Validating Screening Questionnaires for Internalizing ... - INEE
32
Validating Screening Questionnaires for Internalizing and Externalizing Disorders against Clinical Interviews in 8 to 17-Year-Old Syrian Refugee Children Fiona S. McEwen 1 , Patricia Moghames 2 , Tania Bosqui 3,4 , Vanessa Kyrillos 2 , Nicolas Chehade 2 , Stephanie Saad 2 , Diana Abdul Rahman 2 , Cassandra Popham 1 , Dahlia Saab 5 , Georges Karam 5,6,7,8 , Elie Karam 5,6,7,9 , & Michael Pluess 1 1 Queen Mary University of London 2 Médecins du Monde 3 American University of Beirut 4 Centre for Public Health, Queen’s University Belfast 5 Institute for Development, Research, Advocacy & Applied Care (IDRAAC) 6 St. George Hospital University Medical Centre/Faculty of Medicine, University of Balamand 7 Medical Institute for Neuropsychological Disorders (MIND) 8 President of Alzheimer's Association Lebanon (AAL) 9 Chairman of the WPA Epidemiology and Public Health Section Technical Working Paper Draft January 2020 Note: This report contains evidence on a suite of screening tools tested by study authors for use with Syrian refugee children ages 8 – 17 years old in Lebanon. Information on the Screen for Child Anxiety Related Emotional Disorders (SCARED) measure specifically can be found in the summary tables below as well as in sections 1.1.2, 2.4.1, 3.1.2, 3.2.2, and 5.1.2. We strongly encourage the reader to carefully review the introduction, methods, summary and recommendations of the entire report to facilitate accurate interpretation of the results. _________ Correspondence and requests for technical appendices should be addressed to Dr. Fiona McEwen at [email protected]
-
Upload
khangminh22 -
Category
Documents
-
view
1 -
download
0
Transcript of Validating Screening Questionnaires for Internalizing ... - INEE
Validating Screening Questionnaires for Internalizing and Externalizing
Disorders against Clinical Interviews in 8 to 17-Year-Old Syrian Refugee Children
Fiona S. McEwen1, Patricia Moghames2, Tania Bosqui3,4, Vanessa Kyrillos2, Nicolas
Chehade2, Stephanie Saad2, Diana Abdul Rahman2, Cassandra Popham1, Dahlia Saab5, Georges Karam5,6,7,8, Elie Karam5,6,7,9, & Michael Pluess1
1 Queen Mary University of London
2 Médecins du Monde 3 American University of Beirut
4 Centre for Public Health, Queen’s University Belfast
5 Institute for Development, Research, Advocacy & Applied Care (IDRAAC) 6 St. George Hospital University Medical Centre/Faculty of Medicine, University of Balamand
7 Medical Institute for Neuropsychological Disorders (MIND) 8 President of Alzheimer's Association Lebanon (AAL)
9 Chairman of the WPA Epidemiology and Public Health Section
Technical Working Paper Draft January 2020
Note:
This report contains evidence on a suite of screening tools tested by study authors for use with Syrian refugee children ages 8 – 17 years old in Lebanon. Information on the Screen for Child Anxiety Related Emotional Disorders (SCARED) measure specifically can be found in the summary tables below as well as in sections 1.1.2, 2.4.1, 3.1.2, 3.2.2, and 5.1.2. We strongly encourage the reader to carefully review the introduction, methods, summary and recommendations of the entire report to facilitate accurate interpretation of the results. _________ Correspondence and requests for technical appendices should be addressed to Dr. Fiona McEwen at [email protected]
Abstract
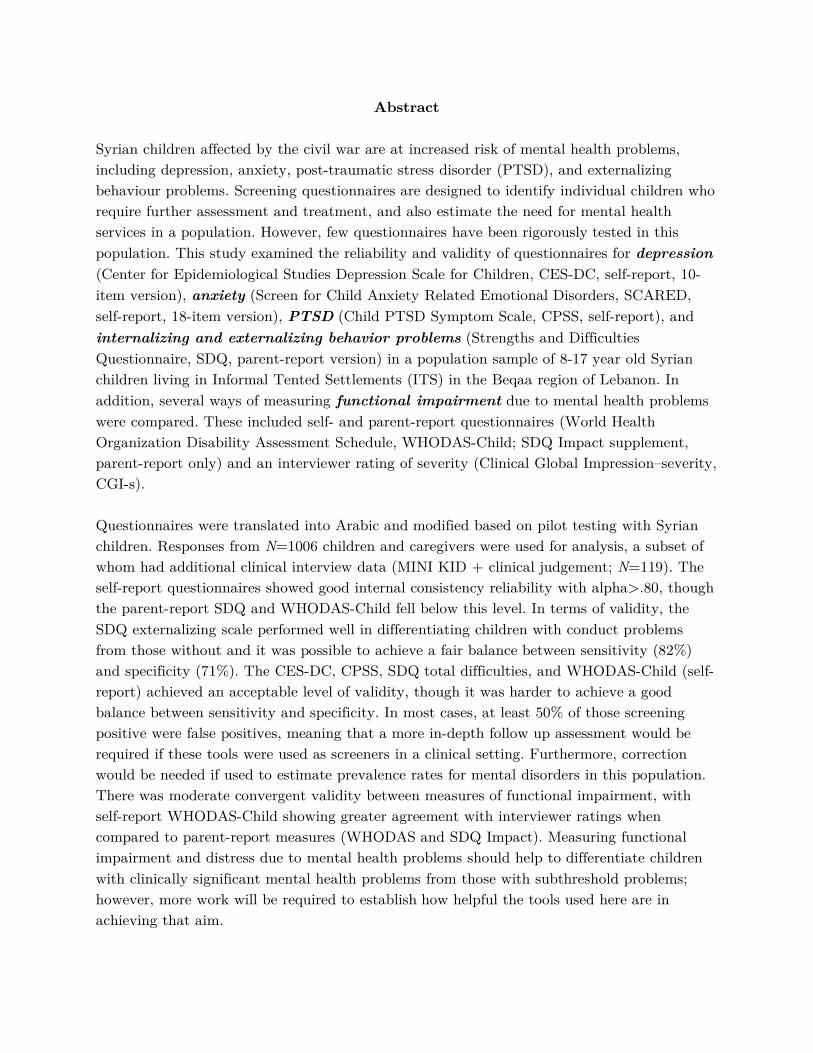
Syrian children affected by the civil war are at increased risk of mental health problems, including depression, anxiety, post-traumatic stress disorder (PTSD), and externalizing behaviour problems. Screening questionnaires are designed to identify individual children who require further assessment and treatment, and also estimate the need for mental health services in a population. However, few questionnaires have been rigorously tested in this population. This study examined the reliability and validity of questionnaires for depression (Center for Epidemiological Studies Depression Scale for Children, CES-DC, self-report, 10-item version), anxiety (Screen for Child Anxiety Related Emotional Disorders, SCARED, self-report, 18-item version), PTSD (Child PTSD Symptom Scale, CPSS, self-report), and internalizing and externalizing behavior problems (Strengths and Difficulties Questionnaire, SDQ, parent-report version) in a population sample of 8-17 year old Syrian children living in Informal Tented Settlements (ITS) in the Beqaa region of Lebanon. In addition, several ways of measuring functional impairment due to mental health problems were compared. These included self- and parent-report questionnaires (World Health Organization Disability Assessment Schedule, WHODAS-Child; SDQ Impact supplement, parent-report only) and an interviewer rating of severity (Clinical Global Impression–severity, CGI-s). Questionnaires were translated into Arabic and modified based on pilot testing with Syrian children. Responses from N=1006 children and caregivers were used for analysis, a subset of whom had additional clinical interview data (MINI KID + clinical judgement; N=119). The self-report questionnaires showed good internal consistency reliability with alpha>.80, though the parent-report SDQ and WHODAS-Child fell below this level. In terms of validity, the SDQ externalizing scale performed well in differentiating children with conduct problems from those without and it was possible to achieve a fair balance between sensitivity (82%) and specificity (71%). The CES-DC, CPSS, SDQ total difficulties, and WHODAS-Child (self-report) achieved an acceptable level of validity, though it was harder to achieve a good balance between sensitivity and specificity. In most cases, at least 50% of those screening positive were false positives, meaning that a more in-depth follow up assessment would be required if these tools were used as screeners in a clinical setting. Furthermore, correction would be needed if used to estimate prevalence rates for mental disorders in this population. There was moderate convergent validity between measures of functional impairment, with self-report WHODAS-Child showing greater agreement with interviewer ratings when compared to parent-report measures (WHODAS and SDQ Impact). Measuring functional impairment and distress due to mental health problems should help to differentiate children with clinically significant mental health problems from those with subthreshold problems; however, more work will be required to establish how helpful the tools used here are in achieving that aim.
Overview of SCARED: MENAT Measurement Library Criteria
SCARED should have high evidence of internal consistency and diagnostic accuracy for use as a screening measure in clinical settings or as an epidemiological research measure. In testing with Syrian refugee children in Lebanon, SCARED subscales had only moderate evidence of internal consistency and the total scores showed modest ability to discriminate between children with and without anxiety disorders. This version of the SCARED is not currently recommended for the purposes of screening for or estimating prevalence of anxiety disorders in the Syrian refugee context. If interested in use of the measure, please contact the developer for further information.
Criteria Indicators Notes
Purpose
Screening Requires high internal consistency; strong evidence of validity, including diagnostic accuracy, sensitivity, and specificity. May prioritize evidence of sensitivity.
Epidemiological research Requires high internal consistency; strong evidence of validity, including diagnostic accuracy, sensitivity, & specificity. May prioritize a balance of sensitivity & specificity or the number of false positives & false negatives, although the latter is sample specific.
Empirical evidence overall
# of types of evidence 7
% of evidence meets criteria1 10% (green only); 50% (yellow and green)
Evidence fit for purpose Yes for internal consistency and validity
Confidence in evidence
Sampling method Full sample: Purposive cluster sampling Clinical interview sample: Purposive sampling and use of sample weights to represent full sample
Sample size Full sample: Large (N = 1006) Clinical interview sample: Small (N = 119)
Missing data Small amount of missing data
Rigor of method High
Revisions Clear guidance on what to adjust/refine
Yes
1Does not include sensitivity, specificity, positive predictive values (PPV) or negative predictive values (NPV)
This technical working paper was developed by Fiona S. McEwen, Patricia Moghames, Tania Bosqui, Vanessa Kyrillos, Nicolas Chehade, Stephanie Saad, Diana Abdul Rahman, Cassandra Popham, Dahlia Saab, Georges Karam, Elie Karam, & Michael Pluess as members of the 3EA | MENAT Measurement Consortium, and reviewed by NYU Global Ties for Children.
Suggested citation: McEwen, F. S., Moghames, P., Bosqui, T., Kyrillos, V., Chehade, N., Saad, S., Abdul Rahman, D., Popham, C., Saab, D., Karam, G., Karam, E., & Pluess, M. (2020, January). Validating screening questionnaires for internalizing and externalizing disorders against clinical interviews in 8-17 year-old Syrian refugee children. Technical working paper. London, UK: QMUL.
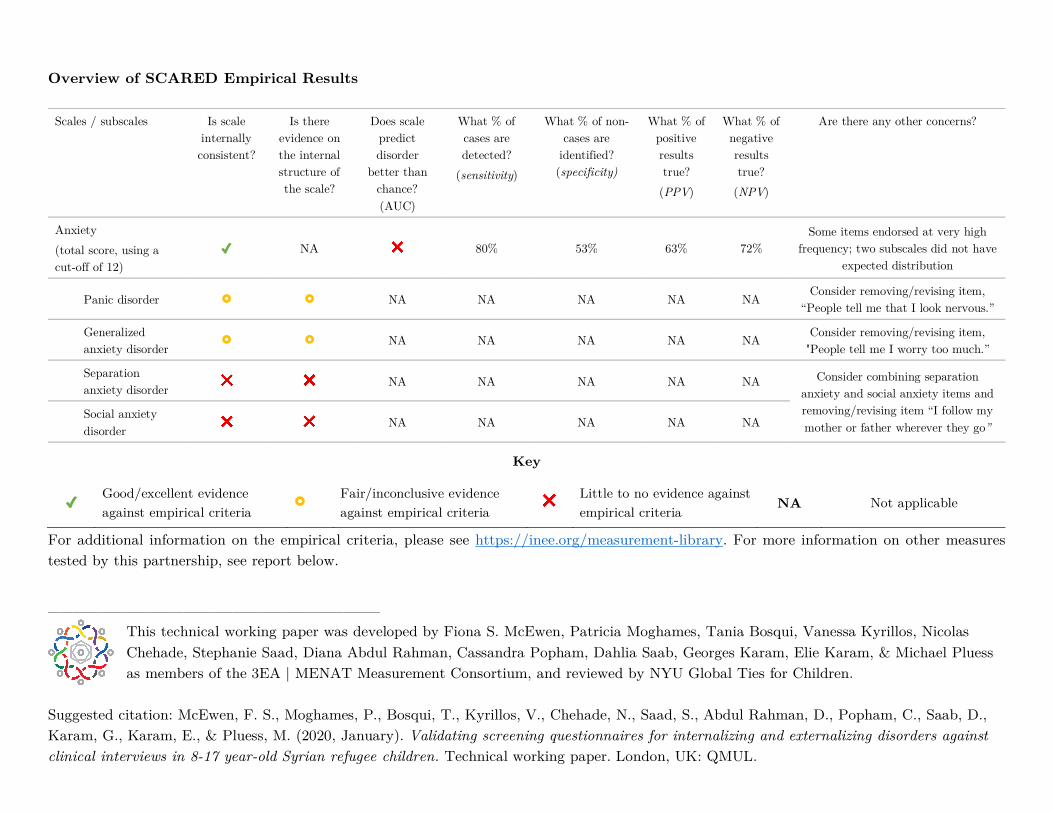
Overview of SCARED Empirical Results Scales / subscales Is scale
internally consistent?
Is there evidence on the internal structure of the scale?
Does scale predict disorder
better than chance? (AUC)
What % of cases are detected?
(sensitivity)
What % of non-cases are
identified? (specificity)
What % of positive results true? (PPV)
What % of negative results true?
(NPV)
Are there any other concerns?
Anxiety (total score, using a cut-off of 12)
✓ NA ❌ 80% 53% 63% 72% Some items endorsed at very high
frequency; two subscales did not have expected distribution
Panic disorder £ £ NA NA NA NA NA Consider removing/revising item, “People tell me that I look nervous.”
Generalized anxiety disorder
£ £ NA NA NA NA NA Consider removing/revising item, "People tell me I worry too much.”
Separation anxiety disorder ❌ ❌ NA NA NA NA NA Consider combining separation
anxiety and social anxiety items and removing/revising item “I follow my mother or father wherever they go”
Social anxiety disorder
❌ ❌ NA NA NA NA NA
For additional information on the empirical criteria, please see https://inee.org/measurement-library. For more information on other measures tested by this partnership, see report below.
___________________________
Key
✓ Good/excellent evidence against empirical criteria
£ Fair/inconclusive evidence against empirical criteria
❌ Little to no evidence against empirical criteria NA Not applicable
3EA Consortium QMUL–IDRAAC–MDM Final Report, v1.5 19th February 2020
Page 1 of 28
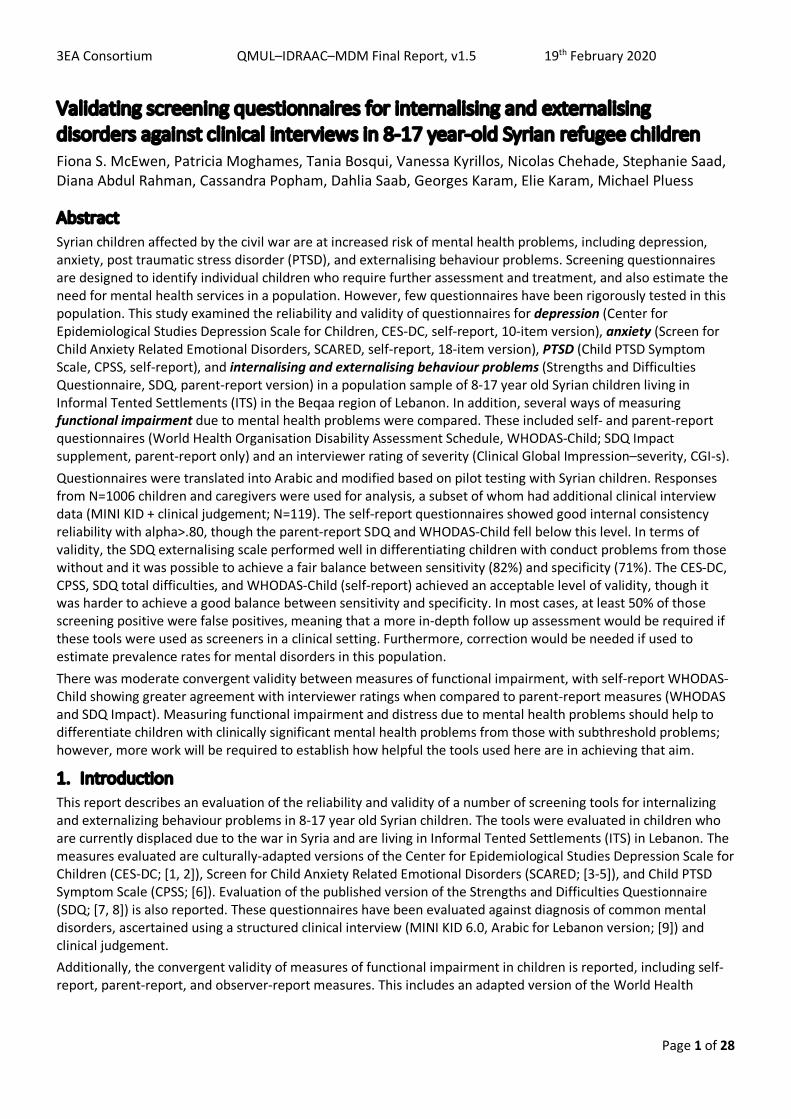
Validating screening questionnaires for internalising and externalising disorders against clinical interviews in 8-17 year-old Syrian refugee children Fiona S. McEwen, Patricia Moghames, Tania Bosqui, Vanessa Kyrillos, Nicolas Chehade, Stephanie Saad, Diana Abdul Rahman, Cassandra Popham, Dahlia Saab, Georges Karam, Elie Karam, Michael Pluess
Abstract Syrian children affected by the civil war are at increased risk of mental health problems, including depression, anxiety, post traumatic stress disorder (PTSD), and externalising behaviour problems. Screening questionnaires are designed to identify individual children who require further assessment and treatment, and also estimate the need for mental health services in a population. However, few questionnaires have been rigorously tested in this population. This study examined the reliability and validity of questionnaires for depression (Center for Epidemiological Studies Depression Scale for Children, CES-DC, self-report, 10-item version), anxiety (Screen for Child Anxiety Related Emotional Disorders, SCARED, self-report, 18-item version), PTSD (Child PTSD Symptom Scale, CPSS, self-report), and internalising and externalising behaviour problems (Strengths and Difficulties Questionnaire, SDQ, parent-report version) in a population sample of 8-17 year old Syrian children living in Informal Tented Settlements (ITS) in the Beqaa region of Lebanon. In addition, several ways of measuring functional impairment due to mental health problems were compared. These included self- and parent-report questionnaires (World Health Organisation Disability Assessment Schedule, WHODAS-Child; SDQ Impact supplement, parent-report only) and an interviewer rating of severity (Clinical Global Impression–severity, CGI-s). Questionnaires were translated into Arabic and modified based on pilot testing with Syrian children. Responses from N=1006 children and caregivers were used for analysis, a subset of whom had additional clinical interview data (MINI KID + clinical judgement; N=119). The self-report questionnaires showed good internal consistency reliability with alpha>.80, though the parent-report SDQ and WHODAS-Child fell below this level. In terms of validity, the SDQ externalising scale performed well in differentiating children with conduct problems from those without and it was possible to achieve a fair balance between sensitivity (82%) and specificity (71%). The CES-DC, CPSS, SDQ total difficulties, and WHODAS-Child (self-report) achieved an acceptable level of validity, though it was harder to achieve a good balance between sensitivity and specificity. In most cases, at least 50% of those screening positive were false positives, meaning that a more in-depth follow up assessment would be required if these tools were used as screeners in a clinical setting. Furthermore, correction would be needed if used to estimate prevalence rates for mental disorders in this population. There was moderate convergent validity between measures of functional impairment, with self-report WHODAS-Child showing greater agreement with interviewer ratings when compared to parent-report measures (WHODAS and SDQ Impact). Measuring functional impairment and distress due to mental health problems should help to differentiate children with clinically significant mental health problems from those with subthreshold problems; however, more work will be required to establish how helpful the tools used here are in achieving that aim.
1. Introduction
This report describes an evaluation of the reliability and validity of a number of screening tools for internalizing and externalizing behaviour problems in 8-17 year old Syrian children. The tools were evaluated in children who are currently displaced due to the war in Syria and are living in Informal Tented Settlements (ITS) in Lebanon. The measures evaluated are culturally-adapted versions of the Center for Epidemiological Studies Depression Scale for Children (CES-DC; [1, 2]), Screen for Child Anxiety Related Emotional Disorders (SCARED; [3-5]), and Child PTSD Symptom Scale (CPSS; [6]). Evaluation of the published version of the Strengths and Difficulties Questionnaire (SDQ; [7, 8]) is also reported. These questionnaires have been evaluated against diagnosis of common mental disorders, ascertained using a structured clinical interview (MINI KID 6.0, Arabic for Lebanon version; [9]) and clinical judgement. Additionally, the convergent validity of measures of functional impairment in children is reported, including self-report, parent-report, and observer-report measures. This includes an adapted version of the World Health
3EA Consortium QMUL–IDRAAC–MDM Final Report, v1.5 19th February 2020
Page 2 of 28
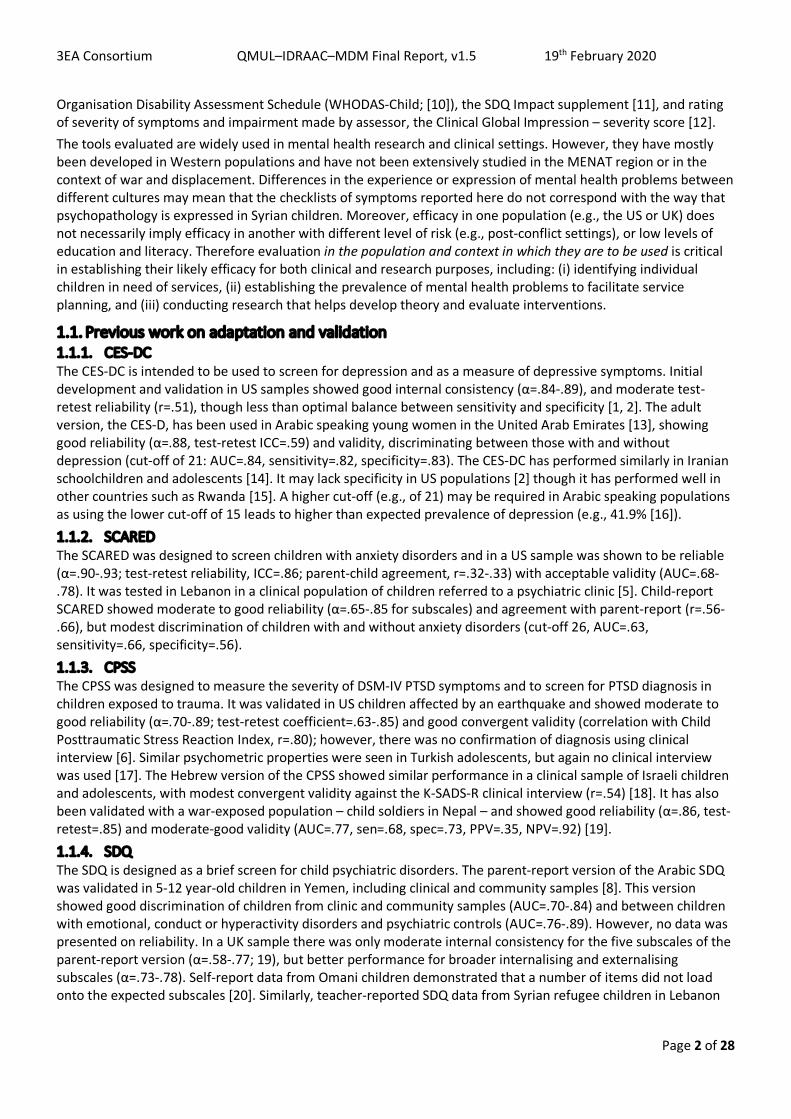
Organisation Disability Assessment Schedule (WHODAS-Child; [10]), the SDQ Impact supplement [11], and rating of severity of symptoms and impairment made by assessor, the Clinical Global Impression – severity score [12]. The tools evaluated are widely used in mental health research and clinical settings. However, they have mostly been developed in Western populations and have not been extensively studied in the MENAT region or in the context of war and displacement. Differences in the experience or expression of mental health problems between different cultures may mean that the checklists of symptoms reported here do not correspond with the way that psychopathology is expressed in Syrian children. Moreover, efficacy in one population (e.g., the US or UK) does not necessarily imply efficacy in another with different level of risk (e.g., post-conflict settings), or low levels of education and literacy. Therefore evaluation in the population and context in which they are to be used is critical in establishing their likely efficacy for both clinical and research purposes, including: (i) identifying individual children in need of services, (ii) establishing the prevalence of mental health problems to facilitate service planning, and (iii) conducting research that helps develop theory and evaluate interventions.
1.1. Previous work on adaptation and validation 1.1.1. CES-DC The CES-DC is intended to be used to screen for depression and as a measure of depressive symptoms. Initial development and validation in US samples showed good internal consistency (α=.84-.89), and moderate test-retest reliability (r=.51), though less than optimal balance between sensitivity and specificity [1, 2]. The adult version, the CES-D, has been used in Arabic speaking young women in the United Arab Emirates [13], showing good reliability (α=.88, test-retest ICC=.59) and validity, discriminating between those with and without depression (cut-off of 21: AUC=.84, sensitivity=.82, specificity=.83). The CES-DC has performed similarly in Iranian schoolchildren and adolescents [14]. It may lack specificity in US populations [2] though it has performed well in other countries such as Rwanda [15]. A higher cut-off (e.g., of 21) may be required in Arabic speaking populations as using the lower cut-off of 15 leads to higher than expected prevalence of depression (e.g., 41.9% [16]). 1.1.2. SCARED The SCARED was designed to screen children with anxiety disorders and in a US sample was shown to be reliable (α=.90-.93; test-retest reliability, ICC=.86; parent-child agreement, r=.32-.33) with acceptable validity (AUC=.68-.78). It was tested in Lebanon in a clinical population of children referred to a psychiatric clinic [5]. Child-report SCARED showed moderate to good reliability (α=.65-.85 for subscales) and agreement with parent-report (r=.56-.66), but modest discrimination of children with and without anxiety disorders (cut-off 26, AUC=.63, sensitivity=.66, specificity=.56). 1.1.3. CPSS The CPSS was designed to measure the severity of DSM-IV PTSD symptoms and to screen for PTSD diagnosis in children exposed to trauma. It was validated in US children affected by an earthquake and showed moderate to good reliability (α=.70-.89; test-retest coefficient=.63-.85) and good convergent validity (correlation with Child Posttraumatic Stress Reaction Index, r=.80); however, there was no confirmation of diagnosis using clinical interview [6]. Similar psychometric properties were seen in Turkish adolescents, but again no clinical interview was used [17]. The Hebrew version of the CPSS showed similar performance in a clinical sample of Israeli children and adolescents, with modest convergent validity against the K-SADS-R clinical interview (r=.54) [18]. It has also been validated with a war-exposed population – child soldiers in Nepal – and showed good reliability (α=.86, test-retest=.85) and moderate-good validity (AUC=.77, sen=.68, spec=.73, PPV=.35, NPV=.92) [19]. 1.1.4. SDQ The SDQ is designed as a brief screen for child psychiatric disorders. The parent-report version of the Arabic SDQ was validated in 5-12 year-old children in Yemen, including clinical and community samples [8]. This version showed good discrimination of children from clinic and community samples (AUC=.70-.84) and between children with emotional, conduct or hyperactivity disorders and psychiatric controls (AUC=.76-.89). However, no data was presented on reliability. In a UK sample there was only moderate internal consistency for the five subscales of the parent-report version (α=.58-.77; 19), but better performance for broader internalising and externalising subscales (α=.73-.78). Self-report data from Omani children demonstrated that a number of items did not load onto the expected subscales [20]. Similarly, teacher-reported SDQ data from Syrian refugee children in Lebanon
3EA Consortium QMUL–IDRAAC–MDM Final Report, v1.5 19th February 2020
Page 3 of 28
and Iraq suggested a different factor structure than the five published subscales, and some items did not load onto any of the proposed subscales [21]. 1.1.5. WHODAS-Child The WHODAS-Child was designed as a measure of disability due to health problems that could be used in both clinical and epidemiological work, including measuring response to interventions. Self- and parent-report versions have been validated in Rwandan children, most of whom had been referred for psychosocial problems, showing good test-retest (r=.83) and inter-rater reliability (ICC=.88), but only modest agreement between parent and child report (r=.32). It was modestly correlated with symptoms of common mental health problems (r=.18-.42) [10].
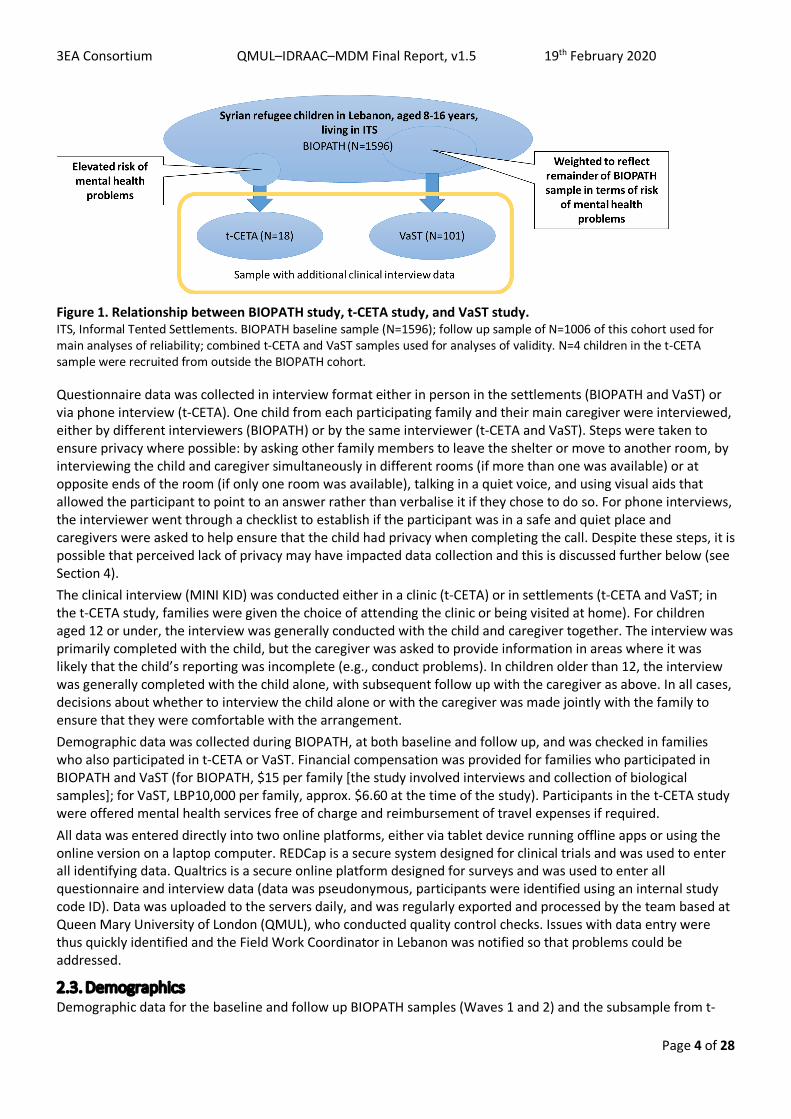
2. Methods 2.1. Sample Data is drawn from a large, longitudinal cohort study of Syrian children living in Lebanon, Biological Pathways of Risk and Resilience in Syrian Refugee Children (BIOPATH). All children were living in Informal Tented Settlements (ITS) in West and Central Bekaa and were eligible to participate if they were: (i) aged 8-16 years at recruitment (late 2017); (ii) had left Syria because of the war in the past four years at the time of recruitment (left Syria approx. 2013-2017); (iii) the caregiver gave informed consent and the child gave assent to participate. Purposive cluster sampling was used with small to medium sized settlements in west and central Bekaa selected from UNHCR listings to represent a range of levels of vulnerability. N=88 settlements were sampled during October 2017 – January 2018 and all eligible families in these settlements were offered inclusion (N=2,300); the resulting sample size was N=1,596 child-caregiver dyads at baseline (69.4% response rate). A follow up assessment was conducted 12 months later during October 2018 – January 2019; N=1006 families were interviewed (funding constraints meant that only 63% of families could be followed up). A subsample of the BIOPATH sample also took part in a structured clinical interview through one of two related studies. The first is a pilot clinical trial (Development, Piloting and Evaluation of a Phone-Delivered Psychological Intervention [t-CETA] for Syrian Refugee Children in Lebanon), and children were eligible if (i) they or their caregiver had indicated interest in accessing mental health services for problems that the child had, and (ii) they had evidence of common mental health problems through scoring in the top 40% of the distribution of at least one of the self-report screening questionnaires (SCARED, CES-DC, or CPSS) and the top 40% of the parent-report SDQ. During the trial, recruitment was also opened to children from the same region who had not taken part in BIOPATH. Children were excluded if they had evidence of disorders for which the intervention is not suitable (e.g., psychosis) or serious risk issues that would make inclusion inappropriate (e.g., child protection issues). A second group of children was recruited specifically for the study reported here (Validating screening questionnaires for internalising and externalising disorders against clinical interviews in 8-16 year-old Syrian refugee children [VaST]). Children were eligible if they had not participated in the t-CETA study and the sample was weighted to reflect the rest of the BIOPATH sample in terms of risk of mental health problems (based on whether or not they indicated that they child needed mental health services and their questionnaire scores). Where children were assessed as part of the VaST study and found to have clinically significant mental health problems, they were offered inclusion in the t-CETA study. In cases where they took up this offer, their data from the VaST study was used. A total of N=119 children had both questionnaire and clinical interview data, four of whom were not BIOPATH participants. At the time the subsample was selected, this sample was representative of the BIOPATH sample in terms of age, gender, and scores on mental health screening questionnaires, though a greater proportion attended school (see Section 2.3). Figure 1 shows the relationship between the three study populations.
2.2. Data collection Local Lebanese Arabic-speaking interviewers conducted all data collection, after appropriate training. Training involved all aspects of data collection, including specific training on each measurement tool and a focus on adjusting phrasing to account for differences in Arabic dialects and approaching culturally sensitive issues in an appropriate way. See associated training materials and instructions for more information.
3EA Consortium QMUL–IDRAAC–MDM Final Report, v1.5 19th February 2020
Page 4 of 28
Figure 1. Relationship between BIOPATH study, t-CETA study, and VaST study. ITS, Informal Tented Settlements. BIOPATH baseline sample (N=1596); follow up sample of N=1006 of this cohort used for main analyses of reliability; combined t-CETA and VaST samples used for analyses of validity. N=4 children in the t-CETA sample were recruited from outside the BIOPATH cohort.
Questionnaire data was collected in interview format either in person in the settlements (BIOPATH and VaST) or via phone interview (t-CETA). One child from each participating family and their main caregiver were interviewed, either by different interviewers (BIOPATH) or by the same interviewer (t-CETA and VaST). Steps were taken to ensure privacy where possible: by asking other family members to leave the shelter or move to another room, by interviewing the child and caregiver simultaneously in different rooms (if more than one was available) or at opposite ends of the room (if only one room was available), talking in a quiet voice, and using visual aids that allowed the participant to point to an answer rather than verbalise it if they chose to do so. For phone interviews, the interviewer went through a checklist to establish if the participant was in a safe and quiet place and caregivers were asked to help ensure that the child had privacy when completing the call. Despite these steps, it is possible that perceived lack of privacy may have impacted data collection and this is discussed further below (see Section 4). The clinical interview (MINI KID) was conducted either in a clinic (t-CETA) or in settlements (t-CETA and VaST; in the t-CETA study, families were given the choice of attending the clinic or being visited at home). For children aged 12 or under, the interview was generally conducted with the child and caregiver together. The interview was primarily completed with the child, but the caregiver was asked to provide information in areas where it was likely that the child’s reporting was incomplete (e.g., conduct problems). In children older than 12, the interview was generally completed with the child alone, with subsequent follow up with the caregiver as above. In all cases, decisions about whether to interview the child alone or with the caregiver was made jointly with the family to ensure that they were comfortable with the arrangement. Demographic data was collected during BIOPATH, at both baseline and follow up, and was checked in families who also participated in t-CETA or VaST. Financial compensation was provided for families who participated in BIOPATH and VaST (for BIOPATH, $15 per family [the study involved interviews and collection of biological samples]; for VaST, LBP10,000 per family, approx. $6.60 at the time of the study). Participants in the t-CETA study were offered mental health services free of charge and reimbursement of travel expenses if required. All data was entered directly into two online platforms, either via tablet device running offline apps or using the online version on a laptop computer. REDCap is a secure system designed for clinical trials and was used to enter all identifying data. Qualtrics is a secure online platform designed for surveys and was used to enter all questionnaire and interview data (data was pseudonymous, participants were identified using an internal study code ID). Data was uploaded to the servers daily, and was regularly exported and processed by the team based at Queen Mary University of London (QMUL), who conducted quality control checks. Issues with data entry were thus quickly identified and the Field Work Coordinator in Lebanon was notified so that problems could be addressed.
2.3. Demographics Demographic data for the baseline and follow up BIOPATH samples (Waves 1 and 2) and the subsample from t-
3EA Consortium QMUL–IDRAAC–MDM Final Report, v1.5 19th February 2020
Page 5 of 28
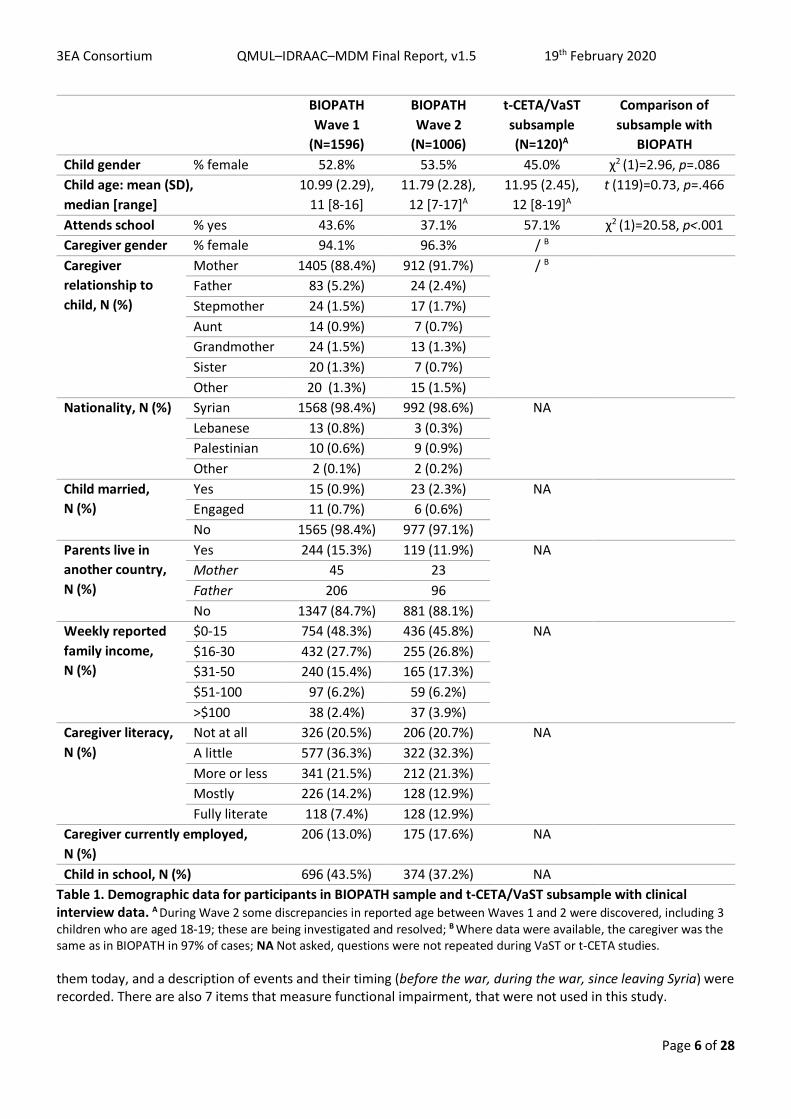
CETA/VaST with clinical interview data is shown in Table 1. Those with clinical interview data did not differ from those without on age and gender, though a greater proportion attended school. Based on BIOPATH Wave 2 data (the subsample invited for clinical interview were selected from those who completed Wave 2), those with clinical interview data did not differ from those without on the SCARED (t(df)=0.58(1004), p=.560), the CES-DC (t(df)=1.90(152.8), p=.059), the CPSS (t(df)=0.77(1003), p=.444), SDQ total difficulties (t(df)=-0.14(994), p=.892), or the SDQ Impact score (t(df)=0.06(120), p=.951). Those with clinical interview data had significantly lower scores for the WHODAS self-report (t(df)=3.39(170.7), p=.001), and WHODAS parent-report (t(df)=3.32(163.8), p=.001), albeit of small effect size (d=.27 and .26, respectively). Despite the fact that the subsample who completed clinical interviews was broadly representative of the BIOPATH Wave 2 sample at the time at the time of BIOPATH data collection, at the time of data collection to complete clinical interviews and questionnaires for validity analysis (2-10 months later) there was evidence of an increased level of symptoms of mental health problems compared to mean scores during BIOPATH data collection. Scores for CES-DC (t(df)=5.91(119), p<.001), CPSS (t(df)=6.42(118), p<.001), SDQ total difficulties (t(df)=4.42(119), p<.001), WHODAS self-report (t(df)=5.53(119), p<.001), and WHODAS parent-report (t(df)=7.58(118), p<.001) were all higher with medium effect sizes (d=0.40-0.69). Scores for SCARED (t(df)=0.13(118), p=.894) and SDQ Impact (t(df)=1.26(42), p=.216) did not differ. The possible reasons for this increase, as well as implications for evaluating the measurement tools, are considered in the Discussion.
2.4. Measures 2.4.1. Screen for Child Anxiety Related Emotional Disorders (SCARED; child self-report) This is a child self-report (or parent-report) instrument used to screen for childhood anxiety disorders including general anxiety disorder, separation anxiety disorder, panic disorder, social phobia, and school phobia [3-5]. The original version consists of 41 items and 5 factors that parallel the DSM-IV classification of anxiety disorders. We shortened the scale to 15 items, using qualitative feedback and factor analysis of pilot data from Syrian refugee children in Lebanon to make decisions about items to remove. We removed items that were not understood by the majority of children. Items relating to school anxiety were also removed, because a significant proportion of children in the target population do not attend school. We retained items across the following scales: panic disorder, generalised anxiety disorder, separation anxiety, and social anxiety that both loaded onto specific factors but also onto one general anxiety factor. Following use of the 15-item version for Wave 1 of the BIOPATH study, and due to concerns that many items were endorsed at very high frequency, we added three items back in to make an 18-item scale. Items are scored from 0 (Not true or hardly ever true) to 2 (Very true or often true), resulting in total scores from 0-36 for the 18-item version included in this report. 2.4.2. Center for Epidemiological Studies Depression Scale for Children (CES-DC; child self-report) This is a 20-item questionnaire that assesses the frequency and duration of the symptoms associated with depression in children and adolescents [1, 2]. The measure was reduced to 10 items following pilot testing in Syrian refugee children in Lebanon. Factor analysis and qualitative feedback was used to choose items that were understandable to Syrian children and that loaded most strongly onto one factor. Based on qualitative feedback, items where children commonly asked for examples were modified to provide standardised examples. For example, It was hard to get started doing things, was modified to It was hard to get started doing things (e.g., homework, playing, watching TV, doing chores). Items are scored from 0 (Not at all or only at one time) to 3 (Almost always), resulting in a total ranging from 0-30 for the 10-item version. 2.4.3. Child PTSD Symptom Scale (CPSS; child self-report) The CPSS is a self-report questionnaire designed to assess the severity of DSM-IV PTSD symptoms in children aged 8-18 [6]. There are 17 items that measure the presence of symptoms, each of which is rated on a scale from 0 (Not at all or only at one time) to 3 (5 or more times a week/almost always), resulting in a total ranging from 0-51. The authors recommended a clinical cutoff score of greater or equal to 11 on the basis of inspecting the distribution of total scale scores for children with high and low PTSD symptoms, which yielded 95% sensitivity and 96% specificity [6]. However, a cut-off of 20 was established in a study of child soldiers in Nepal, suggesting that a higher cut-off may be approriate in war-exposed populations [19]. Some items were modified to be appropriate to the context, for example the symptom Having trouble falling or staying asleep was supplemented with excluding times when you were disturbed by other people or noise. The instructions were also supplemented to ensure that children were referring to an event that was very scary, dangerous, or violent and that still bothers
3EA Consortium QMUL–IDRAAC–MDM Final Report, v1.5 19th February 2020
Page 6 of 28
BIOPATH Wave 1
(N=1596)
BIOPATH Wave 2
(N=1006)
t-CETA/VaST subsample (N=120)A
Comparison of subsample with
BIOPATH Child gender % female 52.8% 53.5% 45.0% χ2 (1)=2.96, p=.086 Child age: mean (SD), median [range]
10.99 (2.29), 11 [8-16]
11.79 (2.28), 12 [7-17]A
11.95 (2.45), 12 [8-19]A
t (119)=0.73, p=.466
Attends school % yes 43.6% 37.1% 57.1% χ2 (1)=20.58, p<.001 Caregiver gender % female 94.1% 96.3% / B Caregiver relationship to child, N (%)
Mother 1405 (88.4%) 912 (91.7%) / B Father 83 (5.2%) 24 (2.4%) Stepmother 24 (1.5%) 17 (1.7%) Aunt 14 (0.9%) 7 (0.7%) Grandmother 24 (1.5%) 13 (1.3%) Sister 20 (1.3%) 7 (0.7%) Other 20 (1.3%) 15 (1.5%)
Nationality, N (%) Syrian 1568 (98.4%) 992 (98.6%) NA Lebanese 13 (0.8%) 3 (0.3%) Palestinian 10 (0.6%) 9 (0.9%) Other 2 (0.1%) 2 (0.2%)
Child married, N (%)
Yes 15 (0.9%) 23 (2.3%) NA Engaged 11 (0.7%) 6 (0.6%) No 1565 (98.4%) 977 (97.1%)
Parents live in another country, N (%)
Yes 244 (15.3%) 119 (11.9%) NA Mother 45 23 Father 206 96 No 1347 (84.7%) 881 (88.1%)
Weekly reported family income, N (%)
$0-15 754 (48.3%) 436 (45.8%) NA $16-30 432 (27.7%) 255 (26.8%) $31-50 240 (15.4%) 165 (17.3%) $51-100 97 (6.2%) 59 (6.2%) >$100 38 (2.4%) 37 (3.9%)
Caregiver literacy, N (%)
Not at all 326 (20.5%) 206 (20.7%) NA A little 577 (36.3%) 322 (32.3%) More or less 341 (21.5%) 212 (21.3%) Mostly 226 (14.2%) 128 (12.9%) Fully literate 118 (7.4%) 128 (12.9%)
Caregiver currently employed, N (%)
206 (13.0%) 175 (17.6%) NA
Child in school, N (%) 696 (43.5%) 374 (37.2%) NA Table 1. Demographic data for participants in BIOPATH sample and t-CETA/VaST subsample with clinical interview data. A During Wave 2 some discrepancies in reported age between Waves 1 and 2 were discovered, including 3 children who are aged 18-19; these are being investigated and resolved; B Where data were available, the caregiver was the same as in BIOPATH in 97% of cases; NA Not asked, questions were not repeated during VaST or t-CETA studies.
them today, and a description of events and their timing (before the war, during the war, since leaving Syria) were recorded. There are also 7 items that measure functional impairment, that were not used in this study.
3EA Consortium QMUL–IDRAAC–MDM Final Report, v1.5 19th February 2020
Page 7 of 28
2.4.4. Strengths and Difficulties Questionnaire + Impact Supplement (SDQ; parent-report) The SDQ is a brief behavioural screening questionnaire about 3-16 year olds [7]. It includes 25 items on psychological attributes, some positive and others negative. These 25 items are divided between 5 scales: (1) emotional symptoms; (2) conduct problems; (3) hyperactivity/inattention; 4) peer relationship problems; 5) prosocial behaviour. Parent-report, self-report and teacher-report versions are available; only parent-report was used for this study. In low-risk or general population samples, it may be better to use an alternative three-subscale division of the SDQ into 'internalising problems' (emotional + peer symptoms, 10 items), 'externalising problems' (conduct + hyperactivity symptoms, 10 items) and the prosocial scale (5 items) [22]. An Impact Supplement is also available, which asks whether the respondent thinks the young person has a problem, and if so, enquires further about chronicity, distress, social impairment, and burden to others [11]. No modifications were made to the SDQ (modifications are not permitted). Some items are culturally sensitive (e.g., stealing) and were reported to be offensive by some respondants; interviewers clarified that these are standard items asked to all families to reduce the risk of causing offence. 2.4.5. World Health Organization Disability Assessment Schedule for Children (WHODAS-Child; self- and
parent-report) The WHODAS-Child is a 36-item instrument designed to measure disability or functional impairment and that has been adapted for low resource settings [10]. It is based on the WHO’s International Classification of Functioning, Disability and Health for children and youth and covers six domains: understanding and communicating, getting around (mobility), self-care (personal hygiene and safety), getting along with people, life activities (ability to carry out responsibilities at home, work and school), and participation in society (engagement in community, civil and recreational activities). A 24-item version including the scales Getting along with people, Life activities, and Participation in society, as well as items about overall health and the number of days when usual activities were impaired, was used in this study [23]. Each subscale score is calculated as a percentage of the maximum possible score, and then a global disability score is created by averaging all subscales (range 0-100).
2.5. Translation and refinement Where an Arabic translation was not available, questionnaires (other than the WHODAS; see below) were translated using a standard protocol (see Appendix 1). Two local clinical psychology students independently completed forward translation from English to Modern Standard Arabic (MSA). The two versions were synthesized into one version, which was then back translated from Arabic to English by two different students. This back translated version was compared to the original version to check for discrepancies and refine the Arabic translation. The translated version was then reviewed independently by three local experts with knowledge of the target community and the constructs measured in the questionnaires (e.g., clinical psychologists working with Syrian refugees). Where necessary, the MSA version was supplemented with alternative dialect words to improve comprehensibility. Following translation, the questionnaires were piloted during Focus Group Discussions (FGD) with Syrian children and caregivers, and then during a series of pilot studies (sample size N=30-100 for each questionnaire). This was used to further refine questions (by adjusting language or providing examples) and to guide modifications to the scales (deciding which items to remove when abridging scales). The WHODAS was introduced later in the project and was forward translated by a professional translator, back translated by two local clinical psychology students, and then reviewed by three local clinical staff. Interviewers reported any difficulties during its administration and this feedback was used to refine the language (e.g., adding appropriate dialect words) where necessary.
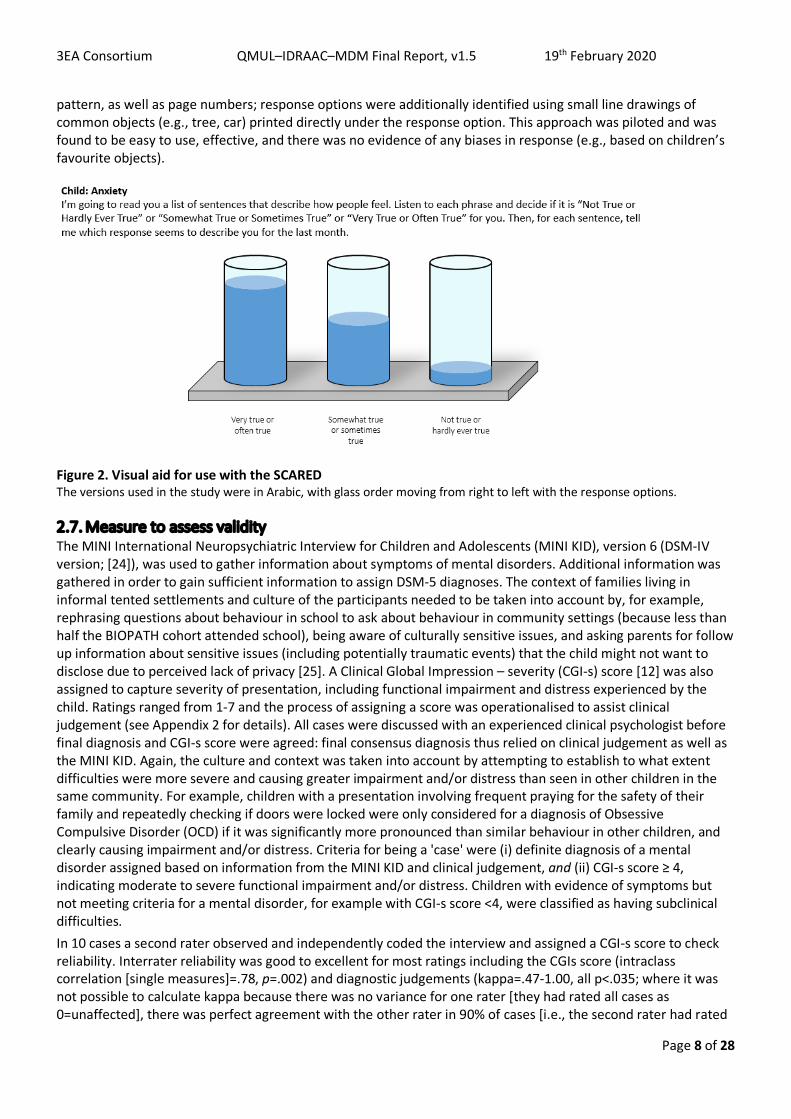
2.6. Visual aids Visual aids were available for all questionnaires, which participants could choose to use. During piloting it was clear that some participants found the Likert scale response format difficult, spontaneously answering using a dichotomous format (yes/no). A range of different visual aids were developed and piloted, and a version portraying water glasses was selected. See Figure 2 for an example. The versions used to support phone interviews in the t-CETA study were presented in a laminated booklet that the family kept at home. To support participants with lower literacy, pages were identified using colour and
3EA Consortium QMUL–IDRAAC–MDM Final Report, v1.5 19th February 2020
Page 8 of 28
pattern, as well as page numbers; response options were additionally identified using small line drawings of common objects (e.g., tree, car) printed directly under the response option. This approach was piloted and was found to be easy to use, effective, and there was no evidence of any biases in response (e.g., based on children’s favourite objects).
Figure 2. Visual aid for use with the SCARED The versions used in the study were in Arabic, with glass order moving from right to left with the response options.
2.7. Measure to assess validity The MINI International Neuropsychiatric Interview for Children and Adolescents (MINI KID), version 6 (DSM-IV version; [24]), was used to gather information about symptoms of mental disorders. Additional information was gathered in order to gain sufficient information to assign DSM-5 diagnoses. The context of families living in informal tented settlements and culture of the participants needed to be taken into account by, for example, rephrasing questions about behaviour in school to ask about behaviour in community settings (because less than half the BIOPATH cohort attended school), being aware of culturally sensitive issues, and asking parents for follow up information about sensitive issues (including potentially traumatic events) that the child might not want to disclose due to perceived lack of privacy [25]. A Clinical Global Impression – severity (CGI-s) score [12] was also assigned to capture severity of presentation, including functional impairment and distress experienced by the child. Ratings ranged from 1-7 and the process of assigning a score was operationalised to assist clinical judgement (see Appendix 2 for details). All cases were discussed with an experienced clinical psychologist before final diagnosis and CGI-s score were agreed: final consensus diagnosis thus relied on clinical judgement as well as the MINI KID. Again, the culture and context was taken into account by attempting to establish to what extent difficulties were more severe and causing greater impairment and/or distress than seen in other children in the same community. For example, children with a presentation involving frequent praying for the safety of their family and repeatedly checking if doors were locked were only considered for a diagnosis of Obsessive Compulsive Disorder (OCD) if it was significantly more pronounced than similar behaviour in other children, and clearly causing impairment and/or distress. Criteria for being a 'case' were (i) definite diagnosis of a mental disorder assigned based on information from the MINI KID and clinical judgement, and (ii) CGI-s score ≥ 4, indicating moderate to severe functional impairment and/or distress. Children with evidence of symptoms but not meeting criteria for a mental disorder, for example with CGI-s score <4, were classified as having subclinical difficulties. In 10 cases a second rater observed and independently coded the interview and assigned a CGI-s score to check reliability. Interrater reliability was good to excellent for most ratings including the CGIs score (intraclass correlation [single measures]=.78, p=.002) and diagnostic judgements (kappa=.47-1.00, all p<.035; where it was not possible to calculate kappa because there was no variance for one rater [they had rated all cases as 0=unaffected], there was perfect agreement with the other rater in 90% of cases [i.e., the second rater had rated
3EA Consortium QMUL–IDRAAC–MDM Final Report, v1.5 19th February 2020
Page 9 of 28
90% as 0=unaffected]). Agreement for conduct disorder / oppositional defiant disorder (CD/ODD) was poorer (kappa=.41, p=.084); this reflected a need to adjust for the context, where fighting between children and other low-level conduct issues were relatively common, and this was a particular focus during consensus discussions. All discrepancies in administration or coding that were highlighted during double coding were further discussed in joint supervision sessions to improve consistency in administration and coding. The MINI KID was either completed on the same day as the questionnaires (N=101 cases) or on different days (N=18; median gap=19.5 days, interquartile range=21.5 days). Cases in which the gap between MINI KID and questionnaires was greater than 2 months were excluded from analysis.
2.8. Data analysis 2.8.1. Calculating scales There was little missing data: >97% of cases in BIOPATH and >93% of the subsample with clinical interview data had complete data for each scale and where data were missing, this was typically only 1-2 items. This small amount of missing data was mostly not associated with age, gender, or evidence of mental disorder. The exception was the WHODAS, where children who were not in school were missing data on the subscale relating to school. The WHODAS is calculated as a percentage score using the subscales available, so the total score was calculated minus the school subscale in children who did not attend school. See Appendix 3 for details on missing data. All scales and subscales were calculated by multiplying the mean item score by the maximum possible number of items in the scale, providing at least 90% of items were available. This thus corrected for missing data by replacing missing items with the mean item score. If greater than 10% of items were missing, the scale total was also missing. 2.8.2. Reliability Internal consistency for each scale and subscale was examined using Cronbach’s alpha. Exploratory factor analysis was also conducted on each scale to establish whether the factor structure fitted the proposed subscales. Wave 2 BIOPATH data (N=1006) was used for these analyses. 2.8.3. Validity Each psychopathology questionnaire is designed to measure symptoms of mental disorders, and to identify likely clinical cases by the application of a cut-off score. The efficacy of each scale in identifying clinical cases was explored by comparing each questionnaire to cases of the relevant disorder in the subsample with clinical interview data (N=119). For example, the SCARED was compared to current diagnosis of any anxiety disorder and the CES-DC to current diagnosis of major depressive disorder/episode. Receiver Operating Characteristics (ROC) Curve analysis was used to summarise the overall diagnostic accuracy of each questionnaire in correctly classifying cases and non-cases (using the Area Under the Curve; AUC). An AUC of 0.5 suggests no discrimination, 0.7-0.8 is considered acceptable, 0.8-0.9 is considered excellent, and >0.9 is considered outstanding [26]. The ROC curve was used to select a cut-off that would achieve an optimal balance between sensitivity and specificity (with priority given to sensitivity when a balance was difficult to achieve). Sensitivity (the proportion of true cases correctly identified), specificity (the proportion of non-cases correctly identified), Positive Predictive Value (PPV; the proportion of individuals above cut-off that are true cases), and Negative Predictive Value (NPV; the proportion of individuals below cut-off that are true non-cases) were calculated using previously established cut-offs and/or new cut-offs established for this population [27]. Values range from 0-1.0 (or are expressed as a percentage), with higher values indicating better performance. Sensitivity and specificity are in balance, such that increasing sensitivity for a scale results in decreasing specificity. The values that are considered to be acceptable depend on the purpose that the scale is to be used for (i.e., is it more important to prioritise sensitivity or specificity), so there are no published standard criteria as to 'good' sensitivity or specificity. The values for sensitivity, specificity, PPV and NPV should be considered together when making decisions about whether to use a scale for a particular purpose and interpreting results [28]. Construct validity was examined for the WHODAS-Child by examining patterns of convergent and discriminant validity using self- and parent-report versions, both in the BIOPATH sample (N=1006) and the subsample (N=119) (N varies slightly by analysis, see Appendix 4, Tables A4.7 and A4.8). Convergent validity for measures of
3EA Consortium QMUL–IDRAAC–MDM Final Report, v1.5 19th February 2020
Page 10 of 28
functional impairment was examined using correlational analysis between different measurement tools (WHODAS, SDQ Impact, and CGI-s score), and between different raters (WHODAS-Child self-report and parent-report), in the BIOPATH sample and the subsample (N varies by measure, see Table 6). The ability of the WHODAS and the screening question of the SDQ Impact supplement to predict any mental disorder or more severe disorder was also explored, using ROC Curve analysis as described above. Further analysis was conducted to examine the effect of the skip rule in the SDQ Impact supplement by comparing children whose caregiver answered Yes or No to the screening question at the start of the SDQ Impact supplement on (i) WHODAS and CGI-s scores, and (ii) diagnosis of any disorder.
3. Results 3.1. Psychopathology screening tools 3.1.1. CES-DC Exploratory factor analysis: Exploratory factor analysis resulted in one factor being extracted, with item factor loadings all >.6 (see Appendix 4, p1). This may be an artefact of the way the scale was shortened, as items that loaded most strongly onto one factor were selected for inclusion in the brief version. However, the brief scale contains items from all three factors identified by the original study in a US sample [1] and the amount of variance explained by the one factor in our study (51%) is similar to that explained by the three factors in the original study (44%). Reliability: The 10-item version showed good internal consistency: Cronbach’s α=.89. Distribution: The distribution was positively skewed (see Appendix 4, Figures A4.2-3), as expected for a measure of psychopathology, and all items showed a similar distribution.
A B
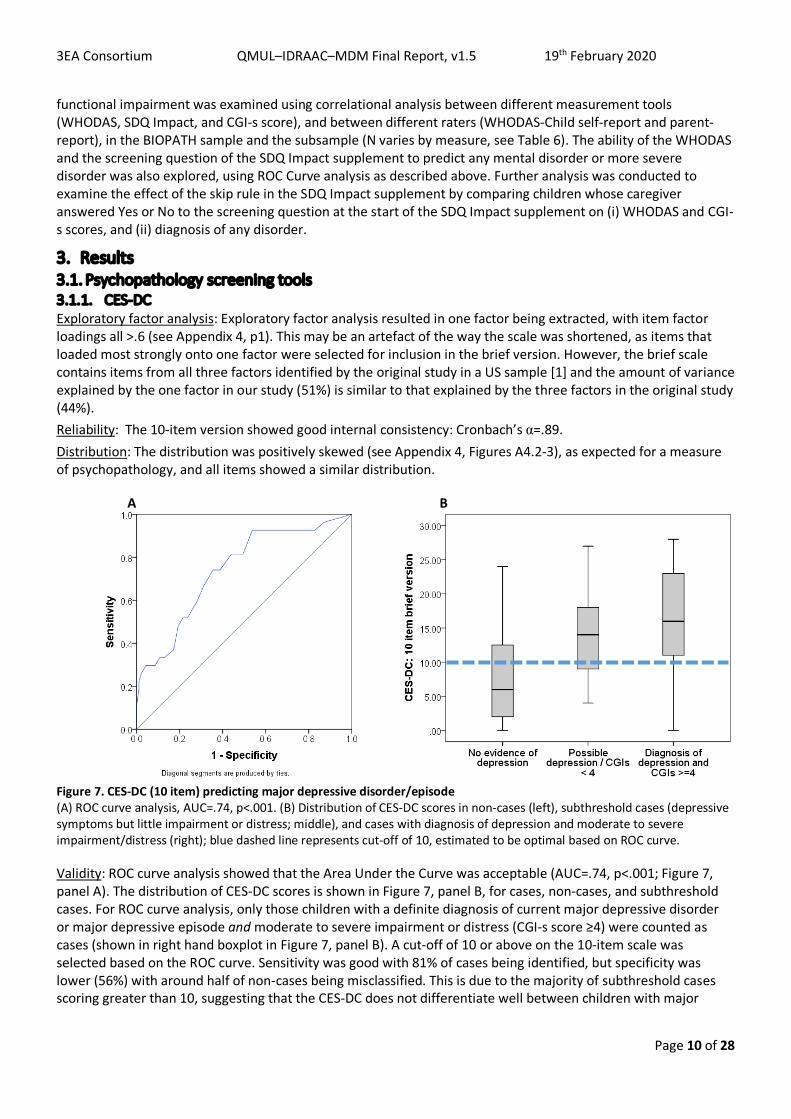
Figure 7. CES-DC (10 item) predicting major depressive disorder/episode (A) ROC curve analysis, AUC=.74, p<.001. (B) Distribution of CES-DC scores in non-cases (left), subthreshold cases (depressive symptoms but little impairment or distress; middle), and cases with diagnosis of depression and moderate to severe impairment/distress (right); blue dashed line represents cut-off of 10, estimated to be optimal based on ROC curve.
Validity: ROC curve analysis showed that the Area Under the Curve was acceptable (AUC=.74, p<.001; Figure 7, panel A). The distribution of CES-DC scores is shown in Figure 7, panel B, for cases, non-cases, and subthreshold cases. For ROC curve analysis, only those children with a definite diagnosis of current major depressive disorder or major depressive episode and moderate to severe impairment or distress (CGI-s score ≥4) were counted as cases (shown in right hand boxplot in Figure 7, panel B). A cut-off of 10 or above on the 10-item scale was selected based on the ROC curve. Sensitivity was good with 81% of cases being identified, but specificity was lower (56%) with around half of non-cases being misclassified. This is due to the majority of subthreshold cases scoring greater than 10, suggesting that the CES-DC does not differentiate well between children with major
3EA Consortium QMUL–IDRAAC–MDM Final Report, v1.5 19th February 2020
Page 11 of 28
depressive disorder / episode and those with some evidence of depressive symptoms but little impairment or distress. PPV was low with only 35% of children who screened positive being true cases. NPV was better: 91% of children who scored under 10 were true non-cases. Overall, 61.7% of cases were correctly classified using this cut-off.
3.1.2. SCARED Exploratory factor analysis: Four factors were extracted, which explained 53.5% of the variance and partially replicated the subscale structure (see Appendix 4, p3). The Panic disorder and Generalised anxiety disorder (GAD) subscales were replicated, other than the two items that were phrased ‘People tell me that…’ which loaded on their own factor, suggesting that this may be driven by question style. Interviewers reported that these questions were difficult for some children, perhaps because others did not comment on the child’s symptoms to them. All but one of the Separation anxiety and Social anxiety items loaded on one factor, though the Separation anxiety items cross-loaded on the Panic disorder factor. Forcing all items onto one factor resulted in factor loadings >.4 for all items, other than ‘I follow my mother or father wherever they go’. Reliability: The 18-item version of the SCARED showed good internal consistency: Cronbach’s α=.84. Internal consistency for subscales was more variable, ranging from α=.52-.78 (see Table 2). Internal consistency was repeated using empirically derived scales: the item ‘I follow my mother or father wherever they go’ was removed from the total score; the items phrased ‘People tell me that…’ were removed from Panic disorder and GAD subscales; the remaining Separation and Social anxiety items were analysed together. While this improved internal consistency for Separation and Social anxiety, change to the total scale was negligible. Further analyses use the 18-item scale with no further modification. Distribution: The distribution of total SCARED score for the 18-item version was approximately normal (see Appendix 4, Figure A4.4). Typically, measures of psychopathology show a positive skew: the majority of children have low scores and relatively few children have high scores. The Panic disorder and GAD subscales were positively skewed, while Separation anxiety was normally distributed and Social anxiety was negatively skewed (see Appendix 4, Figure A4.4). Examination of the distribution of individual items showed that several of the items that contribute to the latter scales were endorsed at very high frequency, with the majority of children responding Very true or often true (e.g., I get scared if I sleep away from home [Separation anxiety], I feel shy with people I don’t know well [Social anxiety]).
Scale Using items / subscales as defined in original measure
Using items as defined in empirically derived scales
N items Cronbach’s alpha N items Cronbach’s alpha Anxiety total 18 .84 17 .85 Panic disorder 6 .78 5 .80 Generalised anxiety disorder
6 .73 5 .72
Separation anxiety disorder
3 .52 5 .71
Social anxiety disorder 3 .69 Table 2. Internal consistency for SCARED scale and subscales
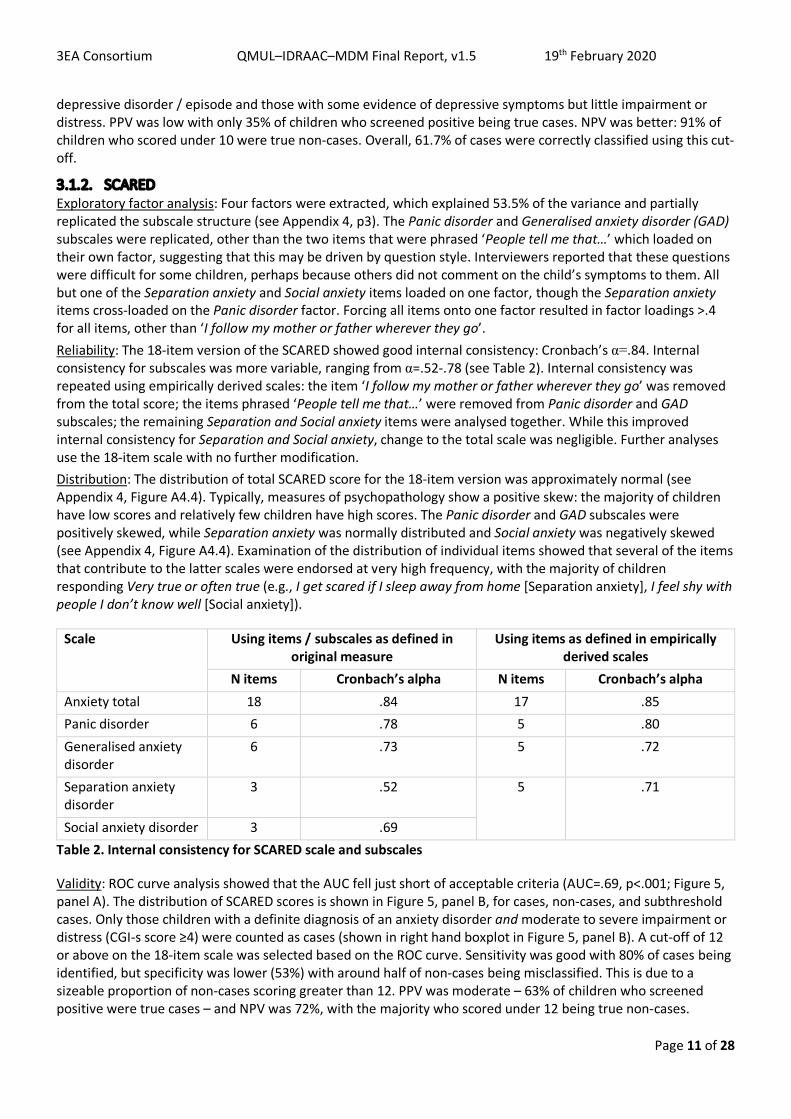
Validity: ROC curve analysis showed that the AUC fell just short of acceptable criteria (AUC=.69, p<.001; Figure 5, panel A). The distribution of SCARED scores is shown in Figure 5, panel B, for cases, non-cases, and subthreshold cases. Only those children with a definite diagnosis of an anxiety disorder and moderate to severe impairment or distress (CGI-s score ≥4) were counted as cases (shown in right hand boxplot in Figure 5, panel B). A cut-off of 12 or above on the 18-item scale was selected based on the ROC curve. Sensitivity was good with 80% of cases being identified, but specificity was lower (53%) with around half of non-cases being misclassified. This is due to a sizeable proportion of non-cases scoring greater than 12. PPV was moderate – 63% of children who screened positive were true cases – and NPV was 72%, with the majority who scored under 12 being true non-cases.
3EA Consortium QMUL–IDRAAC–MDM Final Report, v1.5 19th February 2020
Page 12 of 28
A B
Figure 5. SCARED (18 item) predicting any anxiety disorder (A) ROC curve analysis, AUC=.69, p<.001. (B) Distribution of SCARED scores in non-cases (left), subthreshold cases (anxiety symptoms but little impairment or distress; middle), and cases with a diagnosis of anxiety disorder and moderate to severe impairment and/distress (right); blue dashed line represents cut-off of 12, estimated to be optimal based on ROC curve.
3.1.3. CPSS Exploratory factor analysis: Two factors were extracted, which explained 59.8% of the variance, though the scree plot suggested that a one factor solution may be acceptable (see Appendix 4, p5). The first factor consisted of items broadly from the following DSM-5 criteria: Criterion B, Intrusion Symptoms; Criterion C, Avoidance; and Criterion E, Alterations in Arousal and Reactivity. This factor also maps onto the three Criteria from ICD 11: Criterion B, Re-experiencing; Criterion C, Avoidance; and Criterion D, Hyperarousal. The second factor consisted broadly of items from DSM-5 Criterion D, Negative Alterations in Cognitions and Mood. This may suggest that the ‘core’ PTSD items were represented by the first factor, and those that are less specific (e.g., also associated with depression) were represented by the second factor. However, the scree plots suggest that a one-factor solution is also acceptable; forcing all items onto one factor results in all items having a factor loading of at least .56. Distribution: Just over a quarter of children (27.2%) in the BIOPATH sample reported at least one event that still bothers them today. Just over half of reported events occurred during the war in Syria, but approximately 40% of reported events occurred after displacement in Lebanon (e.g., fires in settlements, road accidents, and interpersonal violence). During the later data collection for VaST, the number of children reporting an event had increased to 58.8%. Again, over half were events that occured in Syria, and around 40% occured in Lebanon. The total CPSS score was calculated from symptom items only and was positively skewed (see Appendix 4, Figure A4.6), as expected for a measure of psychopathology. This was true for the BIOPATH sample and the subsample with clinical interviews, although there was an upwards shift of the distribution in the subsample with an increase in mean score from 10.80 to 17.51 (data collection took place 3-10 months later); this seemed to be driven by an approximate doubling of mean scores in those who did not report an event. As predicted, the mean score was higher in those reporting an event than those who did not report an event (Appendix 4, Figure A4.6, panels B-C and E-F). In the BIOPATH sample, 7.5% of children were estimated to meet DSM-5 criteria for PTSD based on applying an algorithm to CPSS responses (this required children to have reported a potentially traumatic event [Criterion A] and endorsed the minimum number of required symptoms from Criteria B-E). This had increased to 25.4% during data collection in the subsample. Reliability: The CPSS showed excellent internal consistency: Cronbach’s α=.94. Interviewers reported that younger children (aged approx. 8-10 years) found it hard to understand what was meant by an ‘event’, which made it difficult to complete the symptom checklist in some cases.
3EA Consortium QMUL–IDRAAC–MDM Final Report, v1.5 19th February 2020
Page 13 of 28
A B
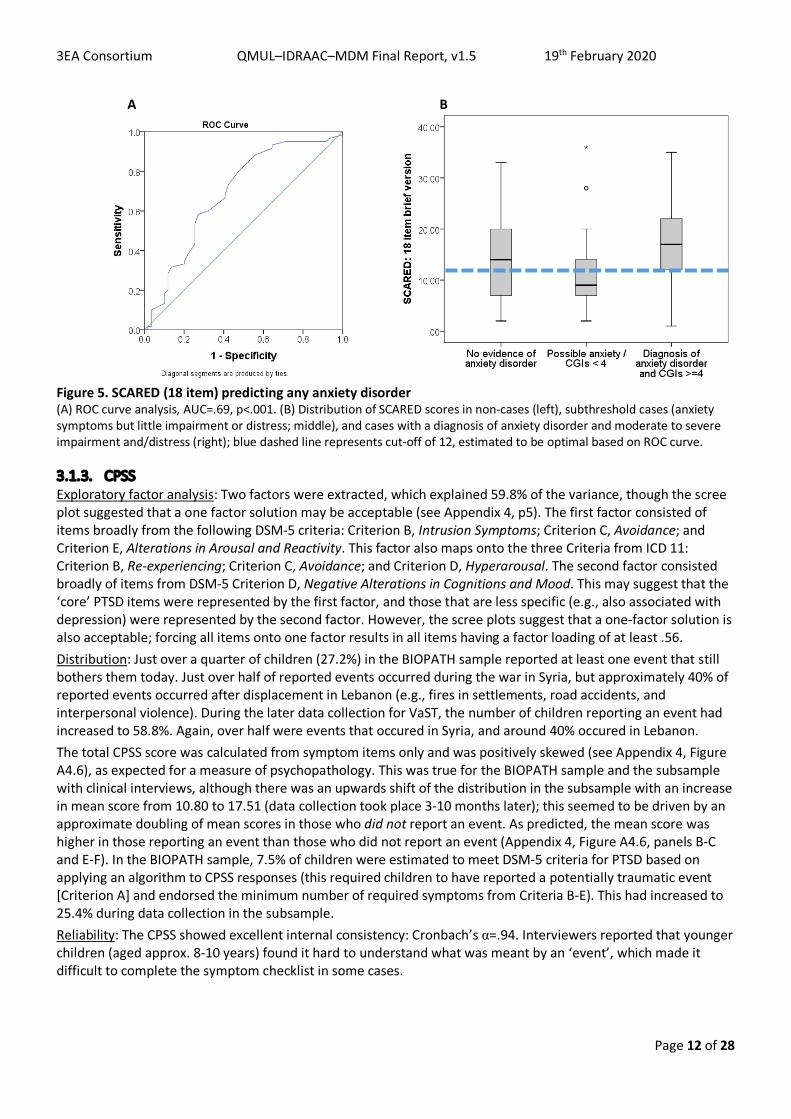
Figure 9. CPSS predicting PTSD (A) ROC curve analysis, AUC=.70, p<.001. (B) Distribution of CPSS scores in non-cases (left), subthreshold cases (PTSD symptoms but little impairment or distress; middle), and cases with diagnosis of PTSD and moderate to severe impairment/distress (right); blue dashed line represents cut-off of 12, estimated to be optimal based on ROC curve.
Validity: ROC curve analysis showed that the AUC was sigificantly different from chance (AUC=.70, p<.001; Figure 9, panel A) and reached an acceptable level. The distribution of CPSS scores is shown in Figure 9, panel B, for cases, non-cases, and subthreshold cases. For ROC curve analysis, only those children with a definite diagnosis of PTSD and moderate to severe impairment or distress (CGI-s score ≥4) were counted as cases (shown in right hand boxplot in Figure 9, panel B). A cut-off of 12 or above was selected based on the ROC curve. Sensitivity was high with 83% of cases being identified, but specificity was only 43% with many non-cases being misclassified. This is due to the majority of children with subthreshold symptoms and half of non-cases scoring greater than 12. PPV was moderate with 48% of children who screened positive being true cases. NPV was better with 79% of children who scored under 12 being true non-cases. As an alternative to applying a cut-off to the total score, an algorithm based on DSM-5 criteria was applied to questionnaire responses (as described above). This resulted in a lower sensitivity of 33% but a much improved specificity of 88%; while two thirds of cases were missed, this approach significantly reduced the risk of misclassifying non-cases. PPV was slightly improved at 62%, and NPV was 69%.
3.1.4. SDQ and Impact supplement Exploratory factor analysis: For the 25 symptom items of the SDQ, seven factors were extracted, which explained 49.6% of the variance (see Appendix 4, p7-8). The Prosocial scale was represented by one factor and four items from the Emotional problems subscale loaded onto another factor with one item from the Peer problems scale (Rather solitary, tends to play alone). Two items from the Conduct problems scale loaded on a factor with two Hyperactivity items and one Emotional problems item. The other three items from the Conduct problems scale loaded on a factor with one Peer problems item (Picked on or bullied by other children). The three inattention items from the Hyperactivity scale loaded on a factor by themselves. The Peer problems items loaded across four separate factors. Finally, the Peer problems item Gets on better with adults than other children loaded on a factor by itself, but with some evidence of cross-loading on the Prosocial subscale. This item was negatively correlated with other items in the Peer problems scale and was endorsed at a high frequency, suggesting that it does not index social difficulties in this population. In summary, the original subscale structure was only partially reproduced, and internalising and externalising items did not clearly separate. For the Impact supplement there was a one factor solution, explaining 54.0% of the variance and all items had a factor loading of .58 or greater (see Appendix 4, p7&9). Reliability: Internal consistency was acceptable for SDQ total difficulties: Cronbach’s α=.76; and for the Impact supplement: α=.78. However, it was low for the five subscales and the internalising and externalising scales (see Table 3).
3EA Consortium QMUL–IDRAAC–MDM Final Report, v1.5 19th February 2020
Page 14 of 28
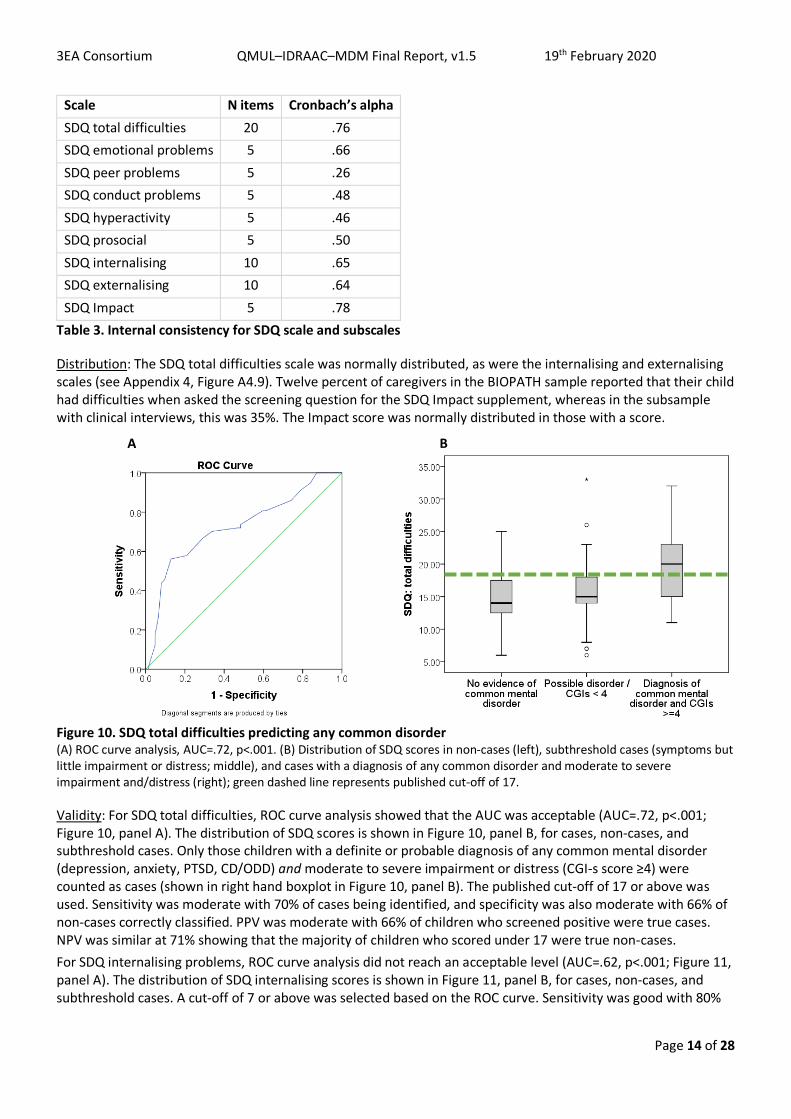
Scale N items Cronbach’s alpha SDQ total difficulties 20 .76 SDQ emotional problems 5 .66 SDQ peer problems 5 .26 SDQ conduct problems 5 .48 SDQ hyperactivity 5 .46 SDQ prosocial 5 .50 SDQ internalising 10 .65 SDQ externalising 10 .64 SDQ Impact 5 .78
Table 3. Internal consistency for SDQ scale and subscales
Distribution: The SDQ total difficulties scale was normally distributed, as were the internalising and externalising scales (see Appendix 4, Figure A4.9). Twelve percent of caregivers in the BIOPATH sample reported that their child had difficulties when asked the screening question for the SDQ Impact supplement, whereas in the subsample with clinical interviews, this was 35%. The Impact score was normally distributed in those with a score.
A B
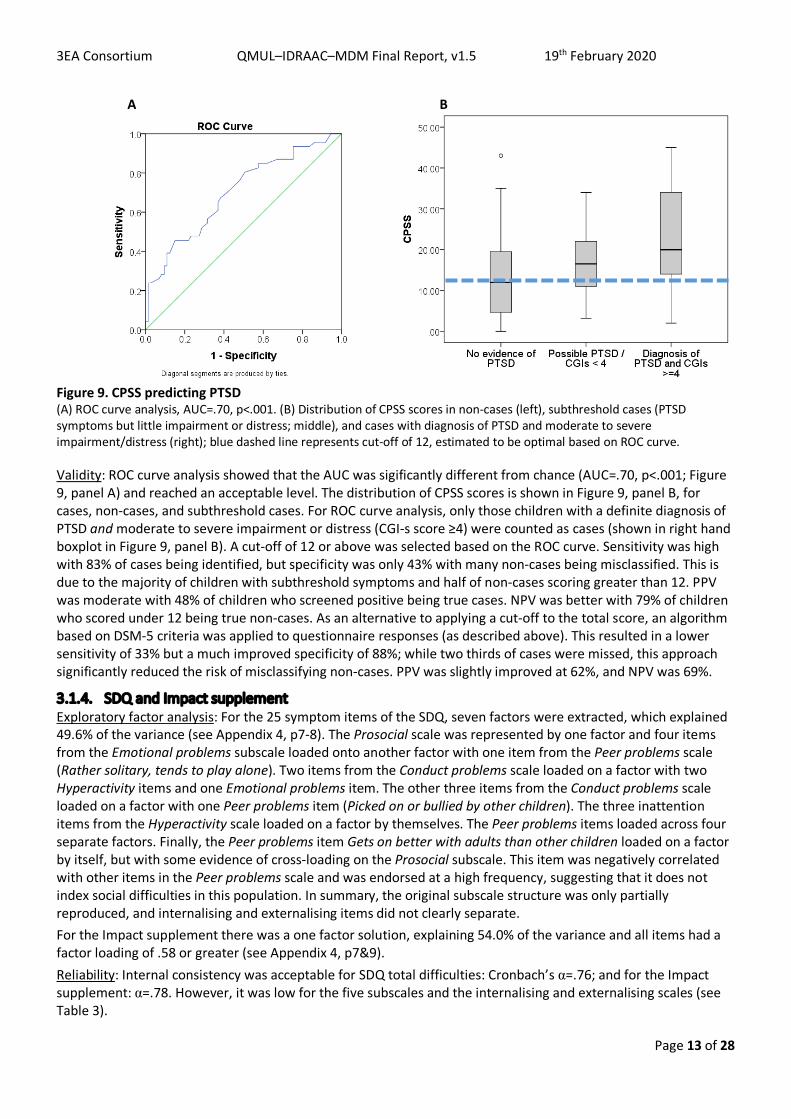
Figure 10. SDQ total difficulties predicting any common disorder (A) ROC curve analysis, AUC=.72, p<.001. (B) Distribution of SDQ scores in non-cases (left), subthreshold cases (symptoms but little impairment or distress; middle), and cases with a diagnosis of any common disorder and moderate to severe impairment and/distress (right); green dashed line represents published cut-off of 17.
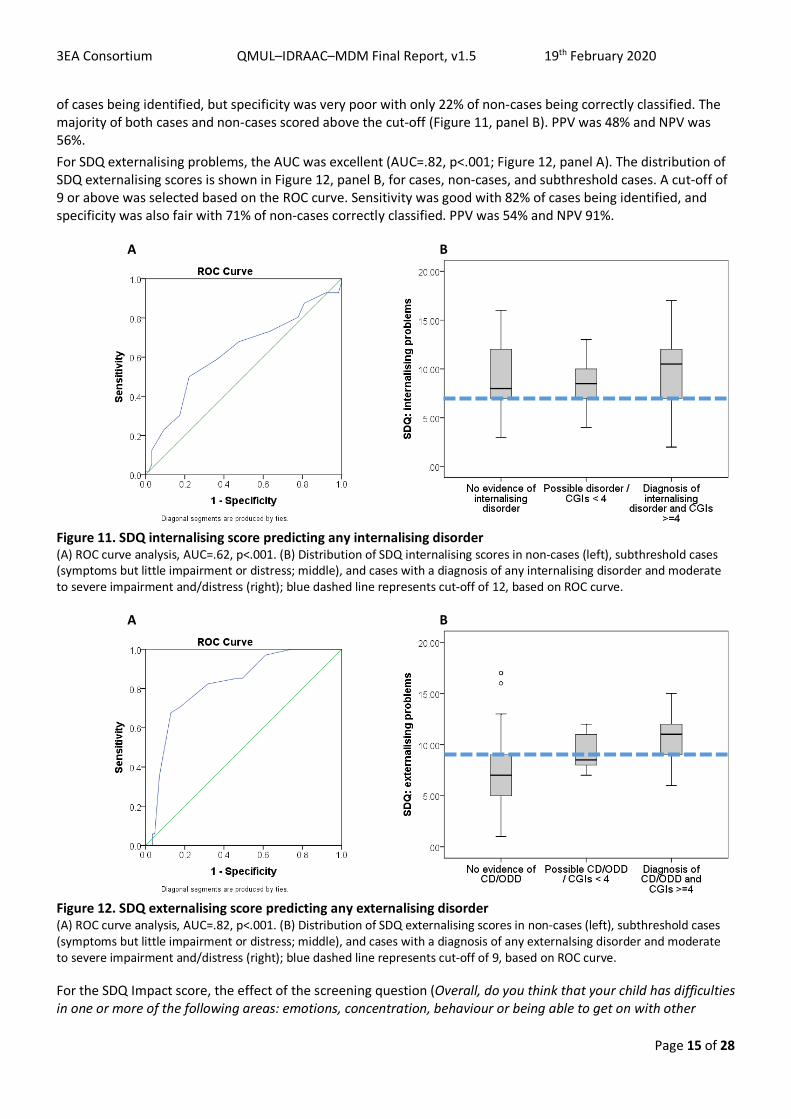
Validity: For SDQ total difficulties, ROC curve analysis showed that the AUC was acceptable (AUC=.72, p<.001; Figure 10, panel A). The distribution of SDQ scores is shown in Figure 10, panel B, for cases, non-cases, and subthreshold cases. Only those children with a definite or probable diagnosis of any common mental disorder (depression, anxiety, PTSD, CD/ODD) and moderate to severe impairment or distress (CGI-s score ≥4) were counted as cases (shown in right hand boxplot in Figure 10, panel B). The published cut-off of 17 or above was used. Sensitivity was moderate with 70% of cases being identified, and specificity was also moderate with 66% of non-cases correctly classified. PPV was moderate with 66% of children who screened positive were true cases. NPV was similar at 71% showing that the majority of children who scored under 17 were true non-cases. For SDQ internalising problems, ROC curve analysis did not reach an acceptable level (AUC=.62, p<.001; Figure 11, panel A). The distribution of SDQ internalising scores is shown in Figure 11, panel B, for cases, non-cases, and subthreshold cases. A cut-off of 7 or above was selected based on the ROC curve. Sensitivity was good with 80%
3EA Consortium QMUL–IDRAAC–MDM Final Report, v1.5 19th February 2020
Page 15 of 28
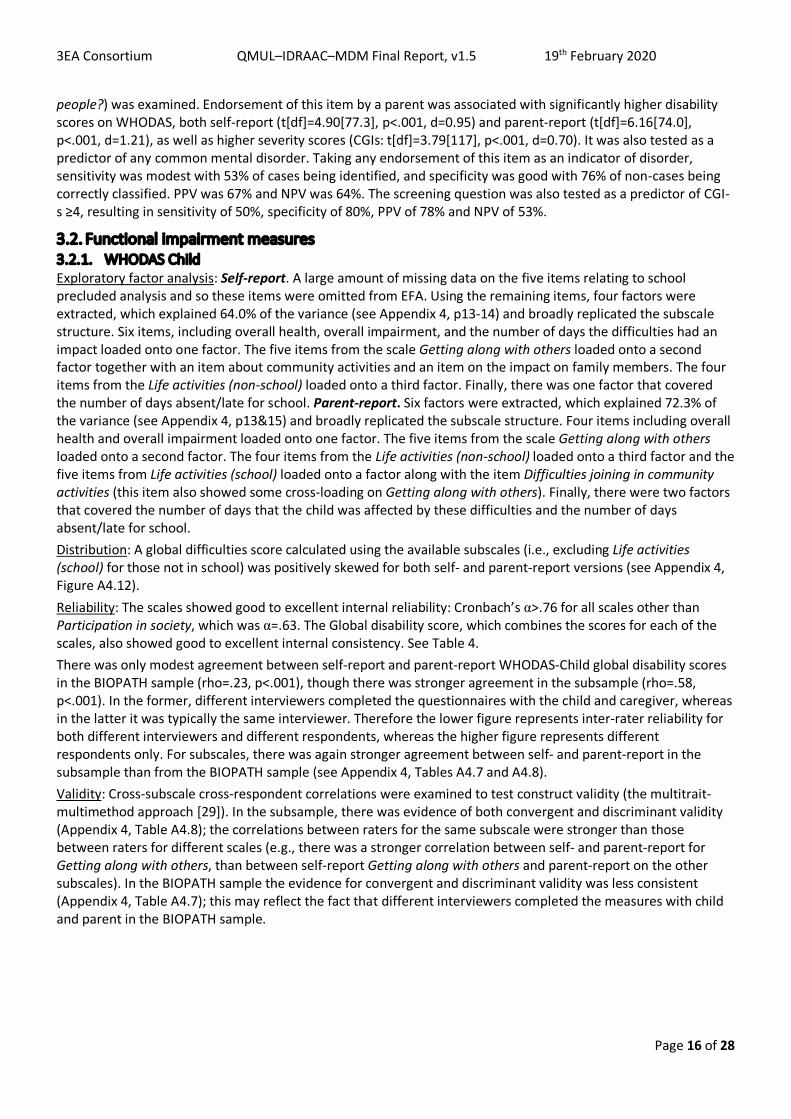
of cases being identified, but specificity was very poor with only 22% of non-cases being correctly classified. The majority of both cases and non-cases scored above the cut-off (Figure 11, panel B). PPV was 48% and NPV was 56%. For SDQ externalising problems, the AUC was excellent (AUC=.82, p<.001; Figure 12, panel A). The distribution of SDQ externalising scores is shown in Figure 12, panel B, for cases, non-cases, and subthreshold cases. A cut-off of 9 or above was selected based on the ROC curve. Sensitivity was good with 82% of cases being identified, and specificity was also fair with 71% of non-cases correctly classified. PPV was 54% and NPV 91%.
A B
Figure 11. SDQ internalising score predicting any internalising disorder (A) ROC curve analysis, AUC=.62, p<.001. (B) Distribution of SDQ internalising scores in non-cases (left), subthreshold cases (symptoms but little impairment or distress; middle), and cases with a diagnosis of any internalising disorder and moderate to severe impairment and/distress (right); blue dashed line represents cut-off of 12, based on ROC curve.
A B
Figure 12. SDQ externalising score predicting any externalising disorder (A) ROC curve analysis, AUC=.82, p<.001. (B) Distribution of SDQ externalising scores in non-cases (left), subthreshold cases (symptoms but little impairment or distress; middle), and cases with a diagnosis of any externalsing disorder and moderate to severe impairment and/distress (right); blue dashed line represents cut-off of 9, based on ROC curve.
For the SDQ Impact score, the effect of the screening question (Overall, do you think that your child has difficulties in one or more of the following areas: emotions, concentration, behaviour or being able to get on with other
3EA Consortium QMUL–IDRAAC–MDM Final Report, v1.5 19th February 2020
Page 16 of 28
people?) was examined. Endorsement of this item by a parent was associated with significantly higher disability scores on WHODAS, both self-report (t[df]=4.90[77.3], p<.001, d=0.95) and parent-report (t[df]=6.16[74.0], p<.001, d=1.21), as well as higher severity scores (CGIs: t[df]=3.79[117], p<.001, d=0.70). It was also tested as a predictor of any common mental disorder. Taking any endorsement of this item as an indicator of disorder, sensitivity was modest with 53% of cases being identified, and specificity was good with 76% of non-cases being correctly classified. PPV was 67% and NPV was 64%. The screening question was also tested as a predictor of CGI-s ≥4, resulting in sensitivity of 50%, specificity of 80%, PPV of 78% and NPV of 53%.
3.2. Functional impairment measures 3.2.1. WHODAS Child Exploratory factor analysis: Self-report. A large amount of missing data on the five items relating to school precluded analysis and so these items were omitted from EFA. Using the remaining items, four factors were extracted, which explained 64.0% of the variance (see Appendix 4, p13-14) and broadly replicated the subscale structure. Six items, including overall health, overall impairment, and the number of days the difficulties had an impact loaded onto one factor. The five items from the scale Getting along with others loaded onto a second factor together with an item about community activities and an item on the impact on family members. The four items from the Life activities (non-school) loaded onto a third factor. Finally, there was one factor that covered the number of days absent/late for school. Parent-report. Six factors were extracted, which explained 72.3% of the variance (see Appendix 4, p13&15) and broadly replicated the subscale structure. Four items including overall health and overall impairment loaded onto one factor. The five items from the scale Getting along with others loaded onto a second factor. The four items from the Life activities (non-school) loaded onto a third factor and the five items from Life activities (school) loaded onto a factor along with the item Difficulties joining in community activities (this item also showed some cross-loading on Getting along with others). Finally, there were two factors that covered the number of days that the child was affected by these difficulties and the number of days absent/late for school. Distribution: A global difficulties score calculated using the available subscales (i.e., excluding Life activities (school) for those not in school) was positively skewed for both self- and parent-report versions (see Appendix 4, Figure A4.12). Reliability: The scales showed good to excellent internal reliability: Cronbach’s α>.76 for all scales other than Participation in society, which was α=.63. The Global disability score, which combines the scores for each of the scales, also showed good to excellent internal consistency. See Table 4. There was only modest agreement between self-report and parent-report WHODAS-Child global disability scores in the BIOPATH sample (rho=.23, p<.001), though there was stronger agreement in the subsample (rho=.58, p<.001). In the former, different interviewers completed the questionnaires with the child and caregiver, whereas in the latter it was typically the same interviewer. Therefore the lower figure represents inter-rater reliability for both different interviewers and different respondents, whereas the higher figure represents different respondents only. For subscales, there was again stronger agreement between self- and parent-report in the subsample than from the BIOPATH sample (see Appendix 4, Tables A4.7 and A4.8). Validity: Cross-subscale cross-respondent correlations were examined to test construct validity (the multitrait-multimethod approach [29]). In the subsample, there was evidence of both convergent and discriminant validity (Appendix 4, Table A4.8); the correlations between raters for the same subscale were stronger than those between raters for different scales (e.g., there was a stronger correlation between self- and parent-report for Getting along with others, than between self-report Getting along with others and parent-report on the other subscales). In the BIOPATH sample the evidence for convergent and discriminant validity was less consistent (Appendix 4, Table A4.7); this may reflect the fact that different interviewers completed the measures with child and parent in the BIOPATH sample.
3EA Consortium QMUL–IDRAAC–MDM Final Report, v1.5 19th February 2020
Page 17 of 28
Scale N items Self-report version Cronbach’s alpha
Parent-report version Cronbach’s alpha
WHODAS global disability 5 subscalesA .82B .76B
WHODAS getting along with others 5 .76 .81 WHODAS life activities (non-school) 4 .91 .93 WHODAS life activities (school) 5 .88 .94 WHODAS participation in society 3 .68 .63 WHODAS overall health 1 N/A N/A WHODAS overall impairment 1 N/A N/A
Table 4. Internal consistency for WHODAS Child self- and parent-report subscales and total score calculated from subscale scores A Cronbach’s alpha was calculated using subscale scores, to reflect the way that the global disability score is calculated from subscales; B When restricted to those in school (with Life activities (school) subscale score), α=.83/.76
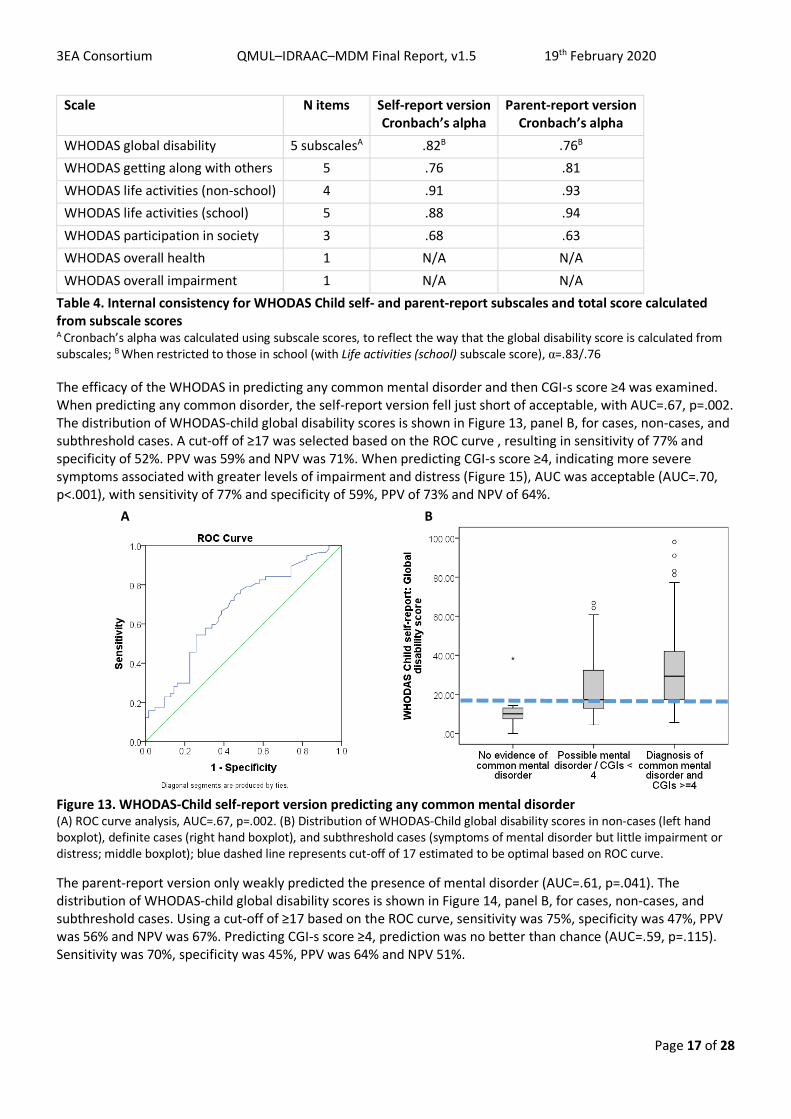
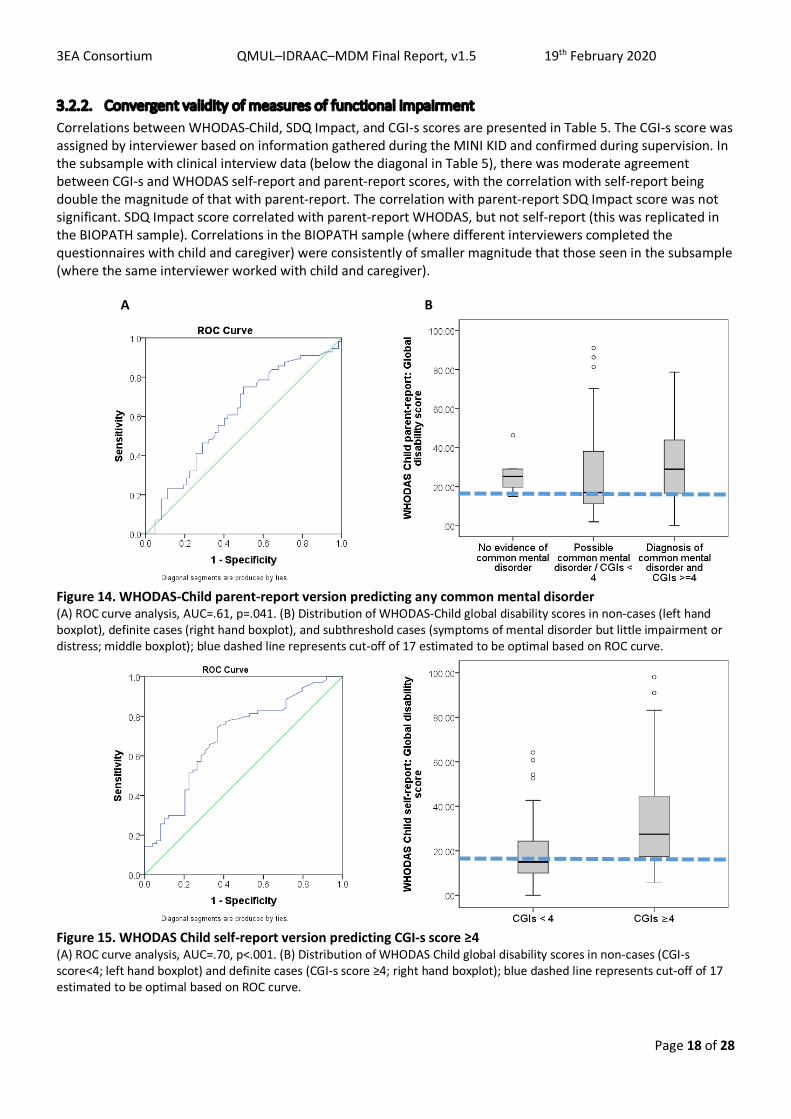
The efficacy of the WHODAS in predicting any common mental disorder and then CGI-s score ≥4 was examined. When predicting any common disorder, the self-report version fell just short of acceptable, with AUC=.67, p=.002. The distribution of WHODAS-child global disability scores is shown in Figure 13, panel B, for cases, non-cases, and subthreshold cases. A cut-off of ≥17 was selected based on the ROC curve , resulting in sensitivity of 77% and specificity of 52%. PPV was 59% and NPV was 71%. When predicting CGI-s score ≥4, indicating more severe symptoms associated with greater levels of impairment and distress (Figure 15), AUC was acceptable (AUC=.70, p<.001), with sensitivity of 77% and specificity of 59%, PPV of 73% and NPV of 64%. A B
Figure 13. WHODAS-Child self-report version predicting any common mental disorder (A) ROC curve analysis, AUC=.67, p=.002. (B) Distribution of WHODAS-Child global disability scores in non-cases (left hand boxplot), definite cases (right hand boxplot), and subthreshold cases (symptoms of mental disorder but little impairment or distress; middle boxplot); blue dashed line represents cut-off of 17 estimated to be optimal based on ROC curve.
The parent-report version only weakly predicted the presence of mental disorder (AUC=.61, p=.041). The distribution of WHODAS-child global disability scores is shown in Figure 14, panel B, for cases, non-cases, and subthreshold cases. Using a cut-off of ≥17 based on the ROC curve, sensitivity was 75%, specificity was 47%, PPV was 56% and NPV was 67%. Predicting CGI-s score ≥4, prediction was no better than chance (AUC=.59, p=.115). Sensitivity was 70%, specificity was 45%, PPV was 64% and NPV 51%.
3EA Consortium QMUL–IDRAAC–MDM Final Report, v1.5 19th February 2020
Page 18 of 28
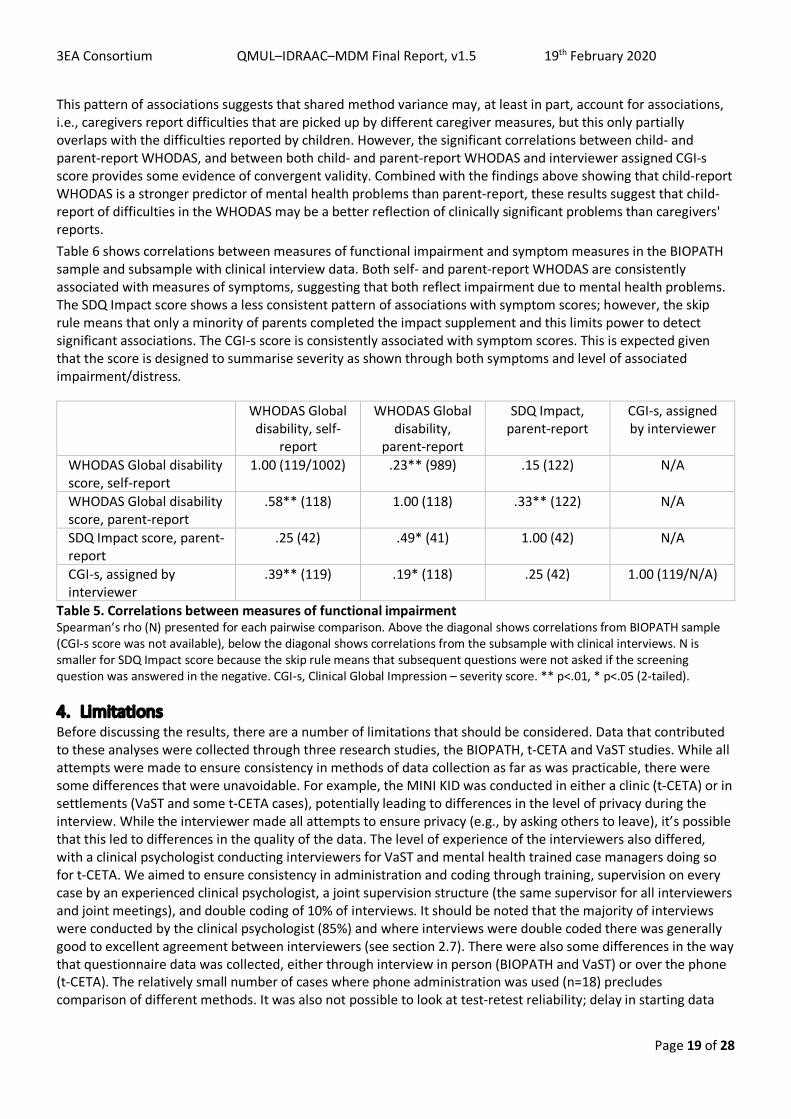
3.2.2. Convergent validity of measures of functional impairment Correlations between WHODAS-Child, SDQ Impact, and CGI-s scores are presented in Table 5. The CGI-s score was assigned by interviewer based on information gathered during the MINI KID and confirmed during supervision. In the subsample with clinical interview data (below the diagonal in Table 5), there was moderate agreement between CGI-s and WHODAS self-report and parent-report scores, with the correlation with self-report being double the magnitude of that with parent-report. The correlation with parent-report SDQ Impact score was not significant. SDQ Impact score correlated with parent-report WHODAS, but not self-report (this was replicated in the BIOPATH sample). Correlations in the BIOPATH sample (where different interviewers completed the questionnaires with child and caregiver) were consistently of smaller magnitude that those seen in the subsample (where the same interviewer worked with child and caregiver).
A B
Figure 14. WHODAS-Child parent-report version predicting any common mental disorder (A) ROC curve analysis, AUC=.61, p=.041. (B) Distribution of WHODAS-Child global disability scores in non-cases (left hand boxplot), definite cases (right hand boxplot), and subthreshold cases (symptoms of mental disorder but little impairment or distress; middle boxplot); blue dashed line represents cut-off of 17 estimated to be optimal based on ROC curve.
Figure 15. WHODAS Child self-report version predicting CGI-s score ≥4 (A) ROC curve analysis, AUC=.70, p<.001. (B) Distribution of WHODAS Child global disability scores in non-cases (CGI-s score<4; left hand boxplot) and definite cases (CGI-s score ≥4; right hand boxplot); blue dashed line represents cut-off of 17 estimated to be optimal based on ROC curve.
3EA Consortium QMUL–IDRAAC–MDM Final Report, v1.5 19th February 2020
Page 19 of 28
This pattern of associations suggests that shared method variance may, at least in part, account for associations, i.e., caregivers report difficulties that are picked up by different caregiver measures, but this only partially overlaps with the difficulties reported by children. However, the significant correlations between child- and parent-report WHODAS, and between both child- and parent-report WHODAS and interviewer assigned CGI-s score provides some evidence of convergent validity. Combined with the findings above showing that child-report WHODAS is a stronger predictor of mental health problems than parent-report, these results suggest that child-report of difficulties in the WHODAS may be a better reflection of clinically significant problems than caregivers' reports. Table 6 shows correlations between measures of functional impairment and symptom measures in the BIOPATH sample and subsample with clinical interview data. Both self- and parent-report WHODAS are consistently associated with measures of symptoms, suggesting that both reflect impairment due to mental health problems. The SDQ Impact score shows a less consistent pattern of associations with symptom scores; however, the skip rule means that only a minority of parents completed the impact supplement and this limits power to detect significant associations. The CGI-s score is consistently associated with symptom scores. This is expected given that the score is designed to summarise severity as shown through both symptoms and level of associated impairment/distress.
WHODAS Global disability, self-
report
WHODAS Global disability,
parent-report
SDQ Impact, parent-report
CGI-s, assigned by interviewer
WHODAS Global disability score, self-report
1.00 (119/1002) .23** (989) .15 (122) N/A
WHODAS Global disability score, parent-report
.58** (118) 1.00 (118) .33** (122) N/A
SDQ Impact score, parent-report
.25 (42) .49* (41) 1.00 (42) N/A
CGI-s, assigned by interviewer
.39** (119) .19* (118) .25 (42) 1.00 (119/N/A)
Table 5. Correlations between measures of functional impairment Spearman’s rho (N) presented for each pairwise comparison. Above the diagonal shows correlations from BIOPATH sample (CGI-s score was not available), below the diagonal shows correlations from the subsample with clinical interviews. N is smaller for SDQ Impact score because the skip rule means that subsequent questions were not asked if the screening question was answered in the negative. CGI-s, Clinical Global Impression – severity score. ** p<.01, * p<.05 (2-tailed).
4. Limitations Before discussing the results, there are a number of limitations that should be considered. Data that contributed to these analyses were collected through three research studies, the BIOPATH, t-CETA and VaST studies. While all attempts were made to ensure consistency in methods of data collection as far as was practicable, there were some differences that were unavoidable. For example, the MINI KID was conducted in either a clinic (t-CETA) or in settlements (VaST and some t-CETA cases), potentially leading to differences in the level of privacy during the interview. While the interviewer made all attempts to ensure privacy (e.g., by asking others to leave), it’s possible that this led to differences in the quality of the data. The level of experience of the interviewers also differed, with a clinical psychologist conducting interviewers for VaST and mental health trained case managers doing so for t-CETA. We aimed to ensure consistency in administration and coding through training, supervision on every case by an experienced clinical psychologist, a joint supervision structure (the same supervisor for all interviewers and joint meetings), and double coding of 10% of interviews. It should be noted that the majority of interviews were conducted by the clinical psychologist (85%) and where interviews were double coded there was generally good to excellent agreement between interviewers (see section 2.7). There were also some differences in the way that questionnaire data was collected, either through interview in person (BIOPATH and VaST) or over the phone (t-CETA). The relatively small number of cases where phone administration was used (n=18) precludes comparison of different methods. It was also not possible to look at test-retest reliability; delay in starting data
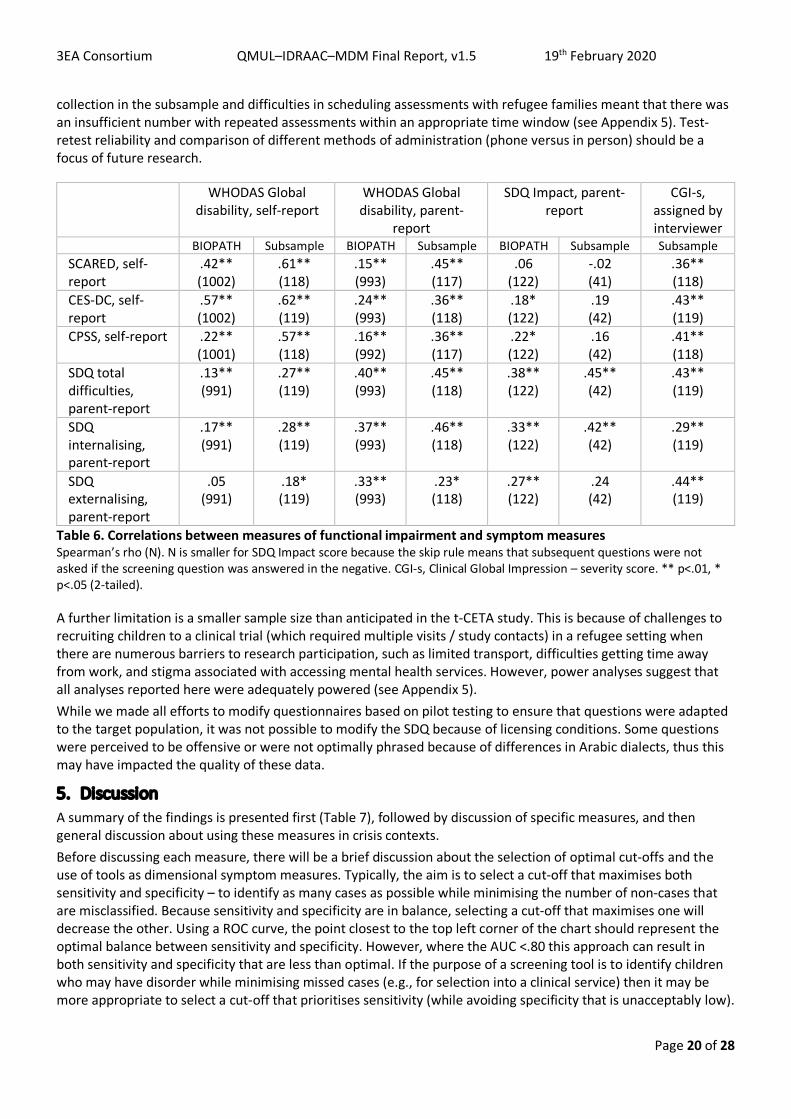
3EA Consortium QMUL–IDRAAC–MDM Final Report, v1.5 19th February 2020
Page 20 of 28
collection in the subsample and difficulties in scheduling assessments with refugee families meant that there was an insufficient number with repeated assessments within an appropriate time window (see Appendix 5). Test-retest reliability and comparison of different methods of administration (phone versus in person) should be a focus of future research.
WHODAS Global disability, self-report
WHODAS Global disability, parent-
report
SDQ Impact, parent-report
CGI-s, assigned by interviewer
BIOPATH Subsample BIOPATH Subsample BIOPATH Subsample Subsample SCARED, self-report
.42** (1002)
.61** (118)
.15** (993)
.45** (117)
.06 (122)
-.02 (41)
.36** (118)
CES-DC, self-report
.57** (1002)
.62** (119)
.24** (993)
.36** (118)
.18* (122)
.19 (42)
.43** (119)
CPSS, self-report .22** (1001)
.57** (118)
.16** (992)
.36** (117)
.22* (122)
.16 (42)
.41** (118)
SDQ total difficulties, parent-report
.13** (991)
.27** (119)
.40** (993)
.45** (118)
.38** (122)
.45** (42)
.43** (119)
SDQ internalising, parent-report
.17** (991)
.28** (119)
.37** (993)
.46** (118)
.33** (122)
.42** (42)
.29** (119)
SDQ externalising, parent-report
.05 (991)
.18* (119)
.33** (993)
.23* (118)
.27** (122)
.24 (42)
.44** (119)
Table 6. Correlations between measures of functional impairment and symptom measures Spearman’s rho (N). N is smaller for SDQ Impact score because the skip rule means that subsequent questions were not asked if the screening question was answered in the negative. CGI-s, Clinical Global Impression – severity score. ** p<.01, * p<.05 (2-tailed).
A further limitation is a smaller sample size than anticipated in the t-CETA study. This is because of challenges to recruiting children to a clinical trial (which required multiple visits / study contacts) in a refugee setting when there are numerous barriers to research participation, such as limited transport, difficulties getting time away from work, and stigma associated with accessing mental health services. However, power analyses suggest that all analyses reported here were adequately powered (see Appendix 5). While we made all efforts to modify questionnaires based on pilot testing to ensure that questions were adapted to the target population, it was not possible to modify the SDQ because of licensing conditions. Some questions were perceived to be offensive or were not optimally phrased because of differences in Arabic dialects, thus this may have impacted the quality of these data.
5. Discussion A summary of the findings is presented first (Table 7), followed by discussion of specific measures, and then general discussion about using these measures in crisis contexts. Before discussing each measure, there will be a brief discussion about the selection of optimal cut-offs and the use of tools as dimensional symptom measures. Typically, the aim is to select a cut-off that maximises both sensitivity and specificity – to identify as many cases as possible while minimising the number of non-cases that are misclassified. Because sensitivity and specificity are in balance, selecting a cut-off that maximises one will decrease the other. Using a ROC curve, the point closest to the top left corner of the chart should represent the optimal balance between sensitivity and specificity. However, where the AUC <.80 this approach can result in both sensitivity and specificity that are less than optimal. If the purpose of a screening tool is to identify children who may have disorder while minimising missed cases (e.g., for selection into a clinical service) then it may be more appropriate to select a cut-off that prioritises sensitivity (while avoiding specificity that is unacceptably low).
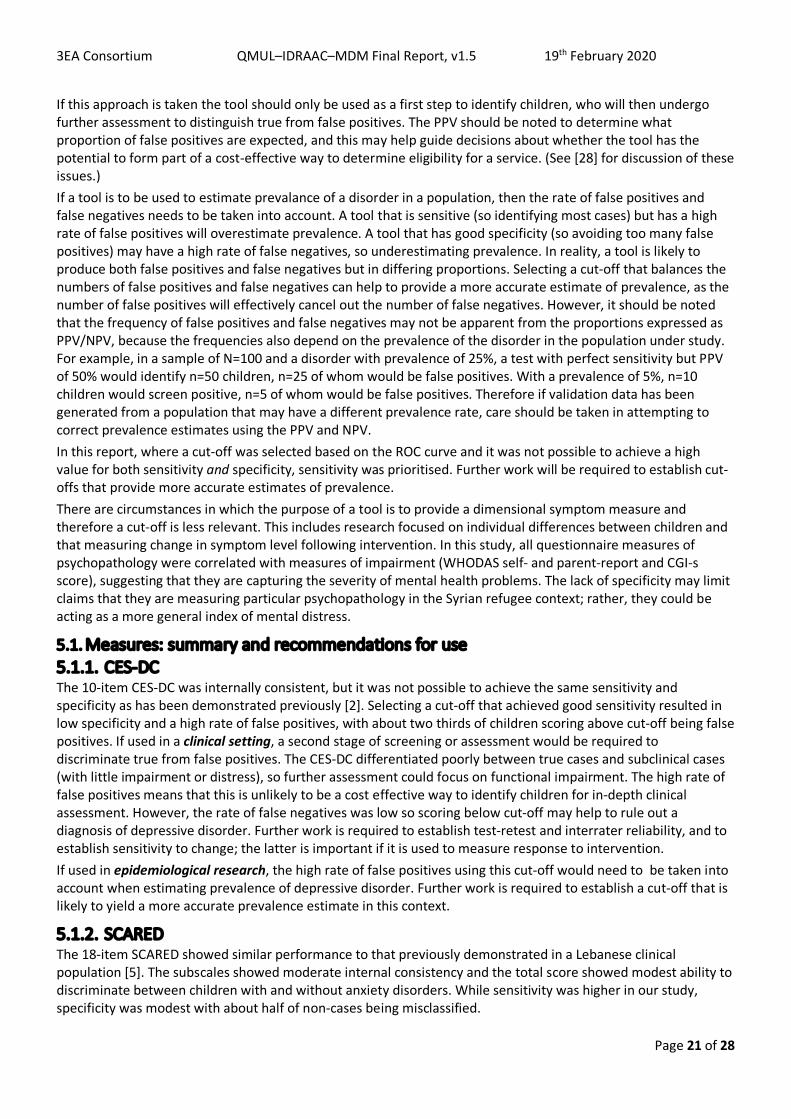
3EA Consortium QMUL–IDRAAC–MDM Final Report, v1.5 19th February 2020
Page 21 of 28
If this approach is taken the tool should only be used as a first step to identify children, who will then undergo further assessment to distinguish true from false positives. The PPV should be noted to determine what proportion of false positives are expected, and this may help guide decisions about whether the tool has the potential to form part of a cost-effective way to determine eligibility for a service. (See [28] for discussion of these issues.) If a tool is to be used to estimate prevalance of a disorder in a population, then the rate of false positives and false negatives needs to be taken into account. A tool that is sensitive (so identifying most cases) but has a high rate of false positives will overestimate prevalence. A tool that has good specificity (so avoiding too many false positives) may have a high rate of false negatives, so underestimating prevalence. In reality, a tool is likely to produce both false positives and false negatives but in differing proportions. Selecting a cut-off that balances the numbers of false positives and false negatives can help to provide a more accurate estimate of prevalence, as the number of false positives will effectively cancel out the number of false negatives. However, it should be noted that the frequency of false positives and false negatives may not be apparent from the proportions expressed as PPV/NPV, because the frequencies also depend on the prevalence of the disorder in the population under study. For example, in a sample of N=100 and a disorder with prevalence of 25%, a test with perfect sensitivity but PPV of 50% would identify n=50 children, n=25 of whom would be false positives. With a prevalence of 5%, n=10 children would screen positive, n=5 of whom would be false positives. Therefore if validation data has been generated from a population that may have a different prevalence rate, care should be taken in attempting to correct prevalence estimates using the PPV and NPV. In this report, where a cut-off was selected based on the ROC curve and it was not possible to achieve a high value for both sensitivity and specificity, sensitivity was prioritised. Further work will be required to establish cut-offs that provide more accurate estimates of prevalence. There are circumstances in which the purpose of a tool is to provide a dimensional symptom measure and therefore a cut-off is less relevant. This includes research focused on individual differences between children and that measuring change in symptom level following intervention. In this study, all questionnaire measures of psychopathology were correlated with measures of impairment (WHODAS self- and parent-report and CGI-s score), suggesting that they are capturing the severity of mental health problems. The lack of specificity may limit claims that they are measuring particular psychopathology in the Syrian refugee context; rather, they could be acting as a more general index of mental distress.
5.1. Measures: summary and recommendations for use 5.1.1. CES-DC The 10-item CES-DC was internally consistent, but it was not possible to achieve the same sensitivity and specificity as has been demonstrated previously [2]. Selecting a cut-off that achieved good sensitivity resulted in low specificity and a high rate of false positives, with about two thirds of children scoring above cut-off being false positives. If used in a clinical setting, a second stage of screening or assessment would be required to discriminate true from false positives. The CES-DC differentiated poorly between true cases and subclinical cases (with little impairment or distress), so further assessment could focus on functional impairment. The high rate of false positives means that this is unlikely to be a cost effective way to identify children for in-depth clinical assessment. However, the rate of false negatives was low so scoring below cut-off may help to rule out a diagnosis of depressive disorder. Further work is required to establish test-retest and interrater reliability, and to establish sensitivity to change; the latter is important if it is used to measure response to intervention. If used in epidemiological research, the high rate of false positives using this cut-off would need to be taken into account when estimating prevalence of depressive disorder. Further work is required to establish a cut-off that is likely to yield a more accurate prevalence estimate in this context.
5.1.2. SCARED The 18-item SCARED showed similar performance to that previously demonstrated in a Lebanese clinical population [5]. The subscales showed moderate internal consistency and the total score showed modest ability to discriminate between children with and without anxiety disorders. While sensitivity was higher in our study, specificity was modest with about half of non-cases being misclassified.
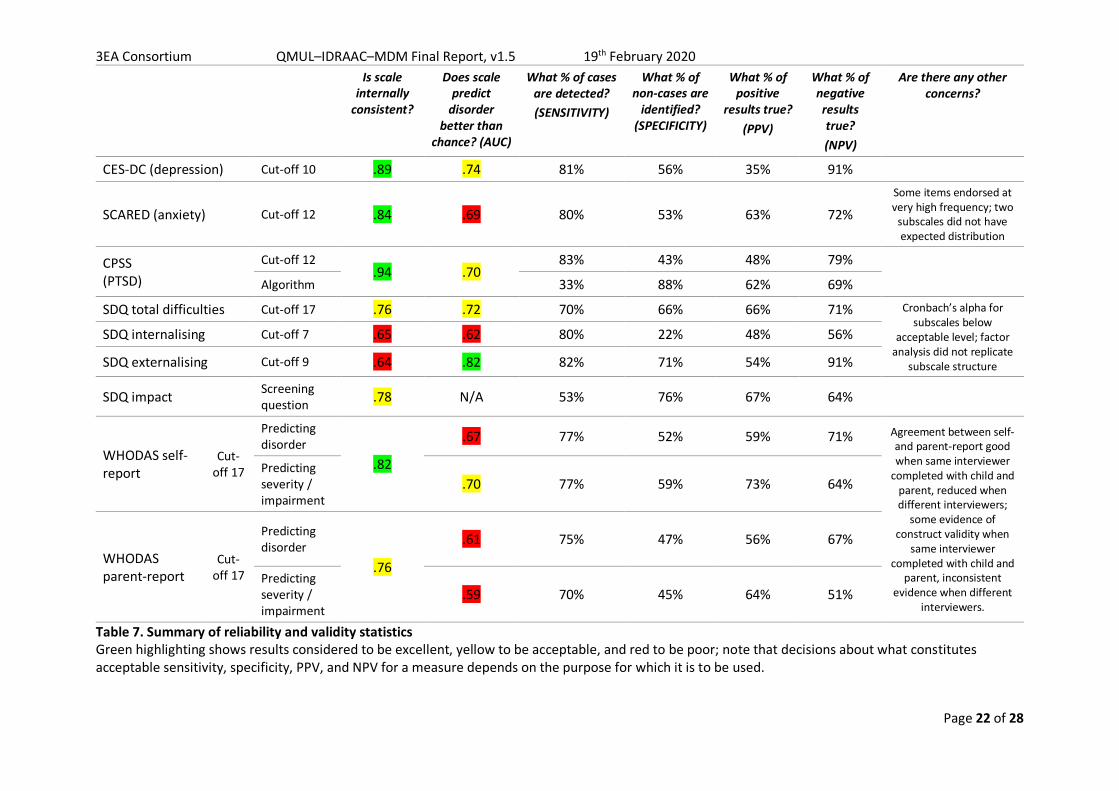
3EA Consortium QMUL–IDRAAC–MDM Final Report, v1.5 19th February 2020
Page 22 of 28
Is scale
internally consistent?
Does scale predict
disorder better than
chance? (AUC)
What % of cases are detected? (SENSITIVITY)
What % of non-cases are
identified? (SPECIFICITY)
What % of positive
results true? (PPV)
What % of negative results true? (NPV)
Are there any other concerns?
CES-DC (depression) Cut-off 10 .89 .74 81% 56% 35% 91%
SCARED (anxiety) Cut-off 12 .84 .69 80% 53% 63% 72% Some items endorsed at very high frequency; two
subscales did not have expected distribution
CPSS (PTSD)
Cut-off 12 .94 .70
83% 43% 48% 79%
Algorithm 33% 88% 62% 69%
SDQ total difficulties Cut-off 17 .76 .72 70% 66% 66% 71% Cronbach’s alpha for subscales below
acceptable level; factor analysis did not replicate
subscale structure
SDQ internalising Cut-off 7 .65 .62 80% 22% 48% 56%
SDQ externalising Cut-off 9 .64 .82 82% 71% 54% 91%
SDQ impact Screening question .78 N/A 53% 76% 67% 64%
WHODAS self-report
Cut-off 17
Predicting disorder
.82
.67 77% 52% 59% 71% Agreement between self- and parent-report good when same interviewer
completed with child and parent, reduced when different interviewers;
some evidence of construct validity when
same interviewer completed with child and
parent, inconsistent evidence when different
interviewers.
Predicting severity / impairment
.70 77% 59% 73% 64%
WHODAS parent-report
Cut-off 17
Predicting disorder
.76
.61 75% 47% 56% 67%
Predicting severity / impairment
.59 70% 45% 64% 51%
Table 7. Summary of reliability and validity statistics Green highlighting shows results considered to be excellent, yellow to be acceptable, and red to be poor; note that decisions about what constitutes acceptable sensitivity, specificity, PPV, and NPV for a measure depends on the purpose for which it is to be used.
3EA Consortium QMUL–IDRAAC–MDM Final Report, v1.5 19th February 2020
Page 23 of 28
A number of SCARED items were endorsed at very high frequency and the 3-item subscales for Social and Separation anxiety did not show the expected distribution. It is possible that some questions are confounded by the context of displacement. For example, being scared about being separated from parents, sleeping away from home, being alone in the house, or worrying about the future may be common reactions in children who have been displaced. Furthermore, some items may reflect living in informal tented settlements (ITS) where there are sometimes hostilities, such as reporting being shy or nervous with people the child doesn’t know well. However, similarly elevated scores have been found in a school-based study involving Lebanese and Syrian students, suggesting that there may be broader cultural factors that influence the performance of the SCARED in Lebanon and that require further exploration (Karam, E., Karam, G., Saab, D., unpublished data). These issues may increase the level of reported anxiety symptoms across the whole sample, and contribute to the difficultly in separating children with clinically-significant anxiety from those without. More than half of children with no evidence of anxiety disorder at clinical interview nevertheless had SCARED scores above the cut-off, confirming that, in this population of displaced Syrian children, the SCARED has limited value in identifying cases. Apparently elevated prevalence of anxiety shown by the SCARED should therefore be interpreted with caution. Further work will be required to determine if the same items are endorsed at high frequency in other populations in the Middle East, and in a range of contexts, to understand the extent to which cultural and contextual factors may influence children’s responses. A clearer understanding will be required in order to identify those symptoms that provide better discrimination of anxiety disorders from feelings or behaviour that are normative in the context. These concerns mean that this 18-item version of the SCARED is not currently recommended for the purpose of screening for anxiety disorders in clinical settings in the Syrian refugee context.
5.2. CPSS The CPSS was internally consistent, but it was difficult to achieve a good balance between sensitivity and specificity. With sensitivity of 83%, specificity was only 42% and the false positive rate was 52%. The one previous study in a war-exposed population also failed to achieve both good sensitivity and specificity (reporting moderate values for each and using a higher cut-off than used here) and had a very high false positive rate [19]. One possibility is that the lack of specificity means that children with other difficulties (e.g., depression) are picked up by the CPSS. Examining data from the false positives, nearly half met criteria for an internalising or externalising disorder. Applying an algorithm aligned to DSM-5 criteria for PTSD to the CPSS responses addressed this by increasing specificity to 88%; however, the trade off was very low sensitivity, with two thirds of cases being missed using this approach. If used to screen in a clinical setting, applying a cut-off would identify most cases but further assessment would be required to separate true from false positives, and to assess for a range of other difficulties that may be present in those who do not meet criteria for PTSD. If used in epidemiological research, further work is required to establish a cut-off that is likely to yield a more accurate prevalence estimate in this context.
Data on the types of events described by children in the CPSS have not yet been explored; it will be necessary to establish if events are consistent with those set out in DSM-5 for PTSD and whether using this information improves the performance of the CPSS (e.g., in conjunction with a cut-off score). The increase in reported events between data collection for BIOPATH and then several months later in the subsample has also still to be explored. While there is an increase at group level, it will be of interest to check whether the events reported by children are consistent over time for events that happened prior to BIOPATH data collection. It is currently unclear why there is an increase in both events reported and PTSD symptoms, but this might relate to changing circumstances in the Beqaa region around the time of data collection. Many families reported an increase in events like army raids and evictions, and were concerned about forced return to Syria. Events like army raids could have been reported as new traumatic events, or triggered stronger memories of events that occurred during the war. The increase in PTSD symptom scores appeared to be driven by those who did not report a traumatic event, which might suggest that increased CPSS scores reflect symptoms not specific to PTSD (e.g., depression) related to changing circumstances. This is consistent with a concurrent increase in scores for the CES-DC, SDQ, and WHODAS. However, this is speculative and we cannot rule out alternative explanations including interviewer effects and differences in the context of data collection.
5.3. SDQ + Impact supplement
3EA Consortium QMUL–IDRAAC–MDM Final Report, v1.5 19th February 2020
Page 24 of 28
The subscale structure of the SDQ was not replicated and the subscales showed poor internal consistency (α=.26-.66). While this might relate to the different culture and context, it should be noted that some data from UK children also fell short of standard criteria for internal consistency (α=.58-.77 [22]). In Arab samples, subscales were not internally consistent using parent-report in children from GAZA [30] and could not be replicated in Omani and Syrian children using teacher report [21]. This suggests that the subscales may not clearly capture distinct patterns of psychopathology in Arab populations. Factor analysis suggested that some items may have a different meaning in this population. For example, the item Gets on better with adults than other children, which is intended to measure difficulties with peer relationships, was negatively correlated with other Peer problems items, endorsed at a high frequency, and showed some cross-loading on the Prosocial factor. This suggests that it may be interpreted as a desirable trait – such as a sign of maturity or good manners – rather than as a measure of social difficulties in this population. Another study found that this item was not valid in children from Oman consistently across self-, parent-, and teacher-report versions [20]. The authors offered a similar explanation, suggesting that in a collective culture where there are fewer boundaries between relationships with the same versus different age groups, this item does not capture peer problems. In our study, interviewers reported that some items were culturally insensitive and some parents experienced it as shameful or as an accusation to be asked items such as Steals from home, school or elsewhere. Despite interviewers making it clear that these are standard items asked to everyone, some items were endorsed at very low frequencies and may not reflect the actual prevalence of these behaviours in this population.
Two of the factors identified by factor analysis included items from both internalising and externalising subscales, suggesting that this may not be a clear distinction in this population, or that some items carry a different meaning. For example, the Emotional problems item Nervous or clingy in new situations, easily loses confidence loaded with externalising behaviour problems, replicating a finding from children with learning disabilities in Oman and Saudi Arabia using the teacher-report version [31]. This is consistent with another recent study of Syrian children in Lebanon (aged 5-16 years) that suggested that anger and sadness were associated in children’s descriptions of their emotions during social situations [32]. This was contrary to research based on WEIRD (Western, Educated, Industrialised, Rich, Developed) populations, where the processes involved in identifying and regulating emotions such as anger and sadness are thought to be different. While it is possible that this is an artefact (e.g., reflecting differential item response patterns), the similarities across studies and methods (including child vs. parent-report) are suggestive of differences in the way emotions are experienced or expressed in the Syrian refugee context.
Despite these issues, the Total difficulties score and Externalising subscale showed reasonable ability to discriminate between children with mental disorders and those without, achieving AUC values (.72, .82) comparable to that reported in children from Yemen [8]. In particular, the Externalising subscale achieved sensitivity of 82% and specificity of 71% in detecting conduct or oppositional defiant disorder. This suggests that even with relatively poor internal consistency, these checklists of problems may nevertheless have utility in screening for clinically significant difficulties in Syrian refugee children. No data on reliability were reported from the Yemen study so it is not clear if similar issues with internal consistency were seen. The SDQ Total difficulties score and Externalising subscale could be used as a first stage of screening in a clinical setting, with further assessment to differentiate true from false positives. A negative result on the externalising scale rule outs conduct problems with a high degree of confidence. However, the Internalising subscale performed poorly, with very low specificity (22%) driven by the majority of children scoring above cut-off. This mirrored the SCARED, where a large proportion of non-cases scored above cut-off, suggesting that the difficulties in identifying children with anxiety disorders in this population are not specific to the SCARED nor to self-report measures. The SDQ Internalising subscale is not recommended as a way to screen for internalising disorders in this context.
5.4. Measures of functional impairment The WHODAS-Child self- and parent-report versions showed reasonable replication of the subscale structure and good internal consistency. Self- and parent-report versions were significantly associated with each other, as well as with the Clinical Global Impression – severity (CGI-s) score assigned by interviewer and confirmed during clinical supervision. Scoring above a cut-off of 17 on the self-report WHODAS-Child was a reasonable predictor of having a CGI-s score ≥4, suggesting that the self-report WHODAS-Child may have utility in identifying children with
3EA Consortium QMUL–IDRAAC–MDM Final Report, v1.5 19th February 2020
Page 25 of 28
more severe and impairing mental health problems in this population. The parent-report WHODAS-Child did not significantly predict CGI-s score ≥4 in this context. The self-report version could potentially be combined with a symptom scale with high sensitivity as a second stage of screening, though the effectiveness of this approach has yet to be tested.
The SDQ Impact supplement is intended to be used in this way, and endorsing the screening question did significantly predict CGI-s ≥4 with good specificity. However, the use of a skip rule means that only around half of parents whose child met criteria for a mental disorder completed it, resulting in low sensitivity. The screening question asks parents if they think their child has difficulties in emotions, concentration, behaviour or being able to get on with other people, so it relies on the parent conceptualising their child’s difficulties in this way. It was apparent that some parents who answered No to this question subsequently requested mental health services for their child, suggesting that in this population the screening question may not be effective. However, it should be noted that the parent-report version of the WHODAS-Child was also a poor predictor of CGI-s score, suggesting that parent-report measures provide more limited insight into impairment and distress resulting from their child’s mental health problems.
Many children in our sample did not attend school and this meant that the WHODAS-Child subscale relating to impairment at school was missing for many cases. While a global impairment score was calculated from the other subscales in these cases, this rests on the assumption that impairment in school is highly correlated with impairment in other settings. However, it is possible that impairment is more likely to manifest in the more structured school setting than in settings with fewer demands. Further work will be required to explore whether performance of the WHODAS-Child differs in children who do or do not attend school.
5.5. Respondent and interviewer effects The WHODAS-Child was the only measure where we used both self- and parent-report versions, allowing a direct comparison between respondants. When child and parent were interviewed by the same person, there was good agreement between child and parent reports. However, where a different interviewer completed the questionnaire with child and parent the agreement was less than half the magnitude. This suggests that even when using a questionnaire with closed questions, there may be a significant interviewer effect. It also introduced a challenge to reliability, such that construct validity for the WHODAS-Child subscales was hard to replicate when different interviewers were used. We aimed to ensure that interviewers were focusing on the quality of data over the quantity of interviews completed, but it is likely that there were still differences in administration that could impact data quality. This highlights the need for improved training and supervision of interviewers to ensure that administration is consistent, and further work to identify ways in which administration differs (e.g., rephrasing questions, taking time to check understanding, rechecking answers if there are apparent inconsistencies). These are questionnaires designed to be self-completed, and it is unclear if similar challenges to reliability would occur if they were completed by the respondant without support (e.g., due to difficulty understanding questions or differences in interpretation).
There also seem to be significant respondant effects, such that parent-report measures of impairment were associated with each other, but much less with self-report and interviewer-report, a finding that has been reported previously for measures of both symptoms and impairment [33]. While it’s possible that parents have less insight into some forms of impairment (e.g., at school or with peers) or distress, it’s also possible that both children’s and parents’ perspectives capture unique information about impairment. There may be utility in combining information from self- and parent-report, but this has yet to be explored. Parent-report WHODAS-Child is significantly correlated with all measures of psychopathology and CGI-s score, suggesting that as a dimesional measure it captures information about impairment (despite its poorer performance when applying a cut-off).
5.6. Do these tools meet needs in the Syrian refugee context? During this project, two specific needs for screening tools were identified by mental health professionals working with Syrian refugees in Lebanon: (1) a very brief screener that could be used by outreach volunteers to identify children with problems, and (2) measures of specific mental disorders (e.g., depression, PTSD) that would help psychotherapists differentiate these types of problems. Of the tools evaluated here, none fits the criteria for a very brief screener (e.g., 5 items) so further work is required to develop and evaluate a tool for this purpose. The
3EA Consortium QMUL–IDRAAC–MDM Final Report, v1.5 19th February 2020
Page 26 of 28
CES-DC, SCARED, CPSS, and SDQ are designed to measure specific mental disorders; however, using cut-offs to optimise sensitivity results in unacceptably low specificity in most cases and the substantial proportion of false positives may at least partly reflect the presence of other psychopathology. Thus, they do not seem to be good candidates for differentiating different mental disorders from each other in clinical settings with Syrian refugees. The exception may be the tools with high NPV (CES-DC and SDQ Externalising subscale), in which case a negative result can rule out the presence of these problems with a high degree of confidence.
5.7. Challenges in applying findings to other contexts In theory, sensitivity and specificity do not differ depending on disease prevalence. However, in practice there are various ways in which methodology influences prevalence, and in turn this has an effect on the reported sensitivity and specificity of tests [34, 35]. Higher prevalence tends to mean lower specificity, though the effect on sensitivity is less predictable [35]. The way that samples are selected can result in different prevalence rates of disorders and qualitatively different types of populations, hence impacting the performance of screening tools. For example, a population with a higher prevalence might be one with more severe cases of disorder, which would make it easier to detect cases and improve the performance of a screening tool. However, what may be more likely in the Syrian refugee context is an increase in subthreshold presentations associated with challenging environmental conditions. This would result in an increase in false positives and decrease in specificity, which is what we observe in this study. If the tools are used in a population with a different prevalence of common mental disorders, and qualitative differences such as the level of adversity, then performance may differ. Caution should therefore be applied in using the cut-offs derived from this sample of vulnerable Syrian refugee children in Beqaa, Lebanon.
5.8. Next steps A number of steps need to be taken to provide further data on the performance of these measures in this context. It is possible that measures perform differently in older and younger children, in boys and girls, and in children with different educational levels. Therefore testing for measurement invariance is necessary. Sensitivity to change – for example, after an intervention – has also still to be tested. Further analysis at item level is required to explore which items are most predictive of disorder, which will guide the future development of scales with improved psychometric properties. The utility of two-step approaches to screening, using measures of both symptoms and functional impairment, has also to be undertaken. Improved cut-offs that balance the number of false positives and false negatives, and therefore guide more accurate prevalence estimates in this population, will be also explored. Finally, it should be noted that while questionnaire measures have a place in providing quick ways to screen for the presence of mental disorders or level of symptoms and impairment, they do not replace in-depth clinical assessment by trained mental health professionals; the latter is required for confirmation of diagnosis in clinical practice and to provide robust prevalence estimates in epidemiological research.
Acknowledgements Data collection for the VaST study was funded by an award from TIES/NYU as part of the 3EA | MENAT Measurement Initiative (Subaward: S4323-04). The BIOPATH study was funded by the Eunice Shriver National Institute of Child Health & Human Development (NICHD; R01HD083387). The t-CETA study was funded by Elrha as part of the Research for Health in Humanitarian Crises (R2HC) scheme. NICHD and Elrha played no role in study design, in the collection, analysis or interpretation of data, or in the writing of the report.
We warmly thank all participating families for their participation. Fieldwork was conducted with Médecins du Monde France (MdM) in Lebanon. We thank Patricia Moghames, Nicolas Chehade, Stephanie Legoff, Nicolas Puvis, and Zeina Hassan, and all other members of the VaST, BIOPATH, and t-CETA teams for their dedication, hard work and insights.
3EA Consortium QMUL–IDRAAC–MDM Final Report, v1.5 19th February 2020
Page 27 of 28
References 1. Faulstich, M.E., et al., Assessment of depression in childhood and adolescence: an evaluation of the Center
for Epidemiological Studies Depression Scale for Children (CES-DC). Am J Psychiatry, 1986. 143(8): p. 1024-7.
2. Fendrich, M., M.M. Weissman, and V. Warner, Screening for depressive disorder in children and adolescents: validating the Center for Epidemiologic Studies Depression Scale for Children. Am J Epidemiol, 1990. 131(3): p. 538-51.
3. Birmaher, B., et al., The screen for child anxiety related emotional disorders (SCARED): Scale construction and psychometric characteristics. Journal of the American Academy of Child and Adolescent Psychiatry, 1997. 36(4): p. 545-553.
4. Birmaher, B., et al., Psychometric properties of the Screen for Child Anxiety Related Emotional Disorders (SCARED): a replication study. J Am Acad Child Adolesc Psychiatry, 1999. 38(10): p. 1230-6.
5. Hariz, N., et al., Reliability and validity of the Arabic Screen for Child Anxiety Related Emotional Disorders (SCARED) in a clinical sample. Psychiatry Res, 2013. 209(2): p. 222-8.
6. Foa, E.B., et al., The Child PTSD Symptom Scale: A preliminary examination of its psychometric properties. Journal of clinical child psychology, 2001. 30(3): p. 376-384.
7. Goodman, R., The Strengths and Difficulties Questionnaire: A research note. Journal of Child Psychology and Psychiatry, 1997. 38: p. 581-586.
8. Alyahri, A. and R. Goodman, Validation of the Arabic Strengths and Difficulties Questionnaire and the Development and Well-Being Assessment. East Mediterr Health J, 2006. 12 Suppl 2: p. S138-46.
9. Sheehan, D.V., et al., Reliability and validity of the Mini International Neuropsychiatric Interview for Children and Adolescents (MINI-KID). J Clin Psychiatry, 2010. 71(3): p. 313-26.
10. Scorza, P., et al., Validation of the "World Health Organization Disability Assessment Schedule for children, WHODAS-Child" in Rwanda. PLoS One, 2013. 8(3): p. e57725.
11. Goodman, R., The extended version of the Strengths and Difficulties Questionnaire as a guide to child psychiatric caseness and consequent burden. J Child Psychol Psychiatry, 1999. 40(5): p. 791-9.
12. Busner, J. and S.D. Targum, The clinical global impressions scale: applying a research tool in clinical practice. Psychiatry (Edgmont), 2007. 4(7): p. 28-37.
13. Ghubash, R., et al., The performance of the Center for Epidemiologic Study Depression Scale (CES-D) in an Arab female community. Int J Soc Psychiatry, 2000. 46(4): p. 241-9.
14. Essau, C.A., et al., Depressive symptoms among children and adolescents in Iran: a confirmatory factor analytic study of the centre for epidemiological studies depression scale for children. Child Psychiatry Hum Dev, 2013. 44(1): p. 123-36.
15. Betancourt, T., et al., Validating the Center for Epidemiological Studies Depression Scale for Children in Rwanda. J Am Acad Child Adolesc Psychiatry, 2012. 51(12): p. 1284-92.
16. Salah, E.M., et al., Screening for depressive symptoms and their associated risk factors in adolescent students in South Sinai, Egypt. Life Science Journal, 2013. 10(3): p. 433-443.
17. Kadak, M.T., et al., Psychometric properties of the Turkish version of the child PTSD symptom scale. Compr Psychiatry, 2014. 55(6): p. 1435-41.
18. Rachamim, L., et al., Validation of the Child Posttraumatic Symptom Scale in a sample of treatment-seeking Israeli youth. J Trauma Stress, 2011. 24(3): p. 356-60.
19. Kohrt, B.A., et al., Validation of cross-cultural child mental health and psychosocial research instruments: adapting the Depression Self-Rating Scale and Child PTSD Symptom Scale in Nepal. BMC Psychiatry, 2011. 11(1): p. 127.
20. Emam, M.M., et al., Psychometric properties of the Arabic self-report version of the strengths and difficulties questionnaire. Res Dev Disabil, 2016. 59: p. 211-220.
21. Tubbs Dolan, C., The strengths and difficulties of the Strengths and Difficulties Questionnaire: Cross-national measurement of children’s social-emotional well-being in crisis-affected contexts. 2017, New York University: New York.
3EA Consortium QMUL–IDRAAC–MDM Final Report, v1.5 19th February 2020
Page 28 of 28
22. Goodman, A., D.L. Lamping, and G.B. Ploubidis, When to use broader internalising and externalising subscales instead of the hypothesised five subscales on the Strengths and Difficulties Questionnaire (SDQ): data from British parents, teachers and children. J Abnorm Child Psychol, 2010. 38(8): p. 1179-91.
23. Betancourt, T.S., et al., Family-based promotion of mental health in children affected by HIV: a pilot randomized controlled trial. J Child Psychol Psychiatry, 2017. 58(8): p. 922-930.
24. Sheehan, D.V., et al., The Mini-International Neuropsychiatric Interview (M.I.N.I.): the development and validation of a structured diagnostic psychiatric interview for DSM-IV and ICD-10. J Clin Psychiatry, 1998. 59 Suppl 20: p. 22-33;quiz 34-57.
25. Kyrillos, V., et al., Assessing the mental health of Syrian refugee children and adolescents in Lebanon: Observations from the field
26. Mandrekar, J.N., Receiver operating characteristic curve in diagnostic test assessment. J Thorac Oncol, 2010. 5(9): p. 1315-6.
27. Mandrekar, J.N., Simple statistical measures for diagnostic accuracy assessment. J Thorac Oncol, 2010. 5(6): p. 763-4.
28. HealthNewsReview.org. Understanding medical tests: sensitivity, specificity, and positive predictive value. 2018 [cited 2020 16th January]; Available from: https://www.healthnewsreview.org/toolkit/tips-for-understanding-studies/understanding-medical-tests-sensitivity-specificity-and-positive-predictive-value/.
29. Campbell, D.T. and D.W. Fiske, Convergent and discriminant validation by the multitrait-multimethod matrix. Psychol Bull, 1959. 56(2): p. 81-105.
30. Thabet, A.A., D. Stretch, and P. Vostanis, Child mental health problems in Arab children: application of the strengths and difficulties questionnaire. Int J Soc Psychiatry, 2000. 46(4): p. 266-80.
31. El-Keshky, M. and M. Emam, Emotional and behavioural difficulties in children referred for learning disabilities from two Arab countries: A cross-cultural examination of the Strengths and Difficulties Questionnaire. Res Dev Disabil, 2015. 36C: p. 459-469.
32. Kim, H.Y. and C. Tubbs Dolan, SERAIS: Social Emotional Response and Information Scenarios Evidence on Construct Validity, Measurement Invariance, and Reliability in use with Syrian Refugee Children in Lebanon. 2019, New York University: New York.
33. Weissman, M.M., H. Orvaschel, and N. Padian, Children's symptom and social functioning self-report scales. Comparison of mothers' and children's reports. J Nerv Ment Dis, 1980. 168(12): p. 736-40.
34. Leeflang, M.M., P.M. Bossuyt, and L. Irwig, Diagnostic test accuracy may vary with prevalence: implications for evidence-based diagnosis. J Clin Epidemiol, 2009. 62(1): p. 5-12.
35. Leeflang, M.M., et al., Variation of a test's sensitivity and specificity with disease prevalence. CMAJ, 2013. 185(11): p. E537-44.