Testing and validating IRI-2016 model over Ethiopian ...
13
Astrophys Space Sci (2020) 365:49 https://doi.org/10.1007/s10509-020-03761-1 ORIGINAL ARTICLE Testing and validating IRI-2016 model over Ethiopian ionosphere Lake Endeshaw 1 Received: 16 March 2019 / Accepted: 4 March 2020 / Published online: 12 March 2020 © The Author(s) 2020 Abstract This paper focuses on the validation of the lat- est version of the International Reference Ionosphere (IRI- 2016) model in predicting the vertical total electron content (VTEC) variation over Ethiopian ionospheric region dur- ing a high solar activity (2012-2016) phase. The diurnal, monthly and seasonal VTEC variations were analyzed from dual-frequency global positioning system (GPS) and IRI- 2016 model at the Debark station. The diurnal, monthly and seasonal maximum TEC values measured between around 9:00 and 18:00 UT (12:00 and 21:00 LT) hours and the mini- mum TEC values measured before 9:00 (12:00 LT) and after 18:00 UT (21:00 LT). The overall results show that IRI-2016 model generally overestimates the diurnal, monthly and sea- sonal mean VTEC values during the high solar activity (2012-2016) phase. The model prediction generally follows that the monthly and seasonal variations of the measured VTEC values in equinoctial months are higher than sol- stice months. The monthly mean and seasonal mean values of IRI-TEC and GPS-TEC mostly correlates before early morning and after evening hours and also slightly IRI-TEC underestimates starting from morning hours up to evening hours. The magnetic storm effects on GPS-TEC are asso- ciated with fluctuations. However, the IRI-TEC values show smooth pattern during both in storm on and off options. Con- sequently, the IRI-2016 model does not correctly respond to the effects of the resulting storm disturbance. Keywords GPS-VTEC · IRI-2016 VTEC · VTEC B L. Endeshaw [email protected] 1 Department of Physics, Worabe University, Worabe, Ethiopia 1 Introduction The large natural blanket of plasma in the atmosphere, which envelopes the Earth from an altitude of approximately 50 km to several thousands of kilometers is called the iono- sphere. The existence of the ionosphere was clearly estab- lished in 1901 when G. Marconi successfully transmitted radio signals across the Atlantic (Ratcliffe 1967). The free electrons and ions are produced via ionization of the neu- tral particles both by extreme ultraviolet radiation from the Sun and by collisions with energetic particles that penetrate the atmosphere (Newell 1980). The ionized particles in the ionosphere are produced during the daytime through absorp- tion of solar extreme ultraviolet and x-ray radiation by the atmospheric species. As the ionizing radiation from the sun penetrates deeper and deeper into the Earth’s atmosphere, it encounters a larger and larger density of gas particles, pro- ducing more and more electrons per unit volume (Bitten- court 2004). The recombination of free electrons with posi- tive ions is a reversion of the photoionization and the recom- bination process is the main driver to produce neutral atoms (Limberger et al. 2015). Diurnal ionospheric variation is the change in iono- spheric electron concentration from day to night brought about by the daily rotation of the Earth (Liu and Chen 2009). During the day when the Sun is directly overhead, the inten- sity of sunlight reaching the upper atmosphere is greatest and the level of ionization is maximized. At night side of the Earth, the amount of sunlight reaching the atmosphere is zero and production due to photoionization is reduced to the lowest level. The diurnal variation of the ionosphere is generally controlled by the photoionization, recombination and transport processes (Wernik et al. 2004). Ionospheric seasonal variation is related to a solar zenith angle change, while its solar cycle variation is related to a change in the so- lar EUV and X-ray radiation fluxes. Solar cycle is associated
-
Upload
khangminh22 -
Category
Documents
-
view
0 -
download
0
Transcript of Testing and validating IRI-2016 model over Ethiopian ...
Astrophys Space Sci (2020) 365:49https://doi.org/10.1007/s10509-020-03761-1
ORIGINAL ARTICLE
Testing and validating IRI-2016 model over Ethiopian ionosphere
Lake Endeshaw1
Received: 16 March 2019 / Accepted: 4 March 2020 / Published online: 12 March 2020© The Author(s) 2020
Abstract This paper focuses on the validation of the lat-est version of the International Reference Ionosphere (IRI-2016) model in predicting the vertical total electron content(VTEC) variation over Ethiopian ionospheric region dur-ing a high solar activity (2012-2016) phase. The diurnal,monthly and seasonal VTEC variations were analyzed fromdual-frequency global positioning system (GPS) and IRI-2016 model at the Debark station. The diurnal, monthly andseasonal maximum TEC values measured between around9:00 and 18:00 UT (12:00 and 21:00 LT) hours and the mini-mum TEC values measured before 9:00 (12:00 LT) and after18:00 UT (21:00 LT). The overall results show that IRI-2016model generally overestimates the diurnal, monthly and sea-sonal mean VTEC values during the high solar activity(2012-2016) phase. The model prediction generally followsthat the monthly and seasonal variations of the measuredVTEC values in equinoctial months are higher than sol-stice months. The monthly mean and seasonal mean valuesof IRI-TEC and GPS-TEC mostly correlates before earlymorning and after evening hours and also slightly IRI-TECunderestimates starting from morning hours up to eveninghours. The magnetic storm effects on GPS-TEC are asso-ciated with fluctuations. However, the IRI-TEC values showsmooth pattern during both in storm on and off options. Con-sequently, the IRI-2016 model does not correctly respond tothe effects of the resulting storm disturbance.
Keywords GPS-VTEC · IRI-2016 VTEC · VTEC
B L. [email protected]
1 Department of Physics, Worabe University, Worabe, Ethiopia
1 Introduction
The large natural blanket of plasma in the atmosphere,which envelopes the Earth from an altitude of approximately50 km to several thousands of kilometers is called the iono-sphere. The existence of the ionosphere was clearly estab-lished in 1901 when G. Marconi successfully transmittedradio signals across the Atlantic (Ratcliffe 1967). The freeelectrons and ions are produced via ionization of the neu-tral particles both by extreme ultraviolet radiation from theSun and by collisions with energetic particles that penetratethe atmosphere (Newell 1980). The ionized particles in theionosphere are produced during the daytime through absorp-tion of solar extreme ultraviolet and x-ray radiation by theatmospheric species. As the ionizing radiation from the sunpenetrates deeper and deeper into the Earth’s atmosphere, itencounters a larger and larger density of gas particles, pro-ducing more and more electrons per unit volume (Bitten-court 2004). The recombination of free electrons with posi-tive ions is a reversion of the photoionization and the recom-bination process is the main driver to produce neutral atoms(Limberger et al. 2015).
Diurnal ionospheric variation is the change in iono-spheric electron concentration from day to night broughtabout by the daily rotation of the Earth (Liu and Chen 2009).During the day when the Sun is directly overhead, the inten-sity of sunlight reaching the upper atmosphere is greatestand the level of ionization is maximized. At night side ofthe Earth, the amount of sunlight reaching the atmosphereis zero and production due to photoionization is reduced tothe lowest level. The diurnal variation of the ionosphere isgenerally controlled by the photoionization, recombinationand transport processes (Wernik et al. 2004). Ionosphericseasonal variation is related to a solar zenith angle change,while its solar cycle variation is related to a change in the so-lar EUV and X-ray radiation fluxes. Solar cycle is associated
49 Page 2 of 13 L. Endeshaw
with the Sun spot numbers and Sun spot is the coldest partof sun. The Sun’s output of energy is not constant in timebut changes over a period of 11 years cycle, which is mea-sured in terms of the number of sunspot visible on the disk(Hunsucker and Hargreaves 2002). Variations linked to solaractivity are associated with solar EUV radiation and X-rayflux, and geomagnetic activity are associated with the solarwind-magnetosphere ionosphere coupling (Athieno 2017).
Geomagnetic storms and associated ionospheric stormsoccur when charged particles with high energy in the solarwind, arrive to the Earth causing interferences in the terres-trial magnetic field. The charged particles interacting withthe atmosphere excite ions and produce additional electrons.The equatorial regions like Ethiopia can be characterizedwith combined effect of high radiation level from the sunand the electric and the magnetic fields of the Earth results inthe electrons rising. And moving along the horizontal linesof the magnetic field and makes a particle to transport andpenetration of high-latitude electric field to lower latitudewhich travel equator ward with high velocities during thestorm.
At present most models are able to reproduce consistentlythe climate of the ionosphere over a given location or re-gion, as defined mostly by diurnal, seasonal and solar cy-cle variations (Abdus Salam Intern 2009). In the late 1970’sthe first International Reference Ionosphere model (IRI) wasreleased with Rawer as its first Chairperson (Rawer et al.1978). The IRI Working Group of International Ionosphericexperts are developing the model as new data become avail-able and order data sources are fully evaluated and exploited,the model should be revised in accordance with these newresults. Many researchers have made different studies onIRI-TEC and GPS-TEC over different regions of the worldand the IRI model has been steadily improved as IRI-78(Rawer et al. 1978), IRI-85 (Bilitza 1986), IRI-1990 (Bil-itza 1990), IRI-2000 (Bilitza 2001), IRI-2007 (Bilitza andReinisch 2008), IRI-2012 (Bilitza et al. 2014) and the latestis IRI-2016 (Bilitza et al. 2017).
Ezquer et al. (1998) has shown that the IRI-95 modelTEC generally overestimates the observed TEC during thedaily minimum and underestimates it in the remaining hoursof the day. The IRI-2000 model overestimates the measure-ment in low-latitude (Bhuyan and Borah 2007). The IRI-2001 has the discrepancies between the experimental andmodel TEC values during high solar activity years (Mukher-jee et al. 2010). The studies have been made to evaluate theperformance of the IRI model in the East African regionsduring low solar activity yeas (2009-2011) over Kenya re-gions (Olwendo et al. 2012a) have studied that seasonal av-erage of ETC estimated from the IRI-2007 model are signif-icantly higher than GPS measurements, which is in agree-ment to this study. Additionally, for solar activity phase2009-2010 (Olwendo et al. 2012b) also studied the IRI-2007
model overestimates for all the seasons only except duringthe March equinox. Tariku (2015) studied the discrepancyin the IRI-2012 model performance using IRI-NeQ topsideoption over equatorial regions of Ethiopia during low solaractivity year 2009 and high solar activity year 2012. His re-sults showed that the diurnal VTEC prediction performanceof the model is generally better during the solar minimumphase 2009 than during solar maximum phase 2012 which isin agreement to this study (Tariku et al. 2014). Kumar (2016)studied IRI-2012 model with respect to ground based GPSmeasurements during ascending phase of solar activity in2009 to 2013 from low to mid-latitudes and they found thatlow-latitude regions higher than mid-latitude discrepanciesduring all the seasons (Kumar et al. 2015).
In this paper, I have studied the variations of the GPS-TEC and IRI-2016 model during high solar activity phasefrom 2012 to 2016. Hence, this is perhaps the first workto extensively assess the VTEC variation and examine thecapacity of the latest version (IRI-2016) model in predict-ing the VTEC during high solar activity phase. As a result,in this study a very high (2012-2016) solar activity phaseconsidered to see the diurnal, monthly and seasonal VTECvariations and capability of IRI-2016 model over Ethiopianregions.
2 Methods
The observation data from GPS-TEC and IRI-TEC datawere collected from March 2012 to December 2016 fromEthiopia at Debark station (geographic 13.15◦ N,37.89◦ E;geomagnetic 9.52◦ N,112.84◦ E). The description of thesetwo data sets is discussed in the following Sects. 2.1 and 2.2.
2.1 TEC from the International ReferenceIonosphere (IRI-2016) model
The IRI is an international project sponsored by the Com-mittee on Space Research (COSPAR) and the InternationalUnion of Radio Science (URSI). The TEC from IRI-2016model can be calculated according to IRI 2016 home page.1
In this work the year is chosen from 2012 to 2016 and theirmonths and days of each year are imported. Local time inEthiopia is 3 hours a head of Universal Time (i.e., LT = UT+ 3 hours).
2.2 TEC from dual-frequency GPS receiver
The ionospheric parameter that has an over bearing influ-ence on the GPS based communication and navigation sys-tems is the total electron content (TEC) (Akala et al. 2013).
1http://www.omni-web.gsfc.nasa.gov/vitmo/iri_vitmo.html.
Testing and validating IRI-2016 model over Ethiopian ionosphere Page 3 of 13 49
The GPS measurements are used to estimate the TEC alonga ray path between a GPS satellite and receiver on theground. These GPS measurements are recorded by dual-frequency GPS receivers as they are better to eliminate iono-spheric errors in the estimation of TEC. GPS have dual fre-quencies f1 and f2, which are derived from the fundamentalfrequency fo (Gao and Liu 2002). A dual-frequency GPSreceiver can measure the difference in ionospheric delaysbetween the L1 and L2 of the GPS frequencies, which aregenerally assumed to travel along the same path through theionosphere. GPS observables are either code pseudo ranges(P) or carrier phase (�) measurements (Klobuchar et al.1996).
fo = 10.23 MHz (1)
f1 = 154fo = 1575.42 MHz (2)
f2 = 120fo = 1227.60 MHz (3)
Thus, the group delay can be obtained as:
P1 − P2 = 40.3 TEC
{1
f 22
− 1
f 21
}(4)
TECP = 1
40.3
f 21 f 2
2
f 21 − f 2
2
{(P2 − P1)} (5)
where, p1 and p2 are the group path lengths correspondingto the frequency of the high GPS (f1 = 1575.42 MHz) andthe frequency of the low GPS (f2 = 1227.61 MHz) respec-tively.
Conversely, the TEC from carrier phase measurementscan be expressed as:
TEC� = 1
40.3
f 21 f 2
2
f 21 − f 2
2
{(ϕ1 − ϕ2)} (6)
where, (ϕ1 − ϕ2) is the phase measurements and they areobtained from the fundamental frequency (Klobuchar et al.1996; Ciraolo et al. 2007).
TEC can also be calculated by integrating with locationdependent ds electron density ne(s). The TEC is the amountof free electrons along the path of the electromagnetic wavebetween each satellite and the receiver, given by
TEC =∫ satellite
receiverne (s)ds (7)
The GPS-TEC data utilized for this work are inferred fromthe dual-frequency GPS installed at Ethiopia in Debark sta-tion (Geographic latitude 13.2◦ N and longitude 37.9◦ E;Geomagnetic latitude 9.52◦ N and longitude 112.48◦ E). Myimplementation in averaging the GPS-TEC and IRI-TEC instudying the diurnal, monthly and seasonal climatology is15-minute resolution. All data scripts were written for this
work to import, process and plot for GPS and model outputby Matrix Lab software (MATLAB) version 2016b.
3 Results
3.1 Diurnal variation of VTEC and validation ofIRI-2016 model
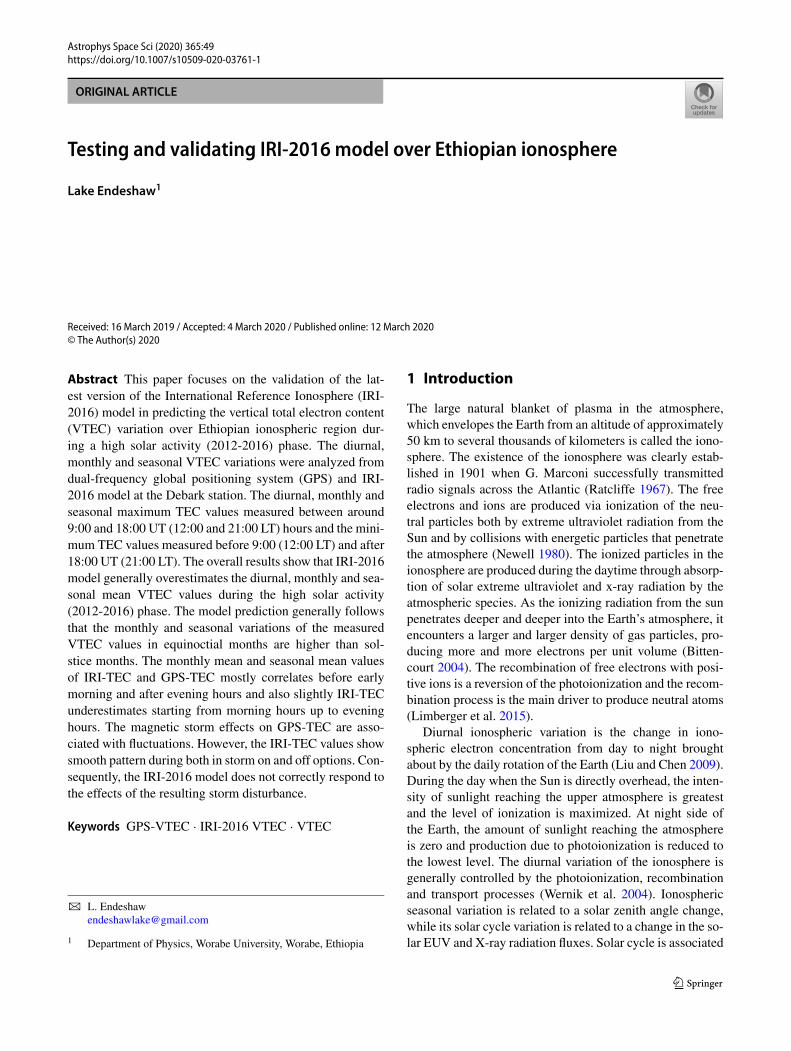
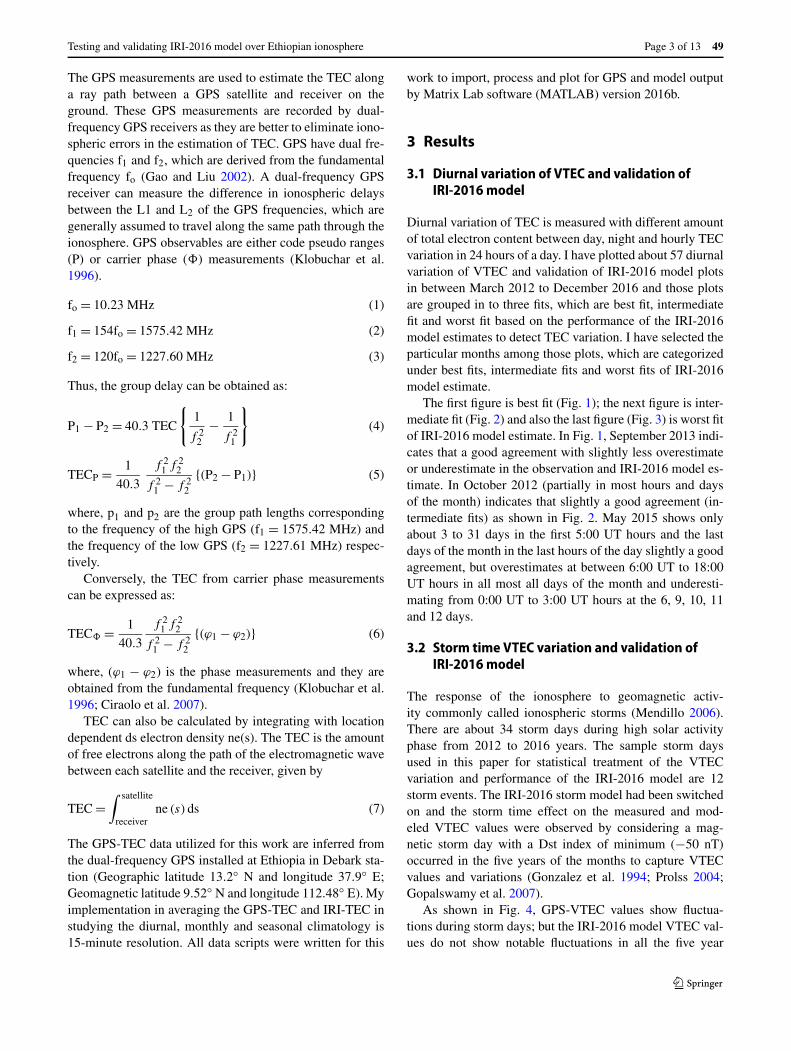
Diurnal variation of TEC is measured with different amountof total electron content between day, night and hourly TECvariation in 24 hours of a day. I have plotted about 57 diurnalvariation of VTEC and validation of IRI-2016 model plotsin between March 2012 to December 2016 and those plotsare grouped in to three fits, which are best fit, intermediatefit and worst fit based on the performance of the IRI-2016model estimates to detect TEC variation. I have selected theparticular months among those plots, which are categorizedunder best fits, intermediate fits and worst fits of IRI-2016model estimate.
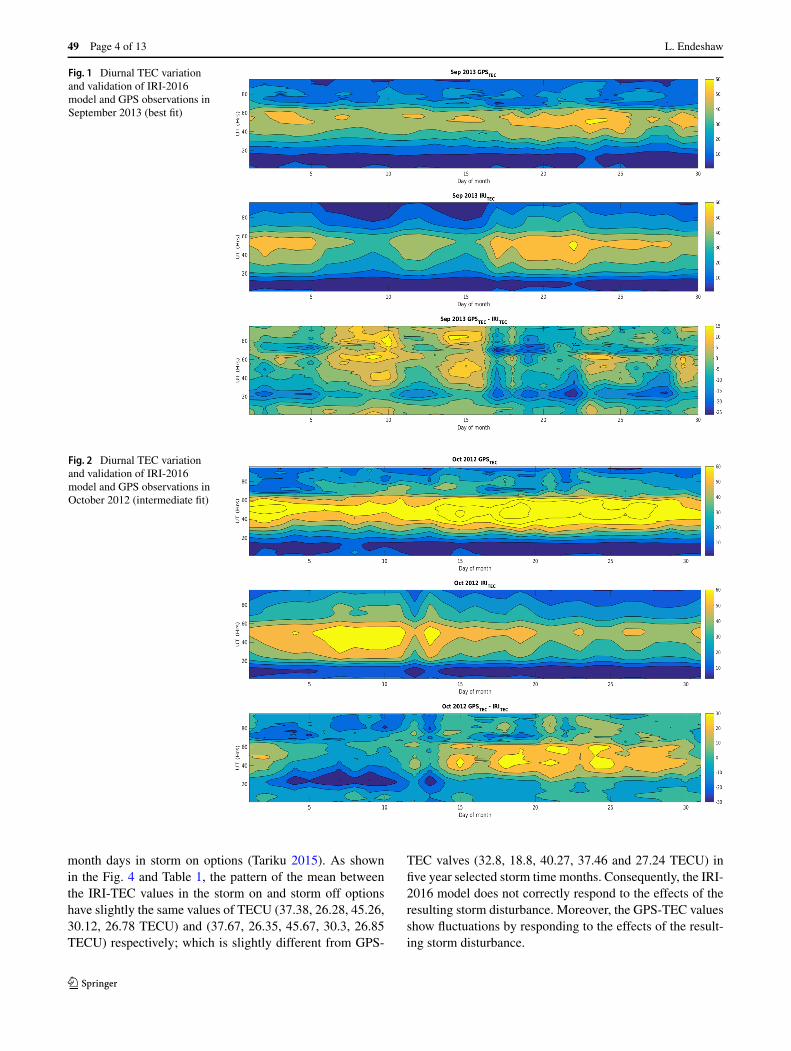
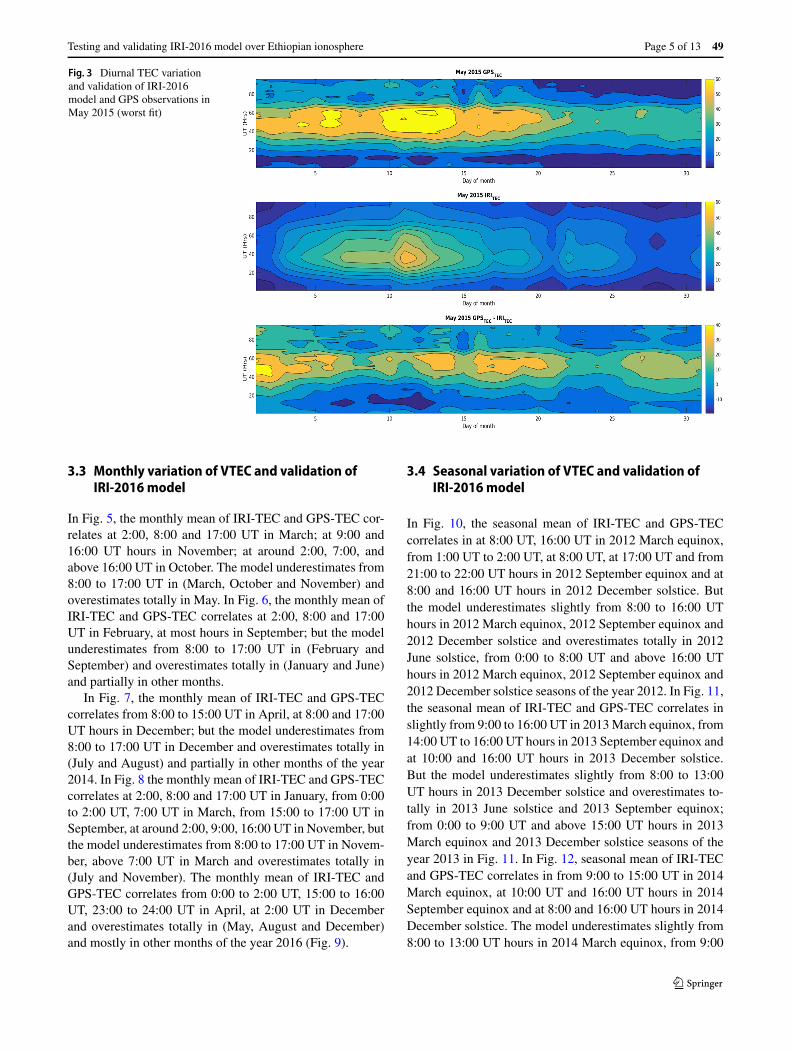
The first figure is best fit (Fig. 1); the next figure is inter-mediate fit (Fig. 2) and also the last figure (Fig. 3) is worst fitof IRI-2016 model estimate. In Fig. 1, September 2013 indi-cates that a good agreement with slightly less overestimateor underestimate in the observation and IRI-2016 model es-timate. In October 2012 (partially in most hours and daysof the month) indicates that slightly a good agreement (in-termediate fits) as shown in Fig. 2. May 2015 shows onlyabout 3 to 31 days in the first 5:00 UT hours and the lastdays of the month in the last hours of the day slightly a goodagreement, but overestimates at between 6:00 UT to 18:00UT hours in all most all days of the month and underesti-mating from 0:00 UT to 3:00 UT hours at the 6, 9, 10, 11and 12 days.
3.2 Storm time VTEC variation and validation ofIRI-2016 model
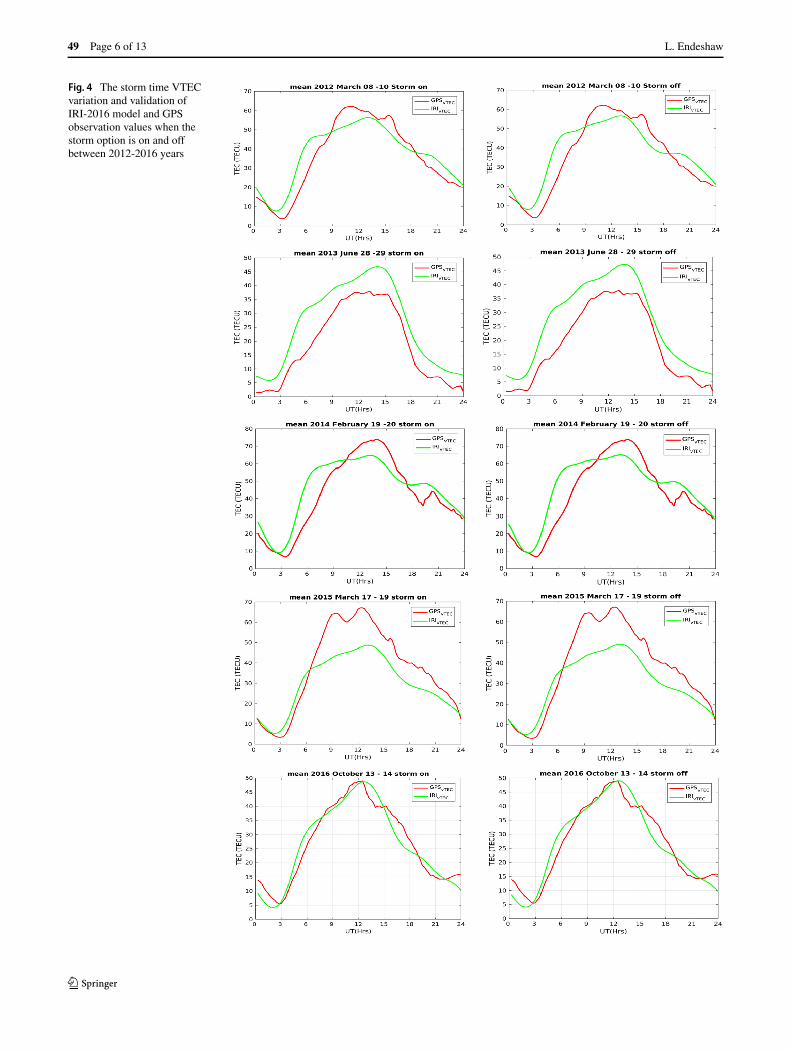
The response of the ionosphere to geomagnetic activ-ity commonly called ionospheric storms (Mendillo 2006).There are about 34 storm days during high solar activityphase from 2012 to 2016 years. The sample storm daysused in this paper for statistical treatment of the VTECvariation and performance of the IRI-2016 model are 12storm events. The IRI-2016 storm model had been switchedon and the storm time effect on the measured and mod-eled VTEC values were observed by considering a mag-netic storm day with a Dst index of minimum (−50 nT)occurred in the five years of the months to capture VTECvalues and variations (Gonzalez et al. 1994; Prolss 2004;Gopalswamy et al. 2007).
As shown in Fig. 4, GPS-VTEC values show fluctua-tions during storm days; but the IRI-2016 model VTEC val-ues do not show notable fluctuations in all the five year
49 Page 4 of 13 L. Endeshaw
Fig. 1 Diurnal TEC variationand validation of IRI-2016model and GPS observations inSeptember 2013 (best fit)
Fig. 2 Diurnal TEC variationand validation of IRI-2016model and GPS observations inOctober 2012 (intermediate fit)
month days in storm on options (Tariku 2015). As shownin the Fig. 4 and Table 1, the pattern of the mean betweenthe IRI-TEC values in the storm on and storm off optionshave slightly the same values of TECU (37.38, 26.28, 45.26,30.12, 26.78 TECU) and (37.67, 26.35, 45.67, 30.3, 26.85TECU) respectively; which is slightly different from GPS-
TEC valves (32.8, 18.8, 40.27, 37.46 and 27.24 TECU) infive year selected storm time months. Consequently, the IRI-2016 model does not correctly respond to the effects of theresulting storm disturbance. Moreover, the GPS-TEC valuesshow fluctuations by responding to the effects of the result-ing storm disturbance.
Testing and validating IRI-2016 model over Ethiopian ionosphere Page 5 of 13 49
Fig. 3 Diurnal TEC variationand validation of IRI-2016model and GPS observations inMay 2015 (worst fit)
3.3 Monthly variation of VTEC and validation ofIRI-2016 model
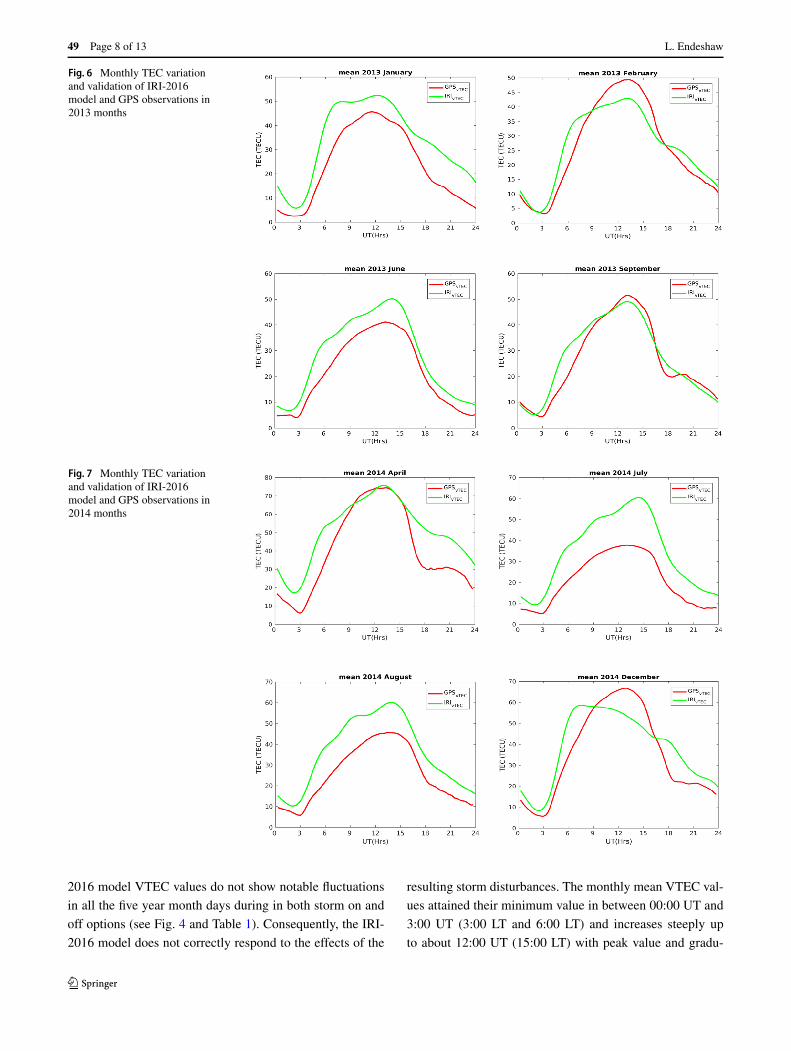
In Fig. 5, the monthly mean of IRI-TEC and GPS-TEC cor-relates at 2:00, 8:00 and 17:00 UT in March; at 9:00 and16:00 UT hours in November; at around 2:00, 7:00, andabove 16:00 UT in October. The model underestimates from8:00 to 17:00 UT in (March, October and November) andoverestimates totally in May. In Fig. 6, the monthly mean ofIRI-TEC and GPS-TEC correlates at 2:00, 8:00 and 17:00UT in February, at most hours in September; but the modelunderestimates from 8:00 to 17:00 UT in (February andSeptember) and overestimates totally in (January and June)and partially in other months.
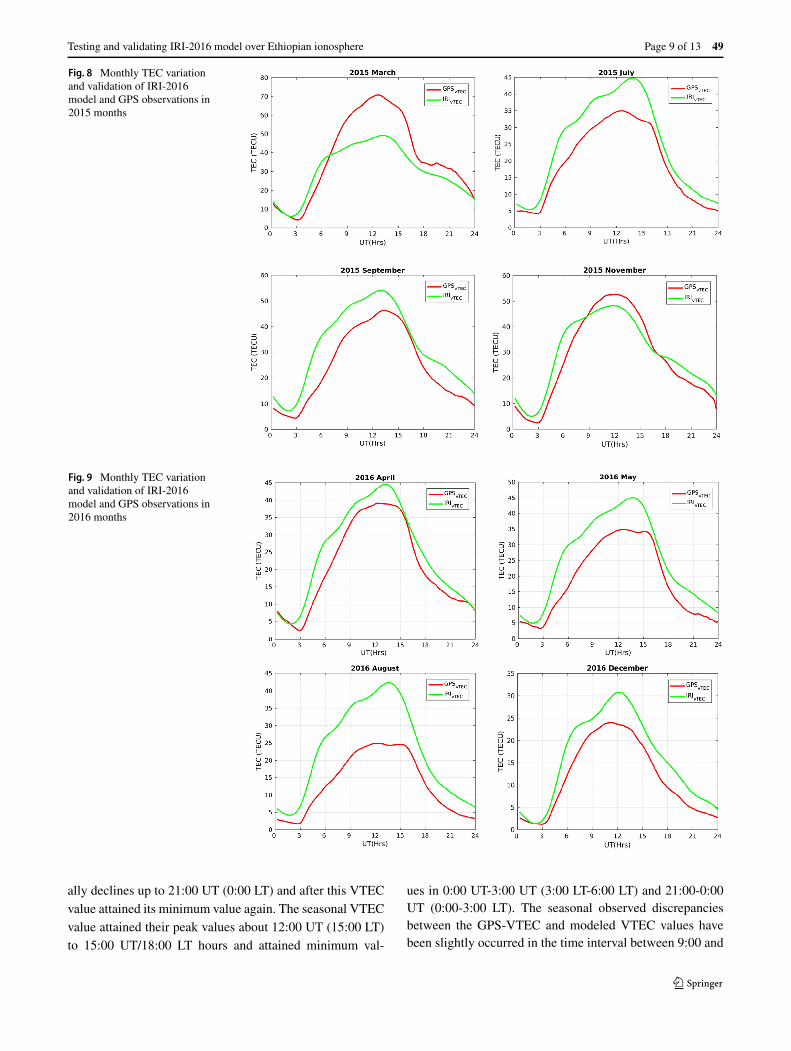
In Fig. 7, the monthly mean of IRI-TEC and GPS-TECcorrelates from 8:00 to 15:00 UT in April, at 8:00 and 17:00UT hours in December; but the model underestimates from8:00 to 17:00 UT in December and overestimates totally in(July and August) and partially in other months of the year2014. In Fig. 8 the monthly mean of IRI-TEC and GPS-TECcorrelates at 2:00, 8:00 and 17:00 UT in January, from 0:00to 2:00 UT, 7:00 UT in March, from 15:00 to 17:00 UT inSeptember, at around 2:00, 9:00, 16:00 UT in November, butthe model underestimates from 8:00 to 17:00 UT in Novem-ber, above 7:00 UT in March and overestimates totally in(July and November). The monthly mean of IRI-TEC andGPS-TEC correlates from 0:00 to 2:00 UT, 15:00 to 16:00UT, 23:00 to 24:00 UT in April, at 2:00 UT in Decemberand overestimates totally in (May, August and December)and mostly in other months of the year 2016 (Fig. 9).
3.4 Seasonal variation of VTEC and validation ofIRI-2016 model
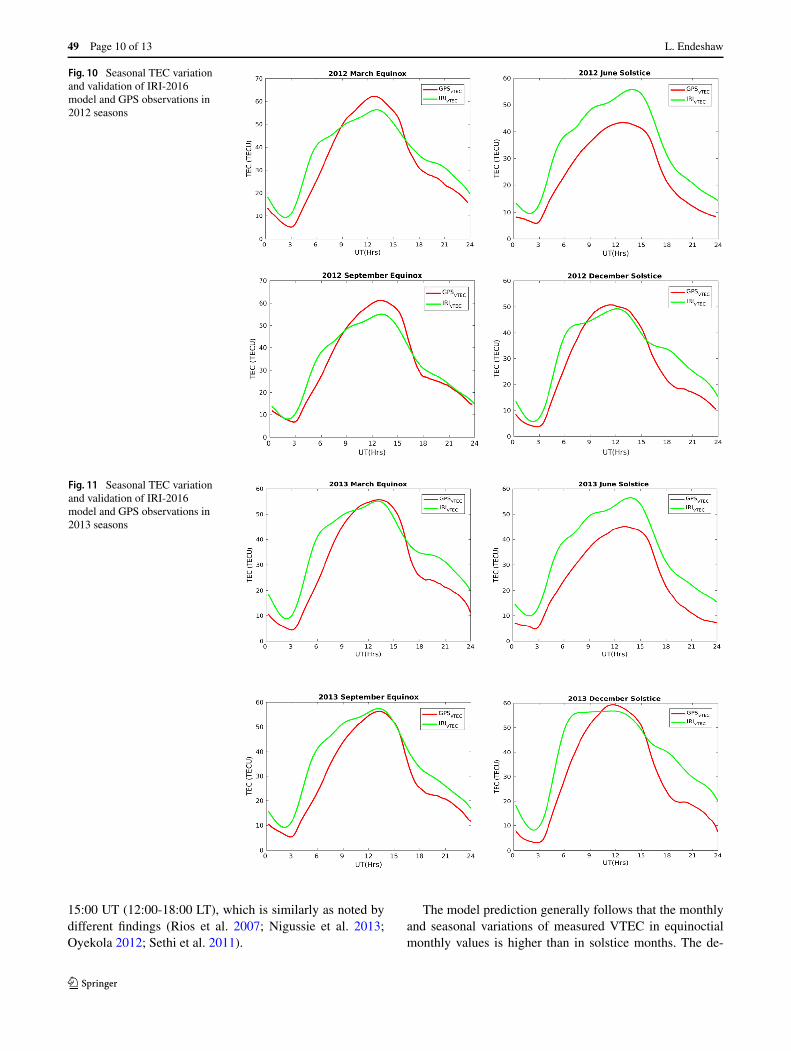
In Fig. 10, the seasonal mean of IRI-TEC and GPS-TECcorrelates in at 8:00 UT, 16:00 UT in 2012 March equinox,from 1:00 UT to 2:00 UT, at 8:00 UT, at 17:00 UT and from21:00 to 22:00 UT hours in 2012 September equinox and at8:00 and 16:00 UT hours in 2012 December solstice. Butthe model underestimates slightly from 8:00 to 16:00 UThours in 2012 March equinox, 2012 September equinox and2012 December solstice and overestimates totally in 2012June solstice, from 0:00 to 8:00 UT and above 16:00 UThours in 2012 March equinox, 2012 September equinox and2012 December solstice seasons of the year 2012. In Fig. 11,the seasonal mean of IRI-TEC and GPS-TEC correlates inslightly from 9:00 to 16:00 UT in 2013 March equinox, from14:00 UT to 16:00 UT hours in 2013 September equinox andat 10:00 and 16:00 UT hours in 2013 December solstice.But the model underestimates slightly from 8:00 to 13:00UT hours in 2013 December solstice and overestimates to-tally in 2013 June solstice and 2013 September equinox;from 0:00 to 9:00 UT and above 15:00 UT hours in 2013March equinox and 2013 December solstice seasons of theyear 2013 in Fig. 11. In Fig. 12, seasonal mean of IRI-TECand GPS-TEC correlates in from 9:00 to 15:00 UT in 2014March equinox, at 10:00 UT and 16:00 UT hours in 2014September equinox and at 8:00 and 16:00 UT hours in 2014December solstice. The model underestimates slightly from8:00 to 13:00 UT hours in 2014 March equinox, from 9:00
49 Page 6 of 13 L. Endeshaw
Fig. 4 The storm time VTECvariation and validation ofIRI-2016 model and GPSobservation values when thestorm option is on and offbetween 2012-2016 years
Testing and validating IRI-2016 model over Ethiopian ionosphere Page 7 of 13 49
Table 1 IRI-2016 Model IRI_TEC value in storm “on” and “off” and storm disturbance GPS_TEC observation values
Year IRI_TEC(TECU) GPS_TEC(TECU)
Selected storm times (2012-2016) Storm on Storm off Min Max Mean
Min Max Mean Min Max Mean
March 08–10 2012 7.67 56.23 37.38 7.933 56.6 37.67 3.554 62.05 32.8
June 28–29 2013 5.8 46.7 26.28 5.8 47.3 26.35 1.519 37.94 18.8
February 19–20 2014 9 64.7 45.26 8.85 65.1 45.69 6.537 74.01 40.27
March 17–19 2015 5.333 48.6 30.12 5.267 48.97 30.32 3.393 67.01 37.46
October 13–14 2016 4.1 48.7 26.78 4.05 49.1 26.85 5.446 49.04 27.24
Fig. 5 Monthly TEC variationand validation of IRI-2016model and GPS observations in2012 months
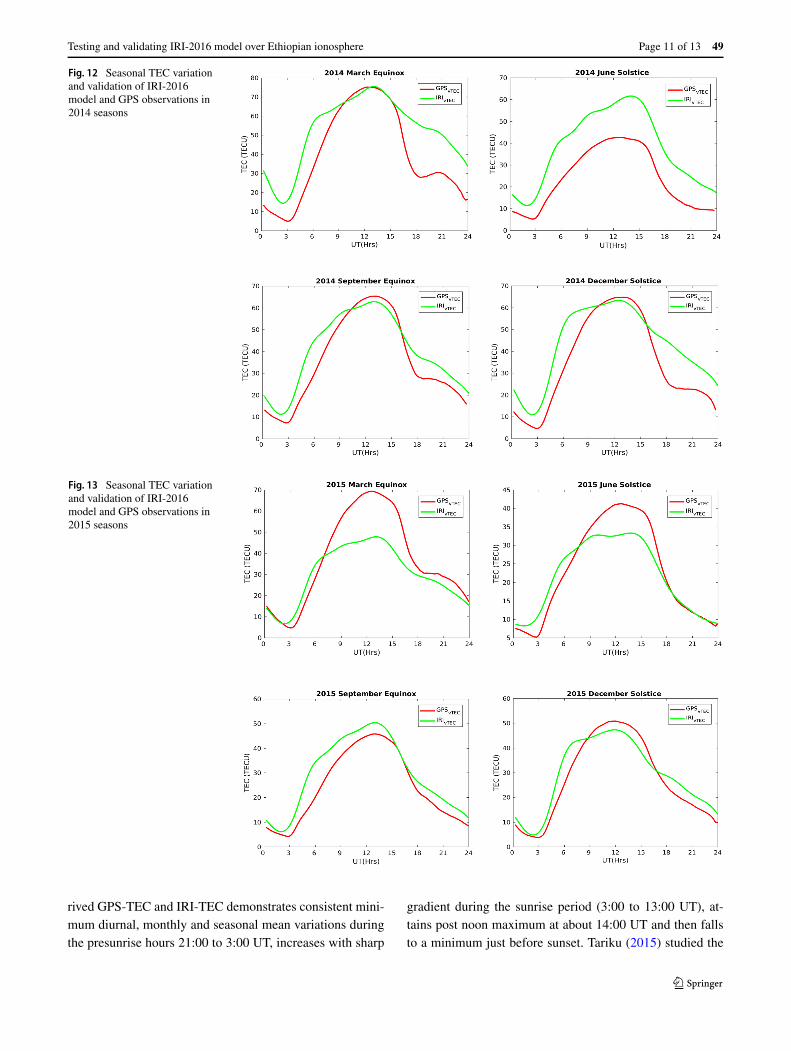
to 16:00 UT hours in 2014 September equinox and 2014December solstice. And the model overestimates totally in2014 June solstice, from 0:00 to 9:00 UT and above 15:00UT hours in 2014 March equinox, 2014 September equinoxand 2014 December solstice seasons.
In Fig. 13, seasonal mean of IRI-TEC and GPS-TEC cor-relates in from 0:00 to 2:00 UT, at 7:00 UT in 2015 Marchequinox, from 16:00 to 17:00 UT hours in 2015 Septem-ber equinox, at 8:00 UT and above 18:00 UT in 2015 Junesolstice and at 2:00, 8:00 and 17:00 UT hours in 2015 De-cember solstice. The model underestimates at above 7:00UT hours in 2015 March equinox, from 8:00 to 18:00 UThours in 2015 June solstice and 2015 December solstice. Inaddition, the model overestimates totally in 2015 Septem-ber equinox, from 2:00 to 7:00 UT hours in 2015 Marchequinox, from 0:00 to 8:00 UT hours in 2015 June solstice
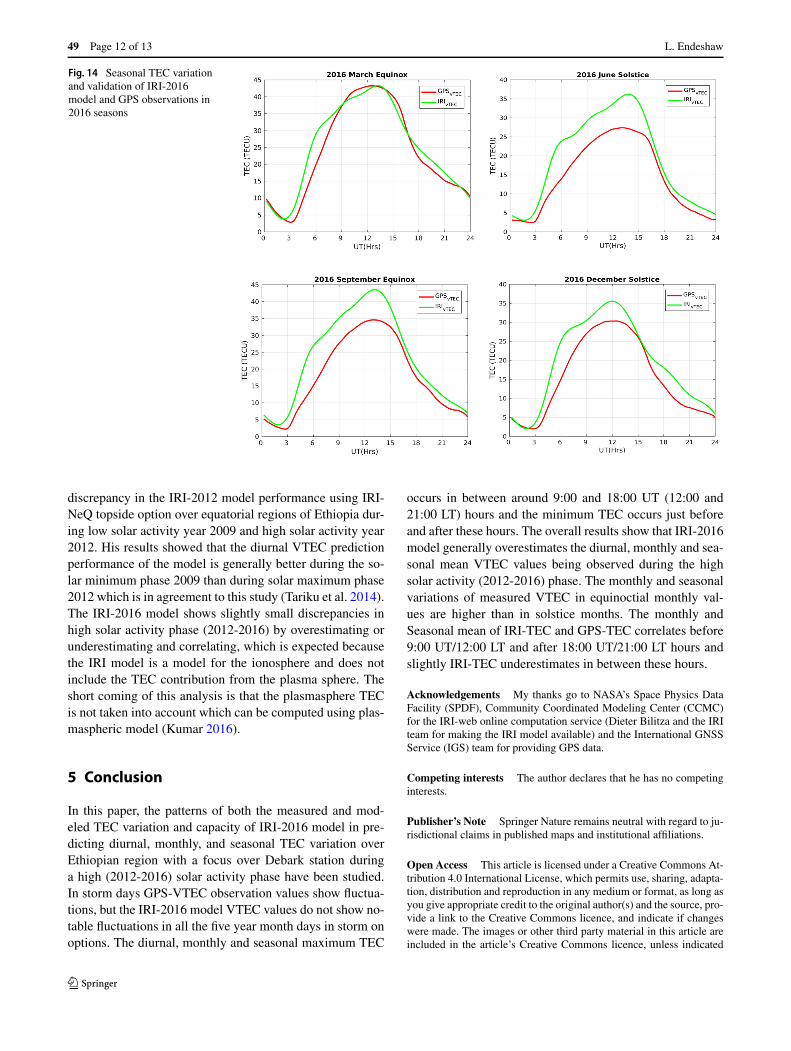
and from 0:00 to 8:00 UT and above 18:00 UT hours in2015 December solstice seasons of the year 2015 in Fig. 13.The seasonal mean hourly modeled VTEC values and themeasured GPS VTEC are mostly correlated in 2016 Marchequinox and for the others in the first 3:00 UT hours andabove the 15:00 UT hours. The seasonal mean hourly mod-eled VTEC values are found to be larger than the corre-sponding measured VTEC values in all seasons during bothin equinox and solstice of the year 2016. In general, themodeled VTEC value overestimates for all the seasons inthe years 2012 to 2016.
4 Discussions
In the magnetic storm days GPS-VTEC observation valuesshow fluctuations (many up and down peaks), but the IRI-
49 Page 8 of 13 L. Endeshaw
Fig. 6 Monthly TEC variationand validation of IRI-2016model and GPS observations in2013 months
Fig. 7 Monthly TEC variationand validation of IRI-2016model and GPS observations in2014 months
2016 model VTEC values do not show notable fluctuations
in all the five year month days during in both storm on and
off options (see Fig. 4 and Table 1). Consequently, the IRI-
2016 model does not correctly respond to the effects of the
resulting storm disturbances. The monthly mean VTEC val-
ues attained their minimum value in between 00:00 UT and
3:00 UT (3:00 LT and 6:00 LT) and increases steeply up
to about 12:00 UT (15:00 LT) with peak value and gradu-
Testing and validating IRI-2016 model over Ethiopian ionosphere Page 9 of 13 49
Fig. 8 Monthly TEC variationand validation of IRI-2016model and GPS observations in2015 months
Fig. 9 Monthly TEC variationand validation of IRI-2016model and GPS observations in2016 months
ally declines up to 21:00 UT (0:00 LT) and after this VTECvalue attained its minimum value again. The seasonal VTECvalue attained their peak values about 12:00 UT (15:00 LT)to 15:00 UT/18:00 LT hours and attained minimum val-
ues in 0:00 UT-3:00 UT (3:00 LT-6:00 LT) and 21:00-0:00UT (0:00-3:00 LT). The seasonal observed discrepanciesbetween the GPS-VTEC and modeled VTEC values havebeen slightly occurred in the time interval between 9:00 and
49 Page 10 of 13 L. Endeshaw
Fig. 10 Seasonal TEC variationand validation of IRI-2016model and GPS observations in2012 seasons
Fig. 11 Seasonal TEC variationand validation of IRI-2016model and GPS observations in2013 seasons
15:00 UT (12:00-18:00 LT), which is similarly as noted bydifferent findings (Rios et al. 2007; Nigussie et al. 2013;Oyekola 2012; Sethi et al. 2011).
The model prediction generally follows that the monthlyand seasonal variations of measured VTEC in equinoctialmonthly values is higher than in solstice months. The de-
Testing and validating IRI-2016 model over Ethiopian ionosphere Page 11 of 13 49
Fig. 12 Seasonal TEC variationand validation of IRI-2016model and GPS observations in2014 seasons
Fig. 13 Seasonal TEC variationand validation of IRI-2016model and GPS observations in2015 seasons
rived GPS-TEC and IRI-TEC demonstrates consistent mini-mum diurnal, monthly and seasonal mean variations duringthe presunrise hours 21:00 to 3:00 UT, increases with sharp
gradient during the sunrise period (3:00 to 13:00 UT), at-tains post noon maximum at about 14:00 UT and then fallsto a minimum just before sunset. Tariku (2015) studied the
49 Page 12 of 13 L. Endeshaw
Fig. 14 Seasonal TEC variationand validation of IRI-2016model and GPS observations in2016 seasons
discrepancy in the IRI-2012 model performance using IRI-NeQ topside option over equatorial regions of Ethiopia dur-ing low solar activity year 2009 and high solar activity year2012. His results showed that the diurnal VTEC predictionperformance of the model is generally better during the so-lar minimum phase 2009 than during solar maximum phase2012 which is in agreement to this study (Tariku et al. 2014).The IRI-2016 model shows slightly small discrepancies inhigh solar activity phase (2012-2016) by overestimating orunderestimating and correlating, which is expected becausethe IRI model is a model for the ionosphere and does notinclude the TEC contribution from the plasma sphere. Theshort coming of this analysis is that the plasmasphere TECis not taken into account which can be computed using plas-maspheric model (Kumar 2016).
5 Conclusion
In this paper, the patterns of both the measured and mod-eled TEC variation and capacity of IRI-2016 model in pre-dicting diurnal, monthly, and seasonal TEC variation overEthiopian region with a focus over Debark station duringa high (2012-2016) solar activity phase have been studied.In storm days GPS-VTEC observation values show fluctua-tions, but the IRI-2016 model VTEC values do not show no-table fluctuations in all the five year month days in storm onoptions. The diurnal, monthly and seasonal maximum TEC
occurs in between around 9:00 and 18:00 UT (12:00 and21:00 LT) hours and the minimum TEC occurs just beforeand after these hours. The overall results show that IRI-2016model generally overestimates the diurnal, monthly and sea-sonal mean VTEC values being observed during the highsolar activity (2012-2016) phase. The monthly and seasonalvariations of measured VTEC in equinoctial monthly val-ues are higher than in solstice months. The monthly andSeasonal mean of IRI-TEC and GPS-TEC correlates before9:00 UT/12:00 LT and after 18:00 UT/21:00 LT hours andslightly IRI-TEC underestimates in between these hours.
Acknowledgements My thanks go to NASA’s Space Physics DataFacility (SPDF), Community Coordinated Modeling Center (CCMC)for the IRI-web online computation service (Dieter Bilitza and the IRIteam for making the IRI model available) and the International GNSSService (IGS) team for providing GPS data.
Competing interests The author declares that he has no competinginterests.
Publisher’s Note Springer Nature remains neutral with regard to ju-risdictional claims in published maps and institutional affiliations.
Open Access This article is licensed under a Creative Commons At-tribution 4.0 International License, which permits use, sharing, adapta-tion, distribution and reproduction in any medium or format, as long asyou give appropriate credit to the original author(s) and the source, pro-vide a link to the Creative Commons licence, and indicate if changeswere made. The images or other third party material in this article areincluded in the article’s Creative Commons licence, unless indicated
Testing and validating IRI-2016 model over Ethiopian ionosphere Page 13 of 13 49
otherwise in a credit line to the material. If material is not includedin the article’s Creative Commons licence and your intended use is notpermitted by statutory regulation or exceeds the permitted use, you willneed to obtain permission directly from the copyright holder. To view acopy of this licence, visit http://creativecommons.org/licenses/by/4.0/.
References
Abdus Salam Intern: Ionospheric Modelling for Theoretical PhysicsAeronomy and Radio Propagation Laboratory, Italy (2009)
Akala, A.O., Rabiu, A.B., Somoye, E.O., Oyeyemi, E.O., Adeloye,A.B.: The response of African equatorial GPS-TEC to intense ge-omagnetic storms during the ascending phase of solar cycle 24.J. Atmos. Sol.-Terr. Phys. 98, 50–62 (2013)
Athieno: Empirical Model in the Characterization of High FrequencyPropagation in the Arctic Region. University of New Brunswick,Fredericton (2017)
Bhuyan, P.K., Borah, R.R.: TEC derived from GPS network in Indiaand comparison with the IRI. Adv. Space Res. 39(5), 830–840(2007)
Bilitza, D.: International reference ionosphere: recent developments.Radio Sci. 21(3), 343–346 (1986)
Bilitza, D.: International reference ionosphere 2000. Radio Sci. 36(2),261–275 (2001)
Bilitza, D.: International reference ionosphere 1990, NSSDC/WDC-A-R S 90-22. National Space Science Data Center, Greenbelt (1990)
Bilitza, D., Reinisch, B.W.: IRI-2007: improvements and new parame-ters. Adv. Space Res. 42(4), 599–609 (2008)
Bilitza, D., Altadill, D., Zhang, Y., Mertens, C., Truhlik, V., Richards,P., McKinnell, L., Bodo Reinisch, B.: The IRI-2012-A model ofinternational collaboration. J. Space Weather Space Clim. 4, A07(2014). https://doi.org/10.1051/swsc/2014004
Bilitza, D., Altadill, D., Truhlik, V., Shubin, V., Galkin, I., Reinisch, B.,Huang, X.: International reference ionosphere 2016: from iono-spheric climate to real-time weather predictions IRI-2016. SpaceWeather (2017). https://doi.org/10.1002/2016SW001593
Bittencourt: Fundamentals of Plasma Physics 1, 3rd edn. Springer,New York (2004)
Ciraolo, L., Azpilicueta, F., Brunini, C., Meza, A., Radicella, S.M.:Calibration errors on experimental slant total electron content(TEC) determined with GPS. J. Geod. 81, 111–120 (2007)
Ezquer, R.G., Jadur, C.A., de Gonzalez, M.M.: IRI-95 TEC predic-tions for the South American peak of the equatorial anomaly. Adv.Space Res. 22(6), 811–814 (1998)
Gao, Y., Liu, Z.: Precise ionospheric modelling using regional GPSnetwork data. J. Glob. Position. Syst. 1(1), 18–24 (2002)
Gonzalez, W., Joselyn, J., Kamide, Y., Kroehl, H., Rostoker, G., Tsu-rutani, B., Vasyliunas, V.: What is to geomagnetic storm? J. Geo-phys. Res. 99, 5771–5792 (1994)
Gopalswamy, N., Yashiro, S., Akiyama, S.: Geoeffectiveness of halocoronal mass ejections. J. Geophys. Res. 112, A06112 (2007).https://doi.org/10.1029/2006JA012149
Hunsucker, R., Hargreaves, J.: The High-Latitude Ionosphere and ItsEffects on Radio Propagation. Cambridge Atmospheric and SpaceScience Series. Cambridge University Press, Cambridge (2002)
Klobuchar, J.A., Parkinson, B.W., Spilker, J.J.: Ionospheric effects onGPS. In: Global Positioning System: Theory and Applications.American Institute of Aeronautics and Astronautics, Washington(1996)
Kumar, S.: Performance of IRI-2012 model during a deep solar mini-mum and a maximum year over global equatorial regions. J. Geo-phys. Res. Space Phys. 121, 5664–5674 (2016). https://doi.org/10.1002/2015JA022269
Kumar, S., Tan, E.L., Murti, D.S.: Impacts of solar activity on perfor-mance of the IRI-2012 model predictions from low to mid lati-tudes. Earth Planets Space 67, 42 (2015). https://doi.org/10.1186/s40623-015-0205-3
Limberger, M., Hernandez-Pajares, M., Aragon-Angel, A., Altadill,D., Dettmering, D.: Long-term comparison of the ionosphericF2 layer electron density peak derived from ionosonde data andFormosat-3/COSMIC occultations. J. Space Weather Space Clim.5, A21 (2015). https://doi.org/10.1051/swsc/2015023
Liu, L., Chen, Y.: Statistical analysis of solar activity variations of totalelectron content derived at Jet Propulsion Laboratory from GPSobservations. J. Geophys. Res. Space Phys. 114, A10311 (2009).https://doi.org/10.1029/2009JA014533
Mendillo, M.: Storms in the ionosphere: patterns and processes fortotal electron content. Rev. Geophys. 44, RG401 (2006). https://doi.org/10.1029/2005RG000193
Mukherjee, S., Sarkar, S., Purohit, P.K., Gwal, A.K.: Seasonal varia-tion of total electron content at crest of equatorial anomaly stationduring low solar activity conditions. Adv. Space Res. 46(3), 291–295 (2010)
Newell, H.E.: Beyond the Atmosphere. NASA SP-4211, Washington,DC (1980)
Nigussie, M., Radicella, S.M., Damtie, B., Nava, B., Yizengaw, E.,Groves, K.: Validation of the Ne-Quick and IRI-2007 models inEast-African equatorial region. J. Atmos. Sol.-Terr. Phys. (2013).https://doi.org/10.1016/j.jastp.2013.04.016
Olwendo, O.J., Baki, P., Mito, C., Doherty, P.: Comparison of GPSTEC variations with IRI-2007 TEC prediction at equatorial lat-itudes during a low solar activity (2009-2011) phase over theKenyan region. Adv. Space Res. 49, 914–921 (2012a). https://doi.org/10.1016/j.asr.2011.12.007
Olwendo, O.J., Baki, P., Mito, C., Doherty, P.: Characterization ofionospheric GPS total electron content (GPS-TEC) in low lati-tude zone over the Kenyan region during a very low solar activityphase. J. Atmos. Sol.-Terr. Phys. 84, 52–61 (2012b). https://doi.org/10.1016/j.jastp.2012.06.003
Oyekola, O.S.: Equatorial vertical plasma drifts and the measured andIRI model-predicted F2-layer parameters above Ouagadougouduring solar minimum. Earth Planets Space 64, 577–593 (2012)
Prolss, G.W.: Physics of the Earth’s Space Environment: An Introduc-tion. Springer, Berlin (2004)
Ratcliffe, J.A.: The ionosphere and the engineer. Proc. Inst. Elec. Eng.114, 1 (1967)
Rawer, K., Bilitza, D., Ramakrishnan, S.: Goals and status of the In-ternational Reference Ionosphere. Rev. Geophys. 16(2), 177–181(1978)
Rios, V.H., Medina, C.F., Alvarez, P.: Comparisons between IRI pre-dictions and digisonde measurements at Tucuman. J. Atmos. Sol.-Terr. Phys. 69, 569–577 (2007)
Sethi, N.K., Dabas, R.S., Sarkar, S.K.: Validation of IRI-2007 againstETC observation during low solar activity over Indian sector.J. Atmos. Terr. Phys. 73, 751–759 (2011)
Tariku, Y.A.: TEC prediction performance of IRI-2012 model during avery low and a high solar activity phase over equatorial regions,Uganda. J. Geophys. Res. Space Phys. 120, 5973–5982 (2015).https://doi.org/10.1002/2015JA021203
Tariku, Y.A., Kassa, T., Nigussie, M.: Validation of IRI-2012 TECmodel over Ethiopia during solar minimum (2009) and solar max-imum (2013). Adv. Space Res. 53, 1582–1594 (2014). https://doi.org/10.1016/j.asr.2014.02.017
Wernik, A.W., Lucilla, A., Materassi, M.: Ionospheric irregularities,scintillation and its effects on systems. Acta Geophys. Pol. 52(2),237–249 (2004)