Seasonal forecasting of Ethiopian spring rains
26
Seasonal Forecasting of Ethiopian Spring rains Gulilat Tefera Diro Supervisors: David Grimes and Emily Black Department of Meteorology University of Reading Africa group 2007 – p. 1/2
Transcript of Seasonal forecasting of Ethiopian spring rains
Seasonal Forecasting of EthiopianSpring rains
Gulilat Tefera DiroSupervisors: David Grimes and Emily Black
Department of Meteorology
University of Reading
Africa group 2007 – p. 1/20

Outline of the talk
Large scale controls
Homogeneous rainfall zones
Predictors
Forecasting Models
Skill Assessment
Conclusions
Africa group 2007 – p. 2/20
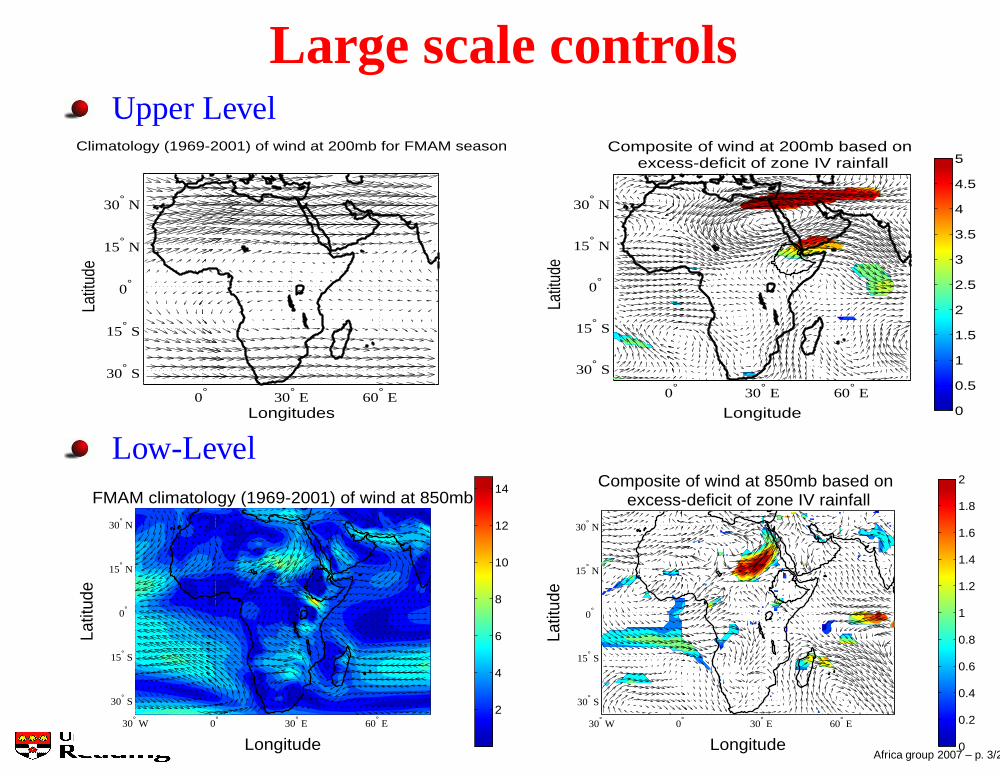
Large scale controlsUpper Level
Longitudes
Latit
ude
Climatology (1969-2001) of wind at 200mb for FMAM season
0° 30° E 60° E
30° S
15° S
0°
15° N
30° N
Longitude
Latit
ude
Composite of wind at 200mb based on excess-deficit of zone IV rainfall
0° 30° E 60° E
30° S
15° S
0°
15° N
30° N
0
0.5
1
1.5
2
2.5
3
3.5
4
4.5
5
Low-Level
Longitude
Latit
ude
FMAM climatology (1969-2001) of wind at 850mb
30° W 0° 30° E 60° E
30° S
15° S
0°
15° N
30° N
2
4
6
8
10
12
14
Longitude
Latit
ude
Composite of wind at 850mb based on excess-deficit of zone IV rainfall
30° W 0° 30° E 60° E
30° S
15° S
0°
15° N
30° N
0
0.2
0.4
0.6
0.8
1
1.2
1.4
1.6
1.8
2
Africa group 2007 – p. 3/20

Identifying homogeneous rainfall zones
Determining and selecting of predictors
Model development
Skill Assessment
Africa group 2007 – p. 4/20

Seasonal Cycle
Feb Apr Jun Aug Oct Dec0
50
100
150
200
250
300
350
Month
Ra
infa
ll(m
m)
Zone I
35 40 45
4
6
8
10
12
14
LongitudeLatitu
de
I
Africa group 2007 – p. 5/20

Seasonal Cycle
Feb Apr Jun Aug Oct Dec0
50
100
150
200
250
300
350
Month
Ra
infa
ll(m
m)
Zone IZone II
35 40 45
4
6
8
10
12
14
LongitudeLatitu
de
I
II
Africa group 2007 – p. 5/20

Seasonal Cycle
Feb Apr Jun Aug Oct Dec0
50
100
150
200
250
300
350
Month
Ra
infa
ll(m
m)
Zone IZone IIZone III
35 40 45
4
6
8
10
12
14
LongitudeLatitu
de
I
IIIII
Africa group 2007 – p. 5/20

Seasonal Cycle
Feb Apr Jun Aug Oct Dec0
50
100
150
200
250
300
350
Month
Ra
infa
ll(m
m)
Zone IZone IIZone IIIZone IV
35 40 45
4
6
8
10
12
14
LongitudeLatitu
de
I
IIIII
IV
Africa group 2007 – p. 5/20

Seasonal Cycle
Feb Apr Jun Aug Oct Dec0
50
100
150
200
250
300
350
Month
Ra
infa
ll(m
m)
Zone IZone IIZone IIIZone IVZone V
35 40 45
4
6
8
10
12
14
LongitudeLatitu
de
I
IIIII
IV
V
Africa group 2007 – p. 5/20

Seasonal Cycle
Feb Apr Jun Aug Oct Dec0
50
100
150
200
250
300
350
Month
Ra
infa
ll(m
m)
Zone IZone IIZone IIIZone IVZone VZone VI
35 40 45
4
6
8
10
12
14
LongitudeLatitu
de
I
IIIII
IV
V
VI
Africa group 2007 – p. 5/20

Inter-annual variability (cross-correlation)
Belg Z I Z II Z III Z IV Z V Z VI
Zone I 0.34 0.30 0.15 0.26 0.17 0.10
Zone II 0.30 0.33 0.23 0.24 0.23 0.09
Zone III 0.15 0.23 0.55 0.47 0.48 0.26
Zone IV 0.26 0.24 0.47 0.53 0.42 0.21
Zone V 0.17 0.23 0.48 0.42 0.43 0.27
Zone VI 0.10 0.09 0.26 0.21 0.27 0.25
35 40 45
4
6
8
10
12
14
Longitude
Latit
ude
I
IIIII
IV
V
VI
Africa group 2007 – p. 6/20

Inter-annual variability (cross-correlation)
Belg Z I Z II Z III Z IV Z V Z VI
Zone I 0.34 0.30 0.15 0.26 0.17 0.10
Zone II 0.30 0.33 0.23 0.24 0.23 0.09
Zone III 0.15 0.23 0.55 0.47 0.48 0.26
Zone IV 0.26 0.24 0.47 0.53 0.42 0.21
Zone V 0.17 0.23 0.48 0.42 0.43 0.27
Zone VI 0.10 0.09 0.26 0.21 0.27 0.25
35 40 45
4
6
8
10
12
14
Longitude
La
titu
de
I
IIIII
IV
V
VI
⇒
Belg Z I Z II Z III Z IV Z V
Zone I 0.50 0.30 0.10 0.21 0.09
Zone II 0.30 0.36 0.19 0.21 0.11
Zone III 0.10 0.19 0.51 0.44 0.27
Zone IV 0.21 0.21 0.44 0.50 0.26
Zone V 0.09 0.11 0.27 0.26 0.40
35 40 45
4
6
8
10
12
14
Longitude
Latitu
de
I
II III
IV
V
Africa group 2007 – p. 6/20

Identifying homogeneous rainfall zones
Determining and selecting of predictors
Model development
Skill Assessment
Africa group 2007 – p. 7/20

Predictors Identification
Longitude
Latit
ude
Correlation of FMAM Zone V ranfall with October SST
60° E 120° E 180° E 120° W 60° W 0° 90° S
60° S
30° S
0°
30° N
60° N
90° N
-0.6 -0.4 -0.2 0 0.2 0.4 0.6
Longitude
Latit
ude
Correlation of FMAM Zone V ranfall with November SST
60° E 120° E 180° E 120° W 60° W 0° 90° S
60° S
30° S
0°
30° N
60° N
90° N
-0.6 -0.4 -0.2 0 0.2 0.4 0.6
Longitude
La
titu
de
Correlation of FMAM Zone V ranfall with December SST
60° E 120° E 180° E 120° W 60° W 0° 90° S
60° S
30° S
0°
30° N
60° N
90° N
-0.6 -0.4 -0.2 0 0.2 0.4 0.6
Longitude
Latit
ude
Correlation of FMAM Zone V ranfall with January SST
60° E 120° E 180° E 120° W 60° W 0° 90° S
60° S
30° S
0°
30° N
60° N
90° N
-0.6 -0.4 -0.2 0 0.2 0.4 0.6
Africa group 2007 – p. 8/20

Selection procedure
Four sets of Predictors (A’, B’,A and B) are createdusing:
A’: stepwise regression and including predictorsfrom contemporaneous season
B’: stepwise discriminant analysis and includingpredictors from contemporaneous season
A : stepwise regression and excluding predictorsfrom contemporaneous season
B : stepwise discriminant analysis and excludingpredictors from contemporaneous season
Africa group 2007 – p. 9/20

Selected Predictors
Longitude
Latitu
de
Belg zone I predictors
Feb
Jan
Dec
Aug
Sep
Jul
Jul
Jun
JunMay
Dec
Oct
Dec
60° E 120° E 180° E 120° W 60° W 0° 90° S
60° S
30° S
0°
30° N
60° N
90° N
Longitude
Latitu
de
Belg zone II predictors
MayNov
OctJul
Aug
Sep
Jun
Sep
Aug
Feb
60° E 120° E 180° E 120° W 60° W 0° 90° S
60° S
30° S
0°
30° N
60° N
90° N
Longitude
Latitu
de
Belg zone III predictors
Mar
Mar
Oct
Dec
Jun
Jul
Jun
Jun
Jul
60° E 120° E 180° E 120° W 60° W 0° 90° S
60° S
30° S
0°
30° N
60° N
90° N
Longitude
Latitu
de
Belg zone IV predictors
Dec
Dec
Nov
Jun
Sep Jul
60° E 120° E 180° E 120° W 60° W 0° 90° S
60° S
30° S
0°
30° N
60° N
90° N
Longitude
Latitu
de
Belg zone V predictors
Oct
Oct
Dec
Sep
Aug
Jul
Sep
Sep
60° E 120° E 180° E 120° W 60° W 0° 90° S
60° S
30° S
0°
30° N
60° N
90° N
35 40 45
4
6
8
10
12
14
Longitude
Latitu
de
I
II III
IV
V
Stepwise regression Stepwise discriminant analysis Common to both Including FMAM predictors
Africa group 2007 – p. 10/20

Identifying homogeneous rainfall zones
Determining and selecting of predictors
Model development
Skill Assessment
Africa group 2007 – p. 11/20

Forecasting Models
Multiple Linear Regression (MLR)
Pr(Y|X) ∼ N(Y, var(Y )); Y = βX; var(Y ) = σ2
o [1 + X′(X′X)−1X]
Linear Discriminant Analysis (LDA)
Pr(Wi|X) =Pr(Wi)fi(X)
P
j Pr(Wj)fj(X); ln(fi(X)) = αi1x1+αi2x2+· · ·+αinxn+Γi
Pr(Wi|X) =edi
P
j edj
; where di = αi1x1+αi2x2+· · ·+αinxn+Γi+ln(Pr(Wi))
Y = Rainfall ; X= predictors (SSTA); β = regression parameter
Where αij = S−1
ij xi and Γi = − 1
2xT
i S−1xi
d=discriminant score, Pr(Wi) = apriori probability, W = category, f = density function
Africa group 2007 – p. 12/20

Identifying homogeneous rainfall zones
Determining and selecting of predictors
Model development
Skill Assessment
Africa group 2007 – p. 13/20

Hindcastleaving out 3 years cross-validation
2002
1971
1972
1970
2000
2001
1969
2003
OmitForecastTraining
1973
Africa group 2007 – p. 14/20
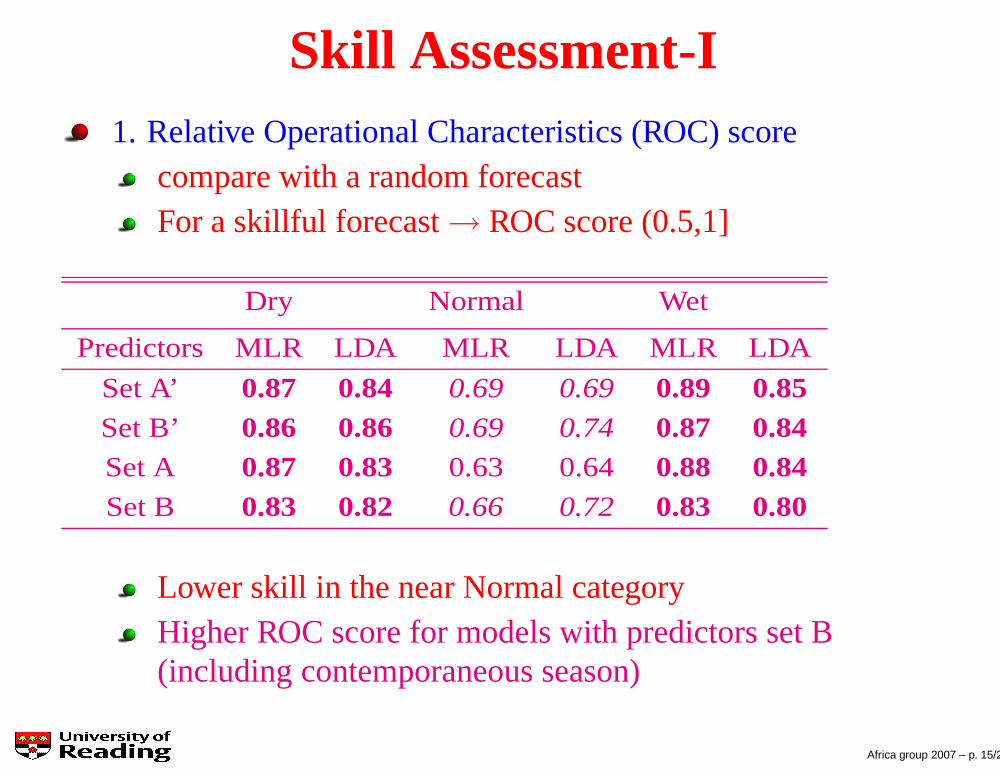
Skill Assessment-I1. Relative Operational Characteristics (ROC) score
compare with a random forecastFor a skillful forecast→ ROC score (0.5,1]
Dry Normal Wet
Predictors MLR LDA MLR LDA MLR LDA
Set A’ 0.87 0.84 0.69 0.69 0.89 0.85Set B’ 0.86 0.86 0.69 0.74 0.87 0.84Set A 0.87 0.83 0.63 0.64 0.88 0.84Set B 0.83 0.82 0.66 0.72 0.83 0.80
Lower skill in the near Normal categoryHigher ROC score for models with predictors set B(including contemporaneous season)
Africa group 2007 – p. 15/20

Skill Assessment -II2. Ranked Probability Skill Score (RPSS)
compare with climatologyFor a skillful forecast→ RPSS(0,1]
RPSS
0.00.2
0.40.6
0.81.0
RPSS for FMAM quint LDA forecast
Zone_I
Zone_II
Zone_IIIZone_IV
Zone_V
Stepwise MLR including FMAMStepwise LDA including FMAMStepwise MLR excluding FMAMStepwise LDA excluding FMAM
RPSS
0.00.2
0.40.6
0.81.0
RPSS for FMAM quint MLR forecast
Zone_I
Zone_II
Zone_IIIZone_IV
Zone_V
Stepwise MLR including FMAMStepwise LDA including FMAMStepwise MLR excluding FMAMStepwise LDA excluding FMAM
RPSS
0.00.2
0.40.6
0.81.0
RPSS for FMAM tercile LDA forecast
Zone_I
Zone_II
Zone_IIIZone_IV
Zone_V
Stepwise MLR including FMAMStepwise LDA including FMAMStepwise MLR excluding FMAMStepwise LDA excluding FMAM
RPSS
0.00.2
0.40.6
0.81.0
RPSS for FMAM tercile MLR forecast
Zone_I
Zone_II
Zone_IIIZone_IV
Zone_V
Stepwise MLR including FMAMStepwise LDA including FMAMStepwise MLR excluding FMAMStepwise LDA excluding FMAM
If we exclude contemporaneous predictors, the highest skillis over Zone V (where spring is the main rainy season)
35 40 45
4
6
8
10
12
14
Longitude
La
titu
de
I
II III
IV
V
Africa group 2007 – p. 16/20

Conclusions
Due to high spatial variation forecasting should be done foreach homogeneous rainfall zones separately
Linear approach yield a better skill compared to climatology orrandom forecast
The skill in the outer categories (above normal and belownormal) is better that that of the inner one (near normal)
Models with predictor set A’ and B’ (includingcontemporaneous season) have got higher skill than modelswith predictor set A and B (excluding contemporaneous season)
The skill of the forecast is better for zone V where Spring is themain rainy season.
Africa group 2007 – p. 17/20

Future work
Modify the seasonal forecast by using additional atmosphericparameter and compare with the one already done
Carry out idealised SST experiments for different regions ofoceans to understand the mechanisms
Africa group 2007 – p. 18/20

Thanks
Africa group 2007 – p. 19/20