ISIOLO COUNTY 2021 LONG RAINS FOOD SECURITY ...
34
ISIOLO COUNTY 2021 LONG RAINS FOOD SECURITY ASSESSMENT REPORT A Joint Report of KFSSG - National and Isiolo County Steering Group (CSG): Technical Departments and Partners July, 2021 KFSSG National team: Anthony Munyao - State Department for Livestock, Pancras Ngati - State Department for Livestock and Opportuna Marura - NDMA
-
Upload
khangminh22 -
Category
Documents
-
view
0 -
download
0
Transcript of ISIOLO COUNTY 2021 LONG RAINS FOOD SECURITY ...

ISIOLO COUNTY
2021 LONG RAINS FOOD SECURITY ASSESSMENT REPORT
A Joint Report of KFSSG - National and Isiolo County Steering Group (CSG): Technical Departments
and Partners
July, 2021
KFSSG National team: Anthony Munyao - State Department for Livestock, Pancras Ngati - State Department for Livestock and
Opportuna Marura - NDMA

1
Executive Summary
The 2020 long rains food and nutrition security assessment was undertaken from 12th to 16th July
2021 by Isiolo County Steering Group (CSG) with the technical support from Kenya Food Security
Steering Group (KFSSG). The overall objective of the assessment was to conduct an objective, evidence based, and transparent food and nutrition security situation analysis following the 2021 long
rains and cumulative effect of the previous seasons and provide recommendations for possible response options based on the situation analysis. The assessment was based on the four pillars of food
security such as food availability, access, utilization and stability. It also looked at the contributing
factors, outcomes and effects on each sector. Various interventions that addressed the issues arising in each sector: agriculture, livestock, water, health and nutrition, education, peace and security, and
markets and trade were identified. Primary data was collected from the community and triangulated by the secondary data to enhance reliability of the findings. The results indicated that, the main drivers
of food and nutrition insecurity in the county were presence of corona virus (COVID-19) pandemic,
crop failure, livestock diseases (Lumpy skin disease and Contagious Caprine Pleuropneumonia, Pestes Petit Ruminate, Sheep and Goat pox), Crop pests and disease (Fall Army Worm and Tuta
absoluta), resource base conflicts, Human disease outbreaks (Kalazaar and Diarrhea), Floods experienced in Cherab and Sericho wards resulting in destruction of household items, roads as well
as water harvesting structures and high food commodity prices. The COVID-19 implementation of
Covid 19 control measures has led to loss of livelihoods across all livelihood zones, underutilization of health facilities and health services, declined market operations, high costs of provision of vet
services and increase in herding costs. The county received depressed rains which was characterized by poor temporal and uneven spatial distribution. The onset was 3 dekads late and cessation was
earlier than normal in the second dekad of May. The depressed rainfall had a negative impact on both
water accessibility and availability, crop and livestock production.
The county experienced massive crop failure. Food availability at household level was low when compared to normal and this impacted negatively on health and nutrition status of both children under
five years and the general population. The stocks held by farmers was 93.9 percent below the long
term average. The pasture and browse condition in all livelihood zones was generally poor or depleted with a worsening trend compared to fair normally resulting to fair to poor livestock body condition.
Milk production declined by almost 50 percent across all the livelihood zones while the prices increased by 66.7 percent. The proportion of households with poor food consumption was 8.4 and
6.7 percent in Pastoral and Casual/waged labor livelihood zones respectively which implied that these
households were only consuming at least staples and vegetables on a daily basis. The proportion of households who had acceptable food consumption was 70.5, 75.1 and 77.6 percent in Pastoral, Agro
Pastoral and Casual-waged labor livelihood zones respectively. Moreover, households were employing consumption based coping strategies more frequently compared in order to meet food
gaps. In conclusion, the indicative food security phase classification in the county is “Crisis” (IPC
Phase 3). However, Pastoral and some parts of Agro Pastoral zones of the county are likely to move to “Emergency” (IPC phase 4) in the next 3 months due to depletion of household food stocks and
forage and water if the expected Short rains fail or are below normal.

2
Table of Contents
Executive Summary .......................................................................................................................................................... 1
Table of Contents ................................................................................................................... Error! Bookmark not defined.
1.0 INTRODUCTION ........................................................................................................................................................ 3
1.1 County background .................................................................................................................................................... 3
2.0 DRIVERS OF FOOD AND NUTRITION SECURITY IN THE COUNTY .......................................................... 3
2.1 Rainfall Performance ................................................................................................................................................. 3
2.2 Insecurity/conflicts..................................................................................................................................................... 4
2.3 Covid-19 pandemic .................................................................................................................................................... 4
2.4 Other Shocks and Hazards ......................................................................................................................................... 4
3.0 IMPACTS OF DRIVERS ON FOOD AND NUTRITION SECURITY ................................................................. 5
3.1 Availability ................................................................................................................................................................ 5
3.1.1 Rain Fed Crop Production .................................................................................................................................. 5
3.1.2 Cereals Stocks .................................................................................................................................................... 6
3.1.3 Livestock Production.......................................................................................................................................... 7
3.1.4 Impact on Availability ...................................................................................................................................... 11
3.2 Access ...................................................................................................................................................................... 11
3.2.1 Market prices .................................................................................................................................................... 11
3.2.3 Income sources ................................................................................................................................................. 13
3.2.4 Water Access and Availability ............................................................................................................................. 13
3.2.5 Food Consumption ........................................................................................................................................... 15
3.3 Utilization ................................................................................................................................................................ 16
3.3.1 Morbidity and mortality patterns...................................................................................................................... 16
3.3.2 Vitamin A Supplementation and Immunization............................................................................................... 17
3.3.3 Nutrition Status and Dietary Diversity ............................................................................................................. 17
3.3.5 Public Interventions, Risk communication and Community level Actions ..................................................... 18
3.3.6 Coordination and leadership in COVID-19 pandemic preparedness and response ......................................... 19
3.3.7 Sanitation and Hygiene .................................................................................................................................... 19
3.4 Trends of key food security indicators .................................................................................................................... 19
3.5 Education ................................................................................................................................................................. 20
3.5.1 Enrolment ......................................................................................................................................................... 20
3.5.2 Effect of Covid-19 on Schools ......................................................................................................................... 20
3.5.3 Effects of 2021 Long Rains on Schools ........................................................................................................... 20
3.5.4 School Feeding ................................................................................................................................................. 20
3.5.5 Inter-sector links ............................................................................................................................................... 21
4.0 FOOD SECURITY PROGNOSIS ............................................................................................................................ 21
4.1 Prognosis Assumptions ............................................................................................................................................ 21
5.0 CONCLUSION AND INTERVENTIONS .............................................................................................................. 23
5.1 Conclusion ............................................................................................................................................................... 23
5.1.1 Summary of findings ........................................................................................................................................ 23
5.1.2 Phase Classification.......................................................................................................................................... 24
5.1.3 Sub-county Ranking ......................................................................................................................................... 24
5.2 Ongoing Interventions ............................................................................................................................................. 25
5.2.1 Food Interventions............................................................................................................................................ 25
5.2.2 Non-Food Interventions ................................................................................................................................... 25
5.3 Recommended Interventions ................................................................................................................................... 29

3
1.0 INTRODUCTION
1.1 County background
Isiolo County lies on the eastern side of the
country and borders Marsabit to the North, Wajir to the East, Garissa to the East and
South East, Tana River, Kitui and Meru to the
South, and Samburu and Laikipia to the West. The county has a population of 268,002
(KNBS 2019) persons and occupies an estimated 25,605 square kilometres. The
county has three livelihood zones namely;
Pastoral species, Casual and waged labour, and Agro-Pastoral with population per
livelihood zone being 52, 33 and 15 percent respectively as shown in Figure 1.
In the Pastoral livelihood zone, 50 percent of
the population is semi-nomadic while the other 15 percent are fully nomadic. In the Agro Pastoral livelihood zone, 45 percent of the population
is fully settled while 30 percent are semi-nomadic. The agro pastoralists reside along/close to the main rivers and suffer from crop losses when rivers flood. The pastoralist areas of Sericho and
Garbatulla bordering Wajir and Garissa counties occasionally suffer resource-based conflict.
Methodology
The main objective of rapid Long Rains Food Security Assessment was to develop an objective,
evidence-based and transparent food security situation analysis following the long rains season of
March to May (MAM) 2021 taking into account the cumulative effects of previous seasons and
thereafter provide instantaneous and medium-term recommendations for possible response options
for stakeholders based on actual situation analysis. Primary data was collected during the field visits
at the county through community and market interviews. Sector technical focal persons at the county
level provided data consolidated in checklists for further analysis, reporting and reference. More
secondary data was collected from the early warning system bulletins and used to provide trends for
the different food security indicators in the various sectors.
2.0 DRIVERS OF FOOD AND NUTRITION SECURITY IN THE COUNTY
2.1 Rainfall Performance
Isiolo County has a bimodal rainfall pattern with long
rains in March- April- May (MAM) and short rains in
October- November-December (OND). The rains
started in Isiolo County in the first dekad of April
which was 3 dekads late across the county. In general,
the county received 25 to 75 percent of the normal
rains with Northern and Central parts of the county
being the most affected. Oldonyiro and parts of
central Isiolo and Kinna received less than 5 percent
of normal rains (Figure 2). The cumulative amounts
of rainfall received during the season was 50.64 mm
compared to the long term average of 145.55 mm.
Spatial distribution was uneven across the county
52%
33%
15%
Pastoral
Figure 1: Isiolo Livelihood zones
Figure 2: Isiolo County Long Rains
performance

4
with poor temporal distribution. The cessation of the rains was early in the second dekad of May
compared to third dekad of same month normally.
2.2 Insecurity/conflicts
The county experienced resource based conflicts especially in zones near the county boundaries with
her neighbors, Wajir and Garissa which were attributed to competition over pastures and water.
However, recurrent incidences have been blamed on political instigated retaliatory attacks which
have occurred along the Garbatulla-Garissa, Merti-Wajir West sub-county and pasture rich Kom
triangle. Some of the conflict hotspots are Garbatulla, Sericho and Korbesa in Garbatulla sub-county,
Alango, Yamicha in Merti and Kom in Charri ward. The other areas with significant conflicts were
fanned by cattle rustling in Ngaremara ward. Several livestock heads have been lost during the raids
in addition to loss of life and/or injuries to the conflicting herding community members. The ensuing
insecurity especially among the communities living near the conflict hotspots has led to continued
fear of attacks. This has derailed livelihood activities such as forage search and livestock marketing
subsequently leading to a significant shrinking of markets access and prices offered at the remaining
operational markets. A reduction in price of livestock has led to a significant decline in purchasing
power of pastoral households. Moreover, livestock deaths perpetrated by wild animals have been
reported across the county by herding communities to relevant authorities with no or minimal
compensation made for the destruction.
2.3 Covid-19 pandemic
Since emergence of the disease a number of measures to control spread of the disease have been put
in place. Such measures include travel restrictions and periodical ban on gatherings which have had
dire consequences on trade and hospitality. The resultant effect was downscaling of operations in the
tourism and hospitality industries as well as transportation of people and goods across diverse markets
leading to significant decline in demand for services and products. The Covid-19 control measures
have eventually resulted to loss of jobs and livelihoods. In the Pastoral livelihood zone, farmers are
being offered significantly lower prices for their livestock when compared to the pre-Covid-19 times.
This is among other factors that could have led to lower purchasing power of a large proportion of
the county population that relies on sale of livestock to access food commodities.
2.4 Other Shocks and Hazards
High food commodity prices: The moderate increase in staple food prices are a direct result of crop
failure or poor harvests locally that has led to a lower purchasing power among herding households
who are forced to sell their heads of livestock at prevailing lower market prices. This is expected to
erode on households’ ability to feed their members and thus resort to employment of food and
livelihood based coping strategies.
Hazards
Crop Failure: There was massive failure of most of crops such as maize and beans under pure rain
fed production. However, maize crops were more affected by the poor availability of soil moisture
following the depressed performance of long rains. This implied that households producing crops had
little or no harvests to stock or sell, therefore depressed stocks, less income and low purchasing
power. It also directly meant that majority of the county food stocks have to be obtained from
neighboring counties, a factor that poses a risk of early price surges as drought heightens.
Livestock diseases: Livestock such as Anaplasmosis, Lumpy Skin Disease (LSD), Contagious
Caprine Pleuro Pneumonia (CCPP), Pestes Petit Ruminate (PPR), Sheep and Goat pox (S&GP) are
causing a heightened risk of opportunistic infections due to the continued weakening of their health
5
and immunity. This is attributed to consumption of less quality feeds and water that is increasingly
becoming scarce due to depletion in addition to increasing distances to watering points.
Crops and livestock pests
Pests such as the Fall Army Warm (FAW) have become big threat to maize farmers growing the
cereal crop. This has consequently increased farming costs and thereby reducing the farmer income
and thus their purchasing power. Livestock pests such as ticks and Tse tse fly were also reported
although their prevalence was generally low mainly attributed to the poorly regenerated pasture lands
following poor performance of the long rains season.
Floods
Flash floods were experienced in Cherab and Sericho wards following heavy downpours during the
third dekad of April, resulting in destruction of household items, roads as well as water harvesting structures such as water pans. The flooding resulted in the area being cut-off for a period of five
days.
3.0 IMPACTS OF DRIVERS ON FOOD AND NUTRITION SECURITY
3.1 Availability
This is a key pillar of food security incorporating prevailing livelihood options for a society which
comprise of economic undertakings people engage in to make a living. The pillar portrays the primary
sources of food and income, essential to make a living. The county has two main livelihoods that
shape the availability pillar; that is livestock production and crop production, gradually developing
as an alternative to diversify food and income source. Under the pillar, the current poor condition of
forage, both in quantity and quality and the prevailing water scarcity, depicts that livestock production
is under threat, in a county where farmers’ contingencies of animal feed are insufficient and/or non-
existent. Moreover, crop production in the season was very poor characterized by massive crop
failure. In this section area planted under crops, harvests, available food stocks and productivity of
livestock and marketing aspects are discussed.
3.1.1 Rain Fed Crop Production
Crop production is only practiced in the Agro-Pastoral and casual waged-labour livelihood zones
with a 20 and 32 percent population respectively. Food crop production contributes 23 and 15 percent
of cash income in the Agro Pastoral and casual waged labour livelihood zones respectively. Maize
production contributes 15 percent of cash income and 45 percent to food in the Agro Pastoral
livelihood zone. In casual waged labour livelihood zone, maize and beans contribute 70 and 20
percent to food and income respectively. The long rains season accounts for about 40 percent of
annual rainfall experienced in the county. The area planted under maize was equivalent to the LTA
because farmers were assisted with assorted seeds, fertilizer and subsidized tractor services by Food
Agriculture Organization (FAO), World Vision and County government. The hectreage under beans
and green grams was 20.8 and 17.9 percent below the LTA (Table 1). The decline in area planted
under the two crops is associated to low purchasing power of farmers for farm inputs such as seeds
and also due to reduced labour on the farms as a result of Covid-19 restrictions on group gatherings
mainly in areas bordering Meru, Kinna and Rapsu. Production for maize, beans and green grams was
98.1, 97.8 and 97.5 percent respectively below the LTA which is attributed to depressed long rains
which was erratic, unevenly distributed coupled with late onset and early cessation. The fall army
worm infestation in maize was also experienced in Rapsu ward.

6
Table 1: Rain-fed crop production
Crop Area planted
during 2021
Long rains
season
(Ha)
Long term average (5
year) area planted
during the Long
rains season (Ha)
2021 LRA rains
season production
(90 kg bags)
Projected/Actual
Long term average (5
year) production
during the short rains
season
(90 kg bags)
1.Maize 372 372 101 5400
2.Beans 210 265 39 1800
3.Greengrams 55 67 10 400
Irrigated crop production
The main crops produced through irrigation in order of priority are maize, tomatoes and onions as
illustrated in Table 2 above. The area under maize, tomatoes and onions was 43.9, 47.1 and 45.6
percent below the Long term average respectively. The decline in hectreage under production for the
above crops was due to low purchasing power of farmers for the seeds and seedlings as well as the
depressed long rains which were received in most parts of the county. Production for maize,
Tomatoes and Onions declined by 70.4, 57.8 and 59.7 percent respectively when compared to LTA.
The decline was due to reduced water levels in the rivers resulting to water rationing in the irrigated
areas as a result of depressed long rains. Production was lower in maize because of attack by fall-
armyworm which cleared approximately 25 percent of the area planted during the season in Rapsu,
while tuta absoluta pest in tomatoes affected production in tomatoes.
Table 2: Irrigated Crop Production Crop Area planted
during the
2021 Long
rains season
(ha)
Long term average
(3 years) area
planted during short
rains season (ha)
2021 Long rains
season production (90
kg bags/MT)
Projected/Actual
Long term average (3
years) production during
2021 Long rains season
(90 kg bags/MT)
1.Maize 185 330 1245 4200
2.Tomatoes 45 85 607MT 1440MT
3.Onions 43 79 433MT 1074MT
3.1.2 Cereals Stocks
Maize stocks held by farmers, traders and millers were 93.9, 91.2 and 39.7 percent (Table 3) below
the LTA respectively as result of crop failure experienced in the county due to depressed long rains.
For the traders, the stocks have declined in most markets in Isiolo Sub-county with markets such as
Oldonyiro experiencing reduced supplies from the neighboring counties. Farmers in the pastoral
Livelihood zones have no stocks and are wholly dependent on the markets for their food supplies.
Table 3: Quantities held currently Commodity Maize Rice Sorghum Green gram
Current LTA Current LTA Current LTA Current LTA
Farmers 20 330 0 0 0 20 5 25
Traders 200 2273 2200 2200 15 18 14 18
Millers 400 663 0 0 0 0 0 0

7
Commodity Maize Rice Sorghum Green gram
Current LTA Current LTA Current LTA Current LTA
Food Assistance 0 700 0 0 0 0 0 700
NCPB 0 1250 0 0 0 0 0 0
Effects of Covid-19
The pandemic has not affected availability of food stocks since there has been no restriction of
movement of goods from all the supply areas.
3.1.3 Livestock Production
Livestock production is the mainstay of the county’s economy and it is practiced in all the livelihood
zones. Livestock production contributes 80 percent of cash income in the pastoral livelihood zone
while in the agro-pastoral livelihood zone, the sector contributes 45 percent of cash income. The main
livestock species kept include cattle, goat, sheep, camel, donkey and chicken. The most important
species in the food chain are sheep and goats which are easily sold by farmers to replenish food stocks
at the household level while camel and cattle are usually sold when major investments are to be done.
Camels are largely kept for milk production while donkeys are used mostly for transporting water,
firewood and household food to and from the market. The milk from camels, goats and cattle is used
for household consumption while the surplus is sold.
The emergence of Covid-19 has negatively affected the livestock sector. Provision of veterinary
services has declined due to a decrease in Government funding and a noted increase in prices of
veterinary inputs like drugs. Restricted movement and low purchasing power due to Covid-19
containment measures has affected the distribution of veterinary goods and services resulting in
shortages of such goods and services in some villages. Herding labor costs has continued to increase
due cost associated with implementation of some Covid-19 control measures. Households who were
involved in the value addition of livestock products either stopped production due to Covid-19
restrictions coupled with low demand of the products. Operations in all livestock markets have not
normalized completely hence markets are not fully provisioned with livestock good and services.
Covid-19 restrictions have been an additional burden to vulnerable households in terms purchase of
sanitizers and face masks. Fear of contracting Covid-19 among herders has limited movements to
certain areas which are viewed as risky.
Pasture and Browse
The pasture and browse condition in all livelihood zones was generally poor or depleted when
compared to fair normally (Table 4). This was attributed to poor performance of both 2020 short rains
and 2021 long rains which led to no or minimal regeneration of pasture and browse. Pasture and
browse has been depleted in most grazing zones in the county especially Chari, Cherab, Sericho,
Garbatulla, Kinna and Oldonyiro wards. However, few areas with pasture and browse such as Kom
and Gogogicha, are expected to last between one to two months compared to three to four months
normally. Insecurity along Isiolo-Garissa, Isiolo-Wajir and Isiolo-Samburu border have limited
access to pasture and browse. The worst affected wards are Charri, Cherab, Sericho, Ngare mara and
Burat. Also, inadequate water in dry grazing areas for example Yamicha and Alango coupled with
bush fires in Cherab and Sericho has limited the access. In Kinna ward, tsetse fly and tick infestation
around the border of Bisan Adhi and Meru National park have limited the access to pasture and
browse. Invasive plant species such as acacia reficience in Oldonyiro ward and Prosopis juliflora in
Cherab ward have invaded thousands of hectares. These invasive plant species have limited access
to pasture and browse because they smother the growth of other palatable plant and grass species.

8
Table 4: Condition of pasture and browse
Pasture conservation status
Pasture conservation is being practiced in Kinna, Muchuro, Rapsu, Burat, Munanda Nur, Oldonyiro
and Korbesa villages. The county has approximately 3,500 bales of hay currently being held by
farmers and farmers groups. The county has five hayshed with average storage capacity of 20,000
bales with only three being utilized having 900 bales in store. The average prevailing price is Kshs.
300 per bale. In both Pastoral and Agro Pastoral livelihood zones, the rate of adoption of pasture
production and conservation is still very low due to belief among the pastoralists that pasture is a free
input in livestock production system. However, the few farmers involved in pasture production and
conservation use simple raised platform structures within the pasture field to store hay. The utilization
of held hay stands at less than 30 percent. Factors limiting utilization of the hay include inadequate
market (Kinna ward), lack of technical skills on production and conservation and lack of incentives
to conserve pasture. Lack of stockists for certified pasture seeds in the county also limits pasture
production. There are three groups in Kinna, Ngare Mara and Burat wards that are currently involved
in commercial pasture production but they are at formative stages therefore their role in mitigating
seasonal fluctuation of livestock feeds is still minimal.
Covid-19 containment measures has affected communities’ regular meetings for planning grazing
and scouting of grazing areas. The herding labor cost has also increased because of additional
requirements by herders to buy sanitizers and masks which many household cannot afford.
Livestock Productivity
Livestock body condition
The body condition for cattle and sheep was fair to poor compared to fair normally while that of goats
was fair which was normal. Camels had a fair body condition compared to good normally which is
attributed to availability of shrubs for browsing (Table 5). The current livestock body condition has
been attributed to diminishing/depleted pasture and browse, increasing trekking return distance from
grazing to water points which has resulted to a decrease in watering intervals.
Table 5: Livestock body condition
Pasture Browse
Livelihoo
d zone
condition How long to
last (Months)
Factors
Limiting
access
Condition How long to
last (Months)
Factors Limiting
access
Curr
ent
Nor
mal
Curr
ent
Nor
mal
Curre
nt
Nor
mal
Curr
ent
Nor
mal
Pastoral Poor fair 1-2 3-4 Water,
insecurity
Fair to
poor
fair 2-3 4 Water, insecurity,
Invasive weeds
Agro-
pastoral
Poor fair 1-2 3-4 Water,
insecurity
Fair to
Poor
fair 2-3 4 Water, insecurity,
tse tse fly
Livelihood
zone
Cattle Sheep Goat Camel
Current Normal Current Normal Current Normal Current Normal
Pastoral Fair to
poor
Fair Fair to
poor
Fair Fair Fair Good to
Fair
Good
Agro-pastoral Fair to
poor
Fair Fair to
poor
Fair Fair Fair Good to
Fair
Good

9
Tropical livestock units (TLUs)
The TLUs were below average across all the livelihood zones for both poor and middle-income
groups. The TLUs owned by poor income households declined by 50 percent while that for middle
income household households reduced by 33.3 percent in the Pastoral livelihood zone. In the Agro pastoral livelihood zone, the decline in TLUs was 33.3 percent among the poor household and 50
percent among the middle income household (Table 6). The decline in TLUs was attributed to previous droughts which resulted to livestock deaths, incidences of livestock diseases outbreaks and
cattle rustling. Poor income households have been unable to restock substantially after death or loss
of livestock. The rate of natural recovery for herds has also been poor due to the successive nature of the shocks such as droughts. Decline in TLUs implies the household will be unable to meet all their
needs from the livestock hence end up being food insecure.
Table 6: Tropical Livestock Units
Birth rate
The livestock births rates were noted to be slightly below normal due to ongoing dry spell and
weakening of livestock body conditions across all the livelihood zones for all livestock species. The
trend will worsen in the next three months due to depletion of available pasture, browse and water
for livestock.
Milk production, consumption and pricing
Most of the cattle milking herds have dried up except camels, due to poor pasture and browse
condition and long trekking distances to watering points which has resulted to weakening of livestock
body condition. Current average milk production per household ranges from nil to less than one litre
compared to two litres normally across all the livelihood zones (Table 7). Milk consumption per
household on the other hand stood at nil to less than one litre compared to two normally. This
represents a decline of more than 50 percent of milk production and consumption in the two
livelihood zones. Milk prices have increased by 66.7 percent when compared to the LTA across all
the livelihood zones. Generally, there was reduced market access for milk by most of vulnerable
households due to the prevailing dry spell, the poor economic situation of most households in the
county and upward trend in prices of the milk available in the market. COVID-19 has also impacted
negatively on the vulnerable households who do not own any milking herds and are unable to buy
milk in the market due to high prices.
Table 7: Milk production, consumption and prices
COVID-19 containment measures have resulted in a general decrease in milk consumption due to
reduced milk supplies as some milk venders and traders have dropped out of the milk market coupled
Livelihood zone Poor income households Medium income households
Current Normal Current Normal
Pastoral 2 4 10 15
Agro-pastoral 2 3 5 10
Livelihood
zone
Milk Production
(Litres)/Household
Milk consumption (Litres)
per Household
Prices (Kshs)/Litre
Current LTA Current LTA Current LTA
Agro-pastoral 0-<1 2 0-<1 2 80-120 60
Pastoral 0-<1 2 0-<1 2 80-120 60

10
with reduced milk demand from consumers reluctant to purchase raw milk from the markets due to
fear of contracting COVID-19 in crowded markets places.
Migration
The county has experienced in- migration of livestock from Wajir and Garissa counties which is
normal during this period. Internal migration within the county to the dry grazing areas of Kom, Urura, Dogogicha, Nyachis and other dry season grazing reserves of Yamicha and Duma have been
witnessed. Livestock from Kinna ward have moved to Meru National Park and surrounding areas while in Oldonyiro ward, cattle have moved out to Laikipia ranches and Samburu County. Cattle and
small stock in Merti and Garbatulla sub-county have migrated to Ewaso Nyiro River basin. An
approximately 80, 60 and 30 percent of cattle, camels and sheep and goat respectively have migrated in the livelihood zones. The implementation of COVID 19 control measures has resulted to increase
in herding costs and high herding labour turn over as herders are required to have sanitizers, soaps and face masks when migrating with livestock as a COVID containment measures.
Livestock Diseases and Mortalities
There was no reported case of disease outbreak in the county. Endemic livestock diseases such as
Anaplasmosis, Lumpy Skin Disease (LSD), Contagious Caprine Pleuro Pneumonia (CCPP), Pestes
Petit Ruminate (PPR), Sheep and Goat pox (S&GP) was noted in all livelihood zones and continued
to pose challenges to pastoralists. Livestock mortality rates for all livestock species in the county
was normal and mostly attributed to natural causes.
COVID-19 containment measures negatively affected disease control in the county in that pastoralists
were unable to get adequate animal health services because resources from county government were
mostly dedicated towards COVID 19 control and prevention measures and other infrastructural
projects such as roads. In general, veterinary drug suppliers are few in the county and coupled with
increase in prices of most drugs, livestock health and productivity has been negatively affected.
Water for Livestock
The current water sources for livestock in both Agro Pastoral and Pastoral livelihood zones are
boreholes, springs, shallow wells, sand dams and Traditional river wells compared to Boreholes,
rivers, springs, water pans and sand dams normally. The variation in the water sources was attributed
to low recharge of open water sources and subsequent drying up of the all water pans due depressed
long rains. The current trekking return distances from grazing area to watering points is 14 km in
Agro Pastoral and approximately 16 km in Pastoral compared to less than 10 kms in all the livelihood
zones normally (Table 8). The watering frequency is after two to three days for goats, sheep and cattle
species compared to daily normally. Camels are watered after every 6 days compared to after every
5 days normally. Shallow wells are expected to last for less than two months compared to four months
normally with worst affected wards being Sericho, Cherab, Garbatulla and Kinna. The current factors
limiting access to water are insecurity especially in Merti and Garbatulla sub-counties. COVID 19
containment measures had very minimal effect on access to water for livestock.
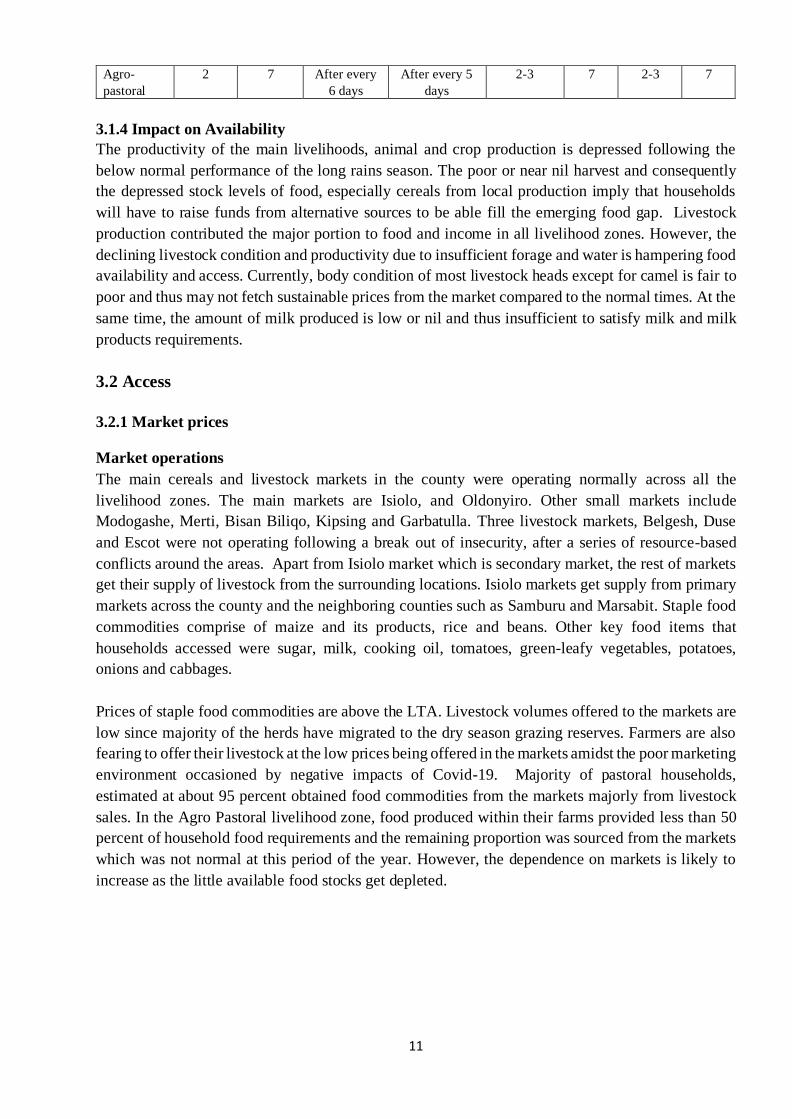
Table 8: Watering frequency (Days per week) Livelihood
zone
Cattle Camels Goats Sheep
Current Normal Current Normal Current Norm
al
Current Norm
al
Pastoral 2 7 After every
6 days
After every 5
days
2-3 7 2-3 7
11
Agro-
pastoral
2 7 After every
6 days
After every 5
days
2-3 7 2-3 7
3.1.4 Impact on Availability
The productivity of the main livelihoods, animal and crop production is depressed following the
below normal performance of the long rains season. The poor or near nil harvest and consequently
the depressed stock levels of food, especially cereals from local production imply that households
will have to raise funds from alternative sources to be able fill the emerging food gap. Livestock
production contributed the major portion to food and income in all livelihood zones. However, the
declining livestock condition and productivity due to insufficient forage and water is hampering food
availability and access. Currently, body condition of most livestock heads except for camel is fair to
poor and thus may not fetch sustainable prices from the market compared to the normal times. At the
same time, the amount of milk produced is low or nil and thus insufficient to satisfy milk and milk
products requirements.
3.2 Access
3.2.1 Market prices
Market operations
The main cereals and livestock markets in the county were operating normally across all the
livelihood zones. The main markets are Isiolo, and Oldonyiro. Other small markets include
Modogashe, Merti, Bisan Biliqo, Kipsing and Garbatulla. Three livestock markets, Belgesh, Duse
and Escot were not operating following a break out of insecurity, after a series of resource-based
conflicts around the areas. Apart from Isiolo market which is secondary market, the rest of markets
get their supply of livestock from the surrounding locations. Isiolo markets get supply from primary
markets across the county and the neighboring counties such as Samburu and Marsabit. Staple food
commodities comprise of maize and its products, rice and beans. Other key food items that
households accessed were sugar, milk, cooking oil, tomatoes, green-leafy vegetables, potatoes,
onions and cabbages.
Prices of staple food commodities are above the LTA. Livestock volumes offered to the markets are
low since majority of the herds have migrated to the dry season grazing reserves. Farmers are also
fearing to offer their livestock at the low prices being offered in the markets amidst the poor marketing
environment occasioned by negative impacts of Covid-19. Majority of pastoral households,
estimated at about 95 percent obtained food commodities from the markets majorly from livestock
sales. In the Agro Pastoral livelihood zone, food produced within their farms provided less than 50
percent of household food requirements and the remaining proportion was sourced from the markets
which was not normal at this period of the year. However, the dependence on markets is likely to
increase as the little available food stocks get depleted.

12
Maize price
There has been a steady increase in maize
prices from the beginning of the year up to
June. The average market price in the month
July 2021 is Kshs. 55.6 which is 11 per cent
above the LTA price of Ksh.50. The increase
in the main cereal’s price is attributed to
declining level of stocks held by households’
majority of whom experienced near-total
failure of their crops. Traders and millers
have also not restocked. Maize price was
however highest in the pastoral livelihood
zone markets where a kilo retailed at a price
13 percent above the LTA. The above
average maize price in some rural markets in
Cherab, Charri and Sericho wards were
attributed to transport costs from the main supply
stores in Isiolo and Maua in Meru County. The price of maize is expected to increase considerably
in the next three months mainly attributed to expected depletion of stocks held by households and
local traders.
Goat price
The average market price in month
of July 2021 for a middle sized goat
was Kshs. 3,194 which was 11
percent below thee LTA. The price
varied across the livelihoods
depending on the proximity to
operational livestock markets and
availability of buyers. The price has
been stable but on declining. The
marketing environment is bearing
the brunt of the prevailing
economic slowdown occasioned
by impacts of Covid-19 pandemic.
The other contributing factor could be the
Deteriorating body condition as shortage of forage and water deepens across the livelihood zones.
Goat price is expected to decline gradually in the next three months as forage shortage deepens and
distance increase to watering points.
Figure 3: Average small stock (goat) price (Ksh)
0
1000
2000
3000
4000
5000
Jan Feb Mar Apr May Jun Jul Aug Sep Oct Nov Dec
Pri
ce (
Ksh
.)
Average (2016-2020) 2020 2021
44
46
48
50
52
54
56
58
Jan Feb Mar Apr May Jun Jul Aug Sep OctNovDec
Pri
ce (
Ksh
. /
kg)
Average (2016-2020) 2020 2021
Figure 3: Maize prices

13
Terms of Trade (ToT)
The ToT in the month of July 2021 was
58 kg of maize after sale of a two-year
goat, which h is 3.4 percent which was
equivalent to the LTA. The ratio has been
declining steadily due to the rise in maize
market price as stocks decline. The ToT
which is an indicative of the prevailing
household’s purchasing power, was 16
percent below the LTA in the pastoral
livelihood zone. The county overall ToT
is expected to reduce in the following
three months owing to projected
reduction in livestock market prices and
increase in maize price.
3.2.3 Income sources
Main sources of income in both the pastoral and agro- pastoral zone
is sale of livestock, mainly goat and sheep which are easier sell within primary and rural markets.
The small stocks are also easier to transport to markets in bikes, lorries and buses. Other sources of
income in the Agro Pastoral livelihood zone include sale of onions, vegetables, tomatoes and
pawpaws. Income sources are normal at this time of the year. Petty trade and casual jobs in irrigation
farms and construction sites are the major income generating options largely available in the casual-
labor livelihood zone.
3.2.4 Water Access and Availability
The main water sources for domestic
use were boreholes, rivers, shallow
wells, sand dams and traditional river
wells (Figure 6). The county residents
mainly rely on rivers Ewaso Nyiro,
Isiolo and Bisan Adhi as major water
sources in the county during the rains
and drought periods.
Some sections of the county such as
Oldonyiro and Kipsing, have poor
water supplies and residents rely on
sand dams built along the temporary
river beds. Locations such as Sericho
and Iresaboru in Sericho ward,
Garbatulla sub-county and Korbesa, Malkagalla, Saleti and Matarba in Merti sub-county access water
from shallow wells dug along the Ewaso Nyiro flood basin which has dried up stream. Households
in Isiolo Central especially in Burat and Bulapesa wards access water from River Isiolo though the
flow volumes are on a decline trend day by day due to over utilization by farmers and Isiolo town
residents. River Bisanadi in Kinna has water flowing but the volumes are reducing due to abstraction
upstream.
Figure 4: Main sources of water
0
10
20
30
40
50
60
70
80
Jan Feb Mar Apr May Jun Jul Aug Sep Oct Nov Dec
Kilo
gra
ms
of m
aiz
e
exch
an
ged
fo
r a g
oat
Terms of tradeAverage (2016-2020) 2020 2021
Figure 5: Terms of Trade

14
The general water access situation in the county is poor as majority of surface sources were partially
recharged. Highest recharge in water pans was about 85 percent in Sericho ward, Garbatulla sub-
county and lowest at approximately 10-30 percent in Cherab ward, Merti sub-county where least
rainfall was experienced. On the other hand, the recharge levels of main rivers and boreholes ranged
between 40 to 60 percent.
Approximately 95 percent of water pans have dried up. Water levels in shallow wells has also
declined as result of reduction of river flows and drying up of some of the rivers such as River Ewaso
Nyiro and Rikiundu. The number of boreholes that are functional with normal yield are
approximately 91 percent though the yield may reduce due to poor cumulative recharge during the
below average performance of previous two rainy seasons. Wards with points with high human
concentrations at water points include Sericho, Kinna , Garbatulla ward and Oldonyiro in Isiolo sub-
county as well as Cherab and Chari in Merti sub-county. The overall water situation in all the
livelihood zones in the county is below normal when compared to same time last year. Boreholes in
Beltume, Yamicha, Duma and Modogashe were destroyed due to escalating conflicts while one of
the borehole in Iresaboru was destroyed by flood hence are not operational. The water in pans
currently holding water are expected to last for two weeks while shallow wells are expected to last
for 2 months when compared to four and six months normally. Majority of sand dams mainly in
Oldonyiro ward are expected to last for a period of three months when compared to six months
normally.
Distance to water sources
Households in Pastoral livelihood zones covered an average return distance of 2-5km which is
considered to be moderately longer when compared to the normal distance of about 1-2.5km.
Households in Agro Pastoral livelihood zones accessed water at a relative short distance of 1-2km
which was normal. In Sericho ward, Garbatulla sub-county, several areas such as Biliqi, Gubatu,
Iresaboru and Modogashe are facing moderate to acute water shortages. The same water stress is
being experienced in Cherab ward in Korbesa, Alango, Dadacha Basa and neighboring locations. In
Oldonyiro ward, Isiolo sub-county, areas experiencing water shortages are Tuale, Nooroloi, Lpusi,
and Lebarasherek.
Waiting time at the source
The average waiting time at water points in all the livelihood zone ranged between 20 to 30 minutes
compared to 20 minutes during normally. However, waiting time was relatively higher in boreholes
powered with solar energy. The waiting time in Pastoral and Agro Pastoral livelihood zones where
main water sources are rivers, traditional river wells and sand dams was estimated to be about five
and ten minutes. The time spent while queuing in some casual waged livelihood zones, in Mwangaza,
Wabera, Bulapesa and Kambi ya Juu in Isiolo town ranged between 15 to 30 minutes which was
noted to be normal. There were no areas with abnormal population numbers crowding at any given
time apart from areas such as Kulamawe attributed to fewer water distribution points.
Cost of water
Cost of water is affordable in most parts of the county as residents are charged a small fee to cater
for pumping operations for borehole water in the Pastoral and Agro Pastoral livelihood zones. In
established market centres and urban areas, the commodity is channeled to water kiosks where
households are able access it at a short distance from their homesteads. The water management
committees in urban settlements in Sericho, Bulesa and Charri wards charge an average of Ksh 2.00
per 20 jerrican while in other areas such as Malkadaka, Gafarsa, Garbatulla sub-county as well as
Merti township the charge was a monthly rate of Kshs. 200. Water is free in the Sericho and Kinna

15
locations. A 20 litre jerrican was being sold at Kshs. 5.00 in Dadacha Basa and exceptionally high in
the Pastoral Modogashe where water vendors charge households Kshs. 10 per 20 litre jerrican.
Water consumption
Average water consumption in Agro Pastoral livelihood zone stands at an average of 20 litres per
person per day compared to 40 litres normally while in Pastoral livelihood zones the average daily
water consumption was 7.5 liters per person per day when compared to 20 litres per person per day
normally. The below normal consumption is attributed to the lower than average recharge levels due
to the poor performance of the long rains. The consumption was low in water scarce hotspots in
Pastoral livelihood zones such as Sericho, Biliqi, Gubatu, Iresaboru. Modogashe. Cherab Alango,
Dadacha Basa and neighboring locations where water trucking intervention was the only source. The
consumption for herding households was about 5 litres per person per day due to water scarcity.
3.2.5 Food Consumption
Food Consumption Score (FCS)
The proportion of households with poor
FCS was 8.4 and 6.7 percent in Pastoral and
Agro pastoral livelihood zones
respectively. On the other hand, the
proportion of households who have
borderline food consumption was 21.1,
18.2 and 22.4 percent in the Pastoral, Agro
Pastoral and casual-waged livelihood zones
respectively. Households who have
acceptable food consumption was 70.5,
75.1 and 77.6 percent in Pastoral, Agro
Pastoral and casual-waged labor livelihood
zones respectively as shown in figure 7.
Households in borderline food
consumption consumed staples and
vegetables every day accompanied by oil and pulses a few times during the seven-day recall period.
Dietary diversity especially in the larger Pastoral livelihood zone was poor, a scenario that is blamed
on poor availability of the required food groups. Access to the rich variety of foods is also hindered
by transport challenges from production and growing zones to markets.
Milk consumption
The average fresh milk consumption per household per day was nil to less than 1 litre compared to
short term average of 2 litres across the livelihood zones. Majority of the milk consumed was
obtained from camels as the cows and goats produced insignificant amounts or none. A proportion
of households who do not own camels relied on milk bought from their counterparts keeping the
camel at a price ranging from Kshs.80 to Kshs. 120 per litre or bought packet milk from the market.
The fresh milk at its current price is only affordable to a few households with higher incomes
especially in Isiolo market where the fresh product is being retailed at Ksh.120 per litre.
0.0
20.0
40.0
60.0
80.0
100.0
120.0
Pastoral Agro-pastoral Casual Wagedlabour
Food Consumption Score June, 2021
Poor Borderline Acceptable
Figure 5: Food Consumption Score

16
Coping Strategies
The current reduced coping strategies index (CSI) stands at 11.8 having
portrayed an increasing trend since March this year. The current CSI is
slightly above last year’s index of
10.9, implying that strategies being employed currently slightly exceed
those of last year. This is more pronounced among herding
households whose access to food is
limited to due to poor access to livestock and food commodity
markets. This could also be attributed to lower food availability as well as
accessibility especially, milk and
vegetables that are now declining especially in the pastoral livelihood
zone.
Most households reporting unstable food security reduced the number of meals while going for the
less preferred and/or expensive foods. Some in this category are taking credit from their rural Fast
Moving Consumer Goods (FMCG) retailers and neighbors. Other commonly employed coping
strategies are reduction in portion or size of meals and borrowing. Households in the pastoral
livelihood zone employed more coping strategies when compared to their counterparts in the agro-
pastoral and casual waged labor/employment zones.
3.3 Utilization
3.3.1 Morbidity and mortality patterns
Under Fives
The most common ailments among under 5 years remain Upper Respiratory Tract Infection (URTI),
Diarrhea and malaria with a slight increase noted in the months of April, May and June this year for URTI and Diarrhea. For the general population URTI, UTI, Malaria, skin and eye diseases were the
most common ailments in the county. The community mostly sought health services from the Health facilities with some of the hard to reach areas covered through Integrated Outreaches. The Diarrhea
cases in children under 5 years increased by 22 percent in Jan - June 2021 compared to Jan- June
2020 across the county. The increase in Diarrhea can be attributed to acute water shortage currently being experienced in some parts of Isiolo, Merti and Garbatulla sub counties which resulted to poor
hygiene practices. There was slight increase in URTI cases by 5.3 percent from Jan – June 2021 compared to same period last year due to improved health seeking behaviors at health facilities that
led to an increase in cases recorded. Uptake of health and nutrition services in the period of Jan –
June 2020 was hampered by the stigma and anxiety surrounding COVID 19 as opposed to this year where the county has seen a progressive increase in the number of cases received as a result of
improved health seeking behavior with better awareness and containment measures.
General population
The URTI cases increased by 5 percent among general population in the period Jan to June 2021 compared to same period last year. The increase in the cases can be attributed to improved health
seeking behavior during this period when compared to same time last year that was characterized
0
2
4
6
8
10
12
14
Pastoral Agro-pastoral Casual Wagedlabour
Me
an C
SIMonth
Isiolo County - Coping Strategies Index
Figure 6: Reduced Coping Strategies Index (rCSI)

17
with anxiety and stigma due to Covid-19. Acute water shortages in Isiolo, Merti and Garbatulla sub counties resulted in increase in Diarrhea cases by 12 percent between Jan - June 2021 compared to
the same period in 2020. The water shortage are attributed to depressed 2021 long rains which were
experienced in the county which resulted to poor hygiene practices. There were no major diseases outbreak reported during the period under review. There was significant decrease in malaria cases by
55 percent in Jan – June 2021 when compared to the same period in 2020. This decrease in malaria cases was as a result of good uptake of immunization services where the Pregnant Lactating Women
are provided with treated mosquito nets and health education at facility level where the household
were taught on the need to prevent and control malaria through clearing of bushes and grasses, draining stagnant water and sleeping under treated mosquito nets.
3.3.2 Vitamin A Supplementation (VAS) and Immunization
Vitamin A supplementation increased
to 82.7 percent in Jan – June 2021 compared to 48.8 percent same period
in 2020 for children aged 6 to 11
months. For children aged 12 to 59 months Vitamin A supplementation
decreased from 125.6 percent recorded in Jan – June to 19.3 percent in Jan-
June 2021 which is below the National
target of 80 percent (figure 9). The increase VAS for children aged 6-11
months is attributed to the interventions such as ECD
supplementation and Community level
mobilization and supplementation employed to ensure an adequate
coverage.
According to DHIS 2021, the proportion of Fully Immunized Children (FIC) decreased slightly from
77.3 percent Jan- June 2020 compared to 70.6 percent in Jan -June 2021.There was a decrease in
measles coverage by card at 9 and 18 months from 72 to 61 percent and 55 to 36 percent respectively. The decrease in immunization can be attributed to long distances to the health facilities, acute antigen
shortages in most health facilities, low integration of outreach interventions, poor linkages in community- facility, poor defaulter tracing and fear of contracting Covid-19. The County Department
through the Community Health System has intensified information sharing, follow-up and defaulter
tracing mechanisms to ensure the uptake of services is sustained.
3.3.3 Nutrition Status and Dietary Diversity
Dietary diversity
Dietary diversity was poor across the livelihood zones with majority of the households consuming two meals a day with an average of four food groups daily. This was common for both children under
5years and adults. In pastoral livelihood zone where milk was available, children below 5years were
able to take at a least glass of milk while adults commonly consume milk in tea. Poor dietary diversity was as a result of knowledge gap on dietary diversity and culture among the population. Covid-19
impacted negatively dietary diversity with a notable increase on commodities prices making food access difficult and in turn affecting dietary diversity.
0
1000
2000
3000
4000
5000
6000
7000
8000
Jan -june 2020 Jan - June 2021
Pro
po
rtio
n o
f ch
ildre
n
Axis Title
Vitamin A Supplementation
Children 6 to 11 months Children 12 to 59 months
Figure 9: Vitamin A Supplementation

18
Nutrition status
Proportion of children who are severely and moderately malnourished in July were 3 and
7.2 percent respectively (Figure 10). The prevailing rate is 58 percent below the short-
term average rate of malnutrition of 17
percent. The highest rate of malnutrition was in the pastoral livelihood zone and more
pronounced in Cherab ward, Merti sub-county. The main causes of malnutrition in
the county include food insecurity, sub
optimal young child feeding and care practices, poor dietary diversity, poor
hygiene and sanitation leading to epidemic prone illnesses that have an effect on
nutritional status, migration patterns and low access to essential nutrition services. There were
marginal differences across the livelihood zones.
Admission and program trends
New admission trends increased marginally
in 2021compared to 2020. For the program
trends there was a decrease of 50 percent in Outpatient therapeutics feeding in 2021
when compared to 2020 due to program defaulting. The decrease in admissions can
be attributed to improved health seeking
behavior arising from family MUAC interventions in 17 community units. There
was an increase of 34 percent in admission trends for supplementary feeding attributed
to improved health seeking behavior among
the households and reduction in Covid-19
stigma.
3.3.5 Public Interventions, Risk communication and Community level Actions
Health and Nutrition Sector COVID -19
The continuous sensitization and awareness creation on Covid-19 has helped reduce most of challenges that were associated with Covid-19 as experienced in 2020 compared to 2021. Service
delivery continues through the various platforms such as static health facilities, Community Health strategy and Outreach services. However, social distancing, face masking, access to water and low
uptake of the vaccines continue to hinder control and preventive measures.
The health sector and other stakeholders put efforts in mitigating the effects of the pandemic on access of essential health and nutrition services in the following ways; continued sensitization of health
workers, CHV’s and the community; distribution of essential supplies (PPE’s) to CHV’s; training of caregivers on home-based screening for acute malnutrition; routine coordination forums on health
and nutrition and rollout of Covid-19 vaccination targeting essential service providers
Social safety programmes
There are a number of social safety net programs implemented in the county to improve nutrition status with the support of the following partners implement;
13.2% 12.3%
18.2%
13.8%
9.2%
16.7%
1.7% 1.2%
3.3%2.6%
0.7% 1.50%
2015 2016 2017 2018 2019 2020
Trends in prevalence of SAM and GAM; Weight for height z-score
GAM (%) SAM (%)
Figure 7: Trends in prevalence of SAM and GAM
Figure 10: Proportion of children under risk of malnutrition

19
• Cash transfers by NAWIRI- 1,300 Households
• Action Against Hunger- 1,150 Households
• WFP-1,700 Households
• Cartitas-800 Households
• FAO/MID-P-1,000 Households where households with members with acute malnutrition are
included.
3.3.6 Coordination and leadership in Covid-19 pandemic preparedness and response
There exists various coordination mechanisms in the County domiciled within Department of Health and other sectors. The County Nutrition Technical Forum is functional at County level, meetings are
held on a quarterly basis while at the Sub County level, meetings are held on a monthly basis.
There exists a Multi Stakeholder Platform for Nutrition that brings together relevant sectors and partners in support of Food and Nutrition Security in the County. The MSP is functional and
coordinated by the Office of the County Secretary with meetings held on quarterly/Monthly basis as stipulated in the TOR for the various levels. Nutrition is represented in the County Covid-19
Response TWG that meets on an ad hoc basis to discuss issues related to COVID response. Meeting
is chaired by Director of Health.
3.3.7 Sanitation and Hygiene
According to Isiolo Nutrition smart survey done in February 2020 there was a significance increase
in proportion of households practicing open defecation across the county at 24.4 percent while 64.6
percent households have access to latrines. According to the survey about 27.2 percent of households
in the county treat drinking water, with use of chemicals being the most commonly used method at
74.9 percent, boiling at 31.3 percent, use of traditional herbs at 0.6 percent and pot filters at 2.2
percent. The little water available in water pans and rivers is contaminated and needs treatment before
household consumption. Water from shallow wells is also contaminated because most of the shallow
wells are not protected and rivers are polluted by humans where they wash clothes and take bath
directly from the river while animals also drink water directly from the river. Majority of the
boreholes have salty water in varying degrees.
3.4 Trends of key food security indicators
Table 9: Food security trends in Isiolo County Indicator Short rains assessment, Feb 2021 Long rains assessment, July 2021
% of maize stocks held by
households (agro-pastoral)
12.3% 11.6%
Livestock body condition Cattle- Good
Sheep- Good
Goat- Good
Camel- Good
Cattle- Fair
Sheep- Fair
Goat- Fair
Camel- Good
Water consumption (litres
per person per day)
20 Pastoral – 5 to 7.5
Agro Pastoral - 20
Price of maize (per kg) 49 55
Distance to grazing 15.2 Pastoral – 16KM
Agro pastoral - 14KM
Terms of trade (pastoral
zone)
71 60
Coping strategy index 8.3 11.83
Food consumption score 76.8 Acceptable – 74.4
Border line – 20.6
Poor – 5.0

20
3.5 Education
3.5.1 Enrolment
Enrolment of boys in ECD increased by four percent while that of Girls increased by five percent
reflecting an overall average increase of 4.5 percent in May when compared to January 2021. In
primary school level, there was an increase in enrollment of five and six percent among boys and
girls respectively which reflected an overall average increase of 5.5 percent. The same trend was
observed at the secondary school level where enrolment increased by two percent for both boys and
girls. The reasons for increases in enrollment for both boys and at the ECD level were attributed to
availability of school feeding programmes and CSB porridge. Increases in enrolment in primary
schools for both boys and girls was due to presence of school feeding program and transfer from
private to public schools from within and outside the county as result of decreased household
incomes. At the secondary school the observed slight increase in number of boys and girls in schools
can be attributed to transfers of students from boarding schools in other counties to local day schools
to the county due to high cost of education in the boarding schools.
3.5.2 Effect of Covid-19 on Schools
The adherence to MOH Covid-19 protocols of wearing face masks, social distancing and hand
washing was between 50 to 80 percent at all levels. Wearing of face masks was at 50, 60 and 80
percent at ECD, primary and secondary school respectively. Implementation of social distancing
protocol was at 50 percent in ECD and Primary schools and 60 percent at secondary schools while
hand washing was at 60, 50 and 70 percent at ECD, primary and secondary school respectively.
3.5.3 Effects of 2021 Long Rains on Schools
The 2021 long rains received in the county were very depressed across the livelihood zones. However, seven schools (6 primary and 1 secondary) experienced some damages occasioned by
strong winds and floods which were experienced in some parts of the county. At Iresaboru primary school in Garbatulla, experienced flooding that was caused by overflow of water from R. Ewaso
Nyiro. At Kinna primary school in Kinna ward in Garbatulla, roofs for 2 classrooms were blown off
by wind. Another Sub county affected by floods and heavy wind was Isiolo where at Wabera ward one roof of a primary school was blown off by wind and 2 others flooded. Another school at
Oldonyiro had also its roof top blown off as well. The effect of these phenomena was destruction of stationary (books and reading materials), collapse of semi-permanent classrooms and deposition of
mud in schools making them inaccessible by both teachers and learners. There was no school in the
county sheltering IDPS.
3.5.4 School Feeding
The number of schools in the county providing ISMP School feeding programmes were 116 which
benefited 29778 learners (14,415 boys and 15,363 girls). On the other hand a total of 15415 ECDE
learners (7696 boys and 7719 girls) from 158 ECDE’S in public primary schools accessed porridge
and shared meals with their colleagues in primary schools. In secondary schools, 5313 students (2535
boys and 2778 girls) from day schools had meals supported by their guardians through In-kind school
meals programme.
The school meals had a positive impact on access, participation and retention in the county because
it resulted to improved performance, increased attendance across all levels, increased enrolment at
ECD and lower primary schools levels, reduced age of entry into schools and led to higher percentage
of retention and completion across all levels. All public primary and secondary schools had meals
programme. However 158 Public ECDE Centres with an enrolment of 15415 learners (14415 boys

21
and 15363 girls) did not have any meals programme but depended on the SMP from the Ministry of
education.
About 228 (130 boys and 58 girls) students in secondary schools across the county missed meals as
they could not afford the parents supported meals programme. In the provision of school meals
programmes the county faces several challenges as enumerated below:-
Transportation of food. Due to vastness of the county, transportation of food from the county headquarters to sub counties and to schools is very high.
Spoilage of food due to poor storage in schools. Most stores are in poor state, hence rice sometimes is destroyed.
Theft of school meals. Due to insecurity food is lost due to theft for example, in May and June 2021,
5 Schools in Burat ward lost food worth Kshs.180, 000 due to theft cases. In secondary schools, most students could afford to pay for food due to drought and loss of livelihood
by the guardians. The county did not receive cash transfers to schools to finance school meals, however all public schools were receiving FPE capitation funds. In secondary schools all the 26 day
schools has an In-kind School meals programme supported by parents. However, the county does not
have any community supported programme due to high poverty levels. Expanded school meals programme to cater for ECDE pupils and secondary schools is recommended to ensure retention and
transition in schools. Storage of food should also be enhanced as the stores in the primary schools are in bad state leading to food spoilage.
3.5.5 Inter-sector links
Water Sanitation and Hygiene (WASH)
The available WASH facilities within the schools in the county were inadequate in meeting the needs
of the learners. At the ECD level 84 centres in Chari, Cherab, Kinna and Oldonyiro were depending on latrines in primary schools which to some extent were not age friendly while 29 primary and nine
secondary in the same areas had inadequate latrines. Nine primary schools and one secondary lacked handwashing facilities across the county. The number of schools with no access to safe drinking water
(functional source within 100m radius) were 21 at ECD, 21 at primary school level and 6 at the
secondary school level in Sericho, Chari, Cherab and Oldonyiro.
Menstrual support/dignity kits for school going girls
All primary schools received sanitary towels in January 2021 from the Government. Other
organizations that provided the dignity kits included- World vision, Mercy corps, Pacesetters and
Beyond zero. The provision of dignity kits reduced absenteeism, drop outs, improved girls esteem,
encouraged participation in co-curricular activities and enhanced academic performance. Due to the
depletion of pasture in Oldonyiro grazing areas, attendance of pupils to schools was affected as pupils
followed animals from Oldonyiro to Merti, Laikipia and Baringo counties. A school such as Nooloroi
had 33 out of 77 pupils absent due to nomadism. In Cherab, Urula primary school had closed down
due to insecurity and all learners settled in Dadachabasa primary school. This led to congestion and
pressure on the existing facilities.
4.0 FOOD SECURITY PROGNOSIS
4.1 Prognosis Assumptions • Based on NMME and WMO forecasts, the October-December 2021 short rains season is most
likely to be below-average with an onset beginning in late October accompanied with high
average temperatures
• The forecasted below-average October to December short rains are expected to provide only
short-lived improvements in rangeland resources followed by a rapid degradation driven by

22
overgrazing and above-average temperatures through January 2022. The continued high temperatures are expected to drive a rapid deterioration of rangeland resources
• Livestock migration are expected to increase in incidences of livestock disease outbreaks and
resource-based conflicts where livestock congregate in large numbers. Low livestock
conception and birth
• Birth rates are expected from mid-November, driving below-average household milk
availability and related income.
• Sustained high food prices and low livestock prices due to depressed crop production and
further deterioration of livestock body condition
5.2 Food Security Outlook
Food Security Outcomes for August, September and October 2021
Below average total household income is expected driven by below-average livestock prices, along
with below-average milk sales and off-farm casual labor. The accelerated deterioration of rangeland
resources and increased livestock trekking distances will result to further decline in livestock body
condition and productivity, driving more intensified migration to dry season grazing and also
migration further into neighboring counties. Household milk availability and consumption will
decline with the deterioration in livestock body conditions, as increased migration reduces livestock
prices and milk access. Food Consumption is expected to deteriorate considerably in the next three
months as food availability and access challenges deepen due to expected rise in staple food price
and declining purchasing power in all livelihood zones. Households are also likely to increase
consumption-based coping strategies like reducing the number of daily meals, eating less preferred
foods, limiting adult intake for children to eat, and borrowing food from friends and relatives. From
August, households will likely intensify the application of stress and crisis livelihood coping
strategies such as the sale of more animals than usual and reducing health expenditure. As the drought
conditions persist, households are expected to depend on emergency safety nets to mitigate the below-
average food and income levels. Households are also expected to increase their dependence on
purchasing food with credit, support from government safety nets, and emergency food assistance.
Humanitarian assistance is expected to continue as vulnerable and food-insecure households are
supported by a combination of national and county governments and humanitarian agencies. Maize
prices and prices of other food commodities are expected to remain above the long term average due
to the depressed harvests experienced during the season that has driven household stocks to far below
the long term averages. There are high expectation of outbreak of Kalazaar, a disease associated with
fly bites on people roaming around previously swampy areas. Diarrhoea ailments could rise
especially in areas where households are still accessing water from water pans, unprotected sand
dams and shallow wells. Consequently, the reducing amounts of water available for consumption
may negatively affect personal as well as household hygiene. The nutrition status of children under
5 years will continue to deteriorate further as a result of declined milk consumption occasioned by
an intensified livestock migration. Acute malnutrition is expected to remain Critical due to reduced
milk access during the anticipated longer dry period.
Outlook for November to January
The forecasted below-average October to December short rains are expected to provide only short-
lived improvements in rangeland resources followed by a rapid degradation driven by overgrazing
and above-average temperatures through January 2022. The continued high temperatures are
expected to drive a rapid deterioration of rangeland resources. The productivity of the livestock will
sink further, as the poor environmental conditions will find already weak animals and depleted
sources of water for watering of livestock and humans. The body conditions of the animals will not

23
achieve any substantial level of recovery, as there will be no forage which might result in livestock
deaths. The ensuing scenario will worsen milk production towards negligible amounts. Food
consumption at the household level will worsen owing to the stressed productivity of all livestock
species and depressed crop production, where purchasing power will be expected to significantly
eroded. The further emaciation of livestock will drive market prices to be below than normal. This
will exacerbate the inability of households to obtain sufficient food to meet daily dietary
requirements. Households will employ severe coping strategies, the food-based strategies and the
livelihood coping strategies. Nutrition status due to failure to obtain sufficient food for all members
of the households, is likely to increase the rate of malnutrition might during the period. Death of
livestock will be highly anticipated and is expected to begin as a result of persistent forage and water
shortage. The price of food commodities will continue to be above the long term averages.
5.0 CONCLUSION AND INTERVENTIONS
5.1 Conclusion
5.1.1 Summary of findings
The 2021 long rains started late and ceased in the 2-dekad of May which was earlier than normal.
The performance was characterized by poor temporal and spatial distribution. The average rainfall
experienced was depressed, ranging from 5 to 75 percent of the normal amounts. The impact of the
rains on pasture and browse was sub-optimal. The ensuing regeneration of natural vegetation was
poor especially at the traditional grazing areas implying the forage was quickly exhausted triggering
internal and external livestock migrations earlier than normal. Water scarcity is affecting normal
livelihood production as a result of poor surface and underground water recharge to both permanent
and temporary water sources. The inadequate recharge has led to adoption of rationing schedules
affecting several locations across the livelihood zones to allow substantial amounts to be available
for domestic as well as livestock without causing conflicts among the various category of users.
Majority of residents especially in the pastoral and agro-pastoral livelihood zone did not treat water
before drinking therefore standing an increased risk to water borne diseases.
Crop production was greatly affected by the depressed performance of the rains which led to massive
crop failures, both for cereals and legumes. The failure was exacerbated by poor recharge to rivers
and temporary sources of water leading to low volumes, implying that small scale irrigation along
rivers, had to be scaled down, forcing earlier than normal water rationing. There was poor harvests,
a factor that led to few stocks than normal of staple foods held by households and other agents. Attack
of crops by Fall Army Worms, more so cereal crops contributed to the poor harvests realized.
The implication of prevailing terms of trade of 60kg for a sale of a medium sized goat being
marginally above the long-term average is that households have moderately weak purchasing power.
Their ability to access the required food basket in required diversity is fair and expected to
significantly to decline thus affecting food consumption. A considerably good proportion of the
households 70.5 percent in pastoral livelihood zone, had acceptable food consumption, an indication
that they are able to take meals at an acceptable frequency comprising of cereals served with
vegetables, high value proteins. At the same time, 21.1 percent of the households had a borderline
food consumption. The other 8.4 percent who had poor consumption, skipped meals sometimes for
an entire day and consumed cereals with vegetables and tea occasionally. The current reduced coping
strategies index (CSI) stands at 11.8 and is slightly above last year’s index of 10.9. This is more
pronounced among herding households whose access to food is limited to due to poor access to

24
livestock and food commodity markets. The level of consumption contributed partially to the
prevailing rate of malnutrition at 10.6 percent (classified as Serious –Using IPC Acute Food
Insecurity Reference Table) among children (under 5-years) is worrying and needs further attention
to ascertain and respond where possible.
5.1.2 Phase Classification
The county is therefore classified at Integrated Food Security Phase Classification, “Crisis” IPC 3.
5.1.3 Sub-county Ranking
The sub-county ranking indicates the level of the severity of food security in various sub counties
with the sub county ranked number one (1) having the more severe food insecurity situation.
Table 10: Sub-County and Ward Ranking
Sub-County Rank Reasons
Merti 1 Insecurity at border points with Wajir
Poor road network
Invasive species I.e prosopis juliflora
Water scarcity and poor underground water potential
High rate of malnutrition among children
Garbatulla 2 Water sources are dry
Distance and access to markets are poor
Insecurity
High cases of malnutrition
Water scarcity and poor underground water potential
Isiolo 3 Received low rainfalls than
Poor pasture condition
Insecurity
Ward Rank Reasons
Cherab 1 Insecurity
Poor road network
Invasive species I.e prosopis juliflora
Water scarcity and poor underground water potential
High rate of malnutrition among children.
Sericho 2 Water sources are dry
Distance and access to markets are poor
Insecurity
High cases of malnutrition
Water scarcity and poor underground water potential
Oldonyiro 3 Land degradation
Poor access to health facilities
No irrigation water
Quality of water is also poor.
Poor underground water potential
Charri 4 Poor access to markets
Water scarcity
Insecurity

25
Garbatulla 5 No access to markets due to collapse of markets
Prone to resource-based and border conflicts
Poor road networks
Risk of crop failure because R. Ewaso Nyiro is dry.
Kinna 6 Food security
Insecurity.
Poor access to health facilities
High influx of livestock
Ngaremara 7 Received more rainfall than Burat
Conservation of pasture is good in Ngaremara because of the
conservancies
Insecurity
High influx of livestock
Burat 8 Received low rainfalls than Cherab as compared to normal
Poor pasture condition
Insecurity
High illiteracy levels
Central
(wabera &
B/Pesa
9 High unemployment rate
5.2 Ongoing Interventions
5.2.1 Food Interventions
There are a number of social safety net programs implemented in the county to improve nutrition status with the support of the following partners implement;
• Cash transfers by NAWIRI- 1,300 Households
• Action Against Hunger- 1,150 Households
• WFP-1,700 Households
• Cartitas-800 Households
• FAO/MID-P-1,000 Households where households with members with acute malnutrition are included.
5.2.2 Non-Food Interventions
Agriculture Sector (Crop Production)
Immediate interventions
Sub
County
Intervention Ward No. of
benefici
aries
Proposed
Implementers
Required
Resources
Available
Resources
Time
Frame
Isiolo,
Merti
Garbatula
Provision of certified
seeds
All 10
wards
12000 County Govt
National Govt &
WFP, We World,
FAO, KCSAP
Funds
[15M]
1.5M Aug-Sept
2021
Isiolo
Merti
Garbatula
Crop Pests and
decease control
All 10
Wards
12000 County Govt
National Govt &
WFP, We World,
FAO, KCSAP
Funds
chemicals
2m - Aug.-Dec.
2021

26
Isiolo
Merti
Garbatula
Farmers training on
crop husbandry and
post- harvest
management
All 10
wards
3M County Govt
National Govt &
WFP, We World,
FAO, KCSAP
funds 2M Aug-
Dec.2021
Isiolo
Merti
Garbatula
Rehabilitation of
irrigation canals
All 10
wards
6000 County Govt
National Govt &
WFP, We World,
FAO, KCSAP
funds 6M Aug-Sept
2021
Isiolo
Merti
Garbatula
Enhancement of
tractor services
All 10
wards
12000 County Govt
National Govt &
WFP, We World,
FAO, KCSAP
funds 3M Aug-sept
2021
Isiolo
Garbatulla
Merti
Farmers compensation
for crops destruction
by wildlife
All 10
wards
2000 Kenya wildlife
services
funds 1OM Aug.2021
Isiolo
Merti
garbatula
Installation of
sanitizer booths water
tanks and soap in
markets
All wards 50000 County Govt
National Govt &
WFP, We World,
FAO, KCSAP
funds 10M Aug.2021+
Medium term/Long-Term Interventions
Garbatulla,
Isiolo,
Burat
Nutrition sensitive
interventions
Promotion of drought
tolerant crops, orange-
sweet potatoes, Iron
rich beans
OLDONY
IRO
BURAT
Ngaremar
a
6,500 Count Government
WFP,
KSAP
40m 3m 2022
Garbatulla,
Isiolo
Capacity building of
farmers and extension
staff
OLDONY
IRO
BURAT
Ngaremar
a
10000 Count Government
WFP,
KSAP
6m 0.5m 2022
Isiolo
Water harvesting for
irrigation
OLDONY
IRO
BURAT
Ngaremar
a
8000 Count/National
governments,
WFP, KSAP
Funds
(300M)
10m 2021+
Garbatula Water harvesting for
irrigation
Kina
Sericho
Garbatula
3000 County/National
Governments,
WFP
Funds
(300M)
8m 2021+
Merti Water harvesting for
irrigation
Chari
Cherab
1000 County Govt
National Govt
Funds
(200M)
2m 2021+
Livestock Sector (Livestock production)
Ongoing Interventions
Cou
nty
Sub County Intervention No. of
beneficia
ries
Implementers Impacts
on food
security
Cost (
Kshs)
Time
Frame
IMMEDIATE

27
Isiol
o
Isiolo/ Garbatlla
Merti
Disease surveillance all County Govt,
DRIC (VSF)
ILRI/FAO
Isiolo/
Garbatlla/Merti
Vaccination against PPR,
CCPP, sheep and goat pox
1500H/H RPLRP/KCSA
P/ FAO/VSF
Isiolo
Garbatulla
Supporting of vulnerable
households with pullets
(5000)
1000 FAO/VSF
Isiolo / garbatulla Training camel producers and
other actors on milk hygiene
300H/H VSF/Biovision/
livestock dept
Isiolo/Garbatulla Training of community
disease reporters
100 VSF/WFP/ILR
I
MEDIUM AND LONG TERM
Isiolo/Merti/Garb
atulla
Development of rangeland
management policy and bill
All NRT, VSF,
WFP, county
government
Isiolo Completion and
operationalization of Isiolo
abattoir
all County
government,
KCSAP
Isiolo/Merti/Garb
atulla
Fodder production and
marketing
10,000
H/H
County Govt,
VSF, WFP
Water Sector
Sub
County
Intervention
Ward/Loc
ation
No. of
beneficia
ries
Implemente
rs
Impacts in
terms of
food
security
Cost
Time
Fram
e
Implementati
on Status (%
of
completion)
Immediate On-going Interventions (Water)
Isiolo
Sub
County
Extension of pipeline
from water sources to
control congestion
and to improve access
Ngaremara
(Aukot,
Shambani)
1000 World
Vision, Red
Cross, Water
Dept
Improved
access to
water
14m
(Shambani
)6m
(Aukot)
Augu
st
2021
60%
(Shambani)
90% (Aukot)
CHERA
B
-Water trucking Korbesa,
Malkagalla
, Saleti,
Biliqi noor
6,000 Water Dept Alternative
access to
water for
HH use
40m Marc
h-
June
Intervention
stopped
temporarily
due to lack of
funds
-Repair &
maintenance of
Boreholes
Alango 1,200 Water
dept
Improved
access to
water HH
0.8m June-
July
Ongoing
CHARI Repairs &
maintenance of
boreholes and the
pipeline
Bisan
Biliqo,
Bulesa
6,000 Water Dept Improved
access to
water HH
1.5m June-
July
Ongoing

28
Garbatull
a
Digging and
equipping of
Diredima shallow
wells
Garbatulla 800 Dedha
(grazing
committee)
Community
Improved
access to
water HH
and
Livestock
1m May-
Septe
mber
80% complete
and ongoing
Medium and Long term on-going interventions
Cherab Work on Merti-
Matarba-korbesa
water pipeline 23km
Matarba-
Saleti-
Korbesa
4,500 NDMA,
County Govt
and Nothern
Water
Works
Improved
access to
water for
HHs
40m Jan-
Augu
st
80% complete
Cherab Drilling and
equipping of Lakole
borehole
Lakole 3000 We World
(DRIC), CGI
Improved
access to
water for
HHs
7.5m May-
Septe
mber
At planning
stages
Garbatull
a
Acquisition and
installation of water
meters at households
level
Kinna 400 Water Dept. Improved
water
manageme
nt and
control
1.2m Augu
st
2021
60%
Health and Nutrition
Sub county Intervention
Location No. of
beneficiaries
Implementers Estimated
Cost (Ksh) Time
Frame
Male Femal
e
Isiolo,
Merti,
Garbatulla
Vitamin A
Supplementation
All health
facilities
14467 14295 MoH and
implementing partners
650000 Ongoing
Isiolo,
Merti,
Garbatulla
Zinc
Supplementation
All health
facilities
1950 1873 MoH and
implementing partners
0 Ongoing
Isiolo,
Merti,
Garbatulla
Management of
Acute
Malnutrition
(IMAM)
All health
facilities
1990 1912 MoH and
implementing partners
120000 Ongoing
Isiolo,
Merti,
Garbatulla
IYCN
Interventions
(EBF and Timely
Intro of
complementary
Foods)
All health
facilities
8008 8153 MoH and
implementing partners
100000 Ongoing
Isiolo,
Merti,
Garbatulla
Iron Folate
Supplementation
among Pregnant
Women
All health
facilities
7192 MoH and
implementing partners
500000 Ongoing
Isiolo,
Merti,
Garbatulla
Deworming All health
facilities
12679 12181 MoH and
implementing partners
0 Ongoing
Merti Sensitizations of
CHVs and
community on
Covid-19
All villages MoH, ACF 1000000 Complet
ed
Isiolo,
Merti,
Garbatulla
Surveillance
through family
MUAC in
10 NDMA
sentinel
1300 1300 MoH, NDMA, KRCS,
UNICEF, ACF
1400000 Ongoing

29
NDMA sentinel
sites and
malnutrition
hotspots
sites and 17
CU’s
Education
Sub-county Ward Intervention Locati
on
No. of
beneficiaries
Impleme
nters
Impacts in terms of
food security
Timefram
e
Isiolo,
Merti,
Garbatulla
ALL Expansion of School
Meals Programme by
introduction CSB
porridge for ECDE Pupils
in public schools
All 15415 GoK
through
WFP and
MOE
Regular attendance
as pupils are assured
one more meal, early
entry to school
6 months
Isiolo,
Merti,
Garbatulla
ALL Provision of Masks All 49428 MOE Reduced cost in
health
once
5.3 Recommended Interventions
Agriculture Sector
Livestock Sector
a. Measures to mitigate the effects of the COVID- 19
• Provision of more sanitizers and face mask to traders and producers
• Provision of water tanks and hand washing facilities in markets, slaughter houses
• Provision of some grants to traders to expand their business or start new ones
• Support producers with some incentives e.g transport subsidies to enable them market their
animals
Sub
County
Intervention No. of
benficiari
es
Proposed
Implementers
Required
Resources
Available
Resources
Time
Frame
Immediate Interventions
Isiolo/
merti,
Garbatulla
Provision of protective and
personal effects
8,000 County Govt and
development partners
30 million -
Isiolo/
merti,
Garbatulla
Provision of grants to
vulnerable household to
start business
2000HH County Govt and
development partners
50 million -
Isiolo/
merti/
Garbatulla
Provision of grants to
producers to help them in
marketing of livestock
1800HH County Govt and
development partners
60 million
Isiolo/Garb
atulla/Merti
Provision of water tanks
and hand washing facilities
in markets, slaughter
houses
15 million County Govt and
development partners
Medium/Long term interventions

30
Isiolo/
merti/
Garbatulla
Provision of Supplementary
feeds to core breeding stock
10,000 County Govt and
development partners
20million 0 August
2021
Isiolo/
merti/
Garbatulla
Commercial destocking 6000 County Govt and
development partners
10 million 0 August –
sept 2021
Isiolo/
Merti
Garbatulla
Vaccination, deworming,
treatment
20,000 County Govt and
development partners
6 million vaccines August
2021
Isiolo/
Merti
Garbatulla
Continuous disease
surveillance
all County Govt and
development partners
1million continous
Isiolo,
Merti,
Garbatulla
Peace meetings and
protection of strategic
boreholes
all Ministry of interior ,
county Govt and
partners
3million Personnel continous
Water Sector
Sub
county
Interventions Ward/Loca
tion
No. of
beneficia
ries
Proposed
Implementers
Required
Resources
Available
Resource
s
Time
Frame
Immediate recommended interventions
Isiolo
Sub-
county
Water trucking to
Tuale in Oldonyiro
ward
2,000
persons
County
Government
6m Technical
teams
available
FY
2021/202
2
Garbatul
la
Purchase of fast
moving spare parts
i.e piston rings,
filters
Kinna,
Sericho and
Garbatulla
8,000
HHs
County and
National govts
and partners
3m Technical
team
available
July-
Septembe
r 2021
Garbatul
la
Purchase of water
trucking fuel
Sericho
(Modogash
e)
5,000
HHs
County and
National govts
and partners
1m 0 July-Sept
2021
Garbatul
la
Purchase and
Distribution of
jericans (already
provided by
UNICEF)
Garbatulla,
Kinna and
Sericho
15,000
HHs
County, National
Govts & WASH
Partners
0.6m 0 July-Sept
2021
Cherab Support Water
Trucking
Korbesa,
Saleti,
Malkagalla,
Riga,
Matarba,
Biliqi noor
8,000 Dept. of Water 30m Nil July to
Septembe
r 2021
Cherab Repair and
Maintenance
Beltume,
Duma
5,000 Dept of water 2m Nil July to
Septembe
r 2021
Cherab Stand by
Generators
Duma,
Betume and
Yamicha
4,000 Dept of water 6m nil July-Oct
2021
Cherab
and
Charri
Fast moving spare
parts (filters, piston
rings, gaskets,
sanction pipes)
For all
boreholes
10,000 Dept. of water,
partners
3m Nil July to
October
2021

31
Medium and Long Term recommended Interventions
Isiolo
Sub
County
Rehabilitation/repa
ir of existing water
supplies to improve
overall
performance
Oldonyiro,
Ngaremara
Burat,
Ngaredare
10,000
persons
County /
Regional/
National level
WASH partners
15m Technical
teams
available
FY
2021/202
2
Fencing Kiwanja.
Kizito,
Daaba
5000 County /
Regional/
National level &
WASH partners
6m Technical
teams
available
FY
2021/202
2
Overhaul of
serviceable
generators
Burat 1 County Govt and
WSH Partners
2m 0 FY
2021/202
2
Merti Drilling of
boreholes
Barambate
in chari
ward
2000 Dept of water &
partners
7.5m 0 July-
December
2021
Drilling and
equipping of Mata
sadhe
Charri 1000 Dept of water &
partners
7.5m 0 July –
December
2021
Garbatul
la
Rehabilitation/repa
ir of existing water
supplies to improve
overall
performance
Sericho,
Kinna
10,000
persons
County /
Regional/
National level
WASH partners
10m 0 FY
2021/202
2
Kinna Civil works (repair
of leaking tanks
Kinna
(kulamawe)
8,500
HHs
CGI & Partners 0.3m 0 FY
2021/202
2
Health and Nutrition
Immediate Recommended Interventions
Sub
Count
y
Intervention Location No. of
benefici
aries
Proposed
Implementers
Required
Resources
Available
Resources
Time
Frame
Count
y wide
Scale up family
MUAC in 23
community units
Isiolo, Merti
and
Garbatulla
25000 MoH & partners
(UNICEF,ACF,
KRCS).
5,000,000 0 6
months
Count
y wide
Mass screening in
malnutrition
hotspots
Oldonyiro,
Cherab,
Ngaremara,
Burat,
Sericho
15000 MoH, and other
partners
3500000 0 6
months
Count
y wide
Strengthen
micronutrient
supplementation
(Zinc, IFAS,
MNP’s,
Deworming)
56 HF’s 41535 MoH, and other
partners (UNICEF,
ACF , CRS,
CARITAS, K-
RAPID)
1,200,000 0 6
months
Count
y wide
Strengthen
coordination
mechanism at Sub
County level
Isiolo, Merti
and
Garbatulla
GoK 360,000/- 0 6
Months
Count
y wide
Capacity building
of Health workers
MIYCN-E,
56 HF’s Training
- 80
HW’s
MOH and other
implementing
partners UNICEF,
KRCS
2,400,000 0
Count
y
Strengthen
Nutrition
Advocacy
County 60 Pax MOH and other
implementing
partners
700,000 0 6
Months

32
Medium and Long term Recommended Interventions
Count
y wide
Intensify CLTS
initiatives
31 H/H 189000 MoH & partners
(UNICEF, ACF,
CRS, CARITAS,
ADS, WVI and
NDMA
1000000 0
Count
y wide
Supply and
distribution of
water treatment
chemicals – Pur,
Water guard, water
maker and clorine
tablet
Waso, Tuale,
Oldonyiro,
Biliqi,
Badanararo,
Malkagalla,A
warsitu,
Saleti,
Mataarba,
Fororsa,
Belgesh,
Gubadida,
Duse,
Malkadaka,K
orbesa
MoH & partners
(UNICEF, CRS,
CARITAS, ACF,
ADS, WVI etc)
18,000000 0 3
months ,
Education
Sub-
county
Wa
rd
Intervention No. of
schools
No. of
targeted
beneficiari
es
Proposed
Implementers
Requir
ed
Resour
ces
Kshs
Availabl
e
Resourc
es (Kshs)
Resourc
e Gap
Kshs
Time
frame
Isiolo All Expansion of
School Meals
Programme to
include all
ECD pupils
84 3187 Boys
3062 Girls
6249 Total
County Govt
of Isiolo, Moe,
World vision,
Unicef, Action
Aid
10 m @
year
nil 10 m Long
term
Isiolo All Increased
allocation for
bursaries to
support
secondary
school lunch
programmes
32 2903 Boys
2981 Girls
5884 Total
County Govt
of Isiolo, NG
CDF, NGOs-
NRT.ACTIO
N AID’ VSO,
UNICEF
%other
partners
15
million
@ year
Nil (for
current
year)
15
million
Long
term
Isiolo All Construction
of additional
classrooms
30 C/rooms
in secondary
72 classroom
in primary
4590
pupils
MOE, NGOs
and partners
100
million
Nil 100
million
Long
term
ISIOL
O
AL
L
Training of
learners,
teachers and
school
management
on
implementatio
n of covid19
protocols
49428
learners
MOH,
MOE,TSC,U
NICEF.WOR
LD VISION
200000 NIL 1M Contin
ous
ISIOL
O
AL
L
Reinforcement
of security of
SMP stores to
prevent theft
of food stuffs
116 29778
pupils
MOE’ World
Vision. Unicef
& other
partners
10m NIL 10M Long
term

33
isiolo AL
L
Provision of
water
harvesting and
storage
facilities.
50 schools 5000
pupils
World Vision,
We world,
County Govt
& other
partners
5m Nil 5m Long
term