Food Security Metrics
101
Preliminary Recommendations for the Hawaii Food Security Metrics System Project Prepared for the Hawaii Department of Agriculture By Sustain Hawaii August 6, 2014
-
Upload
independent -
Category
Documents
-
view
1 -
download
0
Transcript of Food Security Metrics

Preliminary Recommendations for the Hawaii Food Security Metrics System Project
Prepared for the Hawaii Department of Agriculture
By Sustain Hawaii
August 6, 2014

This page was left blank intentionally.

i
1 Introduction
1.1 Project Purpose and Goal The objective of the Hawaii Food Security Metrics System Project is to develop benchmark indicators
that will determine the State’s level of food self-reliance. These indicators will provide simple, useful
statistics related to production capacity, food production, the movement of food, and food
consumption, providing easy comparisons across commodities and products. The indicators should
provide policy makers and the community with the information necessary to discuss and decide on
goals, benchmarks, policies, and programs.
The Hawaii Food Security Metrics System Project is funded by the Ulupono Initiative and administered
by the Hawaii Department of Agriculture (HDOA), which contracted with Sustain Hawaii to develop the
Hawaii Food Security Metrics System as a web site. Ulupono and HDOA have indicated that the initial
focus of the system should be on local production, exports, imports, and local consumption, by weight
and income and disaggregated by food type and county when possible.
1.2 Report Purpose This report was developed during Phase 2 of the project. This report builds on the product of Phase 1,
which as a macro-level Literature Review of the field of food self-reliance. It summarized the theory and
practice behind food indicators, data sources, data collection methods, and data management and
visualization.
The purpose of this Phase 2 report is to provide recommendations related to:1
Benchmark indicators for products and commodities and that are most relevant to agriculture
in Hawaii
Sources of data for each indicator
Methods of data collection for each source of data
Additional analysis needed to convert available data into food self-sufficiency indicators
Flexible, expandable data collation and management systems
Data visualization tools to provide easy-to-use and -understand snapshots and comparisons of
benchmarks and goals.
After HDOA and Ulupono review this report and requested revisions are made, the findings from this
report will be vetted with food and agriculture stakeholders. Feedback from stakeholders will then be
used to prepare final recommendations. HDOA and Ulupono will then provide guidance for Phases 3
and 4 of the project – data collection, synthesis, and visualization as well as web site development.
1 Naturally, many of the sources referenced in the Phase 1 Literature Review were again used to develop
recommendations in this report, as noted in Section 3.1.

ii
1.3 Report Overview This report is organized into three main sections:
1) Introduction
2) Preliminary Recommendations, including:
a. Recommended metrics for Year 1 and beyond (pages 1 through 4)
b. Recommendations for data management, portals, and visualization (pages 5
through 6)
c. Some supplementary findings (pages 7 through 10)
d. Tables demonstrating the metric identification and prioritization process (pages 11
through 22).
3) The Appendix of Supporting Material starting on page 25 includes more detailed
information in support of the recommendations.
Works Cited are also included at the conclusion of the report. All sources used in the development of
this report are available in the Hawaii Food System Metrics Library (see page 28), which doubles as the
bibliography for this report
The hyperlinked Table of Contents below can be used to navigate the report. Within the body of the
report, hyperlinked cross-references are also used extensively to facilitate navigation among related
sections of the report, particularly between Section 2: “Preliminary Recommendations” and Section 3
“Appendix of Supporting Material.”

iii
1.4 Table of Contents 1 Introduction ........................................................................................................................................... i
1.1 Project Purpose and Goal .............................................................................................................. i
1.2 Report Purpose .............................................................................................................................. i
1.3 Report Overview ........................................................................................................................... ii
1.4 Table of Contents ......................................................................................................................... iii
1.5 Table of Figures ............................................................................................................................ vi
1.6 Table of Tables ............................................................................................................................. vi
2 Preliminary Recommendations ............................................................................................................. 1
2.1 Preliminary Metrics Recommendations: Year 1 and Beyond ....................................................... 1
2.1.1 Recommendations Logic ....................................................................................................... 1
2.1.2 Data Availability for Priority Metrics ..................................................................................... 3
2.1.3 Metric Prioritization .............................................................................................................. 4
2.1.4 Next Step: Vetting with Stakeholders ................................................................................... 4
2.2 Recommendations for Data Management, Portals, and Visualization ......................................... 5
2.2.1 Data Management ................................................................................................................ 5
2.2.2 Data Portals ........................................................................................................................... 5
2.2.3 Data Visualization.................................................................................................................. 5
2.3 Supplementary Findings ............................................................................................................... 7
2.3.1 Local Food in Hawaii ............................................................................................................. 7
2.3.2 Food Metrics System Options ............................................................................................... 8
2.4 Tables Supporting Recommendations ........................................................................................ 11
2.4.1 Data Availability .................................................................................................................. 11
2.4.2 Prioritization of Potential Metrics ....................................................................................... 17

iv
3 Appendix of Supporting Material ........................................................................................................ 25
3.1 Research Process and Resources ................................................................................................ 25
3.1.1 Hawaii Food System Metrics Workbook ............................................................................. 25
3.1.2 Identifying Available Data ................................................................................................... 28
3.1.3 A “Walkabout” among Hawaii’s Food System Stakeholders .............................................. 29
3.2 What We Know about Local Food Value Chains ......................................................................... 52
3.2.1 Products from local farms follow multiple, complex routes to consumers ........................ 52
3.2.2 Local food farms tend to be smaller ................................................................................... 53
3.2.3 Enterprise size influences product routes .......................................................................... 54
3.2.4 Revenue and product route are correlated ........................................................................ 54
3.2.5 Enterprise “values” also influence product routes ............................................................. 54
3.2.6 Three value chain “flows”: product, financial, and information ......................................... 55
3.2.7 Communicate food value chain flow and dynamics ........................................................... 55
3.3 Methods of Food System Assessment ........................................................................................ 57
3.3.1 Eight types of food system assessments have emerged .................................................... 57
3.3.2 Life cycle analysis is complex and expensive ...................................................................... 57
3.3.3 Freight movement analysis provides a macro-level picture, with limitations .................... 58
3.3.4 Local Food System Exemplary Projects ............................................................................... 60
3.4 Sources of Secondary Data for Local Food Systems ................................................................... 61
3.4.1 There is a wealth of sources – with limitations .................................................................. 61
3.4.2 USDA Data ........................................................................................................................... 62
3.5 Collecting Primary Data .............................................................................................................. 67
3.5.1 Previous Primary Data Collection by the HDOA .................................................................. 67
3.5.2 Options for Collecting Primary Data ................................................................................... 67
3.5.3 Filling Specific Secondary Data Gaps with Strategic Primary Data Collection .................... 68
3.6 Data Management ...................................................................................................................... 69
3.6.1 The Need for Data Management ........................................................................................ 69
3.6.2 Past Data Management Challenges .................................................................................... 69
3.6.3 Advances in Data Management .......................................................................................... 69
3.6.4 Recommended Data Management Platform ...................................................................... 69
3.6.5 Task at Hand: Metric Prioritization ..................................................................................... 70
3.6.6 Data Management Functions .............................................................................................. 70

v
3.6.7 Challenges Specific to Food Systems .................................................................................. 71
3.7 Making Data and Metrics Accessible .......................................................................................... 72
3.7.1 Data Portal Models ............................................................................................................. 72
3.7.2 Wide-Ranging Options for Data Visualization ..................................................................... 74
3.7.3 Recommendations for Data Accessibility ........................................................................... 75
3.8 Food and Agriculture Standards and Certifications .................................................................... 77
3.8.1 A range of regulations, certifications, and requirements impact local supply chains ........ 77
3.8.2 Food Safety ......................................................................................................................... 77
3.8.3 Values-Based Standards ...................................................................................................... 78
3.8.4 Cross-over Standards .......................................................................................................... 79
3.8.5 Certification Services ........................................................................................................... 79
3.9 Traceability in Local Supply Chains ............................................................................................. 81
3.9.1 Traceability would help with regulatory compliance.......................................................... 81
3.9.2 Traceability is also a market barrier .................................................................................... 81
3.9.3 Traceability is not currently widely practiced ..................................................................... 82
3.9.4 Internationally, regimes are being developed to measure and monitor agricultural
performance metrics .......................................................................................................................... 82
3.9.5 Traceability is feasible ......................................................................................................... 85
3.9.6 Some traceability systems are already available ................................................................ 85
3.9.7 Those initiatives might tie-in nicely with existing enterprise solutions for local farms...... 86
4 Works Cited ......................................................................................................................................... 87

vi
1.5 Table of Figures Figure 1: Metrics Pyramid ........................................................................................................................... 27
Figure 2: Local Food Market Demand Study Value Chain ........................................................................... 56
Figure 3: The Emerging Transparency Framework ..................................................................................... 83
1.6 Table of Tables Table 1: Preliminary Metrics Recommendations .......................................................................................... 2
Table 2: Summary of Production and Consumption Data Available (by weight) ....................................... 12
Table 3: Summary of Data Available for Production Expenses and Revenue and Consumption
Expenditures (in dollars) ............................................................................................................................. 13
Table 4: Summary of Data Available for Value Chain Components ............................................................ 15
Table 5: Metric Prioritization ...................................................................................................................... 17
Table 6: Metric Prioritization: Production and Consumption (by weight).................................................. 18
Table 7: Metric Prioritization: Production Expenses and Revenue and Consumption Expenditures (in
dollars) ........................................................................................................................................................ 19
Table 8: Metric Prioritization: Value Chain Components ........................................................................... 21
Table 9: Metrics Workbook Table of Contents ........................................................................................... 26
Table 10: Walkabout Notes......................................................................................................................... 33
Table 11: Local Food Marketing Options .................................................................................................... 53
Table 12: Summary of NASS Data Availability at the State and County Level ............................................ 62
Table 13: Food System Certifications .......................................................................................................... 77

Section 2: Preliminary Recommendations

This page was left blank intentionally.

1
2 Preliminary Recommendations
2.1 Preliminary Metrics Recommendations: Year 1 and Beyond Preliminary metrics recommendations are summarized in Table 1 on page 2. Those metrics proposed
for the initial 2015 Hawaii Food Security Metrics Report are distinguished from those recommended for
consideration in subsequent metrics reports. Subsequent reports would include updated versions of the
2015 metrics plus any supplementary metrics selected by HDOA and Ulupono.
The preliminary metrics recommendations include all of those prioritized by Ulupono (highlighted in
yellow). The recommendations for the 2015 report also include:
The Localization Ratio (% of local consumption produced locally) of major food groups, as an
important “big picture” metric
Metrics that provide important context to deliberations about food self-reliance, including a
tentative Localization Ratio “ceiling” and clarity about where key decisions are made about food
sourcing
A view into food insecurity and underlying issues of equity and economics
A snapshot of major components of the local food value chain, including agricultural land and
water, farms and farmers, and the path food follows from farm to fork.
As noted above, after revisions requested by HDOA and Ulupono are made, the report findings will be
vetted with food and agriculture stakeholders. Feedback from stakeholders will then be used to prepare
final recommendations.
2.1.1 Recommendations Logic
These preliminary recommendations are based on the following three-step analysis:
1. Available food system data were identified.
a. See Section 3.1 “Research Process and Resources” on page 25 for detailed information
about the research methods, which included both a review of related resources and a
“walkabout” among Hawaii’s food system stakeholders.
b. The research findings are summarized in Section 2.1.2 “Data Availability for Priority
Metrics” on page 3, and supporting detail is in the following tables:
i. Table 2: Summary of Production and Consumption Data Available (by weight) on
page 12
ii. Table 3: Summary of Data Available for Production Expenses and Revenue and
Consumption Expenditures (in dollars) on page 13
iii. Table 4: Summary of Data Available for Value Chain Components on page 15.
2
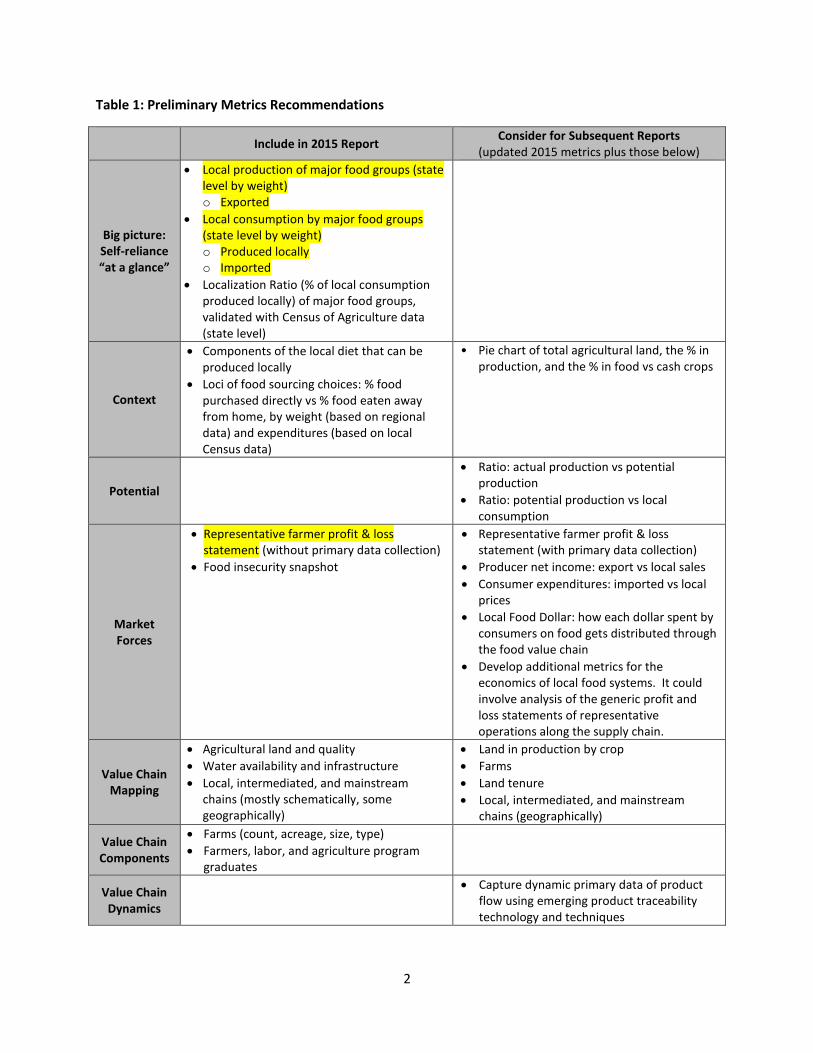
Table 1: Preliminary Metrics Recommendations
Include in 2015 Report
Consider for Subsequent Reports (updated 2015 metrics plus those below)
Big picture: Self-reliance “at a glance”
Local production of major food groups (state level by weight) o Exported
Local consumption by major food groups (state level by weight) o Produced locally o Imported
Localization Ratio (% of local consumption produced locally) of major food groups, validated with Census of Agriculture data (state level)
Context
Components of the local diet that can be produced locally
Loci of food sourcing choices: % food purchased directly vs % food eaten away from home, by weight (based on regional data) and expenditures (based on local Census data)
• Pie chart of total agricultural land, the % in production, and the % in food vs cash crops
Potential
Ratio: actual production vs potential production
Ratio: potential production vs local consumption
Market Forces
Representative farmer profit & loss statement (without primary data collection)
Food insecurity snapshot
Representative farmer profit & loss statement (with primary data collection)
Producer net income: export vs local sales
Consumer expenditures: imported vs local prices
Local Food Dollar: how each dollar spent by consumers on food gets distributed through the food value chain
Develop additional metrics for the economics of local food systems. It could involve analysis of the generic profit and loss statements of representative operations along the supply chain.
Value Chain Mapping
Agricultural land and quality
Water availability and infrastructure
Local, intermediated, and mainstream chains (mostly schematically, some geographically)
Land in production by crop
Farms
Land tenure
Local, intermediated, and mainstream chains (geographically)
Value Chain Components
Farms (count, acreage, size, type)
Farmers, labor, and agriculture program graduates
Value Chain Dynamics
Capture dynamic primary data of product flow using emerging product traceability technology and techniques

3
2. Potential food system metrics were prioritized.
a. See Section 2.1.3 “Metric Prioritization” on page 4 for a description of the process used
to prioritize metrics by importance and availability.
b. The outcomes of the prioritization process are summarized in the following tables:
i. Table 5: Metric Prioritization on page 17
ii. Table 6: Metric Prioritization: Production and Consumption (by weight) on page
18
iii. Table 7: Metric Prioritization: Production Expenses and Revenue and
Consumption Expenditures (in dollars) on page 19
iv. Table 8: Metric Prioritization: Value Chain Components on page 21.
3. Based in part on the Supplementary Findings on page 7, meta-indicators that combine or
integrate other metrics were added to Table 1 to provide a more complete picture of the food
system.
2.1.2 Data Availability for Priority Metrics
Data availability for metrics that were identified by Ulupono as priorities are summarized briefly below
and in greater detail in Table 2 on page 12, Table 3 on page 13 , and Table 4 on page 15. For more
information about data sources, refer to Section 3.1.1 “Hawaii Food System Metrics Workbook” on page
25.
2.1.2.1 Production and Consumption – Local, Imports, and Exports (by weight)
On an annual basis, local production, exports, net imports, and local consumption can be calculated at
the state level, for each of the major food groups. Annually, the Localization Ratio (LR), which is the
percent of food consumed that is produced locally, can also be calculated. Every five years, including in
the first HDOA report in 2015, production calculations and the LR can be validated against USDA Census
of Agriculture data. See “Table 2: Summary of Production and Consumption Data Available (by weight)”
on page 12 for greater detail.
2.1.2.2 Production Expenses and Revenue, and Consumption Expenditures (in dollars)
Growers’ production expenses and income as well as food consumption expenditures can be reasonably
estimated in the aggregate and to a lesser extent by food group, mostly at the state level annually, and
partially at the county level every five years. See “Table 3: Summary of Data Available for Production
Expenses and Revenue and Consumption Expenditures (in dollars)” on page 13 for greater detail.
2.1.2.3 Value Chain Components
Major components of the local food value chain can be mapped schematically and to a lesser extent
geographically, including agricultural land, water, farms, intermediaries, and outlets. See “Table 4:
Summary of Data Available for Value Chain Components” on page 15 for greater detail.

4
2.1.3 Metric Prioritization
Table 5 on page 17, Table 6 on page 18, Table 7 on page 19, and Table 8 on page 21 summarize the
outcomes of the metric prioritization process.
A simple prioritization process was used based on the data availability findings summarized above in
Table 2: Summary of Production and Consumption Data Available (by weight) on page 12
Table 3: Summary of Data Available for Production Expenses and Revenue and Consumption
Expenditures (in dollars) on page 13, and
Table 4: Summary of Data Available for Value Chain Components on page 15.
The following prioritization steps were taken with each of the data points in the tables listed above:
1. For importance (i.e., meaningfulness, relevance, usefulness), potential indicators were identified
as primary (must measure), secondary (nice to measure if we can), or tertiary (luxurious to
measure if we could).
2. For availability, practical methods for collecting data for each indicator were identified as easy,
moderate, or difficult (detailed information about data availability is available in the Hawaii
Food System Metrics Workbook, which is described in Section 3.1.1 on page 25).
3. Potential indicators were then positioned appropriately in “Table 5: Metric Prioritization” on
page 17. Those in the green boxes are the highest priority, yellow the second priority, and red
the lowest priority.
4. Table 2, Table 3, and Table 4 were then reproduced based on the color-coded prioritization
summarized in “Table 5: Metric Prioritization,” to create:
a. Table 6: Metric Prioritization: Production and Consumption (by weight) on page 18
b. Table 7: Metric Prioritization: Production Expenses and Revenue and Consumption
Expenditures (in dollars) on page 19
c. Table 8: Metric Prioritization: Value Chain Components on page 21.
The metrics recommendations summarized in “Table 1: Preliminary Metrics Recommendations” on page
2 are based on the outcomes of the above process.
2.1.4 Next Step: Vetting with Stakeholders
After HDOA and Ulupono review this report and requested revisions are made, Sustain Hawaii will
facilitate a review of metrics recommendations with select, representative food system stakeholders.
That review will use a method and logic mirroring that described in Section 2.1.1 “Recommendations
Logic” on page 1, concluding with the prioritization of potential metrics.
The outcomes of the vetting process will be summarized for HDOA and Ulupono for their use in making
final decisions about the metrics to include in the 2015 Hawaii Food Security Metrics Report.

5
2.2 Recommendations for Data Management, Portals, and Visualization
2.2.1 Data Management
The volume and diversity of available data related to food systems can be overwhelming, even for a
prioritized set of select metrics. However, recent advances in technology have greatly simplified data
management, making it relatively easy to consolidate and analyze disparate data sets, establish user-
friendly data portals, and proceed with the analysis that informs food system decision making.
It is recommended that the heavily vetted open source code powering some of the world’s largest
government open data sites be used to build an open, flexible, and expandable database for the
Hawaii Food Security Metrics project. This cost-effective approach frees up remaining financial
resources for the more labor-intensive functions required of data management projects of any size and
scope, including control, planning, development, and operational activities.
See Section 3.6 “Data Management” on page 69 for more information about data management
challenges and options.
2.2.2 Data Portals
Data portals are the users’ customer service window into (sometimes complex) databases. Like a
reference librarian, they provide easy access to information tailored to individual interests.
Data portals are plentiful, including several that are focused on agricultural and food systems. It is
recommended that the Hawaii Food Security Metrics System Project link to and include data portals
with features similar to the portals introduced in Section 3.7.1 “Data Portal Models” on page 72.
2.2.3 Data Visualization
Telling a story with data is the most meaningful way to make data more accessible to a diversity of
stakeholders, and because a picture is worth a thousand words, data visualization is the key to
accessibility. The best data visualization tools are flexible, adaptable, and built to accommodate updates
and expansion, allowing users to create new visualizations on-demand based on user-defined
parameters (e.g., crop, locale, year) and preferred visualization outputs (table, graph, map, flow chart,
network, etc.).
As with data management, recent technological advances make it easier to create visualizations tailored
to individual interests, and there are wide-ranging ways to visually present data and related value chain
metrics, including maps, system schematics, charts, and infographics that combine multiple
visualizations to tell a story. The challenge is to clearly understand the target audience’s context,
information needs, decisions, and actions that the information will inform.
To meet that challenge, two steps during Phase 3 of the project are recommended:
1) Build a data accessibility and visualization platform that is flexible and able to adapt to a wide
diversity of user interests and needs and
2) Pilot visualizations with key stakeholders to identify those that are most meaningful and should
be featured in broader public information campaigns.

6
See Section 3.7.2 “Wide-Ranging Options for Data Visualization” on page 74 for more information about
visualization challenges and options.

7
2.3 Supplementary Findings During the data identification and metric prioritization process, a range of insights were gleaned from
food systems stakeholders and the food system value chain “knowledge base.” Those insights are
briefly summarized below, with references to sections of the appendix where greater detail is available.
2.3.1 Local Food in Hawaii
Local Food Value Chain Complexities
Local food supply chains have three basic components: 1) production, 2) PAD (processing, aggregation,
distribution), and 3) consumption.2
They also operate in three different markets: direct-to-consumer (farmers’ markets, CSAs, etc.),
intermediated (local outlets and institutions), and mainstream (global).3
These “local food value chains” are not singular, linear, or static and vary by crop, year, and season.
Local Food Tensions
Most local food farms are small,4 and most small farms market directly.5 These enterprises are often
“values-based,” attempting to enhance farmers’ financial viability by capturing price premiums in the
marketplace for the environmental and social benefits (values) embedded in the products.6
However, most food travels through intermediated and mainstream markets,7 which typically generate
the most revenue.8 Moreover, almost half of Hawaii food expenditures are away from home, secured
through intermediated or mainstream supply chains. This suggests that most Hawai‘i residents control
only a portion of their personal food buying decisions.9
The tension within many local and regional food distribution systems lies between values-driven
decision-making on the one hand and, on the other hand, an emphasis on optimizing financial returns
for food enterprises and convenience for consumers.10
Diversity of Stakeholders and Perspectives
There is significant diversity among those who have a stake in Hawaii’s food system.11 For example,
Hawaii has large and small producers, growers of food and growers of commodities, local and outside
2 See Section 3.2.1 “Products from local farms follow multiple, complex routes to consumers” on page 52.
3 See Section 3.2.1 “Products from local farms follow multiple, complex routes to consumers” on page 52.
4 See Section 3.2.2 “Local food farms tend to be smaller” on page 53.
5 See Section 3.2.3 “Enterprise size influences product routes” on page 54.
6 See Section 3.2.5 “Enterprise “values” also influence product routes” on page 54.
7 See Section 3.2.3 “Enterprise size influences product routes” on page 54.
8 See Section 3.2.4 “Revenue and product route are correlated” on page 54.
9 See Section 3.2.1 “Products from local farms follow multiple, complex routes to consumers” on page 52.
10 See Section 3.2.5 “Enterprise “values” also influence product routes” on page 54.
11 See Section 3.1.3.1 “Hawaii’s Food System Stakeholders” on page 29.

8
processors and distributors, niche and chain grocery stores and restaurants, and consumers who expect
both the cheapest and the finest food.
The perspectives and interests of these stakeholders are just as diverse.12 Though many share the goal
of improved food self-reliance, few share common objectives, questions, or strategies. For many, food
is business and a livelihood. For others, food is culture, health, justice, and sustainability. Within
Hawaii’s food and agricultural community, conflict is sometimes more common than consensus.
2.3.2 Food Metrics System Options
The Goal: Product, Financial, and Information Flows through the Value Chain
Given the complexities of the food value chain and the diversity of interests and perspectives among
food system stakeholders, any system that provides data about Hawaii’s food system should be
comprehensive, objective, and easy to use, allowing each stakeholder to track metrics about production,
the movement of food, and consumption that inform their efforts to improve self-reliance.13
At the same time, any food metrics system should focus on the specific types of information needed by
policy-makers, enterprises, and advocates to make strategic, leveraged local food system improvements.
And past practice indicates that it is most useful to understand three types of “flow” through a local
food system: product, financial, and information flow.14
Understanding Local Food Value Chains
There are well-developed methodologies for comprehensive food system assessments, which provide a
snapshot of the local food supply chain components and markets.15 Life cycle analysis can also map
energy and material flow at a macro level.16 Similarly, freight movement analysis provides a macro-level
picture of food commodity group imports and exports at the state level.17
Many communities have used variations on these methodologies, and much can be learned from their
experience. A handful stands out as exemplary.18 Most also use a combination of secondary and
primary data collection. Options for each type of data are detailed below.
Secondary Data Availability
Product Flow: As noted in Section 2.1.2.1 “Production and Consumption – Local, Imports, and Exports
(by weight)” on page 3, on an annual basis, local production, exports, net imports, and local
consumption can be calculated at the state level, for each of the major food groups using secondary
12
See Sections 3.1.3.2 “Diversity of Perspectives” on page 29, 3.1.3.3 “Diversity of Agendas” on page 30 and 3.1.3.4 “Diversity of Metrics Needed” on page 30. 13
See Section 3.2.7 “Communicate food value chain flow and dynamics” on page 55. 14
See Section 3.2.6 “Three value chain “flows”: product, financial, and information” on page 55. 15
See Section 3.3.1 “Eight types of food system assessments have emerged” on page 57. 16
See Section 3.3.2 “Life cycle analysis is complex and expensive” on page 57. 17
See Section 3.3.3 “Freight movement analysis provides a macro-level picture, with limitations” on page 58. 18
See Section 3.3.4 “Local Food System Exemplary Projects” on page 60.

9
data. However, there are no sources of annual production data for fruits and vegetables, and food
consumption can only be estimated. Moreover, data are currently not collected about the flow of local
food through the value chain.
Financial Flow: As noted in 2.1.2.2 “Production Expenses and Revenue, and Consumption Expenditures
(in dollars)” on page 3, growers’ production expenses and income as well as food consumption
expenditures can be reasonably estimated in the aggregate and to a lesser extent by food group, mostly
at the state level annually, and partially at the county level every five years using secondary data.
However, data are not currently collected about the flow of money into, out of, and through Hawaii’s
food value chain.
Value Chain Components: As noted in Section 2.1.2.3 “Value Chain Components” on page 3, major
components of the local food value chain can be mapped schematically and to a lesser extent
geographically, including agricultural land, water, farms, intermediaries, and outlets, using secondary
data. However, because of the lack of data about product and financial flow within the value chain, it is
not currently possible to map the dynamic exchanges of goods and dollars among value chain
components.
More detail about secondary data availability is in Section 2.1.2 “Data Availability for Priority Metrics” on
page 3 and in Section 3.4 “Sources of Secondary Data for Local Food Systems” on page 61.
Options for Collecting Primary Data
Nationally, most efforts at assessing local food systems have supplemented secondary data with some
level of primary data collection, including surveys (online, mail, phone), interviews by phone or in-
person, and focus groups.19 Depending on the outcomes of the metrics prioritization process (see
Section 2.1.4 “Next Step: Vetting with Stakeholders” on page 4), some primary data collection may be
necessary to provide specific high-value metrics, like land rents, fruit and vegetable production, direct
sales, intermediated sales, pricing of locally-produced goods, and differentiation of local and imported
products beyond the farm gate.
As noted in Section 3.4.2.7 “Tap USDA expertise to make the best use of data” on page 66, it may prove
effective to use the USDA’s data collection and analysis expertise to access existing secondary data that
isn’t typically published and/or to collect high value primary data.
Improving Information Flow
As noted above, to make strategic, leveraged local food system improvements, it is most useful to
understand three types of “flow” through a local food system: product, financial, and information flow.
We can get reasonable product and financial snapshots – for local production and consumption,
production expenses and income, consumption expenditures, and major components of the local food
value chain. Information flow, however, is limited or non-existent. We cannot map the dynamic
exchanges of goods and dollars among value chain components – in other words, we are not able to
19
See Section 3.5 ”Collecting Primary Data” on page 67.

10
follow the flow of local food through the value chain or the flow of money into, out of, and through
Hawaii’s food value chain.
Those constraints on information flow may be short-lived due to recent developments in the fields of
certification and traceability. Consumer, food industry, and government demands for food safety,
animal welfare, and sustainability have created a mix of mandated and voluntary certifications.20 In
response, there have recently been significant advances in the field of traceability – the capacity to
follow the flow of a food through specified stages of production, processing, and distribution.21
Improved traceability would help with regulatory compliance and help overcome market barriers
related to the inability to track farm and product attributes through supply chains.
Internationally, regimes are being developed to measure and monitor agricultural performance
metrics.22 The know-how exists, traceability standards and systems have been developed, traceability
systems are already available,23 and they integrate nicely with existing enterprise solutions for local
farms.24
The use of traceability systems in local food value chain projects would mark a dramatic shift from static
(often dated) snapshots of pieces of the food chain to broader windows into the dynamic flow of
products and dollars through local value chains.
20
See Section 3.8 “Food and Agriculture Standards and Certifications” on page 77. 21
See Section 3.9 “Traceability in Local Supply Chains” on page 81. 22
See Section 3.9.4 “Internationally, regimes are being developed to measure and monitor agricultural performance metrics” on page 82. 23
See Section 3.9.5 “Traceability is feasible” on page 85. 24
See Section 3.9.7 “Those initiatives might tie-in nicely with existing enterprise solutions for local farms” on page 86.

11
2.4 Tables Supporting Recommendations
2.4.1 Data Availability
Note:
Unless otherwise noted, potential metrics are derived from secondary data accessed directly
from electronic sources with little or no analysis.
Metrics in blue are derived from secondary data but require manual gathering, compilation,
scrubbing, and/or normalization. See Section 2.2.1 “Data Management” on page 5 for more
information about what those processes entail.
Metrics in red are derived from primary data and require manual gathering, compilation,
scrubbing, and/or normalization. See Section 3.5 “Collecting Primary Data” on page 67 for more
information about primary data collection.
An asterisk (*) indicates that additional calculations and/or analyses are needed to derive the metric
from the data.

12
Table 2: Summary of Production and Consumption Data Available (by weight)
Dairy Protein Vegetables Fruit Grains Commodities &
Other
Local Production
Production (calculated annually from import-export data)*
Milk Seafood Other protein
Vegetables Fruit Grains
Production (measured annually)
Milk Seafood Beef Hogs25 Poultry Eggs
Vegetables*26
Avocado Papaya Guava Banana
Honey
Production (measured every 5 years)
Other dairy Nuts Mac nuts
Vegetables Other Grains Coffee Flowers Seed
Exports (annual, interstate & foreign*)
Dairy Seafood (interstate) Beef Hogs Poultry (foreign) Eggs (foreign)
Vegetables Fruit Grains Coffee (interstate) Sugar Seed (foreign)
Local Consumption
Annual Consumption Per capita estimates*27
Imports (annual, interstate & foreign*)
Dairy Seafood (interstate) Beef Hogs Poultry (foreign) Eggs (foreign)
Vegetables Fruit Grains Coffee (interstate) Sugar Seed (foreign)
Re-exports of foreign imports
(annual)*
Dairy Beef Hogs Poultry Eggs
Vegetables Fruit Grains Sugar Seed
Localization Ratio
Annual Milk Seafood Other protein
Vegetables Fruit Grains
25
Most hogs are not slaughtered in facilities where production data are collected. 26
It may be possible to access annual NASS survey data for vegetable and fruit production. 27
Consumption is not measured, but estimates are possible based on national consumption data and assumptions about local dietary idiosyncrasies.

13
Table 3: Summary of Data Available for Production Expenses and Revenue and Consumption Expenditures (in dollars)
Total Dairy Protein Vegetables Fruit Grains
Commodities & Other
Production Expenses
Annual
Production expenses Land fee simple costs* Property tax rates Land rent28 Water rates Feedstuffs Feed & seed imports (wt)* Labor costs/wages
5-year Land rent
Producer Revenue
Annual
Cash receipts Net value added Direct govt payments Net farm income Farm debt held29
Total market value Cash receipts
Beef: Total market value, Cash receipts, Output Hogs: Net farm income Poultry: Cash receipts Eggs: Total market value, Cash receipts
Cash receipts
Cash receipts
Total market value +/or cash receipts
Profit-Loss Annual Representative P&L
PAD Purchasing
Monthly
Mainland prices
Shipping costs*
28
Given the limited number of agricultural land lessors, primary data about land rents could be collected more regularly. 29
At the national scale only.

14
Total Dairy Protein Vegetables Fruit Grains
Commodities & Other
Consumption Expenditures
Annual
CPI for food total, at home, & away from home Direct sale prices* Grocery prices & sales (local & import)* Restaurants Fast food Food insecurity SNAP, WIC, school breakfast & lunch
Estimates based on regional expenditure data, local consumption estimates, and Honolulu CPI*
5-year Direct sales30
Value Chain Revenue
Annual
Producer-Consumer price spread Food Dollar31
Also available:
De facto population densities to estimate demand
30
It may be possible to access annual NASS survey data for direct sale prices and volume. 31
Produced by USDA at national scale. 5-year Census of Agriculture data may make it possible to produce a local version.

15
Table 4: Summary of Data Available for Value Chain Components
Annual 5 Years
Production
Land
Ag land & quality (acres, map) Acreage needed for caloric +/or energy self-sufficiency* Undeveloped ag land (acres, map) Land in production (acres, by type, map*32) Fallow land (acres, map*) Crop probability*33 Production capacity* Land tenure: leased vs owned (acres, map*) Land in conservation easements (acre, map)
Land in production (acres, by type) Land tenure (acres)
Water
Rainfall/drought (map) Reservoir, ditch, public, irrigation system (map) Irrigation system users (count), gallons, revenue ($)
Irrigated land (acres) Farms with irrigation (acres)
Operations
Farms (count, acreage, size, type, location*) Farms (count, map by commodity)* Organic (count, map) Food safety certification (count, map)
Farms (count by commodity) Detailed farm characteristics Organic (count)
Operators & Labor
Operators (count)
Employment (count)
Ag program graduates (count)
Operator characteristics
32
Could map more regularly than every 5 years using methods of Melrose/UH SDAV (2012). 33
Kemp, “The Hawaiˋi Island Crop Probability Map.”

16
Annual 5 Years
PAD
Intermediated Sales
Food hubs (count, map) Wholesalers (count, map) Distributors (count, map) Processors (count, map) Manufacturers (count, map) Food safety certification (count, map)
Consumption
Direct Sales Farmers’ markets (count, map) CSAs (count, map)
Farms (count) Value added products
Retail
Grocery stores (count, map) Supercenters (count, map) Convenience stores (count, map) Specialty stores (count, map)
Restaurants Full service (count, map) Fast food (count, map)
Food Security
Food insecurity (count) SNAP (count) WIC (count) School lunch & breakfast (count) Food deserts (map)*

17
2.4.2 Prioritization of Potential Metrics
Table 5: Metric Prioritization
Key: green boxes = highest priority, yellow = second priority, and red = lowest priority. Unless otherwise
noted, all metrics are annual, state level, and for all major crops or food groups.
Importance Primary Secondary Tertiary
Availability
Easy
Value Chain Ag land & quality (acres, map) Land in cons. easements (acres, map) Rainfall/drought (map) Farms (count, acreage, size, type) Operators (count) Employment (count) Food insecurity (count) Dollars Mainland prices Producer revenue CPI for food total, at home, & away from
home Representative farm P&L (not by crop)
Value Chain Food hubs (count, map) Grocery stores (count, map) Supercenters (count, map) Convenience stores (count, map) Specialty stores (count, map) Full service restaurants (count, map) Fast food (count, map) SNAP, WIC, & School lunch & breakfast
(count) Dollars Restaurant & fast food expenditures Food insecurity SNAP, WIC, school breakfast & lunch
Moderate
Value Chain Undeveloped ag land (acres, map) Reservoir, ditch, public, irrigation system
(map) Irrigation system users (count), gallons,
revenue ($) Ag program graduates (count) Farmers’ markets (count, map) CSAs (count, map) Processors (count, map) Weight Local Production Exports Local Consumption Imports Localization Ratio Dollars Production expenses (not by crop),
including property tax rates, water rates, feedstuffs, labor costs
Shipping costs (not by crop) Consumption expenditures/ demand
Value Chain Wholesalers (count, map) Distributors (count, map) Manufacturers (count, map) Organic (count, map) Food safety certification (count, map) Dollars Land fee simple costs Producer-Consumer price spread Food Dollar
Difficult
Value Chain Production capacity Land in production (acres, by type, map) Fallow land (acres, map) Farms (count, map by commodity) Land tenure: leased vs owned (acres, map) Dollars Land rent Direct sale prices Grocery prices & sales (local & import)
Value Chain Acreage needed for caloric +/or energy self-
sufficiency Crop probability Food deserts

18
Table 6: Metric Prioritization: Production and Consumption (by weight)
Table 6 is “Table 2: Summary of Production and Consumption Data Available (by weight)” on page 12 color-coded by priority, as indicated in
Table 5: Metric Prioritization.
Dairy Protein Vegetables Fruit Grains Commodities &
Other
Local Production
Production (calculated annually from import-export data)*
Milk Seafood Other protein
Vegetables Fruit Grains
Production (measured annually)
Milk Seafood Beef Hogs Poultry Eggs
Vegetables* Avocado Papaya Guava Banana
Honey
Production (measured every 5 years)
Other dairy Nuts Mac nuts
Vegetables Other Grains Coffee Flowers Seed
Exports (annual, interstate & foreign*)
Dairy Seafood (interstate) Beef Hogs Poultry (foreign) Eggs (foreign)
Vegetables Fruit Grains Coffee (interstate) Sugar Seed (foreign)
Local Consumption
Annual Consumption Per capita estimates*
Imports (annual, interstate & foreign*)
Dairy Seafood (interstate) Beef Hogs Poultry (foreign) Eggs (foreign)
Vegetables Fruit Grains Coffee (interstate) Sugar Seed (foreign)
Re-exports of foreign imports
(annual)*
Dairy Beef Hogs Poultry Eggs
Vegetables Fruit Grains Sugar Seed
Localization Ratio
Annual Milk Seafood Other protein
Vegetables Fruit Grains

19
Table 7: Metric Prioritization: Production Expenses and Revenue and Consumption Expenditures (in dollars)
Table 7 is “Table 3: Summary of Data Available for Production Expenses and Revenue and Consumption Expenditures (in dollars)” on page 13
color-coded by priority, as indicated in Table 5: Metric Prioritization.
Total Dairy Protein Vegetables Fruit Grains
Commodities & Other
Production Expenses
Annual
Production expenses Land fee simple costs Property tax rates Land rent Water rates Feedstuffs Feed & seed imports (wt)* Labor costs/wages
5-year Land rent
Producer Revenue
Annual
Cash receipts Net value added Direct govt payments Net farm income Farm debt held
Total market value Cash receipts
Beef: Total market value, Cash receipts, Output Hogs: Net farm income Poultry: Cash receipts Eggs: Total market value, Cash receipts
Cash receipts
Cash receipts
Total market value +/or cash receipts
Profit-Loss Annual Representative P&L
PAD Purchasing
Monthly
Mainland prices
Shipping costs

20
Total Dairy Protein Vegetables Fruit Grains
Commodities & Other
Consumption Expenditures
Annual
CPI for food total, at home, & away from home Direct sale prices Grocery prices & sales (local & import) Restaurants Fast food Food insecurity SNAP, WIC, school breakfast & lunch
Estimates based on regional expenditure data, local consumption estimates, and Honolulu CPI*
5-year Direct sales
Value Chain Revenue
Annual
Producer-Consumer price spread Food Dollar

21
Table 8: Metric Prioritization: Value Chain Components
Table 8 is “Table 4: Summary of Data Available for Value Chain Components” on page 15 color-coded by
priority, as indicated in Table 5: Metric Prioritization.
Annual 5 Years
Production
Land
Ag land & quality (acres, map) Acreage needed for caloric +/or energy self-sufficiency Undeveloped ag land (acres, map) Land in production (acres, by type, map) Fallow land (acres, map*) Crop probability Production capacity* Land tenure: leased vs owned (acres, map*) Land in conservation easements (acre, map)
Land in production (acres, by type) Land tenure (acres)
Water
Rainfall/drought (map) Reservoir, ditch, public, irrigation system (map) Irrigation system users (count), gallons, revenue ($)
Irrigated land (acres) Farms with irrigation (acres)
Operations
Farms (count, acreage, size, type, location) Farms (count, map by commodity) Organic (count, map) Food safety certification (count, map)
Farms (count by commodity) Detailed farm characteristics Organic (count)
Operators & Labor
Operators (count)
Employment (count)
Ag program graduates (count)
Operator characteristics

22
Annual 5 Years
PAD
Intermediated Sales
Food hubs (count, map) Wholesalers (count, map) Distributors (count, map) Processors (count, map) Manufacturers (count, map) Food safety certification (count, map)
Consumption
Direct Sales Farmers’ markets (count, map) CSAs (count, map)
Farms (count) Value added products
Retail
Grocery stores (count, map) Supercenters (count, map) Convenience stores (count, map) Specialty stores (count, map)
Restaurants Full service (count, map) Fast food (count, map)
Food Security
Food insecurity (count) SNAP (count) WIC (count) School lunch & breakfast (count) Food deserts (map)

Section 3: Appendix of Supporting Material

This page was left blank intentionally.

25
3 Appendix of Supporting Material
3.1 Research Process and Resources The research process was two-pronged. On the one hand, available food system data were identified
through a thorough review of related resources (see Section 3.1.2 “Identifying Available Data”
immediately on page 28). Naturally, many of the sources referenced in the Phase 1 Literature Review
were again used to develop recommendations in this report.
On the other hand, a “walkabout” was conducted among the diversity of Hawaii’s food system
stakeholders to identify local data sources and metrics needs (see Section 3.1.3 “A “Walkabout” among
Hawaii’s Food System Stakeholders” on page 29). The findings from the walkabout exercise are
anecdotal and qualitative, and some portions of the walkabout were conducted before this project was
initiated and may not reflect the most current stakeholder perspectives.
The findings from both prongs are summarized in the Hawaii Food System Metrics Workbook, which is
introduced immediately below.
3.1.1 Hawaii Food System Metrics Workbook
The Metrics Workbook is a standalone Excel workbook that is supplementary to this report. It contains
detailed information about a wide range of food system data sources and potential food system metrics
that were identified during the two-pronged research process introduced immediately above.
The workbook is organized into four main sections, based on the “pyramid” of indicators in Figure 1:
Metrics Pyramid and summarized in Table 9: Metrics Workbook Table of Contents.
A Level is built on B Level data, which is built on data in B and D Level worksheets (or Data
Sheets).
C Level is undeveloped.
Some pyramid levels are further organized into sublevels. See Table 9: Metrics Workbook Table of
Contents below.
Data Sheets contain information about the source, scale, and frequency of indicators.
They also often include notes about related useful resources.
The focus is on state and county indicators, so national indicators and data sets are referenced
as “other contextual data sources.”
Some Data Sheets focus on indicators that are not central to the project and are not developed fully.
All sources referenced are available in the Hawaii Food System Metrics Library (page 28), which doubles
as the bibliography for this report.

26
Table 9: Metrics Workbook Table of Contents
Pyramid Level Sublevel Data Sheet Notes
A LEVEL
Wt & $
Other Other big picture metrics used by others and that could be developed
B LEVEL Master sheet with scale and frequency of supply chain metrics by commodity – everything is summarized here
CHAIN Components of the supply chain
Farms Count, acreage
Costs Production costs
Production
Revenue
PAD Processing, aggregation, distribution
Food Safety
Imp & Exp Imports and exports
Consumption
Outlets
Waste Undeveloped
CROPS
Dairy
Beef
Seafood
Other protein
Veggies No frequent data
Fruit No frequent data
C LEVEL Undeveloped
Potential
D LEVEL
Land
Water
Employment
Operators
Fishers
Seed Undeveloped
Invasive Species
Undeveloped
Electricity Undeveloped
Capital Undeveloped

27
“A” LEVEL
Big picture. Self-reliance “at a glance”
“B” LEVEL
Tracking indicators that tell specific stories
about production, aggregation, consumption, or other aspects of Hawaii’s “foodprint”.
“C” LEVEL
Specialized indicators that are not really needed
at the A and B levels but are vital for specific users.
“D” LEVEL
Basic inputs without which production and
consumption doesn’t work.
Figure 1: Metrics Pyramid

28
3.1.2 Identifying Available Data
3.1.2.1 Research Process
The following steps were taken:
Establish the Hawaii Food System Metrics Library (see page 28) online
o Its organization evolved as the project progressed.
Update the library
o It was originally populated with resources used in developing the project proposal.
o Resources referenced in the Phase 1 Literature Review were added.
o Additional resources were added as found during the steps below.
Establish the Hawaii Food System Metrics Workbook (see page 25) using Microsoft Excel
o It served as the repository for information about food supply chain data sources and
their scale and frequency, as found during the steps below.
o Data sources were also organized in the Data Sources collection in the library.
Review related resources, including:
o Hawaii-specific food systems work that's been done (see “Hawaii Analyses & Plans” in
the library)
o Other communities’ food indicators projects and products (see “Metrics & Indicators” in
the library)
o Best practices in food system assessments (see “Local Food System Planning” in the
library)
o Strategies employed to gather food system data (see “Data Gathering Strategies” in the
library)
o Work done in food supply chain analysis (see “Supply Chain Analysis” in the library)
o Resources specific to particular commodities (see “Commodities” in the library)
o Efforts to build and strengthen local food systems (see “Building Local Food Systems” in
the library)
o Resources related to the economics of local food systems (see “Economics and Markets”
in the library).
Final review of “Data Sources” in the library, checking it against the Metrics Workbook by source
Reorganize and format the Metrics Workbook.
3.1.2.2 Hawaii Food System Metrics Library
Zotero [zoh-TAIR-oh] is a free, easy-to-use tool to help collect, organize, cite, and share research
sources.
All of the sources used to develop the “Hawaii Food System Metrics” project are available to the public
in the project library at: https://www.zotero.org/groups/hawaii_food_system_metrics/items.
Registered users (it’s free) can access all of the uploaded files.

29
Though available online, the library is easiest to use with the Firefox browser plug-in. More detailed
information about using Zotero is included below. Most of the guidance links to Zotero’s great
documentation.
To get started:
1. Review the Zotero Quick Start Guide: https://www.zotero.org/support/quick_start_guide 2. Install Firefox: http://www.mozilla.org/en-US/firefox/new/ 3. Install Zotero: https://www.zotero.org/download/; https://www.zotero.org/support/installation 4. If you run into problems, very useful guidance can be found here:
a. Getting Help: https://www.zotero.org/support/getting_help b. FAQs: https://www.zotero.org/support/frequently_asked_questions c. Tutorials: https://www.zotero.org/support/screencast_tutorials
5. Familiarize yourself with the organization of the group library: https://www.zotero.org/groups/hawaii_food_security_metrics/items
a. The library has been organized into “collections” (i.e., folders) and “subcollections” (https://www.zotero.org/support/screencast_tutorials/collections or https://www.zotero.org/support/collections_and_tags)
i. Importantly, Zotero allows you to file items in multiple (sub)collections, thereby providing a visual organizing alternative to tags.
ii. Note that some collections include “general” items in addition to subcollections. iii. There is also a “To Be Filed” folder where users can park new items for the
librarian to add and file. iv. As the library grows, new collections and subcollections will be added, and
(sub)collections will be re-organized. b. You can also easily view any tagged items, items within any (sub)collection, or tagged
items in any (sub)collection.
3.1.3 A “Walkabout” among Hawaii’s Food System Stakeholders
3.1.3.1 Hawaii’s Food System Stakeholders
Hawaii’s food system stakeholders are remarkably diverse. Just on the production side, there are
vegetable growers (cabbages, tomatoes, cucumbers, lettuce, etc.); tropical fruit growers (pineapple,
papaya, banana, etc.); kalo growers (loi and dryland); large and small coffee growers; large, medium,
and small beef ranchers doing both general and specialty cattle; large, small, and individual dairy
farmers; specialty crops (teas, cacao, tobacco); seed companies; foliage, flower, turf, and landscape
plant growers; and large and small macadamia growers. There is comparable diversity among input
providers, processors, distributors, grocers, restaurants, air and ground shippers, landowners, bankers,
labor-suppliers, government agencies, units of higher education, interest groups, and policy makers.
3.1.3.2 Diversity of Perspectives
Many of these stakeholders come with philosophical agendas that go beyond their business or
professional interests. For example, some espouse a “locavore” philosophy and are interested in food
miles traveled. Others are interested in certified organic farms and food or specialized diets (vegan,
30
vegetarian, paleo, Shintani, gluten-free, etc.). Still others are interested in food safety, food security, or
food policy issues.
3.1.3.3 Diversity of Agendas
Because of the diversity in stakes and perspectives, agriculture and food stakeholders are not aligned
behind a common agenda or strategy. In fact, their efforts often conflict. For some, the highest priority
is to “move the needle” – to maximize local production. Some want to increase local agricultural
business opportunities and see more farmers, especially younger ones, on the land. Others seek to
insulate Hawaii from temporary or long-term transportation shocks. Still others advocate for a more
comprehensive, long-term view that raises questions of equity and sustainability. Some seek to attack
rising obesity rates, cure barren “food deserts,” create food hubs, preserve open space, strengthen rural
community life, improve diets, or combat particular kinds of agriculture that they don’t like.
3.1.3.4 Diversity of Metrics Needed
This means that assessing and benchmarking food self-reliance does not start with an agreed upon set
of questions. There are many differences of voice, view, and perspective. Reflecting those differences,
different groups involved in Hawaii’s food web want indicators that can potentially inform their different
needs. For example, policy makers seem interested in numbers and benchmarks that would help steer
public investments in labor, land availability, water, or certain industries within agriculture that may be
experiencing a crisis. Producers of different food products want information that would inform what
they grow, where their markets are, and what financial bets they may be willing to take. Advocates
want to know about pesticides, GMO products, and food safety. Attorneys want to know about food
borne illnesses and culpability. Grant applicants want information that will support their quest for
research funding.
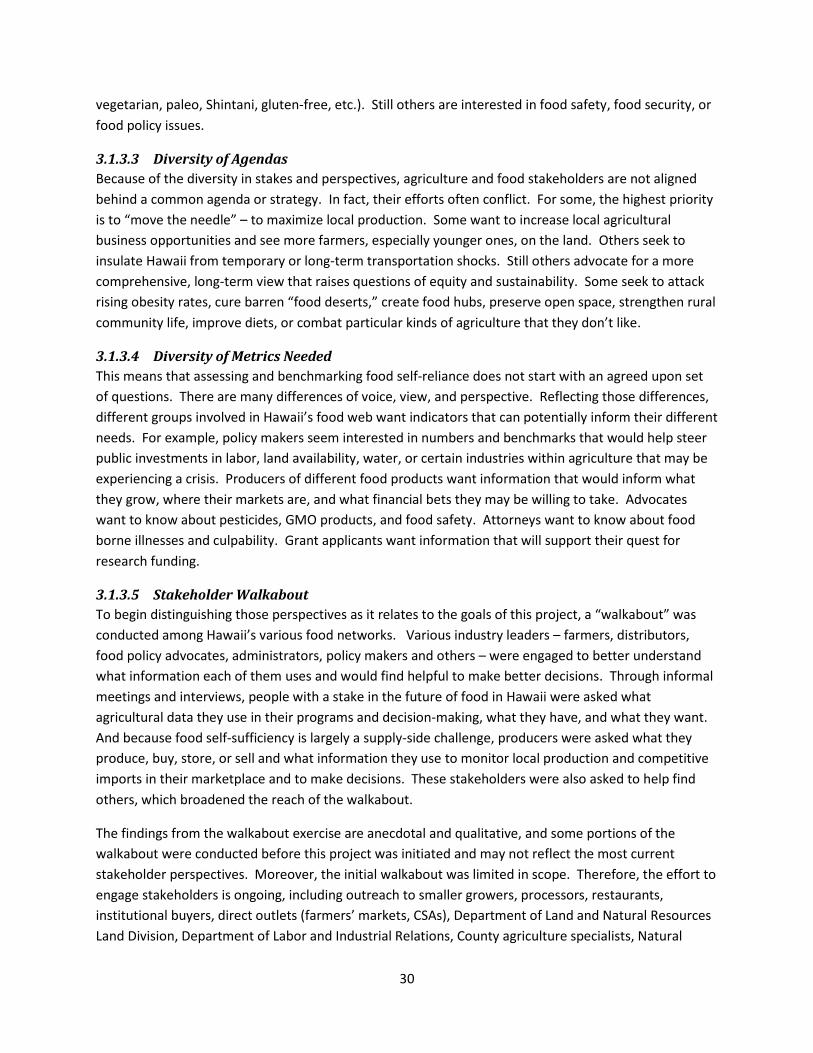
3.1.3.5 Stakeholder Walkabout
To begin distinguishing those perspectives as it relates to the goals of this project, a “walkabout” was
conducted among Hawaii’s various food networks. Various industry leaders – farmers, distributors,
food policy advocates, administrators, policy makers and others – were engaged to better understand
what information each of them uses and would find helpful to make better decisions. Through informal
meetings and interviews, people with a stake in the future of food in Hawaii were asked what
agricultural data they use in their programs and decision-making, what they have, and what they want.
And because food self-sufficiency is largely a supply-side challenge, producers were asked what they
produce, buy, store, or sell and what information they use to monitor local production and competitive
imports in their marketplace and to make decisions. These stakeholders were also asked to help find
others, which broadened the reach of the walkabout.
The findings from the walkabout exercise are anecdotal and qualitative, and some portions of the
walkabout were conducted before this project was initiated and may not reflect the most current
stakeholder perspectives. Moreover, the initial walkabout was limited in scope. Therefore, the effort to
engage stakeholders is ongoing, including outreach to smaller growers, processors, restaurants,
institutional buyers, direct outlets (farmers’ markets, CSAs), Department of Land and Natural Resources
Land Division, Department of Labor and Industrial Relations, County agriculture specialists, Natural

31
Resources Conservation Service, Farm Service Agency, UHERO, and a broader range of interest groups
like the Farmers Union, HOFA, and the Kohala Center.
Table 10: Walkabout Notes on page 33 catalogs the reach of the walkabout through July 2014, and
summary “findings” are including in the section immediately below and integrated into the “Hawaii
Food System Metrics Workbook” introduced on page 25. Table 10 is in unrefined form.
3.1.3.6 Walkabout Findings
Available annual (or better) secondary data that stakeholders said would be useful
Agriculture program graduation rates
Agriculture enterprise directory/map (farm, PAD, retail, direct)
Cost of production (production expenses detail)
Food safety certification
Production
o Beef slaughter/production
# of cows born
# of calves weaned
In state slaughter #s
Price for premium meat – market value, cash receipts, mainland prices
o Seafood catch
o Layer/boiler production
o Milk price and production
o Colonies producing honey, yield per colony, & honey production
Import data of inputs (e.g., feed, soil amendments)
Export data by commodity
Foreign poultry/egg imports
Dollar value of all local products
Population/market densities
Food desert mapping
Metrics requested by stakeholders that require primary data collection
Agriculture property tax rates
Farm by crop
o Organic farms
Production
o Truck farm production (veggies, fruits): possible to access annual NASS survey data?
o Most hog production not tracked
Beef
o # of calves shipped and their market value
o # of breeding cows
o # of bulls
o Culled cows and their value
32
o Culled bulls and their value
o Local price for premium meat
o # of heifers retained for breeding
o # of types of operations: cow-calf; seed stock; stocker-finisher
o # of acres in active grazing
o # of acres under management
o Pasture quality (production by acre)
Sales data through the value chain (grocers most important, but also useful for wholesalers/
aggregators/ distributors, restaurants, direct)
o Local vs import volume, costs, and retail price
Local pricing data to contrast local, import, and export (national/west coast AMS Market News
data)
o Capture retail through grocery store ads for local and non-local fruits/vegetables
Metrics requested by stakeholders that require analysis
Total available acreage
Map agricultural irrigation systems
Land in production by crop
Map fallow quality agricultural land: would require first determining what land is in production,
which can be done with GIS using combination of RPT, aerial, and other data (the UHH SDAV lab
does this really well)
Compare local and net export prices to producers = west coast price + shipping
o USDA AMS publishes pricing/market information in the Market News Service
o Shipping rate information available online
Imports by major food group (fresh, frozen, processed)
Net local production by major food group
Consumption habits/preferences (estimates)
Net market share by crop (providing some insight into market niches/ import substitution
options)
Metrics requested by stakeholders that are not feasible or outside the project scope
Current number of farms that are profitable
Backyard garden production
Ethnic percentages of Kauai population who hunt, fish and gather
Information on agricultural BMPs

33
Table 10: Walkabout Notes
NAME
ORG.
NOTES
DATA SOURCES
COMMENTS
PRODUCTION
Mike Buck Farmer Waimanalo farming. Lots of opportunities for land in ‘Nalo. UH has a large tract that is fallow and ripe for experimental farming.
None Map fallow quality ag land
Sydney Keliipuleole
KSBE – Manages all agricultural leases
Is trying to steer the use of KSBE’s leased lands into more food production, which is one of KSBE’s goals. Has a strategic plan with 9 specific agricultural goals.
Would probably share data sources on lands in production and food produced as well as their progress against goals but would need a high level request.
Alec Sou Aloun Farms One of the state’s largest vegetable and fruit producers. He produces 19 different crops for local consumption and exports sweet onions during shoulder periods on mainland US. He fills out HASS and NASS surveys regularly and believes that it is good business to do so. He operates one of the state’s largest CSA’s and does so because he thinks folks pay too much at the markets
Used HASS annual report in early years to figure what crops to grow. Now follows national food prices (Terminal Prices on West Coast) plus known shipping costs to help set his values. Says all farmer contracts w/ retailers are handshakes, no fixed contracts in writing. He now builds his production around what his major buyers say they want. When China joined RIMPAC this year he immediately put more acres of Asian vegetables in the ground to meet their demand. Like other larger producers he “anticipates” and makes bets. Hard to know how many bets go bad.
Could collect local pricing data to contrast with AMS Market News data
Larry Jefts Sugarland Produces 1-million lbs of food every 7 days and is currently the largest banana producer in the U.S.
Relies on weather forecasts, sales prices, Matson’s shipping information, and buyer needs in local and national markets. Very focused on national ag conditions to inform what he grows, where he ships, and when.
Shipping rate information available online

34
NAME
ORG.
NOTES
DATA SOURCES
COMMENTS
Keoki Woods Ranch Manager, Parker Ranch
Ranch is primarily a cow/calf operation now looking at keeping more animals home for grass fed market (with financial support by Ulupono). They follow a robust set of data sets on west coast cattle and grain pricing and shipping costs. Local slaughter costs are far out of line w/ large scale mainland prices and local houses have control over pricing that is not transparent. They glance at HASS cattle reports but it has little to do with their decision making.
Suggested Cattlefax.com as an industry fee for service website that provides current industry data that ranchers use.
Could track shipping costs to inform both cost of production and to compare local and net export prices to producers.
Richard Spiegel
Independent Beekeeper. High-end honey. More data on bee diseases
Has access to local and national honey production produced by the industry.
NASS publishes annual data on number of colonies producing honey, yield per colony, & honey production
Bruce Anderson
Has a ranch in Waikii. Thinks we should be doing more long term orchards even though he understands the need for shorter term profits.
None
Cory Gillans Island Dairy: O’okala, Hamakua
Idaho milk producers and marketers who bought local dairy and are investing over $15M in building a modern dairy operation. Plan to double current herd to 2800 cows and continue to grow
Milk prices set by the Milk Control Act. Each dairy gets an allocation at a supported rate. Production beyond their allocation is sold at west coast prices plus shipping. All data available at DOA Quality Assurance division, Grant Tomita. Single point of
Published

35
NAME
ORG.
NOTES
DATA SOURCES
COMMENTS
their own feed as much as possible. All milk goes to Meadow Gold, the only local processor, who packs for many brands and imports the remainder of the state’s fresh milk and processed dairy from the mainland.
contact.
Jason Moniz DOA State Veterinarian
Tracks most cattle, pork and other livestock in the state and intervenes where there are diseases. He is also a small rancher that exports over 500 calves annually.
Federal inspectors collect data on all animal kills at every certified slaughterhouse. They work for Food Safety Inspection Service (FSIS) for the USDA. DOA often has difficulty getting regular reports from FSIS local staff. Having spoken to that staff person, I understand the ego involved. Getting FSIS will be very useful to sharpen the numbers for local protein harvest. Getting it regularly will require high level requests that start outside of the state and find their way here as a mandate.
Richard Ha Hamakua Springs
One of Hawaii Island’s biggest tomato farmers and distributors of crops from other small farmers. For Richard, it all comes down to energy costs and their impact on his bottom line and the ability of consumers to pay for what he produces. He is very interested in liquid fuels from excess hydro and geothermal sources to create a local source of farm fuel and fertilizer.
He reports his data to HASS and NASS and occasionally uses those resources to quote numbers to help make his points. His farm sales are entirely based on market relationships, terminal values in west coast markets and seasonal insights that he has developed over the years.
USDA AMS publishes pricing/market information in the Market News Service

36
NAME
ORG.
NOTES
DATA SOURCES
COMMENTS
Chris Robb Robb Farms, organic greens in Lalamilo Waimea
Has established sustainable relationships with Armstrong and Whole Foods who take most of his crop. He sells quality not price and has 30 years of market and industry savvy to draw on.
Keeps his number close to his chest but will share anecdotal insights to people he trusts. He fills out HASS/NASS most times.
Michelle Galimba
Kuahiwi Ranch, Ka’u, BOA member
Family rancher who produces pasture feed cattle for Whole Foods and Foodland. Strong holistic thinker.
Good source of anecdotal info on grass fed industry and current state of the market but not specific data source. She’ll share data but as a matter of trust needs to know whom she is talking to.
Ron McKeehan
VP Hawaii Pork Producers Association; Ahualoa Hog Farm
Formerly a large hog operator w/ over 300 sows. Now down to just 3-5 with focus on high end genetics. Shifted to sheep to reduce stress once their kids grew up. He is active in Statewide hog issues.
Good source of anecdotal info but has no firm source of local production. Much of statewide production never gets to a certified slaughter floor.
Lori Beach Hilo Hamakua Farmers Coop Exec Director
Manages land and issues for 40+ small farmers in Hamakua.
Has no way to measure Coop production but is interested in trying to get these numbers to help make their case externally and to DOA. [A good additional contact for co-op information on Hawaii is Melanie Bondera at Kohala Center.]
John Cross Olson Trust, Mac nut and coffee grower in Kau/S Hilo w/ veg crop lessees and tropical fruit business.

37
NAME
ORG.
NOTES
DATA SOURCES
COMMENTS
Ken Love Tropical Fruit Growers Association
Major player in tropical fruit, an international scout for new varieties and a strong advocate for people being paid what it cost them to produce fruit. He has ravaged vendors at markets who are under selling local fruit.
Ken tracks local food prices in West Hawaii by logging grocery store ads for local and non-local fruits/veg. Data is area specific but represents a strong personal effort to track data.
Mark Suiso Tropical Fruit Growers Association
Mark is on Oahu and works closely with Ken. Is a tireless advocate for planting home fruit trees.
Same as Ken
David Rietow Mac Nut Assoc., Agro Resources President, ADC board
David is very active in ag land management and markets for multiple crops. A hard worker on ADC to get it to rise to its mission.
Uses HASS data in his discussions and has good market understanding of global mac nut and various fruits and coffee. Has no data sources of his own.
Lani Petrie Manager Kapapala Ranch
30,000 ac cow calf operation w/ 3000 goats for land management. Great resource on value added options for local beef, member for several cattle coops. Knows her own numbers and a good sense of what some others do but no comprehensive cattle data.
No data source herself but tracks similar data on West coast pricing, local slaughter costs, shipping costs and issues etc.
Wes Nohara Puu Kane Farms, Pineapple grower, West Maui
Wes is long time Maui Pine manager and one of the best land managers in the business. Farming Ulupono lands in Honokahua. Planning to shut down
No suggestions for ongoing data sources.

38
NAME
ORG.
NOTES
DATA SOURCES
COMMENTS
operation for lack of reasonable return. Understands Maui ag and the pineapple market well.
Dean Okimoto and Joy Gold
Both formerly of Hawaii state Farm Bureau
Dean is an active farmer and has good insights into ag issues generally. Both have represented farmers at the legislature.
Have organizational information on farmer demographics and would likely be able to secure good information on air and sea cargo.
Rodney Hariguchi
Hanalei May be the biggest taro farmer and also does value added products.
In a position to bring extensive taro data to the table.
PAD & CONSUMPTION
Claire Sullivan
Whole Foods Interested in both macro and micro indicators.
May be able to point us to North American Industry data that can be sorted by zip codes
In workbook
Robert Futa Safeway Murray Clay and Peter Adler met with Robert Futa, produce buyer for Hawaii’s Safeway stores.
Possible use of aged-out SKU data however, it seems less useable than we thought since the SKU’s wont distinguish local versus inshipped products. They may still have a certain value in terms of providing a snapshot of what people are buying and presumably eating at any given moment but that snapshot is heavily influenced by seasonality (here and elsewhere) and what is in fashion. Futa believes there are strong potential investments to scale up local production if there are more hothouses.
See traceability: labels can be producer-specific
Tish Uyehara Armstrong Produce
Distributes food safety certified foods for many sources. Biggest issue is the lack of farmers who can produce dependable supply. Ones that can are courted
Their data is proprietary, like other distributors we spoke to. We assume they have shipping data at the “crate” level so they can show chain of custody and be able to pay and bill.
See traceability.

39
NAME
ORG.
NOTES
DATA SOURCES
COMMENTS
and supported to keep them in play.
Eric Weinert Calavo, Puna Calavo exports 60% of the state’s papaya crop and owns the e-beam irradiator that treats most exported tropical fruit (rambuton, longon, lychee etc.) and almost all of the 16M # of sweet potato we ship out annually. New irradiator on Oahu has created some completion for some crops and the recent loss of FedEx direct 747 to Hilo has made export more complex and expensive.
He is a source of anecdotal data based on what goes by him regularly. No published data. He does fill out HASS/NASS for his growers.
Russell Hata Y Hata One of the state’s biggest distributors. Nearly all its products are currently bags, bottles and cans inshipped to Hawaii. Very little, if any local, sourcing other than bananas for its Jamba Juice client.
Recognizes the growing interest in “local fresh” and is opening a “Chef Zone” store near the airport which will be for restaurateurs only and carry more locally sourced food since that is what restaurants are increasingly wanting.
Jill Mattos Manager Hawaii Beef Producers, Pa’auilo Slaughter house
Runs largest slaughterhouse in the state. Her data mainly comes for the Federal inspectors at the plant. She is focused on the cost of operations and rancher relations. High cost of slaughter in Hawaii makes her job tough and drives
She reports her numbers to HASS/NASS and thinks that FSIS has good numbers as well but does not have access to them herself.

40
NAME
ORG.
NOTES
DATA SOURCES
COMMENTS
cattlemen to export for higher returns.
Glen Hong Young Brothers President and BOA Member
Further discussions being planned. Initial contacts suggest freight data is consolidated and not useful. DOA use to monitor shipments and collect their own data but YB just monitors large freight trends.
YB may be able to adjust data collection if asked at a high level with some specific goals in mind. Just collecting data, however, is not their business.
Lauren Zirbel Exec Director, Hawaii Food Industry Association
Oversees an association that represents many local grocers and few of the large global chains.
She has no data herself but knows grocers to talk to. Our follow up for her contacts was not very productive. Retail data is closely guarded. Will require high level requests from DOA or Ulupono.
MIXED STAKEHOLDERS
Brandi Beaudet, Parker Ranch Chris English, Ponoholo Ranch Tyler Jones, HARC (forestry) Sydney Keliipuleole, KSBE Kirby Kester, BASF James Kwon, USFWS Jennica
AG LEADERS PROGRAM – Cohort 14. This was a 2-hour exercise asking them for their indicator preferences.
Veggies
Sales data from stores on import replacement
CSAs, what customers want, what’s being [purchased, and what is trending
Re-use of food waste
Sales data aggregated anonymously
Cost of mainland vs. local products side by side
Reports on local purchases (#s, varieties) from local grocers
Data from distributors (Armstrong, Otani) on
Members of Cohort-14 are all in different lines of agriculture and may have access to specialized data in their areas of agriculture. Requires individual contacts
Veggies and Fruit Again, would need local pricing info Timely, local market dynamics not realistic Surveys/tracing could be used to aggregate sales data Seafood Seafood data available Poultry and Eggs NASS publishes annual layer/boiler production USDA tracks foreign poultry/egg imports Farm by crop available in 5-year ag census Import data of inputs available: feed Cost of production from ERS Land in production only every 5 years:

41
NAME
ORG.
NOTES
DATA SOURCES
COMMENTS
Lowell, Kona Blue Water Farms Elton Mow, Big island Orchid Growers Cynthia Nazario-Leary, MCC – New Farmer Training Program Judith Rivera, Pioneer Seed Ashley Stokes, CHTAR Vet Miki Kiyomi Tomita, UH-Lab School Christina Zimmerman, DOA Pesticides Derrick Kiyabu, Mao Farms (now Kohala Ctr) Melissa Zeman, Kunia Ag Park and
what is being replaced or not replaced locally
Consumer data: surveys from customers @ local stores, CSA’s etc.: what are you buying and eating?
Restaurants: what are they buying and can they get locally grown in the right quantities?
Self-report via survey
Survey monkey: what are you growing and eating?
Self reports random? Submit your own?
Fruits
Type and amount of fruits treated for expert
Type and amount of fruits produced (#s, acreage)
Type and amount of fruits bought and sold by o Wholesalers o Supermarkets o Restaurants o Farmers Markets
Fish
Wild catch
Large scale fleet catch
Seafood inspection data and reports to state
Poultry and Eggs
Imports (# of dozens) vs. retail sales
varies by season # of food safety violations, rejections, illness? ERS has annual export data by commodity, including poultry Specialty eggs – nutritional supplements (?) Amendments for pasture quality - ? Beef # of cows born: NASS # of calves weaned: NASS # of calves shipped and their market value – not available # of breeding cows – not available # of bulls – not available In state slaughter #s - NASS Culled cows and their value – not available Culled bulls and their value – not available Price for premium meat – market value, cash receipts, mainland prices – local price not available # of heifers retained for breeding – not available # of types of operations: cow-calf; seed stock; stocker-finisher – not disaggregated by type # of acres in active grazing -- varies by season # of acres under management -- varies by season Pasture quality (production by acre) – not available

42
NAME
ORG.
NOTES
DATA SOURCES
COMMENTS
Island Fresh # of local egg and chicken farms
lbs of feed purchased locally
Sales in dollars and price: local v. imports; Organic, free range vs. conventional
Cost of production/acre
Total acres in production
# of food safety violations, rejections, illness
Eggs and poultry exported
Specialty eggs – nutritional supplements
Amendments for pasture quality
Beef
# of cows born
# of calves weaned
# of calves shipped and their market value
# of breeding cows
# of bulls
In state slaughter #s
Culled cows and their value
Culled bulls and their value
Price for premium meat
# of heifers retained for breeding
# of types of operations: cow-calf; seed stock; stocker-finisher
# of acres in active grazing

43
NAME
ORG.
NOTES
DATA SOURCES
COMMENTS
# of acres under management
Pasture quality (production by acre)
NOTES FROM AG 2012 CONF MEETINGS (about 30 people in the room)
Total available acreage and how much is in use
Current number of farms that are profitable
How do locally produced foods connect with dietary preferences? o What foods people want
year round o What exactly is grown
where
Current market share for every crop o A solid list of market
niches o Market determines
everything: need data on demand for every commodity
o What gets imported o What % of imported
food is fresh, how much is prepared, how much frozen?
o Where is there competitive room in the marketplace for producers?
o An analysis of what is happening globally:

44
NAME
ORG.
NOTES
DATA SOURCES
COMMENTS
what are the global food supply trends?
Comparisons of prices: local vs. inshipped o Exactly how much more
are people will to pay for local?
o Dollar value of all local products
o All markets: who is buying what?
o Regular price and availability reports
How many middlemen are there
Aggregator/distributor metrics o % of orders filled by
local o % of orders accepted
and rejected o % of import costs
compared to local o Prices sold for by
commodity
Price flow-through and markups: producer, wholesalers, sellers, consumers
How many farms are food safety certified
A study of who is interested in farming? o How many students

45
NAME
ORG.
NOTES
DATA SOURCES
COMMENTS
graduate annually from ag programs?
A good working definition of total ag inputs
A study of how much food is grown in backyards
Information on good agricultural practices
Good list of agricultural practices by commodity
GOVERNMENT
Charley Ice CWRM Focused on bulk water systems on all islands but thinks state subsidized ditch and tunnel water is probably underpriced.
CWRM has detailed maps and water volume reports for all state water systems
Map them HDOA Ag Resources Mgmt Division has ag irrigation systems, availability, rates OP has GIS layers for ditches, reservoirs
Mary Lou Kobayashi and Robin Loudermik
State Planning Has completed a study of food self-sufficiency problems
They used a variety of interviews and readily available sources like NASS and NASS to gather information
Report is referenced in draft recs
Laura Thielen
Former Oahu Ag Coordinator (now a state Senator)
Has comparative information on ag property taxes, water fees, farmers markets and developed a good list of barriers to expanding Oahu’s ag picture but her report is somewhat dated now.
Production costs (except rent) available annually from NASS Could confirm by gathering local public data on taxes, fees, etc. Lots of directories of farmers markets
Sandy Kunimoto
Former DOA Chair
Lost ground during Lingle years. Willing to contribute to project and help facilitate
None
Melanie Stephens
HIAMP Mediator
Focused on Maui and knows the Maui ag scene. Wants data on organic farms on Maui.
None Could get from certifiers, but not sure it’s critical for this project
Mark Hudson
HDOA Statistician
HAS/NAS discussion. Provides a good periodic
Surveys include: January cattle
Need to confirm whether highlighted surveying can be tailored and/or expanded

46
NAME
ORG.
NOTES
DATA SOURCES
COMMENTS
baseline of all agriculture though has a hard time getting surveys back. Future uncertain. Lost enormous ground in 2009. Surveys are ongoing as management shifts to west coast offices. Local staff in place to follow up on surveys and keep a personal face on data collection. DOA is rebuilding this staff. New leadership incoming after Mark’s departure. NASS claims that they will work with local needs and adapt data collection as needed. Details should go through DOA to help them design data collection improvements.
January sheep/goats December Hogs Milk estimates January, April, July and Oct Fresh Fruits, nuts and vegetables surveys sent to selected producers annually Coffee and mac nut surveys to selected producers annually Sugar production annually Nursery/floriculture survey of selected producers Generally gather harvested acres, production, price units, etc. USDA collects and publishes FSIS slaughter data from federally inspected facilities (all in Hawaii). Results are published regularly. See the attached link for example of data and discussion of statistical issues. http://usda.mannlib.cornell.edu/usda/current/LiveSlau/LiveSlau-05-22-2014.pdf
Audrey Newman
Hawaii Green Growth Initiative
HGG Food Stats. Wants food self-sufficiency data for HGG’s larger metrics project. They collect lots of other metrics but not food.
None
JoAnn Yukimura
Kauai Council member
Promotes Kauai self-sufficiency. Would appreciate better data and a way to track growth in local production.
None, beyond what may be held by Bill Spitz, Kauai ag coordinator.
Bill Spitz Kauai Agricultural
Observes the Kauai Ag community and is a bit
Kauai has lots of theoretical passion for ag but little production. Now caught up in the

47
NAME
ORG.
NOTES
DATA SOURCES
COMMENTS
Specialist befuddled by the pressure for more ag lands to produce food when so few people produce food on the lands that are available.
global GMO/pesticide issue and losing focus on simply building local production.
Jackie Kozak-Thiel
Governor’s Sustainability Coordinator
Wants summary of lands under cultivation. Very interested in metrics and understands the difficulty of getting clarity on local food production.
None so far.
Diane Ley USDA Farm Service Director, former DOA Deputy
Felt that DOA staff that went out daily to collect ag and food data could be more efficient by setting up a set of electronic reporting methods that reduced warm body dependence.
Her agency keeps financial farm data and relies on NASS/HASS for most data.
See traceability
Richard Onishi
State Rep, Ag Vice Chair
Mainly interested in getting data that helps commercial farmers make better business decisions. He uses HASS number to get a sense of industry economic impacts and production. Particularly disappointed in recent divisions in the farmer community around big/small, organic conventional etc. Makes his job of being an ag advocate very hard.
No data
Roy Yamakawa
CHTAR - Kauai Extension officer Has good information on Kauai farms and farmers. Has been involved directly in taro

48
NAME
ORG.
NOTES
DATA SOURCES
COMMENTS
issues.
RESEARCH
PingSun Leung and Matthew Loke
CHTAR Perhaps the best and most published interpreters of Hawaii’s food picture. They have examined food sourced locally and inshipped
They rely on North American Industry Classification (NAICS) reports, NAAS and HASS census data, Food and Agricultural Organization data, U.S. interstate shipping data from Army Corps of Engineer’s Waterborne Commerce Statistics Center, export data from the U.S. Foreign Agricultural Service, USDA’s Economic Research Center, Marine Fisheries Review, USDA’s Pacific Region Farm Data.
Karl Kim & Dolores Foley
UH-Dept. of Urban and Regional Planning
Developing a food security training program for National Disaster Preparedness Training Center and has just completed a student practicum.
Their project uses a “scalar” approach and has some general information on other Asia-Pacific agricultural land uses, sources of distribution and aggregation, food processors, consumption patterns, and resources waste recovery. Kim was also the primary author of the Kauai IAL inventory recently completed. They used USDA consumption figures to back into how much Kauai consumes of several basic foods, and then assigned acres to determine IAL land needs…pretty weak way to approach the issue
Krishna Suryanata
UH Geography
Suggests gathering information on exclusive contracts with local farmers, samples of neighborhood purchasers, and survey or interview data from Big Box stores, institutional buyers (schools, hospitals, big hotels) and an inventory of
Has some academic studies and papers but relies on published studies, interviews, surveys and student projects.
What is a “neighborhood purchaser”? Interview/survey or tracing could track local purchasing

49
NAME
ORG.
NOTES
DATA SOURCES
COMMENTS
what high end, mid-range, and low end (plate lunch types) are buying and from who
ADVOCACY/SUPPORT
Mae Nakahata / Warren Watanabe
Maui Farm Bureau
Focused largely on Maui. Has data on population growth and distribution, total value of veggies and melons 1955-2006; amount of both that were produced; cattle, calf and dairy production, electrical generation, chicken (1984-2006), land use and diminishing farm sizes, farming jobs
All but veggie/fruit data available
Diane Zachery
Kauai Planning & Action Alliance
Kauai indicators project is interested in knowing ethnic percentages of Kauai population who hunt, fish and gather (#48)
Has 201l survey of Kauai production data and notes an upward trend in gathering, hunting and fishing which Kauai is tracking by ethnic groups.
Tiny fraction of production/ consumption
Kim Coffee-Isaak
Exec Dir, Agricultural Leadership Foundation
Would like better data to use for shaping their bi-annual conferences and their emerging leaders program.
None
Ashley Lukens
UH, Food Policy Council, and Center for Food Safety
Was particularly interested in food desserts and wanted this project to map all the fast food places in Kalihi.
Nothing new on production, imports or consumption
ERS and Census publish food security data ERS Food Env Atlas has food desert mapping tools AMS has food desert locator tool
Jason Philpott
Fish Trust (formerly)
Was developing a set of self-sufficiency metrics for seafood in Hawaii
Sources of data (if they will provide it): Suisan, Island Fresh Fish, Garden Isle Seafood, Hawaii Fish. Also Brooke Takenaka at fish auction may be able to provide data on fish caught in local waters. DLNR keeps fish catch data by harbor of landing. All commercial fishermen required to report but not all do. DLNR DAR also tracks commercial fish purchases. Both data sets

50
NAME
ORG.
NOTES
DATA SOURCES
COMMENTS
are available by query from DAR staff.
Dawn Chang Kuiwalu Consulting
Need data pertinent to Hawaiian diets and Hawaiian food producers: taro sweet potatoes, pork, fish.
None Tiny fraction of production/ consumption Consumption data not available. Production figures only disaggregated by crop and producer demographics in Ag Census.
John Knox Advice on indicators. Knox is an expert on indicators and other metrics and will be worth consulting with.
None
Laurie Carlson
Largely local/slow food focus. Interested in “faux local.” Willing to help.
None
Paula Young The Los Angles Food Policy Council
Author of Los Angeles Foodshed. Outstanding portrait of LA and surrounding counties.
Her report shows sources many of which are from NASS Census of Agriculture, workforce information from DOL, and other California state departments and has quality graphics. California’s ag industry is so large that it is much easier to convince big players to report production for market benefits.
Scott Ezer (and Kem Lowry)
HHF Planners HHF has completed an initial project developing IALs on Oahu. Phase-2 is in progress.
Has developed the consensus criteria for defining Oahu IALs. Can provide some inventories of potential lands under consideration based on their Phase-1 criteria but the actual map of Oahu IALs is a year away.
Criteria (for Oahu and Kauai) could be useful metrics.
Roy Oyama Kauai Farm Bureau
Long time farmer and Farm Bureau member on Kauai. Feels like he is often fighting a losing battle to keep ag alive with so many forces trying to tear it down. Lots of want-to-be farmers on Kauai but few really making a
No data

51
NAME
ORG.
NOTES
DATA SOURCES
COMMENTS
positive difference.
Val Kaneshiro
Emillia Noordoek
Sustainable Molokai
Has done an extensive set of interviews and SWOT analysis to analyze gaps, barriers, and opportunities to greater on-island self-reliance.
Has data from her interviews and a SWOT summary in chart form.

52
3.2 What We Know about Local Food Value Chains During the data identification and metric prioritization process (see Section 3.1 “Research Process and
Resources” on page 25), a range of insights were gleaned from food systems stakeholders and the food
system value chain “knowledge base.” Those insights are briefly summarized in this section.
Summary Takeaways:
Locally-produced food is marketed through direct, intermediated, and mainstream supply
chains, none of which are linear.
Most local food farms are small, and most small, local farms market directly.
But most food travels through intermediated supply chains, in which most revenue is generated.
This highlights the tension within many local and regional food systems between values-driven
decision-making on the one hand and an emphasis on optimizing time and/or capital on the
other.
To better understand value chains, it is useful to follow three types of “flow”: product flow,
financial flow, and information flow.
3.2.1 Products from local farms follow multiple, complex routes to consumers
They are marketed through both mainstream and local supply chains.34 Figure 1 in Diamond (2008)
compares market options for producers.35
Market options include:36
Farm-to-consumer or direct: stands, CSAs, farmers' markets
Farm-to-Firm or “intermediated”: restaurant, grocery, institution
Major channels or “mainstream”: collection markets, auctions, terminal markets, national
distributors, processors/repackers, brokers, large coops, government procurement.
Table 11: Local Food Marketing Options on page 53 summarizes insights about local marketing options
gleaned from the walkabout conducted for this project (see 3.1.3 “A “Walkabout” among Hawaii’s Food
System Stakeholders” on page 29).
Bower (2010) suggests thinking about market options as tiers:37
Tier 0, Personal Production of Food—backyard gardens, community gardens, home-canning
Tier 1, Direct Producer to Consumer—Farmers’ Markets, Farm stands, CSAs, Direct mail order
Tier 2, Strategic Partners in Supply Chain Relationships—Food Co-ops, Organic Valley, and other
small-mid scale values-driven distributors 34
King et al., Comparing the Structure, Size, and Performance of Local and Mainstream Food Supply Chains. 35
Diamond, Adam, Barham, James, and Tropp, Debra, Emerging Market Opportunities for Small-Scale Producers: Proceedings of a Special Session at the 2008 USDA Partners Meeting. 36
Barham, James, “Assessing Alternative Food Distribution Models: Improving Marketing Opportunities for Small-Scale and Limited-Resource Producers”; King et al., Comparing the Structure, Size, and Performance of Local and Mainstream Food Supply Chains. 37
Bower, Doetch, and Stevenson, Tiers of the Food System.

53
Tier 3, Large Volume Conventional Aggregation and Distribution—Sysco, Reinhart, Goodness
Greenness
Tier 4, Global Anonymous Aggregation and Distribution—ADM, Cargill, Ajinomoto.
Supply chains are not necessarily linear – they can be complex networks.38
Almost half of Hawaii food expenditures are away from home, secured through intermediated or
mainstream supply chains. This suggests that most Hawai‘i residents control only a portion of their
personal food buying decisions.39
Table 11: Local Food Marketing Options
Marketing Options Types of Agreements Benefits Drawbacks Direct sales to consumers Increasingly popular
farmers’ markets. Revenues one sale at a time. Community Supported Ag (CSA”S) and food hubs may be gaining traction.
Produces highest value return. Farmer gets 70-90% of retail. Food safety certification not required. Can build consumer linkages to individual farmers, i.e. loyalty.
Higher cost of sales. Unsold items are farmer’s responsibility.
Direct sales to retailers and restaurants
Contracts or standing handshake orders for dependable producers. Hit or miss for smaller producers.
Higher value return. Some certainty on sales. Opportunity for farmer identity marketing on some menus and in-store signage.
Requires delivery capacity. May take farmers off the farm to market. Returns ~70% of retail value. Some buyers may have food safety requirements. Lack of sales contracts and other potential competitive sellers.
Sales to distributors Standing contracts for specific volumes.
Moves largest produce volume. Services largest market places. One-stop sales for multiple products. Distributors assume cost for unsold items.
Farmer gets <40% of retail value. Larger markets require food safety certification. May not take all food available based on current markets.
3.2.2 Local food farms tend to be smaller
Nationally, small local food farms (gross farm sales less than $50,000) represented almost 81 percent of
all local food farms; medium-sized farms (gross farm sales $50,000-$249,999) represented 14 percent;
and large farms (sales of $250,000 or more) accounted for almost 5 percent of all local food farms.40
38
Feenstra, Visher, and Hardesty, “Developing Values-Based Distribution Networks to Enhance the Prosperity of Small and Medium Sized Producers.” 39
Leung and Loke, “Economic Impacts of Increasing Hawaii’s Food Self Sufficiency.” 40
Low and Vogel, Direct and Intermediated Marketing of Local Foods in the United States.

54
3.2.3 Enterprise size influences product routes
Typically, small farms largely rely on direct marketing. Mid-size farms are too large for direct marketing
but too small to be incorporated into vertically integrated supply chains. Large farms are incorporated
into vertically integrated supply chains.41
Low & Vogel (2011) dissect direct-to-consumer and intermediated marketing channels (regional
distributors and grocery stores, restaurants, or other retailers) using ARMS data:42
Almost two-thirds of all local food producers reported that local food sales accounted for at
least 75 percent of their total gross farm sales.
A vegetable/fruit/nut farm is eight times more likely to sell food commodities locally than other
farms.
Direct-to-consumer outlets accounted for approximately 75 percent of marketing channels for
local food sales.
As the size of local food sales farms increases, the frequency of farms selling through direct-to-
consumer marketing channels declines, and the frequency of sales through intermediated
marketing channels increases.
Most food goes through intermediated channels.
3.2.4 Revenue and product route are correlated
Vegetable, fruit, and nut farms, on average, generate $1,338 per acre in sales on 76 acres—four to six
times the revenue per acre on a farm that is 33-50 percent the size of the average field crop or livestock
farm.43
Average gross sales per acre ranges from $640 per acre for vegetable, fruit, and nut farmers
using direct-to-consumer outlets only
$1,310 per acre for those using both direct-to-consumer and intermediated outlets
Over $3,100 per acre for those relying exclusively on intermediated outlets.
3.2.5 Enterprise “values” also influence product routes
“Values-based” chains are different from traditional supply chains in that they attempt to enhance small
and midscale farmers’ financial viability by capturing price premiums in the marketplace for the
environmental and social benefits (values) embedded in the products.44
41
Ibid.; Lev and Stevenson, “Acting Collectively to Develop Mid-Scale Food Value Chains”; Stevenson et al., “Midscale Food Value Chains”; Buskirk et al., “A Traceability Model for Beef Product Origin within a Local Institutional Value Chain.” 42
Low and Vogel, Direct and Intermediated Marketing of Local Foods in the United States. 43
Ibid. 44
Stevensen, G.W. and Pirog, Rick, Values-Based Food Supply Chains: Strategies for Agri-Food Enterprises-of-the-Middle; Feenstra et al., “Using a Supply Chain Analysis To Assess the Sustainability of Farm-to-Institution Programs.”

55
The tension within many local and regional food distribution systems lies between values-driven
decision-making on the one hand and an emphasis on optimizing time, fuel, and/or capital on the
other.45
3.2.6 Three value chain “flows”: product, financial, and information
Boehlje, King, and Venturini outline three types of “flows” that are important features of a value chain:
product flow, financial flow, and information flow.46
3.2.7 Communicate food value chain flow and dynamics
The State’s self-sufficiency strategy document as well as studies and initiatives nationwide note that, to
make strategic food system improvements, we must understand the product, financial, and information
flow through Hawaii’s food supply chain – what’s being grown and its path from farm to fork. For
example, supply chain dynamics inform agriculture policy (e.g., a food sustainability standard), land use
planning (e.g., identifying important agriculture lands), and other strategies to increase local market
share (e.g., tax incentives, institutional procurement, processing facilities, etc.). More importantly,
supply chain information is an invaluable decision-making tool for agribusinesses and entrepreneurs. It
simplifies market research, creates opportunities for distribution innovations, and creates new markets
(e.g., waste-to-product, mobile processing, etc.).
Importantly, there is no silver bullet – there is no single supply chain variable that if optimized could
predictably increase the efficiency and thereby profitability of local/regional food supply chains.47
However, by mapping the whole local supply chain, and understanding the interactions within that chain
as a system, the most effective leverage points can be identified.48 Moreover, communicating
distribution variables and best practices to actors across the supply chain can enable suppliers,
distributors, and buyers to better understand each other’s business decisions and identify opportunities
to forge partnerships.49
In Hawaii, this process was started in the 2011 OmniTrak report commissioned by the Ulupono Initiative
(see Figure 2: Local Food Market Demand Study Value Chain).50
45
Bittner et al., Maximizing Freight Movements in Local Food Markets. 46
Feenstra et al., “Using a Supply Chain Analysis To Assess the Sustainability of Farm-to-Institution Programs.” 47
Bittner et al., Maximizing Freight Movements in Local Food Markets. 48
Hawkes, “Identifying Innovative Interventions to Promote Healthy Eating Using Consumption-Oriented Food Supply Chain Analysis.” 49
Bittner et al., Maximizing Freight Movements in Local Food Markets. 50
OmniTrak Group Inc., “Local Food Market Demand Study of O‘ahu Shoppers.”
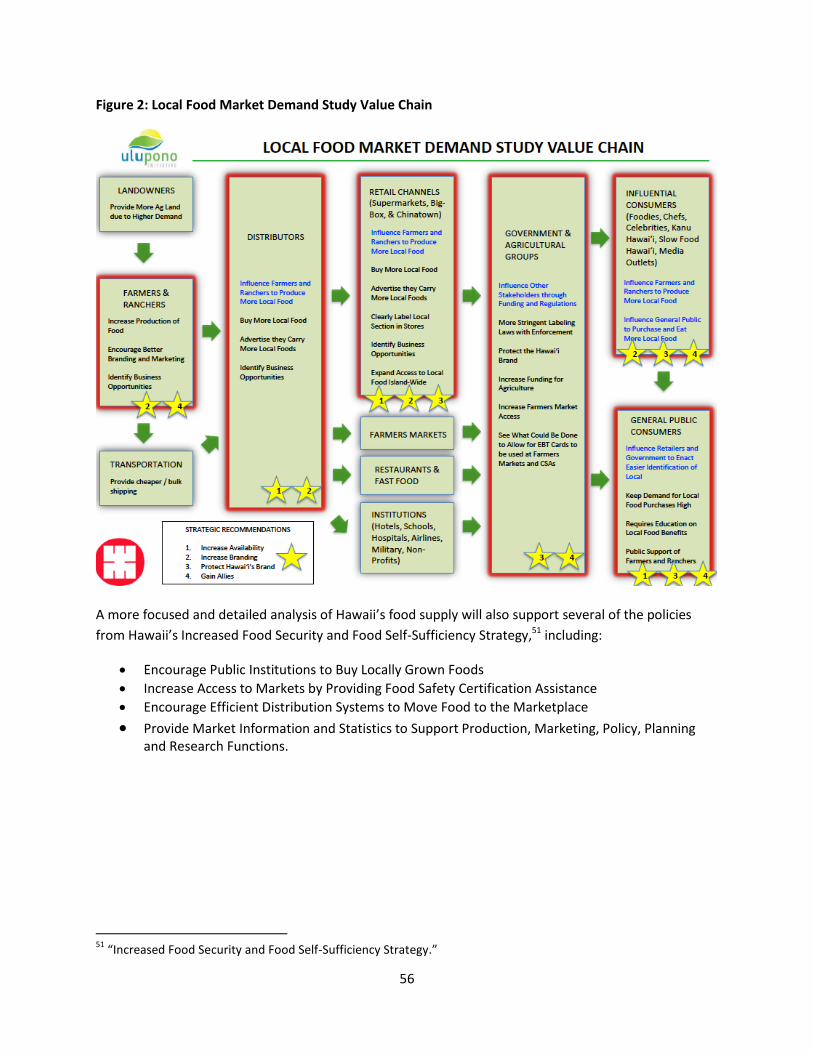
56
Figure 2: Local Food Market Demand Study Value Chain
A more focused and detailed analysis of Hawaii’s food supply will also support several of the policies
from Hawaii’s Increased Food Security and Food Self-Sufficiency Strategy,51 including:
Encourage Public Institutions to Buy Locally Grown Foods
Increase Access to Markets by Providing Food Safety Certification Assistance
Encourage Efficient Distribution Systems to Move Food to the Marketplace
Provide Market Information and Statistics to Support Production, Marketing, Policy, Planning and Research Functions.
51
“Increased Food Security and Food Self-Sufficiency Strategy.”

57
3.3 Methods of Food System Assessment
3.3.1 Eight types of food system assessments have emerged
Any given food assessment may include elements from one or more of these types:52
Community Food Asset Mapping using informal, participatory mapping exercises
Community Food Security Assessment focusing on low-income residents’ access to food
Food Desert Assessment identifying locations in a given region where residents have limited access to supermarkets or other healthy food sources.
Land Inventory Food Assessment identifying underutilized land suitable for agriculture and assessing the extent to which a municipality or region can feed itself (similar in some ways to the Kauai Important Agriculture Lands study)
Local or Regional Foodshed Assessment focusing on geographic boundaries of local food procurement, sometimes including the land requirements for feeding a given population.
Local Food Economy Assessment assessing economic conditions in local farm and food systems to inform community-based food commerce, jobs, and wealth creation
Food Industry Assessment identifying key food industries in a region, perhaps assisting investors in making investment decisions or identifying existing or potential industry clusters in food
Comprehensive Food System Assessment, which analyze the systemic nature of a local, state, or regional food system, including the land requirements, production, processing, distribution, consumption, and disposal of waste.
Of those, a “Comprehensive Food System Assessment” seems best suited to this project, but it requires
both quantitative (data, geospatial) and qualitative (surveys, interviews) analysis and can be expensive
and overly complex.
3.3.2 Life cycle analysis is complex and expensive
Related to but different from food system assessments is life cycle analysis (LCA) and life cycle
management. LCA is oriented toward environmental indicators (e.g., energy use, greenhouse gas
emissions, etc.). ISO standards have been developed for LCA: 14040, 14041, 14042, and 14049. The
United Nations Environment Program (UNEP) and the Society for Environmental Toxicology and
Chemistry (SETAC) sponsor a Life Cycle Initiative focused on products and enterprises,53 and the
nonprofit Ecoinvent provides LCA data and services across many industry sectors.54
LCA’s are complex and expensive.55 The USDA completed an energy LCA for the US food system using
input-output material flow analysis data from the UN,56 Heller did a macro-level LCA for the US food
52
Freedgood, Pierce-Quiñonez, and Meter, “Emerging Assessment Tools To Inform Food System Planning.” 53
United Nations Environment Program (UNEP) and Society for Environmental Toxicology and Chemistry (SETAC), “Life Cycle Initiative.” 54
“EcoInvent.” 55
Edwards-Jones et al., “Testing the Assertion That ‘local Food Is Best’: The Challenges of an Evidence-Based Approach.” 56
Canning et al., Energy Use in the U.S. Food System.

58
system,57 and the Department of Environment, Food, and Rural Affairs (DEFRA) did a comparative LCA
for major foods in Britain.58
3.3.3 Freight movement analysis provides a macro-level picture, with limitations
3.3.3.1 Freight Analysis Framework
The Freight Analysis Framework (FAF) integrates data from a variety of sources to create a
comprehensive picture of freight movement among states and major metropolitan areas by all modes of
transportation. With data from the 2007 Commodity Flow Survey (see Section 3.3.3.2 “Commodity Flow
Survey” on page 59) and additional sources, FAF version 3 (FAF3) provides estimates for tonnage, value,
and domestic ton-miles by region of origin and destination, commodity type, and mode for 2007, the
most recent year, and forecasts through 2040. Provisional annual data for 2011 are available. Also
included are state-to-state flows for these years plus 1997 and 2002, summary statistics, and flows by
truck assigned to the highway network for 2007 and 2040.59
The Food FAF refers to three different types of movements:
Within region (or intraregion)
Inbound movements are movements originating outside the area
Outbound movements are movements originating in the area and destined for a location
outside.
There are 43 commodity codes within the FAF database that correlate with the Standard Classification of
Transported Goods used by Bureau of Transportation Statistics and the US Census Bureau. Of the 43
classifications, there are eight commodities that are associated with the food industry:
1. Live animals and fish
2. Cereal grains
3. Other agricultural products
4. Animal feed
5. Meat and seafood
6. Milled grain products
7. Other foodstuffs
8. Alcoholic beverages.
As a planning tool, the FAF allows freight data to be aggregated over various geographic areas so that
federal, state, and local governments can better understand the flow of cargo from one region or state
to another and can forecast growth in shipments. The FAF is a useful tool in that it aggregates an
immense amount of data collected by various government agencies and measures freight movements
throughout the United States and identifies domestic and international trading partners.
57
Heller and Keoleian, “Assessing the Sustainability of the US Food System: A Life Cycle Perspective.” 58
Comparative Life Cycle Assessment of Food Commodities Procured for UK Consumption through a Diversity of Supply Chains. 59
“Freight Analysis Framework - FHWA Freight Management and Operations.”
59
The January 2010 Greater Philadelphia Food System Study60 used the FAF to track the types of food
movements over time, trace food origins and destinations, and disaggregate movements by commodity
(by weight and value). It also identified the challenges and shortcomings of the FAF database:
Because the forecasts are first based on national controls, aggregation down to the
metropolitan level loses some accuracy. This, however, is true for any statistical database–the
larger the region or sample size, the more reliable the numbers derived from a statistical
sampling.
The geographic areas used in the FAF are not ideal or consistent with other US surveying and
data collecting initiatives. County-level data is not available in the FAF.
No through movements are included. For example, a movement from Washington, DC, to New
York City may pass through Greater Philadelphia but would be unaccounted for in the FAF.
Because the base year is 2002, forecasts cannot account for the recent increase in food and fuel
prices, the popularity of biofuels, or the growing popularity of the local food movement.
Weight and value of commodities may be double counted. A finished product that moves into
the Philadelphia region and is warehoused and then distributed to a retailer is counted as both
an inbound movement and a within region movement, thus double counting the product.
Similarly, raw products that go into a processing center and come out as finished products are
counted twice–as the raw product and as a fraction of the finished product.
The FAF database and its original data sources do not account for unregulated freight. A
shipment of avocadoes coming from Mexico crosses the United States border and must be
unloaded to an American truck or packaged by an American company. If this freight has a final
destination in Greater Philadelphia, the shipment will be counted as a domestic inbound
movement, not an international import.
It is important to note that the FAF is designed to quantify movements, not consumption. For
example, 40 million tons of foods are moving into, within, and out of Greater Philadelphia.
However, that same region consumes about three million tons of food.
3.3.3.2 Commodity Flow Survey
The Commodity Flow Survey (CFS)61 is the primary source of national and state-level data on domestic
freight shipments by American establishments in mining, manufacturing, wholesale, auxiliaries, and
selected retail and services trade industries. Data are provided on the types, origins and destinations,
values, weights, modes of transport, distance shipped, and ton-miles of commodities shipped. The CFS
is a shipper-based survey and is conducted every five years as part of the Economic Census. It provides
a modal picture of national freight flows, and represents the only publicly available source of commodity
flow data for the highway mode. The CFS was conducted in 1993, 1997, 2002, 2007 and most recently in
2012. The CFS includes:
60
Greater Philadelphia Food System Study. 61
“Commodity Flow Survey.”

60
Inbound and outbound shipment characteristics for the entire state, Honolulu, and the rest of
the state by commodity group (the same 43 Standard Classification of Transported Goods
(SCTG) Two-Digit Commodities included in the FAF)
Shipment characteristics by NAICS (North American Industry Classification System),62 including
food manufacturing, grocery and related product merchant wholesalers, and farm product raw
material, for the entire state, Honolulu, and the rest of the state.
3.3.4 Local Food System Exemplary Projects
The Hawaii Food System Metrics Library (see page 28) includes many of the products of efforts in
communities around the world that are similar to the Hawaii Food Security Metrics System Project (see
the “Local Assessments” section of the “Local Food System Planning” subcollection). Two projects stand
out as exemplary.
3.3.4.1 Vermont Farm to Plate63
1. Strategic plan for food system development64 based on an 18-month statewide public
engagement process that included these steps:
a. Assemble and analyze food system data (including GIS analysis)
b. Stakeholder interviews, focus groups, summits
c. New research
d. Objectives and strategies
2. Goals and Indicators
3. Data about indicators65 available online and summarized in annual reports
4. Food System Atlas, searchable by marketing, farm input, food production, food processing, food
distribution, and retail outlet categories
3.3.4.2 West Virginia Food System66
This report assesses West Virginia’s local food system infrastructure and existing supply chains to
identify opportunities and constraints, drawing upon national, state, and local food systems literature;
federal and state statistics and data; and extensive personal interviews. It identified direct,
intermediated, and mainstream marketing supply chains and reviewed in depth infrastructure for
processing, aggregation, distribution, and retail of local food.
62
Special Projects Staff, “North American Industry Classification System (NAICS) Main Page.” 63
“Vermont Food Atlas.” 64
“Vermont Farm to Plate.” 65
“Vermont Farm to Plate Strategic Plan | Vermont Food System Atlas.” 66
Peters et al., West Virginia Food System: Opportunities and Constraints in Local Food Supply Chains.

61
3.4 Sources of Secondary Data for Local Food Systems
3.4.1 There is a wealth of sources – with limitations
A tremendous amount of secondary data is available about local food systems. The Hawaii Food System
Metrics Workbook (page 25) summarizes the data available, and the data sources are available in the
Hawaii Food System Metrics Library (page 28). Table 2: Summary of Production and Consumption Data
Available (by weight) on page 12, Table 3: Summary of Data Available for Production Expenses and
Revenue and Consumption Expenditures (in dollars) on page 13, and Table 4: Summary of Data Available
for Value Chain Components on page 15 summarize the availability of data most related to the Hawaii
Food Security Metrics System Project.
The advantages of most of these data sources are that they are available electronically and reliable –
they are prepared by statisticians in reputable organizations, using standard research and statistical
practices. Moreover, the latest Census of Agriculture data are also available and can be used to paint a
detailed picture of Hawaii’s local food system.
These data sets also have some disadvantages. Data are not universally available. Most importantly,
there are no sources of annual production data for fruits and vegetables. There are also large gaps in
data related to food consumption – estimates are necessary. In addition, data are not collected
regularly, and there is typically a lag between collection and publication, so data are not available in
“real time.” More detailed information about some of these limitations is included in the subsections
that follow.
To compensate for these limitations, primary data can be collected. Section 3.5 “Collecting Primary
Data” on page 67 outlines those options.
3.4.1.1 Fruit and vegetable production data are largely missing
Annual fruit and vegetable secondary production data are only available for avocados, papaya, guava,
and banana.
3.4.1.2 The flow of local food through market channels is untraceable
For most local food products, it is very difficult to track the amounts of food that flow through different
market channels. There is no requirement for farmers to disclose their production or their means of
sale. Distributors are also not required or motivated to disclose their marketing patterns, and retail
outlets and restaurants are so diversified that it would be very difficult to track the specific paths and
volumes that farmers deliver to these markets. Direct sales from farmer to consumer are even more
complex to track. Farmers markets, roadside stands and other direct sales are generally conducted in
cash and therefore impossible to track with any accuracy.
3.4.1.3 Consumption of local food is not precisely measureable
There seems to be no credible set of methods to precisely measure the percentage of food consumed
that is locally grown.67 All per capital consumption is estimated based on national consumption data
67
Conner et al., “Measuring Current Consumption of Locally Grown Foods in Vermont.”

62
and assumptions about local dietary idiosyncrasies. There is a paucity of public information about fresh
food consumption and consumer preferences. There are no studies that define the average Hawaii diet
or that quantify how much of what types of food are actually consumed by Hawaii residents and the de
facto visitor and military populations.
Other food system projects have estimated consumption using a combination of secondary data and
direct inquiries to institutional food service operations, nonprofits that manager directories, distributors,
retailers, and government agencies.68
3.4.1.4 Data are not available for some components of the food systems
Some informal production (home production, hunting) is not measureable. However, this is a small
fraction of local production and consumption.
3.4.2 USDA Data69
This section outlines the range of state and county food system data available directly from the USDA,
which is summarized immediately in Table 12: Summary of NASS Data Availability at the State and
County Level.
Table 12: Summary of NASS Data Availability at the State and County Level
Monthly (State) Annually (State) 5-Year Ag Census
(State, County, zip)
Operations
Number of farms x x (by crop)
Farm characteristics Average acreage x
Ownership x
Operators & Labor
Operator characteristics x
Computer use x
Farm labor x
Land & Water
Land use Land in farms x
Irrigation x
Production
Crops x (by crop)
Avocado, banana, guava, papayas, and macadamia nut acreage, yield, production, & use
x
Livestock, poultry and their products
x
Red meat production by species x
Number of head, live weight and dressed weight of cattle, calves, sheep and lambs and hogs and
x Inventory of all cattle and calves, number of calves born, and total
68
Ibid.; King et al., Comparing the Structure, Size, and Performance of Local and Mainstream Food Supply Chains. 69
2013 Guide to Products and Services.

63
Monthly (State) Annually (State) 5-Year Ag Census
(State, County, zip)
pigs slaughtered in commercial plants and number by class in federally inspected plants
number on feed Meat animal production Number of head slaughtered at non-federally inspected plants
Milk and dairy products, including number of milk cows, production per cow and total milk production
x
Average number of layers, eggs per layer, & total egg production
x
Number of colonies producing honey, yield per colony, & honey production
x
Floriculture production x
Inputs & Expenses
Cash rents paid x (State & County)
Chemical use x
Production expenses x
PAD
Farms/acres with veggies for fresh-market sales
x
Number of federally-inspected meat plants
x
Number of non-federally inspected meat plants
x
Consumption
Income
Meat value of production, cash receipts, home consumption and gross marketings Milk cash receipts and value of production Egg value of production Avocado, banana, guava, papayas, and
x

64
Monthly (State) Annually (State) 5-Year Ag Census
(State, County, zip)
macadamia nut price & crop value Honey price and value Floriculture price and value of wholesale sales and growers having $100,000 or more in sales
Direct marketing (farms with direct sales (number, % farms, value, % total value, per capita, # farmers markets & per 1000, % change, CSA sales)
x
3.4.2.1 NASS Regular Reports70
The USDA NASS produces the monthly reports of state-level production for:
Milk and dairy products, including number of milk cows, production per cow and total milk
production during preceding month for major States
Number of head, live weight and dressed weight of cattle, calves, sheep and lambs and hogs and
pigs slaughtered in commercial plants and number by class in federally inspected plants
Red meat production by species.
Annual reports are also prepared for at the state and county level for:
Cash rents paid for irrigated and non-irrigated cropland and pasture
And at the state level for:
Number of farms in operation, land in farms, and average size (acreage) of farms
Inventory of all cattle and calves, number of calves born, and total number on feed
Meat animal production and marketings in pounds, value of production, cash receipts, home
consumption and gross marketings
Number of non-federally inspected plants and number of head slaughtered
Milk cash receipts and value of production
Average number of layers, eggs per layer, total egg production, and value (collected but not
reported to avoid disclosing individual operations)
Avocado, banana, guava, papayas, and macadamia nut acreage, yield, production, use, price and
crop value
70
“Hawaii Portal, USDA NASS.”

65
Number of colonies producing honey, yield per colony, honey production, average price and
value
Floriculture production, price and value of wholesale sales and growers having $100,000 or
more in sales. Number of growers and growing area for growers with $10,000 or more in sales.
3.4.2.2 Five-year Census of Agriculture71
The Census of Agriculture is conducted every five years to obtain agricultural statistics for each county,
State and the Nation. The Census is the leading source of statistics about the Nation’s agricultural
production and the only source of consistent, comparable data at the county, State and national levels.
Special Studies and Censuses are conducted as follow-on programs to the Census. The follow-on
programs include an Organic Production Survey, a Farm and Ranch Irrigation Survey, an On-Farm
Renewable Energy Production Survey and a Census of Horticultural Specialties.
Separate State reports display statistics for the entire State and every county or equivalent. Data
include
Number of farms
Farm characteristics
Ownership
Operator characteristics
Computer use
Farm labor and migrant workers
Land use
Irrigation
Crops
Livestock, poultry and their products
Chemical use
Production expenses
Direct marketing
Income.
The 2014 reports will cover 2012, with comparative data for previous census years.
Specialty Crop Tabulations present agricultural statistics for specialty crops for all farms in the 50 states.
Tables show production, demographic and economic data for farms producing specialty crops. Specialty
crops are defined as fruits and vegetables, tree nuts, dried fruits, nursery crops (including floriculture)
and maple syrup.
ZIP Code Tabulation present agricultural statistics by five-digit postal ZIP Code for all 50 States. The data
table shows farm counts by ZIP code for various classifications.
71
“Census of Agriculture.”

66
3.4.2.3 Agricultural Atlas72
The Agricultural Atlas of the United States features thematic maps for the nation, states, and counties
highlighting agricultural activities and characteristics such as farm number and size, selected crops
harvested, livestock and poultry inventories and number sold, agricultural sales, production expenses,
land use, irrigation patterns, fertilizer and chemical use machinery and equipment on farms.
3.4.2.4 Agricultural Resource Management Survey (ARMS)73
The ARMS is USDA’s primary source of information on the financial condition, production practices, and
resource use of America's farm businesses and the economic well-being of America's farm households.
The ARMS is the only national survey that provides observations of field-level farm practices, the
economics of the farm businesses operating the field (or dairy herd, green house, nursery, poultry
house, etc.), and the characteristics of farm operators and their households (age, education, occupation,
farm and off-farm work, types of employment, family living expenses, etc.).
The ARMS is not currently conducted in Hawaii. A request could be made to change that (see Section
3.4.2.7 “Tap USDA expertise to make the best use of data” on page 66). See Low and Vogel for issues
with reconciling Census of Agriculture and ARMS data.74
3.4.2.5 Surveys, Technical Assistance, and Microdata Analysis75
In addition to the many statistical activities directly related to its mission, NASS conducts surveys for and
lends technical expertise to other Federal agencies, State governments and private organizations on a
reimbursable basis. NASS provides support and assistance in the areas of questionnaire and sample
design, data collection and editing, analysis of survey results and training. The NASS Data Laboratory
also provides access and analysis of microdata for each State by researchers desiring to explore
relationships among agricultural variables relevant to environmental, resource management and
productivity trends and developments.
3.4.2.6 Changes at USDA
NASS is currently undergoing changes on a national level. The responsibility for Hawaii’s data collection
and analysis is shifting to USDA’s regional office in Sacramento. It is unclear at the time of this report
just what impacts this may have on the extent and timeliness of data collection both locally and
nationally.
3.4.2.7 Tap USDA expertise to make the best use of data
As noted in Section 3.4.2.5 “Surveys, Technical Assistance, and Microdata Analysis” on page 66, NASS
conducts surveys for and lends technical expertise to other agencies on a reimbursable basis. It may
prove effective to use the USDA’s data collection and analysis expertise to access existing data that isn’t
typically published and/or to collect high value primary data.
72
“2012 Census Ag Atlas Maps.” 73
“ERS ARMS Farm Financial and Crop Production Practices.” 74
Low and Vogel, Direct and Intermediated Marketing of Local Foods in the United States. 75
“Special Tabulations, NASS.”

67
3.5 Collecting Primary Data
3.5.1 Previous Primary Data Collection by the HDOA
In the past, HDOA published “Market News.” Based on conversations during the walkabout (see Section
3.1.3 on page 29), Market News appears to have been widely followed in the agricultural community. It
reported inshipments from elsewhere and interisland transshipments along with the prices of different
commodities that would inform farmers of important market trends. It provided the most
comprehensive statistical snapshot of the State’s total and disaggregated agricultural production.
During the period of fiscal belt-tightening in 2007-2008, Hawaii’s administration decided that the data
collection division of the HDOA was not a high priority public service. More than twenty-five HDOA
employees were laid off, and much of the State’s agricultural data stopped being collected.
HDOA plans to restore something akin to Market News in the near future.
3.5.2 Options for Collecting Primary Data
Nationally, most efforts at assessing local food systems involved some level of primary data collection.
Common data collection approaches include:
Surveys conducted by mail, online, and by phone
Network-based direct, personal requests or interviews. Because some may be hesitant to share
what they consider sensitive information and given the highly relational nature of local culture
and Hawaii’s agricultural industry in particular, it is likely that direct, personal requests will be
necessary. In those cases, a “network” approach will be considered, starting with the existing
networks of key informants. Each contact would, in turn, be asked for advice on others to
contact and for help making introductions, as necessary.
Focus groups
Form communities of practice (COP) around measuring local foods and use participatory
research76
Contacts by volunteers. Volunteers may also be recruited to assist in expanding the data
collection network. Volunteers could come from the many agriculture-focused civic
organizations and via university internship and service-learning programs.
Incorporate requirements for data provision into existing regulatory or market requirements,
like permits, filings, or bids.
These resources in the “Data Gathering Strategies” subcollection of the Hawaii Food System Metrics
Library (see Section 3.1.2.2 on page 28) highlight communities that were successful in capturing related
76
Conner et al., “Measuring Current Consumption of Locally Grown Foods in Vermont.”

68
primary data: Conner (2013),77 Bittner et al (2011),78 Feenstra et al (2011),79 Bloom and Hinrichs
(2010),80 Clancy and Ruhf (2010),81 and Bonney et al (2009).82
3.5.3 Filling Specific Secondary Data Gaps with Strategic Primary Data Collection
Depending on the outcomes of the metrics prioritization process (see Section 2.1.4 “Next Step: Vetting
with Stakeholders” on page 4), some primary data collection may be necessary to provide specific high-
value metrics, like land rents, fruit and vegetable production, direct sales, intermediated sales, pricing of
locally-produced goods, and differentiation of local and imported products beyond the farm gate,
particularly in intermediated markets.
77
Ibid. 78
Bittner et al., Maximizing Freight Movements in Local Food Markets. 79
Feenstra et al., “Using a Supply Chain Analysis To Assess the Sustainability of Farm-to-Institution Programs.” 80
Bloom and Hinrichs, “Moving Local Food through Conventional Food System Infrastructure.” 81
Clancy, K. and Ruhf, K., Regional Value Chains in the Northeast: Findings from a Survey. 82
Bonney et al., Sustainable Value Chain Analysis.
69
3.6 Data Management
3.6.1 The Need for Data Management
As demonstrated in Section 3.1.2 “Identifying Available Data” on page 28, in the Hawaii Food System
Metrics Workbook (see page 25), and in Section 3.4 “Sources of Secondary Data for Local Food Systems”
on page 61, the volume of available data related to food systems can be overwhelming.
The field of data management was developed to address this problem. The goal of data management is
to make raw data available as information that can be used to expand knowledge. When interpreted,
data become information. And when information is understood contextually and applied, it becomes
knowledge.
3.6.2 Past Data Management Challenges
In the past, data management could be a laborious process involving complicated database software,
the acquisition of data sets, manual data entry, and sophisticated data analysis. Data scrubbing and
normalization were particularly problematic. Because of the varied sources of data and because some
sources are unfiltered or out-of-date, data has to be “scrubbed,” or verified to confirm accuracy.
Likewise data normalization is necessary to align disparate data file types into a universally-accessible
data schema. Data files come from a variety of software tools in a range of formats, including doc, xls,
csv, access, net, sql, pdf, etc. Data schema are data organizational systems, or the organizational
structure of data that describe how real world entities are modeled in the database. Normalization
ensures that data are formatted and integrated consistently, so the database maintains integrity.
3.6.3 Advances in Data Management
Recent advances in technology, however, have greatly simplified these processes. For example, with
applications like dataZoa (www.datazoa.com), the user simply drags data from a data portal (e.g.,
www.nass.usda.gov) and drops it into the dataZoa interface. From there, users view, analyze, share,
download, and create charts, tabular displays, and data dashboards or portals. Moreover, once
established, the dataZoa connections to data are live – dataZoa keeps the data sets updated with the
latest data uploaded by the original source.
3.6.4 Recommended Data Management Platform
For this project, dataZoa has offered seven years of free access to its platform and technical support.
However, because the expiration of the seven-year grant may impact future project viability, dataZoa
will only be used as a backup system.
It is recommended that a platform be developed for this project using the heavily vetted open source
code powering sites like www.data.gov, www.data.gov.uk, and www.open-data.europa.eu. Information
about the open source code is available at github.com/GSA/data.gov and www.ckan.org. The same
developers that built and use that code are available to build an expandable platform for this project.
Moreover, virtual private servers and cloud computing now make just about any web application
affordably scalable, so it is recommended that a service like MediaTemple (mediatemple.net) be used
for the server and that it be connected to the cloud via Amazon’s Web Services.

70
These options are most cost-effective, freeing up remaining financial resources for the more labor-
intensive aspects of data management, which are discussed immediately below.
3.6.5 Task at Hand: Metric Prioritization
Because robust data management tools are readily available, the challenge with metric development is
not technological. The challenge is one of prioritization and metric selection. The most important task
at hand, therefore, is to thoughtfully identify the data sets and related metrics that are most meaningful
and useful.
3.6.6 Data Management Functions
Regardless of the technology, additional data management functions must be performed by
experienced managers and developers. Sustain Hawaii has an experienced data management team in
place, which is prepared to plan, develop, and operate the Hawaii Food Security Metrics database
(during Phase 3 of the project) and then train others to manage operations into the future (in Phase 6).
By way of overview, to use data to build knowledge, ten fundamental data management functions are
necessary, which can be clustered into four activity groups:
Control Activities: supervisory activities performed on an on-going basis
1. Data Governance – high-level planning, supervision and control over data management and use
Planning Activities: setting and maintaining the strategic and tactical course
2. Data Architecture Management – the development and maintenance of data architecture, the
standards that govern data collection, storage, integration, and use
3. Reference & Master Data Management – control activities to ensure consistency of contextual
data values
Development Activities
4. Data Development – database design, development, testing, and maintenance
Operational Activities: service and support activities performed on an on-going basis
5. Database Operations Management – control and support for the data lifecycle, from creation
and acquisition through archival and purge
6. Data Security Management – activities to ensure privacy and confidentiality and to prevent
unauthorized and inappropriate data access, creation or change
7. Data Warehousing & Business Intelligence Management –decision and knowledge support to
those engaged in data reporting and analysis
8. Document & Content Management – enabling access to data found within unstructured sources
of electronic files and physical records
9. Meta Data Management – enabling easy access to high quality, integrated meta data
10. Data Quality Management – ensuring the fitness of data for use.

71
3.6.7 Challenges Specific to Food Systems
The varied data sets needed to paint a complete food systems picture further complicate data
management. By way of example, Loke & Leung (2013)83 encountered these challenges when
developing Hawaii’s Localization Ratio:
Standardization: the task of compiling, aggregating and converting the many food products with
different unit measures into a common unit measure. Various databases and data sources utilize
different measuring units. American databases such as NASS use pounds, short tons, gallons, and unit
counts (e.g., number of eggs or heads of cattle). International databases (foreign imports and exports)
adopt the metric system and report measures ranging from kilograms, metric tons (tonnes), liters,
kiloliters, and unit counts.
Furthermore, the conversion of volume measure to weight measure (e.g., kiloliters to pounds or gallons
to kilograms) requires knowledge of the specific liquid’s density. For example, one liter of water (at 4
degrees Celsius) is about one kilogram and converts to about 2.2 pounds, whereas one liter of olive oil is
about 0.92 kilogram and converts to about 2.02 pounds.
Finally, it is important to convert the measurement of food items to their most consumable form. For
example, livestock products are defined in dressed weight as opposed to live weight and seafood is
defined in edible weights as opposed to product weight.
Reconfiguration: When specific items from various datasets or data sources are not available or not
clearly delineated, it is necessary to reconfigure the initially defined food groups and subgroups. For
example, data sets don’t always differentiate canned, dried, or processed fruits and vegetables. Hence,
Loke and Leung reconfigured fruits and vegetables to “fresh fruits and fresh vegetables.” All the
undifferentiated products were aggregated into the residual (catch all) food group “Others.”
Validation: assessing how significant and relevant the various compiled statistics and estimates are in
the various food groups. The rationality and consistency tests within and across time frames are
important to establishing the validity of the information presented. Double counting is a real hazard
when reconfiguring the various foodgroups/subgroups, redistributing the weight measure of various
food products, and in measuring processed (value-added) products. The same challenge is encountered
when aggregating out-shipment (export) volumes from various island ports. Summing up volumes from
each island port will lead to double counting since a large volume of exports are shipped to Honolulu
before being shipped to the continental United States. Secondly, out-shipment from Honolulu can also
imply in-shipment to neighbor island ports.
Importantly, once overcome initially (as has been done by Loke & Leung), these standardization,
reconfiguration, and validation challenges become manageable during ongoing project and data
management.
83
Loke and Leung, “Hawaii’s Food Consumption and Supply Sources: Benchmark Estimates and Measurement Issues.”

72
3.7 Making Data and Metrics Accessible
3.7.1 Data Portal Models
Data portals are plentiful, including several that are focused on agricultural and food systems. The
Hawaii Food Security Metrics System Project can link to and include features similar to the portals
introduced below.
3.7.1.1 ERS Food Environment Atlas
The objectives of the Atlas are to assemble statistics on food environment indicators to stimulate
research on the determinants of food choices and diet quality, and to provide a spatial overview of a
community's ability to access healthy food and its success in doing so.
The Atlas assembles statistics on three broad categories of food environment factors:
Food Choices—Indicators of the community's access to and acquisition of healthy, affordable
food, such as: access and proximity to a grocery store; number of foodstores and restaurants;
expenditures on fast foods; food and nutrition assistance program participation; food prices;
food taxes; and availability of local foods.
Health and Well-Being—Indicators of the community's success in maintaining healthy diets, such
as: food insecurity; diabetes and obesity rates; and physical activity levels.
Community Characteristics—Indicators of community characteristics that might influence the
food environment, such as: demographic composition; income and poverty; population loss;
metro-nonmetro status; natural amenities; and recreation and fitness centers.
The Atlas currently includes over 211 indicators of the food environment. The year and geographic level
of the indicators vary to better accommodate data from a variety of sources. Some indicators are at the
county level while others are at the State or regional level. The most recent county-level data are used
whenever possible.
3.7.1.2 ERS Atlas of Rural and Small Town America
The Atlas of Rural and Small-Town America assembles statistics on four broad categories of
socioeconomic factors:
Agriculture: Indicators from the latest Census of Agriculture, including number and size of farms,
operator characteristics, off-farm income, and government payments.
Jobs: Economic data from the Bureau of Labor Statistics and other sources, including
information on employment trends, unemployment, industrial composition, and household
income.
People: Demographic data from the latest American Community Survey, including age, race and
ethnicity, migration and immigration, education, household size and family composition. Data
have been added on veterans, including service period, education, unemployment, income, and
demographic characteristics.
County classifications: The rural-urban continuum, economic dependence, persistent poverty,
population loss, onshore oil/natural gas counties, and other ERS county codes.
73
3.7.1.3 DataFerrett
DataFerrett is a US Census data analysis and extraction tool to customize federal, state, and local data to
suit specialized requirements. DataFerrett can produce an unlimited array of customized spreadsheets
and then turn those spreadsheets into graphs and maps without any additional software.
Datasets accessible through DataFerrett that may be useful include: Census data, County Business
Patterns, Consumer Expenditure Survey, Behavioral Risk-Factor Surveillance System (BRFSS), National
Health and Nutrition Examination Survey (NHANES), and National Survey of Fishing, Hunting and
Wildlife-Associated Recreation (FHWAR).
3.7.1.4 North Central Region County Food Systems Profiles Portal84
The Applied Population Laboratory at the University of Wisconsin-Madison created this portal to provide
an overview of existing data across a broad scope of food systems activities, document how key
indicators are changing over time, and serve as a baseline to identify opportunities for growth or
expansion in regional food systems.
Data for this profile was accessed from existing secondary data sources including the US Census of
Agriculture and the United State Department of Agriculture. Indicators featured included:
Food Access (USDA ERS)
Food Assistance
Health
Local and Direct Markets (USDA NASS, AMS; Census)
Processing and Distribution
Production Agriculture (USDA NASS).
Outputs include comprehensive food systems data profiles by County and regional maps by indicator.
3.7.1.5 CARES National Interactive Maps85
Since 2000, the Center for Applied Research and Environmental Systems (CARES) at the University of
Missouri has maintained a robust portal for public data, associated GIS layers, and a custom “map room”
to make public policy accessible as easy-to-use data visualizations. Available data sets related to local
food systems include:
Farm land
Crops
Farm demographics
NAICS data
Business locations and characteristics
Farm economics: ownership, operations, income, classification, practices, assets
Job counts by industry
84
“North Central Region County Food Systems Profiles Portal.” 85
“CARES Map Room: National Interactive Map.”

74
Industries and wages
Food prices
Food consumption
Food outlets: grocery, restaurant
Direct sales
Farmers markets
Food costs and expenditures
Food access and security.
3.7.1.6 PAN Plan Tracker86
The Hawai‘i Physical Activity and Nutrition Plan 2013-2020 (PAN Plan 2020) describes strategies to
increase physical activity and healthy eating, with long-term goals of reducing overweight, obesity, and
chronic disease among all Hawai‘i residents. The PAN Plan Tracker lists PAN Plan indicators, and current
values and targets (data and in charts). For each indicator, detailed information is available about the
indicator and the source and status of related data.
3.7.2 Wide-Ranging Options for Data Visualization
3.7.2.1 Data Visualization
Telling a story with data is one of the most straightforward ways to make data more accessible. And
because a picture is worth a thousand words, data visualization is the key to accessibility. The primary
goal of data visualization, therefore, is to communicate information clearly and effectively through
graphical means to stimulate viewer engagement and attention.
Basic principles of data visualization include:
Tailor visualizations to each audience’s unique needs and roles, making it as personal as possible
Present information in a clear and understandable manner, at the scale closest to the audience’s
experience
Provide relevant, timely, and complete data
Minimize noise, complexity, and unnecessary detail
Convey meaning that builds understanding and is actionable through behavior and decisions.
To visualize data effectively, therefore, requires clearly understanding audiences’ contexts, their
information needs, and their actions that the information will inform.
3.7.2.2 Data Visualization Tools
The best data visualization tools are flexible, adaptable, and built to accommodate updates and
expansion, allowing users to create new visualizations on-demand based on user-defined parameters
(e.g., crop, locale, year) and preferred visualization outputs (table, graph, map, flow chart, network,
etc.).
86
“Physical Activity and Nutrition Plan Tracker.”

75
The Hawaii Food System Metrics Library (Section 3.1.2.2 on page 28) includes many examples of data
visualizations. There are also visualization libraries (e.g., http://demos.telerik.com/kendo-
ui/dataviz/overview/index.html) that provide the code and documentation for creating most any type of
visualization.
As with data management, technology is not a barrier. The key is prioritization and implementation.
3.7.2.3 Mapping
Geospatial analysis has been used to map elements of the food supply chain (see the Maps subcollection
in the Visualization section of the Hawaii Food System Metrics Library (Section 3.1.2.2 on page 28)). For
example, a gap analysis has been used to identify potential processing, aggregation, and distribution
(PAD) hubs.87
Based on experiences in other communities, some have suggested mapping a number of the value chain
components featured in Table 8: Metric Prioritization: Value Chain Components on page 21:
Features of agricultural land
Temperature-controlled storage facilities
Existing food distributors
Food processors
Freight transportation networks
Grocery and retail outlets
Other high-volume local markets including school systems, universities, hospitals, and corporate
campuses.88
Sometimes schematic maps are equally valuable, like the value chain maps on pp. 40-41 of the “Island of
Hawaii Whole System Project Phase I Report.”89
3.7.3 Recommendations for Data Accessibility
A goal of the Hawaii Food Security Metrics System Project is to provide easy-to-use and -understand
comparisons of benchmarks and goals that help identify leverage points for change, establish realistic
goals, and monitor food system change.
As noted above, technology is not the challenge. The key is to clearly understand the target audience’s
context, information needs, and actions that the information will inform.
Making the data relevant and close to the issues that people care about is challenging. To meet that
challenge, two steps during Phase 3 of the project are recommended:
87
Peters et al., West Virginia Food System: Opportunities and Constraints in Local Food Supply Chains; Peters CJ et al., “Mapping Potential Foodsheds in New York State by Food Group: An Approach for Prioritizing Which Foods to Grow Locally.” 88
Day-Farnsworth and Morales, “Satiating the Demand.” 89
Page, Bony, and Schewel, “Island of Hawaii Whole System Project Phase I Report.”

76
1. Build a data accessibility and visualization platform that is flexible and able to adapt to a wide
diversity of user interests and needs. A beta version of the platform populated with actual
datasets and visualization tools to be ready for beta-testing by the end of 2014.
The platform and underlying database will be completely open source. In layman’s terms, this
means that anybody can use the data to create reports and visualizations tailored to their
interests.
As an example of the platform’s functionality, it will be built to “zoom” in and out geographically
and to isolate crop or industry-specific supply chains as granularly as existing data allows. The
data will include international, national, state, and county or inter-island levels, and, when
available, will include product-level data by individual business enterprise (i.e., site location and
organization). Temporally, and when available, data will be viewable: 1) historically (based on
archived data), 2) contemporarily (based on most recent data), and 3) in real-time (based on
user-input data). The initial focus will be on contemporary data.
2. Pilot visualizations with key stakeholders to identity those that are most meaningful and should
be featured in broader public information campaigns. During Phase 3 of the project, Sustain
Hawaii will work with stakeholders to
Identify unique contexts, roles, and needs
Clarify knowledge that is most meaningful for each audience
Determine the best timing for data presentation to each audience
Create the most useful data visualizations for each audience.

77
3.8 Food and Agriculture Standards and Certifications
3.8.1 A range of regulations, certifications, and requirements impact local supply chains
Consumer, food industry, and government demands for food safety, animal welfare, and sustainability
have created a mix of mandated and voluntary certifications.90 Table 13: Food System Certifications is a
sample breakdown (though incomplete and state-specific) adapted from West Virginia.91
Table 13: Food System Certifications
State Federal Other Mandated Voluntary
Food establishment permit x x
Food manufacturer permit x x
Meat distributor license x x
Hazard Analysis & Critical Control Points (HACCP) plan
x x
Perishable Ag Commodities Act (PACA) license
x x
Good Agricultural Practices (GAP) certification x x x
Good Handling & Manufacturing Practices (GHP & GMP) certification
x x x
USDA organic certification x x
Liability insurance x x
3rd party certification under the Produce Traceability Initiative (PTI)
x x
Value-based certifications x x
3.8.2 Food Safety
3.8.2.1 Regulations
Bioterrorism Act of 2002: This act required one up, one back (one step forward, one step backward) traceability requirements among actors in the food supply chain. Hazard Analysis and Critical Control Points (HAACP): HAACP is a systematic preventive approach to
food safety and biological, chemical, and physical hazards in production processes that can cause the
finished product to be unsafe, and designs measurements to reduce these risks to a safe level. The
HACCP system can be used at all stages of a food chain, from food production and preparation processes
including packaging, distribution, etc. Meat HACCP systems are regulated by the USDA, while seafood
and juice are regulated by the FDA. The use of HACCP is currently voluntary in other food industries.
Food Safety Modernization Act (FSMA):92 The FSMA gives the FDA a legislative mandate to require
comprehensive, prevention-based controls across the food supply. Implementation of mandatory
preventive controls for food facilities and compliance with mandatory produce safety standards will be
90
Trienekens et al., “Transparency in Complex Dynamic Food Supply Chains.” 91
Peters et al., West Virginia Food System: Opportunities and Constraints in Local Food Supply Chains. 92
Center for Food Safety and Applied Nutrition, “FDA Food Safety Modernization Act (FSMA).”

78
required. FDA is in the process of developing a proposed rule that will establish science-based minimum
standards for the safe production and harvesting of fruits and vegetables and will address soil
amendments, worker health and hygiene, packaging, temperature controls, water, and other issues. As
part of FSMA implementation, the Institute of Food Technologists conducted pilot projects for food
traceability (see Section 3.9 “Traceability in Local Supply Chains” on page 81) and published a report of
recommendations in 2012.93
3.8.2.2 Standards
ISO 22000 – Food Safety:94 This international standard includes requirements for pre-requisites for
farming, requirements for food manufacturing, and guidelines for audits and certification.
Global Food Safety Initiative (GFSI):95 GFSI is, in part, a benchmarking organization that has recognized
a number of food safety management schemes that fulfill the criteria that a group of multi-stakeholders
have identified in the GFSI Guidance Document as covering best food safety practice. GFSI is not a
scheme in itself, and neither does it carry out any accreditation or certification activities. GFSI
recognized schemes include:
PrimusGFS96
GLOABG.A.P. (see Section 3.8.4 “Cross-over Standards” on page 79)
FSSC 2200097
SQF Institute (see Section 3.8.5.1 “Food Safety Certifiers” on page 79).
3.8.3 Values-Based Standards
There are a range of voluntary, values-based standards:
USDA Organic
Fair Trade USA
Fisheries Improvement Project98
Marine Stewardship Council99
Stewardship Index for Specialty Crops:100 This is a multi-stakeholder initiative dedicated to
developing tools for measuring sustainable performance across the specialty crops supply chain.
Metrics have been developed for water use efficiency, energy use, nitrogen use, phosphorus
use, and soil organic matter, and metrics are being developed for biodiversity, greenhouse
gases, and irrigation efficiency.
93
McEntire, Pilot Projects for Improving Product Tracing along the Food Supply System – Final Report. 94
“ISO 22000: Food Safety Management Systems.” 95
“Global Food Safety Initiative.” 96
“PrimusGFS.” 97
“Food Safety System Certification 22000.” 98
“Fisheries Improvement Project.” 99
“Marine Stewardship Council.” 100
“Stewardship Index for Specialty Crops.”

79
Global Reporting Initiative (GRI):101 GRI promotes the use of sustainability reporting as a way for
organizations to become more sustainable and contribute to sustainable development. GRI
provides sector guidance for all reporting organizations in the food processing sector, enabling
them to measure and report their sustainability performance. The guidelines set out reporting
principles, disclosures on management approach and performance indicators for economic,
environmental and social issues. The Food Processing Sector Supplement covers key sector-
specific issues, including: sourcing practices, community investment, impact of governmental
support, labor and management relations, practices that promote healthy and affordable food,
customer health and safety, product information, communication to consumers, and animal
welfare including breeding and genetic, animal husbandry, and transportation, handling, and
slaughter.
3.8.4 Cross-over Standards
GLOBALG.A.P.:102 a leading standards organization for good agricultural practice, which certifies food
safety and traceability, environmental sustainability, worker health and safety, and animal welfare at
three levels:
Primary Farm Assurance: non-GFSI recognized, entry-level food safety
Produce Safety Standard: GFSI recognized, essential food safety
Integrated Farm Assurance: food safety plus traceability, sustainability, worker safety, and
animal welfare.
3.8.5 Certification Services
3.8.5.1 Food Safety Certifiers
SQF:103 A division of the Food Marketing Institute, the Safe Quality Food Institute (SQF) provides
certification for “every link in the food chain,” at three levels:
Level 1: Fundamental food safety controls appropriate for low-risk products
Level 2: HACCP and ISO based food safety program recognized by the Global Food Safety
Initiative (GFSI)
Level 3: A comprehensive mastery of safety and quality management systems.
NSF:104 NSF International is a leading global certifier to GFSI benchmarked standards.
3.8.5.2 LCA/Supply Chain-based Certifiers
SCS Global:105 SCS Global provides certification, auditing, and testing services for a range of industries,
including food and agriculture: food safety (Global GAP, SQF, GAP, GMP), USDA Organic, Sustainably
101
“Global Reporting Initiative: Food Processing.” 102
“GlobalG.A.P.” 103
“Standards | Safe Quality Food Institute.” 104
“NSF Global Food Safety Initiative (GFSI) Certification.” 105
“SCS Global Services.”

80
Grown, Pesticide Free, Fair Trade USA, MSC Fisheries, Seafood Chain of Custody, and Fisheries
Improvement Project.
SCS Global uses a Life Cycle Assessment approach and develops custom-built supply chain management
tools to collect and analyze LCA data.

81
3.9 Traceability in Local Supply Chains Traceability is the capacity to follow the movement of a food through specified stages of production, processing, and distribution.106
3.9.1 Traceability would help with regulatory compliance
As part of implementation of the Food Safety Modernization Act (see 3.8.2.1” Regulations” on page 77),
the Institute of Food Technologists conducted pilot projects for food traceability and recommended in
its 2012 final report:107
FDA establish a uniform set of recordkeeping requirements for all FDA-regulated foods and not
permit exemptions to recordkeeping requirements based on risk classification.
FDA should require firms that manufacture, process, pack, transport, distribute, receive, hold, or
import food to identify and maintain records of Critical Tracking Events (CTEs) and Key Data
Elements (KDEs) as determined by FDA.
Each member of the food supply chain should be required to develop, document, and exercise a
product tracing plan.
FDA should develop standardized electronic mechanisms for the reporting and acquiring of CTEs
and KDEs during product tracing investigations.
FDA should accept summarized CTEs and KDEs data that are submitted through standardized
reporting mechanisms and initiate investigations based on such data.
FDA should consider adopting a technology platform that would allow efficient aggregation and
analysis of data submitted in response to a request from regulatory officials. The technology
platform should be accessible to other regulatory entities.
3.9.2 Traceability is also a market barrier
The lack of methods to track farm and/or product attributes through supply chains, including product
origin (i.e., local versus imported), has been recognized as a market barrier.108 Traceability
methodologies will also be necessary for emergence of “transitional” food systems that utilize pre-
existing, conventional food system infrastructure, while capturing social and economic benefits of
differentiation.109
A tracking system for Hawaii’s local food would support several of the policies and recommended actions from Hawaii’s Increased Food Security and Food Self-Sufficiency Strategy,110 including:
Expand and Improve Branding and Labeling Programs to Identify Local Foods and Consumer Education Programs to Help Consumers Know Local Farms and Farmers
Encourage Public Institutions to Buy Locally Grown Foods
Increase Access to Markets by Providing Food Safety Certification Assistance
106
International Standards Organization, Traceability in the Feed and Food Chain — General Principles and Basic Requirements for System Design and Implementation. 107
McEntire, Pilot Projects for Improving Product Tracing along the Food Supply System – Final Report. 108
Martinez et al., Local Food Systems: Concepts, Impacts, and Issues. 109
Bloom and Hinrichs, “Moving Local Food through Conventional Food System Infrastructure”; Buskirk et al., “A Traceability Model for Beef Product Origin within a Local Institutional Value Chain.” 110
“Increased Food Security and Food Self-Sufficiency Strategy.”

82
Encourage Efficient Distribution Systems to Move Food to the Marketplace
Provide Support for Multi-Functional Food Hub Facilities or Food Incubator Facilities
Provide Market Information and Statistics to Support Production, Marketing, Policy, Planning and Research Functions
Collect Data and Conduct Market Research on In-Shipments and Locally Produced Agricultural Commodities
Collect and Publish Agricultural Statistical Data through the Publication of Statistics of Hawaii Agriculture.
“Local” is just one example of how products may be differentiated. Others, including production
methods, can be monitored by values-based standards (see Section 3.8.3 “Values-Based Standards” on
page 78).111
3.9.3 Traceability is not currently widely practiced
In 2009, the Department of Health and Human Services Office of Inspector General found that:112
5 of 40 sample products could be traced through each stage of the food supply chain
Limiting factors included:
o processors, packers, and manufacturers not always maintaining lot-specific information,
as required
o other types of facilities not maintaining lot-specific information because it is not
required
o retailers receiving products not labeled with lot-specific information
o the mixing of products from a large number of farms.
Fifty-nine percent of the food facilities did not meet FDA’s requirements to maintain records
about their sources, recipients, and transporters.
One-quarter of the food facilities were not aware of FDA’s records requirements; others
highlighted practices designed to improve traceability.
3.9.4 Internationally, regimes are being developed to measure and monitor agricultural
performance metrics113
3.9.4.1 The Know-How Exists
The necessary technology exists to trace the movement of food (and each food lots’ characteristics).
However, the lack of common data elements in the supply chain hinder tracing (i.e., information is
recorded but not linked). Moreover, there are no standards for capturing and expressing info, both
internally within a firm and externally.114
111
Buskirk et al., “A Traceability Model for Beef Product Origin within a Local Institutional Value Chain.” 112
Levinson, Traceability in the Food Supply Chain. 113
Anstey, Measure What Matters: The Search for Farming’s Triple Bottom Line. Gerhard Schiefer and Jivka Deiters, Transparency in the Food Chain. 114
McEntire, “Product Tracing in Food Systems.”

83
These challenges could be overcome by:115
Identifying Critical Tracking Events (CTEs) similar to Hazard and Critical Control Points (HACCP)
(see Section 3.8.2.1 “Regulations” on page 77)
Maintain records for CTE in standardized formats at the lot level, printed on cases and
associated paperwork
Provide key data elements electronically.
A framework for transparency analysis has emerged (see Figure 3: The Emerging Transparency
Framework).116
Figure 3: The Emerging Transparency Framework
In large, commodity food supply chains, chain-wide information exchange supported by matching chain-
wide governance mechanisms and quality and safety standards have not yet been implemented and are
115
Ibid. 116
Trienekens et al., “Transparency in Complex Dynamic Food Supply Chains.”
84
a much bigger challenge because of the differentiated system and governance solutions that are needed
for the actors of these supply chains, which in general serve many different market segments.117
3.9.4.2 And traceability standards and systems have been developed
However, because the food industry sees the business advantages to supply chain traceability and wants
to “stay out in front” of FSMA regulations, several organizations are taking the lead on developing those
systems:118
ISO 22005:2007: This establishes an international standard for traceability in the feed and food chain.
GS1:119 GS1 develops standards and systems for traceability and business processes. GS1 uses unique
brand identifiers (UPC barcodes) to monitor “critical tracking events” for members’ products. GS1 US is
the only authorized source in the U.S. for assigning a UPC barcode company prefix.
The GS1 United States Standards Initiative uses Global Trade Item Numbers (GTIN) tracked with
Universal Product Codes (UPC) and Radio Frequency Identification (RFID).
The GS1 Traceability Standard120 is a business process standard describing the traceability process
independently from the choice of enabling technologies. It defines minimum requirements for
companies of all sizes across industry sectors and corresponding GS1 Standards used within information
management tools. The basic components of the GS1 traceability system include:
Global Location Numbers (GLN) assigned to locations in the supply chain: farms, packers,
shippers
GTINs created for each product and case, with associated labels printed and affixed to those
cases
A Global Data Synchronization Network (GDSN) that houses and shares data for traceability.
Produce Traceability Initiative (PTI):121 PTI, which is sponsored by the Canadian Produce Marketing
Association, GS1 US, the Produce Marketing Association, and United Fresh Produce Association, is
advancing supply-chain wide adoption of electronic produce traceability at the case level. To reconcile
internal and external traceability, produce needs a case coding solution that can be read by any
company across that supply chain, that is linked by common information, and that is retained
electronically by all the companies handling the package. The information to appear on each and every
produce case is: (1) a Global Trade Item Number (GTIN), which will identify who the “manufacturer” is
(i.e., the owner of the brand that appears on the product case) and the type of product inside that case;
(2) a lot number specifically identifying the lot from which that produce came. This information will
appear in both human-readable form and in a machine-readable GS1 barcode. The Produce Traceability
Initiative does not create a centralized database to hold all the data for the entire supply chain.
117
Ibid. 118
National Food Service Management Institute, Inventory Management and Track Reference Guide. 119
GS1, “GS1 Fresh Foods.” 120
GS1, Global Traceability Standard: Business Process and System Requirements for Full Supply Chain Traceability. 121
“The Produce Traceability Initiative.”

85
mpXML Meat and Poultry Traceability Implementation Guide:122 Using GS1 standards, mpXML
developed a Meat and Poultry Traceability Implementation Guide as a consistent approach to
traceability across all fresh food supply chains in June 2010. This guide was produced for US suppliers,
wholesalers, and retailers, and provides minimum standards and best practices for managing product
traceability at the shipment, pallet, case, and consumer level.
Although the practices covered in the mpXML guide span many levels of product hierarchy, the
structure does not address traceability to farm of origin, traceability to the animal level, maintenance of
credence attribute information, nor traceability transparency with the consuming public.123
3.9.5 Traceability is feasible
Small and closed supply chains can implement chain-wide information exchange supported by matching
chain-wide governance mechanisms and quality and safety standards.124
Anticipated cost categories for a food traceability system have been outlined by Mejia, McEntire,
Keener, Muth, Nganje, Stinson, & Jensen (2010) and include capital equipment and software;
consultants for identifying, designing, and/or implementing the system; training costs; labor for
operating; consumable materials; and the cost effects on line speed or efficiency of operations.125
Numerous groups across the country are in the process of developing open-source inventory
management software specifically for food supply chains.126 There is also potential in smartphone
technology, which could be adapted to be used as scanners in inventory management systems.127
A traceability model for local beef has been piloted in Michigan.128
3.9.6 Some traceability systems are already available
The Japanese government and Japan Agricultural Cooperatives have actively promoted development
and application of food traceability systems as national projects since 2001. Farmers input production
data about their products in an Internet-accessible database. Consumers can then browse the products’
data by accessing the database using the product ID (Sugahara, 2009). Traceable food in Japan is often
referred to as “food with a visible face” (Hall, 2010).129
localg.a.p.:130 GLOBALG.A.P. (see Section 3.8.4 “Cross-over Standards” on page 79) is building
“localg.a.p.,” which facilitates the sourcing of local and regional products that meet baseline
requirements for food safety. localg.a.p. supports a network of producers who are identified in the
GLOBALG.A.P. database and traceability system.
122
mpXML and GS1, “Meat and Poultry Traceability Initiative.” 123
Buskirk et al., “A Traceability Model for Beef Product Origin within a Local Institutional Value Chain.” 124
Trienekens et al., “Transparency in Complex Dynamic Food Supply Chains.” 125
Buskirk et al., “A Traceability Model for Beef Product Origin within a Local Institutional Value Chain.” 126
Bittner et al., Maximizing Freight Movements in Local Food Markets. 127
Ibid. 128
Buskirk et al., “A Traceability Model for Beef Product Origin within a Local Institutional Value Chain.” 129
Ibid. 130
“Localg.a.p.”

86
USDA Food and Nutrition Service Web-Based Supply Chain Management System:131 USDA agencies
AMS, FAS, FSA, FNS, as well as USAID joined forces to launch a modern Web Based Supply Chain
Management system based on Enterprise Resource Planning (ERP) commercial off-the-shelf (COTS)
technologies. WBSCM provides an integrated commodity purchasing, tracking and ordering system for
USDA and USAID as well as our customers, vendors, suppliers, and transportation personnel. WBSCM
supports the domestic agricultural economy, nutrition assistance programs, food security programs and
International food assistance programs of USDA and USAID.
Top 10 Produce:132 Top 10 issues GTINs, UPCs, and labels to small agricultural firms, including firms with
company prefixes assigned by GS1. Labels can be printed for individual produce or for cases.
ScoringAg:133 ScoringAg is a complete interoperable database with site-specific recordkeeping and
standardized records that includes food, feed ingredients, and SSOP and HACCP as well as containers
and machinery records in one simple world-wide working system.
3.9.7 Those initiatives might tie-in nicely with existing enterprise solutions for local farms
Online local food marketing tools are growing increasingly sophisticated:
Local Food MarketSizer:134 uses data from public and private sources to calculate unmet demand
for at the state, metropolitan area and county level for local meat, dairy, poultry & eggs, and
fruits & vegetables
Local Orbit:135 online ordering, inventory management, logistics, marketing, financial
management, and reporting and analysis.
CSA Ware:136 membership management, online ordering, delivery scheduling, and financial
reporting.
Small Farm Central:137 direct marketing and CSA web sites
Locally Grown:138 web sites, product listings, multi-farm coordination, customer management,
ordering, labelling, and payment processing.
Local Food Network:139 farm production plans, online orders, food distribution, and financial
management.
Farmigo:140 online ordering and pickup logistics.
AgSquared:141 crop planning, production management, and recordkeeping software.
131
“Web Based Supply Chain Management (WBSCM) System.” 132
“Top Ten Produce.” 133
“ScoringAg.” 134
“Local Food MarketSizer.” 135
“Local Orbit.” 136
“CSA Software - CSA Management | LocalHarvest / CSAware.” 137
“Small Farm Central.” 138
“Locally Grown.” 139
“Food Network Software.” 140
“Get Better, Local Food with Friends.” 141
“AgSquared.”

87
4 Works Cited “2012 Census Ag Atlas Maps,” n.d.
http://www.agcensus.usda.gov/Publications/2012/Online_Resources/Ag_Atlas_Maps/. 2013 Guide to Products and Services. USDA NASS. Accessed March 30, 2014.
http://www.nass.usda.gov/Publications/catalog.pdf. “AgSquared,” n.d. http://www.agsquared.com/. Anstey, Chris. Measure What Matters: The Search for Farming’s Triple Bottom Line. Pulse Canada,
November 2010. Barham, James. “Assessing Alternative Food Distribution Models: Improving Marketing Opportunities for
Small-Scale and Limited-Resource Producers.” Accessed March 6, 2014. http://www.ams.usda.gov/AMSv1.0/getfile?dDocName=STELPRDC5076016.
Bittner, Jason, Lindsey Day-Farnsworth, Michelle Miller, Rosa Kozub, and Bob Gollnik. Maximizing Freight Movements in Local Food Markets. National Center for Freight & Infrastructure Research & Education, September 2011. http://www.wistrans.org/cfire/documents/CFIRE_04-23_Final_Report.pdf.
Bloom, J. Dara, and C. Clare Hinrichs. “Moving Local Food through Conventional Food System Infrastructure: Value Chain Framework Comparisons and Insights.” Renewable Agriculture and Food Systems 26, no. 01 (September 16, 2010): 13–23. doi:10.1017/S1742170510000384.
Bonney, Laurie, Rob Clark, Ray Collins, Benjamin Dent, and A. Fearne. Sustainable Value Chain Analysis: An Agri-Food Chain Diagnostic. Hobart, Tasmania: National Lamb Value Chain Project, University of Tasmania, 2009. http://www.researchgate.net/publication/251236688_Sustainable_value_chain_analysis_an_agri-food_chain_diagnostic/file/9c96051ef888ad6850.pdf.
Bower, Jim, Ron Doetch, and Steve Stevenson. Tiers of the Food System, August 2010. http://www.cias.wisc.edu/wp-content/uploads/2010/09/tiers082610lowres.pdf.
Buskirk, Daniel, Jeannine Schweihofer, Jason Rowntree, Robert Clarke, Daniel Grooms, and Tristan Foster. “A Traceability Model for Beef Product Origin within a Local Institutional Value Chain.” Journal of Agriculture, Food Systems, and Community Development, March 13, 2013, 33–43. doi:10.5304/jafscd.2013.032.007.
Canning, Patrick, Ainsely, Charles, Huang, Sonya, Polenske, Karen R., and Waters, Arnold. Energy Use in the U.S. Food System. USDA Economic Research Service, March 2010. http://www.ers.usda.gov/publications/err-economic-research-report/err94.aspx#.UxCmmoWoSSo.
“CARES Map Room: National Interactive Map,” n.d. http://ims2.missouri.edu/tool/maps/default.aspx. “Census of Agriculture,” n.d. http://www.agcensus.usda.gov/index.php. Center for Food Safety and Applied Nutrition. “FDA Food Safety Modernization Act (FSMA).”
WebContent. Accessed March 29, 2014. http://www.fda.gov/Food/GuidanceRegulation/FSMA/default.htm.
Clancy, K., and Ruhf, K. Regional Value Chains in the Northeast: Findings from a Survey. Northeast Regional Lead Team Project, February 2010. http://api.ning.com/files/WAFzvztbJNjQVIglsHHegv*VwDfNbVjqOfGweByGwziZ7kR1j-naG721B9E0rHkx88*OpwwE87k0VuMFSWdQou-cWVWFSowT/NESAWGValueChainsReport12710updated.pdf.
“Commodity Flow Survey.” Accessed February 27, 2014. http://www.rita.dot.gov/bts/sites/rita.dot.gov.bts/files/publications/commodity_flow_survey/index.html.

88
Comparative Life Cycle Assessment of Food Commodities Procured for UK Consumption through a Diversity of Supply Chains. Department for Environment, Food, and Rural Affairs, United Kingdom. Accessed March 7, 2014. http://randd.defra.gov.uk/Default.aspx?Module=More&Location=None&ProjectID=15001.
Conner, David, Florence Becot, Doug Hoffer, Ellen Kahler, Scott Sawyer, and Linda Berlin. “Measuring Current Consumption of Locally Grown Foods in Vermont: Methods for Baselines and Targets.” Journal of Agriculture, Food Systems, and Community Development, May 17, 2013, 1–12. doi:10.5304/jafscd.2013.033.004.
“CSA Software - CSA Management | LocalHarvest / CSAware.” Accessed March 26, 2014. http://www.csaware.com/.
Day-Farnsworth, Lindsey, and Alfonso Morales. “Satiating the Demand: Planning for Alternative Models of Regional Food Distribution.” Journal of Agriculture, Food Systems, and Community Development, December 29, 2011, 227–48. doi:10.5304/jafscd.2011.021.020.
Diamond, Adam, Barham, James, and Tropp, Debra. Emerging Market Opportunities for Small-Scale Producers: Proceedings of a Special Session at the 2008 USDA Partners Meeting. U.S. Department of Agriculture, Agricultural Marketing Service, April 2009. http://www.ams.usda.gov/AMSv1.0/getfile?dDocName=STELPRDC5076556.
“EcoInvent,” n.d. http://ecoinvent.com/. Edwards-Jones, Gareth, Llorenç Milà i Canals, Natalia Hounsome, Monica Truninger, Georgia Koerber,
Barry Hounsome, Paul Cross, et al. “Testing the Assertion That ‘local Food Is Best’: The Challenges of an Evidence-Based Approach.” Trends in Food Science & Technology 19, no. 5 (May 2008): 265–74.
“ERS ARMS Farm Financial and Crop Production Practices,” n.d. http://www.ers.usda.gov/data-products/arms-farm-financial-and-crop-production-practices.aspx#.Uw9iX4WoSSo.
Feenstra, Gail, Patricia Allen, Shermain Hardesty, Jeri Ohmart, and Jan Perez. “Using a Supply Chain Analysis To Assess the Sustainability of Farm-to-Institution Programs.” Journal of Agriculture, Food Systems, and Community Development 1, no. 4 (July 19, 2011): 1–16. doi:10.5304/jafscd.2011.014.009.
Feenstra, Gail, David Visher, and Shermain Hardesty. “Developing Values-Based Distribution Networks to Enhance the Prosperity of Small and Medium Sized Producers,” 2011. http://studentfarm.ucdavis.edu/sarep/sfs/10July2012_Developing%20Values-Based%20Distribution%20Networks%20to%20Enhance%20the%20Prosperity%20of%20Small%20and%20Medium%20Sized%20Producers_report_compressed.pdf.
“Fisheries Improvement Project,” n.d. https://www.sustainablefish.org/fisheries-improvement. “Food Network Software,” n.d. http://foodnetworksoftware.org/. “Food Safety System Certification 22000,” n.d. http://www.fssc22000.com. Freedgood, Julia, Marisol Pierce-Quiñonez, and Ken Meter. “Emerging Assessment Tools To Inform Food
System Planning.” Journal of Agriculture, Food Systems, and Community Development, December 23, 2011, 83–104. doi:10.5304/jafscd.2011.021.023.
“Freight Analysis Framework - FHWA Freight Management and Operations.” Accessed February 25, 2014. http://www.ops.fhwa.dot.gov/freight/freight_analysis/faf/.
“Get Better, Local Food with Friends.” Accessed July 29, 2014. http://www.farmigo.com/. “Global Food Safety Initiative,” n.d. http://www.mygfsi.com/. “Global Reporting Initiative: Food Processing,” n.d. https://www.globalreporting.org/reporting/sector-
guidance/sector-guidance/food-processing/Pages/default.aspx. “GlobalG.A.P.,” n.d. http://www1.globalgap.org/north-america/front_content.php?idart=2196. Greater Philadelphia Food System Study. Delaware Valley Regional Planning Commission, January 2010.
http://www.dvrpc.org/reports/09066A.pdf.

89
GS1. Global Traceability Standard: Business Process and System Requirements for Full Supply Chain Traceability, March 2010. http://www.gs1.org/docs/gsmp/traceability/Global_Traceability_Standard.pdf.
———. “GS1 Fresh Foods,” n.d. http://www.gs1us.org/industries/fresh-foods. “Hawaii Portal, USDA NASS,” n.d. http://www.nass.usda.gov/Statistics_by_State/Hawaii/index.asp. Hawkes, Corinna. “Identifying Innovative Interventions to Promote Healthy Eating Using Consumption-
Oriented Food Supply Chain Analysis.” Journal of Hunger & Environmental Nutrition 4, no. 3–4 (July 2009): 336–56. doi:10.1080/19320240903321243.
Heller, Martin C, and Gregory A Keoleian. “Assessing the Sustainability of the US Food System: A Life Cycle Perspective.” Agricultural Systems 76, no. 3 (June 2003): 1007–41.
“Increased Food Security and Food Self-Sufficiency Strategy.” Office of Planning, DBEDT, October 2012. International Standards Organization. Traceability in the Feed and Food Chain — General Principles and
Basic Requirements for System Design and Implementation, July 15, 2007. http://www.safefood.gov.cn/GB/files/uploadfiles/200811/20081117083256100.pdf.
“ISO 22000: Food Safety Management Systems,” n.d. http://www.iso.org/iso/home/news_index/iso-in-action/food.htm.
Kemp, Karen K. “The Hawaiˋi Island Crop Probability Map,” October 2012. King, Robert P., Hand, Michael S., DiGiacomo, Gigi, Kate Clancy, Gomez, Miguel, Shermain Hardesty,
Larry Lev, and McLaughlin, Edward. Comparing the Structure, Size, and Performance of Local and Mainstream Food Supply Chains. Economic Research Report. USDA, June 2010.
Leung, PingSun, and Matthew Loke. “Economic Impacts of Increasing Hawaii’s Food Self Sufficiency.” Cooperative Extension Service, CTAHR, UH Manoa, Economic Issues, December 2008. http://www.npachawaii.org/files/content/task_forces/nutrition/foodselfsufficiency.pdf.
Lev, Larry, and G. Stevenson. “Acting Collectively to Develop Mid-Scale Food Value Chains.” Journal of Agriculture, Food Systems, and Community Development, August 2, 2011, 119–28. doi:10.5304/jafscd.2011.014.014.
Levinson, Daniel R. Traceability in the Food Supply Chain. Office of Inspector General, Department of Health and Human Services, March 2009. http://oig.hhs.gov/oei/reports/oei-02-06-00210.pdf.
“Local Food MarketSizer,” n.d. http://newventureadvisors.net/marketsizer.html. “Local Orbit,” n.d. http://localorb.it/. “Localg.a.p.,” n.d. http://www.globalgap.org/uk_en/what-we-do/globalg.a.p.-certification/localg.a.p./. “Locally Grown,” n.d. http://locallygrown.net/. Loke, Matthew K, and PingSun Leung. “Hawaii’s Food Consumption and Supply Sources: Benchmark
Estimates and Measurement Issues.” Agricultural and Food Economics 1, no. 1 (2013): 10. doi:10.1186/2193-7532-1-10.
Low, Sarah, and Stephen Vogel. Direct and Intermediated Marketing of Local Foods in the United States. Economic Research Report. Economic Research Service, USDA, November 2011. http://www.ers.usda.gov/publications/err-economic-research-report/err128.aspx#.UxXk7YWoSSo.
“Marine Stewardship Council,” n.d. http://www.msc.org/. Martinez, Steve, Hand, Michael S., Da Pra, Michelle, Pollack, Susan, Ralston, Katherine, Smith, Travis,
Vogel, Steven, et al. Local Food Systems: Concepts, Impacts, and Issues. Economic Research Report. Economic Research Service, USDA, May 2010. http://www.ers.usda.gov/publications/err-economic-research-report/err97.aspx#.UpqcYeIUaSp.
McEntire, Jennifer. Pilot Projects for Improving Product Tracing along the Food Supply System – Final Report. Institute of Food Tehnologists, August 2012. http://www.fda.gov/downloads/Food/GuidanceRegulation/UCM341810.pdf.

90
———. “Product Tracing in Food Systems.” November 12, 2009. http://www.ift.org/traceability/player.html.
mpXML, and GS1. “Meat and Poultry Traceability Initiative,” n.d. http://www.mpxml.org/I_Traceability.html.
National Food Service Management Institute. Inventory Management and Track Reference Guide. University of Mississippi, 2012. http://www.nfsmi.org/documentlibraryfiles/PDF/20120430044359.pdf.
“North Central Region County Food Systems Profiles Portal,” n.d. http://www.foodsystems.wisc.edu/. “NSF Global Food Safety Initiative (GFSI) Certification,” n.d. http://www.nsf.org/services/by-
industry/food-safety-quality/global-food-safety-certification/. OmniTrak Group Inc. “Local Food Market Demand Study of O‘ahu Shoppers.” Ulupono Initiative,
December 2011. Page, Christina, Lionel Bony, and Laura Schewel. “Island of Hawaii Whole System Project Phase I
Report.” Rocky Mountain Institute, 2007. http://sustainablemaui.org/wp-content/uploads/2012/05/BigIslandFoodSecurity.pdf.
Peters, Cassie, Evan Hansen, Jason Clingerman, Anne Hereford, and Nathan Askins. West Virginia Food System: Opportunities and Constraints in Local Food Supply Chains, 2012. http://www.thegreenaccelerator.com/uploads/files/x/000/088/465/WV%20Food%20System%20Report%20.pdf.
Peters CJ, Bills NL, Lembo AJ, Wilkins JL, and Fick GW. “Mapping Potential Foodsheds in New York State by Food Group: An Approach for Prioritizing Which Foods to Grow Locally.” Renewable Agriculture and Food Systems 27, no. 2 (2012): 125–37.
“Physical Activity and Nutrition Plan Tracker,” n.d. http://www.hawaiihealthmatters.org/index.php?module=Trackers&func=display&tid=1002.
“PrimusGFS,” n.d. http://www.primusgfs.com/. “ScoringAg,” n.d. https://www.scoringag.com//scoringag/3/index.cfm?sfa=main.main. “SCS Global Services.” Accessed March 24, 2014. http://www.scsglobalservices.com/?scscertified=1. “Small Farm Central,” n.d. http://www.smallfarmcentral.com/. Special Projects Staff, Service Sector Statistics Division. “North American Industry Classification System
(NAICS) Main Page.” Accessed April 3, 2014. http://www.census.gov/eos/www/naics/. “Special Tabulations, NASS,” n.d.
http://www.nass.usda.gov/Data_and_Statistics/Special_Tabulations/index.asp. “Standards | Safe Quality Food Institute.” Accessed March 24, 2014. http://www.sqfi.com/standards/. Stevensen, G.W., and Pirog, Rick. Values-Based Food Supply Chains: Strategies for Agri-Food Enterprises-
of-the-Middle. Accessed February 18, 2014. http://www.agofthemiddle.org/papers/valuechain.pdf.
Stevenson, G. W., Kate Clancy, Robert King, Larry Lev, Marcia Ostrom, and Stewart Smith. “Midscale Food Value Chains: An Introduction.” Journal of Agriculture, Food Systems, and Community Development 1, no. 4 (July 19, 2011): 1–8. doi:10.5304/jafscd.2011.014.007.
“Stewardship Index for Specialty Crops,” n.d. http://www.stewardshipindex.org/. “The Produce Traceability Initiative,” n.d. http://www.producetraceability.org/. “Top Ten Produce,” n.d. http://www.top10produce.com/. Trienekens, J.H., P.M. Wognum, A.J.M. Beulens, and J.G.A.J. van der Vorst. “Transparency in Complex
Dynamic Food Supply Chains.” Advanced Engineering Informatics 26, no. 1 (January 2012): 55–65. doi:10.1016/j.aei.2011.07.007.
United Nations Environment Program (UNEP), and Society for Environmental Toxicology and Chemistry (SETAC). “Life Cycle Initiative,” n.d. http://www.lifecycleinitiative.org/.
“Vermont Farm to Plate.” Accessed February 25, 2014. http://www.vtfoodatlas.com/.

91
“Vermont Farm to Plate Strategic Plan | Vermont Food System Atlas.” VT Farm to Plate Food Atlas. Accessed July 29, 2014. http://www.vtfoodatlas.com/plan/.
“Vermont Food Atlas,” n.d. www.vtfoodatlas.com/atlas. “Web Based Supply Chain Management (WBSCM) System,” n.d.
http://www.fns.usda.gov/fdd/WBSCM/default.htm.


![[Document title] - Food Security Cluster](https://static.fdokumen.com/doc/165x107/63150bb56ebca169bd0b096c/document-title-food-security-cluster.jpg)