
Redistribution and Effect of Various Elements on the ...
11
HAL Id: hal-01169928 https://hal.archives-ouvertes.fr/hal-01169928 Submitted on 30 Jun 2015 HAL is a multi-disciplinary open access archive for the deposit and dissemination of sci- entific research documents, whether they are pub- lished or not. The documents may come from teaching and research institutions in France or abroad, or from public or private research centers. L’archive ouverte pluridisciplinaire HAL, est destinée au dépôt et à la diffusion de documents scientifiques de niveau recherche, publiés ou non, émanant des établissements d’enseignement et de recherche français ou étrangers, des laboratoires publics ou privés. Redistribution and Effect of Various Elements on the Morphology of Primary Graphite in Cast Iron Jacques Lacaze, Nathalie Valle, Koenraad Theuwissen, Jon Sertucha, Brahime El Adib, Lydia Laffont-Dantras To cite this version: Jacques Lacaze, Nathalie Valle, Koenraad Theuwissen, Jon Sertucha, Brahime El Adib, et al.. Re- distribution and Effect of Various Elements on the Morphology of Primary Graphite in Cast Iron. Advances in Materials Science and Engineering, Hindawi Publishing Corporation, 2013, vol. 2013, pp. 1-9. 10.1155/2013/638451. hal-01169928
-
Upload
khangminh22 -
Category
Documents
-
view
3 -
download
0
Transcript of Redistribution and Effect of Various Elements on the ...
HAL Id: hal-01169928https://hal.archives-ouvertes.fr/hal-01169928
Submitted on 30 Jun 2015
HAL is a multi-disciplinary open accessarchive for the deposit and dissemination of sci-entific research documents, whether they are pub-lished or not. The documents may come fromteaching and research institutions in France orabroad, or from public or private research centers.
L’archive ouverte pluridisciplinaire HAL, estdestinée au dépôt et à la diffusion de documentsscientifiques de niveau recherche, publiés ou non,émanant des établissements d’enseignement et derecherche français ou étrangers, des laboratoirespublics ou privés.
Redistribution and Effect of Various Elements on theMorphology of Primary Graphite in Cast Iron
Jacques Lacaze, Nathalie Valle, Koenraad Theuwissen, Jon Sertucha, BrahimeEl Adib, Lydia Laffont-Dantras
To cite this version:Jacques Lacaze, Nathalie Valle, Koenraad Theuwissen, Jon Sertucha, Brahime El Adib, et al.. Re-distribution and Effect of Various Elements on the Morphology of Primary Graphite in Cast Iron.Advances in Materials Science and Engineering, Hindawi Publishing Corporation, 2013, vol. 2013, pp.1-9. �10.1155/2013/638451�. �hal-01169928�

Open Archive TOULOUSE Archive Ouverte (OATAO) OATAO is an open access repository that collects the work of Toulouse researchers and makes it freely available over the web where possible.
This is an author-deposited version published in : http://oatao.univ-toulouse.fr/ Eprints ID : 14057
To cite this version : Lacaze, Jacques and Valle, Nathalie and Theuwissen, Koenraad and Sertucha, Jon and El Adib, Brahime and Laffont-Dantras, Lydia Redistribution and Effect of Various Elements on the Morphology of Primary Graphite in Cast Iron. (2013) Advances in Materials Science and Engineering, vol. 2013. pp. 1-9. ISSN 1687-8434
To link to this article : DOI: 10.1155/2013/638451 URL: http://dx.doi.org/10.1155/2013/638451
Any correspondance concerning this service should be sent to the repository administrator: [email protected]
Research ArticleRedistribution and Effect of Various Elements onthe Morphology of Primary Graphite in Cast Iron
J. Lacaze,1 N. Valle,2 K. Theuwissen,1 J. Sertucha,3 B. El Adib,2 and L. Laffont1
1 CIRIMAT, Universite de Toulouse, ENSIACET, 31432 Toulouse Cedex 4, France2Department “Science and Analysis of Materials” (SAM), Centre de Recherche Public-Gabriel Lippmann 41 rue du Brill,4422 Belvaux, Luxembourg
3 Engineering and Foundry Processes Department, AZTERLAN, Aliendalde Auzunea 6, Bizkaia, 48200 Durango, Spain
It has been shown repeatedly that many elements present as traces or at low level can affect graphite shape in cast irons. As part of along termproject aimed at clarifying the growth and the alteration of spheroidal graphite, a study on the effect of a few elements (Cu,Sn, Sb, and Ti) on primary graphite growth was undertaken and analysed with reference to an alloy without any such additions.Thiswork was performed by remelting alloys in graphite crucibles thus saturating the melt in carbon and enabling primary graphite togrow by controlled cooling of the melt above the eutectic temperature. Primary graphite growth in the reference alloy was observedto be lamellar, while the added elements were found to affect bulk graphite and tomodify its outer shape, with Sb leading eventuallyto rounded agglomerates together with wavy lamellae. Secondary ion mass spectrometry was used to analyze the distribution ofelements, and no build-up of trace elements at the graphite surface could be observed. Instead, it is established that the perturbationof bulk graphite is associated with inhomogeneous distribution of metallic elements inside graphite precipitates.
1. Introduction
Graphite in cast irons can adopt various shapes partly de-pending not only on cooling rate but also on the presence ofadditives or of trace elements. Without appropriate prepara-tion, graphite precipitates as lamellae (GL), and this has beenin part related to the presence of oxygen and sulfur dissolvedin cast iron melts. These latter elements may be withdrawnfrom the melt by adding 0.025 to 0.050wt.%Mg (orMg asso-ciated with Ce) which ensure in most cases that graphite pre-cipitates as spheroids (SG) while intermediate amounts ofMg(0.009–0.018wt.%) lead to compacted graphite (CG). Fur-ther, many elements other than O and S when present evenas traces lead to degenerate forms of graphite, that is, neitherlamellar nor spheroidal. Values of their maximum permis-sible content for obtaining SG irons have been reviewed byLux [1]. Sorting of trace elements has been proposed [2, 3] fordescribing their effect on spheroidal graphite growth:
(i) reducing the effectiveness of Mg, for example, O, S,Se, Te, and Ti;
(ii) altering graphite growth, for example, Al, As, Bi, Cd,Cu, Pb, Sb, and Sn;
(iii) promoting degenerate graphite in heavy-section cast-ings, for example, Ce and Ca.
Interest has been put for long on graphite chemistry as it maybe expected that modifiers get incorporated into the graphitelattice [1]. For such a purpose, the most usual means as elec-tron probe or energy dispersive analyzers often have too poordetection limits. Francis [4] used chemical analysis of ex-tracted graphite and reported that many elements could bedetected in graphite. Auger electron spectroscopy (AES) hasalso been used, but generally it only gives information on theinterface and not on the bulk of the phases. Although protonemission has been successfully used [5, 6], the most potentialmeans thanks to its high sensitivity appeared to be secondaryion mass spectrometry (SIMS) that has already been used bya few authors [7–10].
In an attempt to enlighten the effect of some additives andtrace elements on graphite growth, experiments have been
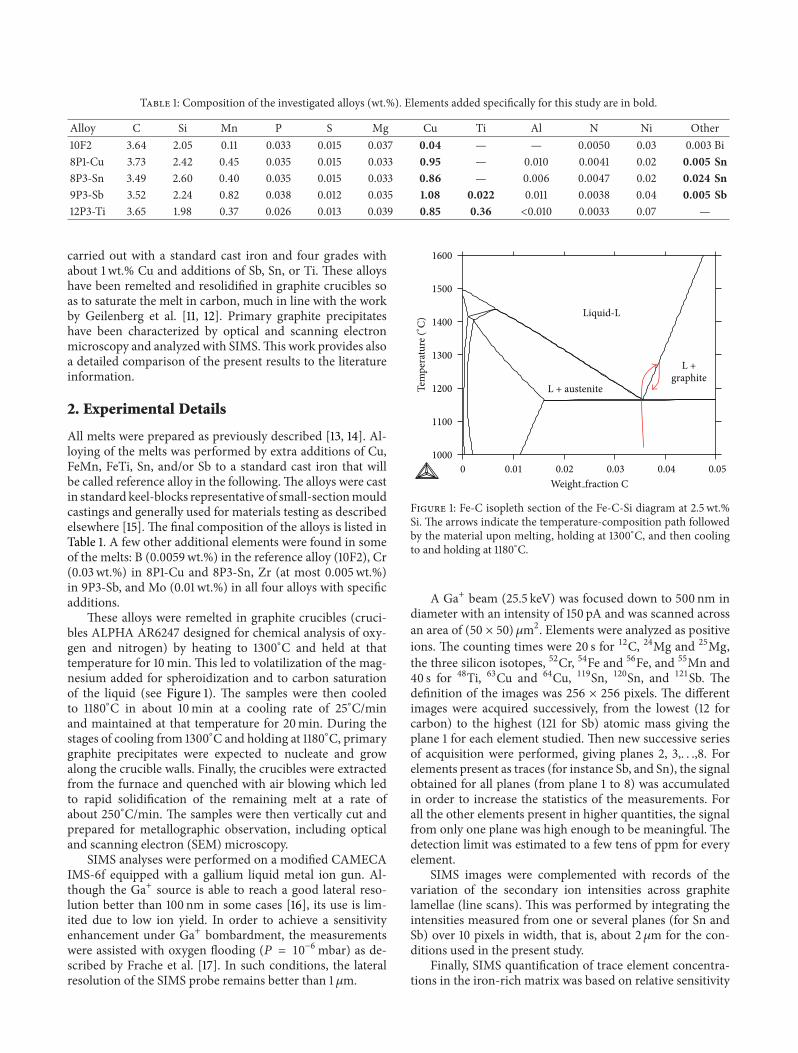
Table 1: Composition of the investigated alloys (wt.%). Elements added specifically for this study are in bold.
Alloy C Si Mn P S Mg Cu Ti Al N Ni Other10F2 3.64 2.05 0.11 0.033 0.015 0.037 0.04 — — 0.0050 0.03 0.003 Bi8P1-Cu 3.73 2.42 0.45 0.035 0.015 0.033 0.95 — 0.010 0.0041 0.02 0.005 Sn8P3-Sn 3.49 2.60 0.40 0.035 0.015 0.033 0.86 — 0.006 0.0047 0.02 0.024 Sn9P3-Sb 3.52 2.24 0.82 0.038 0.012 0.035 1.08 0.022 0.011 0.0038 0.04 0.005 Sb12P3-Ti 3.65 1.98 0.37 0.026 0.013 0.039 0.85 0.36 <0.010 0.0033 0.07 —
carried out with a standard cast iron and four grades withabout 1 wt.% Cu and additions of Sb, Sn, or Ti. These alloyshave been remelted and resolidified in graphite crucibles soas to saturate the melt in carbon, much in line with the workby Geilenberg et al. [11, 12]. Primary graphite precipitateshave been characterized by optical and scanning electronmicroscopy and analyzed with SIMS.This work provides alsoa detailed comparison of the present results to the literatureinformation.
2. Experimental Details
All melts were prepared as previously described [13, 14]. Al-loying of the melts was performed by extra additions of Cu,FeMn, FeTi, Sn, and/or Sb to a standard cast iron that willbe called reference alloy in the following.The alloys were castin standard keel-blocks representative of small-sectionmouldcastings and generally used for materials testing as describedelsewhere [15]. The final composition of the alloys is listed inTable 1. A few other additional elements were found in someof the melts: B (0.0059wt.%) in the reference alloy (10F2), Cr(0.03wt.%) in 8P1-Cu and 8P3-Sn, Zr (at most 0.005wt.%)in 9P3-Sb, and Mo (0.01 wt.%) in all four alloys with specificadditions.
These alloys were remelted in graphite crucibles (cruci-bles ALPHA AR6247 designed for chemical analysis of oxy-gen and nitrogen) by heating to 1300∘C and held at thattemperature for 10min. This led to volatilization of the mag-nesium added for spheroidization and to carbon saturationof the liquid (see Figure 1). The samples were then cooledto 1180∘C in about 10min at a cooling rate of 25∘C/minand maintained at that temperature for 20min. During thestages of cooling from 1300∘C and holding at 1180∘C, primarygraphite precipitates were expected to nucleate and growalong the crucible walls. Finally, the crucibles were extractedfrom the furnace and quenched with air blowing which ledto rapid solidification of the remaining melt at a rate ofabout 250∘C/min. The samples were then vertically cut andprepared for metallographic observation, including opticaland scanning electron (SEM) microscopy.
SIMS analyses were performed on a modified CAMECAIMS-6f equipped with a gallium liquid metal ion gun. Al-though the Ga+ source is able to reach a good lateral reso-lution better than 100 nm in some cases [16], its use is lim-ited due to low ion yield. In order to achieve a sensitivityenhancement under Ga+ bombardment, the measurementswere assisted with oxygen flooding (𝑃 = 10−6mbar) as de-scribed by Frache et al. [17]. In such conditions, the lateralresolution of the SIMS probe remains better than 1 𝜇m.
L +graphite
L + austenite
Liquid-L
1000
1100
1200
1300
1400
1500
1600
0 0.01 0.02 0.03 0.04 0.05Weight fraction C
Tem
pera
ture
(∘C)
Figure 1: Fe-C isopleth section of the Fe-C-Si diagram at 2.5 wt.%Si. The arrows indicate the temperature-composition path followedby the material upon melting, holding at 1300∘C, and then coolingto and holding at 1180∘C.
A Ga+ beam (25.5 keV) was focused down to 500 nm indiameter with an intensity of 150 pA and was scanned acrossan area of (50 × 50) 𝜇m2. Elements were analyzed as positiveions. The counting times were 20 s for 12C, 24Mg and 25Mg,the three silicon isotopes, 52Cr, 54Fe and 56Fe, and 55Mn and40 s for 48Ti, 63Cu and 64Cu, 119Sn, 120Sn, and 121Sb. Thedefinition of the images was 256 × 256 pixels. The differentimages were acquired successively, from the lowest (12 forcarbon) to the highest (121 for Sb) atomic mass giving theplane 1 for each element studied. Then new successive seriesof acquisition were performed, giving planes 2, 3,. . .,8. Forelements present as traces (for instance Sb, and Sn), the signalobtained for all planes (from plane 1 to 8) was accumulatedin order to increase the statistics of the measurements. Forall the other elements present in higher quantities, the signalfrom only one plane was high enough to be meaningful. Thedetection limit was estimated to a few tens of ppm for everyelement.
SIMS images were complemented with records of thevariation of the secondary ion intensities across graphitelamellae (line scans). This was performed by integrating theintensities measured from one or several planes (for Sn andSb) over 10 pixels in width, that is, about 2𝜇m for the con-ditions used in the present study.
Finally, SIMS quantification of trace element concentra-tions in the iron-rich matrix was based on relative sensitivity

(a)
50𝜇m
(b) (c)
Figure 2: Schematic section of the samples showing the location of primary graphite lamellae (a) and optical micrograph at the top (b) andmiddle (c) of the vertical section of the reference 10F2 sample. The scale is the same for both micrographs.
factors (RSF) derived from four standard iron-base alloyswith certified compositions.The RSFX factor for element X isgiven by RSFX = 𝐶x × (𝐼Fe/𝐼x) where 𝐶X is the concentrationof trace species X, 𝐼X and 𝐼Fe are the secondary ion intensitiesmeasured, respectively, for element X and for iron used asreference element. The RSFs were derived from the slope ofthe straight line 𝐼X/𝐼Fe = 𝑓(𝐶X) for Al, Cu, Cr, Mn, Si, Sb, Sn,and Ti. Because the standards do not containmagnesium, thedetermination of RSFMg was not possible. Nevertheless, theMg content was estimated by assuming that RSFMg was equalto RSFTi [18].
3. Results
As schematically illustrated in Figure 2(a), the vertical sectionof every sample showed some large graphite precipitatesattached along the crucible walls, but most of these precip-itates accumulated close to the top surface of the samples.As an example, Figure 2(b) presents part of the top surfaceof the reference alloy. In the remaining volume of thesamples, much smaller primary precipitates of graphite wereobserved and most of the material is essentially composed ofaustenite dendrites and eutectic with undercooled graphite;see Figure 2(c).The large precipitates of graphitemaywithoutdoubt be associated to primary deposition of this phase,suggesting that after nucleation and growth on the cruciblewalls they detached and floated due to the density differencebetween graphite and liquid iron. The finer solidification
structures seen in the remaining of the materials havecertainly been formed after the crucible was withdrawn outof the furnace. Accordingly, emphasis will be put in thefollowing on the large graphite precipitates.
Figure 3 shows a characteristic optical micrograph ofprimary graphite precipitates for each of the four alloys withspecific additions. Comparing to Figure 2(b), the effect of Cuseems limited to a very slight thickening of the lamellae whilethis phenomenon appeared much more pronounced after Snaddition. The most impressive effect relates to the alloy withSb that led to a few thick lamellae but mainly to roundedagglomerates. Finally, Ti had apparently a significantly dif-ferent effect in that it greatly reduced graphite nucleationand growth; namely, much less primary graphite precipitatescould be observed on the metallographic section when com-pared to the four other alloys.
In most cases, the graphite lamellae observed in the ref-erence alloy have smooth edges and a more or less constantthickness that may be indicative of a monotonous growth.Bulk graphite appears smooth as illustrated in Figure 4 wherean example of an SEM image is associated with SIMS mapsof C, Fe, Si, Mg, and Cu. The observed graphite did notcontain significant amounts of Fe and Cu, but little Si and avery homogeneous distribution of Mg. It was seen that thislatter element appeared as well in enriched spots containingalso Mn (not shown in the figure) but outside the graphitelamellae. These are certainly oxide particles similar to thosementioned in other previous studies [10, 19].

50𝜇m Cu
(a)
Sn
(b)
Sb
(c)
Ti
(d)
Figure 3: Optical micrographs of the upper sample surface of all four alloys with specific additions.The scale is the same for all micrographs.
5𝜇m10F2
12C 54Fe
28Si25Mg
63Cu
Figure 4: SEM micrograph of a graphite precipitate in the reference 10F2 alloy and SIMS maps (logarithmic scale) of C, Fe, Si, Mg, and Cu.
Sometimes, branched lamellae presenting a perturbedbulk graphite structure could also be seen in the referencealloy as illustrated in Figure 5. The SEM micrograph showsbulk graphite to present an irregular surface on the sectionwhile SIMSmaps of Si and Fe display irregular distribution ofthese elements. Mn showed an inhomogeneous distributionas Si and Fe while Mg remained homogeneous (maps not
shown in the figure). It is worth stressing that the enrichedareas in Si and Fe in the bulk graphite aremore or less alignedin a layered structure parallel to the long axis of the lamellae.
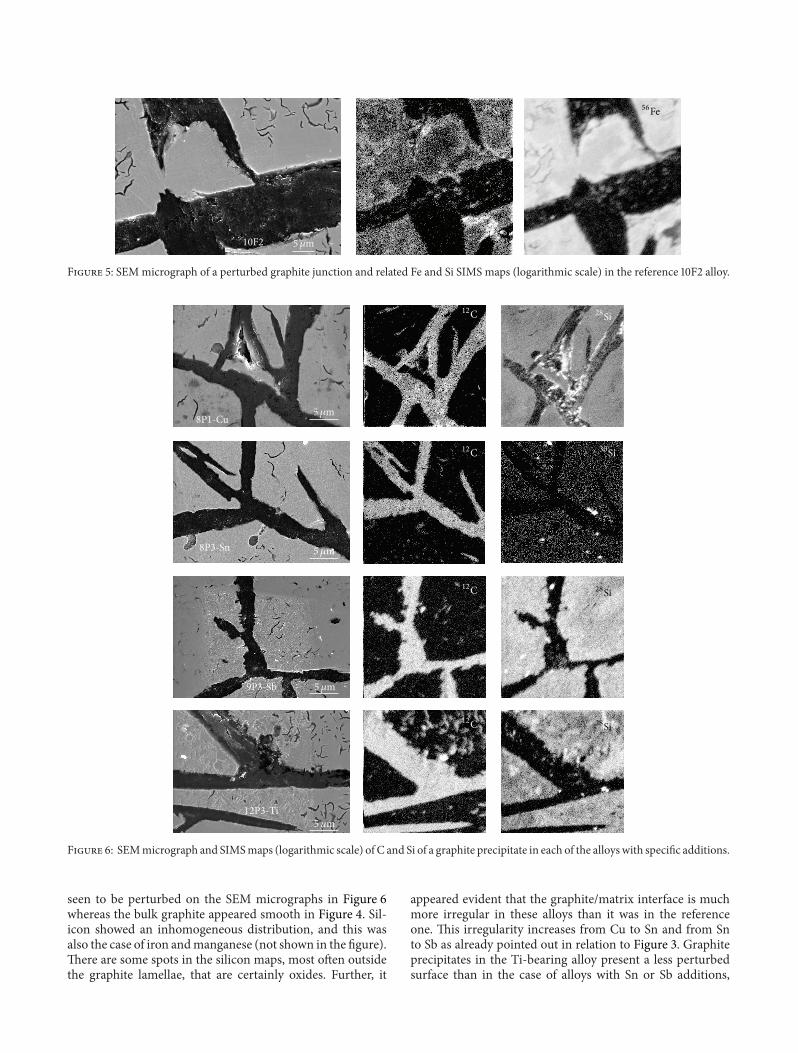
Figure 6 shows a typical example of a graphite lamellafor each of the four alloys with specific additions togetherwith SIMS maps of C and Si. Carbon maps are shown as theymake clearer the shape of the graphite precipitates that are
5𝜇m10F2
56Fe28Si
Figure 5: SEMmicrograph of a perturbed graphite junction and related Fe and Si SIMS maps (logarithmic scale) in the reference 10F2 alloy.
5𝜇m
5𝜇m
5𝜇m
5𝜇m
8P1-Cu
12C
12C
12C
12C
28Si
28Si
28Si
8P3-Sn
30Si
9P3-Sb
12P3-Ti
Figure 6: SEMmicrograph and SIMSmaps (logarithmic scale) of C and Si of a graphite precipitate in each of the alloys with specific additions.
seen to be perturbed on the SEM micrographs in Figure 6whereas the bulk graphite appeared smooth in Figure 4. Sil-icon showed an inhomogeneous distribution, and this wasalso the case of iron andmanganese (not shown in the figure).There are some spots in the silicon maps, most often outsidethe graphite lamellae, that are certainly oxides. Further, it
appeared evident that the graphite/matrix interface is muchmore irregular in these alloys than it was in the referenceone. This irregularity increases from Cu to Sn and from Snto Sb as already pointed out in relation to Figure 3. Graphiteprecipitates in the Ti-bearing alloy present a less perturbedsurface than in the case of alloys with Sn or Sb additions,

10𝜇m
24Mg 25Mg 25Mg
(a)
27Al 27Al 27Al
(b)
8P3-Sn 9P3-Sb 12P3-Ti
(c)
Figure 7: SIMSmaps of Mg (upper row), Al (middle row) and, respectively, Sn, Sb, and Ti (lower row) for the Sn-, Sb-, and Ti-bearing alloys.For clarity, linear scale images were selected for Al, Sn, and Sb maps and logarithmic scale images for the others. The scale is the same for allimages.
but they contain metallic elements as is the case for the otheralloys.
Although Mg has decreased during remelting at a levelwhere it cannot act anymore as a spheroidizer, it has beenobserved that some traces of this element are detected ingraphite precipitates in the reference alloy. This was also thecase for the alloys with specific additions as seen with themaps in the upper row of Figure 7 for the Sn-, Sb-, and Ti-bearing alloys. Similarly, aluminum that is added at a very lowlevel through inoculation is anyway easily detected by SIMSas illustrated in Figure 7, second row. BothMg and Al appearnonhomogeneously distributed within graphite, generally ata low level but sometimes also as spots though most of theselatter are located outside the precipitates. A layered structureof the enriched areas as in Figure 5 may be guessed in theimages of the Ti-bearing alloy.
In the bottom row of Figure 7, a map of Sn, Sb, and Tiis also shown for the Sn-, Sb-, and Ti-bearing alloys, respec-tively. It is seen that Sn and Sb appear at very low level ingraphite with respect to the matrix and that no built-up of
these elements could be detected at the graphite matrix inter-face. Ti as well is present at a low level in graphite with a het-erogeneous distribution but appears mainly as spots of pre-sumably oxide particles outside graphite. Similarly, althoughnot shown, no build-up of copper could be found in any ofthe mappings of this element.
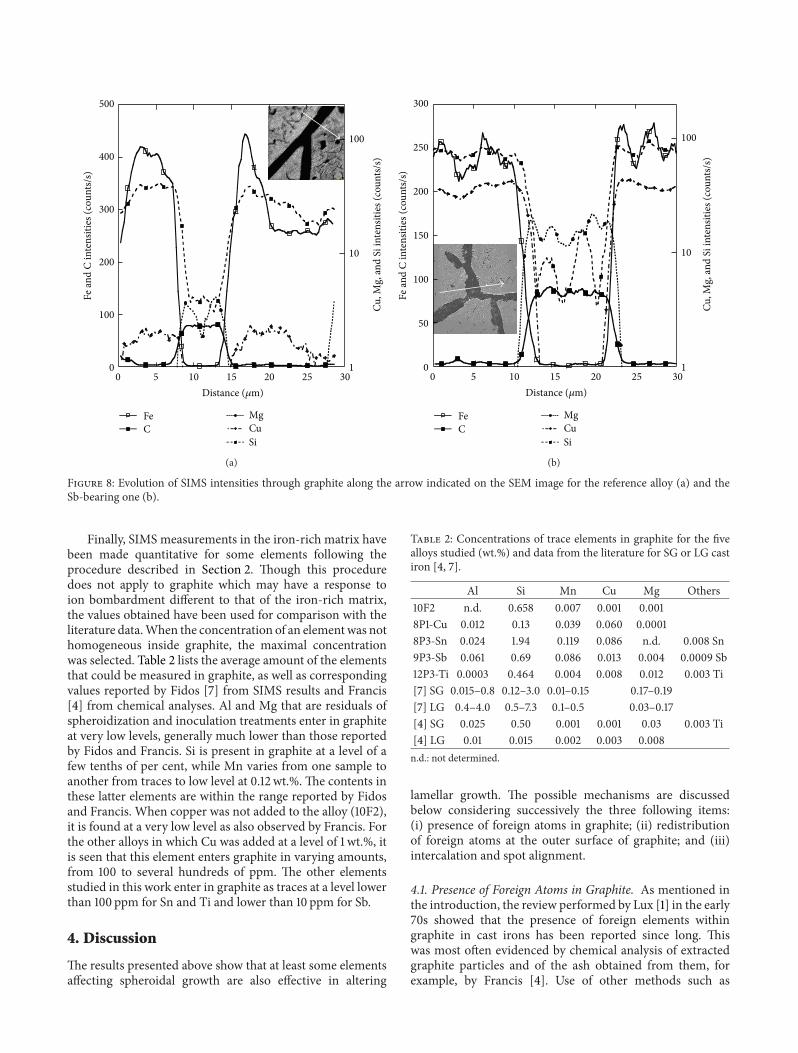
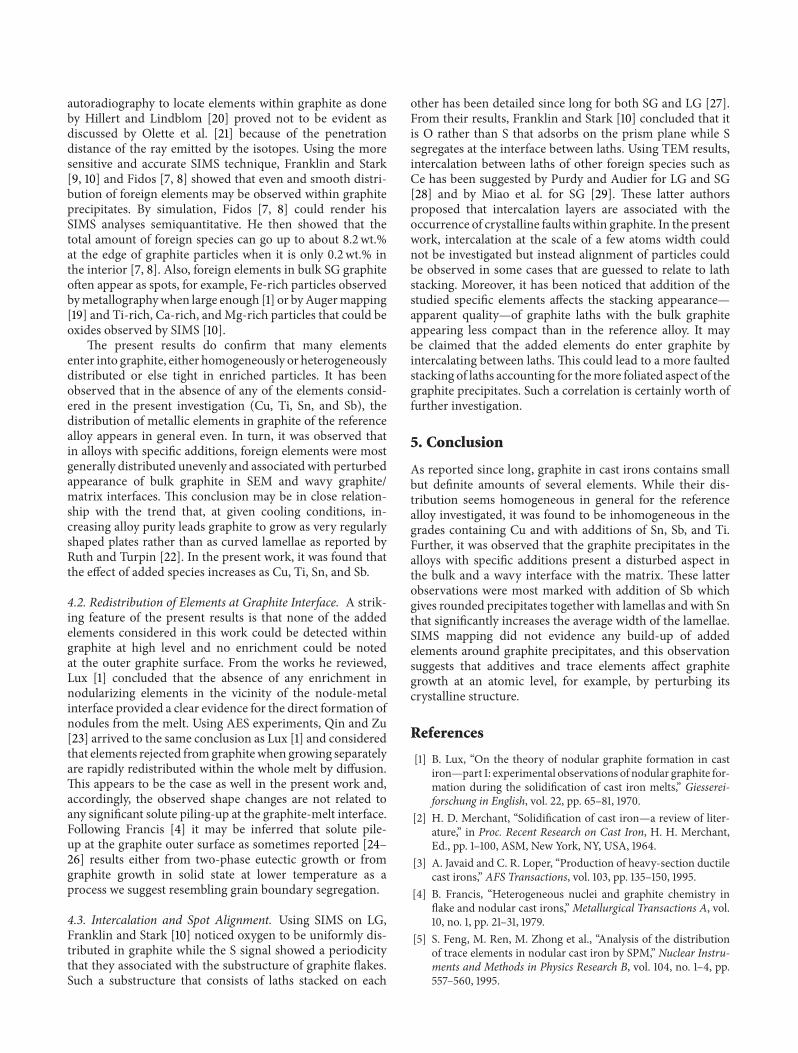
In order to exemplify the lack of spike at the interfacebetween primary graphite and matrix, line scans were drawnfrom the SIMS images. Figure 8 compares such scans forthe reference and the Sb-bearing alloys. The variations alongthe profiles outside the lamellae are essentially due to thefine eutectic developed during rapid cooling. At the micronscale, that is, the resolution of the SIMS probe in the presentconditions, no spike in any of the alloying or trace elementscould be observed at the outer surface of primary graphiteprecipitates. The most important information obtained fromthese graphs is that the variations in low-level elements (Mg,Cu, and Si) within graphite aremuchmore pronounced in thealloy with specific additions than in the reference one.
0
100
200
300
400
500
1
10
100
0 5 10 15 20 25 30
FeC
MgCuSi
Fe an
d C
inte
nsiti
es (c
ount
s/s)
Cu, M
g, an
d Si
inte
nsiti
es (c
ount
s/s)
Distance (𝜇m)
(a)
FeC
MgCuSi
0
50
100
150
200
250
300
1
10
100
0 5 10 15 20 25 30
Fe an
d C
inte
nsiti
es (c
ount
s/s)
Cu, M
g, an
d Si
inte
nsiti
es (c
ount
s/s)
Distance (𝜇m)
(b)
Figure 8: Evolution of SIMS intensities through graphite along the arrow indicated on the SEM image for the reference alloy (a) and theSb-bearing one (b).
Finally, SIMS measurements in the iron-rich matrix havebeen made quantitative for some elements following theprocedure described in Section 2. Though this proceduredoes not apply to graphite which may have a response toion bombardment different to that of the iron-rich matrix,the values obtained have been used for comparison with theliterature data.When the concentration of an elementwas nothomogeneous inside graphite, the maximal concentrationwas selected. Table 2 lists the average amount of the elementsthat could be measured in graphite, as well as correspondingvalues reported by Fidos [7] from SIMS results and Francis[4] from chemical analyses. Al and Mg that are residuals ofspheroidization and inoculation treatments enter in graphiteat very low levels, generally much lower than those reportedby Fidos and Francis. Si is present in graphite at a level of afew tenths of per cent, while Mn varies from one sample toanother from traces to low level at 0.12 wt.%. The contents inthese latter elements are within the range reported by Fidosand Francis. When copper was not added to the alloy (10F2),it is found at a very low level as also observed by Francis. Forthe other alloys in which Cu was added at a level of 1 wt.%, itis seen that this element enters graphite in varying amounts,from 100 to several hundreds of ppm. The other elementsstudied in this work enter in graphite as traces at a level lowerthan 100 ppm for Sn and Ti and lower than 10 ppm for Sb.
4. Discussion
The results presented above show that at least some elementsaffecting spheroidal growth are also effective in altering
Table 2: Concentrations of trace elements in graphite for the fivealloys studied (wt.%) and data from the literature for SG or LG castiron [4, 7].
Al Si Mn Cu Mg Others10F2 n.d. 0.658 0.007 0.001 0.0018P1-Cu 0.012 0.13 0.039 0.060 0.00018P3-Sn 0.024 1.94 0.119 0.086 n.d. 0.008 Sn9P3-Sb 0.061 0.69 0.086 0.013 0.004 0.0009 Sb12P3-Ti 0.0003 0.464 0.004 0.008 0.012 0.003 Ti[7] SG 0.015–0.8 0.12–3.0 0.01–0.15 0.17–0.19[7] LG 0.4–4.0 0.5–7.3 0.1–0.5 0.03–0.17[4] SG 0.025 0.50 0.001 0.001 0.03 0.003 Ti[4] LG 0.01 0.015 0.002 0.003 0.008n.d.: not determined.
lamellar growth. The possible mechanisms are discussedbelow considering successively the three following items:(i) presence of foreign atoms in graphite; (ii) redistributionof foreign atoms at the outer surface of graphite; and (iii)intercalation and spot alignment.
4.1. Presence of Foreign Atoms in Graphite. As mentioned inthe introduction, the review performed by Lux [1] in the early70s showed that the presence of foreign elements withingraphite in cast irons has been reported since long. Thiswas most often evidenced by chemical analysis of extractedgraphite particles and of the ash obtained from them, forexample, by Francis [4]. Use of other methods such as
autoradiography to locate elements within graphite as doneby Hillert and Lindblom [20] proved not to be evident asdiscussed by Olette et al. [21] because of the penetrationdistance of the ray emitted by the isotopes. Using the moresensitive and accurate SIMS technique, Franklin and Stark[9, 10] and Fidos [7, 8] showed that even and smooth distri-bution of foreign elements may be observed within graphiteprecipitates. By simulation, Fidos [7, 8] could render hisSIMS analyses semiquantitative. He then showed that thetotal amount of foreign species can go up to about 8.2 wt.%at the edge of graphite particles when it is only 0.2 wt.% inthe interior [7, 8]. Also, foreign elements in bulk SG graphiteoften appear as spots, for example, Fe-rich particles observedbymetallographywhen large enough [1] or byAugermapping[19] and Ti-rich, Ca-rich, andMg-rich particles that could beoxides observed by SIMS [10].
The present results do confirm that many elementsenter into graphite, either homogeneously or heterogeneouslydistributed or else tight in enriched particles. It has beenobserved that in the absence of any of the elements consid-ered in the present investigation (Cu, Ti, Sn, and Sb), thedistribution of metallic elements in graphite of the referencealloy appears in general even. In turn, it was observed thatin alloys with specific additions, foreign elements were mostgenerally distributed unevenly and associated with perturbedappearance of bulk graphite in SEM and wavy graphite/matrix interfaces. This conclusion may be in close relation-ship with the trend that, at given cooling conditions, in-creasing alloy purity leads graphite to grow as very regularlyshaped plates rather than as curved lamellae as reported byRuth and Turpin [22]. In the present work, it was found thatthe effect of added species increases as Cu, Ti, Sn, and Sb.
4.2. Redistribution of Elements at Graphite Interface. A strik-ing feature of the present results is that none of the addedelements considered in this work could be detected withingraphite at high level and no enrichment could be notedat the outer graphite surface. From the works he reviewed,Lux [1] concluded that the absence of any enrichment innodularizing elements in the vicinity of the nodule-metalinterface provided a clear evidence for the direct formation ofnodules from the melt. Using AES experiments, Qin and Zu[23] arrived to the same conclusion as Lux [1] and consideredthat elements rejected fromgraphitewhen growing separatelyare rapidly redistributed within the whole melt by diffusion.This appears to be the case as well in the present work and,accordingly, the observed shape changes are not related toany significant solute piling-up at the graphite-melt interface.Following Francis [4] it may be inferred that solute pile-up at the graphite outer surface as sometimes reported [24–26] results either from two-phase eutectic growth or fromgraphite growth in solid state at lower temperature as aprocess we suggest resembling grain boundary segregation.
4.3. Intercalation and Spot Alignment. Using SIMS on LG,Franklin and Stark [10] noticed oxygen to be uniformly dis-tributed in graphite while the S signal showed a periodicitythat they associated with the substructure of graphite flakes.Such a substructure that consists of laths stacked on each
other has been detailed since long for both SG and LG [27].From their results, Franklin and Stark [10] concluded that itis O rather than S that adsorbs on the prism plane while Ssegregates at the interface between laths. Using TEM results,intercalation between laths of other foreign species such asCe has been suggested by Purdy and Audier for LG and SG[28] and by Miao et al. for SG [29]. These latter authorsproposed that intercalation layers are associated with theoccurrence of crystalline faults within graphite. In the presentwork, intercalation at the scale of a few atoms width couldnot be investigated but instead alignment of particles couldbe observed in some cases that are guessed to relate to lathstacking. Moreover, it has been noticed that addition of thestudied specific elements affects the stacking appearance—apparent quality—of graphite laths with the bulk graphiteappearing less compact than in the reference alloy. It maybe claimed that the added elements do enter graphite byintercalating between laths. This could lead to a more faultedstacking of laths accounting for themore foliated aspect of thegraphite precipitates. Such a correlation is certainly worth offurther investigation.
5. Conclusion
As reported since long, graphite in cast irons contains smallbut definite amounts of several elements. While their dis-tribution seems homogeneous in general for the referencealloy investigated, it was found to be inhomogeneous in thegrades containing Cu and with additions of Sn, Sb, and Ti.Further, it was observed that the graphite precipitates in thealloys with specific additions present a disturbed aspect inthe bulk and a wavy interface with the matrix. These latterobservations were most marked with addition of Sb whichgives rounded precipitates together with lamellas and with Snthat significantly increases the average width of the lamellae.SIMS mapping did not evidence any build-up of addedelements around graphite precipitates, and this observationsuggests that additives and trace elements affect graphitegrowth at an atomic level, for example, by perturbing itscrystalline structure.
References
[1] B. Lux, “On the theory of nodular graphite formation in castiron—part I: experimental observations of nodular graphite for-mation during the solidification of cast iron melts,” Giesserei-forschung in English, vol. 22, pp. 65–81, 1970.
[2] H. D. Merchant, “Solidification of cast iron—a review of liter-ature,” in Proc. Recent Research on Cast Iron, H. H. Merchant,Ed., pp. 1–100, ASM, New York, NY, USA, 1964.
[3] A. Javaid and C. R. Loper, “Production of heavy-section ductilecast irons,” AFS Transactions, vol. 103, pp. 135–150, 1995.
[4] B. Francis, “Heterogeneous nuclei and graphite chemistry inflake and nodular cast irons,”Metallurgical Transactions A, vol.10, no. 1, pp. 21–31, 1979.
[5] S. Feng, M. Ren, M. Zhong et al., “Analysis of the distributionof trace elements in nodular cast iron by SPM,” Nuclear Instru-ments and Methods in Physics Research B, vol. 104, no. 1–4, pp.557–560, 1995.
[6] S. L. Feng, M. Q. Ren, and M. Zhong, “PIXE analysis of anti-nodularizing elements Al, Pb and Bi in nodular cast iron,” Nu-clear Instruments and Methods in Physics Research B, vol. 109-110, pp. 584–586, 1996.
[7] H. Fidos, “A study of the graphite morphology in nodular castiron,” FWP Journal, vol. 17, no. 10, pp. 9–54, 1977.
[8] H. Fidos, “Structural analysis of a graphite nodule and sur-rounding halo in ductile iron,” FWP Journal, vol. 22, no. 9, pp.11–62, 1982.
[9] S. E. Franklin and R. A. Stark, “Application of secondary ionmass spectrometry to study of graphite morphology in castiron,”Metal Science, vol. 18, no. 4, pp. 187–200, 1984.
[10] S. E. Franklin and R. A. Stark, “Further use of secondary ionmass spectrometry in the study of graphite morphology controlin cast irons,” inThe Physical Metallurgy of Cast Iron, Mat. Res.Soc. Symp. Proc, H. Fredriksson andM. Hillert, Eds., vol. 34, pp.25–35, Norh-Holland, New York, NY, USA, 1985.
[11] W. Patterson, H. Geilenberg, and B. Lange, “Anwachsversuchean Graphit-Impfkristallen aus kohlenstoffgesattigten Eisen-schmelzen,” Giesserei-Forschung, vol. 26, p. 1218, 1974.
[12] H. Geilenberg and B. Lange, “Growth experiments with graph-ite seed crystals from iron melts saturated in carbon,” in TheMetallurgy of Cast Iron, B. Lux, I. Minkoff, and F. Mollard,Eds., pp. 529–543, Georgi Publishing company, St Saphorin,Switzerland, 1975.
[13] I. Asenjo, J. Lacaze, P. Larranaga, S. Mendez, J. Sertucha, and R.Suarez, “Microstructure investigation of small-section nodulariron castings with chunky graphite,” Key Engineering Materials,vol. 457, pp. 52–57, 2011.
[14] N. Valle, K. Theuwissen, J. Sertucha, and J. Lacaze, “Effect ofvarious dopant elements onprimary graphite growth,” IOPCon-ference Series: Materials Science and Engineering, vol. 27, ArticleID 012026, 2012.
[15] J. Serrallach, J. Lacaze, J. Sertucha, R. Suarez, and A. Monzon,“Effect of selected alloying elements on mechanical propertiesof pearlitic nodular cast irons,” Key Engineering Materials, vol.457, pp. 361–366, 2011.
[16] J. M. Chabala, R. Levi-Setti, and Y. L. Wang, “Practical res-olution limits of imaging microanalysis with a scanning ionmicroprobe,” Applied Surface Science, vol. 32, no. 1-2, pp. 10–32,1988.
[17] G. Frache, B. E. Adib, J.-N. Audinot, and H.-N. Migeon,“Evaluation of ionization yields under gallium bombardment,”Surface and Interface Analysis, vol. 43, no. 1-2, pp. 639–642, 2011.
[18] R. G.Wilson, F. A. Stevie, and C.W.Magee, Secondary IonMassSpectrometry, A Practical Handbook for Depth Profiling and BulkImpurity Analysis, John Wiley & Sons, New York, NY, USA,1989.
[19] W. C. Johnson andH. B. Smartt, “The role of interphase bound-ary adsorption in the formation of spheroidal graphite in castiron,” Metallurgical Transactions A, vol. 8, no. 4, pp. 553–565,1977.
[20] M. Hillert and Y. Lindbolm, “The growth of nodular graphite,”The Journal of the Iron and Steel Institute, vol. 148, pp. 388–390,1954.
[21] M. Olette, A. Kohn, and P. Kozakevitch, “Contribution a l’etudedu mecanisme de formation du graphite primaire dans lesfontes,” Fonderie, vol. 229, pp. 87–99, 1965.
[22] J. C. Ruth andM. Turpin, “Structures de solidification unidirec-tionnelle des eutectiques fer-carbone,” Memoires ScientifiquesRevue de Metallurgie, vol. 66, pp. 633–640, 1969.
[23] Z. Qin and Z. Zu, “Dynamic segregation of sulphur in cast iron,”Acta Metallurgica Sinica, vol. 2, pp. 202–204, 1989.
[24] W. C. Johnson and B. V. Kovacs, “The effect of additiveson the eutectoid transformation of ductile iron,” MetallurgicalTransactions A, vol. 9, no. 2, pp. 219–229, 1978.
[25] B. V. Kovacs, “Pearlite stabilization in cast irons,” AFS Transac-tions, vol. 89, pp. 79–96, 1980.
[26] B. C. Liu, T. X. Li, Z. J. Rue, X. Y. Yang, E. Q. Huo, and C. R.Loper, “The role of antimony inn heavy-section ductile iron,”AFS Transactions, vol. 98, pp. 753–757, 1990.
[27] M. J. Hunter and G. A. Chadwick, “Structure of spheroidalgraphite,”The Journal of the Iron and Steel Institute, vol. 210, pp.117–123, 1972.
[28] G. R. Purdy and M. Audier, “Electron microscopical observa-tions of graphite in cast irons,” inThePhysicalMetallurgy of CastIron, Mat. Res. Soc. Symp. Proc, H. Fredriksson and M. Hillert,Eds., vol. 34, pp. 13–23, Norh-Holland, New York, NY, USA,1985.
[29] B. Miao, K. Fang, W. Bian, and G. Liu, “On the microstructureof graphite spherulites in cast irons by TEM and HREM,” ActaMetallurgica et Materialia, vol. 38, no. 11, pp. 2167–2174, 1990.