Phenotypic plasticity, QTL mapping and genomic characterization of bud set in black poplar
16
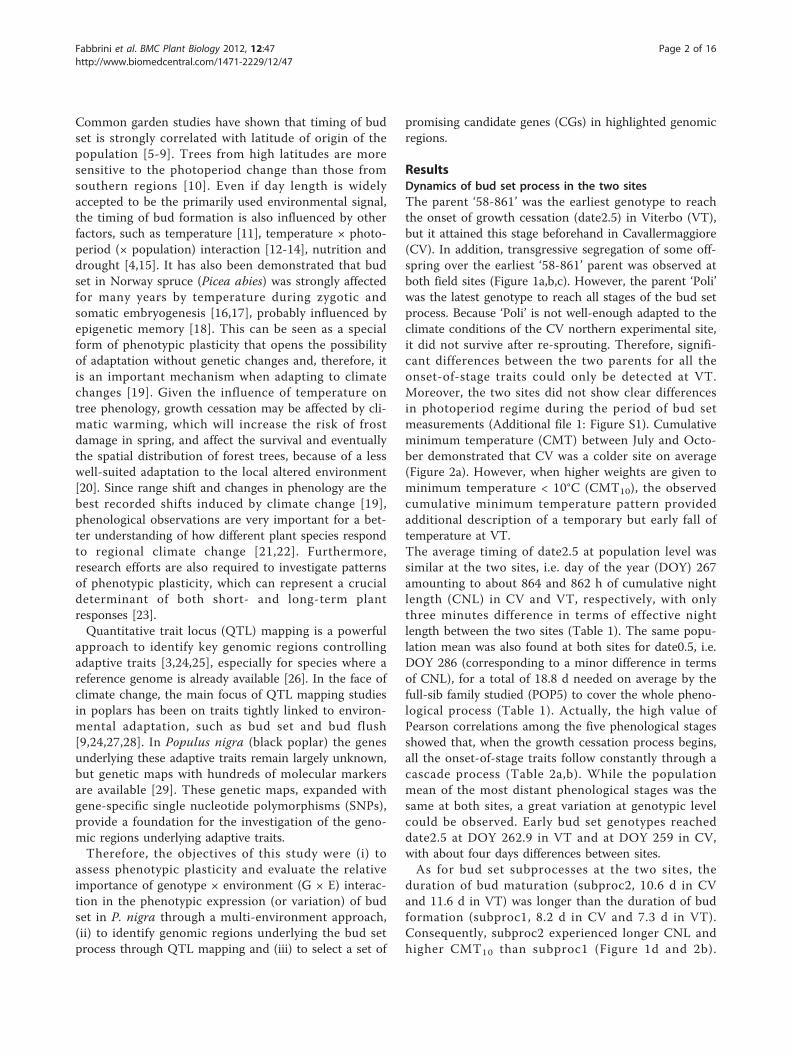
RESEARCH ARTICLE Open Access Phenotypic plasticity, QTL mapping and genomic characterization of bud set in black poplar Francesco Fabbrini 1 , Muriel Gaudet 1 , Catherine Bastien 2 , Giusi Zaina 3 , Antoine Harfouche 1 , Isacco Beritognolo 1,4 , Nicolas Marron 1,5 , Michele Morgante 3,6 , Giuseppe Scarascia-Mugnozza 1,7 and Maurizio Sabatti 1* Abstract Background: The genetic control of important adaptive traits, such as bud set, is still poorly understood in most forest trees species. Poplar is an ideal model tree to study bud set because of its indeterminate shoot growth. Thus, a full-sib family derived from an intraspecific cross of P. nigra with 162 clonally replicated progeny was used to assess the phenotypic plasticity and genetic variation of bud set in two sites of contrasting environmental conditions. Results: Six crucial phenological stages of bud set were scored. Night length appeared to be the most important signal triggering the onset of growth cessation. Nevertheless, the effect of other environmental factors, such as temperature, increased during the process. Moreover, a considerable role of genotype × environment (G × E) interaction was found in all phenological stages with the lowest temperature appearing to influence the sensitivity of the most plastic genotypes. Descriptors of growth cessation and bud onset explained the largest part of phenotypic variation of the entire process. Quantitative trait loci (QTL) for these traits were detected. For the four selected traits (the onset of growth cessation (date2.5), the transition from shoot to bud (date1.5), the duration of bud formation (subproc1) and bud maturation (subproc2)) eight and sixteen QTL were mapped on the maternal and paternal map, respectively. The identified QTL, each one characterized by small or modest effect, highlighted the complex nature of traits involved in bud set process. Comparison between map location of QTL and P. trichocarpa genome sequence allowed the identification of 13 gene models, 67 bud set-related expressional and six functional candidate genes (CGs). These CGs are functionally related to relevant biological processes, environmental sensing, signaling, and cell growth and development. Some strong QTL had no obvious CGs, and hold great promise to identify unknown genes that affect bud set. Conclusions: This study provides a better understanding of the physiological and genetic dissection of bud set in poplar. The putative QTL identified will be tested for associations in P. nigra natural populations. The identified QTL and CGs will also serve as useful targets for poplar breeding. Background Broad-leaved trees grown in temperate zones must avoid periods unfavorable for growth, such as harsh winter weather conditions, synchronizing their annual growth cycle with seasonality. Hence, they have evolved mechanisms to switch between active growth during summer and dormancy during winter, in response to environmental signals. In trees and woody perennial plants, photoperiod (decrease of day length) typically induces growth cessa- tion, the initiation of cold acclimation, the formation of a terminal bud (bud set) and bud dormancy [1]. Timing and duration of bud set process are inherited as quanti- tative traits, involving large number of genes with small individual effects [2-4]. Local adaptation of bud set phe- nology allows trees to find a compromise between the risk of frost damage and the maximization of the grow- ing season duration [5]. In addition, bud activity deter- mines the extent of the seasonal growth, tree architecture, wood quality and productivity [4]. * Correspondence: [email protected] 1 Department for Innovation in Biological, Agro-food and Forest systems, University of Tuscia, Via S. Camillo de Lellis, Viterbo 01100, Italy Full list of author information is available at the end of the article Fabbrini et al. BMC Plant Biology 2012, 12:47 http://www.biomedcentral.com/1471-2229/12/47 © 2012 Fabbrini et al; licensee BioMed Central Ltd. This is an Open Access article distributed under the terms of the Creative Commons Attribution License (http://creativecommons.org/licenses/by/2.0), which permits unrestricted use, distribution, and reproduction in any medium, provided the original work is properly cited.
-
Upload
unitusdistu -
Category
Documents
-
view
0 -
download
0
Transcript of Phenotypic plasticity, QTL mapping and genomic characterization of bud set in black poplar
RESEARCH ARTICLE Open Access
Phenotypic plasticity, QTL mapping and genomiccharacterization of bud set in black poplarFrancesco Fabbrini1, Muriel Gaudet1, Catherine Bastien2, Giusi Zaina3, Antoine Harfouche1, Isacco Beritognolo1,4,Nicolas Marron1,5, Michele Morgante3,6, Giuseppe Scarascia-Mugnozza1,7 and Maurizio Sabatti1*
Abstract
Background: The genetic control of important adaptive traits, such as bud set, is still poorly understood in mostforest trees species. Poplar is an ideal model tree to study bud set because of its indeterminate shoot growth.Thus, a full-sib family derived from an intraspecific cross of P. nigra with 162 clonally replicated progeny was usedto assess the phenotypic plasticity and genetic variation of bud set in two sites of contrasting environmentalconditions.
Results: Six crucial phenological stages of bud set were scored. Night length appeared to be the most importantsignal triggering the onset of growth cessation. Nevertheless, the effect of other environmental factors, such astemperature, increased during the process. Moreover, a considerable role of genotype × environment (G × E)interaction was found in all phenological stages with the lowest temperature appearing to influence the sensitivityof the most plastic genotypes.Descriptors of growth cessation and bud onset explained the largest part of phenotypic variation of the entireprocess. Quantitative trait loci (QTL) for these traits were detected. For the four selected traits (the onset of growthcessation (date2.5), the transition from shoot to bud (date1.5), the duration of bud formation (subproc1) and budmaturation (subproc2)) eight and sixteen QTL were mapped on the maternal and paternal map, respectively. Theidentified QTL, each one characterized by small or modest effect, highlighted the complex nature of traits involvedin bud set process. Comparison between map location of QTL and P. trichocarpa genome sequence allowed theidentification of 13 gene models, 67 bud set-related expressional and six functional candidate genes (CGs). TheseCGs are functionally related to relevant biological processes, environmental sensing, signaling, and cell growth anddevelopment. Some strong QTL had no obvious CGs, and hold great promise to identify unknown genes thataffect bud set.
Conclusions: This study provides a better understanding of the physiological and genetic dissection of bud set inpoplar. The putative QTL identified will be tested for associations in P. nigra natural populations. The identified QTLand CGs will also serve as useful targets for poplar breeding.
BackgroundBroad-leaved trees grown in temperate zones must avoidperiods unfavorable for growth, such as harsh winterweather conditions, synchronizing their annual growthcycle with seasonality. Hence, they have evolvedmechanisms to switch between active growth duringsummer and dormancy during winter, in response toenvironmental signals.
In trees and woody perennial plants, photoperiod(decrease of day length) typically induces growth cessa-tion, the initiation of cold acclimation, the formation ofa terminal bud (bud set) and bud dormancy [1]. Timingand duration of bud set process are inherited as quanti-tative traits, involving large number of genes with smallindividual effects [2-4]. Local adaptation of bud set phe-nology allows trees to find a compromise between therisk of frost damage and the maximization of the grow-ing season duration [5]. In addition, bud activity deter-mines the extent of the seasonal growth, treearchitecture, wood quality and productivity [4].
* Correspondence: [email protected] for Innovation in Biological, Agro-food and Forest systems,University of Tuscia, Via S. Camillo de Lellis, Viterbo 01100, ItalyFull list of author information is available at the end of the article
Fabbrini et al. BMC Plant Biology 2012, 12:47http://www.biomedcentral.com/1471-2229/12/47
© 2012 Fabbrini et al; licensee BioMed Central Ltd. This is an Open Access article distributed under the terms of the Creative CommonsAttribution License (http://creativecommons.org/licenses/by/2.0), which permits unrestricted use, distribution, and reproduction inany medium, provided the original work is properly cited.
Common garden studies have shown that timing of budset is strongly correlated with latitude of origin of thepopulation [5-9]. Trees from high latitudes are moresensitive to the photoperiod change than those fromsouthern regions [10]. Even if day length is widelyaccepted to be the primarily used environmental signal,the timing of bud formation is also influenced by otherfactors, such as temperature [11], temperature × photo-period (× population) interaction [12-14], nutrition anddrought [4,15]. It has also been demonstrated that budset in Norway spruce (Picea abies) was strongly affectedfor many years by temperature during zygotic andsomatic embryogenesis [16,17], probably influenced byepigenetic memory [18]. This can be seen as a specialform of phenotypic plasticity that opens the possibilityof adaptation without genetic changes and, therefore, itis an important mechanism when adapting to climatechanges [19]. Given the influence of temperature ontree phenology, growth cessation may be affected by cli-matic warming, which will increase the risk of frostdamage in spring, and affect the survival and eventuallythe spatial distribution of forest trees, because of a lesswell-suited adaptation to the local altered environment[20]. Since range shift and changes in phenology are thebest recorded shifts induced by climate change [19],phenological observations are very important for a bet-ter understanding of how different plant species respondto regional climate change [21,22]. Furthermore,research efforts are also required to investigate patternsof phenotypic plasticity, which can represent a crucialdeterminant of both short- and long-term plantresponses [23].Quantitative trait locus (QTL) mapping is a powerful
approach to identify key genomic regions controllingadaptive traits [3,24,25], especially for species where areference genome is already available [26]. In the face ofclimate change, the main focus of QTL mapping studiesin poplars has been on traits tightly linked to environ-mental adaptation, such as bud set and bud flush[9,24,27,28]. In Populus nigra (black poplar) the genesunderlying these adaptive traits remain largely unknown,but genetic maps with hundreds of molecular markersare available [29]. These genetic maps, expanded withgene-specific single nucleotide polymorphisms (SNPs),provide a foundation for the investigation of the geno-mic regions underlying adaptive traits.Therefore, the objectives of this study were (i) to
assess phenotypic plasticity and evaluate the relativeimportance of genotype × environment (G × E) interac-tion in the phenotypic expression (or variation) of budset in P. nigra through a multi-environment approach,(ii) to identify genomic regions underlying the bud setprocess through QTL mapping and (iii) to select a set of
promising candidate genes (CGs) in highlighted genomicregions.
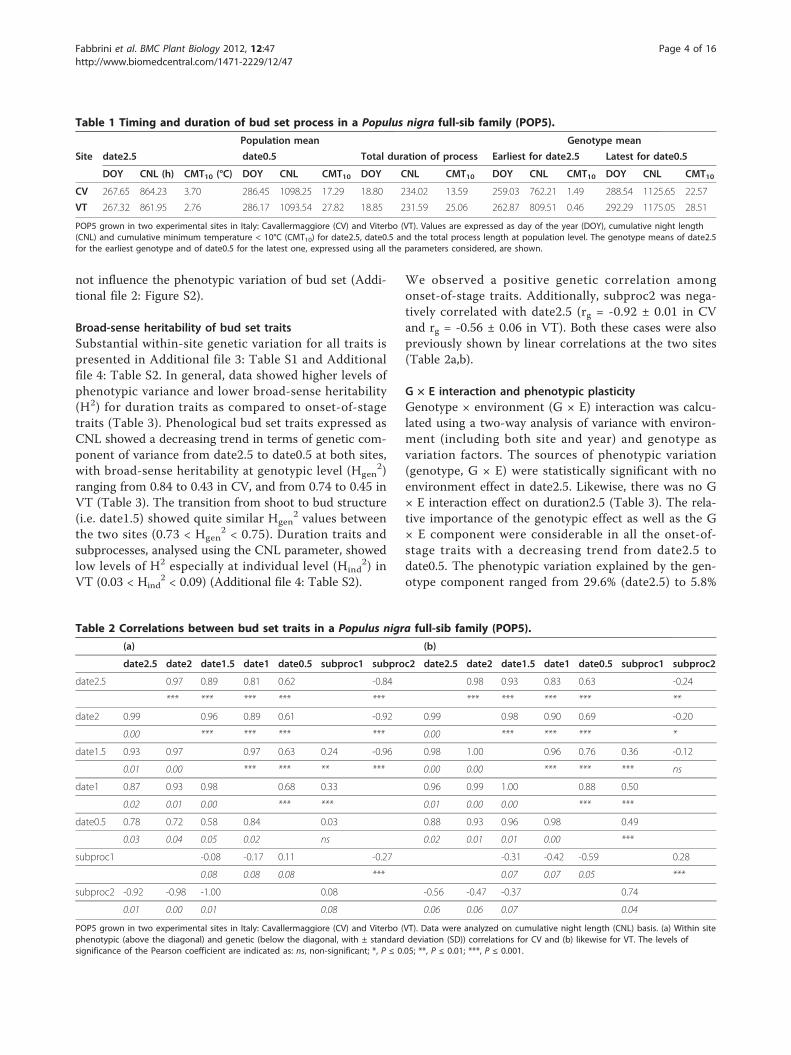
ResultsDynamics of bud set process in the two sitesThe parent ‘58-861’ was the earliest genotype to reachthe onset of growth cessation (date2.5) in Viterbo (VT),but it attained this stage beforehand in Cavallermaggiore(CV). In addition, transgressive segregation of some off-spring over the earliest ‘58-861’ parent was observed atboth field sites (Figure 1a,b,c). However, the parent ‘Poli’was the latest genotype to reach all stages of the bud setprocess. Because ‘Poli’ is not well-enough adapted to theclimate conditions of the CV northern experimental site,it did not survive after re-sprouting. Therefore, signifi-cant differences between the two parents for all theonset-of-stage traits could only be detected at VT.Moreover, the two sites did not show clear differencesin photoperiod regime during the period of bud setmeasurements (Additional file 1: Figure S1). Cumulativeminimum temperature (CMT) between July and Octo-ber demonstrated that CV was a colder site on average(Figure 2a). However, when higher weights are given tominimum temperature < 10°C (CMT10), the observedcumulative minimum temperature pattern providedadditional description of a temporary but early fall oftemperature at VT.The average timing of date2.5 at population level wassimilar at the two sites, i.e. day of the year (DOY) 267amounting to about 864 and 862 h of cumulative nightlength (CNL) in CV and VT, respectively, with onlythree minutes difference in terms of effective nightlength between the two sites (Table 1). The same popu-lation mean was also found at both sites for date0.5, i.e.DOY 286 (corresponding to a minor difference in termsof CNL), for a total of 18.8 d needed on average by thefull-sib family studied (POP5) to cover the whole pheno-logical process (Table 1). Actually, the high value ofPearson correlations among the five phenological stagesshowed that, when the growth cessation process begins,all the onset-of-stage traits follow constantly through acascade process (Table 2a,b). While the populationmean of the most distant phenological stages was thesame at both sites, a great variation at genotypic levelcould be observed. Early bud set genotypes reacheddate2.5 at DOY 262.9 in VT and at DOY 259 in CV,with about four days differences between sites.As for bud set subprocesses at the two sites, the
duration of bud maturation (subproc2, 10.6 d in CVand 11.6 d in VT) was longer than the duration of budformation (subproc1, 8.2 d in CV and 7.3 d in VT).Consequently, subproc2 experienced longer CNL andhigher CMT10 than subproc1 (Figure 1d and 2b).
Fabbrini et al. BMC Plant Biology 2012, 12:47http://www.biomedcentral.com/1471-2229/12/47
Page 2 of 16
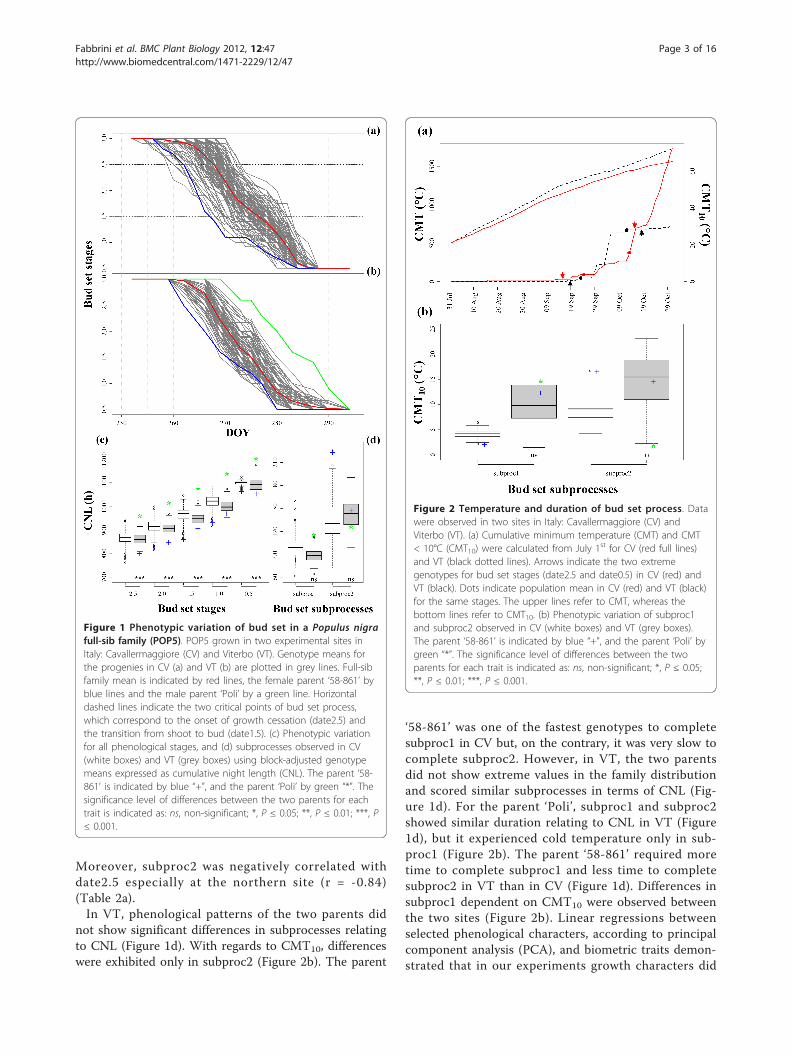
Moreover, subproc2 was negatively correlated withdate2.5 especially at the northern site (r = -0.84)(Table 2a).In VT, phenological patterns of the two parents did
not show significant differences in subprocesses relatingto CNL (Figure 1d). With regards to CMT10, differenceswere exhibited only in subproc2 (Figure 2b). The parent
‘58-861’ was one of the fastest genotypes to completesubproc1 in CV but, on the contrary, it was very slow tocomplete subproc2. However, in VT, the two parentsdid not show extreme values in the family distributionand scored similar subprocesses in terms of CNL (Fig-ure 1d). For the parent ‘Poli’, subproc1 and subproc2showed similar duration relating to CNL in VT (Figure1d), but it experienced cold temperature only in sub-proc1 (Figure 2b). The parent ‘58-861’ required moretime to complete subproc1 and less time to completesubproc2 in VT than in CV (Figure 1d). Differences insubproc1 dependent on CMT10 were observed betweenthe two sites (Figure 2b). Linear regressions betweenselected phenological characters, according to principalcomponent analysis (PCA), and biometric traits demon-strated that in our experiments growth characters did
Figure 1 Phenotypic variation of bud set in a Populus nigrafull-sib family (POP5). POP5 grown in two experimental sites inItaly: Cavallermaggiore (CV) and Viterbo (VT). Genotype means forthe progenies in CV (a) and VT (b) are plotted in grey lines. Full-sibfamily mean is indicated by red lines, the female parent ‘58-861’ byblue lines and the male parent ‘Poli’ by a green line. Horizontaldashed lines indicate the two critical points of bud set process,which correspond to the onset of growth cessation (date2.5) andthe transition from shoot to bud (date1.5). (c) Phenotypic variationfor all phenological stages, and (d) subprocesses observed in CV(white boxes) and VT (grey boxes) using block-adjusted genotypemeans expressed as cumulative night length (CNL). The parent ‘58-861’ is indicated by blue “+”, and the parent ‘Poli’ by green “*”. Thesignificance level of differences between the two parents for eachtrait is indicated as: ns, non-significant; *, P ≤ 0.05; **, P ≤ 0.01; ***, P≤ 0.001.
Figure 2 Temperature and duration of bud set process. Datawere observed in two sites in Italy: Cavallermaggiore (CV) andViterbo (VT). (a) Cumulative minimum temperature (CMT) and CMT< 10°C (CMT10) were calculated from July 1st for CV (red full lines)and VT (black dotted lines). Arrows indicate the two extremegenotypes for bud set stages (date2.5 and date0.5) in CV (red) andVT (black). Dots indicate population mean in CV (red) and VT (black)for the same stages. The upper lines refer to CMT, whereas thebottom lines refer to CMT10. (b) Phenotypic variation of subproc1and subproc2 observed in CV (white boxes) and VT (grey boxes).The parent ‘58-861’ is indicated by blue “+”, and the parent ‘Poli’ bygreen “*”. The significance level of differences between the twoparents for each trait is indicated as: ns, non-significant; *, P ≤ 0.05;**, P ≤ 0.01; ***, P ≤ 0.001.
Fabbrini et al. BMC Plant Biology 2012, 12:47http://www.biomedcentral.com/1471-2229/12/47
Page 3 of 16
not influence the phenotypic variation of bud set (Addi-tional file 2: Figure S2).
Broad-sense heritability of bud set traitsSubstantial within-site genetic variation for all traits ispresented in Additional file 3: Table S1 and Additionalfile 4: Table S2. In general, data showed higher levels ofphenotypic variance and lower broad-sense heritability(H2) for duration traits as compared to onset-of-stagetraits (Table 3). Phenological bud set traits expressed asCNL showed a decreasing trend in terms of genetic com-ponent of variance from date2.5 to date0.5 at both sites,with broad-sense heritability at genotypic level (Hgen
2)ranging from 0.84 to 0.43 in CV, and from 0.74 to 0.45 inVT (Table 3). The transition from shoot to bud structure(i.e. date1.5) showed quite similar Hgen
2 values betweenthe two sites (0.73 < Hgen
2 < 0.75). Duration traits andsubprocesses, analysed using the CNL parameter, showedlow levels of H2 especially at individual level (Hind
2) inVT (0.03 < Hind
2 < 0.09) (Additional file 4: Table S2).
We observed a positive genetic correlation amongonset-of-stage traits. Additionally, subproc2 was nega-tively correlated with date2.5 (rg = -0.92 ± 0.01 in CVand rg = -0.56 ± 0.06 in VT). Both these cases were alsopreviously shown by linear correlations at the two sites(Table 2a,b).
G × E interaction and phenotypic plasticityGenotype × environment (G × E) interaction was calcu-lated using a two-way analysis of variance with environ-ment (including both site and year) and genotype asvariation factors. The sources of phenotypic variation(genotype, G × E) were statistically significant with noenvironment effect in date2.5. Likewise, there was no G× E interaction effect on duration2.5 (Table 3). The rela-tive importance of the genotypic effect as well as the G× E component were considerable in all the onset-of-stage traits with a decreasing trend from date2.5 todate0.5. The phenotypic variation explained by the gen-otype component ranged from 29.6% (date2.5) to 5.8%
Table 1 Timing and duration of bud set process in a Populus nigra full-sib family (POP5).
Population mean Genotype mean
Site date2.5 date0.5 Total duration of process Earliest for date2.5 Latest for date0.5
DOY CNL (h) CMT10 (°C) DOY CNL CMT10 DOY CNL CMT10 DOY CNL CMT10 DOY CNL CMT10
CV 267.65 864.23 3.70 286.45 1098.25 17.29 18.80 234.02 13.59 259.03 762.21 1.49 288.54 1125.65 22.57
VT 267.32 861.95 2.76 286.17 1093.54 27.82 18.85 231.59 25.06 262.87 809.51 0.46 292.29 1175.05 28.51
POP5 grown in two experimental sites in Italy: Cavallermaggiore (CV) and Viterbo (VT). Values are expressed as day of the year (DOY), cumulative night length(CNL) and cumulative minimum temperature < 10°C (CMT10) for date2.5, date0.5 and the total process length at population level. The genotype means of date2.5for the earliest genotype and of date0.5 for the latest one, expressed using all the parameters considered, are shown.
Table 2 Correlations between bud set traits in a Populus nigra full-sib family (POP5).
(a) (b)
date2.5 date2 date1.5 date1 date0.5 subproc1 subproc2 date2.5 date2 date1.5 date1 date0.5 subproc1 subproc2
date2.5 0.97 0.89 0.81 0.62 -0.84 0.98 0.93 0.83 0.63 -0.24
*** *** *** *** *** *** *** *** *** **
date2 0.99 0.96 0.89 0.61 -0.92 0.99 0.98 0.90 0.69 -0.20
0.00 *** *** *** *** 0.00 *** *** *** *
date1.5 0.93 0.97 0.97 0.63 0.24 -0.96 0.98 1.00 0.96 0.76 0.36 -0.12
0.01 0.00 *** *** ** *** 0.00 0.00 *** *** *** ns
date1 0.87 0.93 0.98 0.68 0.33 0.96 0.99 1.00 0.88 0.50
0.02 0.01 0.00 *** *** 0.01 0.00 0.00 *** ***
date0.5 0.78 0.72 0.58 0.84 0.03 0.88 0.93 0.96 0.98 0.49
0.03 0.04 0.05 0.02 ns 0.02 0.01 0.01 0.00 ***
subproc1 -0.08 -0.17 0.11 -0.27 -0.31 -0.42 -0.59 0.28
0.08 0.08 0.08 *** 0.07 0.07 0.05 ***
subproc2 -0.92 -0.98 -1.00 0.08 -0.56 -0.47 -0.37 0.74
0.01 0.00 0.01 0.08 0.06 0.06 0.07 0.04
POP5 grown in two experimental sites in Italy: Cavallermaggiore (CV) and Viterbo (VT). Data were analyzed on cumulative night length (CNL) basis. (a) Within sitephenotypic (above the diagonal) and genetic (below the diagonal, with ± standard deviation (SD)) correlations for CV and (b) likewise for VT. The levels ofsignificance of the Pearson coefficient are indicated as: ns, non-significant; *, P ≤ 0.05; **, P ≤ 0.01; ***, P ≤ 0.001.
Fabbrini et al. BMC Plant Biology 2012, 12:47http://www.biomedcentral.com/1471-2229/12/47
Page 4 of 16
(date0.5) and from 19.0% (date2.5) to 9.2% (date0.5) forthe G × E interaction.Spearman rank coefficients were positive, moderate
and highly significant for the onset-of-stage traits, butthey decreased during time. Hence, there were not sig-nificant changes in the ranking of genotypes betweenenvironments, but the degree of changes increased gra-dually during time (Table 3). Concerning duration traits,low levels of genotypic variance (0.8% < sG
2/sP2 < 8.9%)
and high levels of residuals (up to 87.9%) in the pheno-typic variation were observed, with an increasing impor-tance of the G × E interaction during bud development(from 0% to 20%). The low values of Spearman coeffi-cients for duration traits were a clear indication ofstrong and random changes in genotype rankingbetween environments (Table 3).The interaction pattern of the population mean for
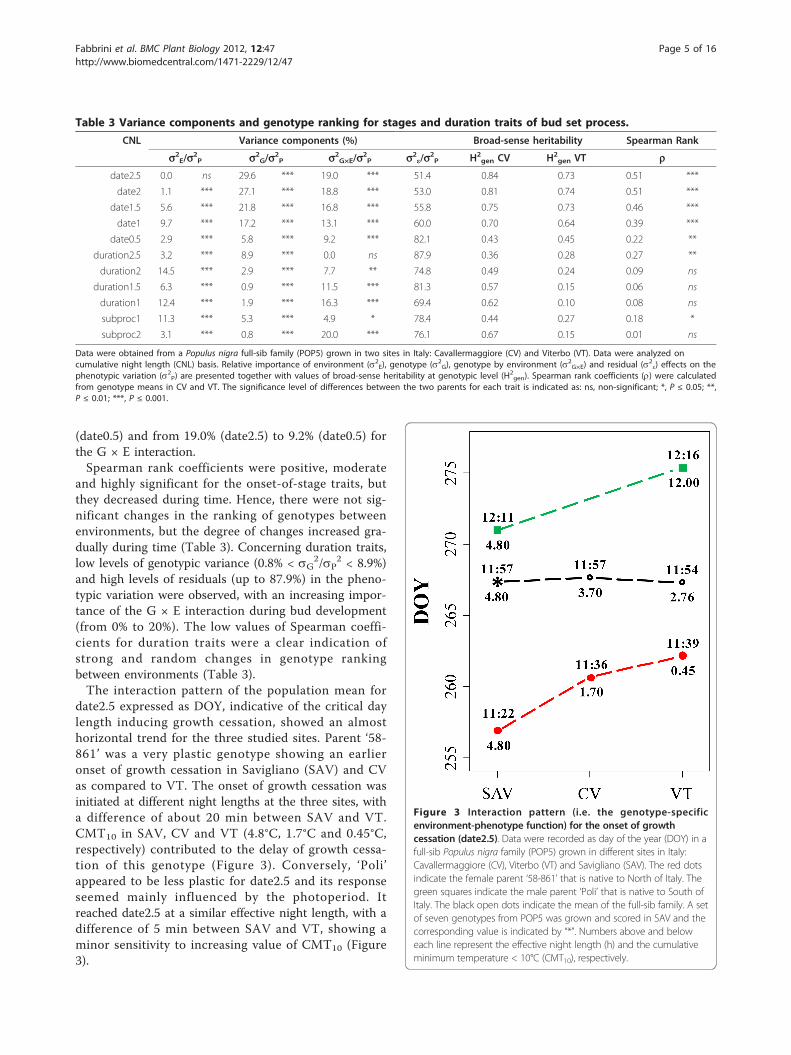
date2.5 expressed as DOY, indicative of the critical daylength inducing growth cessation, showed an almosthorizontal trend for the three studied sites. Parent ‘58-861’ was a very plastic genotype showing an earlieronset of growth cessation in Savigliano (SAV) and CVas compared to VT. The onset of growth cessation wasinitiated at different night lengths at the three sites, witha difference of about 20 min between SAV and VT.CMT10 in SAV, CV and VT (4.8°C, 1.7°C and 0.45°C,respectively) contributed to the delay of growth cessa-tion of this genotype (Figure 3). Conversely, ‘Poli’appeared to be less plastic for date2.5 and its responseseemed mainly influenced by the photoperiod. Itreached date2.5 at a similar effective night length, with adifference of 5 min between SAV and VT, showing aminor sensitivity to increasing value of CMT10 (Figure3).
Table 3 Variance components and genotype ranking for stages and duration traits of bud set process.
CNL Variance components (%) Broad-sense heritability Spearman Rank
s2E/s2P s2G/s2P s2G×E/s2P s2ε/s2P H2
gen CV H2gen VT r
date2.5 0.0 ns 29.6 *** 19.0 *** 51.4 0.84 0.73 0.51 ***
date2 1.1 *** 27.1 *** 18.8 *** 53.0 0.81 0.74 0.51 ***
date1.5 5.6 *** 21.8 *** 16.8 *** 55.8 0.75 0.73 0.46 ***
date1 9.7 *** 17.2 *** 13.1 *** 60.0 0.70 0.64 0.39 ***
date0.5 2.9 *** 5.8 *** 9.2 *** 82.1 0.43 0.45 0.22 **
duration2.5 3.2 *** 8.9 *** 0.0 ns 87.9 0.36 0.28 0.27 **
duration2 14.5 *** 2.9 *** 7.7 ** 74.8 0.49 0.24 0.09 ns
duration1.5 6.3 *** 0.9 *** 11.5 *** 81.3 0.57 0.15 0.06 ns
duration1 12.4 *** 1.9 *** 16.3 *** 69.4 0.62 0.10 0.08 ns
subproc1 11.3 *** 5.3 *** 4.9 * 78.4 0.44 0.27 0.18 *
subproc2 3.1 *** 0.8 *** 20.0 *** 76.1 0.67 0.15 0.01 ns
Data were obtained from a Populus nigra full-sib family (POP5) grown in two sites in Italy: Cavallermaggiore (CV) and Viterbo (VT). Data were analyzed oncumulative night length (CNL) basis. Relative importance of environment (s2E), genotype (s2G), genotype by environment (s2G×E) and residual (s2ε) effects on thephenotypic variation (s2
P) are presented together with values of broad-sense heritability at genotypic level (H2gen). Spearman rank coefficients (r) were calculated
from genotype means in CV and VT. The significance level of differences between the two parents for each trait is indicated as: ns, non-significant; *, P ≤ 0.05; **,P ≤ 0.01; ***, P ≤ 0.001.
Figure 3 Interaction pattern (i.e. the genotype-specificenvironment-phenotype function) for the onset of growthcessation (date2.5). Data were recorded as day of the year (DOY) in afull-sib Populus nigra family (POP5) grown in different sites in Italy:Cavallermaggiore (CV), Viterbo (VT) and Savigliano (SAV). The red dotsindicate the female parent ‘58-861’ that is native to North of Italy. Thegreen squares indicate the male parent ‘Poli’ that is native to South ofItaly. The black open dots indicate the mean of the full-sib family. A setof seven genotypes from POP5 was grown and scored in SAV and thecorresponding value is indicated by “*”. Numbers above and beloweach line represent the effective night length (h) and the cumulativeminimum temperature < 10°C (CMT10), respectively.
Fabbrini et al. BMC Plant Biology 2012, 12:47http://www.biomedcentral.com/1471-2229/12/47
Page 5 of 16
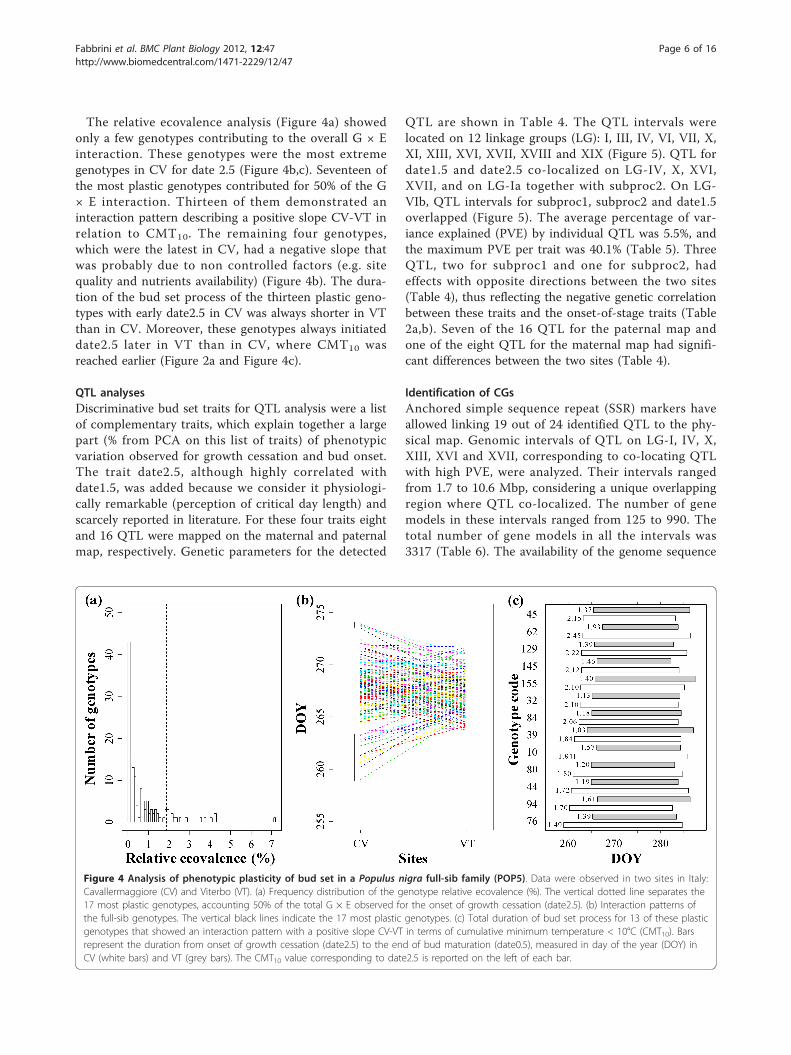
The relative ecovalence analysis (Figure 4a) showedonly a few genotypes contributing to the overall G × Einteraction. These genotypes were the most extremegenotypes in CV for date 2.5 (Figure 4b,c). Seventeen ofthe most plastic genotypes contributed for 50% of the G× E interaction. Thirteen of them demonstrated aninteraction pattern describing a positive slope CV-VT inrelation to CMT10. The remaining four genotypes,which were the latest in CV, had a negative slope thatwas probably due to non controlled factors (e.g. sitequality and nutrients availability) (Figure 4b). The dura-tion of the bud set process of the thirteen plastic geno-types with early date2.5 in CV was always shorter in VTthan in CV. Moreover, these genotypes always initiateddate2.5 later in VT than in CV, where CMT10 wasreached earlier (Figure 2a and Figure 4c).
QTL analysesDiscriminative bud set traits for QTL analysis were a listof complementary traits, which explain together a largepart (% from PCA on this list of traits) of phenotypicvariation observed for growth cessation and bud onset.The trait date2.5, although highly correlated withdate1.5, was added because we consider it physiologi-cally remarkable (perception of critical day length) andscarcely reported in literature. For these four traits eightand 16 QTL were mapped on the maternal and paternalmap, respectively. Genetic parameters for the detected
QTL are shown in Table 4. The QTL intervals werelocated on 12 linkage groups (LG): I, III, IV, VI, VII, X,XI, XIII, XVI, XVII, XVIII and XIX (Figure 5). QTL fordate1.5 and date2.5 co-localized on LG-IV, X, XVI,XVII, and on LG-Ia together with subproc2. On LG-VIb, QTL intervals for subproc1, subproc2 and date1.5overlapped (Figure 5). The average percentage of var-iance explained (PVE) by individual QTL was 5.5%, andthe maximum PVE per trait was 40.1% (Table 5). ThreeQTL, two for subproc1 and one for subproc2, hadeffects with opposite directions between the two sites(Table 4), thus reflecting the negative genetic correlationbetween these traits and the onset-of-stage traits (Table2a,b). Seven of the 16 QTL for the paternal map andone of the eight QTL for the maternal map had signifi-cant differences between the two sites (Table 4).
Identification of CGsAnchored simple sequence repeat (SSR) markers haveallowed linking 19 out of 24 identified QTL to the phy-sical map. Genomic intervals of QTL on LG-I, IV, X,XIII, XVI and XVII, corresponding to co-locating QTLwith high PVE, were analyzed. Their intervals rangedfrom 1.7 to 10.6 Mbp, considering a unique overlappingregion where QTL co-localized. The number of genemodels in these intervals ranged from 125 to 990. Thetotal number of gene models in all the intervals was3317 (Table 6). The availability of the genome sequence
Figure 4 Analysis of phenotypic plasticity of bud set in a Populus nigra full-sib family (POP5). Data were observed in two sites in Italy:Cavallermaggiore (CV) and Viterbo (VT). (a) Frequency distribution of the genotype relative ecovalence (%). The vertical dotted line separates the17 most plastic genotypes, accounting 50% of the total G × E observed for the onset of growth cessation (date2.5). (b) Interaction patterns ofthe full-sib genotypes. The vertical black lines indicate the 17 most plastic genotypes. (c) Total duration of bud set process for 13 of these plasticgenotypes that showed an interaction pattern with a positive slope CV-VT in terms of cumulative minimum temperature < 10°C (CMT10). Barsrepresent the duration from onset of growth cessation (date2.5) to the end of bud maturation (date0.5), measured in day of the year (DOY) inCV (white bars) and VT (grey bars). The CMT10 value corresponding to date2.5 is reported on the left of each bar.
Fabbrini et al. BMC Plant Biology 2012, 12:47http://www.biomedcentral.com/1471-2229/12/47
Page 6 of 16
of the parental genotype ‘Poli’ and three other P. nigragenotypes [30], allowed the calculation of the number ofSNPs in each interval for ‘Poli’ and among the four P.nigra genotypes (Table 6).QTL analyses cannot identify specific genes responsi-
ble for the phenotypic variation, but the integration ofgenomic data with the knowledge of gene function orexpression allowed identifying promising CGs linked tobud set. Literature searches about phenology, coupledwith the search of GenBank database, allowed finding atotal of 997 genes reported to be involved in bud set.Among them, 774 sequences were located on the P. tri-chocarpa genome assembly v2 (corresponding to 1.9% ofall P. trichocarpa genes), 722 were identified by Ruttinket al. [31], and 52 from other sources (Additional file 5:Table S3). Sixty seven expressional CGs from Ruttink etal. [31] and six from the other sources were within theseven QTL regions analyzed, corresponding to 2.2% ofall genes contained in these intervals (Table 6 and
Additional file 5: Table S3). The latter set of six CGswere: one photoreception factor gene, Phytochrome A(PhyA, GI: 2664188); three transcription factor genes forsignal transduction, Constans2-like (Co-L2, GI: 831441),FAR-RED elongated hypocotyl 1 protein (FHY1.2), andPhyA signal transduction factor (PAT1-LGXVI); two cir-cadian clock factor genes, circadian clock coupling factor(ZGT1like, GI:14210078 and ZGT2like, GI:14210078).Since these six candidates did not come from expres-sional evidence, a search in the available expressedsequence tag (EST) database (PopulusDB, GenBank andothers) was conducted in order to find evidence ofexpression. All the six gene sequences showed signifi-cant hits vs. ESTs belonging to a mixed tissue prepara-tion of Populus leaf, bud and stem, which could bereferred to as phenology-related tissues. In the P. nigramapping population, a single marker t-test (Kruskal-Wallis) between phenotypic data of subproc1 and SNPpolymorphism used to map PhyA indicated that this
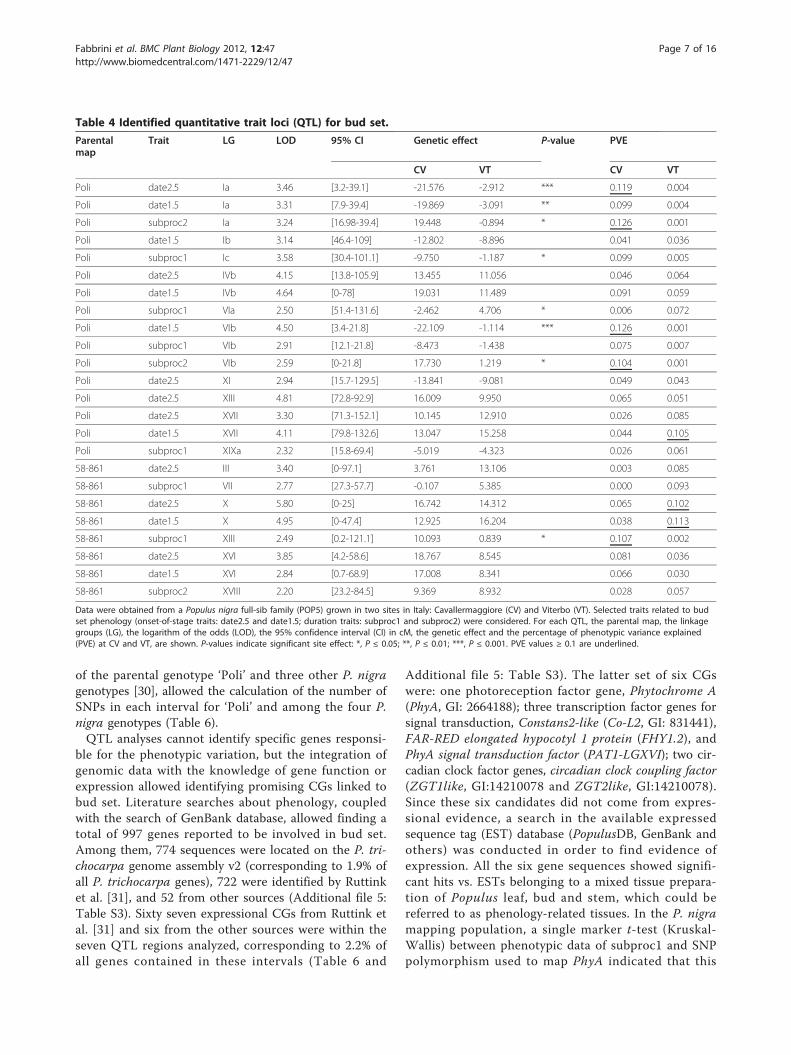
Table 4 Identified quantitative trait loci (QTL) for bud set.
Parentalmap
Trait LG LOD 95% CI Genetic effect P-value PVE
CV VT CV VT
Poli date2.5 Ia 3.46 [3.2-39.1] -21.576 -2.912 *** 0.119 0.004
Poli date1.5 Ia 3.31 [7.9-39.4] -19.869 -3.091 ** 0.099 0.004
Poli subproc2 Ia 3.24 [16.98-39.4] 19.448 -0.894 * 0.126 0.001
Poli date1.5 Ib 3.14 [46.4-109] -12.802 -8.896 0.041 0.036
Poli subproc1 Ic 3.58 [30.4-101.1] -9.750 -1.187 * 0.099 0.005
Poli date2.5 IVb 4.15 [13.8-105.9] 13.455 11.056 0.046 0.064
Poli date1.5 IVb 4.64 [0-78] 19.031 11.489 0.091 0.059
Poli subproc1 VIa 2.50 [51.4-131.6] -2.462 4.706 * 0.006 0.072
Poli date1.5 VIb 4.50 [3.4-21.8] -22.109 -1.114 *** 0.126 0.001
Poli subproc1 VIb 2.91 [12.1-21.8] -8.473 -1.438 0.075 0.007
Poli subproc2 VIb 2.59 [0-21.8] 17.730 1.219 * 0.104 0.001
Poli date2.5 XI 2.94 [15.7-129.5] -13.841 -9.081 0.049 0.043
Poli date2.5 XIII 4.81 [72.8-92.9] 16.009 9.950 0.065 0.051
Poli date2.5 XVII 3.30 [71.3-152.1] 10.145 12.910 0.026 0.085
Poli date1.5 XVII 4.11 [79.8-132.6] 13.047 15.258 0.044 0.105
Poli subproc1 XIXa 2.32 [15.8-69.4] -5.019 -4.323 0.026 0.061
58-861 date2.5 III 3.40 [0-97.1] 3.761 13.106 0.003 0.085
58-861 subproc1 VII 2.77 [27.3-57.7] -0.107 5.385 0.000 0.093
58-861 date2.5 X 5.80 [0-25] 16.742 14.312 0.065 0.102
58-861 date1.5 X 4.95 [0-47.4] 12.925 16.204 0.038 0.113
58-861 subproc1 XIII 2.49 [0.2-121.1] 10.093 0.839 * 0.107 0.002
58-861 date2.5 XVI 3.85 [4.2-58.6] 18.767 8.545 0.081 0.036
58-861 date1.5 XVI 2.84 [0.7-68.9] 17.008 8.341 0.066 0.030
58-861 subproc2 XVIII 2.20 [23.2-84.5] 9.369 8.932 0.028 0.057
Data were obtained from a Populus nigra full-sib family (POP5) grown in two sites in Italy: Cavallermaggiore (CV) and Viterbo (VT). Selected traits related to budset phenology (onset-of-stage traits: date2.5 and date1.5; duration traits: subproc1 and subproc2) were considered. For each QTL, the parental map, the linkagegroups (LG), the logarithm of the odds (LOD), the 95% confidence interval (CI) in cM, the genetic effect and the percentage of phenotypic variance explained(PVE) at CV and VT, are shown. P-values indicate significant site effect: *, P ≤ 0.05; **, P ≤ 0.01; ***, P ≤ 0.001. PVE values ≥ 0.1 are underlined.
Fabbrini et al. BMC Plant Biology 2012, 12:47http://www.biomedcentral.com/1471-2229/12/47
Page 7 of 16
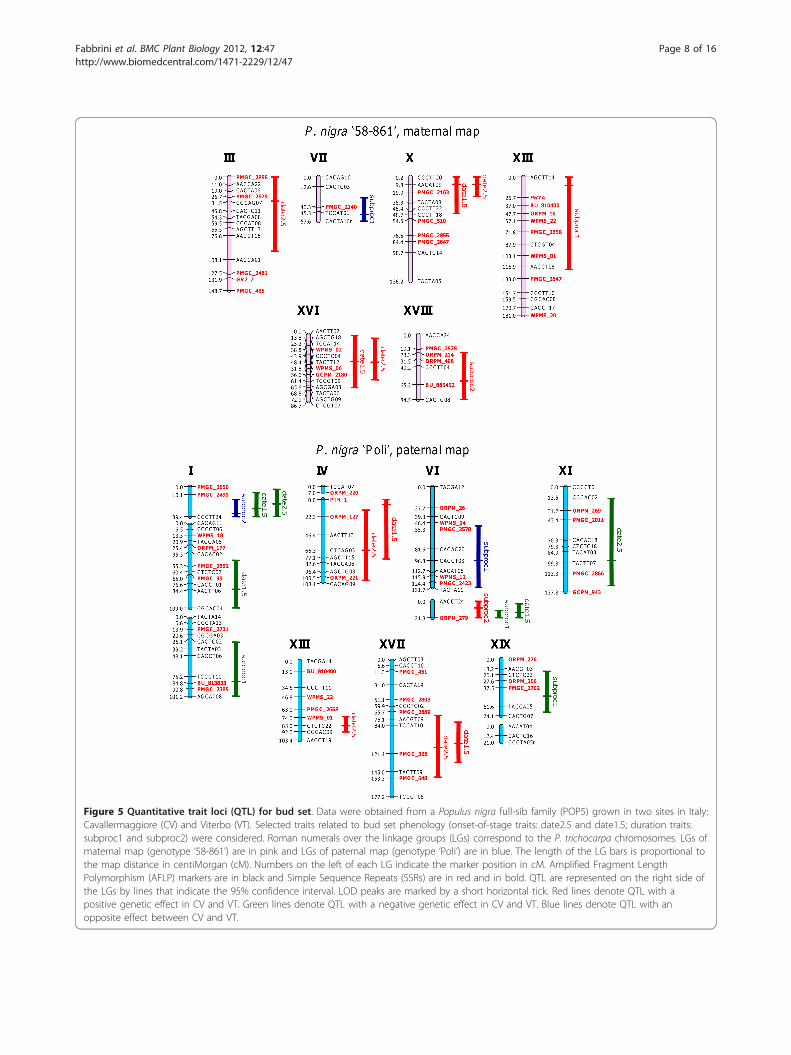
Figure 5 Quantitative trait loci (QTL) for bud set. Data were obtained from a Populus nigra full-sib family (POP5) grown in two sites in Italy:Cavallermaggiore (CV) and Viterbo (VT). Selected traits related to bud set phenology (onset-of-stage traits: date2.5 and date1.5; duration traits:subproc1 and subproc2) were considered. Roman numerals over the linkage groups (LGs) correspond to the P. trichocarpa chromosomes. LGs ofmaternal map (genotype ‘58-861’) are in pink and LGs of paternal map (genotype ‘Poli’) are in blue. The length of the LG bars is proportional tothe map distance in centiMorgan (cM). Numbers on the left of each LG indicate the marker position in cM. Amplified Fragment LengthPolymorphism (AFLP) markers are in black and Simple Sequence Repeats (SSRs) are in red and in bold. QTL are represented on the right side ofthe LGs by lines that indicate the 95% confidence interval. LOD peaks are marked by a short horizontal tick. Red lines denote QTL with apositive genetic effect in CV and VT. Green lines denote QTL with a negative genetic effect in CV and VT. Blue lines denote QTL with anopposite effect between CV and VT.
Fabbrini et al. BMC Plant Biology 2012, 12:47http://www.biomedcentral.com/1471-2229/12/47
Page 8 of 16
SNP was not responsible for the effect of subproc1 QTL(data not shown). Furthermore, gene models were inves-tigated closest to the logarithm of the odds (LOD) peakof selected QTL, considering ± 10 kbp from the LODpeak position [32]. When no gene was found, the regionwas extended to ± 30 kbp to find at least one gene perLOD peak. Eighteen gene models corresponding tothese search criteria were found and listed in Additionalfile 6: Table S4. Some of these genes were functionallyinvolved in regulation of transcription (putative tran-scription factors MYB6, BNQ1, bHLH), intracellular
signal transduction (DC1 domain-containing protein),photomorphogenesis (CULLIN4) and UV light sensitivity(UVI4). The latter gene is also present in the list ofexpressional CGs found by Ruttink et al. [31]. Othergenes close to LOD peaks were related to developmentalprocess (CRINKLY4 RELATED, RABA4D), response tostress and/or hormones (AMK2, CCR4-NOT, ACR8) andothers encoded structural constituent of ribosome(Additional file 6: Table S4). The EST database searchrevealed that 16 out of 18 gene models are putativelyexpressed. Among them, 13 models showed significanthits matching to EST libraries belonging to tissuesrelated to phenology (i.e. bud, flower, apical shoot).Given the data collected in terms of QTL co-localiza-
tion, expression and literature reports, we came up witha set of most promising CGs for bud set traits com-posed of six functional candidates, 13 gene models and67 expressional candidates.
DiscussionUnravelling bud set process and G × E interactionPopulus is an ideal model tree to study bud set becauseof its indeterminate shoot growth. Another factorworthy of consideration is that POP5 parental genotypes
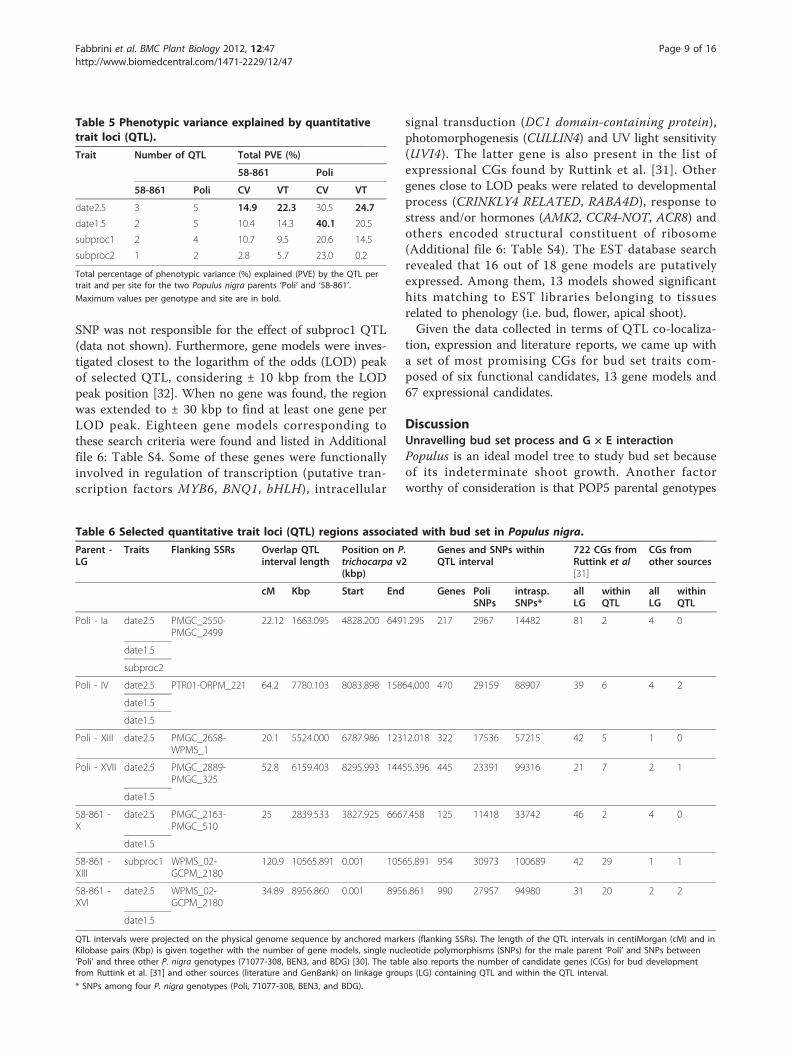
Table 5 Phenotypic variance explained by quantitativetrait loci (QTL).
Trait Number of QTL Total PVE (%)
58-861 Poli
58-861 Poli CV VT CV VT
date2.5 3 5 14.9 22.3 30.5 24.7
date1.5 2 5 10.4 14.3 40.1 20.5
subproc1 2 4 10.7 9.5 20.6 14.5
subproc2 1 2 2.8 5.7 23.0 0.2
Total percentage of phenotypic variance (%) explained (PVE) by the QTL pertrait and per site for the two Populus nigra parents ‘Poli’ and ‘58-861’.
Maximum values per genotype and site are in bold.
Table 6 Selected quantitative trait loci (QTL) regions associated with bud set in Populus nigra.
Parent -LG
Traits Flanking SSRs Overlap QTLinterval length
Position on P.trichocarpa v2(kbp)
Genes and SNPs withinQTL interval
722 CGs fromRuttink et al[31]
CGs fromother sources
cM Kbp Start End Genes PoliSNPs
intrasp.SNPs*
allLG
withinQTL
allLG
withinQTL
Poli - Ia date2.5 PMGC_2550-PMGC_2499
22.12 1663.095 4828.200 6491.295 217 2967 14482 81 2 4 0
date1.5
subproc2
Poli - IV date2.5 PTR01-ORPM_221 64.2 7780.103 8083.898 15864.000 470 29159 88907 39 6 4 2
date1.5
date1.5
Poli - XIII date2.5 PMGC_2658-WPMS_1
20.1 5524.000 6787.986 12312.018 322 17536 57215 42 5 1 0
Poli - XVII date2.5 PMGC_2889-PMGC_325
52.8 6159.403 8295.993 14455.396 445 23391 99316 21 7 2 1
date1.5
58-861 -X
date2.5 PMGC_2163-PMGC_510
25 2839.533 3827.925 6667.458 125 11418 33742 46 2 4 0
date1.5
58-861 -XIII
subproc1 WPMS_02-GCPM_2180
120.9 10565.891 0.001 10565.891 954 30973 100689 42 29 1 1
58-861 -XVI
date2.5 WPMS_02-GCPM_2180
34.89 8956.860 0.001 8956.861 990 27957 94980 31 20 2 2
date1.5
QTL intervals were projected on the physical genome sequence by anchored markers (flanking SSRs). The length of the QTL intervals in centiMorgan (cM) and inKilobase pairs (Kbp) is given together with the number of gene models, single nucleotide polymorphisms (SNPs) for the male parent ‘Poli’ and SNPs between‘Poli’ and three other P. nigra genotypes (71077-308, BEN3, and BDG) [30]. The table also reports the number of candidate genes (CGs) for bud developmentfrom Ruttink et al. [31] and other sources (literature and GenBank) on linkage groups (LG) containing QTL and within the QTL interval.
* SNPs among four P. nigra genotypes (Poli, 71077-308, BEN3, and BDG).
Fabbrini et al. BMC Plant Biology 2012, 12:47http://www.biomedcentral.com/1471-2229/12/47
Page 9 of 16
originated from contrasting environments. These twoadvantages render powerful the exploration of the G ×E interaction patterns and phenotypic plasticity that aremostly uncharacterized for phenology traits. Recently, anew bud set scoring system in Populus spp. has led tothe dissection of the bud set process into different stagesand durations to estimate their relative contribution tothe accomplishment of this phenological process [9].Based on this new tool, the phenotypic plasticity andthe G × E interaction was fully investigated in a P. nigraF1 full-sib family using a multi-environment approach.The transition from shoot to bud structure (date1.5)was selected as the very critical determinant of bud setat both sites by PCA analysis. The selection of phenoty-pic descriptors characterizing key steps of bud set pro-cess allows to improve the estimation of geneticvariation expressed at these different steps and thedetection of more robust genomic regions involved inthe phenological process. High phenotypic and geneticcorrelations between stage traits, consistent to thoseobserved in P. nigra natural population [9], pointed outbud set as a cascade process, during which one phasecould be indicative of the whole process. Genetic corre-lations between the two subprocesses vary in magnitudeand sign from one environment to another. Indeed, inthe past it was recognized that genetic correlationschange across environments [33].In the present study, the timing of stages and duration
traits showed different levels of H2. This contrast couldbe explained simultaneously by different levels ofexpressed genetic variation and different levels of resi-dual variation. Stage traits were characterized by a sig-nificant genotypic effect and a high heritability value,but the influence of the residual factors, either environ-mental conditions or precision of measure, augmentedfrom date2.5 to date0.5. The increase of the importanceof environmental factor from date2.5 to date0.5 is con-trary to the one observed by Rohde et al. [9] in hybridpoplars, but similar to the one observed in P. nigra nat-ural populations studied in the same paper. A majorgenetic control of the last part of the process (date1, theonly scored stage) was also found in a F2 hybrid poplarpedigree by Howe et al. [34]. Similar results were alsofound by Li et al. [35] in interspecific poplar hybrids intwo successive years. This major H2 may be explainedby the use of interspecific hybrids that could increasethe genetic variance and heritability estimation for thesetraits [34]. Nevertheless, heritability estimates have oftenbeen shown to be specific to the population and envir-onment [36,37].The total duration of the bud set process for POP5
was conserved at the two sites, but the time spent ineach subprocess depended on the site. However, in bothcases subproc2 was longer than subproc1. Interestingly,
as exhibited by phenotypic correlations we observed thatthe later genotypes for date2.5 hastened subproc2, whichcould be an important strategy to avoid frost injury.According to the concept of critical night length,
where photoperiod is responsible for the onset of budset process across environments and years [38], POP5family reached date2.5 at about the same effective nightlength at both sites. Importantly, ANOVA analysis fordate2.5 showed a non-significant contribution of theenvironment effect and, on the opposite, a significant G× E effect (up to 19% of the phenotypic variabilityexplained). This indicates that genotypes react differ-ently to different environments. Data showed always ahighly significant contribution of the G × E interactionin the phenotypic variation of all the stages, with adecreasing trend observed during the process. Rohde etal. [14] demonstrated that different locations differen-tially influenced the timing of growth cessation and theduration of bud formation in identical poplar genotypes,suggesting that high temperatures render the meristemless sensitive to growth-arresting photoperiodic signals.Moreover, Kalcsits et al. [11] showed that night tem-perature has a greater influence than day temperature inpoplar. In the present study, the growth cessation of theplastic genotypes started earlier at the site with thelower minimum overnight temperature. Total durationof the bud set process for plastic genotypes was has-tened in VT where lower temperatures were experi-enced during bud set. The site VT was globally warmerthan CV with higher temperatures prevailing during thetime until growth cessation, but the fall of temperaturesrecorded in VT during a limited number of nights waslike a short treatment in an usually warmer site. Fewrecent studies showed that temperature can modify thetiming of photoperiod controlling phenological events indeciduous woody plants [11,13,39]. The relative contri-bution of the G × E interaction on the phenotypic varia-tion observed on date1 was perfectly comparable withthe results of Luquez et al. [5] in P. tremula in twosites. In our P. nigra family the magnitude of G × Einteraction partially increased from subproc1 to sub-proc2. The latter is a developmental period for whichthe genotypes of the analyzed family tended to responddifferently to the various environments.Distribution of genotype relative ecovalences showed
that only few genotypes strongly contributed to theoverall G × E interaction for date2.5. More than impor-tant rank changes, these genotypes revealed differencesin the scale of response to environmental changes. Thisis the case for ‘58-861’, one of the earliest genotype forthe onset of growth cessation (date2.5) at both sites butsensitive to cold temperatures. This could be an impor-tant survival strategy for trees to adjust their short-termresponse to temperature in a changing climate.
Fabbrini et al. BMC Plant Biology 2012, 12:47http://www.biomedcentral.com/1471-2229/12/47
Page 10 of 16
Increasing rank change effect responsible for the G × Einteraction was observed during the bud set process.Non-significant Spearman coefficients indicated randomchanges in genotype ranking for duration traits. Conse-quently, a major influence of environmental conditionson the variation of these traits was observed.
Genomic regions containing QTL for bud setThe QTL detected in this study explain a small propor-tion of the phenotypic variance (≤ 10%), which is likelyoverestimated due to the relatively small progeny size[15]. However, several studies on global gene expressiondemonstrated the complex gene networks involved inbud formation, with large sets of genes temporally regu-lated during each phase of the process [31,40,41]. There-fore, one can expect a complex genetic control of budformation by many genes with minor effect on the phe-notype. Similar results were also described by Jermstadet al. [42] for spring bud flush in Douglas-fir. In foresttrees, biological and technical constraints make difficultto manage wide progeny sizes, thus limiting the com-plete genome coverage with high resolution geneticmaps. This negatively affects the detection of QTL withmajor effect, if present within uncovered genomeregions, and reduces possibility to detect QTL withminor effect. The number of QTL identified alsodepends on the importance of genetic factors for thetrait. This is in agreement with our observations, withmore QTL identified for the onset-of-stage traits thatshowed medium to high H2 than for the duration traits.The co-localization of most QTL for stages and sub-
proc2 was in agreement with their high genetic correla-tion, relating to the physiological relationship betweenthese traits. This could be due to the pleiotropic effectof a single gene affecting the traits or the physical link-age and/or linkage disequilibrium between two lociinfluencing the traits [43]. Negative genetic correlationsindicate antagonistic effects of the loci on the traits.When stages QTL co-localized with the subproc2 QTL,they had opposite genetic effect.Seven QTL on ‘Poli’ map and one on ‘58-861’ map
have significantly different effects between the twoenvironments, underlying the significant G × E interac-tion. Phenotypic data indicated that genotype ‘58-861’was highly plastic, while ‘Poli’ encountered difficulties inadapting to the CV site. This suggests that the expres-sion of alleles inherited from the ‘Poli’ parent is moredependent on the environment than the expression ofalleles inherited from ‘58-861’ parent.Regardless of the slight changes in the genetic maps
and the addition of a second site (VT), the QTL withhigh PVE were identified as in Rohde et al. [9], whoanalyzed the same mapping family but with less indivi-duals. When the framework map was compared to that
described by Gaudet et al. [29] and then used by Rohdeet al. [9], the addition of new F1 individuals has led tothe mapping of new framework markers and to thesplitting of some LGs. However, QTL were detected onLG-III, LG-VI and LG-XIII, which belong to the sixrobust regions selected by Rohde et al. [9]. Previously,QTL for bud set were identified in another pedigree ofP. trichocarpa × P. deltoides on LG-III, VI and X [24].These three LGs have also been detected in Rohde et al.[9] and in the current study. The genes PhyB2, LHY1and LHY2, of which SNP polymorphism explain part ofthe phenotypic variation of bud set in P. tremula[44,45], were not within the common QTL intervalsacross several Populus mapping pedigrees [9,24]. QTLregions recurrently identified in different pedigrees andenvironments are most likely robust genomic regionscontrolling the variation of the traits.
Identifying positional candidate genesQTL mapping is an early step in identifying genesunderlying trait variation [43]. The availability of the P.trichocarpa genome sequence adds a new dimension toQTL mapping, allowing to investigate genes within QTLintervals and map CGs in silico. Deep analysis of themost robust QTL regions allowed to highlight 13 genemodels, 67 bud set-related expressional CGs and sixfunctional CGs (PhyA, Co-L2, FHY1.2, PAT1, ZGT1likeand ZGT2like).The functional CGs are involved in light signaling
pathway. In particular, Co-L2, that belongs to the CON-STANS gene family, was found to be regulated byphotoperiod and involved in growth cessation in Nor-way spruce [46] and Populus [47,48]. PAT1, FHY1.2,ZGT1like and ZGT2like are also involved in the regula-tion of PhyA signaling [49-51], which could affect thequantitative variation of bud set. This regulationmechanism could explain why PhyA was not directlyresponsible for the phenotypic variation of this trait(Kruskal-Wallis single marker t-test), even if it is wellknown to play a key role in growth cessation [52].Another interesting CG is the UV-B light insensitive 4
(UVI4), which is close to a peak of QTL LOD and alsobelongs to the expressional CGs found by Ruttink et al.[31]. UVI4 is responsive to UV-B light and its expres-sion level decreased with the cessation of cell division inArabidopsis thaliana [53]. In Populus, UVI4 gene wasalso found to be down-regulated during bud formationand cambial dormancy [31].Among the hundred gene models annotated within
our large QTL intervals, we investigated those close topeaks of LOD. The identified CGs that are then sup-ported by in silico evidences of expression in phenology-related tissues, mainly respond to light and cold as thefunctional CGs within QTL intervals. Therefore, they
Fabbrini et al. BMC Plant Biology 2012, 12:47http://www.biomedcentral.com/1471-2229/12/47
Page 11 of 16
could participate to environmental adaptation by theplasticity of their expression, which is in agreement withthe phenotypic data.
ConclusionsThe present work improves our understanding of thecomplex genetic architecture of bud set in poplar and ofthe considerable effect of G × E interaction in this pro-cess. QTL for bud set were identified and the projectionof the most robust QTL on the P. trichocarpa genome,associated to previous gene expression studies, allowedthe identification of CGs underlying the QTL. Further-more, by investigating the physiological dynamics of budset, we were able to confirm that the onset of growthcessation was triggered by night length, and the effect ofenvironmental factors increased during the process.Additionally, a low number of plastic genotypes wasresponsible for the observed G × E interaction, withsome of them being sensitive to temperature for theonset of growth cessation.The recent development of the draft genome sequen-
cing projects of P. nigra (Morgante & Zaina, personalcommunication), as well as the whole-genome SNPannotation, and the high throughput SNP genotypingplatform (Faivre-Rampant & Zaina, personal communica-tion) will be valuable tools allowing the scanning of allelicvariation in CGs and analysis of natural populations byassociation mapping to determine the alleles associatedwith bud set traits. While some progress has been madein mapping bud set QTL, the elucidation of the underly-ing molecular mechanisms remains a bottleneck. There-fore, using expression QTL (eQTL) analysis will help toidentify genes and gene networks associated to bud phe-nology and underlying traits involved in growth. Thisstudy opens up stimulating perspectives for molecularbreeding aimed at increasing forest adaptation and pro-ductivity in a rapidly changing environment.
MethodsPlant materialA full-sib family of P. nigra (POP5) was used to scorephenological characters and map QTL. The QTL map-ping pedigree, already used in a previous genetic map-ping study [29], consisted of 162 genotypes and derivedfrom an intraspecific controlled cross between genotype‘58-861’ (female) from Val Cenischia (northern Italy; 45°09’N, 07°01’E) and genotype ‘Poli’ (male) from Policoro(southern Italy; 40°09’N, 16°41’E). The parents originatefrom contrasting environments and have highly diver-gent phenotypes [54].
Experimental sitesThe study was conducted at two sites in northern (CV,44°42’N, 07°41’E) and central Italy (VT, 42°25’N, 12°
05’E) at an elevation of 285 m and 310 m above sealevel, respectively. A third experimental plantationincluding seven randomly collected genotypes of POP5and the two parents, was established in 2008 in north-ern Italy (SAV, 44°36’N, 07°37’E). The soil is alluvialwith sandy loam texture in CV and SAV, and sandy siltin VT. Annual precipitation and temperature averagesof the years of study were 603 mm and 11.5°C (CV),1125 mm and 14.2°C (VT), and 968 mm and 12.2°C(SAV). During the period of measurements (August, 1st
to October, 31st), rainfall in VT was lower than in CVand SAV (152.2 mm vs. 313.4 mm vs. 195.6 mm), whilethe average daily minimum temperature was higher inVT (13.4°C) as compared to CV and SAV (11.7°C)(Additional file 7: Figure S3). CNL, using sunrise andsunset times retrieved from the United States NavalObservatory http://aa.usno.navy.mil/, was calculatedfrom the July, 1st as a starting date. The same date wasused for the calculation of CMT10. In this case, the tem-perature value below 10°C was subtracted to 10, givingto lower temperatures a larger contribution to theparameter.
Experimental designThree experimental plantations were established in April2003 (CV) and April 2008 (VT and SAV) from hard-wood cuttings (25 cm long) planted at a distance of 2 ×0.75 m. The SAV experiment was used to reinforce theobservations of phenotypic plasticity of the parents andPOP5 genotypes. The field trials were established usinga completely randomized block design with six blocks inCV and SAV and five blocks in VT. One ramet per gen-otype and parent was randomly assigned to each block.A double border row using clonal material of the samespecies was planted around the experimental plantationsto reduce border effects. The sites were regularly irri-gated and treated with pesticides as necessary through-out the growing season. Trees were coppiced at the endof the second growing season (February 2005) in CVand the first growing season (February 2009) in VT andSAV. The re-sprouts were thinned to a single stem.
Phenotypic data collectionBud setPhenological measurements were taken in autumn 2005in CV and data were collected every two days from Sep-tember 9 (DOY 252) to October 13 (DOY 286). In VT,bud set was scored in autumn 2008 and data were col-lected every three days, from September 15 (DOY 259)to October 20 (DOY 294). In SAV bud set was scoredevery ten days in 2009, from August 18 (DOY 230) toOctober 7 (DOY 280). All trees showing abnormal api-cal behavior biasing the natural phenological processwere excluded from further measurements. The timing
Fabbrini et al. BMC Plant Biology 2012, 12:47http://www.biomedcentral.com/1471-2229/12/47
Page 12 of 16
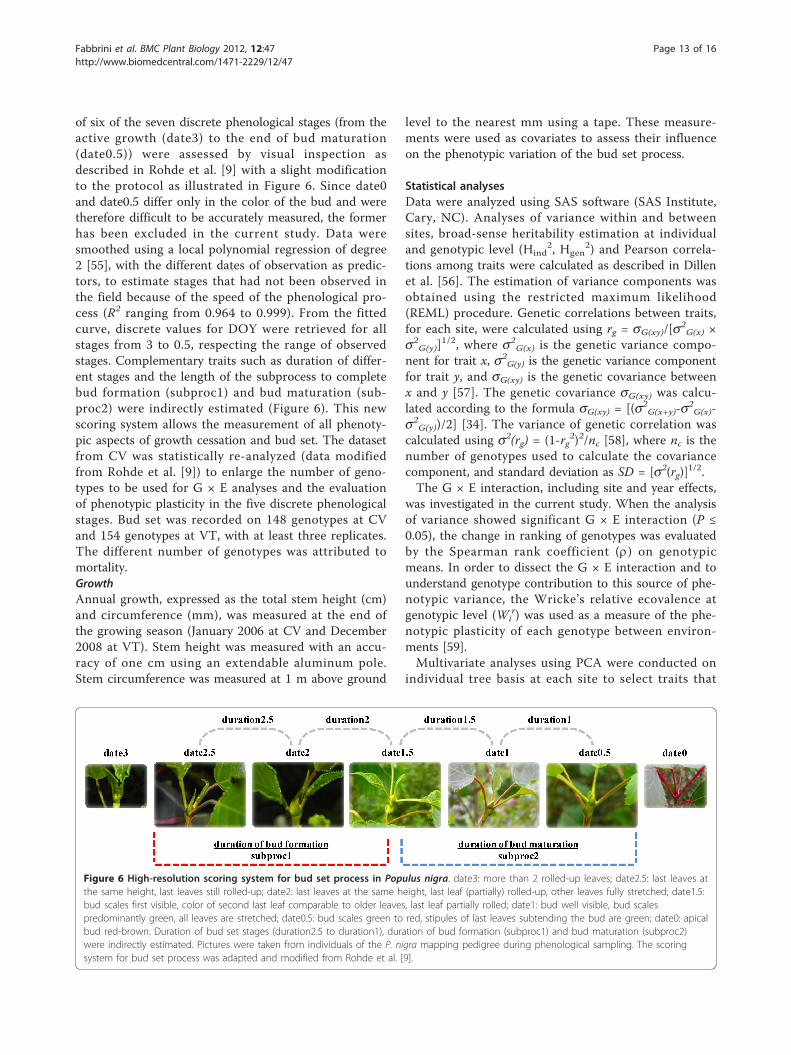
of six of the seven discrete phenological stages (from theactive growth (date3) to the end of bud maturation(date0.5)) were assessed by visual inspection asdescribed in Rohde et al. [9] with a slight modificationto the protocol as illustrated in Figure 6. Since date0and date0.5 differ only in the color of the bud and weretherefore difficult to be accurately measured, the formerhas been excluded in the current study. Data weresmoothed using a local polynomial regression of degree2 [55], with the different dates of observation as predic-tors, to estimate stages that had not been observed inthe field because of the speed of the phenological pro-cess (R2 ranging from 0.964 to 0.999). From the fittedcurve, discrete values for DOY were retrieved for allstages from 3 to 0.5, respecting the range of observedstages. Complementary traits such as duration of differ-ent stages and the length of the subprocess to completebud formation (subproc1) and bud maturation (sub-proc2) were indirectly estimated (Figure 6). This newscoring system allows the measurement of all phenoty-pic aspects of growth cessation and bud set. The datasetfrom CV was statistically re-analyzed (data modifiedfrom Rohde et al. [9]) to enlarge the number of geno-types to be used for G × E analyses and the evaluationof phenotypic plasticity in the five discrete phenologicalstages. Bud set was recorded on 148 genotypes at CVand 154 genotypes at VT, with at least three replicates.The different number of genotypes was attributed tomortality.GrowthAnnual growth, expressed as the total stem height (cm)and circumference (mm), was measured at the end ofthe growing season (January 2006 at CV and December2008 at VT). Stem height was measured with an accu-racy of one cm using an extendable aluminum pole.Stem circumference was measured at 1 m above ground
level to the nearest mm using a tape. These measure-ments were used as covariates to assess their influenceon the phenotypic variation of the bud set process.
Statistical analysesData were analyzed using SAS software (SAS Institute,Cary, NC). Analyses of variance within and betweensites, broad-sense heritability estimation at individualand genotypic level (Hind
2, Hgen2) and Pearson correla-
tions among traits were calculated as described in Dillenet al. [56]. The estimation of variance components wasobtained using the restricted maximum likelihood(REML) procedure. Genetic correlations between traits,for each site, were calculated using rg = sG(xy)/[s2
G(x) ×s2
G(y)]1/2, where s2
G(x) is the genetic variance compo-nent for trait x, s2G(y) is the genetic variance componentfor trait y, and sG(xy) is the genetic covariance betweenx and y [57]. The genetic covariance sG(xy) was calcu-lated according to the formula sG(xy) = [(s2
G(x+y)-s2G(x)-
s2G(y))/2] [34]. The variance of genetic correlation was
calculated using s2(rg) = (1-rg2)2/nc [58], where nc is the
number of genotypes used to calculate the covariancecomponent, and standard deviation as SD = [s2(rg)]
1/2.The G × E interaction, including site and year effects,
was investigated in the current study. When the analysisof variance showed significant G × E interaction (P ≤0.05), the change in ranking of genotypes was evaluatedby the Spearman rank coefficient (r) on genotypicmeans. In order to dissect the G × E interaction and tounderstand genotype contribution to this source of phe-notypic variance, the Wricke’s relative ecovalence atgenotypic level (Wi
r) was used as a measure of the phe-notypic plasticity of each genotype between environ-ments [59].Multivariate analyses using PCA were conducted on
individual tree basis at each site to select traits that
Figure 6 High-resolution scoring system for bud set process in Populus nigra. date3: more than 2 rolled-up leaves; date2.5: last leaves atthe same height, last leaves still rolled-up; date2: last leaves at the same height, last leaf (partially) rolled-up, other leaves fully stretched; date1.5:bud scales first visible, color of second last leaf comparable to older leaves, last leaf partially rolled; date1: bud well visible, bud scalespredominantly green, all leaves are stretched; date0.5: bud scales green to red, stipules of last leaves subtending the bud are green; date0: apicalbud red-brown. Duration of bud set stages (duration2.5 to duration1), duration of bud formation (subproc1) and bud maturation (subproc2)were indirectly estimated. Pictures were taken from individuals of the P. nigra mapping pedigree during phenological sampling. The scoringsystem for bud set process was adapted and modified from Rohde et al. [9].
Fabbrini et al. BMC Plant Biology 2012, 12:47http://www.biomedcentral.com/1471-2229/12/47
Page 13 of 16
account for most of the variance in the observed pheno-logical process before QTL analysis.
QTL analysesQTL analyses were performed on selected traits(date2.5, date1.5, subproc1 and subproc2 expressed asCNL), which resulted after PCA as the most discrimina-tive in terms of phenotypic variation. Analyses were car-ried out as described in Rae et al. [60] and in Rohde etal. [9]. The framework maps of the pedigree, describedin Gaudet et al. [29], were improved by addition of 62F1 progenies to obtain a total of 154 individuals forQTL analysis. Data were processed with MultiQTL soft-ware http://www.multiqtl.com/ and the multiple envir-onment approach was used to increase the accuracy ofthe estimated QTL position and effect [56,60]. The QTLpresented in this study had a chromosome-wise statisti-cal significance level of 0.05 and a bootstrap analysiswith 1,000 data permutations was carried out to esti-mate the 95% confidence interval of the QTL. The dif-ferent effect of the QTL between the two sites wastested according to Rae et al. [60].
QTL projectionsQTL were projected on the reference genome sequenceof P. trichocarpa, using anchored markers. For eachQTL, the SSRs nearest to the interval extremities andwith known position on P. trichocarpa genome wereused to calculate the relationship between the geneticand the physical distance [61] to obtain the physicalcoordinates of the QTL interval on the P. trichocarpagenome sequence. When two or more QTL co-locatedon the same genomic region, a unique overlap QTLinterval was considered and a deep annotation of itssequence was done in terms of genes and SNP markers.The gene report was based on the U.S. Department ofEnergy Joint Genome Institute (JGI) v2.2 gene annota-tion of the P. trichocarpa genome assembly v2. TheSNP report was based on the high-throughput re-sequencing of four P. nigra genotypes (Poli, 71077-308,BEN3, and BDG), which provided a genome-wide SNPdetection, displayed through the IGA gbrowse tool [30].
Candidate gene selectionA bibliographical review was conducted to identify genesor gene models putatively associated with phenology[6,9,52] in Populus. Keywords such as phenology, budset, flowering time pathway, circadian-clock genes andphotoperiod-related genes were used for a web-basedsearch in PubMed and GenBank of the National Centerfor Biotechnology Information (NCBI) http://www.ncbi.nlm.nih.gov/. A key source of CGs was represented bySimpson & Dean [62] and Ruttink et al. [31]. Then, thegenes identified from the resulting literature collection
were queried in the P. trichocarpa genome browser(JGI), assembly v2. When the query belonged to a differ-ent genus than Populus, a TBLASTX search was used;otherwise a BLASTN search was applied. The LG andbase pair (bp) location of each gene model producing astatistically significant alignment with the querysequence was compared to the QTL intervals previouslyprojected on the genome. Annotated genes known to beinvolved in bud set or development (or family membersof such genes) that fell within these intervals were con-sidered to be positional CGs. Their functionality wasconfirmed by searching the P. trichocarpa ESTs databasehttp://www.populus.db.umu.se/index.html[63] in orderto have an additional support in the discovery of themost promising CGs.
Additional material
Additional file 1: Figure S1. (Portable Document Format file)Photoperiod progression in the two experimental sites in Italy:Cavallermaggiore (CV) and Viterbo (VT). (a) The yearly variation inphotoperiod at the two sites situated at 44°N (CV, red full lines) and 42°N(VT, black dotted lines), as well as for 35°N and 50°N of latitude. The graylines correspond to the period of measurements of bud set process. (b)Cumulative night length (CNL) was calculated from July 1st in CV (redfull lines) and VT (black dotted lines).
Additional file 2: Figure S2. (Portable Document Format file) Linearregression between growth and selected phenological traits. Data wereobtained from a Populus nigra full-sib family (POP5) grown in two sites inItaly: Cavallermaggiore (CV) and Viterbo (VT).
Additional file 3: Table S1. (Portable Document Format file) Geneticvariation in a Populus nigra full-sib family (POP5) grown inCavallermaggiore (CV) in Italy. Parental values (i.e. female parent ‘58-861’mean ± standard error (SE)), family values (i.e. population means ± SEand level of significance differences between F1 genotypes) and geneticparameters (i.e. coefficient of genetic (CVg) and residuals (CVε) variationand broad-sense heritability at individual (Hind
2) and genotypic (Hgen2)
level ± SE). The F-test between parents were not performed because ofthe absence of ‘Poli’ (see Materials and Methods).
Additional file 4: Table S2. (Portable Document Format file) Geneticvariation in a Populus nigra full-sib family (POP5) grown in Viterbo (VT) inItaly. Parental values (i.e. female parent ‘58-861’ and male parent ‘Poli’means ± standard error (SE) and level of significance difference betweenthe two), family values (i.e. population means ± SE and level ofsignificance differences between F1 genotypes) and genetic parameters(i.e. coefficient of genetic (CVg) and residuals (CVε) variation and broad-sense heritability at individual (Hind
2) and genotypic (Hgen2) level ± SE).
The significance level of the F-test between the two parents for eachtrait is indicated as: ns, non significant; *, P ≤ 0.05; **, P ≤ 0.01; ***, P ≤
0.001.
Additional file 5: Table S3. (Microsoft Excel file) List of candidate genes(CGs) from bibliography sources.
Additional file 6: Table S4. (Portable Document Format file) Genemodels search relating to bud set. Gene models in Populus trichocarpagenome sequence closest to the logarithm of the odds (LOD) peak ofselected quantitative trait loci (QTL) for bud set traits found in P. nigra.Gene models were searched in the sequence at ± 10 Kbp around theposition of LOD peak or ± 30 Kbp to find at least one gene per LODpeak. LG, linkage group on which QTL were found. bp, base pairs.
Additional file 7: Figure S3. (Portable Document Format file)Meteorological characteristics of the three experimental sites taken intoaccount for phenotypic plasticity. Data were obtained from nearbymeteorological stations in the three experimental sites in Italy,
Fabbrini et al. BMC Plant Biology 2012, 12:47http://www.biomedcentral.com/1471-2229/12/47
Page 14 of 16
Cavallermaggiore (CV), Viterbo (VT) and Savigliano (SAV), where thePopulus nigra full-sib family (POP5) was studied.
AcknowledgementsThe authors are grateful to Michele Baldasso for his help in the phenologicalmeasurements in 2005 and to the Company Alasia Franco Vivai for themanagement of CV and SAV plantation sites. This work was supported bygrants from the European Union (QLK5-CT-2002-00953 POPYOMICS, FP7-211868 NOVELTREE). AH is supported by the Brain Gain Program (Rientro deicervelli) of the Italian Ministry of Education, University and Research (MIUR).
Author details1Department for Innovation in Biological, Agro-food and Forest systems,University of Tuscia, Via S. Camillo de Lellis, Viterbo 01100, Italy. 2INRA, UR0588, National Institute for Agricultural Research, Orléans 2 F-45075, France.3Department of Agriculture and Environmental Sciences, University of Udine,Via delle Scienze, Udine 33100, Italy. 4Institute for Mediterranean Agricultureand Forest Systems, National Research Council, Via Madonna Alta, Perugia06128, Italy. 5INRA, UMR 1137, INRA-Nancy University, Champenoux F-54280,France. 6Istituto di Genomica Applicata, Via J. Linussio 51, Udine 33100, Italy.7Department of Agronomy, Forestry and Land use, Agricultural ResearchCouncil, Via del Caravita, Roma 00186, Italy.
Authors’ contributionsFF and MS participated in the design and performance of the experiments,statistical analyses, data interpretation and writing of the paper; NM co-performed phenological experiments; MG carried out QTL data analyses; MG,GZ and MM performed candidate gene identification, and participated inwriting of the paper; AH and IB participated in data analyses andinterpretation, and writing of the paper. MS, CB and GSM conceived andsupervised the study. All authors jointly interpreted the results, read andapproved the final manuscript.
Competing interestsThe authors have no business relationships that could be construed as apotential conflict of interest.
Received: 21 October 2011 Accepted: 3 April 2012Published: 3 April 2012
References1. Howe GT, Gardner G, Hackett WP, Furnier GR: Phytochrome control of
short-day-induced bud set in black cottonwood. Physiol Plantarum 1996,97:95-103.
2. Pauley SS, Perry TO: Ecotypic variation of the photoperiodic response inPopulus. J Arnold Arboretum 1954, 35:167-188.
3. Neale DB, Ingvarsson PK: Population, quantitative and comparativegenomics of adaptation in forest trees. Curr Opin Plant Biol 2008,11:149-155.
4. Rohde A, Howe GT, Olsen JE, Moritz T, Van Montagu M, Junttila O,Boerjan W: Molecular aspects of bud dormancy in trees. In MolecularBiology of Woody Plants. Volume 1. Edited by: Jain SM, Minocha SC.Dordrecht, The Netherlands: Kluwer Academic Publishers; 2000:89-134.
5. Luquez V, Hall D, Albrectsen BR, Karlsson J, Ingvarsson P, Jansson S: Naturalphenological variation in aspen (Populus tremula): the SwAsp collection.Tree Genet Genomes 2008, 4:279-292.
6. Ingvarsson PK, Garcia MV, Hall D, Luquez V, Jansson S: Clinal variation inphyB2, a candidate gene for day-length-induced growth cessation andbud set, across a latitudinal gradient in European aspen (Populustremula). Genetics 2006, 172:1845-1853.
7. Hall D, Luquez V, Garcia VM, St Onge KR, Jansson S, Ingvarsson PK:Adaptive population differentiation in phenology across a latitudinalgradient in european aspen (Populus tremula, L.): a comparison ofneutral markers, candidate genes and phenotypic traits. Evolution 2007,61:2849-2860.
8. Aitken SN, Yeaman S, Holliday JA, Wang T, Curtis-McLane S: Adaptation,migration or extirpation: climate change outcomes for tree populations.Evol Appl 2008, 1:95-111.
9. Rohde A, Storme V, Jorge V, Gaudet M, Vitacolonna N, Fabbrini F, Ruttink T,Zaina G, Marron N, Dillen S, et al: Bud set in poplar - genetic dissection ofa complex trait in natural and hybrid populations. New Phytol 2011,189:106-121.
10. Howe GT, Hackett WP, Furnier GR, Klevorn RE: Photoperiodic responses ofa northern and southern ecotype of black cottonwood. Physiol Plantarum1995, 93:695-708.
11. Kalcsits L, Silim S, Tanino K: Warm temperature accelerates shortphotoperiod-induced growth cessation and dormancy induction inhybrid poplar (Populus × spp.). Trees 2009, 23:971-979.
12. Håbjørg A: Effects of photoperiod and temperature on growth anddevelopment of three latitudinal and three altitudinal populations ofBetula pubescens Ehrh. Meld Nor Landbrukshøgsk 1972, 51:1-27.
13. Tanino KK, Kalcsits L, Silim S, Kendall E, Gray GR: Temperature-drivenplasticity in growth cessation and dormancy development in deciduouswoody plants: a working hypothesis suggesting how molecular andcellular function is affected by temperature during dormancy induction.Plant Mol Biol 2010, 73:49-65.
14. Rohde A, Bastien C, Boerjan W: Temperature signals contribute to thetiming of photoperiodic growth cessation and bud set in poplar. TreePhysiol 2011, 31:472-482.
15. Howe GT, Aitken SN, Neale DB, Jermstad KD, Wheeler NC, Chen THH: Fromgenotype to phenotype: unraveling the complexities of cold adaptationin forest trees. Can J Botany 2003, 81:1247-1266.
16. Johnsen Ø, Dæhlen OG, Østreng G, Skrøppa T: Daylength andtemperature during seed production interactively affect adaptiveperformance of Picea abies progenies. New Phytol 2005, 168:589-596.
17. Johnsen Ø, Fossdal CG, Nagy N, Mølmann J, Dæhlen OG, Skrøppa T:Climatic adaptation in Picea abies progenies is affected by thetemperature during zygotic embryogenesis and seed maturation. PlantCell Environ 2005, 28:1090-1102.
18. Kvaalen H, Johnsen Ø: Timing of bud set in Picea abies is regulated by amemory of temperature during zygotic and somatic embryogenesis.New Phytol 2008, 177:49-59.
19. Visser ME: Keeping up with a warming world; assessing the rate ofadaptation to climate change. Proc R Soc B 2008, 275:649-659.
20. Kramer K, Leinonen I, Loustau D: The importance of phenology for theevaluation of impact of climate change on growth of boreal, temperateand Mediterranean forests ecosystems: an overview. Int J Biometeorol2000, 44:67-75.
21. Chmielewski FM, Rötzer T: Response of tree phenology to climate changeacross Europe. Agr Forest Meteorol 2001, 108:101-112.
22. Primack RB, Miller-Rushing AJ: The role of botanical gardens in climatechange research. New Phytol 2009, 182:303-331.
23. Nicotra AB, Atkin OK, Bonser SP, Davidson AM, Finnegan EJ, Mathesius U,Poot P, Purugganan MD, Richards CL, Valladares F, et al: Plant phenotypicplasticity in a changing climate. Trends Plant Sci 2010, 15:684-692.
24. Frewen BE, Chen THH, Howe GT, Davis J, Rohde A, Boerjan W,Bradshaw HD Jr: Quantitative trait loci and candidate gene mapping ofbud set and bud flush in Populus. Genetics 2000, 154:837-845.
25. Gailing O, Vornam B, Leinemann L, Finkeldey R: Genetic and genomicapproaches to assess adaptive genetic variation in plants: forest trees asa model. Physiol Plantarum 2009, 137:509-519.
26. Tuskan GA, DiFazio S, Jansson S, Bohlmann J, Grigoriev I, Hellsten U,Putnam N, Ralph S, Rombauts S, Salamov A, et al: The genome of blackcottonwood, Populus trichocarpa (Torr. & Gray). Science 2006,313:1596-1604.
27. Chen THH, Howe GT, Bradshaw HD: Molecular genetic analysis ofdormancy-related traits in poplars. Weed Sci 2002, 50:232-240.
28. Brunner A, Sheng X, Edwards J, Fujino T, Wang CT, DiFazio S: Regulation ofshoot-system development in Populus. BMC Proc 2011, 5(Suppl 7):I11.
29. Gaudet M, Jorge V, Paolucci I, Beritognolo I, Scarascia Mugnozza G,Sabatti M: Genetic linkage maps of Populus nigra L. including AFLPs,SSRs, SNPs, and sex trait. Tree Genet Genomes 2008, 4:25-36.
30. Giacomello S: Next-generation sequencing in Populus nigra: de novoassembly, genome-wide SNP map and comparative genomics analysis.PhD thesis University of Udine, Udine, Italy; 2011.
31. Ruttink T, Arend M, Morreel K, Storme V, Rombauts S, Fromm J,Bhalerao RP, Boerjan W, Rohde A: A molecular timetable for apical budformation and dormancy induction in poplar. Plant Cell 2007,19:2370-2390.
Fabbrini et al. BMC Plant Biology 2012, 12:47http://www.biomedcentral.com/1471-2229/12/47
Page 15 of 16
32. Celton JM, Martinez S, Jammes MJ, Bechti A, Salvi S, Legave JM, Costes E:Deciphering the genetic determinism of bud phenology in appleprogenies: a new insight into chilling and heat requirement effects onflowering dates and positional candidate genes. New Phytol 2011,192:378-392.
33. Stearns S, de Jong G, Newman B: The effects of phenotypic plasticity ongenetic correlations. Trends Ecol Evol 1991, 6:122-126.
34. Howe GT, Saruul P, Davis J, Chen THH: Quantitative genetics of budphenology, frost damage, and winter survival in an F2 family of hybridpoplars. Theor Appl Genet 2000, 101:632-642.
35. Li B, Howe GT, Wu R: Developmental factors responsible for heterosis inaspen hybrids (Populus tremuloides × P. tremula). Tree Physiol 1998,18:29-36.
36. Souza VAB, Byrne DH, Taylor JF: Heritability, genetic and phenotypiccorrelations, and predicted selection response of quantitative traits inpeach: II. An analysis of several fruit traits. J Am Soc Hort Sci 1998,123:604-611.
37. Hendry AP, Kinnison MT, Heino M, Day T, Smith TB, Fitt G, Bergstrom CT,Oakeshott J, Jørgensen PS, Zalucki MP, et al: Evolutionary principles andtheir practical application. Evol Appl 2011, 4:159-183.
38. Nitsch JP: Growth responses of woody plants to photoperiodic stimuli. PAm Soc Hortic Sci 1957, 70:512-525.
39. Mølmann JA, Asante DKA, Jensen JB, Krane MN, Ernstsen A, Junttila O,Olsen JE: Low night temperature and inhibition of gibberellinbiosynthesis override phytochrome action and induce bud set and coldacclimation, but not dormancy in PHYA overexpressors and wild-type ofhybrid aspen. Plant Cell Environ 2005, 28:1579-1588.
40. Ophir R, Pang X, Halaly T, Venkateswari J, Lavee S, Galbraith D, Or E: Gene-expression profiling of grape bud response to two alternativedormancy-release stimuli expose possible links between impairedmitochondrial activity, hypoxia, ethylene-ABA interplay and cellenlargement. Plant Mol Biol 2009, 71:403-423.
41. Kayal WE, Allen CCG, Ju CJT, Adams E, King-Jones S, Zaharia LI, Abrams SR,Cooke JEK: Molecular events of apical bud formation in white spruce,Picea glauca. Plant Cell Environ 2011, 34:480-500.
42. Jermstad KD, Bassoni DL, Jech KS, Wheeler NC, Neale DB: Mapping ofquantitative trait loci controlling adaptive traits in coastal Douglas-fir. I.Timing of vegetative bud flush. Theor Appl Genet 2001, 102:1142-1151.
43. Hausmann NJ, Juenger TE, Sen S, Stowe KA, Dawson TE, Simms EL:Quantitative trait loci affecting δ13C and response to differential wateravailability in Arabidopsis thaliana. Evolution 2005, 59:81-96.
44. Ingvarsson PK, Garcia MV, Luquez V, Hall D, Jansson S: Nucleotidepolymorphism and phenotypic associations within and around thephytochrome B2 locus in European aspen (Populus tremula, Salicaceae).Genetics 2008, 178:2217-2226.
45. Ma XF, Hall D, St.Onge KR, Jansson S, Ingvarsson PK: Geneticdifferentiation, clinal variation and phenotypic associations with growthcessation across the Populus tremula photoperiodic pathway. Genetics2010, 186:1033-1044.
46. Holefors A, Opseth L, Ree Rosnes AK, Ripel L, Snipen L, Fossdal CG,Olsen JE: Identification of PaCOL1 and PaCOL2, two CONSTANS-like genesshowing decreased transcript levels preceding short day inducedgrowth cessation in Norway spruce. Plant Physiol Bioch 2009, 47:105-115.
47. Yuceer C, Harkess RL, Land SB, Luthe DS: Structure and developmentalregulation of CONSTANS-LIKE genes isolated from Populus deltoides. PlantSci 2002, 163:615-625.
48. Böhlenius H, Huang T, Charbonnel-Campaa L, Brunner AM, Jansson S,Strauss SH, Nilsson O: CO/FT regulatory module controls timing offlowering and seasonal growth cessation in trees. Science 2006,312:1040-1043.
49. Torres-Galea P, Huang LF, Chua NH, Bolle C: The GRAS protein SCL13 is apositive regulator of phytochrome-dependent red light signaling, butcan also modulate phytochrome A responses. Mol Genet Genomics 2006,276:13-30.
50. Marrocco K, Zhou Y, Bury E, Dieterle M, Funk M, Genschik P, Krenz M,Stolpe T, Kretsch T: Functional analysis of EID1, an F-box protein involvedin phytochrome A-dependent light signal transduction. Plant J 2006,45:423-438.
51. Yang SW, Jang IC, Henriques R, Chua NH: FAR-RED ELONGATEDHYPOCOTYL1 and FHY1-LIKE associate with the Arabidopsis transcription
factors LAF1 and HFR1 to transmit phytochrome a signals for inhibitionof hypocotyl elongation CW. Plant Cell 2009, 21:1341-1359.
52. Olsen JE: Light and temperature sensing and signaling in induction ofbud dormancy in woody plants. Plant Mol Biol 2010, 73:37-47.
53. Hase Y, Trung KH, Matsunaga T, Tanaka A: A mutation in the uvi4 genepromotes progression of endo-reduplication and confers increasedtolerance towards ultraviolet B light. Plant J 2006, 46:317-326.
54. Regier N, Streb S, Cocozza C, Schaub M, Cherubini P, Zeeman SC, Frey B:Drought tolerance of two black poplar (Populus nigra L.) clones:contribution of carbohydrates and oxidative stress defence. Plant CellEnviron 2009, 32:1724-1736.
55. Cleveland WS, Grosse E, Shyu WM: Local regression models. In Statisticalmodels in S. Edited by: Chambers JM, Hastie TJ. New York: Chapman andHall; 1992:309-376.
56. Dillen SY, Storme V, Marron N, Bastien C, Neyrinck S, Steenackers M,Ceulemans R, Boerjan W: Genomic regions involved in productivity oftwo interspecific poplar families in Europe. 1. Stem height,circumference and volume. Tree Genet Genomes 2009, 5:147-164.
57. Burdon RD: Genetic correlation as a concept for studying genotype-environment interaction in forest tree breeding. Silvae Genet 1977,26:168-175.
58. Visscher PM: On the sampling variance of intraclass correlations andgenetic correlations. Genetics 1998, 149:1605-1614.
59. Wricke G: Über eine Methode zur Erfassung der ökologischen Streubreitein Feldversuchen. Z Pflanzenzüchtg 1962, 47:92-96.
60. Rae AM, Pinel MPC, Bastien C, Sabatti M, Street NR, Tucker J, Dixon C,Marron N, Dillen SY, Taylor G: QTL for yield in bioenergy Populus:identifying G × E interactions from growth at three contrasting sites.Tree Genet Genomes 2008, 4:97-112.
61. Ranjan P, Yin T, Zhang X, Kalluri UC, Yang X, Jawdy S, Tuskan GA:Bioinformatics-based identification of candidate genes from QTLsassociated with cell wall traits in Populus. Bioenerg Res 2010, 3:172-182.
62. Simpson GG, Dean C: Arabidopsis, the Rosetta stone of flowering time?Science 2002, 296:285-289.
63. Sterky F, Bhalerao RR, Unneberg P, Segerman B, Nilsson P, Brunner AM,Charbonnel-Campaa L, Lindvall JJ, Tandre K, Strauss SH, et al: A Populus ESTresource for plant functional genomics. P Natl Acad Sci USA 2004,101:13951-13956.
doi:10.1186/1471-2229-12-47Cite this article as: Fabbrini et al.: Phenotypic plasticity, QTL mappingand genomic characterization of bud set in black poplar. BMC PlantBiology 2012 12:47.
Submit your next manuscript to BioMed Centraland take full advantage of:
• Convenient online submission
• Thorough peer review
• No space constraints or color figure charges
• Immediate publication on acceptance
• Inclusion in PubMed, CAS, Scopus and Google Scholar
• Research which is freely available for redistribution
Submit your manuscript at www.biomedcentral.com/submit
Fabbrini et al. BMC Plant Biology 2012, 12:47http://www.biomedcentral.com/1471-2229/12/47
Page 16 of 16