
Australian plantation inventory: ownership changes, availability and policy.
Upload
independentCategory
view
2download
0
©
New Phytologist
(2001)
150
: 465–476
www.newphytologist.com
465
Research
Blackwell Science Ltd
Free-air CO
2
enrichment (FACE) of a poplar plantation:
the POPFACE fumigation system
Franco
Miglietta
1
, Alessandro Peressotti
2
, Francesco Primo Vaccari
1
, Alessandro Zaldei
1
, Paolo deAngelis
3
and Giuseppe Scarascia-Mugnozza
3
1
IATA-CNR, P.le delle Cascine, 18 50145 Firenze, Italy;
2
DPVTA, Università di Udine, Via delle Scienze 208, 33100 Udine, Italy;
3
DISAFRI, Università della
Tuscia, Via S. Camillo de Lellis, 01100 Viterbo, Italy
Summary
• A new design of free-air CO
2
enrichment (FACE) is presented that has been usedto expose a poplar plantation to elevated atmospheric CO
2
concentrations in other-wise unaltered conditions, in the open.• This system releases pure CO
2
at high velocity, through a large number of smallgas jets, causing rapid mixing between CO
2
and air. The theoretical and practicalaspects of this design are described, with emphasis on the fluid mechanics of air–CO
2
mixing in sonic jets. Field performance data, including spectral analysis of short-term fluctuations in CO
2
concentrations as well as temporal and spatial CO
2
control,are reported for the European project POPFACE facility.• Temporal and spatial performances of the operational POPFACE systems wereadequate with average long-term CO
2
mole fractions on target. Averages over1 min measured in the centre of the rings were within
±
20% and
±
10% of the targetconcentration for > 91% and > 75% of the time, respectively.• The data presented provide convincing evidence that a pure-CO
2
FACE systemcan achieve reliable control, in terms of the quality of the CO
2
control, with signific
-
ant simplification of construction and reduced capital cost.
Key words
:
CO
2
-air mixing,
elevated CO
2
,
EU-project,
free-air CO
2
enrichment(FACE),
Poplar
.
©
New Phytologist
(2001)
150
: 465–476
Author for correspondence:
Franco Miglietta Tel: +39055301422 Fax: +39055308910 Email: [email protected]
Received:
28 August 2000
Accepted:
1 February 2001
Introduction
The POPFACE project was recently funded by the Commissionof the European Union (Directorate General Research) in theframe of Terrestrial Ecosystem Research Initiative (Scarascia-Mugnozza
et al.
, 2000). The main objective of this collaborativeproject is to investigate the response of a poplar plantation anda number of poplar species to the expected increase in atmo-spheric CO
2
concentrations. For this purpose, the POPFACEproject implemented a large-scale Free Air CO
2
Enrichment(FACE) facility in Tuscania (Viterbo), in Central Italy.
FACE is a technique for exposing crops, forest plantationsand natural vegetation to elevated atmospheric CO
2
concen-trations without an enclosing structure. FACE technology hasdeveloped considerably since the first experiences made byHarper and coworkers in the 1970s (Harper
et al.
, 1973) andby van Mooi and coworkers in the 1980s (Mooi, 1985). At
present more than 20 FACE sites are operational around theworld in Northern and Central America, in Europe, Asia andOceania. The size of the FACE plots varies from one meterdiameter of the MiniFACE (Miglietta
et al.
, 1996; Miglietta
et al.
, 2001) to the 30 m of the larger FACE systems that havebeen used to fumigate with CO
2
patches of forest plantations(Hendrey, 1999).
FACE experiments are almost unanimously considered toprovide the best opportunity to expose patches of managed orunmanaged vegetation to conditions of elevated atmosphericconcentrations with minimal alteration of the natural environ-ment where plants are growing. Nevertheless, FACE systemsalso suffer from some experimental limitations such as thepresence of substantial infrastructure, the unavoidable presenceof CO
2
concentration gradients along the wind direction andshort-term fluctuations in CO
2
concentration. The use ofblowers requires large pipes to allow the circulation of large
NPH115.fm Page 465 Thursday, March 29, 2001 5:49 PM
www.newphytologist.com
©
New Phytologist
(2001)
150
: 465–476
Research466
volumes of air, higher power requirement and significantinfrastructure. Moreover, the use of the blowers implies theconstruction of control rings where everything is operated inthe same way as in the FACE, with the only exception of theinjection of carbon dioxide.
Recently different groups in the USA (S. Roberts, pers.comm.), and Japan (Okada
et al.
, 2001) have attempted tomodify the design of their FACE systems to introduce therelease of pure carbon dioxide instead of an air-CO
2
mixture.Such ‘pure-CO
2
’ FACE was thought to be a possible altern-ative solution to the more conventional systems, providingsome potential advantages. This is also the idea that inspiredthe design of the FACE facility that was used for the Europeanproject POPFACE and that will be discussed in this paper.
In the POPFACE system, pure carbon dioxide is released tothe atmosphere through a very large number of small gas jets,at high velocity. Such innovation was introduced because thetheory of fluid mechanics says that when a gas jet reachessonic velocity, a shock-wave is created at the jet outlet and theair-CO
2
mixing is greatly enhanced (Munson
et al.
, 1990).This paper describes both the theory and the practicalaspects of this type of FACE design with emphasis on thefluid mechanics of air-CO
2
mixing in sonic jets. But it alsoreports the data of the field performance of a replicatedPOPFACE system over the first experimental season. Perform-ance data include the spectral analysis of short-term fluctuationsin CO
2
concentrations in the FACE plot as well as temporaland spatial CO
2
control.
Materials and Methods
The relationship between pressure and CO
2
flow rate from gas jets
The first question to be answered while designing a pure-CO
2
FACE system was the number, size and spatial arrangement ofthe CO
2
-venting jets. The basic idea was to utilize a horizontalpipe holding a given number of tiny holes and change thepressure inside the pipe to regulate the CO
2
flow rate. Duringthe initial phase of prototype development changes in CO
2
flowrate from a number of jets of different diameter were investigatedby measuring the relation between mass flow (
g
CO
2
min
–1
)and the absolute pressure inside the pipe (MPa). During themeasurements, the pressure was changed in 8 steps from0.15 MPa to 0.45 MPa and the flow rate was calculated gravi-metrically by monitoring weight changes of a CO
2
cylinder.
Measurements of air-CO
2
mixing
Air-CO
2
mixing in the vicinity of gas jets at sonic velocity wasthen investigated by means of both direct measurements andmodelling. The measurements were made in the laboratoryusing a polyethylene pipe of 20 mm internal diameter and1 mm wall thickness, an Infra-red Gas Analyser with a 0–
100% CO
2
concentration range ( IRGA 1: ADC 0–100%,UK), a second IRGA with 0–2000
µ
mol mol
−
1
range (IRGA2: Li-Cor, Mod. 6252, Lincoln, Nebraska, USA) an air pistonpump with a flow rate of 19 l min
−
1
(Mefar, mod. 8523, I ) andan axial blower with a capacity of 10 m
3
min
−
1
. A hole of0.3 mm diameter was drilled onto the pipe and this was arrangedhorizontally at 100 cm above ground. The CO
2
was releasedthrough the hole by increasing the pressure in the pipe by meansof a manually controlled pressure regulator. The blower wasused to create a constant turbulent flow of air perpendicularto the pipe with air movement at about 1ms
−
1
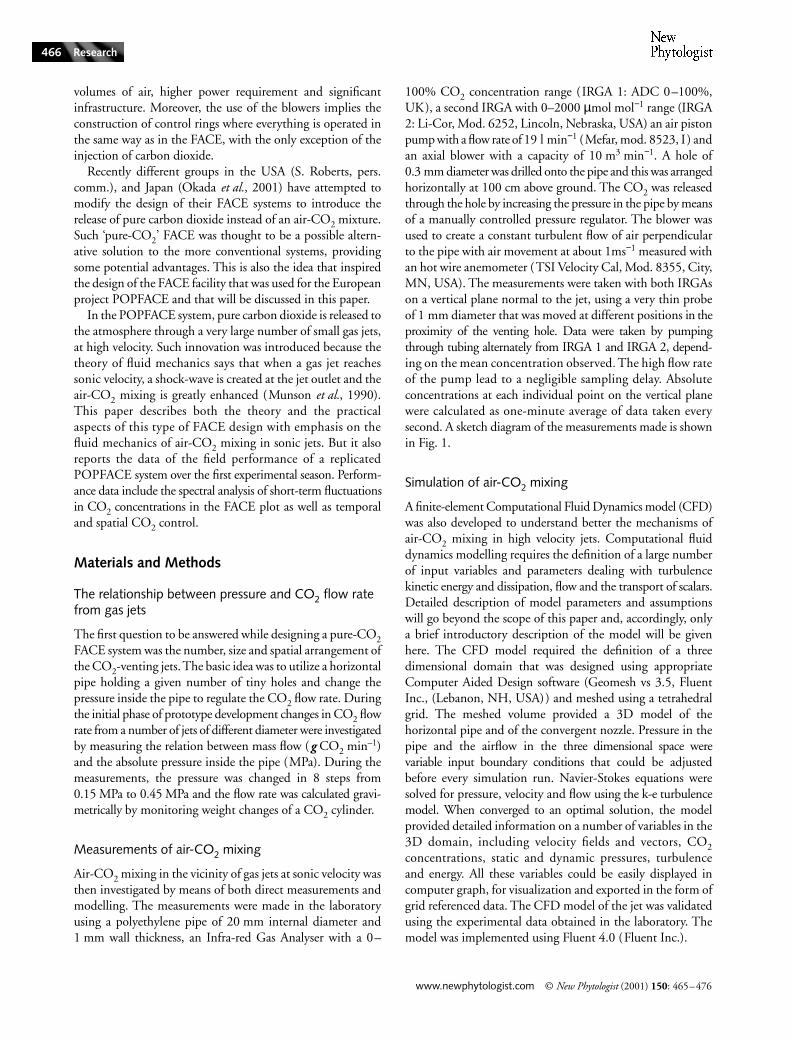
measured withan hot wire anemometer (TSI Velocity Cal, Mod. 8355, City,MN, USA). The measurements were taken with both IRGAson a vertical plane normal to the jet, using a very thin probeof 1 mm diameter that was moved at different positions in theproximity of the venting hole. Data were taken by pumpingthrough tubing alternately from IRGA 1 and IRGA 2, depend-ing on the mean concentration observed
.
The high flow rateof the pump lead to a negligible sampling delay. Absoluteconcentrations at each individual point on the vertical planewere calculated as one-minute average of data taken everysecond. A sketch diagram of the measurements made is shownin Fig. 1.
Simulation of air-CO
2
mixing
A finite-element Computational Fluid Dynamics model (CFD)was also developed to understand better the mechanisms ofair-CO
2
mixing in high velocity jets. Computational fluiddynamics modelling requires the definition of a large numberof input variables and parameters dealing with turbulencekinetic energy and dissipation, flow and the transport of scalars.Detailed description of model parameters and assumptionswill go beyond the scope of this paper and, accordingly, onlya brief introductory description of the model will be givenhere. The CFD model required the definition of a threedimensional domain that was designed using appropriateComputer Aided Design software (Geomesh vs 3.5, FluentInc., (Lebanon, NH, USA)) and meshed using a tetrahedralgrid. The meshed volume provided a 3D model of thehorizontal pipe and of the convergent nozzle. Pressure in thepipe and the airflow in the three dimensional space werevariable input boundary conditions that could be adjustedbefore every simulation run. Navier-Stokes equations weresolved for pressure, velocity and flow using the k-e turbulencemodel. When converged to an optimal solution, the modelprovided detailed information on a number of variables in the3D domain, including velocity fields and vectors, CO
2
concentrations, static and dynamic pressures, turbulenceand energy. All these variables could be easily displayed incomputer graph, for visualization and exported in the form ofgrid referenced data. The CFD model of the jet was validatedusing the experimental data obtained in the laboratory. Themodel was implemented using Fluent 4.0 (Fluent Inc.).
NPH115.fm Page 466 Thursday, March 29, 2001 5:49 PM
©
New Phytologist
(2001)
150
: 465–476
www.newphytologist.com
Research 467
Construction details of the POPFACE installation
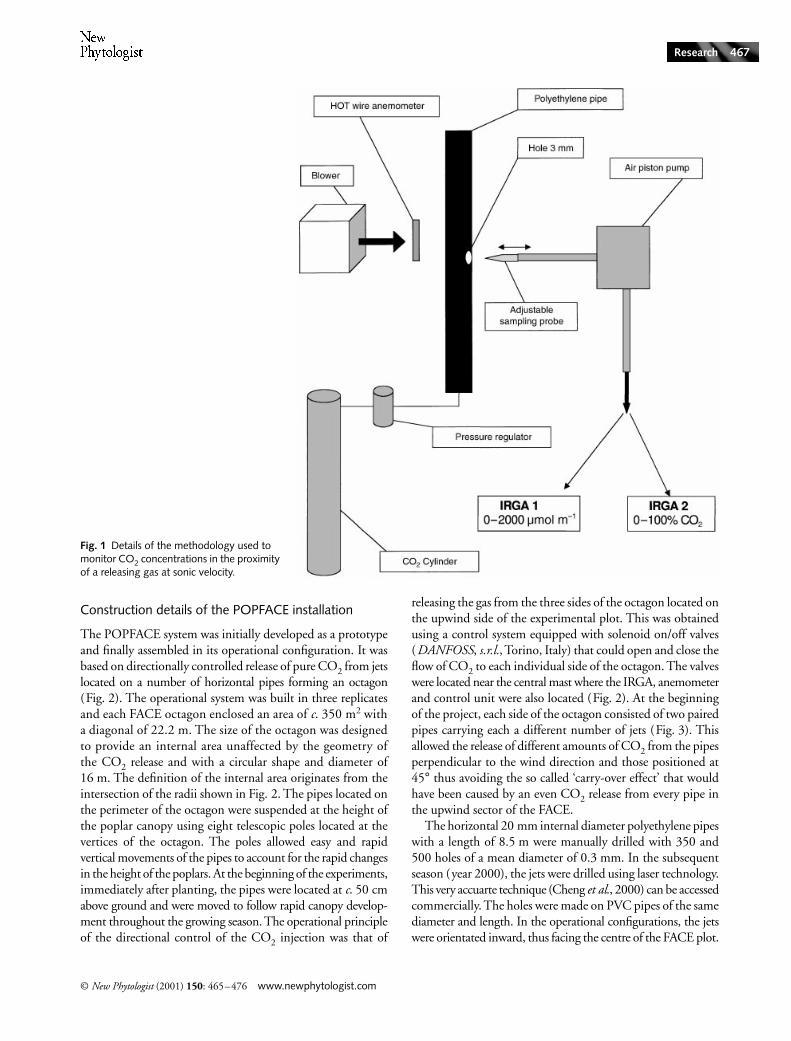
The POPFACE system was initially developed as a prototypeand finally assembled in its operational configuration. It wasbased on directionally controlled release of pure CO
2
from jetslocated on a number of horizontal pipes forming an octagon(Fig. 2). The operational system was built in three replicatesand each FACE octagon enclosed an area of
c
. 350 m
2
witha diagonal of 22.2 m. The size of the octagon was designedto provide an internal area unaffected by the geometry ofthe CO
2
release and with a circular shape and diameter of16 m. The definition of the internal area originates from theintersection of the radii shown in Fig. 2. The pipes located onthe perimeter of the octagon were suspended at the height ofthe poplar canopy using eight telescopic poles located at thevertices of the octagon. The poles allowed easy and rapidvertical movements of the pipes to account for the rapid changesin the height of the poplars. At the beginning of the experiments,immediately after planting, the pipes were located at
c
. 50 cmabove ground and were moved to follow rapid canopy develop-ment throughout the growing season. The operational principleof the directional control of the CO
2
injection was that of
releasing the gas from the three sides of the octagon located onthe upwind side of the experimental plot. This was obtainedusing a control system equipped with solenoid on/off valves(
DANFOSS
,
s.r.l.
, Torino, Italy) that could open and close theflow of CO
2
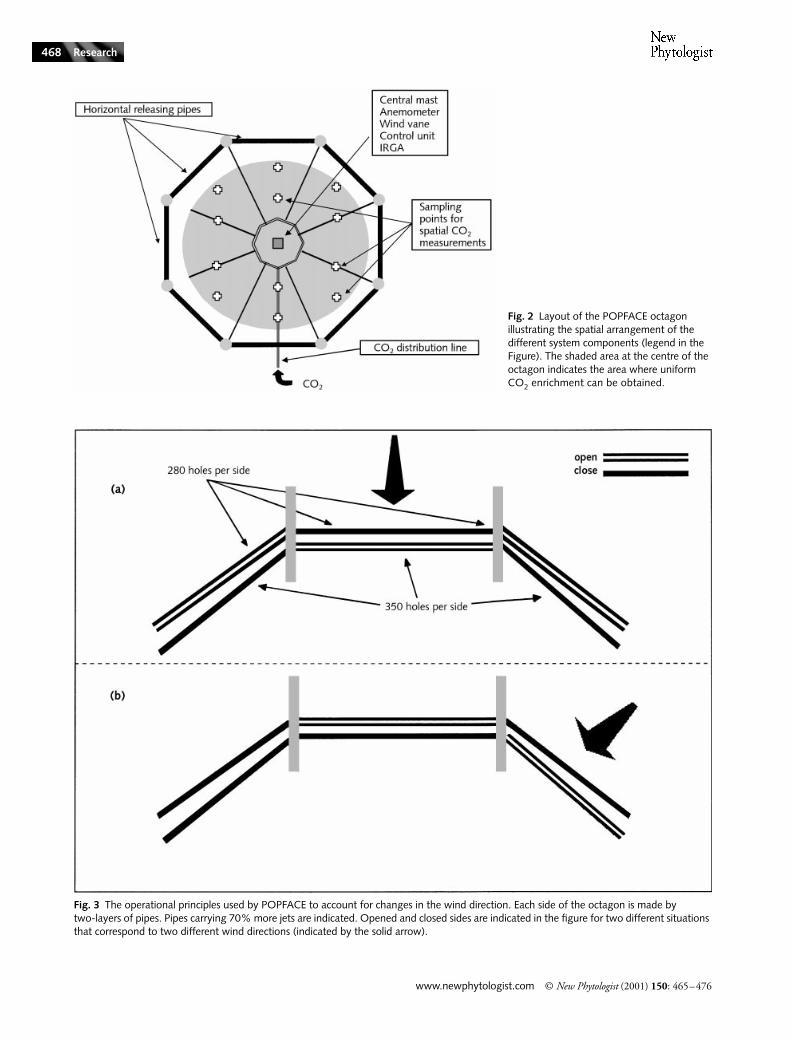
to each individual side of the octagon. The valveswere located near the central mast where the IRGA, anemometerand control unit were also located (Fig. 2). At the beginningof the project, each side of the octagon consisted of two pairedpipes carrying each a different number of jets (Fig. 3). Thisallowed the release of different amounts of CO
2
from the pipesperpendicular to the wind direction and those positioned at45
°
thus avoiding the so called ‘carry-over effect’ that wouldhave been caused by an even CO
2
release from every pipe inthe upwind sector of the FACE.
The horizontal 20 mm internal diameter polyethylene pipeswith a length of 8.5 m were manually drilled with 350 and500 holes of a mean diameter of 0.3 mm. In the subsequentseason (year 2000), the jets were drilled using laser technology.This very accuarte technique (Cheng
et al
., 2000) can be accessedcommercially. The holes were made on PVC pipes of the samediameter and length. In the operational configurations, the jetswere orientated inward, thus facing the centre of the FACE plot.
Fig. 1 Details of the methodology used to monitor CO2 concentrations in the proximity of a releasing gas at sonic velocity.
NPH115.fm Page 467 Thursday, March 29, 2001 5:49 PM
www.newphytologist.com
©
New Phytologist
(2001)
150
: 465–476
Research468
Fig. 2 Layout of the POPFACE octagon illustrating the spatial arrangement of the different system components (legend in the Figure). The shaded area at the centre of the octagon indicates the area where uniform CO2 enrichment can be obtained.
Fig. 3 The operational principles used by POPFACE to account for changes in the wind direction. Each side of the octagon is made by two-layers of pipes. Pipes carrying 70% more jets are indicated. Opened and closed sides are indicated in the figure for two different situations that correspond to two different wind directions (indicated by the solid arrow).
NPH115.fm Page 468 Thursday, March 29, 2001 5:49 PM
©
New Phytologist
(2001)
150
: 465–476
www.newphytologist.com
Research 469
An automatic pressure regulator (SMC Corporation, Toyko,Japan, Mod. ITV3050, JPN) controlled the amount of CO
2
released in the FACE and was operated by supplying variablevoltage (0–10 VDC) that translated into a variable pressure inthe pipes. The control of both on/off valves, that were used toopen and close the different sectors of the octagon releasingCO
2
and of the pressure controller, was obtained by means ofa programmable microprocessor based control unit, specificallydeveloped for POPFACE. The unit used a Motorola HC11microprocessor (Nippon Motorola Ltd., Toyko, Japan) that wasintegrated in a modular system consisting of 8 analogue inputchannels, 8 analogue output channels, 8 digital I/O channelsand a serial RS232 port. The unit was programmed using thelanguage C and a routine library written in HC11 Assembler.
The POPFACE control program used the modified PID(Proportional Integral Differential) algorithm that was origin-ally described by Lewin
et al
. (1992). This algorithm uses windspeed and instantaneous CO
2
concentration measured everysecond by a cup anemometer (R.M. Young Company, TraverseCity, MI, USA, Mod. 12005) and an Infra-Red gas Analyser(IRGA, PPSystem, mod. SBA-1, Hitchin, UK). These arelocated at the centre of the FACE plot and thus to calculate thevoltage to be supplied to the pressure controller. In this way,the control program actually regulates the pressure inside thehorizontal releasing pipes and therefore the amount of carbondioxide required to obtain the set level of CO
2
enrichment. Thesame algorithm also actuates the on/off valves to open the threesides located upwind of the FACE plot as a function of the mostfrequent wind direction calculated every 30 s from data sampledevery second by a wind vane located at the centre of the plot.
Field performance of the POPFACE: high frequency CO
2
concentration data and spectral analysis
The advection of a passive substance by a turbulent flow is avery complex and poorly understood phenomenon (Shraiman& Siggia, 2000). The basic understanding of turbulent mixingand transport is already established (Kolmogorov, 1941) butwhile these dimensional arguments are successful in explainingthe average rate of spreading or mixing in the so called inertialsubrange, understanding the large fluctuations is more a difficultproblem. The nontrivial statistical aspects of the scalar turnout to originate in the mixing process itself. A well-establishedphenomenological parallel exists between the statistical descrip-tion of mixing and fluid turbulence itself.
Spectral analysis of rapid fluctuations in CO
2
concentra-tion provides information on the time and length scales of thefluctuations, thus providing the opportunity to analyse thequality of the air-CO
2
mixing. This type of information wasconsidered critical for characterizing the CO
2
environmentexperienced by the plants.
To perform this type of analyses, wind and CO
2
data wereacquired at 10 Hz using a 3D sonic anemometer (Metek GmbH,Elmshor, Germany, Mod. USA-1) connected to a fast response
CO
2
gas analyser (Li-Cor, Mod. 6252) with a typical samplingfrequency of
c
. 5 Hz (Aubinet
et al.
, 2000). The measurementswere repeated, during a number of field campaigns, in thecentre of the FACE plot just above the canopy height andwere made both in the prototype and in the operational system.Spectra were calculated using EdiRe software (University ofEdinburgh, Vs 1.1.8.23, Edinburgh, UK) from measurementperiods of 30 min by calculating the Fast Fourier Transform(FFT) of de-trended fluctuations around the 30 min average.
Field performance of the POPFACE: temporal and spatial control of CO
2
concentrations and CO
2
use
The performance of the FACE system was evaluated by record-ing, throughout the experimental season, the 1-min averageCO
2
concentration measured by the IRGA located at thecentre of the FACE plot. Such mean was calculated as averageof IRGA readings made every second.
The spatial distribution of CO
2
concentrations was monitoredduring some days throughout the experimental season usinga multiport scanner that was specifically developed for thePOPFACE project. The same type of microprocessor-basedunit described above was programmed to operate the multiportscanner. This was equipped with 12 on/off solenoid valves andtwo IRGAs (PPSystem, mod. SBA-1, Hitchin, UK). The twoIRGA were cross calibrated using a reference gas mixture at thebeginning of each spatial concentration monitoring campaign.The samples were taken along four main octagon cords at 4and 8 m distance from the ring centre. The actual location of thesampling points is shown in Fig. 2. The use of two instead oneIRGA reduced the time period elapsing between two consecutivereadings at each location. The overall CO
2
use of the replicatedPOPFACE system was monitored by recording at 1 min intervalthe voltage supplied to the pressure regulator, as well as the exactamount of liquid CO
2
that was used to refill the main bulk con-tainer at almost weekly intervals. Actual data were finally com-pared with the calculated optimal CO
2
use to derive a CO
2
fumigation efficiency parameter. The calculation of the optimalCO
2
use was made assuming that the amount of carbon dioxidethat is necessary to add 200
µ
mol mol
−
1
of CO
2
to a given volumeof air is a function of the air volume to be enriched and the meanair flow through such a volume. The actual amount of CO
2
thatwas lost by vertical and lateral transport out of the enrichedvolume gives an estimate of the efficiency of the FACE system.
Results and Discussion
The relationship between pressure and CO
2
flow rate from gas jets
The velocity of a gas jet out of a venting hole is a function ofthe difference between the static pressure inside the pipe (Pr) andambient pressure (Pb). Assuming that the CO
2
flow througha nozzle is isoentropic (there is no major heat exchange), the
NPH115.fm Page 469 Thursday, March 29, 2001 5:49 PM
www.newphytologist.com
© New Phytologist (2001) 150: 465–476
Research470
theory says that such velocity cannot be accelerated to avelocity greater than the speed of sound ( John, 1984). Furtherincrease in Pr therefore drives changes in density and massflow out of the jet, but not in velocity. When this situation isreached, the gas jet is defined as choked. Sonic velocity dependson temperature and on the gas properties and an estimate ofthe Pr/Pb ratio that just chokes the nozzle can be obtained bymeans of the following equation:
Pr/Pb = (1 + (γ – 1)/2 × Ma2)γ/(γ –1) Eqn 1
(Ma, Mach number; γ, specific heat ratio (the ratiobetween specific heat at constant pressure and specific heat atconstant volume).)
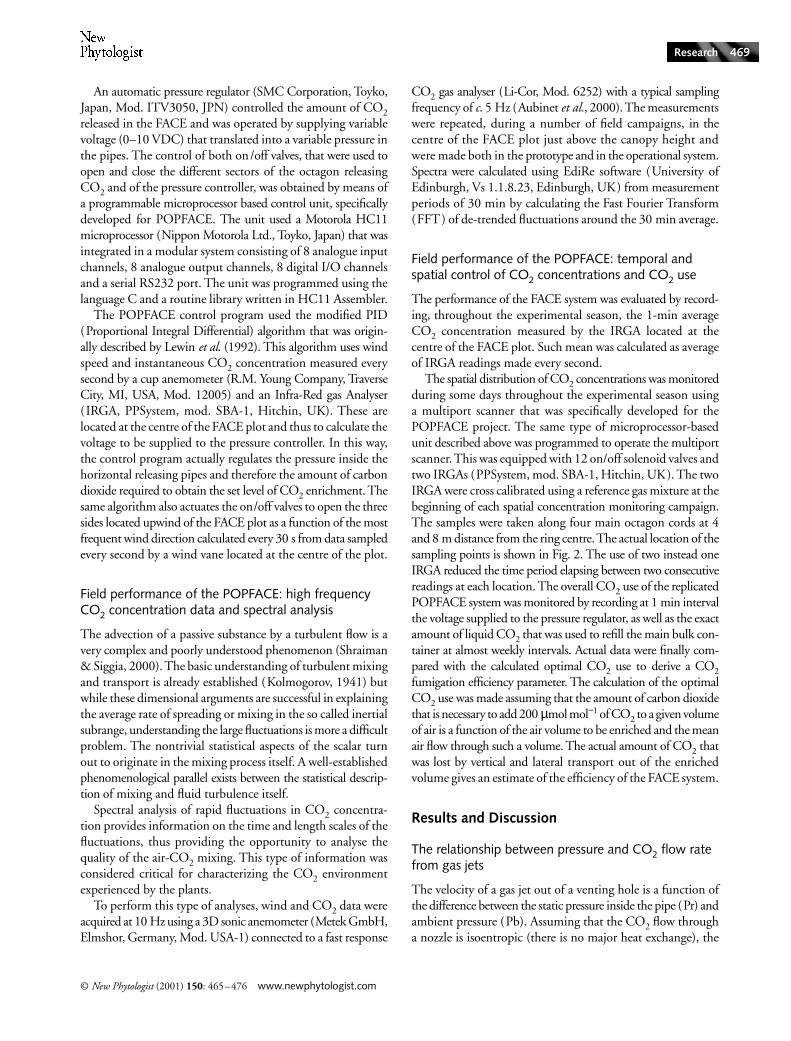
Assuming that for choked nozzles Ma is equal to 1, and thatγ of CO2 is equal to 1.3, the equation yields a value of Pr/Pbof 0.547. For a standard atmospheric pressure of 101.3 KPathis implies that nozzle choking is reached when the pressureinside the pipe is approximately 0.055 MPa. This calculatedvalue is very much in line with the experimental observationsmade in the laboratory, which showed that the relationshipbetween mass flow rate and pressure was not linear when pres-sure dropped below 0.05 MPa. This reflected the fact thatmass flow was driven, under those circumstances, by changesin both flow and velocity (Fig. 4) and not only the former.
These considerations were at the basis of the choice of the sizeof the pipes, the diameter of nozzles and the range of operat-ing pressures for the POPFACE system. Such choice ensuredthat a linear relationship between pressure and flow wouldhave been maintained for most of the time during FACEoperations and that the nozzles were choked.
Air-CO2 mixing in high velocity jets: simulation and observations
The use of choked jets at sonic velocity to release CO2 has acrucial importance for the initial CO2 and air mixing. The
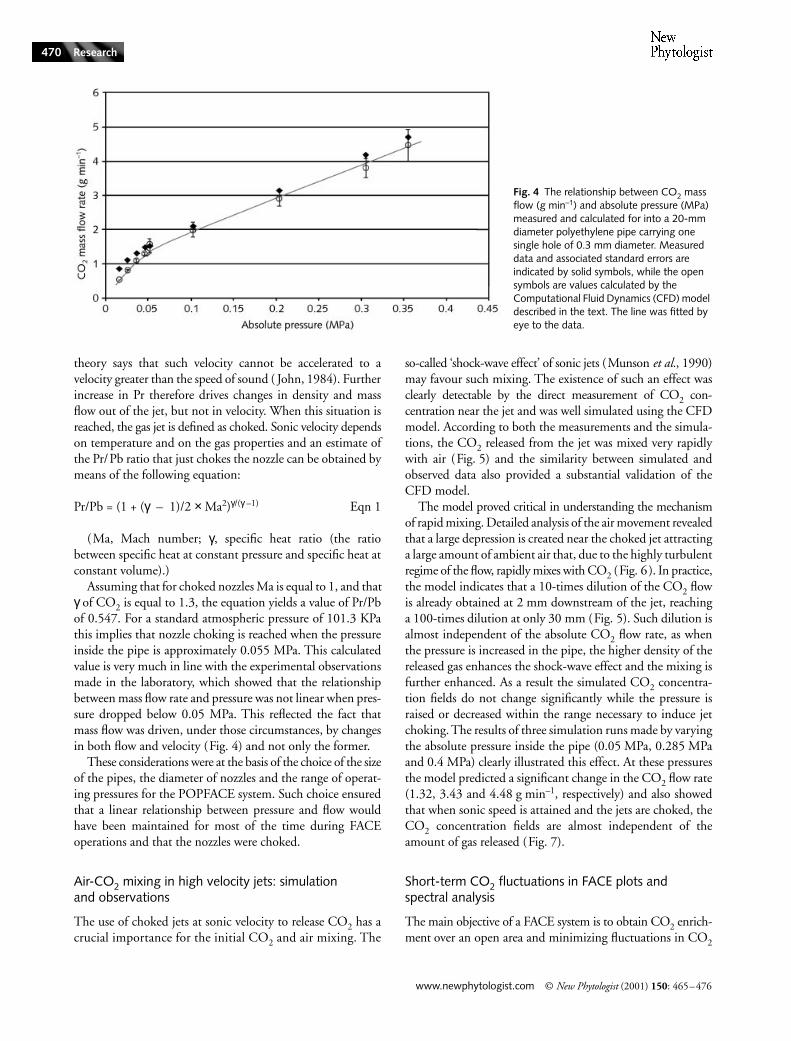
so-called ‘shock-wave effect’ of sonic jets (Munson et al., 1990)may favour such mixing. The existence of such an effect wasclearly detectable by the direct measurement of CO2 con-centration near the jet and was well simulated using the CFDmodel. According to both the measurements and the simula-tions, the CO2 released from the jet was mixed very rapidlywith air (Fig. 5) and the similarity between simulated andobserved data also provided a substantial validation of theCFD model.
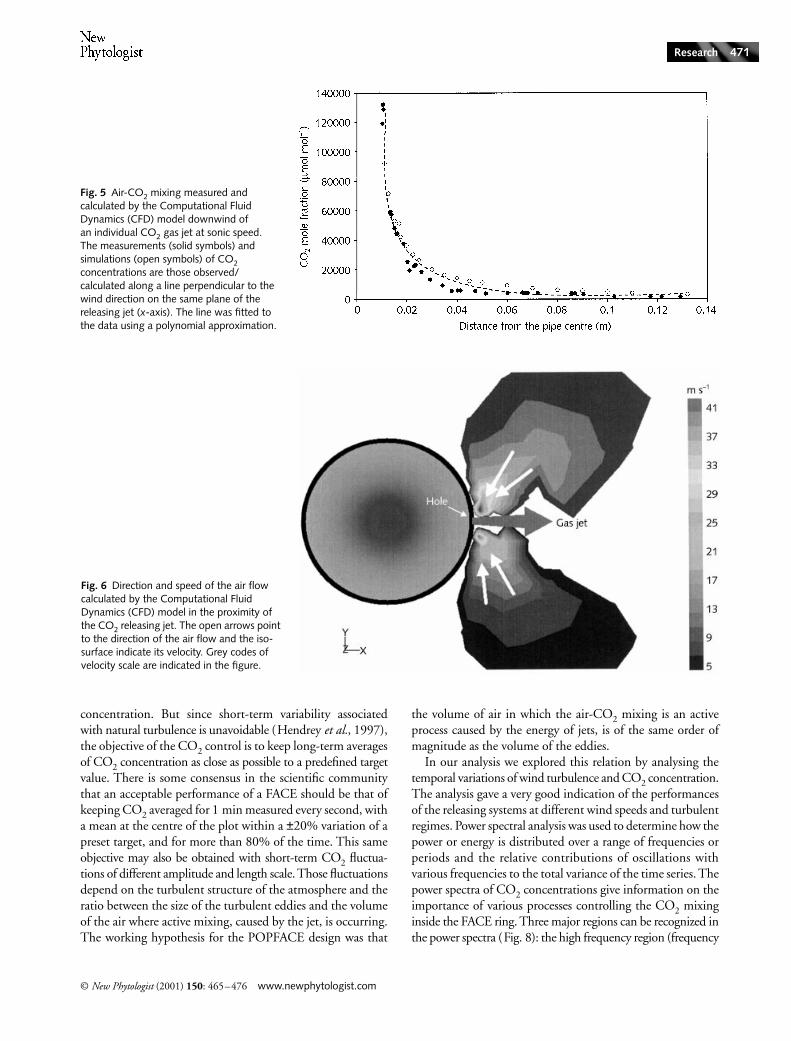
The model proved critical in understanding the mechanismof rapid mixing. Detailed analysis of the air movement revealedthat a large depression is created near the choked jet attractinga large amount of ambient air that, due to the highly turbulentregime of the flow, rapidly mixes with CO2 (Fig. 6). In practice,the model indicates that a 10-times dilution of the CO2 flowis already obtained at 2 mm downstream of the jet, reachinga 100-times dilution at only 30 mm (Fig. 5). Such dilution isalmost independent of the absolute CO2 flow rate, as whenthe pressure is increased in the pipe, the higher density of thereleased gas enhances the shock-wave effect and the mixing isfurther enhanced. As a result the simulated CO2 concentra-tion fields do not change significantly while the pressure israised or decreased within the range necessary to induce jetchoking. The results of three simulation runs made by varyingthe absolute pressure inside the pipe (0.05 MPa, 0.285 MPaand 0.4 MPa) clearly illustrated this effect. At these pressuresthe model predicted a significant change in the CO2 flow rate(1.32, 3.43 and 4.48 g min–1, respectively) and also showedthat when sonic speed is attained and the jets are choked, theCO2 concentration fields are almost independent of theamount of gas released (Fig. 7).
Short-term CO2 fluctuations in FACE plots and spectral analysis
The main objective of a FACE system is to obtain CO2 enrich-ment over an open area and minimizing fluctuations in CO2
Fig. 4 The relationship between CO2 mass flow (g min–1) and absolute pressure (MPa) measured and calculated for into a 20-mm diameter polyethylene pipe carrying one single hole of 0.3 mm diameter. Measured data and associated standard errors are indicated by solid symbols, while the open symbols are values calculated by the Computational Fluid Dynamics (CFD) model described in the text. The line was fitted by eye to the data.
NPH115.fm Page 470 Thursday, March 29, 2001 5:49 PM
© New Phytologist (2001) 150: 465–476 www.newphytologist.com
Research 471
concentration. But since short-term variability associatedwith natural turbulence is unavoidable (Hendrey et al., 1997),the objective of the CO2 control is to keep long-term averagesof CO2 concentration as close as possible to a predefined targetvalue. There is some consensus in the scientific communitythat an acceptable performance of a FACE should be that ofkeeping CO2 averaged for 1 min measured every second, witha mean at the centre of the plot within a ±20% variation of apreset target, and for more than 80% of the time. This sameobjective may also be obtained with short-term CO2 fluctua-tions of different amplitude and length scale. Those fluctuationsdepend on the turbulent structure of the atmosphere and theratio between the size of the turbulent eddies and the volumeof the air where active mixing, caused by the jet, is occurring.The working hypothesis for the POPFACE design was that
the volume of air in which the air-CO2 mixing is an activeprocess caused by the energy of jets, is of the same order ofmagnitude as the volume of the eddies.
In our analysis we explored this relation by analysing thetemporal variations of wind turbulence and CO2 concentration.The analysis gave a very good indication of the performancesof the releasing systems at different wind speeds and turbulentregimes. Power spectral analysis was used to determine how thepower or energy is distributed over a range of frequencies orperiods and the relative contributions of oscillations withvarious frequencies to the total variance of the time series. Thepower spectra of CO2 concentrations give information on theimportance of various processes controlling the CO2 mixinginside the FACE ring. Three major regions can be recognized inthe power spectra (Fig. 8): the high frequency region (frequency
Fig. 5 Air-CO2 mixing measured and calculated by the Computational Fluid Dynamics (CFD) model downwind of an individual CO2 gas jet at sonic speed. The measurements (solid symbols) and simulations (open symbols) of CO2 concentrations are those observed/calculated along a line perpendicular to the wind direction on the same plane of the releasing jet (x-axis). The line was fitted to the data using a polynomial approximation.
Fig. 6 Direction and speed of the air flow calculated by the Computational Fluid Dynamics (CFD) model in the proximity of the CO2 releasing jet. The open arrows point to the direction of the air flow and the iso-surface indicate its velocity. Grey codes of velocity scale are indicated in the figure.
NPH115.fm Page 471 Thursday, March 29, 2001 5:49 PM
www.newphytologist.com © New Phytologist (2001) 150: 465–476
Research472
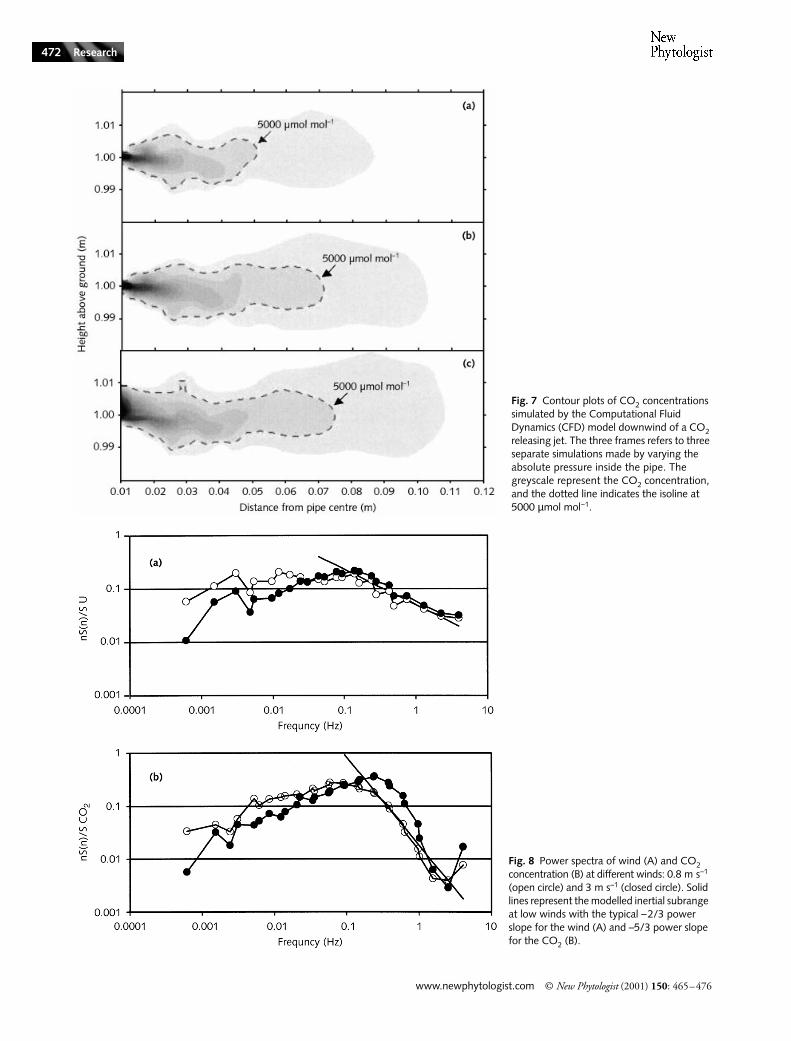
Fig. 7 Contour plots of CO2 concentrations simulated by the Computational Fluid Dynamics (CFD) model downwind of a CO2 releasing jet. The three frames refers to three separate simulations made by varying the absolute pressure inside the pipe. The greyscale represent the CO2 concentration, and the dotted line indicates the isoline at 5000 µmol mol−1.
Fig. 8 Power spectra of wind (A) and CO2 concentration (B) at different winds: 0.8 m s–1 (open circle) and 3 m s–1 (closed circle). Solid lines represent the modelled inertial subrange at low winds with the typical –2/3 power slope for the wind (A) and –5/3 power slope for the CO2 (B).
NPH115.fm Page 472 Thursday, March 29, 2001 5:49 PM
© New Phytologist (2001) 150: 465–476 www.newphytologist.com
Research 473
> 2 Hz) where spurious contributions to sensor output fromelectronic equipment and noise dominate; the inertial sub-range region (frequency range from 2 to 0.1 Hz) with the wellknown negative power slope of −5/3 (Kolmogorov, 1941);and longer fluctuating regions (frequencies < 0.1 Hz) with apositive slope. The relative importance of these regions changeswith wind turbulence, particularly the power in the inertialsub range increases as wind speed increases (Fig. 8) denotinga mixing driven by small scale eddies. At low wind speeds, alarge part of the variance is associated with the last regionwhere CO2 oscillations that are driven by the adjusted releaseof CO2 and by wind gusts. Conversely, at higher wind speedsfluctuations are dominated by Kolmogorov-scale eddies.
When the CO2 power spectra are compared with thecorresponding spectra of main wind components (Fig. 8) adifference becomes evident both at low and high wind speedsin the low frequency region. The positive slopes of the CO2spectra are generally steeper than the wind component spectra,denoting the action of the modified PID algorithm in smooth-ing the longer CO2 fluctuations. This difference gives an indica-tion of the quality of the controlling algorithm, the greater thedifference the better the system can adjust to the varying windconditions. With this kind of analysis, the POPFACE controlalgorithm generally performed slightly better at lower wind
speeds, than at higher wind speeds, when there seems to beless fluctuation in wind speed. However the greater turbu-lence at higher wind speeds masked this effect. This type ofanalysis is also of importance as the time scales of CO2 fluctu-ations may potentially affect the response of stomata and photo-synthesis to elevated CO2 (Cardon et al., 1994; Hendrey et al.,1997; Hendrey, 2000).
The POPFACE field performances
Long-term performances of the POPFACE system were overallsatisfactory. The system was operational from 29 June 1999 to5 December 1999 for the entire duration of the growingseason of the poplars. Over this period, the three replicatedsystems have been operational for more than 93% of the time,with major interruptions of fumigation due to maintenanceand CO2 refilling. Other minor interruptions, always in therange of hours, were due to the failure of sampling pumps forthe IRGAs.
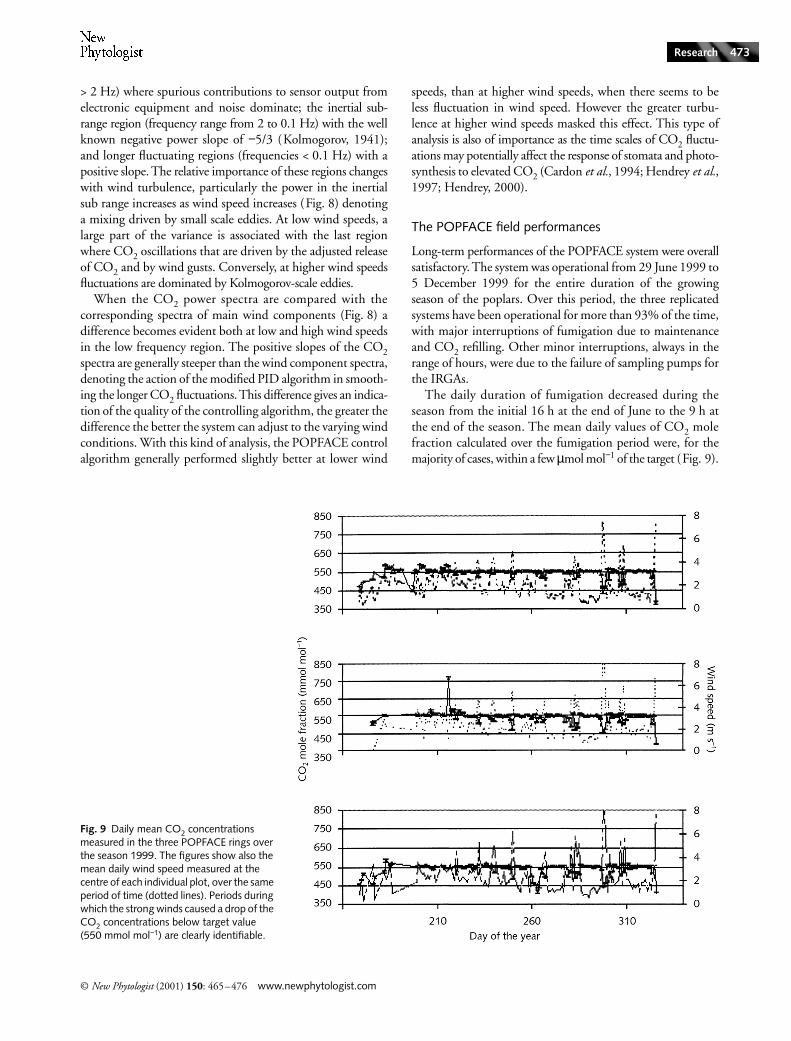
The daily duration of fumigation decreased during theseason from the initial 16 h at the end of June to the 9 h atthe end of the season. The mean daily values of CO2 molefraction calculated over the fumigation period were, for themajority of cases, within a few µmol mol−1 of the target (Fig. 9).
Fig. 9 Daily mean CO2 concentrations measured in the three POPFACE rings over the season 1999. The figures show also the mean daily wind speed measured at the centre of each individual plot, over the same period of time (dotted lines). Periods during which the strong winds caused a drop of the CO2 concentrations below target value (550 mmol mol−1) are clearly identifiable.
NPH115.fm Page 473 Thursday, March 29, 2001 5:49 PM
www.newphytologist.com © New Phytologist (2001) 150: 465–476
Research474
The major exceptions were apparent in days with very highwind conditions, during which the daily mean CO2 con-centrations dropped significantly (Fig. 9). This is explainedby the fact that a cut off was automatically introducedwhen the windspeed exceeded 10 m s−1, as the flow of CO2through the pressure regulator became insufficient. Themean overall long-term CO2 mole fractions in the centresof the three FACE plots were, respectively, 545, 544.8 and541.7 µmol mol−1.
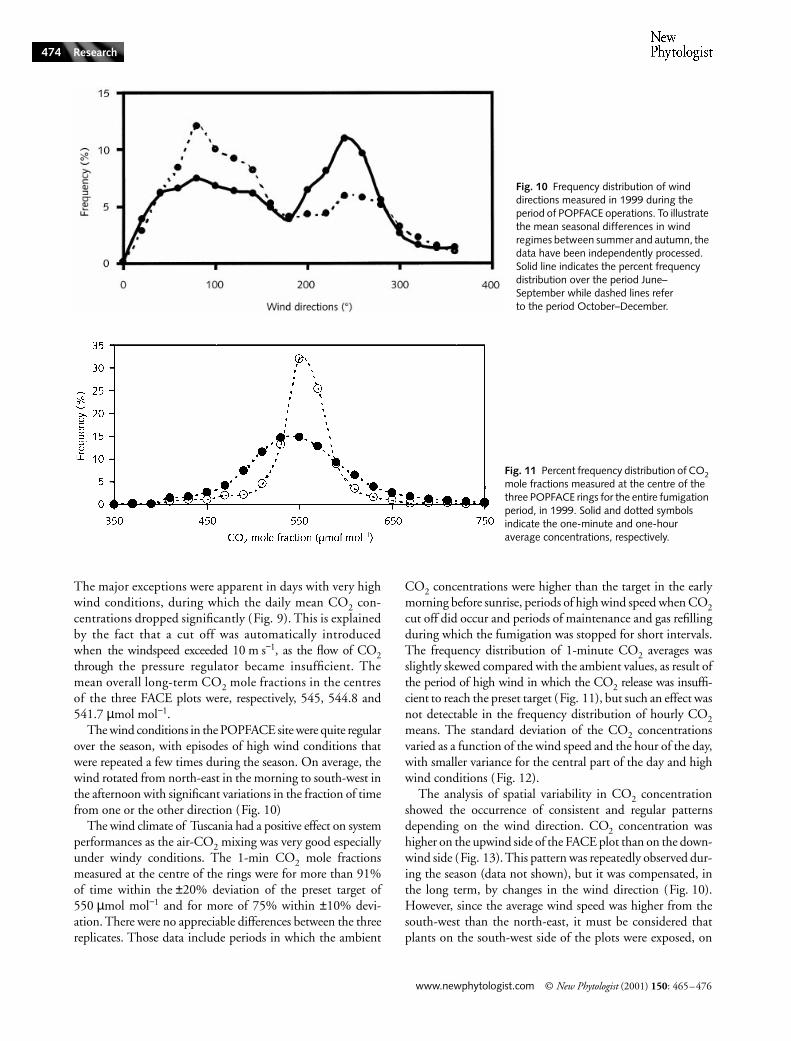
The wind conditions in the POPFACE site were quite regularover the season, with episodes of high wind conditions thatwere repeated a few times during the season. On average, thewind rotated from north-east in the morning to south-west inthe afternoon with significant variations in the fraction of timefrom one or the other direction (Fig. 10)
The wind climate of Tuscania had a positive effect on systemperformances as the air-CO2 mixing was very good especiallyunder windy conditions. The 1-min CO2 mole fractionsmeasured at the centre of the rings were for more than 91%of time within the ±20% deviation of the preset target of550 µmol mol−1 and for more of 75% within ±10% devi-ation. There were no appreciable differences between the threereplicates. Those data include periods in which the ambient
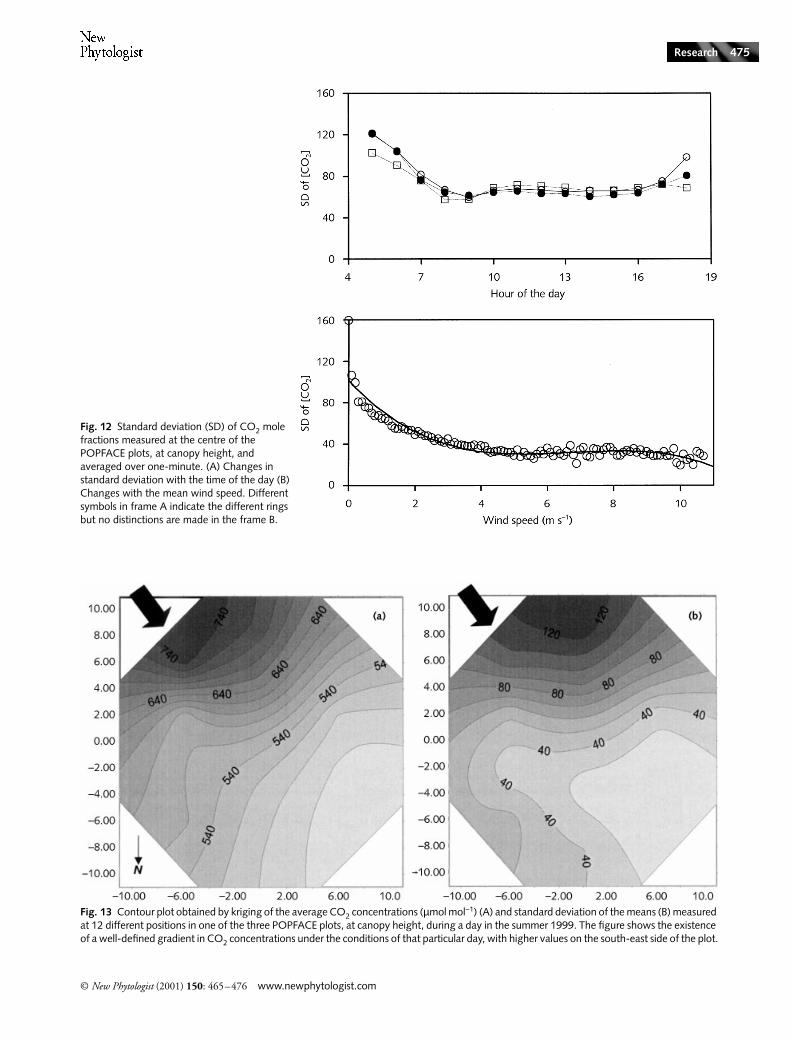
CO2 concentrations were higher than the target in the earlymorning before sunrise, periods of high wind speed when CO2cut off did occur and periods of maintenance and gas refillingduring which the fumigation was stopped for short intervals.The frequency distribution of 1-minute CO2 averages wasslightly skewed compared with the ambient values, as result ofthe period of high wind in which the CO2 release was insuffi-cient to reach the preset target (Fig. 11), but such an effect wasnot detectable in the frequency distribution of hourly CO2means. The standard deviation of the CO2 concentrationsvaried as a function of the wind speed and the hour of the day,with smaller variance for the central part of the day and highwind conditions (Fig. 12).
The analysis of spatial variability in CO2 concentrationshowed the occurrence of consistent and regular patternsdepending on the wind direction. CO2 concentration washigher on the upwind side of the FACE plot than on the down-wind side (Fig. 13). This pattern was repeatedly observed dur-ing the season (data not shown), but it was compensated, inthe long term, by changes in the wind direction (Fig. 10).However, since the average wind speed was higher from thesouth-west than the north-east, it must be considered thatplants on the south-west side of the plots were exposed, on
Fig. 10 Frequency distribution of wind directions measured in 1999 during the period of POPFACE operations. To illustrate the mean seasonal differences in wind regimes between summer and autumn, the data have been independently processed. Solid line indicates the percent frequency distribution over the period June–September while dashed lines refer to the period October–December.
Fig. 11 Percent frequency distribution of CO2 mole fractions measured at the centre of the three POPFACE rings for the entire fumigation period, in 1999. Solid and dotted symbols indicate the one-minute and one-hour average concentrations, respectively.
NPH115.fm Page 474 Thursday, March 29, 2001 5:49 PM
© New Phytologist (2001) 150: 465–476 www.newphytologist.com
Research 475
Fig. 12 Standard deviation (SD) of CO2 mole fractions measured at the centre of the POPFACE plots, at canopy height, and averaged over one-minute. (A) Changes in standard deviation with the time of the day (B) Changes with the mean wind speed. Different symbols in frame A indicate the different rings but no distinctions are made in the frame B.
Fig. 13 Contour plot obtained by kriging of the average CO2 concentrations (µmol mol−1) (A) and standard deviation of the means (B) measured at 12 different positions in one of the three POPFACE plots, at canopy height, during a day in the summer 1999. The figure shows the existence of a well-defined gradient in CO2 concentrations under the conditions of that particular day, with higher values on the south-east side of the plot.
NPH115.fm Page 475 Thursday, March 29, 2001 5:49 PM
www.newphytologist.com © New Phytologist (2001) 150: 465–476
Research476
average, to slightly higher concentrations than those on theopposite side.
Conclusion
Data that have been presented in this paper clearly indicatethat Free Air CO2 Enrichment can be satisfactorily obtainedby releasing pure CO2 instead of a prediluted air + CO2 mixture.The use of CO2 jets at sonic velocity greatly enhanced theair – CO2 mixing that occurred at the releasing points andthis translated into an adequate air-CO2 mixing within theFACE area under both low and high-wind conditions.
Power spectra analysis showed the relative merits of theprediluting effects of the sonic jets and plenums whencompared to subsonic CO2 release. As we hypothesized, theeffect of predilution was shown by the Kolmogorov scalefluctuation.
The advantages of this type of FACE design are clear.The so called ‘blower effect’ is completely removed, theinfrastructure is much lighter and less disturbing than inany other FACE system, the capital cost of the infrastructureis greatly reduced and the construction of the ‘control rings’ isno longer required.
More research is instead needed to evaluate the quality of thecontrol under atmospheric stability and in particular at night.This aspect was not specifically considered for the POPFACEsystem as the fumigation was stopped during night. In thisrespect, the direct comparison of fast-frequency CO2 spectrafor a pure-CO2 and a prediluted CO2 injection system, wouldbe of importance to understand if predilution operated by theblowers would improve the situation significantly under thoseconditions (He et al., 1996).
The possibility of continuing satisfactory CO2 fumigationin a rapidly-growing poplar plantation is a big challenge aheadof us. The POPFACE project will continue over the futureseasons thus providing an opportunity for further testing thequality of the CO2 control with the same free air CO2 enrich-ment system.
Acknowledgements
The authors wish to thank Pierpaolo Pinnacoli for continuedassistance with FACE operations during the first experimentalseason, Beniamino Gioli for substantial help during the installa-tion of the FACE operational set-up and Toufic El Asmar forhis collaboration during the period of prototype development.The POPFACE project is funded by the Commission of theEuropean Communities, Contract No ENV4-CT97-0657and contributes to the GCTE (Global Change and TerrestrialEcosystem) which is a Core Project of IGBP (InternationalGeosphere-Biosphere Programme).
References
Aubinet M, Grelle A, Ibrom A. 2000. Estimates of the annual net carbon and water exchange of forests: The EUROFLUX methodology. Advanced Ecological Research 30: 113–175.
Cardon ZG, Berry JA, Woodrow IE. 1994. Dependence of the extent and direction of average stomatal response in Zea mays L. and Phaseolus vulgaris L. on the frequency of fluctuations in environmental stimuli. Plant Physiology 105: 1007–1013.
Cheng J, Kahlen FJ, Kar A. 2000. Effects of intrapulse structure on hole geometry in laser drilling. Journal of Laseries Applications 12: 232–238.
Harper LA, Baker DN, Box Jejr Hesketh JD. 1973. Carbon dioxide and the photosynthesis of field crops: a metered carbon dioxide release in cotton under field conditions. Agronomy Journal of 65: 7–11.
He Y, Yang X, Miller DR, Hendrey GR, Lewin KF, Nagy J. 1996. Effects of FACE system operation on the micrometeorology of a loblolly pine stand. Transactions of the American Society of Agricultural Engineers 39: 1551–1556.
Hendrey G. 2000. A physiological basis for quality control issues in FACE experiments. New Phytologist. (In press.)
Hendrey GR. 1999. A free-air enrichment system for exposing tall forest vegetation to elevated atmospheric CO2. Global Change Biology 5: 293–309.
Hendrey GR, Long SP, McKee IF, Baker N. 1997. Can photosynthesis respond to short term fluctuations in atmospheric carbon dioxide? Photosynthesis Research 51: 179–184.
John JEA. 1984. Gas dynamics, 2nd edn. New York, USA: Prentice Hall, Inc., 49–53.
Kolmogorov AN. 1941. The local structure of turbulence in incompressible viscous fluid at very large Reynolds numbers. C R Academic of Sciences URSS 30: 301.
Lewin KF, Hendrey G, Kolber Z. 1992. Brookhaven National Laboratory Free-Air Carbon Dioxide Enrichment facility. Critical Reviews in Plant Sciences 11: 135–141.
Miglietta F, Giuntoli A, Bindi M. 1996. The effect of Free Air Carbon Dioxide Enrichment (FACE) and soil nitrogen availability on the photosynthetic capacity of wheat. Photosynthesis Research 47: 281–290.
Miglietta F, Hoosbeek MR, Foot J, Gigon F, Hassinen A, Heijmans M, Peressotti A, Saarinen T, van Breemen N, Wallén B. 2001. Spatial, temporal performance of the MiniFACE, (Free Air CO2 Enrichment) system on bog ecosystems in northern, central Europe. Environmental Monitoring and Assessment 66: 107–127.
Mooi IJ. 1985. Research on the effects of higher than ambient concentrations of SO2 and NO2 on vegetation under semi-natural conditions: the development and testing of a field fumigation system; process description. First Interim Report to the Commission of the European Communities, EEC Contract ENV-677-NL. January–December, 1983. Wageningen, The Netherlands: Research Institute for Plant Protection.
Munson BR, Young DF, Okishi TH. 1990. In: Munson BR, Young DF, Okishi TH, eds. Fundamentals of fluid mechanics, 2nd edn. NY, USA: John Wiley & Sons Inc., 697–781.
Okada M, Lieffering M, Nakamura M, Yoshimoto M, Kim M, Kobayashi K. 2001. Free-air CO2 enrichment (FACE) with pure CO2 injection: system description. New Phytologist 150: 000–000.
Scarascia-Mugnozza G, DeAngelis P, Sabatti M, Calfapietra C, Ceulemans R, Peressotti A, Miglietta F. 2000. A FACE experiment on short rotation, intensive poplar plantation: objective and experimental set up of POPFACE. In: Sutton MA, Moreno JM, van der Putten WH, Struwe S, eds. Terrestrial ecosystem research in europe: successes, challenges and policy. Bruxelles, Belgium: RTD Info European Commission, 136–140.
Shraiman BI, Siggia ED. 2000. Scalar turbulence. Nature 405: 639–646.
NPH115.fm Page 476 Thursday, March 29, 2001 5:49 PM
Copyright © 2022 FDOKUMEN