Free-air CO2 enrichment (FACE) enhances biomass production in a short-rotation poplar plantation
10
Summary This paper investigates the possible contribution of Short Rotation Cultures (SRC) to carbon sequestration in both current and elevated atmospheric CO 2 concentrations ([CO 2 ]). A dense poplar plantation (1 × 1 m) was exposed to a [CO 2 ] of 550 ppm in Central Italy using the free-air CO 2 en- richment (FACE) technique. Three species of Populus were ex- amined, namely P. alba L., P. nigra L. and P .× euramericana Dode (Guinier). Aboveground woody biomass of trees ex- posed to elevated [CO 2 ] for three growing seasons increased by 15 to 27%, depending on species. As a result, light-use effi- ciency increased. Aboveground biomass allocation was un- affected, and belowground biomass also increased under elevated [CO 2 ] conditions, by 22 to 38%. Populus nigra, with total biomass equal to 62.02 and 72.03 Mg ha –1 in ambient and elevated [CO 2 ], respectively, was the most productive species, although its productivity was stimulated least by atmospheric CO 2 enrichment. There was greater depletion of inorganic ni- trogen from the soil after three growing seasons in elevated [CO 2 ], but no effect of [CO 2 ] on stem wood density, which dif- fered significantly only among species. Key words: elevated CO 2 , light-use efficiency, POPFACE, Populus, root/ shoot ratio, SRC, wood density. Introduction Much progress has been made in recent decades toward maxi- mizing woody biomass production in poplar through the intro- duction of new clones and improved cultural techniques (Stettler and Heilman 1984, Hansen 1991). Short Rotation Cultures (SRC) have been introduced to produce biomass for energy and industry in the USA (Hohenstein and Wright 1994) and in Europe (Grassi et al. 1990), but the impact of climate changes on SRC is not well known. Numerous studies on the impact of increasing CO 2 concentration ([CO 2 ]) on tree pro- ductivity, i.e., carbon sequestration capacity, are underway (Karnosky et al. 2001). Initially, elevated [CO 2 ] studies were conducted with small trees under controlled environmental conditions (Ceulemans and Mousseau 1994, Saxe et al. 1998). More recently, the focus has been on ecosystem-level re- sponses, the study of which requires exposing an area of natu- ral vegetation to elevated [CO 2 ] without otherwise altering the environmental conditions (Norby et al. 1999). This can be achieved by the free-air CO 2 enrichment (FACE) technique (Hendrey et al. 1993). Although FACE is widely applied to herbaceous plants, few experiments have been carried out with trees because of the cost of the large installations that such ex- periments require (Karnosky et al. 2001). Elevated [CO 2 ] usually enhances both above- and below- ground productivity, particularly in fast-growing species such as poplars (Gielen and Ceulemans 2001). Increases in total biomass of between 22 and 90% in response to atmospheric CO 2 enrichment have been reported in poplar (Gielen and Ceulemans 2001), although no significant effect on above- ground biomass was found in Populus deltoides Bartr. ex Marsh (Wait et al. 1999), Populus tremuloides Michx. (Kubiske et al. 1997) or Populus grandidentata Michx. (Curtis et al. 1994). Recently, it was reported that aboveground bio- mass of one P .× euramericana Dode (Guinier) and one P. nigra L. genotype, grown within a single small FACE ring for 5 months, increased in response to elevated [CO 2 ] by 47 and 32%, respectively (Tognetti et al. 1999). Little is known about the effect of elevated [CO 2 ] on belowground growth of poplar. Although a number of experiments have shown increased growth of poplars in response to elevated [CO 2 ], these were mostly short-term studies with plants in pots (Radoglou and Jarvis 1990, Curtis and Teeri 1992, Dickson et al. 1998, Loewe et al. 2000). However, a study with six P. tremuloides clones found a 113% increase in fine root biomass in response to ele- Tree Physiology 23, 805–814 © 2003 Heron Publishing—Victoria, Canada Free-air CO 2 enrichment (FACE) enhances biomass production in a short-rotation poplar plantation C. CALFAPIETRA, 1,2 B. GIELEN, 3 A. N. J. GALEMA, 4 M. LUKAC, 5 P. DE ANGELIS, 1 M. C. MOSCATELLI, 6 R. CEULEMANS 3 and G. SCARASCIA-MUGNOZZA 1 1 Università degli Studi della Tuscia, Department of Forest Environment and Resources (DISAFRI), Via S. Camillo de Lellis, I-01100 Viterbo, Italy 2 Author to whom correspondence should be addressed ([email protected]) 3 University of Antwerpen, UIA, Department of Biology, Universiteitsplein 1, B-2610 Wilrijk, Belgium 4 Wageningen University and Research Centre, Department of Environmental Sciences, Forest Ecology and Forest Management Group, P.O. Box 342, 6700AH Wageningen, The Netherlands 5 School of Agricultural and Forest Sciences, University of Wales, Bangor, Deiniol Road, Bangor, LL57 2UW, UK 6 Università degli Studi della Tuscia, Department of Agrobiology and Agrochemistry (DABAC), Via S. Camillo de Lellis, I-01100 Viterbo, Italy Received September 20, 2002; accepted January 24, 2003; published online July 15, 2003 by guest on March 21, 2016 http://treephys.oxfordjournals.org/ Downloaded from
Transcript of Free-air CO2 enrichment (FACE) enhances biomass production in a short-rotation poplar plantation
Summary This paper investigates the possible contributionof Short Rotation Cultures (SRC) to carbon sequestration inboth current and elevated atmospheric CO2 concentrations([CO2]). A dense poplar plantation (1 × 1 m) was exposed to a[CO2] of 550 ppm in Central Italy using the free-air CO2 en-richment (FACE) technique. Three species of Populus were ex-amined, namely P. alba L., P. nigra L. and P. × euramericanaDode (Guinier). Aboveground woody biomass of trees ex-posed to elevated [CO2] for three growing seasons increased by15 to 27%, depending on species. As a result, light-use effi-ciency increased. Aboveground biomass allocation was un-affected, and belowground biomass also increased underelevated [CO2] conditions, by 22 to 38%. Populus nigra, withtotal biomass equal to 62.02 and 72.03 Mg ha–1 in ambient andelevated [CO2], respectively, was the most productive species,although its productivity was stimulated least by atmosphericCO2 enrichment. There was greater depletion of inorganic ni-trogen from the soil after three growing seasons in elevated[CO2], but no effect of [CO2] on stem wood density, which dif-fered significantly only among species.
Key words: elevated CO2, light-use efficiency, POPFACE,Populus, root/shoot ratio, SRC, wood density.
Introduction
Much progress has been made in recent decades toward maxi-mizing woody biomass production in poplar through the intro-duction of new clones and improved cultural techniques(Stettler and Heilman 1984, Hansen 1991). Short RotationCultures (SRC) have been introduced to produce biomass forenergy and industry in the USA (Hohenstein and Wright 1994)and in Europe (Grassi et al. 1990), but the impact of climatechanges on SRC is not well known. Numerous studies on theimpact of increasing CO2 concentration ([CO2]) on tree pro-
ductivity, i.e., carbon sequestration capacity, are underway(Karnosky et al. 2001). Initially, elevated [CO2] studies wereconducted with small trees under controlled environmentalconditions (Ceulemans and Mousseau 1994, Saxe et al. 1998).More recently, the focus has been on ecosystem-level re-sponses, the study of which requires exposing an area of natu-ral vegetation to elevated [CO2] without otherwise altering theenvironmental conditions (Norby et al. 1999). This can beachieved by the free-air CO2 enrichment (FACE) technique(Hendrey et al. 1993). Although FACE is widely applied toherbaceous plants, few experiments have been carried out withtrees because of the cost of the large installations that such ex-periments require (Karnosky et al. 2001).
Elevated [CO2] usually enhances both above- and below-ground productivity, particularly in fast-growing species suchas poplars (Gielen and Ceulemans 2001). Increases in totalbiomass of between 22 and 90% in response to atmosphericCO2 enrichment have been reported in poplar (Gielen andCeulemans 2001), although no significant effect on above-ground biomass was found in Populus deltoides Bartr. exMarsh (Wait et al. 1999), Populus tremuloides Michx.(Kubiske et al. 1997) or Populus grandidentata Michx. (Curtiset al. 1994). Recently, it was reported that aboveground bio-mass of one P. × euramericana Dode (Guinier) and oneP. nigra L. genotype, grown within a single small FACE ringfor 5 months, increased in response to elevated [CO2] by47 and 32%, respectively (Tognetti et al. 1999). Little is knownabout the effect of elevated [CO2] on belowground growth ofpoplar.
Although a number of experiments have shown increasedgrowth of poplars in response to elevated [CO2], these weremostly short-term studies with plants in pots (Radoglou andJarvis 1990, Curtis and Teeri 1992, Dickson et al. 1998, Loeweet al. 2000). However, a study with six P. tremuloides clonesfound a 113% increase in fine root biomass in response to ele-
Tree Physiology 23, 805–814© 2003 Heron Publishing—Victoria, Canada
Free-air CO2 enrichment (FACE) enhances biomass production in ashort-rotation poplar plantation
C. CALFAPIETRA,1,2 B. GIELEN,3 A. N. J. GALEMA,4 M. LUKAC,5 P. DE ANGELIS,1
M. C. MOSCATELLI,6 R. CEULEMANS3 and G. SCARASCIA-MUGNOZZA1
1 Università degli Studi della Tuscia, Department of Forest Environment and Resources (DISAFRI), Via S. Camillo de Lellis, I-01100 Viterbo, Italy2 Author to whom correspondence should be addressed ([email protected])3 University of Antwerpen, UIA, Department of Biology, Universiteitsplein 1, B-2610 Wilrijk, Belgium4 Wageningen University and Research Centre, Department of Environmental Sciences, Forest Ecology and Forest Management Group, P.O. Box 342,
6700AH Wageningen, The Netherlands5 School of Agricultural and Forest Sciences, University of Wales, Bangor, Deiniol Road, Bangor, LL57 2UW, UK6 Università degli Studi della Tuscia, Department of Agrobiology and Agrochemistry (DABAC), Via S. Camillo de Lellis, I-01100 Viterbo, Italy
Received September 20, 2002; accepted January 24, 2003; published online July 15, 2003
by guest on March 21, 2016
http://treephys.oxfordjournals.org/D
ownloaded from
vated [CO2] (King et al. 2001).Estimates of the response of forest ecosystems to elevated
[CO2] have assumed the absence of an effect of [CO2] on theallometric relationships used to estimate biomass withintreated plots (DeLucia et al. 1999, Norby et al. 2001). Norby etal. (2001) have justified this based on an analysis of the effectof elevated [CO2] on stem taper and wood density.
To gain insight into the growth responses of forest trees toelevated [CO2], the light-use efficiency model introduced byMonteith (1972, 1977) may be applied. This model predictsthat net primary productivity (NPP) is linearly related to ab-sorbed photosynthetically active radiation (APAR), assumingthat light-use efficiency (ε) remains constant. Widespread useof this model has been made in estimating productivity overlarge spatial scales (Gower et al. 1999), and possible effects ofrising atmospheric [CO2] on ε need to be taken into account.Results for a Pinus taeda L. ecosystem showed a FACE-in-duced stimulation of ε of 27% as a result of increased biomassproduction (DeLucia et al. 2002).
In the POPFACE experiment, three poplar species weregrown in an SRC plantation for three growing seasons and ex-posed to a [CO2] of 550 ppm using the FACE technique, i.e., inopen field conditions with otherwise unchanged environmen-tal conditions. Because canopy closure in this system occurredin the second year (Gielen et al. 2001), it provided an opportu-nity to assess realistically the effect of future elevated [CO2] onbiomass productivity in forest plantations. Based on previousresearch at this site (for details see Calfapietra et al. 2001,Gielen et al. 2001, 2002), we hypothesized that (1) allometricrelationships between stem cross-sectional area and tree bio-mass are unaffected by an increase in atmospheric [CO2], (2)biomass allocation is slightly affected by the FACE treatmentthrough increased investment of biomass in branches androots, (3) biomass production is stimulated by the FACE treat-ment, and (4) the FACE treatment increases light-use effi-ciency of this plantation.
Materials and methods
Site description and plantation layout
The experimental plantation and FACE facility are located inan agricultural region of Central Italy, near Viterbo (Tuscany;42°22′ N, 11°48′ E, altitude 150 m). In late spring 1999, a 9-hafield was planted with 25-cm-long hardwood cuttings ofPopulus × euramericana (P. deltoides × P. nigra) genotypeI-214 at a density of 5000 trees ha–1 (2 × 1 m). Six experimen-tal plots (30 × 30 m) with homogeneous soil and microclimaticconditions were selected within the plantation. Plots wereplanted at a density of 10,000 trees ha–1 (1 × 1 m) with hard-wood cuttings of three different species: P. × euramericana ge-notype I-214, P. nigra (genotype Jean Pourtet) and a localselection of P. alba L. (genotype 2AS11). This planting den-sity is common in SRC poplar plantations (Hansen 1991,MacPherson 1995). For further information on the descriptivespecies properties, see Calfapietra et al. (2001).
In each of three plots, a 22-m diameter PVC ring was
mounted on telescopic poles, and pure CO2 was releasedthrough laser-drilled holes in the ring (FACE treatment). Treeswithin a 22-m diameter area in the center of each of the threeremaining plots served as controls. In order to avoid cross-con-tamination between FACE and control plots, plots were a min-imum of 120 m apart. The [CO2] was monitored with anautomatic monitoring station at the center of each ring. Direc-tional release of gas around the ring was controlled, accordingto wind direction, by shut-off valves located before the point ofinjection. The released quantity of gas was established, ac-cording to wind speed, with an algorithm developed for the fa-cility based on a three-dimensional gas dispersion model(Miglietta et al. 2001). The computer-controlled system wasset to maintain a [CO2] of 550 ppm inside the FACE plots. Themean [CO2] within the FACE plots was 544 ± 48 ppm duringthe first year of treatment, 532 ± 83 ppm during the secondyear, and 554 ± 95 during the third year (F. Miglietta,CNR-IATA, Florence, Italy, unpublished results). Unexpectedinternal corrosion of the CO2 bulk container caused perfor-mance problems in the autumn of the second year. However,the CO2 concentrations, measured at 1-min intervals at thecenter of the ring and at the top of the canopy, were within 20%of the target concentration more than 80% of the time. The[CO2] in the canopy space was controlled and monitoredthroughout the season by two additional independent infraredgas analyzers. Despite considerable short-term [CO2] fluctua-tions within the canopy space, mean daily values differed onlyslightly from those measured at the top of the canopy(F. Miglietta, unpublished results). Daytime CO2 enrichmentwas provided from bud burst to leaf fall (March to November).A detailed description of the set-up and performance of thisFACE facility has been provided by Miglietta et al. (2001).
The 20-cm-deep topsoil layer had a silt loam texture and apH (KCl) of 5.04. Total carbon and nitrogen were 0.98 and0.12%, respectively, and bulk density was 1.34 g cm–3. Therewere no relevant differences between experimental plots(M. Hoosbeek, Wageningen University, The Netherlands, un-published results).
A drip irrigation system was installed both in the field and inthe experimental plots to avoid drought stress during planta-tion establishment and the dry summer period. Irrigation wasmonitored to ensure equal application in each experimentalplot. The amount of water supplied to trees increased fromspring to summer, and from the first to the third growing sea-son, in order to match transpiration, reaching a maximum of10 mm day–1 in the summer of the third growing season.Weeds were removed manually or mechanically, and insecti-cides was applied as necessary during the establishment year.
Harvests
In November and December 2000, the first biomass harvestwas made of 2-year-old trees selected from the external rowsof the plots, i.e., beyond the CO2-enriched area, thus leavingthe experimental plots undisturbed until the end of the 3-yeartreatment period. The experimental trees were divided intofour classes according to basal area at breast height (BA). Twotrees of each species were selected from each plot (n = 12)
806 CALFAPIETRA ET AL.
TREE PHYSIOLOGY VOLUME 23, 2003
by guest on March 21, 2016
http://treephys.oxfordjournals.org/D
ownloaded from
such that, from each BA class, a number of trees proportionalto the total number of trees in that class was selected. Allaboveground components were dried for 5 days at 70 °C andweighed.
In November and December 2001, the second biomass har-vest was made of 3-year-old trees selected within the experi-mental area. Eight trees of each species were selected fromeach plot (n = 48) such that, from each BA class, a number oftrees proportional to the total number of trees in that class wasselected. For half of the harvested trees, branch biomass wasseparated from stems. For the remaining trees, branches weresorted into: sylleptic branches on HGI 1 (height growth incre-ment of the first growing season), HGI 2 (height growth incre-ment of the second growing season) and HGI 3 (height growthincrement of the third growing season); proleptic branches onHGI 1 and HGI 2; and second-order branches. Only live bio-mass components were sampled. Some proleptic branches de-veloped early in the spring but died and fell before the end ofthe growing season, and thus were not sampled during our har-vests.
Fresh stem volume was measured by water displacement,and all aboveground components were weighed after dryingfor 5 days at 70 °C. Wood density was calculated as fresh stemvolume divided by stem dry mass. In contrast with the first(second-year) harvest, each stem was divided into three partsaccording to the three HGIs to determine the volume and den-sity of each component. Two trees per species per plot (36trees in total) were selected from those harvested to determinebelowground biomass. A 1 × 1 m square centred around thetree was excavated to a depth of 70 cm for belowground bio-mass assessments. We assumed that roots of surrounding treeswithin the sample area compensated for roots of the measuredtree that were outside the sampled area. Only coarse roots (di-ameter > 2–3 mm) were collected, and the stump was sepa-rated from the roots. Fine root biomass was excluded, as weredead coarse roots, which make up only a small fraction of thebiomass. Roots were washed, dried for 3 days at 70 °C andweighed.
Scaling up to the ecosystem level
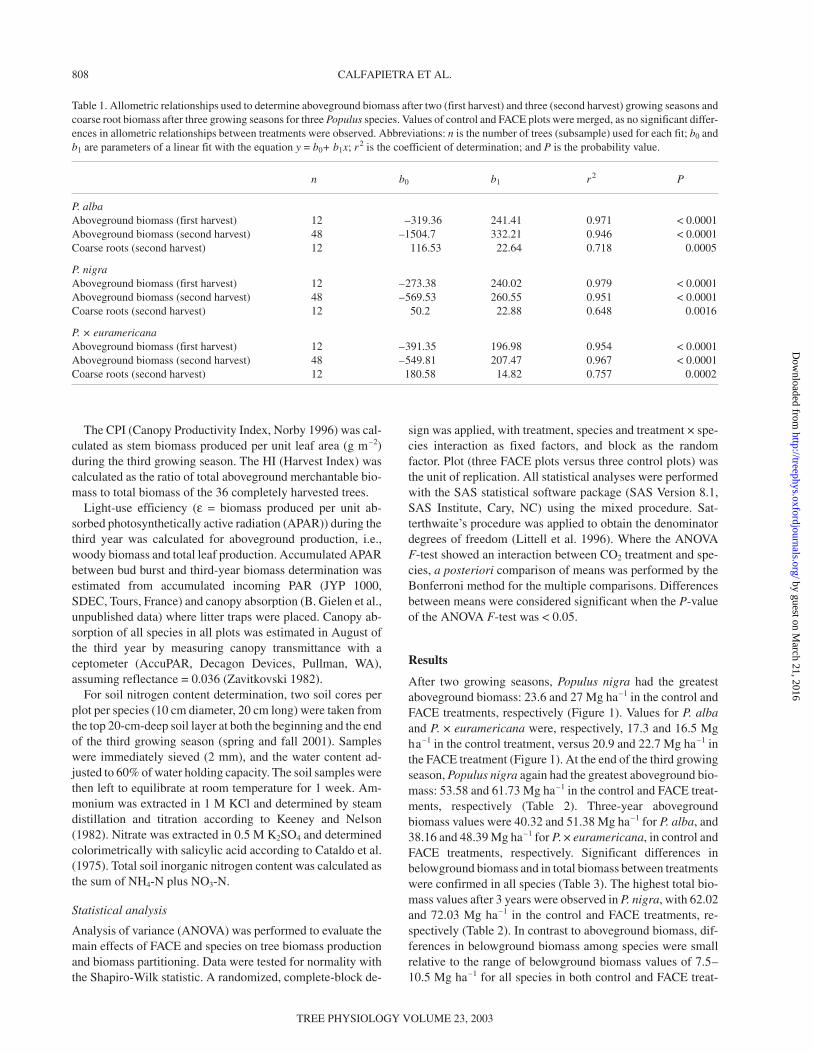
Allometric relationships between BA and total abovegroundbiomass of harvested trees were established for each harvestand species (subsample of 12 and 48 trees for the first and sec-ond harvests, respectively) (Table 1). The FACE treatment didnot affect allometric relationships between BA and above-ground biomass, as shown by analysis of covariance for thethird growing season (P = 0.12 and 0.93 for the slope and theintercept comparison, respectively). This justified the use of asingle regression line to estimate biomass for both treatments.Data were pooled by species, which differed significantly (P <0.0001) in both regression slope and intercept. Allometric re-lationships were used to estimate aboveground biomass fromthe BA of 48 experimental trees (main sample) per plot perspecies. Aboveground biomass per tree was estimated with thegeneral equation (Corona 2000):
y y b x xp ss ss= + −1( )
where x is BA and y is aboveground biomass; yp = mean y esti-mated for the population; yss = mean y of the subsample; xss =mean x of the subsample; x = mean x of the main sample; andb1 = the coefficient of the linear regression between y and x(i.e., y = b0 + b1x; see Table 1).
The accuracy of the estimation of yp depends on the vari-ability of y in the subsample and of the predicted values of y inthe main sample. The variance of yp can be estimated as:
sn n
ns
n
y y
n s
Ny y x
xp
ss
ss
ss
ss
ss2
2 221
1= − + −
−
+ −
,( )
( )
n
N
s
ny2
where sy x,2 = variance of the residual estimated for the sub-
sample:
sy y
ny x
i ii
n
,
( � )2
2
1
2=
−−
=∑ss
where yi = the ith value of the parameter y measured in the sub-sample; �yi = the ith value of the parameter y estimated by usingthe linear regression corresponding to the ith value of the pa-rameter x in the subsample; nss = the number of values in thesubsample; n = the number of values in the main sample; y =mean y of the main sample; sy
2 = variance of y in the sub-sample; sx ss
2 = variance of x in the subsample; and N = the num-ber of values in the population.
A similar procedure was used to obtain a regression betweenBA and coarse root biomass with a subsample of 12 trees perspecies (Table 1).
The root/shoot ratio (R/S) was calculated from values of to-tal below- and aboveground biomass of the harvested trees,i.e., six trees per species per treatment. There were no differ-ences in R/S ratio among stem diameter classes, and thereforebelowground biomass was estimated for trees of the main sam-ple from R/S ratio and aboveground biomass. Stump biomasswas calculated as the difference between total belowgroundbiomass and coarse root biomass.
Branch/stem ratio (B/St) was calculated for the 24 harvestedtrees per species per treatment. With this ratio, branch andstem biomass were estimated from aboveground biomass val-ues. Finally, branch biomass was separated into the differenttypes (see above) based on relative ratios calculated for 12trees per species per treatment.
Assessments at the physiological level
In the third growing season, leaf production was collected incontrol and FACE treatments in six litter traps (0.13 m2) perplot per species. Litter was determined after pooling the threereplicated traps per half-plot per species to account for spatialheterogeneity. Traps were placed in the projected area of a treeor the intersection of the projected areas of four adjacent trees.Litter was dried at 80 °C for 48 h and weighed. Annual litter-fall was calculated as the sum of each periodic collection (gm–2). Total leaf area produced was estimated by multiplyingannual litterfall by specific leaf area values for each species.
TREE PHYSIOLOGY ONLINE at http://heronpublishing.com
EFFECT OF ELEVATED CO2 ON BIOMASS IN POPLARS 807
by guest on March 21, 2016
http://treephys.oxfordjournals.org/D
ownloaded from
The CPI (Canopy Productivity Index, Norby 1996) was cal-culated as stem biomass produced per unit leaf area (g m–2)during the third growing season. The HI (Harvest Index) wascalculated as the ratio of total aboveground merchantable bio-mass to total biomass of the 36 completely harvested trees.
Light-use efficiency (ε = biomass produced per unit ab-sorbed photosynthetically active radiation (APAR)) during thethird year was calculated for aboveground production, i.e.,woody biomass and total leaf production. Accumulated APARbetween bud burst and third-year biomass determination wasestimated from accumulated incoming PAR (JYP 1000,SDEC, Tours, France) and canopy absorption (B. Gielen et al.,unpublished data) where litter traps were placed. Canopy ab-sorption of all species in all plots was estimated in August ofthe third year by measuring canopy transmittance with aceptometer (AccuPAR, Decagon Devices, Pullman, WA),assuming reflectance = 0.036 (Zavitkovski 1982).
For soil nitrogen content determination, two soil cores perplot per species (10 cm diameter, 20 cm long) were taken fromthe top 20-cm-deep soil layer at both the beginning and the endof the third growing season (spring and fall 2001). Sampleswere immediately sieved (2 mm), and the water content ad-justed to 60% of water holding capacity. The soil samples werethen left to equilibrate at room temperature for 1 week. Am-monium was extracted in 1 M KCl and determined by steamdistillation and titration according to Keeney and Nelson(1982). Nitrate was extracted in 0.5 M K2SO4 and determinedcolorimetrically with salicylic acid according to Cataldo et al.(1975). Total soil inorganic nitrogen content was calculated asthe sum of NH4-N plus NO3-N.
Statistical analysis
Analysis of variance (ANOVA) was performed to evaluate themain effects of FACE and species on tree biomass productionand biomass partitioning. Data were tested for normality withthe Shapiro-Wilk statistic. A randomized, complete-block de-
sign was applied, with treatment, species and treatment × spe-cies interaction as fixed factors, and block as the randomfactor. Plot (three FACE plots versus three control plots) wasthe unit of replication. All statistical analyses were performedwith the SAS statistical software package (SAS Version 8.1,SAS Institute, Cary, NC) using the mixed procedure. Sat-terthwaite’s procedure was applied to obtain the denominatordegrees of freedom (Littell et al. 1996). Where the ANOVAF-test showed an interaction between CO2 treatment and spe-cies, a posteriori comparison of means was performed by theBonferroni method for the multiple comparisons. Differencesbetween means were considered significant when the P-valueof the ANOVA F-test was < 0.05.
Results
After two growing seasons, Populus nigra had the greatestaboveground biomass: 23.6 and 27 Mg ha–1 in the control andFACE treatments, respectively (Figure 1). Values for P. albaand P. × euramericana were, respectively, 17.3 and 16.5 Mgha–1 in the control treatment, versus 20.9 and 22.7 Mg ha–1 inthe FACE treatment (Figure 1). At the end of the third growingseason, Populus nigra again had the greatest aboveground bio-mass: 53.58 and 61.73 Mg ha–1 in the control and FACE treat-ments, respectively (Table 2). Three-year abovegroundbiomass values were 40.32 and 51.38 Mg ha–1 for P. alba, and38.16 and 48.39 Mg ha–1 for P. × euramericana, in control andFACE treatments, respectively. Significant differences inbelowground biomass and in total biomass between treatmentswere confirmed in all species (Table 3). The highest total bio-mass values after 3 years were observed in P. nigra, with 62.02and 72.03 Mg ha–1 in the control and FACE treatments, re-spectively (Table 2). In contrast to aboveground biomass, dif-ferences in belowground biomass among species were smallrelative to the range of belowground biomass values of 7.5–10.5 Mg ha–1 for all species in both control and FACE treat-
808 CALFAPIETRA ET AL.
TREE PHYSIOLOGY VOLUME 23, 2003
Table 1. Allometric relationships used to determine aboveground biomass after two (first harvest) and three (second harvest) growing seasons andcoarse root biomass after three growing seasons for three Populus species. Values of control and FACE plots were merged, as no significant differ-ences in allometric relationships between treatments were observed. Abbreviations: n is the number of trees (subsample) used for each fit; b0 andb1 are parameters of a linear fit with the equation y = b0+ b1x; r2 is the coefficient of determination; and P is the probability value.
n b0 b1 r2 P
P. albaAboveground biomass (first harvest) 12 –319.36 241.41 0.971 < 0.0001Aboveground biomass (second harvest) 48 –1504.7 332.21 0.946 < 0.0001Coarse roots (second harvest) 12 116.53 22.64 0.718 0.0005
P. nigraAboveground biomass (first harvest) 12 –273.38 240.02 0.979 < 0.0001Aboveground biomass (second harvest) 48 –569.53 260.55 0.951 < 0.0001Coarse roots (second harvest) 12 50.2 22.88 0.648 0.0016
P. × euramericanaAboveground biomass (first harvest) 12 –391.35 196.98 0.954 < 0.0001Aboveground biomass (second harvest) 48 –549.81 207.47 0.967 < 0.0001Coarse roots (second harvest) 12 180.58 14.82 0.757 0.0002
by guest on March 21, 2016
http://treephys.oxfordjournals.org/D
ownloaded from

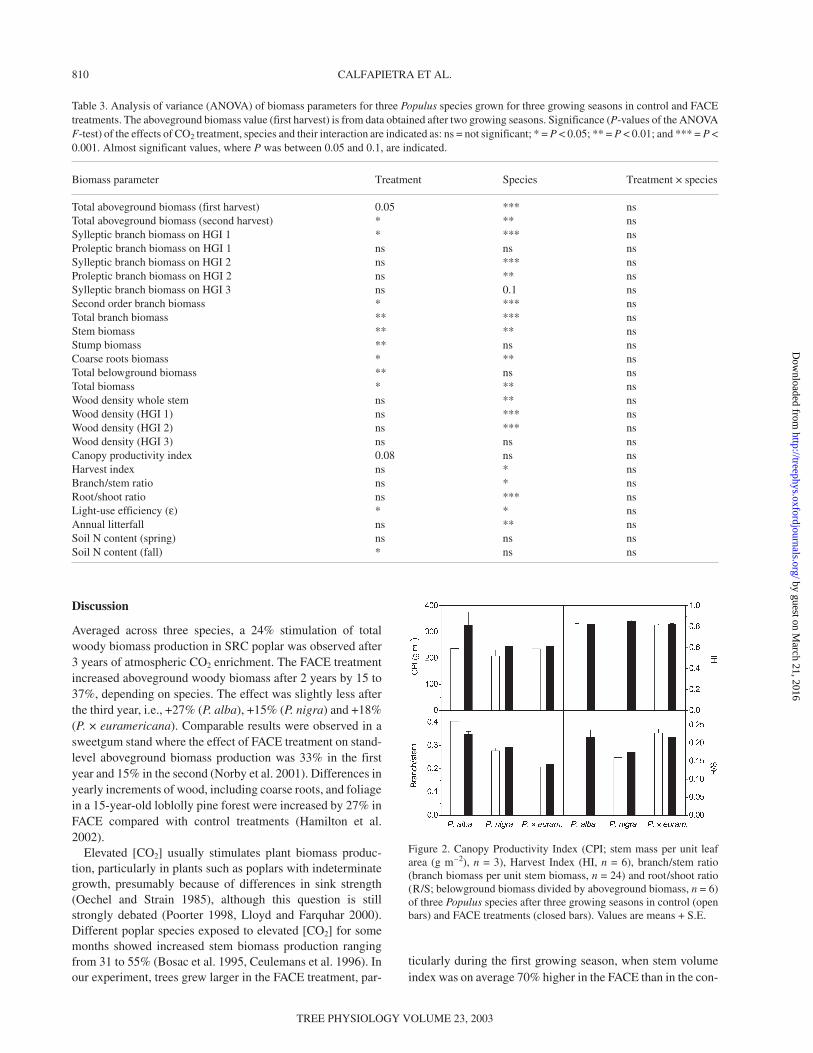
ments (Table 2). Given these above- and belowground biomassvalues, the R/S ratio was not significantly influenced by theFACE treatment; R/S ratios ranged from 0.16 in P. nigra to0.23 in P. alba and P. × euramericana (Figure 2).
Branch biomass was similar in P. nigra and P. alba, butlower in P. × euramericana, in both treatments. Moreover,branch biomass was significantly higher in the FACE treat-ment than in the control treatment (Tables 2 and 3). Values af-ter three growing seasons ranged from 6.45 to 11.57 Mg ha–1
in the control treatment, and from 8.56 to 13.95 Mg ha–1 in theFACE treatment, depending on species. In contrast, the B/Stratio was unaffected by FACE treatment in P. nigra and P. ×euramericana, whereas it was higher in the control treatmentfor P. alba (Figure 2).
The partitioning of branch biomass among different branchtypes was not greatly affected by the FACE treatment. Never-theless, in P. nigra, sylleptic branches on HGI 1 represented 16and 23% of total branch biomass in the control and FACEtreatments, respectively, whereas proleptic branches on HGI 2
represented 25 and 18% of total branch biomass in the controland FACE treatments, respectively (Figure 3). Species differedconsiderably in their allocation of biomass. For instance, P. ×euramericana invested mainly in proleptic branches (69% oftotal branch biomass in the control treatment versus 70% in theFACE treatment), whereas P. alba and P. nigra invested morein sylleptic branches (between 50 and 60% of total branch bio-mass). No significant interactions between CO2 treatment andspecies were found for any of the biomass parameters.
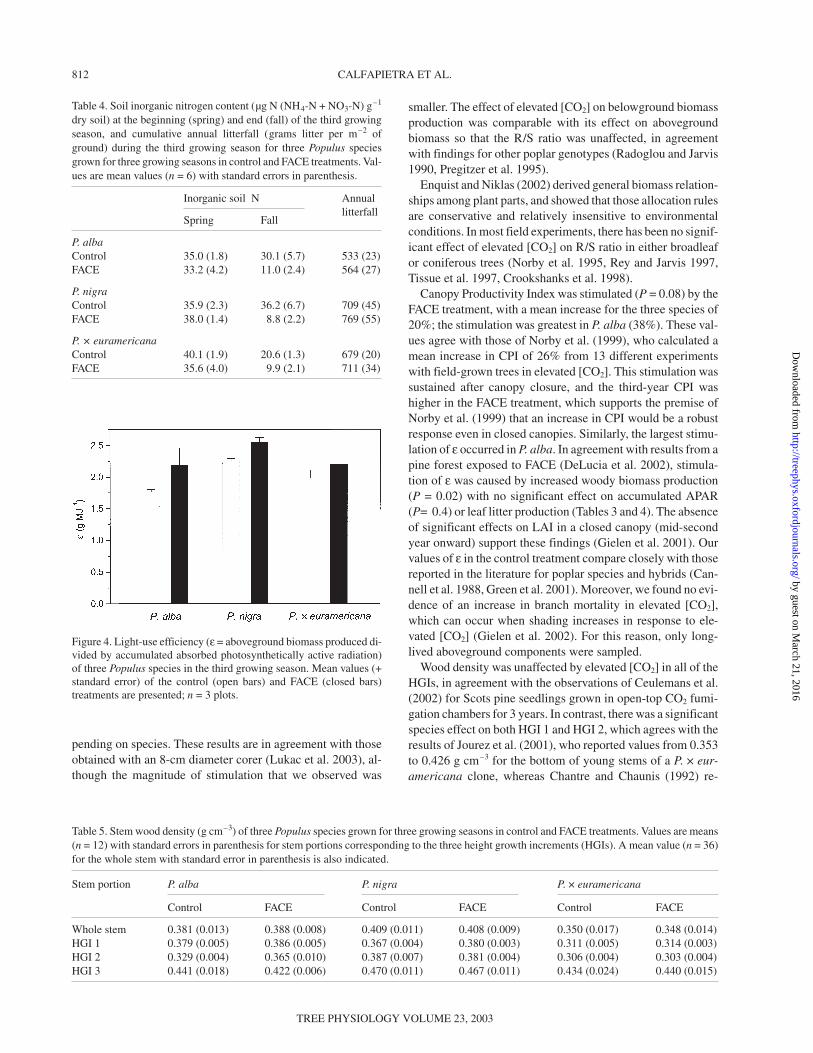
Annual litterfall during the third growing season was unaf-fected by treatment, but a significant difference among speciesemerged. Values ranged between 533 and 769 g m–2, depend-ing on species and treatment (Table 4). Canopy ProductivityIndex was increased by the FACE treatment (P = 0.08) duringthe third growing season, especially in P. alba, where valueswere 236 and 327 g m–2 in the control and FACE treatments,respectively (Figure 2). Lower values were observed inP. nigra and P. × euramericana. For the latter species, differ-ences between treatments were limited. As for CPI, ε washigher in the FACE treatment for all species. The highest ε val-ues were observed in P. nigra (2.25 and 2.54 g MJ–1 in thecontrol and FACE treatments, respectively) (Figure 4). TheHarvest Index was unaffected by both treatment and species,with values ranging from 0.81 to 0.86 (Figure 2).
Wood density was unaffected by the FACE treatment in allspecies, but a significant difference was observed among spe-cies (Tables 3 and 5). Mean values for whole stem wood den-sity ranged from 0.348 g cm–3 in P. × euramericana to 0.409 gcm–3 in P. nigra (Table 5). Differences were evident among thethree HGIs. Wood density was always highest in HGI 3, withvalues ranging from 0.422 to 0.470 g cm–3.
Inorganic soil nitrogen content was similar among speciesand between treatments in the spring of the third growing sea-son, whereas a significant treatment effect emerged in the fall(Tables 3 and 4). A depletion of soil nitrogen was evident forall species in both treatments, except for P. nigra in the controltreatment (Table 4).
TREE PHYSIOLOGY ONLINE at http://heronpublishing.com
EFFECT OF ELEVATED CO2 ON BIOMASS IN POPLARS 809
Table 2. Biomass distribution (Mg ha–1) of three Populus species after three growing seasons in control and FACE treatments. Values are meanswith standard errors in parenthesis; n =144. Abbreviation: HGI = height growth increment.
Component P. alba P. nigra P. × euramericana
Control FACE Control FACE Control FACE
Sylleptic branches on HGI 1 1.52 (0.39) 1.70 (0.31) 1.89 (0.32) 3.21 (0.28) 0.60 (0.13) 0.88 (0.30)Proleptic brances on HGI 1 1.58 (0.24) 1.94 (0.35) 1.48 (0.15) 1.62 (0.27) 1.79 (0.29) 2.45 (0.29)Sylleptic branches on HGI 2 3.57 (0.52) 3.53 (0.40) 2.52 (0.35) 3.37 (0.64) 0.12 (0.04) 0.44 (0.30)Proleptic brances on HGI 2 1.43 (0.24) 2.04 (0.37) 2.94 (0.37) 2.45 (0.38) 2.66 (0.55) 3.49 (0.73)Sylleptic branches on HGI 3 1.33 (0.24) 1.71 (0.42) 1.83 (0.21) 2.08 (0.31) 1.04 (0.32) 1.02 (0.24)Second-order branches 2.03 (0.42) 2.24 (0.48) 0.91 (0.19) 1.22 (0.23) 0.25 (0.08) 0.28 (0.13)Total branches 11.45 (2.30) 13.15 (1.93) 11.57 (1.35) 13.95 (1.39) 6.45 (1.21) 8.56 (1.36)Stem 28.87 (3.65) 38.23 (3.28) 42.01 (2.58) 47.78 (2.57) 31.71 (2.68) 39.82 (2.93)Stump 2.65 (1.16) 4.78 (1.10) 2.73 (0.66) 3.87 (0.73) 2.95 (0.82) 4.46 (0.98)Coarse roots 4.93 (1.71) 5.68 (1.84) 5.71 (2.46) 6.43 (1.46) 4.92 (1.27) 5.65 (1.37)Total aboveground biomass 40.32 (4.31) 51.38 (3.81) 53.58 (2.91) 61.73 (2.93) 38.16 (2.94) 48.39 (3.23)Total belowground biomass 7.58 (2.80) 10.46 (2.96) 8.44 (2.79) 10.30 (2.07) 7.87 (2.07) 10.11 (2.40)Total biomass 47.90 (6.41) 61.84 (5.78) 62.02 (4.57) 72.03 (4.39) 46.03 (4.41) 58.50 (4.88)
Figure 1. Total aboveground biomass measured after two growingseasons in three Populus species in control and FACE treatments.Mean values (+ standard error) of the control (open bars) and FACE(closed bars) treatments are presented. Each bar represents the meanof 144 trees for which biomass was estimated from basal area withallometric relationships.
by guest on March 21, 2016
http://treephys.oxfordjournals.org/D
ownloaded from
Discussion
Averaged across three species, a 24% stimulation of totalwoody biomass production in SRC poplar was observed after3 years of atmospheric CO2 enrichment. The FACE treatmentincreased aboveground woody biomass after 2 years by 15 to37%, depending on species. The effect was slightly less afterthe third year, i.e., +27% (P. alba), +15% (P. nigra) and +18%(P. × euramericana). Comparable results were observed in asweetgum stand where the effect of FACE treatment on stand-level aboveground biomass production was 33% in the firstyear and 15% in the second (Norby et al. 2001). Differences inyearly increments of wood, including coarse roots, and foliagein a 15-year-old loblolly pine forest were increased by 27% inFACE compared with control treatments (Hamilton et al.2002).
Elevated [CO2] usually stimulates plant biomass produc-tion, particularly in plants such as poplars with indeterminategrowth, presumably because of differences in sink strength(Oechel and Strain 1985), although this question is stillstrongly debated (Poorter 1998, Lloyd and Farquhar 2000).Different poplar species exposed to elevated [CO2] for somemonths showed increased stem biomass production rangingfrom 31 to 55% (Bosac et al. 1995, Ceulemans et al. 1996). Inour experiment, trees grew larger in the FACE treatment, par-
ticularly during the first growing season, when stem volumeindex was on average 70% higher in the FACE than in the con-
810 CALFAPIETRA ET AL.
TREE PHYSIOLOGY VOLUME 23, 2003
Table 3. Analysis of variance (ANOVA) of biomass parameters for three Populus species grown for three growing seasons in control and FACEtreatments. The aboveground biomass value (first harvest) is from data obtained after two growing seasons. Significance (P-values of the ANOVAF-test) of the effects of CO2 treatment, species and their interaction are indicated as: ns = not significant; * = P < 0.05; ** = P < 0.01; and *** = P <0.001. Almost significant values, where P was between 0.05 and 0.1, are indicated.
Biomass parameter Treatment Species Treatment × species
Total aboveground biomass (first harvest) 0.05 *** nsTotal aboveground biomass (second harvest) * ** nsSylleptic branch biomass on HGI 1 * *** nsProleptic branch biomass on HGI 1 ns ns nsSylleptic branch biomass on HGI 2 ns *** nsProleptic branch biomass on HGI 2 ns ** nsSylleptic branch biomass on HGI 3 ns 0.1 nsSecond order branch biomass * *** nsTotal branch biomass ** *** nsStem biomass ** ** nsStump biomass ** ns nsCoarse roots biomass * ** nsTotal belowground biomass ** ns nsTotal biomass * ** nsWood density whole stem ns ** nsWood density (HGI 1) ns *** nsWood density (HGI 2) ns *** nsWood density (HGI 3) ns ns nsCanopy productivity index 0.08 ns nsHarvest index ns * nsBranch/stem ratio ns * nsRoot/shoot ratio ns *** nsLight-use efficiency (ε) * * nsAnnual litterfall ns ** nsSoil N content (spring) ns ns nsSoil N content (fall) * ns ns
Figure 2. Canopy Productivity Index (CPI; stem mass per unit leafarea (g m–2), n = 3), Harvest Index (HI, n = 6), branch/stem ratio(branch biomass per unit stem biomass, n = 24) and root/shoot ratio(R/S; belowground biomass divided by aboveground biomass, n = 6)of three Populus species after three growing seasons in control (openbars) and FACE treatments (closed bars). Values are means + S.E.
by guest on March 21, 2016
http://treephys.oxfordjournals.org/D
ownloaded from

trol treatment (Calfapietra et al. 2001). Leaf area index (LAI)also consistently increased in the FACE treatment, especiallyduring the first growing season before canopy closure (Gielenet al. 2001). Growth in elevated [CO2] resulted in an increasein daily integrated carbon uptake for upper canopy leavesranging from 35 to 77%, depending on species and measure-ment date (Bernacchi 2002). Leaf gas exchange measurementsindicated no physiological acclimation to elevated [CO2] (Ber-nacchi 2002). Relative stimulation of stem volume index by el-evated [CO2] decreased after the first growing season to amean of 22% for the three species at the end of both the secondand third growing seasons.
Soil inorganic nitrogen decreased considerably during thethird growing season (Table 4), particularly in the FACE treat-ment, presumably because of greater biomass production. The
more rapid depletion of soil nitrogen in the FACE treatmentmay have reduced the effect of elevated [CO2] on productivity.
Mean annual aboveground biomass production was 17.86and 20.58 Mg ha–1 year–1 in the control and FACE treatments,respectively. For the same parameter, Heilman et al. (1994)observed values between 11.40 and 24.30 Mg ha–1 year–1 in a4-year-old plantation (1 × 1 m spacing) of P. trichocarpa Tott.& Gray, P. deltoides and their hybrids. After 3 years of growth,four Populus clones had a mean total aboveground woody bio-mass of 48.0, 45.0 and 39.1 Mg ha–1 at 0.5-m, 1.0-m and 1.5-mspacings, respectively (DeBell and Harrington 1997). Thesevalues agree with those found for P. alba and P. × eur-americana in our experiment (Table 2).
The stimulation of belowground biomass production (fineroots excluded) by elevated [CO2] ranged from 22 to 38%, de-
TREE PHYSIOLOGY ONLINE at http://heronpublishing.com
EFFECT OF ELEVATED CO2 ON BIOMASS IN POPLARS 811
Figure 3. Relative partitioningof branch biomass among dif-ferent branch categories forthree Populus species afterthree growing seasons in con-trol and FACE treatments. Val-ues were determined from asample of 12 trees selected ac-cording to the frequency distri-bution of stem cross-sectionalarea at breast height of the en-tire main sample. All valuesare percentages. The diameterof each pie graph is propor-tional to the total branch bio-mass for each species andtreatment. Abbreviations:Syll = sylleptic branches;Prol = proleptic branches; IIorder = second-order branches;and HGI = height growth in-crement.
by guest on March 21, 2016
http://treephys.oxfordjournals.org/D
ownloaded from
pending on species. These results are in agreement with thoseobtained with an 8-cm diameter corer (Lukac et al. 2003), al-though the magnitude of stimulation that we observed was
smaller. The effect of elevated [CO2] on belowground biomassproduction was comparable with its effect on abovegroundbiomass so that the R/S ratio was unaffected, in agreementwith findings for other poplar genotypes (Radoglou and Jarvis1990, Pregitzer et al. 1995).
Enquist and Niklas (2002) derived general biomass relation-ships among plant parts, and showed that those allocation rulesare conservative and relatively insensitive to environmentalconditions. In most field experiments, there has been no signif-icant effect of elevated [CO2] on R/S ratio in either broadleafor coniferous trees (Norby et al. 1995, Rey and Jarvis 1997,Tissue et al. 1997, Crookshanks et al. 1998).
Canopy Productivity Index was stimulated (P = 0.08) by theFACE treatment, with a mean increase for the three species of20%; the stimulation was greatest in P. alba (38%). These val-ues agree with those of Norby et al. (1999), who calculated amean increase in CPI of 26% from 13 different experimentswith field-grown trees in elevated [CO2]. This stimulation wassustained after canopy closure, and the third-year CPI washigher in the FACE treatment, which supports the premise ofNorby et al. (1999) that an increase in CPI would be a robustresponse even in closed canopies. Similarly, the largest stimu-lation of ε occurred in P. alba. In agreement with results from apine forest exposed to FACE (DeLucia et al. 2002), stimula-tion of ε was caused by increased woody biomass production(P = 0.02) with no significant effect on accumulated APAR(P= 0.4) or leaf litter production (Tables 3 and 4). The absenceof significant effects on LAI in a closed canopy (mid-secondyear onward) support these findings (Gielen et al. 2001). Ourvalues of ε in the control treatment compare closely with thosereported in the literature for poplar species and hybrids (Can-nell et al. 1988, Green et al. 2001). Moreover, we found no evi-dence of an increase in branch mortality in elevated [CO2],which can occur when shading increases in response to ele-vated [CO2] (Gielen et al. 2002). For this reason, only long-lived aboveground components were sampled.
Wood density was unaffected by elevated [CO2] in all of theHGIs, in agreement with the observations of Ceulemans et al.(2002) for Scots pine seedlings grown in open-top CO2 fumi-gation chambers for 3 years. In contrast, there was a significantspecies effect on both HGI 1 and HGI 2, which agrees with theresults of Jourez et al. (2001), who reported values from 0.353to 0.426 g cm–3 for the bottom of young stems of a P. × eur-americana clone, whereas Chantre and Chaunis (1992) re-
812 CALFAPIETRA ET AL.
TREE PHYSIOLOGY VOLUME 23, 2003
Table 4. Soil inorganic nitrogen content (µg N (NH4-N + NO3-N) g–1
dry soil) at the beginning (spring) and end (fall) of the third growingseason, and cumulative annual litterfall (grams litter per m–2 ofground) during the third growing season for three Populus speciesgrown for three growing seasons in control and FACE treatments. Val-ues are mean values (n = 6) with standard errors in parenthesis.
Inorganic soil N Annual
Spring Falllitterfall
P. albaControl 35.0 (1.8) 30.1 (5.7) 533 (23)FACE 33.2 (4.2) 11.0 (2.4) 564 (27)
P. nigraControl 35.9 (2.3) 36.2 (6.7) 709 (45)FACE 38.0 (1.4) 8.8 (2.2) 769 (55)
P. × euramericanaControl 40.1 (1.9) 20.6 (1.3) 679 (20)FACE 35.6 (4.0) 9.9 (2.1) 711 (34)
Figure 4. Light-use efficiency (ε = aboveground biomass produced di-vided by accumulated absorbed photosynthetically active radiation)of three Populus species in the third growing season. Mean values (+standard error) of the control (open bars) and FACE (closed bars)treatments are presented; n = 3 plots.
Table 5. Stem wood density (g cm–3) of three Populus species grown for three growing seasons in control and FACE treatments. Values are means(n = 12) with standard errors in parenthesis for stem portions corresponding to the three height growth increments (HGIs). A mean value (n = 36)for the whole stem with standard error in parenthesis is also indicated.
Stem portion P. alba P. nigra P. × euramericana
Control FACE Control FACE Control FACE
Whole stem 0.381 (0.013) 0.388 (0.008) 0.409 (0.011) 0.408 (0.009) 0.350 (0.017) 0.348 (0.014)HGI 1 0.379 (0.005) 0.386 (0.005) 0.367 (0.004) 0.380 (0.003) 0.311 (0.005) 0.314 (0.003)HGI 2 0.329 (0.004) 0.365 (0.010) 0.387 (0.007) 0.381 (0.004) 0.306 (0.004) 0.303 (0.004)HGI 3 0.441 (0.018) 0.422 (0.006) 0.470 (0.011) 0.467 (0.011) 0.434 (0.024) 0.440 (0.015)
by guest on March 21, 2016
http://treephys.oxfordjournals.org/D
ownloaded from
ported lower values of between 0.257 and 0.373 g cm–3 foryoung stems of 25 different poplar clones. The wood densityvalues of HGI 3 were considerably higher than those of HGI 1and HGI 2. A similar increase in wood density in young poplarhas been reported in specific experiments (Kellogg and Swan1986, Singh 1986).
In conclusion, our experiment confirmed inter-specific dif-ferences in biomass production in poplar, and demonstratedthat elevated atmospheric [CO2] enhanced productivity andlight-use efficiency of a poplar SRC ecosystem without chang-ing biomass allocation. It remains an open question whetherthis stimulation will continue for longer periods, and how itwould be affected by limitations in soil water and mineral nu-trient availability. Reduced soil inorganic nitrogen as a resultof increased [CO2] in our experiment raises the possibility ofreduced long-term productivity. If the amount of carbon incor-porated in agroforestry systems increases with rising [CO2],this will not necessarily result in increased ecosystem carbonsequestration because a significant fraction of this carbon islost to heterotrophic respiration (Schlesinger 1997). There-fore, the fate of carbon in the soil–microbial–root system mustbe known before sound predictions of carbon sequestrationpotential can be made.
Acknowledgments
This research was conducted within the framework of the followingprograms: EU-POPFACE (ENV4-CT97-0657), Centre of Excellence“Forest and Climate” (MIUR Italian Ministry of University and Re-search), MIUR-COFIN 2000 (coordinated by M. Borghetti). The au-thors acknowledge M. Hovenden (University of Tasmania) forlanguage revision, and P. Corona (University of Viterbo), T. Crowe(University of Southampton) and S. Van Dongen (University of Ant-werpen) for statistical advice. We also thank T. Oro, B. Assissi andM. Tamantini for technical assistance, as well as G. Avino, B. Bartoli,A. Claus and I. Laureysens for their help with the harvests. B. Gielenis a Research Assistant of the Fund for Scientific Research-Flanders(F.W.O.-Vlaanderen).
References
Bernacchi, C.J. 2002. Improved temperature response functions formodeling photosynthetic carbon assimilation in the context of ris-ing carbon dioxide. Ph.D. Thesis, University of Illinois, 136 p.
Bosac, C., S.D.L. Gardner, G. Taylor and D. Wilkins. 1995. ElevatedCO2 and hybrid poplar: a detailed investigation of root and shootgrowth and physiology of P. euramericana ‘Primo.’ For. Ecol.Manage. 74:103–116.
Calfapietra, C., B. Gielen, M. Sabatti, P. De Angelis, G. ScarasciaMugnozza and R. Ceulemans. 2001. Growth performance ofPopulus exposed to “Free Air Carbon dioxide Enrichment” duringthe first growing season in the POPFACE experiment. Ann. For.Sci. 58:819–828.
Cannell, M.G.R., L.J. Sheppard and R. Milne. 1988. Light use effi-ciency and woody biomass production of poplar and willow. For-estry 61:125–136.
Cataldo, D.A., M. Haroon, L.E. Schrader and V. Young. 1975. Rapidcolorimetric determination of nitrate in plant tissue by nitration ofsalicylic acid. Commun. Soil Sci. Plan. 6:71–80.
Ceulemans, R. and M. Mousseau. 1994. Effects of elevated atmo-spheric CO2 on woody plants. Tansley Review No. 71. New Phytol.127:425–446.
Ceulemans, R., B.Y. Shao, X.N. Jiang and J. Kalina. 1996. First- andsecond-year aboveground growth and productivity of two Populushybrids grown at ambient and elevated CO2. Tree Physiol. 16:61–68.
Ceulemans, R., M.E. Jach, R. Van de Velde, J.X. Lin and M. Stevens.2002. Elevated atmospheric CO2 alters wood production, woodquality and wood strength of Scots pine (Pinus sylvestris L.) afterthree years of enrichment. Global Change Biol. 8:153–162.
Chantre, G. and S. Chaunis. 1992. Etude de la variabilité des qualitéspapetières de 25 clones de peuplier agés d’un an. Ann. AFOCEL,pp 219–249.
Corona, P. 2000. Introduzione al rilevamento campionario dellerisorse forestali. CUSL, Florence, 284 p.
Crookshanks, M., G. Taylor and M. Broadmeadow. 1998. ElevatedCO2 and tree root growth: contrasting responses in Fraxinus excel-sior, Quercus petraea and Pinus sylvestris. New Phytol. 138:241–250.
Curtis, P.S. and J.A. Teeri. 1992. Seasonal responses of leaf gas ex-change to elevated carbon dioxide in Populus grandidentata. Can.J. For Res. 22:1320–1325.
Curtis, P.S., D.R. Zak, K.S. Pregitzer and J.A. Teeri. 1994. Above-and below-ground response of Populus grandidentata to elevatedatmospheric CO2 and soil N availability. Plant Soil 165:45–51.
DeBell, D.S. and A. Harrington. 1997. Productivity of Populus inmonoclonal and polyclonal blocks at three spacings. Can. J. For.Res. 27:978–985.
DeLucia, E.H., J.G. Hamilton, S.L. Naidu et al. 1999. Net primaryproduction of a forest ecosystem with experimental CO2 enrich-ment. Science 284:1177–1179.
DeLucia, E.H., K. George and J.G. Hamilton. 2002. Radiation-use ef-ficiency of a forest exposed to elevated concentrations of atmo-spheric carbon dioxide. Tree Physiol. 22:1003–1010.
Dickson, R.E., M.D. Coleman, D.E. Riemenschneider, J.G. Ise-brands, G.E. Hogan and D.F. Karnosky. 1998. Growth of five hy-brid poplar genotypes exposed to interacting elevated CO2 and O3.Can. J. For. Res. 28:1706–1716.
Enquist, B.J. and K.J. Niklas. 2002. Global allocation rules for pat-terns of biomass partitioning in seed plants. Science 295:1517–1519.
Gielen, B. and R. Ceulemans. 2001. The likely impact of rising atmo-spheric CO2 on natural land and managed Populus: a literature re-view. Environ. Pollut. 115:335–358.
Gielen, B., C. Calfapietra, M. Sabatti and R. Ceulemans. 2001. Leafarea dynamics in a poplar plantation under free-air carbon dioxideenrichment. Tree Physiol. 21:1245–1255.
Gielen, B., C. Calfapietra, A. Claus, M. Sabatti and R. Ceulemans.2002. Crown architecture of Populus spp. is differentially modifiedby free-air CO2 enrichment (POPFACE). New Phytol. 153:91–100.
Gower, S.T., C.J. Kucharik and J.M. Norman. 1999. Direct and indi-rect estimation of leaf area index, fAPAR, and net primary produc-tion of terrestrial ecosystems. Remote Sens. Environ. 70:29–51.
Grassi, G., G. Gosse and G. Dos Santos. 1990. Biomass for energyand industry. Vol. I. In Policy, Environment, Production and Har-vesting. Elsevier Applied Science, London, 697 p.
Green, D.S., E.L. Kruger, G.R. Stanosz and J.G. Isebrands. 2001.Light-use efficiency of native and hybrid poplar genotypes at highlevels of intracanopy competition. Can. J. For. Res. 31:1030–1037.
Hamilton, J.G., E.H. DeLucia, K. George, S.L. Naidu, A.C. Finzi andW.H. Schlesinger. 2002. Forest carbon balance under elevatedCO2. Oecologia 131:250–260.
Hansen, E.A. 1991. Poplar woody biomass yields: a look to the future.Biomass Bioenergy 1:1–7.
TREE PHYSIOLOGY ONLINE at http://heronpublishing.com
EFFECT OF ELEVATED CO2 ON BIOMASS IN POPLARS 813
by guest on March 21, 2016
http://treephys.oxfordjournals.org/D
ownloaded from
Heilman, P.E., G. Ekuan and D. Fogle. 1994. Above- and below-ground biomass and fine roots of 4-year-old hybrids of Populustrichocarpa × Populus deltoides and parental species in short-rota-tion culture. Can. J. For. Res. 24:1186–1192.
Hendrey, G.R., K.F. Lewin and J. Nagy. 1993. Free air carbon dioxideenrichment: development, progress, results. Vegetatio 104/105:17–31.
Hohenstein, W.G. and L.L. Wright. 1994. Biomass energy productionin the United States—an overview. Biomass Bioenergy 6:161–173.
Jourez, B., A. Riboux and A. Leclerq. 2001. Comparison of basicdensity and longitudinal shrinkage in tension wood and oppositewood in young stems of Populus euramericana cv. Ghoy whensubjected to a gravitational stimulus. Can. J. For. Res. 31:1676–1683.
Karnosky, D.F., B. Gielen, R. Ceulemans, W.H. Schlesinger, R.J.Norby, E. Oksanen, R. Matyssek and G.R. Hendrey. 2001. FACEsystems for studying the impacts of greenhouse gases on forestecosystems. In The Impact of Carbon Dioxide and Other Green-house Gases on Forest Ecosystems. Eds. D.F. Karnosky, R.Ceulemans, G.E. Scarascia-Mugnozza and J.L. Innes. CABI,Wallingford, U.K., pp 297–324.
Keeney, D.R. and D.W. Nelson. 1982. Nitrogen inorganic forms. InMethods of Soil Analysis. Part 2. Eds. A.L. Page, R.H. Miller andD.R. Keeney. American Society of Agronomy, Madison, WI, pp643–698.
Kellogg, R.M. and E.P. Swan. 1986. Physical properties of black cot-tonwood and balsam poplar. Can. J. For. Res. 16:491–496.
King, J.S., K.S. Pregitzer, D.R. Zak, J. Sober, J.G. Isebrands, R.E.Dickson, G.R. Hendrey and D.F. Karnosky. 2001. Fine-root bio-mass and fluxes of soil carbon in young stands of paper birch andtrembling aspen as affected by elevated atmospheric CO2 and tro-pospheric O3. Oecologia 128:237–250.
Kubiske, M.E., K.S. Pregitzer, C.J. Mikan, D.R. Zak, J.L. Maziaszand J.A. Teeri. 1997. Populus tremuloides photosynthesis andcrown architecture in response to elevated CO2 and soil N availabil-ity. Oecologia 110:328–336.
Littell, R.C., G.A. Milliken, W.W. Stroup and R.D. Wolfinger. 1996.SAS System for mixed models. SAS Institute, Cary, NC, 633 p.
Lloyd, J. and G.D. Farquhar. 2000. Do slow-growing species and nu-trient stressed plants consistently respond less to elevated CO2? Aclarification of some issues raised by Poorter (1998). GlobalChange Biol. 6:871–876.
Loewe, A., W. Einig, L. Shi, P. Dizengremel and R. Hampp. 2000.Mycorrhiza formation and elevated CO2 both increase the capacityfor sucrose synthesis in source leaves of spruce and aspen. NewPhytol 145:565–574.
Lukac, M., C. Calfapietra and D. Godbold. 2003. Production, turn-over and mycorrhizal colonisation of root systems of three Populusspecies grown under elevated CO2 (POPFACE). Global ChangeBiol. In press.
MacPherson, G. 1995. Home-grown energy from short-rotation cop-pice. Farming Press Books, Ipswich, U.K., 214 p.
Miglietta, F., A. Peressotti, F.P. Vaccari, A. Zaldei, P. De Angelis andG. Scarascia-Mugnozza. 2001. Free-air CO2 enrichment (FACE)of a poplar plantation: the POPFACE fumigation system. NewPhytol. 150:465–476.
Monteith, J.L. 1972. Solar radiation and productivity in tropical eco-systems. J. Appl. Ecol. 9:747–766.
Monteith, J.L. 1977. Climate and efficiency of crop production inBritain. Philos. Trans. R. Soc. Lond. B Biol. Sci. 281:277–294.
Norby, R.J. 1996. Forest canopy productivity index. Nature 381:564.Norby, R.J., S.D. Wullschleger, C.A. Gunderson and C.T. Nietch.
1995. Increased growth efficiency of Quercus alba trees in a CO2-enriched atmosphere. New Phytol. 131:91–97.
Norby, R.J., S.D. Wullschleger, C.A. Gunderson, D.W. Johnson andR. Ceulemans. 1999. Tree responses to rising CO2 in field experi-ments: implications for the future forest. Plant Cell Environ. 22:683–714.
Norby, R.J., D.E. Todd, J. Fults and D.W. Johnson. 2001. Allometricdetermination of tree growth in a CO2-enriched sweetgum stand.New Phytol. 150:477–487.
Oechel, W.C. and B.R. Strain. 1985. Native species responses to in-creased atmospheric carbon dioxide concentration. In Direct Ef-fects of Increasing Carbon Dioxide on Vegetation. Eds. B.R. Strainand J.D. Cure. Department of Energy, Office of Basic Energy Sci-ences, Carbon Dioxide Research Division, Springfield, VA, Wash-ington, DC, pp 117–154.
Poorter, H. 1998. Do slow-growing species and nutrient-stressedplants respond relatively strongly to elevated CO2? Global ChangeBiol. 4:693–697.
Pregitzer, K.S., D.R. Zak, P.S. Curtis, M.E. Kubiske, J.A. Teeri andC.S. Vogel. 1995. Atmospheric CO2, soil nitrogen and turnover offine roots. New Phytol. 129:579–585.
Radoglou, K.M. and P.G. Jarvis. 1990. Effects of CO2 enrichment onfour poplar genotypes. I. Growth and leaf anatomy. Ann. Bot.65:617–626.
Rey, A. and P.G. Jarvis. 1997. Growth response of young birch trees(Betula pendula Roth.). In Impacts of Global Change on TreePhysiology and Forest Ecosytems. Eds. G.M.J. Mohren, K.Kramer and S. Sabaté, Kluwer Academic Publishers, Dordrecht,The Netherlands, pp 207–212.
Saxe, H., D.S. Ellsworth and J. Heath. 1998. Tree and forest function-ing in an enriched CO2 atmosphere. Tansley Review No. 98. NewPhytol. 139:395–436.
Schlesinger, W.H. 1997. Biogeochemistry and analysis of globalchange. 2nd Edn. Academic Press, New York, 592 p.
Singh, T. 1986. Wood density variation of six major tree species of theNorthwest Territories. Can. J. For. Res. 16:127–129.
Stettler, R.F. and P.E. Heilman. 1984. Short-rotation poplar culture inthe Pacific Northwest: components of a genetic program. In Ecol-ogy and Management of Forest Biomass Production Systems. Ed.K. Perttu. Swed. Univ. Agric. Sci. Dep. Ecol. Environ. Res. Rep.15:217–232.
Tissue, D.T., R.B. Thomas and B.R. Strain. 1997. Atmospheric CO2
enrichment increases growth and photosynthesis in Pinus taeda: a4-year experiment in the field. Plant Cell Environ. 20:1123–1134.
Tognetti, R., A. Longobucco, A. Raschi, F. Miglietta and I. Fumagalli.1999. Responses of two Populus clones to elevated atmosphericCO2 concentration in the field. Ann. For. Sci. 56:493–500.
Wait, D.A., C.G. Jones, J. Wynn and F.I. Woodward. 1999. The frac-tion of expanding to expanded leaves determines the biomass re-sponse of Populus to elevated CO2. Oecologia 121:193–200.
Zavitkovski, J. 1982. Characterization of light climate under canopiesof intensively cultured hybrid poplar plantations. Agric. Meteorol.25:245–255.
814 CALFAPIETRA ET AL.
TREE PHYSIOLOGY VOLUME 23, 2003
by guest on March 21, 2016
http://treephys.oxfordjournals.org/D
ownloaded from