Water-use efficiency of a poplar plantation in Northern China
10
ORIGINAL ARTICLE Water-use efficiency of a poplar plantation in Northern China Jie Zhou • Zhiqiang Zhang • Ge Sun • Xianrui Fang • Tonggang Zha • Jiquan Chen • Asko Noormets • Junting Guo • Steve McNulty Received: 25 December 2012 / Accepted: 7 February 2014 Ó The Japanese Forest Society and Springer Japan 2014 Abstract The water-use efficiency (WUE) of an eco- system—defined as the gross ecosystem production (GEP) divided by the evapotranspiration (ET)—is an important index for understanding the coupling of water and carbon and quantifying water–carbon trade-offs in forests. An open-path eddy covariance technique and a microclimate measurement system were deployed to investigate the WUE of a poplar plantation ecosystem in the Daxing District of Beijing, China, during the growing seasons in 2006, 2007, and 2008. We found that WUE values changed diurnally, peaking in early morning and showing a mini- mum between 2 pm and 3 pm. This pattern was regulated by photosynthetically active radiation, saturated vapor pressure deficit, and stomatal opening and closure. WUE had inter-daily variations but no substantial seasonal vari- ation. The WUE decreased with increasing soil water content due to the higher sensitivity of ET than GEP to increased soil moisture. Under moist soil conditions (i.e., relative extractable water content [ 0.4), GEP was stable and WUE was generally low. These results suggest that the poplar plantation does not effectively use the available soil water for carbon uptake, and that soil moisture is lost to the atmosphere through ET. Keywords Ecosystem water-use efficiency Evapotranspiration Gross ecosystem productivity Poplar plantation Introduction Forests cover about 31 % of the land surface, and represent a persistent carbon sink (Woodwell et al. 1978; Post et al. 1982; Vitousek 1991; Wright et al. 2000; Pan et al. 2011) that slows the increase in the concentration of carbon dioxide (CO 2 ) in the atmosphere and thus global warming (Dilling et al. 2003; IPCC 2007). China has the largest acreage of manmade forests in the world today, and poplar (i.e., Populus sp.) plantations account for about 14 % of the total acreage devoted to plantations in China (Chinese Forestry Society 2003), making it the most important tree species employed for afforestation in Northern China. As it is a fast-growing species, poplar exhibits high biomass accumulation but also high rates of water loss (Pearce and Rowe 1979; Gordon et al. 1998; Farley et al. 2005). However, water shortages in northern China are becoming increasingly serious, making them the limiting factor in J. Zhou Z. Zhang (&) X. Fang T. Zha J. Guo Key Laboratory of Soil and Water Conservation and Desertification Combating, Ministry of Education, College of Soil and Water Conservation, Beijing Forestry University, Beijing 100083, People’s Republic of China e-mail: [email protected]; [email protected] J. Zhou Beijing Municipal Station of Agro-Environmental Monitoring, Beijing 100029, People’s Republic of China G. Sun S. McNulty Eastern Forest Environmental Threat Assessment Center, USDA Forest Service, Raleigh, NC, USA J. Chen Department of Environmental Sciences, University of Toledo, Toledo, OH, USA A. Noormets Department of Forestry and Environmental Resources, North Carolina State University, Raleigh, NC, USA J. Guo Institute of Wetland Research, Chinese Academy of Forestry, Beijing 100091, People’s Republic of China 123 J For Res DOI 10.1007/s10310-014-0436-3
Transcript of Water-use efficiency of a poplar plantation in Northern China

ORIGINAL ARTICLE
Water-use efficiency of a poplar plantation in Northern China
Jie Zhou • Zhiqiang Zhang • Ge Sun •
Xianrui Fang • Tonggang Zha • Jiquan Chen •
Asko Noormets • Junting Guo • Steve McNulty
Received: 25 December 2012 / Accepted: 7 February 2014
� The Japanese Forest Society and Springer Japan 2014
Abstract The water-use efficiency (WUE) of an eco-
system—defined as the gross ecosystem production (GEP)
divided by the evapotranspiration (ET)—is an important
index for understanding the coupling of water and carbon
and quantifying water–carbon trade-offs in forests. An
open-path eddy covariance technique and a microclimate
measurement system were deployed to investigate the
WUE of a poplar plantation ecosystem in the Daxing
District of Beijing, China, during the growing seasons in
2006, 2007, and 2008. We found that WUE values changed
diurnally, peaking in early morning and showing a mini-
mum between 2 pm and 3 pm. This pattern was regulated
by photosynthetically active radiation, saturated vapor
pressure deficit, and stomatal opening and closure. WUE
had inter-daily variations but no substantial seasonal vari-
ation. The WUE decreased with increasing soil water
content due to the higher sensitivity of ET than GEP to
increased soil moisture. Under moist soil conditions (i.e.,
relative extractable water content [0.4), GEP was stable
and WUE was generally low. These results suggest that the
poplar plantation does not effectively use the available soil
water for carbon uptake, and that soil moisture is lost to the
atmosphere through ET.
Keywords Ecosystem water-use efficiency �Evapotranspiration � Gross ecosystem productivity �Poplar plantation
Introduction
Forests cover about 31 % of the land surface, and represent
a persistent carbon sink (Woodwell et al. 1978; Post et al.
1982; Vitousek 1991; Wright et al. 2000; Pan et al. 2011)
that slows the increase in the concentration of carbon
dioxide (CO2) in the atmosphere and thus global warming
(Dilling et al. 2003; IPCC 2007). China has the largest
acreage of manmade forests in the world today, and poplar
(i.e., Populus sp.) plantations account for about 14 % of the
total acreage devoted to plantations in China (Chinese
Forestry Society 2003), making it the most important tree
species employed for afforestation in Northern China. As it
is a fast-growing species, poplar exhibits high biomass
accumulation but also high rates of water loss (Pearce and
Rowe 1979; Gordon et al. 1998; Farley et al. 2005).
However, water shortages in northern China are becoming
increasingly serious, making them the limiting factor in
J. Zhou � Z. Zhang (&) � X. Fang � T. Zha � J. Guo
Key Laboratory of Soil and Water Conservation and
Desertification Combating, Ministry of Education, College of
Soil and Water Conservation, Beijing Forestry University,
Beijing 100083, People’s Republic of China
e-mail: [email protected]; [email protected]
J. Zhou
Beijing Municipal Station of Agro-Environmental Monitoring,
Beijing 100029, People’s Republic of China
G. Sun � S. McNulty
Eastern Forest Environmental Threat Assessment Center, USDA
Forest Service, Raleigh, NC, USA
J. Chen
Department of Environmental Sciences, University of Toledo,
Toledo, OH, USA
A. Noormets
Department of Forestry and Environmental Resources, North
Carolina State University, Raleigh, NC, USA
J. Guo
Institute of Wetland Research, Chinese Academy of Forestry,
Beijing 100091, People’s Republic of China
123
J For Res
DOI 10.1007/s10310-014-0436-3

forest production. Thus, recently, much research attention
has focused on how best to use the limited water resources
of Northern China and how to improve the efficiency of
water use by manmade forests in this region.
Ecosystem water-use efficiency (WUE)—the ratio of
CO2 assimilation to water loss (Law et al. 2002; Yu et al.
2008)—is used to characterize and define the trade-off
between the water loss and carbon gain of an ecosystem
(Yu et al. 2004). Additionally, the WUE is as an effective
way to assess ecosystem response to climate change
(Baldocchi 1994; Bacon 2004; Hu et al. 2008; Beer et al.
2009). Therefore, studies on the ecosystem WUE of poplar
plantations are helpful when attempting to understand and
quantify how much water the plants need in order to
assimilate a certain amount of carbon, and to determine
how future climate-warming-induced hydrological changes
will impact the carbon budgets of poplar plantation eco-
systems. Eddy covariance (EC) systems measure both CO2
and water vapor exchange between ecosystems and the
atmosphere at a high temporal resolution (Wofsy et al.
1993). These measurements provide a unique approach to
quantifying the characteristics of ecosystem gross ecosys-
tem productivity (GEP), evapotranspiration (ET), and
WUE, as well as their responses to global climate change
(Law et al. 2002; Baldocchi 2003; Barr et al. 2007). Pre-
vious studies of variations in ecosystem WUE found that
there were similar diurnal variations (Scanlon and Albert-
son 2004; Testi et al. 2008; Tong et al. 2009) but different
seasonal variations of the ecosystem WUE in various for-
ests (Reichstein et al. 2002; Ponton et al. 2006; Yu et al.
2008; Migliavacca et al. 2009). Some studies found that the
ecosystem WUE was lower during severe droughts (Teskey
et al. 1994; Reichstein et al. 2002; Migliavacca et al. 2009),
while some other studies showed that the WUE increased
during moderate drought (Linderson et al. 2007; Yu et al.
2008). The various results for the seasonal variation in the
WUE stem in part from the different influences of envi-
ronmental factors on carbon sequestration and water loss
(Veron et al. 2002) and from the various responses of the
WUE to environmental variables in different tree species.
Numerous studies have been conducted in China on
poplar plantations over the last 20 years in terms of bio-
mass measurement, biomass production and growth mod-
eling, water use, and the relationships between stem
density and physiological traits of poplar varieties (Cao
et al. 2002; Peng et al. 2003; Xue and Yang 2004; Liang
et al. 2006), but detailed studies on the relationship
between carbon gain and water loss and their environ-
mental controls at the ecosystem level are lacking. There-
fore, an open-path eddy covariance system and an
automatic micro-meteorology system were used to con-
tinually measure the carbon, water, and energy exchanges
between the canopy of a 10-year-old poplar plantation and
the atmosphere in the Daxing District of Beijing, China
from 2006 to 2008. Our objectives were (1) to quantify the
diurnal and seasonal variability of the ecosystem WUE of a
poplar plantation, and (2) to determine the effects of
environmental factors on the ecosystem WUE at different
temporal scales.
Materials and methods
Study site
The study was conducted in a 10-year-old poplar plantation
(Populus euramericana cv. ‘‘74/76’’) at the Daxing Forest
Farm (116�1500700E, 39�3105000N, and elevation 30 m),
located in a suburb of Beijing, China. The plantation covers
an area of 0.8 km2 and the density of planting was
3 m 9 2 m. The average height and root depth of the trees
were 14.8 ± 1.2 and 1.86 ± 1.02 m by the end of 2008,
respectively, and the leaf area index (LAI) of the stand was
2.1 ± 0.6. The understory vegetation was sparse, contain-
ing perennial herbs such as Chenopodium glaucum Linn.,
Medicago sativa L., Melilotus officinalis (L.) Lam., Salsola
collina Pall., and Tribulus terrestris L. The mean annual
(i.e., 1952–2000) precipitation is 569 mm, of which
*65 % occurs between July and September. The mean
annual (i.e., 1990–2009) temperature is 11.5 �C, as recor-
ded at the Daxing Weather Station (116�1905600E,
39�4302400N). The top two meters of the soil profile were
largely composed of well-drained fluvial sand with a pH of
8.3 and a bulk density of 1.45 g cm-3. Further details are
available in Zhou et al. (2013).
Field measurements
An open-path EC flux measurement system was deployed
at the center of the study site for long-term measurements
of CO2, water vapor, and energy fluxes from 2006 to 2008.
Footprint analysis using an analytical model (Hsieh et al.
2000) suggested that 80 % of the footprint contribution was
in the range of the measurement region (Zhou et al. 2013).
To obtain sufficient fetch, a CO2/H2O infrared gas analyzer
(LI-7500, Li-Cor Inc., Lincoln, NE, USA) and a three-
dimensional ultrasonic anemometer (CSAT3, Campbell
Scientific, Inc., Logan, UT, USA) were mounted 16 m
above ground level (AGL) in 2006 and lifted to 18 m AGL
in 2007 and 2008. The raw 10-Hz data were logged into a
CR5000 data logger (Campbell Scientific, Inc.).
Net radiation (Rn) and photosynthetically active radiation
(PAR) were measured using a net radiometer (Q7.1, REBS,
Seattle, WA, USA) and a quantum sensor (LI190 SB-L, Li-
Cor Inc.) at 16 m AGL in 2006 and 18 m AGL in 2007 and
2008, respectively. Precipitation (P) and atmospheric
J For Res
123
pressure were measured at heights of 16 m AGL and 13 m
AGL in 2006 and of 18 m AGL and 21 m AGL in 2007 and
2008 using a tipping-bucket rain gauge (TE525-L, Camp-
bell Scientific, Inc.) and an air pressure gauge (CS105,
Campbell Scientific, Inc.). Air temperature (Ta) and relative
humidity were measured at four levels (2, 6, 10, and 14 m
AGL in 2006 and 5, 10, 15, and 20 m AGL in 2007 and
2008) using relative humidity and air temperature sensors
(HMP45C probe, Campbell Scientific, Inc.).
Soil temperature profiles and soil heat fluxes were
measured by soil temperature sensors (TCAV107, Camp-
bell Scientific, Inc.) and soil heat plates (HFT3, REBS) at
depths of 5, 10, and 20. Volumetric soil water contents
(VWC) were measured at depths of 20 and 50 cm by a
time-domain reflectometry (TDR) soil moisture device
(CS616, Campbell Scientific, Inc.). All micrometeorologi-
cal data were stored at 30-min intervals on a data logger
(CR5000, Campbell Scientific, Inc.).
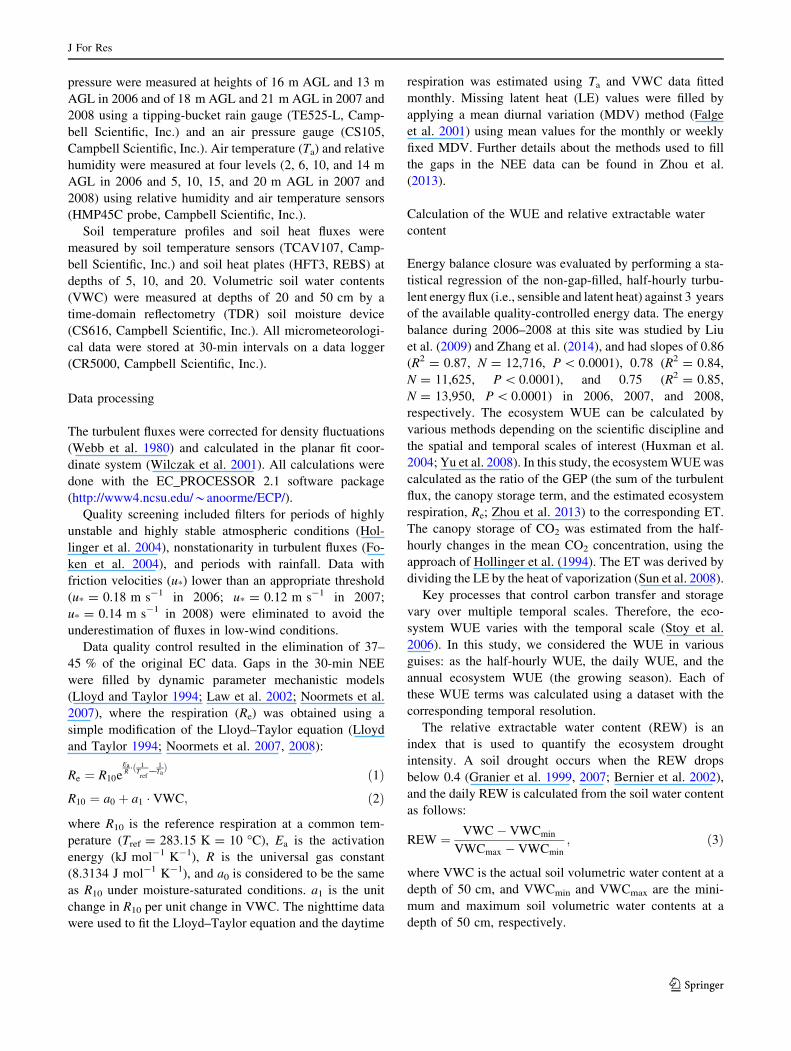
Data processing
The turbulent fluxes were corrected for density fluctuations
(Webb et al. 1980) and calculated in the planar fit coor-
dinate system (Wilczak et al. 2001). All calculations were
done with the EC_PROCESSOR 2.1 software package
(http://www4.ncsu.edu/*anoorme/ECP/).
Quality screening included filters for periods of highly
unstable and highly stable atmospheric conditions (Hol-
linger et al. 2004), nonstationarity in turbulent fluxes (Fo-
ken et al. 2004), and periods with rainfall. Data with
friction velocities (u*) lower than an appropriate threshold
(u* = 0.18 m s-1 in 2006; u* = 0.12 m s-1 in 2007;
u* = 0.14 m s-1 in 2008) were eliminated to avoid the
underestimation of fluxes in low-wind conditions.
Data quality control resulted in the elimination of 37–
45 % of the original EC data. Gaps in the 30-min NEE
were filled by dynamic parameter mechanistic models
(Lloyd and Taylor 1994; Law et al. 2002; Noormets et al.
2007), where the respiration (Re) was obtained using a
simple modification of the Lloyd–Taylor equation (Lloyd
and Taylor 1994; Noormets et al. 2007, 2008):
Re ¼ R10eEaR�ð 1
Tref
1TaÞ ð1Þ
R10 ¼ a0 þ a1 � VWC; ð2Þ
where R10 is the reference respiration at a common tem-
perature (Tref = 283.15 K = 10 �C), Ea is the activation
energy (kJ mol-1 K-1), R is the universal gas constant
(8.3134 J mol-1 K-1), and a0 is considered to be the same
as R10 under moisture-saturated conditions. a1 is the unit
change in R10 per unit change in VWC. The nighttime data
were used to fit the Lloyd–Taylor equation and the daytime
respiration was estimated using Ta and VWC data fitted
monthly. Missing latent heat (LE) values were filled by
applying a mean diurnal variation (MDV) method (Falge
et al. 2001) using mean values for the monthly or weekly
fixed MDV. Further details about the methods used to fill
the gaps in the NEE data can be found in Zhou et al.
(2013).
Calculation of the WUE and relative extractable water
content
Energy balance closure was evaluated by performing a sta-
tistical regression of the non-gap-filled, half-hourly turbu-
lent energy flux (i.e., sensible and latent heat) against 3 years
of the available quality-controlled energy data. The energy
balance during 2006–2008 at this site was studied by Liu
et al. (2009) and Zhang et al. (2014), and had slopes of 0.86
(R2 = 0.87, N = 12,716, P \ 0.0001), 0.78 (R2 = 0.84,
N = 11,625, P \ 0.0001), and 0.75 (R2 = 0.85,
N = 13,950, P \ 0.0001) in 2006, 2007, and 2008,
respectively. The ecosystem WUE can be calculated by
various methods depending on the scientific discipline and
the spatial and temporal scales of interest (Huxman et al.
2004; Yu et al. 2008). In this study, the ecosystem WUE was
calculated as the ratio of the GEP (the sum of the turbulent
flux, the canopy storage term, and the estimated ecosystem
respiration, Re; Zhou et al. 2013) to the corresponding ET.
The canopy storage of CO2 was estimated from the half-
hourly changes in the mean CO2 concentration, using the
approach of Hollinger et al. (1994). The ET was derived by
dividing the LE by the heat of vaporization (Sun et al. 2008).
Key processes that control carbon transfer and storage
vary over multiple temporal scales. Therefore, the eco-
system WUE varies with the temporal scale (Stoy et al.
2006). In this study, we considered the WUE in various
guises: as the half-hourly WUE, the daily WUE, and the
annual ecosystem WUE (the growing season). Each of
these WUE terms was calculated using a dataset with the
corresponding temporal resolution.
The relative extractable water content (REW) is an
index that is used to quantify the ecosystem drought
intensity. A soil drought occurs when the REW drops
below 0.4 (Granier et al. 1999, 2007; Bernier et al. 2002),
and the daily REW is calculated from the soil water content
as follows:
REW ¼ VWC� VWCmin
VWCmax � VWCmin
; ð3Þ
where VWC is the actual soil volumetric water content at a
depth of 50 cm, and VWCmin and VWCmax are the mini-
mum and maximum soil volumetric water contents at a
depth of 50 cm, respectively.
J For Res
123

Results
Meteorology
Figure 1 illustrates the seasonal variations in air tem-
perature (Ta), vapor pressure deficit (VPD), precipitation,
and soil water content in 2006, 2007, and 2008,
respectively. The daily mean Ta during the 2008 growing
season was 20.5 ± 0.5 �C, which was a little lower than
those in 2006 (21.3 ± 0.6 �C) and 2007 (21.9 ± 0.6 �C)
(Fig. 1a–c).
Precipitation differed among the 3 years, in terms of
both amount and seasonal distribution (Fig. 1d–f). The
year 2006 was dry with a total precipitation of 433 mm
during the growing season (April–October). Although
irrigation (35 mm in April and 21 mm in May) was
applied during growing season, the total water supply in
2006 was also less than the multi-year (1990–2009)
mean rainfall of 527 mm (Zhang et al. 2014). The pre-
cipitation was 631 and 632 mm during the growing
seasons of 2007 and 2008, respectively. However, there
was a drought period in 2007 during April to June, and a
much lower VPD was observed in 2008 (especially in
the spring) compared with those of 2006 and 2007
(Fig. 1a–c).
Seasonal changes in REW closely followed the varia-
tions in precipitation (Fig. 1d–f). A long dry period in 2006
and 2007 resulted in severe water deficits in the autumn of
2006 and spring of 2007 when the REW dropped below
0.4. However, no lasting drought was observed in 2008.
Diurnal and seasonal variations in WUE
The instantaneous WUE showed a diurnal trend, with a
primary maximum WUE ranging from 3 to 5 g C kg-1
H2O in the early morning and a secondary maximum
ranging from 2 to 4 g C kg-1 H2O in the evening (Fig. 2).
Ecosystem WUE decreased by about 30–60 % during the
daytime compared with the early morning and reached its
minimum between 14:00 and 15:00. Besides, the morning
WUE was higher than that in the afternoon.
Seasonal patterns of the ecosystem GEP, ET, and WUE
from 2006 to 2008 are shown in Fig. 3. The mean daily
WUE during the growing season was 2.3 ± 0.9, 2.4 ± 0.9,
and 2.3 ± 1.1 g C kg-1 H2O in 2006, 2007, and 2008,
respectively. The mean daily GEP was 6.4 ± 2.9,
6.4 ± 2.4, and 7.5 ± 3.8 g C m-2 d-1 in 2006, 2007, and
2008, respectively (Zhou et al. 2013). The mean daily
growing season ET was 2.7 ± 1.3, 2.7 ± 1.2, and
3.3 ± 1.6 kg H2O m-2 d-1 in 2006, 2007, and 2008,
respectively. During the 3-year study, daily GEP and ET
peaked in July or August with rates of 12–15 g C m-2 d-1
and 3.6–4.7 kg H2O m-2 d-1, respectively. However,
ecosystem WUE fluctuated and did not show a seasonal
cycle during the growing seasons.
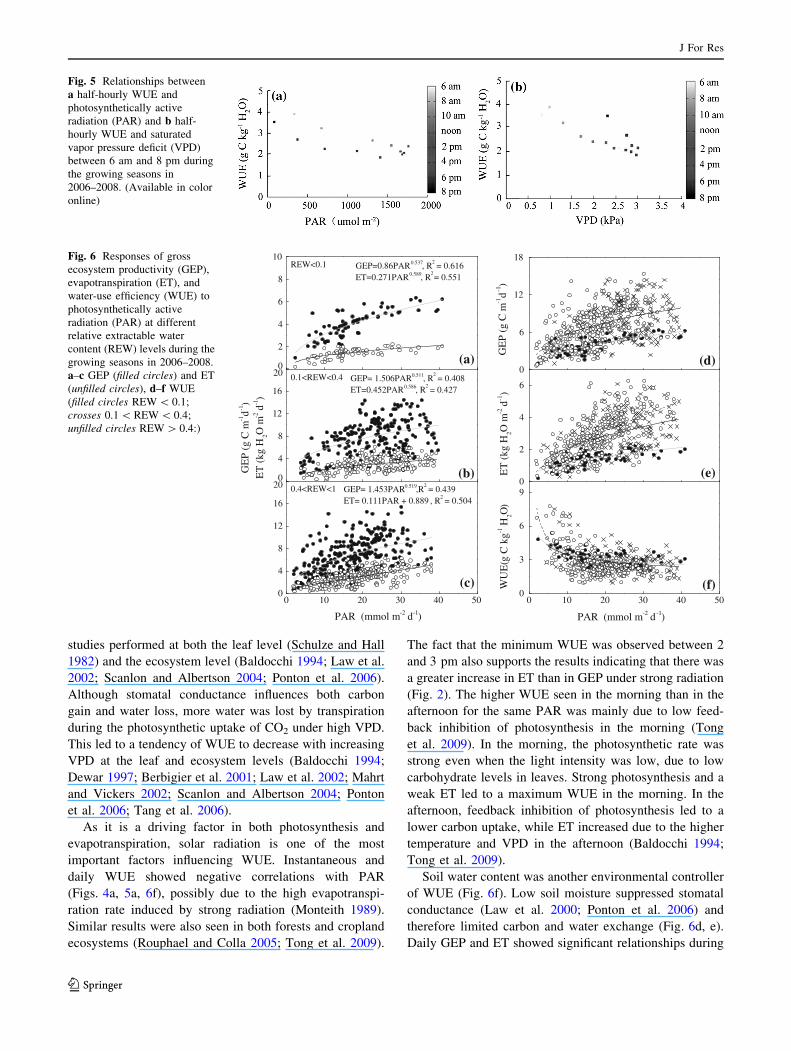
Responses of GEP, ET, and WUE to climate factors
Instantaneous WUE was negatively related to PAR and
VPD (Fig. 4). Therefore, WUE declined with increasing
PAR and VPD until 2 pm or 3 pm, and increased with
decreasing PAR and VPD during the rest of the afternoon
(Fig. 5). However, beginning at sunrise, WUE increased
with increasing PAR and VPD.
GEP and ET (both measured per day) showed positive
correlations with PAR (P \ 0.05), while the sensitivity of
GEP to PAR was different to the sensitivity of ET to PAR,
regardless of the soil moisture conditions present (Fig. 6a–
c). The relatively large increase in ET at low PAR com-
pared to that of GEP led to a tendency of WUE to decrease
10
20
30(b) 2007
100 150 200 250 300
(e)
DOY
(c) 2008
0
2
4
VPD
(kP
a)
Ta
T a (o C
)
2006(a)VPD
100 150 200 250 3000
30
60
90 (d)
P (m
m)
P
REW REW
0.4
100 150 200 250 300
(f)
0.0
0.5
1.0
RE
W
Fig. 1 Seasonal variations in:
daily mean air temperature (Ta)
and daily mean saturated vapor
pressure deficit (VPD) in a2006, b 2007, c 2008; daily
precipitation (P) and relative
extractable water content
(REW; 50 cm) in d 2006, e2007, f 2008
J For Res
123

with increasing PAR under low-PAR conditions (Fig. 6a–
c, f). Neither GEP, ET, nor WUE were significantly cor-
related with VPD on a daily basis (P [ 0.5).
Although the impact of soil water on the daily GEP and
ET was not statistically significant (P [ 0.5, Fig. 7), the
sensitivities of GEP and ET to PAR varied with the REW
(Fig. 6d, e). A power equation was found to give a good fit
to a plot of daily GEP against daily PAR for different
REWs, while a good linear fit was obtained for a plot of
daily ET against PAR when REW [0.4. A low REW
significantly limited ET, and this effect became more
pronounced as PAR increased (Fig. 6e). The slope of the
daily GEP–PAR relationship was smallest when REW
\0.1, but there was no significant effect of soil water on
the relationship between GEP and PAR when
0.1 \ REW \ 0.4 and for REW [ 0.4 (Fig. 6d). Ecosys-
tem GEP and ET were significantly correlated during the
growing seasons of 2006–2008 under various soil water
conditions (i.e., REW \ 0.1: R2 = 0.78, P \ 0.001;
0.1 \ REW \ 0.4: R2 = 0.56, P \ 0.001; REW [ 0.4:
R2 = 0.44, P \ 0.001), but the slope of the GEP–ET
relationship, which is a measure of WUE, declined with
increasing soil moisture (i.e., REW \ 0.1: slope = 2.1,
R2 = 0.78; 0.1 \ REW \ 0.4: slope = 1.6, R2 = 0.56;
REW [ 0.4: slope = 1.4, R2 = 0.44) (Fig. 4).
Discussion
Influence of climate on WUE
The primary environmental driver for changes in the
30-min WUE was the VPD, and thus the cyclical nature of
the VPD resulted in a consistent diurnal cycle for WUE.
The negative linear relationship between WUE and VPD
was due to the limitations of a high VPD on the stomatal
conductance of the plantation, as known from a previous
study performed at this site (Zhou et al. 2013) and other
7:30 10:30 13:30 16:30 19:300
2
4
6
7:30 10:30 13:30 16:30 19:30 7:30 10:30 13:30 16:30 19:30
WU
E (
gC k
g-1 H
2O)
Time of Day
2006
May June July August Sep Oct average
2007 2008
Fig. 2 Diurnal patterns of
instantaneous ecosystem water-
use efficiency (WUE) during the
growing seasons in 2006, 2007,
and 2008. Black lines show the
average instantaneous WUE
during the growing season
0
5
10
15
100 150 200 250 3000
4
8
0
3
6
9
GE
P (g
C m
-1d
-1)
2006 2007 2008
(a)
(c)
WU
E(g
C k
g-1 H
2O)
DOY
(b)
ET
(kg
H2O
m-2 d
-1)
Fig. 3 Seasonal variations in a gross ecosystem productivity (GEP),
b evapotranspiration (ET), and c ecosystem water-use efficiency
(WUE) from 2006 to 2008
Fig. 4 Relationships between awater-use efficiency (WUE) and
photosynthetically active
radiation (PAR) and between bWUE and saturated vapor
pressure deficit (VPD)
J For Res
123
studies performed at both the leaf level (Schulze and Hall
1982) and the ecosystem level (Baldocchi 1994; Law et al.
2002; Scanlon and Albertson 2004; Ponton et al. 2006).
Although stomatal conductance influences both carbon
gain and water loss, more water was lost by transpiration
during the photosynthetic uptake of CO2 under high VPD.
This led to a tendency of WUE to decrease with increasing
VPD at the leaf and ecosystem levels (Baldocchi 1994;
Dewar 1997; Berbigier et al. 2001; Law et al. 2002; Mahrt
and Vickers 2002; Scanlon and Albertson 2004; Ponton
et al. 2006; Tang et al. 2006).
As it is a driving factor in both photosynthesis and
evapotranspiration, solar radiation is one of the most
important factors influencing WUE. Instantaneous and
daily WUE showed negative correlations with PAR
(Figs. 4a, 5a, 6f), possibly due to the high evapotranspi-
ration rate induced by strong radiation (Monteith 1989).
Similar results were also seen in both forests and cropland
ecosystems (Rouphael and Colla 2005; Tong et al. 2009).
The fact that the minimum WUE was observed between 2
and 3 pm also supports the results indicating that there was
a greater increase in ET than in GEP under strong radiation
(Fig. 2). The higher WUE seen in the morning than in the
afternoon for the same PAR was mainly due to low feed-
back inhibition of photosynthesis in the morning (Tong
et al. 2009). In the morning, the photosynthetic rate was
strong even when the light intensity was low, due to low
carbohydrate levels in leaves. Strong photosynthesis and a
weak ET led to a maximum WUE in the morning. In the
afternoon, feedback inhibition of photosynthesis led to a
lower carbon uptake, while ET increased due to the higher
temperature and VPD in the afternoon (Baldocchi 1994;
Tong et al. 2009).
Soil water content was another environmental controller
of WUE (Fig. 6f). Low soil moisture suppressed stomatal
conductance (Law et al. 2000; Ponton et al. 2006) and
therefore limited carbon and water exchange (Fig. 6d, e).
Daily GEP and ET showed significant relationships during
Fig. 5 Relationships between
a half-hourly WUE and
photosynthetically active
radiation (PAR) and b half-
hourly WUE and saturated
vapor pressure deficit (VPD)
between 6 am and 8 pm during
the growing seasons in
2006–2008. (Available in color
online)
2
4
6
8
10
4
8
12
16
20
0 10 20 30 40 500
4
8
12
16
0
6
12
18
0
2
4
6
0 10 20 30 40 500
3
6
9
GE
P (g
C m
-1d-1
)E
T (
kg H
2O m
-2 d
-1)
REW<0.1
(a)
GEP=0.86PAR0.537, R2 = 0.616
ET=0.271PAR0.589, R2 = 0.551
GEP= 1.506PAR0.511, R2 = 0.408
ET=0.452PAR0.586, R2 = 0.427
(b)
0.1<REW<0.4
GEP= 1.453PAR0.519,R2 = 0.439
ET= 0.111PAR + 0.8892 = 0.504
(c)
0.4<REW<1
PAR (mmol m-2 d-1)
(d)
GE
P (g
C m
-1d
-1)
(e) ET
(kg
H2O
m-2 d
-1)
(f)
PAR (mmol m-2 d-1)
WU
E (g
C k
g-1 H
2O), R
0
200
Fig. 6 Responses of gross
ecosystem productivity (GEP),
evapotranspiration (ET), and
water-use efficiency (WUE) to
photosynthetically active
radiation (PAR) at different
relative extractable water
content (REW) levels during the
growing seasons in 2006–2008.
a–c GEP (filled circles) and ET
(unfilled circles), d–f WUE
(filled circles REW \ 0.1;
crosses 0.1 \ REW \ 0.4;
unfilled circles REW [ 0.4:)
J For Res
123

the growing seasons with different soil moisture conditions
(i.e., REW \ 0.1: R2 = 0.78, P \ 0.001; 0.1 \ REW \0.4: R2 = 0.56, P \ 0.001; REW [ 0.4: R2 = 0.44,
P \ 0.001) (Fig. 7). Similar relationships were found
between GEP and ET across various biome types, and the
slope of this relationship can be used to characterize the
ecosystem WUE (Law et al. 2002). Our results suggested
that the slope increased with decreasing soil moisture. Even
though stomatal conductance decreases during a drought,
WUE can increase so long as the internal resistance to CO2
diffusion is kept constant (Yu et al. 2004). Some studies
obtained similar results during moderate droughts at both the
leaf (Huber et al. 1984; Nijs et al. 1989; Liang and Maruy-
ama 1995) and ecosystem (Linderson et al. 2007; Yu et al.
2008) scales. However, during severe drought, WUE
decreased or remained constant (Teskey et al. 1994;
Reichstein et al. 2002; Granier et al. 2007; Migliavacca et al.
2009) due to increased internal resistance to CO2 diffusion
caused by decreased photosynthetic capacity (Baldocchi
et al. 1983). Carbon and water showed more feedbacks at the
ecosystem scale than at the leaf level, so photosynthetic
capacity was not the only reason for the changes in WUE
under water-limited conditions. The fraction of the evapo-
ration that occurs from the forest floor is significant in forest
ecosystems (Baldocchi and Ryu 2011). The low LAI
observed at this site probably supports the notion that the
forest floor makes a significant contribution. When the
shallow layer is dry, the contribution of the forest floor to
evapotranspiration becomes small, but poplars can maintain
transpiration by taking up water through their deep root
systems. Therefore, in our study, WUE was higher under
low soil water conditions, even when the soil water content
was lower than the wilting point (i.e., WP, VWC = 6 %,
REW = 0.2) (Tan et al. 2009) (Fig. 6d–f).
Comparison with other ecosystems
Reported ecosystem-level WUE values of different forests
are briefly summarized in Table 1. Compared to another
poplar plantation forest of a similar age and soil type, the
GEP was similar during the growing season but WUE was
0 2 4 6 8
0
4
8
12
16
GE
P (g
C m
-1d
-1)
ET (kg H2O m-2 d-1)
Fig. 7 Relationship between gross ecosystem productivity (GEP) and
evapotranspiration (ET) for different relative extractable water
contents (REWs) (filled circles 0 \ REW \ 0.1; crosses
0.1 \ REW \ 0.4; unfilled circles REW [ 0.4:) during the growing
seasons in 2006–2008. Regression lines: REW \ 0.1: GEP =
2.11ET ? 1.889, R2 = 0.779; 0.1 \ REW \ 0.4: GEP =
1.63ET ? 2.845, R2 = 0.562; REW [ 0.4: GEP = 1.41ET ? 2.497,
R2 = 0.437
Table 1 Average annual ecosystem water-use efficiency (WUE) of different ecosystems
Ecosystem type Latitude, longitude WUE (g C kg-1 H2O) Reference
Ponderosa pine 44�300N, 121�370W 3.0 Law et al. (2000)
Maritime pine 44�420N, 0�460W 0.9 Berbigier et al. (2001)
Young Jack pine 53�520N, 104�380 W 1.0 Mahrt and Vickers (2002)
Aspen 55�530N, 98�400W 2.3 Mahrt and Vickers, (2002)
Deciduous broadleaf forest 2�–65�N, 20�W–25�E 0.9 Law et al. (2002)
Evergreen conifer forest 2o–65�N, 20�W–25�E 0.8 Law et al. (2002)
Aspen 53�380N, 106�120W 3.6a Ponton et al. (2006)
Douglas fir 49�540N, 125�220W 5.4a Ponton et al. (2006)
Deciduous forest 42�240N, 128�050E 2.6 Yu et al. (2008)
Conifer plantation forest 26�440 N, 115�030E 2.5 Yu et al. (2008)
Evergreen broadleaf forest 23�100N, 112�320E 1.9 Yu et al. (2008)
Poplar plantation 45�120N, 9�030E 3.6b Migliavacca et al. (2009)
Hybrid poplar plantation 54�180N, 111�300W 1.7 Cai et al. (2011)
Poplar plantation 39�310N, 116�150E 2.3b This research
a Daily averageb Growing season
J For Res
123

56 % lower at our site, which was largely because the ET
was 25 % higher in our study (Migliavacca et al. 2009).
Cai et al. (2011) reported the carbon and water fluxes of a
5-year-old hybrid poplar plantation, which indicated a
52 % lower annual ET, a 65 % lower annual GEP, and a
26 % lower WUE than at our study site. The WUE of a
boreal aspen forest was 56 % higher (Ponton et al. 2006)
due to a 28 % lower annual ET and a 7 % lower annual
GEP than in the current study (Barr et al. 2007). Besides,
Mahrt and Vickers (2002) reported a similar WUE for
aspen from the southern study area of the Boreal Ecosys-
tem and Atmospheric Study. In addition, WUE was 13 %
lower in our study due to a 9 % higher GEP and a 17 %
higher ET compared with those of another deciduous forest
at a higher latitude in eastern China (Yu et al. 2008).
We found diurnal WUE patterns at our study site that
were similar to those previously reported (Baldocchi 1994;
Lindroth and Cienciala 1996; Moren et al. 2001; Scanlon
and Albertson 2004; Testi et al. 2008; Tong et al. 2009),
while the seasonal variation in WUE was different
(Reichstein et al. 2002; Ponton et al. 2006; Yu et al. 2008;
Migliavacca et al. 2009). Reichstein et al. (2002) and Yu
et al. (2008) found that the maximum WUE occurred in
wet ecosystems in winter, whereas the minimum occurred
during the peak vegetation season. However, other studies
found no apparent seasonal trend in WUE during the
growing season (Ponton et al. 2006; Yu et al. 2008). In our
study, although there was substantial inter-daily variation
in the WUE, no seasonal variation was observed during the
growing season. This may suggest that the seasonal chan-
ges in WUE were due to factors such as site conditions,
climate, and vegetation type, including the understory and
growing season length (Veron et al. 2002).
Conclusions
The WUE of the poplar plantation forest examined in this
study presented no apparent seasonal variations, but did
show a significant diurnal trend during the growing season.
Maximum WUE was observed in the morning, and mini-
mum WUE was seen between 2 and 3 pm. This was reg-
ulated by stomatal closure and VPD. Seasonally, there was
substantial inter-daily variation in WUE due to the influ-
ences of both the PAR and the soil water conditions. A
higher sensitivity of ET than GEP to soil moisture led to a
decreasing ecosystem WUE with increasing soil moisture.
Therefore, soil moisture was not effectively used by carbon
uptake. Instead, soil water was returned to the atmosphere
through evapotranspiration.
Acknowledgments This study was financially supported by the
National Special Research Program for Forestry entitled ‘‘Forest
Management Affecting the Coupling of Ecosystem Carbon and Water
Exchange with Atmosphere’’ (grant no. 201204102) and the USDA
Forest Service Eastern Forest Environmental Threat Assessment
Center. This study was also partially supported by the US–China
Carbon Consortium (USCCC), the Natural Science Foundation of
China (30928002), NASA-NEWS, and the NASA LUCC Program
(NNX09AM55G).
References
Bacon MA (2004) Water use efficiency in plant biology. Wiley-
Blackwell, Oxford
Baldocchi D (1994) A comparative study of mass and energy
exchange rates over a closed C3 (wheat) and an open C4 (corn)
crop: II. CO2 exchange and water use efficiency. Agr Forest
Meteorol 67:291–321
Baldocchi DD (2003) Assessing the eddy covariance technique for
evaluating carbon dioxide exchange rates of ecosystems: past,
present and future. Glob Chang Biol 9:479–492
Baldocchi DD, Ryu Y (2011) A synthesis of forest evaporation fluxes-
from days to years-as measured with eddy covariance. Ecol Stud
216:101–116
Baldocchi D, Verma S, Rosenberg N, Blad B, Garay A, Specht J
(1983) Influence of water stress on the diurnal exchange of mass
and energy between the atmosphere and a soybean canopy.
Agron J 75:543–548
Barr AG, Black T, Hogg E, Griffis T, Morgenstern K, Kljun N,
Theede A, Nesic Z (2007) Climatic controls on the carbon and
water balances of a boreal aspen forest, 1994–2003. Glob Chang
Biol 13:561–576
Beer C, Ciais P, Reichstein M, Baldocchi D, Law B, Papale D,
Soussana J, Ammann C, Buchmann N, Frank D (2009) Temporal
and among-site variability of inherent water use efficiency at the
ecosystem level. Glob Biogeochem Cycles 23
Berbigier P, Bonnefond JM, Mellmann P (2001) CO2 and water
vapour fluxes for 2 years above Euroflux forest site. Agric For
Meteorol 108:183–197
Bernier P, Breda N, Granier A, Raulier F, Mathieu F (2002)
Validation of a canopy gas exchange model and derivation of a
soil water modifier for transpiration for sugar maple (Acer
saccharum Marsh.) using sap flow density measurement. Forest
Ecol Manag 163:185–196
Cai T, Price DT, Orchansky AL, Thomas BR (2011) Carbon, water,
and energy exchanges of a hybrid poplar plantation during the
first five years following planting. Ecosystems 14:658–671
Cao J, Zhang Y, Liu Y (2002) Changes in forest biomass carbon
storage in Hainan Island over the last 20 years. Geogr Res 5:2
Chinese Forestry Society, National Poplar Commission (2003) Forest
resource, timber production and popular culture in China. In: 1st
Int Conf on the Future of Poplar, Rome, Italy, 13 Nov 2003.
http://www.fao.org/forestry/6240-02fbe2707c128f5d8e1c55e60
b8e1cb94.pdf
Dewar RC (1997) A simple model of light and water use evaluated for
Pinus radiata. Tree Physiol 17:259–265
Dilling L, Doney SC, Edmonds J, Gurney KR, Harriss R, Schimel D,
Stephens B, Stokes G (2003) The role of carbon cycle
observations and knowledge in carbon management. Annu Rev
Environ Resour 28:521–558
Falge E, Baldocchi D, Olson R, Anthoni P, Aubinet M, Bernhofer C,
Burba G, Ceulemans R, Clement R, Dloman H, Granier A, Gross
P, Grunwald T, Hollinger D, Jensen NO, Katul G, Keronen P,
Kowalski A, Lai CT, Law BE, Meyers T, Moncrieff J, Moors E,
Munger JW, Pilegaard K, Rannik U, Rebmann C, Suyker A,
Tenhunen J, Tu K, Werma S, Vesala T, Wilson K, Wofsy S
J For Res
123
(2001) Gap filling strategies for defensible annual sums of net
ecosystem exchange. Agric For Meterol 107:43–69
Farley KA, Jobbagy EG, Jackson RB (2005) Effects of afforestation
on water yield: a global synthesis with implications for policy.
Glob Chang Biol 11:1565–1576
Foken T, Gockede M, Mauder M, Mahrt L, Amiro BD, Munger JW
(2004) Post-field data quality control. In: Lee X, Massman WJ,
Law B (eds) Handbook of micrometeorology: a guide for surface
flux measurement and analysis. Kluwer, Dordrecht, pp 181–208
Gordon M, Choe N, Duffy J, Ekuan G, Heilman P, Muiznieks I,
Ruszaj M, Shurtleff BB, Strand S, Wilmoth J (1998) Phyto-
remediation of trichloroethylene with hybrid poplars. Environ
Health Perspect 106:1001
Granier A, Breda N, Biron P, Villette S (1999) A lumped water
balance model to evaluate duration and intensity of drought
constraints in forest stands. Ecol Model 116:269–283
Granier A, Reichstein M, Breda N, Janssens I, Falge E, Ciais P,
Grunwald T, Aubinet M, Berbigier P, Bernhofer C (2007)
Evidence for soil water control on carbon and water dynamics in
European forests during the extremely dry year: 2003. Agric For
Meteorol 143:123–145
Hollinger DY, Kelliher F, Byers JN, Hunt JE, McSeveny T, Weir P
(1994) Carbon dioxide exchange between an undisturbed old-
growth temperate forest and the atmosphere. Ecology 75:134–150
Hollinger D, Aber J, Dail B, Davidson E, Goltz S, Hughes H, Leclerc
M, Lee J, Richardson A, Rodrigues C (2004) Spatial and
temporal variability in forest–atmosphere CO2 exchange. Glob
Chang Biol 10:1689–1706
Hsieh CI, Katul G, Chi TW (2000) An approximate analytical model
for footprint estimation of scalar fluxes in thermally stratified
atmospheric flows. Adv Water Resour 23:765–772
Hu Z, Yu G, Fu Y, Sun X, Li Y, Shi P, Wang Y, Zheng Z (2008)
Effects of vegetation control on ecosystem water use efficiency
within and among four grassland ecosystems in China. Glob
Chang Biol 14:1609–1619
Huber SC, Rogers HH, Mowry FL (1984) Effects of water stress on
photosynthesis and carbon partitioning in soybean (Glycine max
[L.] Merr.) plants grown in the field at different CO2 levels. Plant
Physiol 76:244–249
Huxman TE, Smith MD, Fay PA, Knapp AK, Shaw MR, Loik ME, Smith
SD, Tissue DT, Zak JC, Weltzin JF (2004) Convergence across
biomes to a common rain-use efficiency. Nature 429:651–654
IPCC (2007) Climate change 2007: the physical science basis. In:
Solomon S, et al. (eds) Contribution of Working Group I to the
Fourth Assessment Report of the Intergovernmental Panel on
Climate Change. Cambridge University Press, Cambridge
Law B, Anthoni P, Aber J (2000) Measurements of gross and net
ecosystem productivity and water vapour exchange of a Pinus
ponderosa ecosystem, and an evaluation of two generalized
models. Glob Chang Biol 6:155–168
Law B, Falge E, Gu L, Baldocchi D, Bakwin P, Berbigier P, Davis K,
Dolman A, Falk M, Fuentes J (2002) Environmental controls
over carbon dioxide and water vapor exchange of terrestrial
vegetation. Agric For Meteorol 113:97–120
Liang N, Maruyama K (1995) Interactive effects of CO2 enrichment
and drought stress on gas exchange and water-use efficiency in
Alnus firma. Environ Exp Bot 35:353–361
Liang W, Hu H, Liu F, Zhang D (2006) Research advance of biomass
and carbon storage of poplar in China. J For Res 17:75–79
Linderson ML, Iritz Z, Lindroth A (2007) The effect of water
availability on stand-level productivity, transpiration, water use
efficiency and radiation use efficiency of field-grown willow
clones. Biomass Bioenergy 31:460–468
Lindroth A, Cienciala E (1996) Water use efficiency of short-rotation
Salix viminalis at leaf, tree and stand scales. Tree Physiol
16:257–262
Liu C, Zhang Z, Sun G, Zhu J, Zha T, Shen L, Chen J, Fang X, Chen J
(2009) Quantifying evapotranspiration and the biophysical
regulations of a poplar plantation assessed by eddy covariance
and sap flow methods. J Plant Ecol 33:706–718
Lloyd J, Taylor J (1994) On the temperature dependence of soil
respiration. Funct Ecol 8:315–323
Mahrt L, Vickers D (2002) Relationship of area-averaged carbon
dioxide and water vapour fluxes to atmospheric variables. Agric
For Meteorol 112:195–202
Migliavacca M, Meroni M, Manca G, Matteucci G, Montagnani L,
Grassi G, Zenone T, Teobaldelli M, Goded I, Colombo R (2009)
Seasonal and interannual patterns of carbon and water fluxes of a
poplar plantation under peculiar eco-climatic conditions. Agric
For Meteorol 149:1460–1476
Monteith JL (1989) Steps in climatology. In: Unger PW, Jordan WR,
Sneed TV, Jensen RW (eds) Proceedings of the International
Conference on Dryland Farming. Texas A&M University,
College Station
Moren AS, Lindroth A, Grelle A (2001) Water-use efficiency as a
means of modeling net assimilation in boreal forests. Trees
Struct Funct 15:67–74
Nijs I, Impens I, Behaeghe T (1989) Effects of long-term elevated
atmospheric CO2 concentration on Lolium perenne and Trifolium
repens canopies in the course of a terminal drought stress period.
Can J Bot 67:2720–2725
Noormets A, Chen J, Crow TR (2007) Age-dependent changes in
ecosystem carbon fluxes in managed forests in northern
Wisconsin, USA. Ecosystems 10:187–203
Noormets A, Desai A, Cook B, Euskirchen E, Ricciuto D, Davis K,
Bolstad P, Schmid H, Vogel C, Carey E (2008) Moisture
sensitivity of ecosystem respiration: comparison of 14 forest
ecosystems in the Upper Great Lakes Region, USA. Agric For
Meteorol 148:216–230
Pan Y, Birdsey RA, Fang J, Houghton R, Kauppi PE, Kurz WA,
Phillips OL, Shvidenko A, Lewis S, Canadell JG, Ciais P,
Jackson RB, Pacala SW, McGuire AD, Piao S, Rautiainen A,
Sitch S, Hayes D (2011) A large and persistent carbon sink in the
world’s forests. Science 333:988–993
Pearce AJ, Rowe LK (1979) Forest management effects on intercep-
tion, evaporation and water yield. J Hydrol (NZ) 18:7387
Peng P, Peng J, Wang C, Wang J (2003) Studies on the biomass and
production of Populus schneideri var. tibetica plantation. For Sci
Technol 4:004
Ponton S, Flanagan LB, Alstad KP, Johnson BG, Morgenstern K,
Kljun N, Black TA, Barr AG (2006) Comparison of ecosystem
water-use efficiency among Douglas-fir forest, aspen forest and
grassland using eddy covariance and carbon isotope techniques.
Glob Chang Biol 12:294–310
Post WM, Emanuel WR, Zinke PJ, Stangenberger AG (1982) Soil
carbon pools and world life zones. Nature 198:156–159
Reichstein M, Tenhunen JD, Roupsard O, Ourcival J, Rambal S,
Miglietta F, Peressotti A, Pecchiari M, Tirone G, Valentini R
(2002) Severe drought effects on ecosystem CO2 and H2O fluxes
at three mediterranean evergreen sites: revision of current
hypotheses? Glob Chang Biol 8:999–1017
Rouphael Y, Colla G (2005) Radiation and water use efficiencies of
greenhouse zucchini squash in relation to different climate
parameters. Eur J Agron 23:183–194
Scanlon TM, Albertson JD (2004) Canopy scale measurements of
CO2 and water vapor exchange along a precipitation gradient in
southern Africa. Biol 10:329–341
Schulze E, Hall A (1982) Stomatal responses, water loss and CO2
assimilation rates of plants in contrasting environments. Encycl
Plant Physiol 12:181–230
Stoy PC, Katul GG, Siqueira M, Juang JY, Novick KA, Uebelherr
JM, Oren R (2006) An evaluation of models for partitioning
J For Res
123
eddy covariance-measured net ecosystem exchange into photo-
synthesis and respiration. Agric For Meteorol 141:2–18
Sun G, Noormets A, Chen J, McNulty S (2008) Evapotranspiration
estimates from eddy covariance towers and hydrologic modeling
in managed forests in Northern Wisconsin, USA. Agric For
Meteorol 148:257–267
Tan J, Zha T, Zhang Z, Sun G, Dai W, Fang X, Xu F (2009) Effects of
soil temperature and soil water on soil respiration in a poplar
plantation in Daxing District of Beijing, China. Ecol Environ Sci
6:2308–2315
Tang J, Bolstad PV, Ewers BE, Desai AR, Davis KJ, Carey EV (2006)
Sap flux–upscaled canopy transpiration, stomatal conductance,
and water use efficiency in an old growth forest in the Great
Lakes region of the United States. J Geophys Res 111:G02009
Teskey R, Gholz H, Cropper W (1994) Influence of climate and
fertilization on net photosynthesis of mature slash pine. Tree
Physiol 14:1215–1227
Testi L, Orgaz F, Villalobos F (2008) Carbon exchange and water use
efficiency of a growing, irrigated olive orchard. Environ Exp Bot
63:168–177
Tong XJ, Li J, Yu Q, Qin Z (2009) Ecosystem water use efficiency in
an irrigated cropland in the North China Plain. J Hydrol
374:329–337
Veron SR, Paruelo JM, Sala OE, Laurenroth WK (2002) Environ-
mental controls of primary production in agricultural systems of
the Argentine Pampas. Ecosystems 5:625–635
Vitousek PM (1991) Can planted forests counteract increasing
atmospheric carbon dioxide? J Environ Qual 20:348–354
Webb EK, Pearman GI, Leuning R (1980) Correction of flux
measurements for density effects due to heat and water vapour
transfer. Q J R Meteorl Soc 106:85–100
Wilczak JM, Oncley SP, Stage SA (2001) Sonic anemometer tilt
correction algorithms. Bound Layer Meteorol 99:127–150
Wofsy S, Goulden M, Munger J, Fan S, Bakwin P, Daube B, Bassow
S, Bazzaz F (1993) Net exchange of CO2 in a mid-latitude forest.
Science 260:1314–1317
Woodwell GM, Whitaker R, Reiners W, Likens GE, Delwich C,
Botkin D (1978) The biota and the world carbon budget. Science
199:141–146
Wright MS, Greene-McDowelle DM, Zeringue HJ, Bhatnagar D,
Cleveland TE (2000) Effects of volatile aldehydes from Asper-
gillus-resistant varieties of corn on Aspergillus parasiticus
growth and aflatoxin biosynthesis. Toxicon 38:1215–1223
Xue L, Yang P (2004) Summary of research on forest biomass.
J Fujian Coll For 24:283–288
Yu GR, Wang QF, Zhuang J (2004) Modeling the water use efficiency
of soybean and maize plants under environmental stresses:
application of a synthetic model of photosynthesis-transpiration
based on stomatal behavior. J Plant Physiol 161:303–318
Yu G, Song X, Wang Q, Liu Y, Guan D, Yan J, Sun X, Zhang L, Wen
X (2008) Water-use efficiency of forest ecosystems in eastern
China and its relations to climatic variables. New Phytol
177:927–937
Zhang Y, Zhang ZQ, Sun G, Fang XR, Zha TG, Noormets A, Chen J,
McNulty SG, Liu CF, Chen LX (2014) Water balance of a poplar
plantation forest in Suburban Beijing, China. J Environ Manage
(in review)
Zhou J, Zhang ZQ, Sun G, Fang XR, Zha TG, McNulty SG, Chen J,
Jin Y, Noormets A (2013) Response of ecosystem carbon fluxes
to drought events in a poplar plantation in Northern China. For
Ecol Manag 300:33–42
J For Res
123