Australian plantation inventory: ownership changes, availability and policy.
43
Australian Plantation Inventory: Ownership Changes, Availability, and Policy Ian Ferguson 1 1 Department of Forest & Ecosystem Science The University of Melbourne Parkville, Vic. 3000 [email protected] Summary The Australian National Plantation Inventory has collected and collated plantation information since 1993 and has periodically published forecasts of availability based on those data. This paper outlines the past methodology and summarizes updates of the most recent forecasts. The failures of some Managed Investment Scheme forestry companies have drawn attention to the risks and difficulties involved in forecasting plantation wood yields for species and areas where few data are available. These issues have important implications for forecasts of availability but several unknowns still exist, especially in relation to future replanting. The accuracy of prospectus forecasts of yields from several Managed Investment Schemes is examined. The methods used in national and selected regional forecasts are reviewed and some of the underlying policy issues for Australian plantations and forestry are critically examined. Keywords: National Plantation Inventory, availability, forecasts, plantation growth and yield, Managed Investment Schemes, plantation policy Introduction
Transcript of Australian plantation inventory: ownership changes, availability and policy.
Australian Plantation Inventory:Ownership Changes, Availability, and
PolicyIan Ferguson1
1 Department of Forest & Ecosystem ScienceThe University of Melbourne
Parkville, Vic. [email protected]
Summary
The Australian National Plantation Inventory has collected and
collated plantation information since 1993 and has periodically
published forecasts of availability based on those data. This paper
outlines the past methodology and summarizes updates of the most
recent forecasts. The failures of some Managed Investment Scheme
forestry companies have drawn attention to the risks and difficulties
involved in forecasting plantation wood yields for species and areas
where few data are available. These issues have important
implications for forecasts of availability but several unknowns still
exist, especially in relation to future replanting. The accuracy of
prospectus forecasts of yields from several Managed Investment
Schemes is examined. The methods used in national and selected
regional forecasts are reviewed and some of the underlying policy
issues for Australian plantations and forestry are critically
examined.
Keywords: National Plantation Inventory, availability, forecasts,
plantation growth and yield, Managed Investment Schemes, plantation
policy
Introduction
The National Plantation Inventory (NPI) is now a program within the
Australian Bureau of Agricultural and Resource Economics and Sciences
(ABARES), a research organization within the Australian Government
Department of Agriculture, Fisheries and Forestry. The NPI was
established in 1993 to collect and collate grower information, to
allow up-to-date quantitative reporting of Australia’s plantation
resource, and to build on a 1988 Commonwealth-State project, the
National Forest Inventory, to establish uniform datasets. The first
comprehensive and spatially based inventory of Australia’s industrial
plantations was developed by the NPI in close consultation with
industry and growers and released in 1997 (Howell et al., 1997).
Figures were reported nationally and regionally, based on 15
plantation resource regions (NPI regions) identified at the time by
industry as the most appropriate economic wood supply zones.
Figures compiled through the first report of the NPI in 1997 provided
the baseline for the ‘Plantations for Australia: the 2020 Vision’ (Pl
antation 2020 Vision Implementation Committee, 1997), a strategic par
tnership between industry and the Australian, state and territory gov
ernments which was developed with a contentious target to treble the
extent of Australia’s plantations to 3 million hectares by 2020. The
release of the strategy in late 1997 was followed by a rapid increase
in the rate of hardwood plantation establishment.
In addition to supplying regular updates on annual planting and the
extent, distribution, planting date, and species involved, there have
been periodic analyses to collate and use area and other information
to forecast the likely availability of Australian-grown plantation
wood in 1997, 2001, 2006 and 2012 (National Forest Inventory, 1997;
Turner et al., 1997; Ferguson et al., 2002; Parsons et al., 2006;
Gavran et al., 2012).
2

The term ’availability’ is used here in preference to ‘log supply’ or
‘wood flows’ because future technologies and production costs may
change. Supply is conditional on price and many other factors. In any
event, supply in itself does not provide a forecast of consumption –
that requires the interaction of both supply and demand. Demand
itself is also subject to change from that anticipated now, as
incomes, tastes and other demand influences change.
Availability is therefore only a very rough proxy for future
consumption (and production) and assumes that the present setting of
real prices, costs, and most other characteristics of demand and
supply will change little, if at all, in the future. The major
influence on future availability is the amount of plantation wood at
any future point in time that meets current market specifications and
practices. Furthermore, ‘availability’ also assumes harvesting will
take place at that prescribed future point in time and that
replanting will follow automatically. These are definitional matters
that must underpin any use of the forecasts for policy or other
purposes.
Gavran et al., (2012) compiled the last official report on national
forecasts. The period from 2005 to 2012 was marked by a sequence of
natural disasters, together with failures of many Managed Investment
Scheme (MIS) forestry companies, all of which left their mark on the
Australian plantation estate. This paper deals first with the
failures of MIS forestry schemes because they raise a number of
policy issues with implications for national and regional
availabilities. It then deals with MIS growth and yield estimates,
reviews the methods used and presents updates of the national
forecasts and selected regional forecasts. Finally, it discusses
some of the underlying policy issues for Australian plantations and
the forestry sector.
3
Managed Investment Scheme Failures
Managed Investment Schemes are not confined to forestry and
agriculture but are quite common in Australian investment where they
play an especially important role in the property and commercial real
estate markets. However, the special taxation provisions relating to
forestry and agriculture MIS schemes set them apart.
A ‘Managed Investment Scheme’1 under Chapter 5c of the Corporations
Act 2001 (Cth) is any pooled direct investment in a venture that is
managed by some other company or person. A direct investment is where
investors are directly involved in the business or property as owners
or beneficial owners, or in which investors are directly contracting
for services to be carried out on their behalf. Holding shares or
debentures in a company does not qualify because share or debenture
holders do not own the business - the company does. Nor do investors
automatically receive profits from the business, only receiving such
dividends as the directors determine.
Any MIS prospectus (the ‘product disclosure statement’) has to meet
requirements laid down by the Australian Securities and Investment
Commission. The prospectus is subject to approval by the Australian
Taxation Office through a formal Product Ruling that enables
investors to be secure regarding the application of the taxation
provisions applying to their investment. An important provision (the
13-month prepayment provision) enables an individual investor to
charge their initial investment (including interest on funds borrowed
for the purpose) in planting against income tax in the financial year
in which the prospectus is approved, even though much of the actual
expenditure on planting might be delayed until later in the planting
season in the next financial year. This provision recognizes
plantation establishment has to be undertaken when seasonal
1 This section draws heavily on Ferguson et al., (2009).
4
conditions are suitable and therefore generally straddles the end of
a financial year.
The MIS model was effective in raising retail investment funds for
plantation establishment. Within Australia, some ten major MIS
companies and approximately seven other smaller entities raised funds
totaling about A$705 million in 2007-08 for forestry projects
(Australian Agribusiness Group, 2008). In total, these companies
offered twenty-two different forestry projects in 2007-08. MIS
companies listed on the Australian Stock Exchange raised 85 per cent
of funds invested in forestry in 2007-08 (Australian Agribusiness
Group, 2008). MIS forestry companies (Parsonson, 2010, citing
Advisor Edge as source) raised some A$5.3 billion from 1995 to 2008,
of which Parsonson estimated that:
· 80 per cent was spent on short rotation hardwoods at an average
cost of $7,000 ha-1
· 13 per cent on tropical species at an average cost of A$30,000
ha-1, and
· 7 per cent on longer rotation softwoods at an average cost of
$8,000 ha-1.
Figure 1 shows the net areas planted for six of the major MIS
forestry companies (Parsonson, 2010, citing Advisor Edge as source).
[Figure 1. Major MIS Hardwood plantation ownership]
A change of Australian Government policy in 2000 withdrawing the 13-
month prepayment provision led to the collapse of several companies
because it restricted their ability to raise new funds and thus
remain solvent while awaiting the age at which harvesting revenues
began to flow. In response to this collapse, a 12-month prepayment
provision was re-introduced in 2002. Very high external debt, and
delays in the commencement of exports of wood chips due to
5
infrastructure delays or market downturn led to the demise of others.
Some failed due to site and climatic conditions impacting on the
growth of particular species. Most of those that failed had become
dependent on the next prospectus to raise funds to bridge operations
until sufficient revenues were generated. Some have referred to this
as entering a Ponzi-like mode of operation (Parliamentary Joint Commi
ttee on Corporations and Financial Services, 2009: p35 - Submission b
y Piper Alderman).
Despite these failures, the timber and land (where relevant) assets
of individual MIS investors were nominally secure, provided they were
able to maintain any payments that were due. However, continuing
ownership often became difficult if the funds had to be borrowed or
if some MIS investors in a particular project (i.e. Prospectus
offering in a particular year) failed to meet their payment
obligations. Most MIS projects pooled the costs and revenues to
woodlot owners across the project, with a pro rata allocation to
individual owners. Failure to meet contractual costs triggered a
change of ownership to the Trustee or, if the MIS project was deemed
to be uneconomic, to sale. When a MIS forestry company failed, the
trees and, if owned by the company, the land on which the trees were
planted, became the subject of the formidable legal processes of
administration, receivership and liquidation.
Five of the MIS forestry companies in Figure 1 existing prior to 2009
failed and only two others, Macquarie and TFS, remain. TFS is
concerned with sandalwood plantations: a very different species,
product and market to those considered in this paper. As a result of
the processes of administration and receivership, the Great Southern
Plantations (GSL) forestry assets are now owned by New Forests, an
Australian-based Timberland Investment Management Organization
(TIMO), that also owns substantial areas of (non-MIS) softwood
plantation in South Australia and Tasmania. Recently, Elders Forestry
6
(2011), formerly ITC, sold most of its forestry assets in the Albany
and Bunbury NPI Regions of Western Australia and the Green Triangle
to Global Forest Partners. The former Timbercorp forestry assets are
now 92 per cent also owned by Global Forest Partners under the name
of Australian Blue Gum Plantations Pty Ltd. Those of Forest
Enterprises Australia (FEA) and Gunns Ltd are in administration and
receivership pending the outcome of legal proceedings.
All these changes have implications for forecasts of availability:
none more so than the resolution of ownership and the management
intent of the new owner in relation to future wood production. These
issues hinge on what capability the woodlots have for future
production, so a prior question that potentially affects all
estimates of future availability is - what growth rates and yields
were and will be achieved by these plantations? This also raises a
peripheral issue of some importance to the forestry profession - how
accurate were the prospectus forecasts provided by MIS forestry
companies?
MIS Growth and Yield Forecasts
Official reports on the failures of many of the MIS companies provide
access to some data that enable assessment of the yield estimates and
on the accuracy of forecasts set out in the prospectuses promoting
various of the MIS schemes. I have attempted to collate the limited
available evidence to assess the accuracy of the MIS yield forecasts.
Unfortunately, most of these lack sufficient detail and clarity to
provide a good audit base. Further research would be desirable once
future ownership issues are resolved.
7
Short rotation MIS schemes
The overwhelming majority of MIS investment has been in short
rotation (10 to 12 y) plantations, mainly of blue gum (Eucalyptus
globulus) in southern Australia, with the expectation that the sole
product would be pulpwood to be exported as wood-chips or processed
domestically. This review will focus on blue gum plantations because
they are the most extensive and best documented in terms of growth
and yield.
The monitoring of outcomes in relation to yields and risks was
largely left to private sector rating agencies. Some collected
inventory data but, with some exceptions, little of it was subjected
to detailed analysis and critical appraisal and very little was made
available in the public domain.
Although some preliminary research was undertaken in the years before
and during the early years of MIS planting, no substantive studies on
MIS growth and yield were published prior to 2004. After 2004, a
number were published (e.g. Strandgard et al., 2005; Nambiar and
Ferguson, 2005; and Wang and Baker, 2007; Harper et al., 2009; Miehle
et al., 2009; Goodwin’s farm forestry toolbox (Private Forestry,
Tasmania, 2011). Nevertheless, some of these were available and being
circulated earlier than the date of publication shown. My
recollection is that researchers and many plantation management
experts at this time were widely critical of and concerned about the
values being used in prospectuses. However, they were constrained in
making public comment because very little independent research was
funded and published until too late. This highlights one of the
shortcomings of the main regulatory agencies (arguably the Australian
Securities and Investment Commission and the Australian Taxation
Office) in not promoting research to monitor what was a fundamental
component of the program. While the agencies cannot be responsible
8
for the profitability of the proposed investment, some verification
and monitoring of the accuracy of Prospectus data fundamental to the
outcome is desirable and in the public interest.
The first major independent study of growth and yield of MIS
plantations was initiated when one of the major companies got into
financial difficulties. KPMG (2008) undertook a comprehensive audit
of the expected blue gum yields for a major MIS company across four
States based on measurements of temporary plots at ages of 5 to 9
years. The results are summarized in Table 1.
[Table 1: Estimates of blue gum plantation production, Great Southern
Plantations]
As with most such aggregate statistics, a number of qualifications
need to be made in reviewing them. In much of southern Australia,
especially in the NPI Regions of Western Australia and the Green
Triangle, the period involved spans a long drought of varying
intensity, resulting in reductions in growth and yield. Towards the
latter years of this period, the supply of the most productive land
had declined as the competition for MIS land intensified and this
reduced average yields. On the other hand, planting and later tending
techniques were refined progressively over this period and led to
improvements in growth and yield. It is not possible to unravel the
impacts of these conflicting influences from aggregate data of this
kind.
What is clear is that, with the exception of a small area at Bunbury
in Western Australia, the blue gum yields in the Albany area and
Green Triangle region fell well short of the conventional wisdom of
20 to 25 m3 ha-1 y-1 (or even 27.5 m3 ha-1 y-1, see Adviser Edge,
2008:p16), which was used in many of the MIS company prospectuses2. 2 The Independent Forester’s Report (p34) of the Timbercorp (2005) Product Disclosure Statement states that ‘Timbercorp Forestry advises
9
Other data (ITC Project Management Limited, 2009) are available on
actual harvest yields in green metric tonnes (gmt) that broadly
support the average yields for the Albany region of Western Australia
reported in Table 1.The ages at ITC harvest varied from 10 to 13
years but the actual values were not reported, so no details are
reported here. The lack of transparency in such reports is a matter
of concern, as is the disparity between prospectus and actual yields
The Australian Agribusiness Group (2010) reported MIS results shown
in Table 2 for blue gum plantations located in the Geelong, Gippsland
and Portland areas. While limited in scope and imprecise because they
were based on tree measurement at 3 years of age, these highlight the
variability from planting year to planting year and/or location to
location.
[Table 2: Estimates of blue gum plantation production in Geelong,
Gippsland and Portland areas, Macquarie Forestry]
In 2008, Forest Enterprises Australia (FEA, 2008) reported a
comparison (Table 3) of prospectus forecasts of mean annual
increments and the weighted average values, based on measurement at
age 5 years, for plantations in Tasmania and northern New South
Wales. Some of these plantations were of species other than blue gum.
Details of the analysis are not available, making geographic
interpretation impossible.
[Table 3: Prospectus forecasts and estimates of mean annual increment
for FEA plantations in Tasmania and northern New South Wales]
Independent data and analyses
that only land that in aggregate with all other land in the Project will continue to provide the target weighted average yield of 275m3 ofpulpwood per hectare between 8-12 years after planting will be included in the Project’.
10
Data from field inventories of several hundred properties carrying
blue gum plantations were made available by a private industry
organization for this study. Most of the inventories were carried out
at 7.5 years, some at 4.5 years, and the data were used to predict
the expected yield per hectare at age 10 years. Although details are
not known, it seems likely that the predictions were made using early
versions of the Prophecy model (Strandgard et al., 2005). Prophecy
is a computer-based simulation model designed to predict the standing
volume and financial outcomes of blue gum plantations under a various
silvicultural regimes. The predictive functions in Prophecy were
based on data from collaborating organisations and MIS companies.
The plantation region (Green Triangle or the South-West of Western
Australia) and average rainfall was identified for each plantation,
together with net planted area, year of planting, the age at which
measurement was carried out, and the tenure of the land (freehold or
lease). Dummy variables were used in the multiple regression analysis
to identify the categorical variables in this set.
The data were edited to remove observations with missing values of
the predicted volume or rainfall and two of which were nonsensical
due to data entry errors. This greatly reduced the number of
observations available. There were too few to allow second rotation
options of replanting or coppicing to be explored. The remaining
data fell into two distinct groups – those in the Green Triangle
Region (277 observations) and those in the South-West of Western
Australia (90 observations).
Each observation was based on an inventory of a separate property.
The net plantable area on each property varied from 6 ha to 1370 ha.
However, as Figures 2 and 3 show, the distributions of net plantable
areas in the Green Triangle and Western Australia NPI Regions were
markedly skewed towards smaller areas. The two regions are fairly
11
similar in the distributions, the relative frequencies of new
plantable areas under 40 ha being 15 to 17 per cent, while those for
net plantable areas under 80 ha were 33 and 36 per cent respectively.
Given the differences in soils and climate, the two groups were
analysed separately using multiple regression analysis.
Green Triangle Region
Figure 4 summarises the results for the Green Triangle NPI Region.
The scatter of the data points highlights the very large variation,
some of which may be attributed to errors in rainfall data, errors in
measurement, and/or errors in extrapolation of inventory data to age
10 years. Nevertheless, the number of observations is sufficiently
large to make the results reasonably robust. The grand mean
corresponded to a mean annual increment of 17.2 m3 ha-1 y-1. That from
a different source covering 280 properties for which rainfall data
were not available was 16.3 m3 ha-1 y-1.
[Figure 4. Predicted volume at age 10y against mean annual rainfall
for Green Triangle NPI Region - data, model predictions, and
confidence intervals]
The final model was as follows, standard errors being shown in
parentheses below the estimated values of coefficients
y = -9.98 + .250x Adjusted R2=.0.16 (1)
(24.7) (.034)
where y denoted the predicted volume at age 10y (m3 ha-1)
x denotes the mean annual rainfall (mm y-1)
12
Various alternative models including the other independent variables
were analyzed. None had coefficients that were significantly
different from zero at the 95 per cent probability level.
Western Australia NPI Region
Figure 5 summarizes the results for the NPI Region of Western
Australia. Again, the scatter is considerable. The grand mean
corresponded to a mean annual increment of 18.7 m3 ha-1 y-1. That from
a different source covering 201 properties for which rainfall data
were not available was also 18.7 m3 ha-1 y-1.
[Figure 5. Predicted volume at age 10 years against mean annual
rainfall for W.A. - data, model predictions, and confidence
intervals]
Given the much smaller number of observations and the various errors
in variables referred to earlier, it would be unwise to make too much
of the difference between the fitted relationship in Figure 6 and
that for the Green Triangle Region, other than to say there is a
difference and the nature of it might reflect the effect of the
drier, hotter summers on the lower rainfall areas in Western
Australia, especially over the period of drought in the last decade.
However, none of the other independent variables, including the year
of planting, showed coefficients that were statistically different
from zero at the 95 per cent probability level.
The final model was therefore as follows:
y = -123.0 + .377x Adjusted R2=.0.36 (2)
(38.0) (.052)
where y denotes the predicted volume at age 10y (m3 ha-1)
x denotes the mean annual rainfall (mm y-1)
13
The trends in Figures 5 tally broadly with research findings of
Harper et al., (2005: Tables 8 & 9) regarding the impact of average
rainfall but the Harper et al. study takes account of many other
variables as well.
The trends in Figures 4 and 5 are also broadly consistent with data
collated and similar regressions estimated by Knott (2011). Knott’s
presentation3, regrettably as yet unpublished, was based on more
numerous data drawn from across Victoria and south-eastern South
Australia and also provides some valuable insights on short-term
variations in rainfall, tree breeding and soils.
Precision of Prospectus Forecasts
The sets of confidence intervals shown in Figures 4 and 5 may help to
correct seeming misconceptions in some of the prospectus statements
of some consulting foresters. To avoid confusion over terminology,
let us define a:
· planting block as an area planted on a specific land title, and
a
· project area as the aggregate of planting blocks covered by
common conditions in a Prospectus.
The inner curves (dashed lines) around the predicted values are the
confidence intervals attached to the mean of the population value of
predicted volume at age 10 years across all planting blocks having a
given value of mean annual rainfall. For a given rainfall, these
3 In subsequent correspondence, Knott estimated the following function for merchantable volume (y) at age 10 years based on averageannual rainfall following planting (Rf) and 1612 plots: y= -1084.5+184.74*log(Rf). This is substantially lower than Equation 3, but somewhat closer to Equation 4 for lower rainfall. Unlike thoseequations it shows diminishing returns for high rainfall.
14
intervals reflect the sampling distribution of the mean predicted
volume at age 10 years if sampling was or could be repeated many
times for that rainfall and all those project areas in the sample
used to derive the mean and confidence interval. While it may be more
impressive to cite these intervals, they do not reflect the
circumstances that most consultants face in the field. Most
consultants are asked to report on a specific project area.
The outer confidence intervals (solid lines) reflect the sampling
distribution of the predicted volume at age 10 years for an
individual planting block at a specified mean annual rainfall under
repeated sampling. They are very much larger than the former because
the confidence interval comprises two separate components - a
variance attributable to the sample data used and a variance
attributable to the individual planting blocks not included in the
sample.
MIS plantations were generally sold to investors on the basis of a
project area that was effectively divided for sale of woodlots to
individual owners. Notwithstanding the subdivision and identification
of a specific area, timber yields and revenues were typically pooled
across the entire project area: a pro rata share going to the
individual owner. This means that the confidence intervals for a
particular project area lie between the two extremes described in
Figures 4 and 5.
A consultant would normally be asked to evaluate a Prospectus project
area that comprises a number of individual properties. For
simplicity, let us assume a consultant is asked to prepare or
evaluate a predicted yield at age 10 years for a new project area and
Prospectus. The effect of having more than one planting block will
draw the confidence interval for the project area in towards those of
the mean across all planting blocks. However, for most practical
15
situations (say 4 to 20 planting blocks in a project area), the
reduction will be small, as the change is less than proportional to
the square root of the number of blocks. Hence, when estimates of
variability are reported in prospectuses, the MIS lessons show that
consultants need to be clear as to the basis they are applying, as
the differences are substantial. Furthermore, confidence intervals
will be larger, the further the mean annual rainfall of the project
area is from the general mean of annual rainfall of the sample
relationship.
Data on Actual Yields
Table 4 summarizes one of the very few sets of data available to date
on the actual harvest yields using aggregated data from the NPI and
relate to blue gum MIS schemes established in South-east Australia.
The average values are similar to those in Figures 5 and 6 for first
rotation plantations. Mean annual increments were not adjusted for
the differences in harvest age, which ranged from 11 to 13 y.
[Table 4: Actual harvest yields of some blue gum plantations in
South-east Australia]
Sawlog rotation MIS schemes
Forecasts of plantation sawlog availability raise issues beyond those
already canvassed, because of the extended period of time required to
capture sufficient data on which to develop accurate growth and yield
models and to reflect the product out-turns and the risks involved
with respect to pests, diseases and natural disasters.
Where the species has been planted widely and the growth and yield
characteristics are well-documented, as in the case of radiata pine
(Pinus radiata), southern pines (P. caribbea, P. elliottii and
16
hybrids), or maritime pine (P. pinaster) in Western Australia, the
risks are much smaller.
Concerns expressed in evidence to some Parliamentary inquiries (e.g.
Parliamentary Joint Committee on Corporations and Financial Services,
2009: paras 3.37-3.49) over some inflated forecasts of growth and
yield in MIS prospectuses seem well founded. Some of the reports of
the consulting foresters in the MIS prospectuses for blue gum and
other hardwoods suggest that misplaced optimism was a more powerful
force than the literature and published research - there being little
(sometimes no) reference to that research or analysis of risks and
much reliance on undocumented experience and observation.
In fairness to those involved, however, comparatively little
published research was available about the growth and yields of the
hardwood species used in sawlog rotation projects. This partly
reflects the bias in those government agencies towards funding
experimental plantings, rather than later research that monitors and
analyses the outcomes (see Nambiar and Ferguson, 2005, for a
heartfelt account). What is available bears testimony to the
desirability of widely spread experimental plantings to sort out some
of the major risks, together with a preparedness to wait for a long
period, if not a full rotation, to ensure that early trends are borne
out.
The history of such plantings has many cases of failure or relative
failure following early promise. Most of the hardwood plantings in
Central and North Queensland failed for reasons discussed later. Yet
earlier analyses (Venn, 2005) based on expert estimates (though
little data) suggested these could be economically viable. Later age
failures include blue gum, a widely planted species that after early
promise yielded disappointing later-age growth when grown on the
duplex soils in Gippsland, Victoria. These disappointing outcomes
17
simply highlight the tendency to underestimate the risks involved,
even when assessed by knowledgeable local experts.
Some MIS marketing organizations deliberately sought to promote a mix
of plantings of lesser-known hardwood species with plantings of long-
established softwood species, each in geographically distant areas,
to better attract investors. For example, Willmott Forests (2010)
offered a blend of radiata pine (Southern NSW and Victoria) and
intermixtures of silky oak - Grevillea robusta - and Casuarina spp
(Northern NSW). Elders Forestry (2010) offered a blend of teak -
Tectona grandis (Far North Qld), African mahogany - Khaya
senegalensis (Far North Qld), sandalwood (northern WA) and blue gum
(southern States). How much of this was an attempt to appeal to an
innate preference of MIS investors for native Australian species as
against exotic species; how much was to appear to hedge long rotation
returns by blending long and short rotation returns; and how much was
to deliberately attract high-risk investors, is unclear and warrants
further investigation. The obvious difference in risk between long-
established and new species, generally pointed out explicitly in MIS
prospectuses, seemed to count for little with MIS investors as the
these options were widely taken up.
A referee suggested that this behavior may just reflect that
investors were rational in seeking to maximise the risk-adjusted
value of their investment, and that MIS companies and their promoters
were simply seeking to assist this endeavor. However, because of the
ASIC strictures against providing financial forecasts in the
Prospectuses, the information provided would scarcely enable a
rational analysis of the risks-adjusted returns.
Summary
18
What is clear is that MIS investors were not, in general, rational
investors in the sense of weighing return against risk. Or is it
simply that having avoided paying some tax, one might just as well
have a flutter on the ultimate returns in what largely constitutes a
bet at the Government’s expense? As a professional colleague engaged
in financial analysis of MIS investments forcefully pointed out, many
MIS investors were only interested in the tax avoidance and never
read the fine print of prospectuses anyway.
Such an opinion does not provide an excuse for a consulting forester
to neglect these issues. Sooner or later, an irate and informed MIS
investor (or group thereof) will trigger litigation about misleading
estimates. Consulting foresters need to address this and pay greater
attention to published literature and journal papers to establish
better their forecasts of likely yields or growth rates and to engage
in more explicit analyses of the risks. This is not just a matter of
citing current research. The essential lessons stem from
understanding the long-known and well-documented principles that
underpin forest growth and yield:
1. Experimental planting results generally exceed those achieved
in large-scale plantings- partly due to the inevitable
variations in site, treatment and climate within the latter4.
That bias needs to be factored into early estimates of growth
and yield for large-scale plantings. My own rule of thumb is to
reduce initial estimates by at least one third.
2. Once measurable, current annual increment in volume or mass
exceeds mean annual increment up to the point of maximum mean
annual increment. Current annual increments during young ages
4 Experimental sites are generally better than average and more uniform in site productivity than a large plantation estate. Local geographic or temporal variations in climate, treatment, and the depredations of pests and diseases all contrive to lower yields in the latter relative to the former.
19
can be very misleading as to mean annual increment. Measurable
current annual increment may not start until year two but
escalates very rapidly only to decline rapidly thereafter.
These differences are profound for very short rotations of
order 10 years.
3. Growth rates for well-stocked plantations are generally
markedly influenced by rainfall. There is sufficient evidence
now available to factor the effect of mean average rainfall
into any estimates for many species in southern Australia but
more research is needed for sub-tropical and tropical regions.
4. Prolonged drought, other natural disasters and attack by
disease or pests can have devastating impacts. Risks, including
those of fire, drought, cyclone and hail, need to be assessed
from historical records and other research and applied to the
economic analyses. Any adjustments for risks should be
additional to the adjustments mentioned in #1. Risks from
disease and pests may be especially high for newly introduced
plantation species, as the Queensland experience with E.
grandis hybrids and E. dunnii shows.
5. A substantial number of permanent plots measured over periods
that approach the chosen rotation age are needed to establish
an adequate basis for estimation of growth and yield. Inventory
and the preparation of growth and yield models need to be a
line item that is specifically included in the MIS company
budget from inception and implemented for large-scale
plantings.
6. The predicted volume or mass at harvest needs to be reconciled
against actual volume or mass sold because factors including
markets, harvest technologies, and management can have marked
impacts on the amounts actually sold.
National Plantation Inventory Forecasting Methods
20
The preceding review of MIS plantations is a necessary building block
to understanding and interpreting the NPI forecasts, as MIS
plantation interests account for a substantial proportion of the
national plantation estate. Hence the following review of the
methods used to derive those forecasts, the assumptions that underpin
them and the resulting policy issues.
Net plantation areas
Net plantation areas represent a set of basic data whose accuracy
underpins all later forecast of aggregate growth and yield.
In the NPI, area data are collected from growers. In the case of
industrial plantations (estates exceeding 1,000 ha), all growers have
supplied detailed data on areas and, in most instances, species
planted on an annual basis. Confidentiality of the data is critical
and ABARES and its predecessors have established an excellent
reputation in this respect. Gross areas were validated and sometimes
more detailed checks were carried out by reference to remote sensing
data. Tabular area data have been updated annually (Gavran, 2012). A
more comprehensive update using spatial data provided by plantation
growers is undertaken every five years, the most recent available
being for 2010 (Gavran and Parsons, 2011). These area data reflect
additions due to new plantings and reductions due to re-measurements
of areas, changes in land use after harvesting, and losses due to
wildfire or pests or diseases up to 2010.
A National Farm Forestry Inventory (Sun et al., 1997) was established
in 1998 to collect and collate data from plantations of less than
1,000 ha owned by individual (rather than company, joint venture or
leasehold) growers. A further inventory was carried out in 2000. The
data were collected on a confidential basis through an extensive
21
network of regional and State farm forestry groups. The project
lapsed for lack of funds in 2001 and subsequent estimates have relied
on ad hoc updates supplied by some individual growers and informal
regional contacts. In 2001 (Wood et al., 2001), farm forestry
plantations constituted less than 5 per cent of the total plantation
estate and that proportion has declined substantially since that
date, so although an objective sample is currently lacking, it is
probably not a major defect in the present estimates.
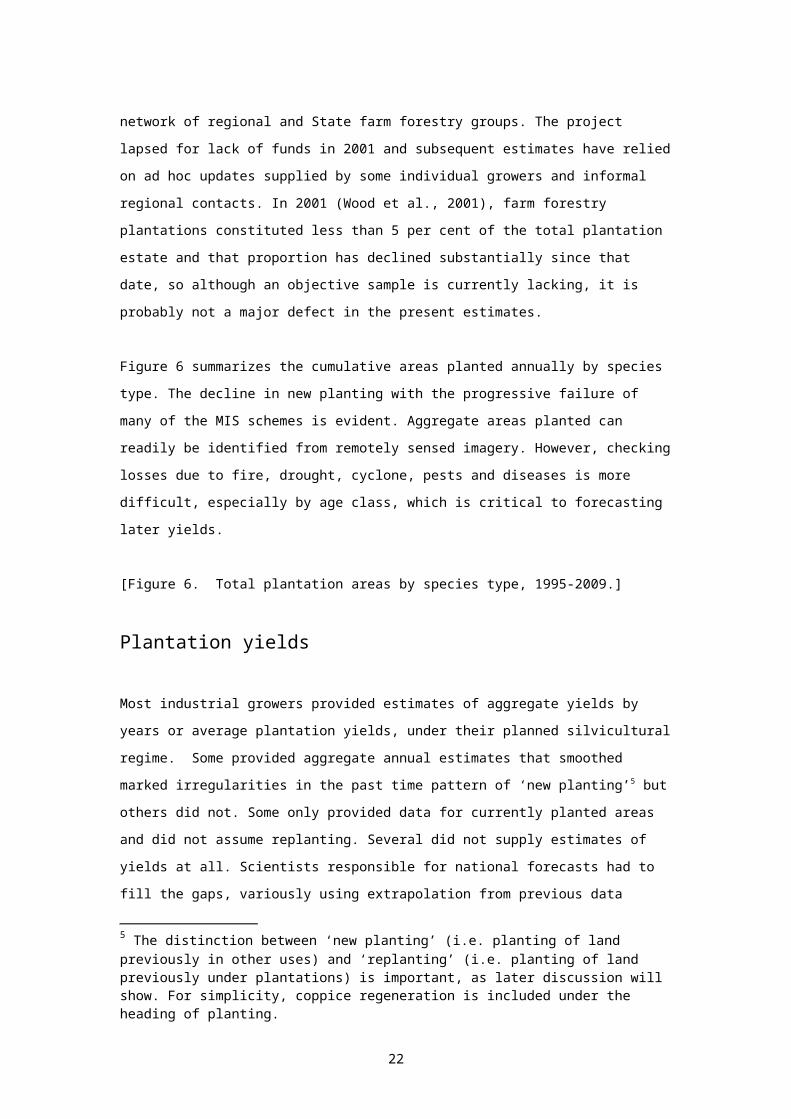
Figure 6 summarizes the cumulative areas planted annually by species
type. The decline in new planting with the progressive failure of
many of the MIS schemes is evident. Aggregate areas planted can
readily be identified from remotely sensed imagery. However, checking
losses due to fire, drought, cyclone, pests and diseases is more
difficult, especially by age class, which is critical to forecasting
later yields.
[Figure 6. Total plantation areas by species type, 1995-2009.]
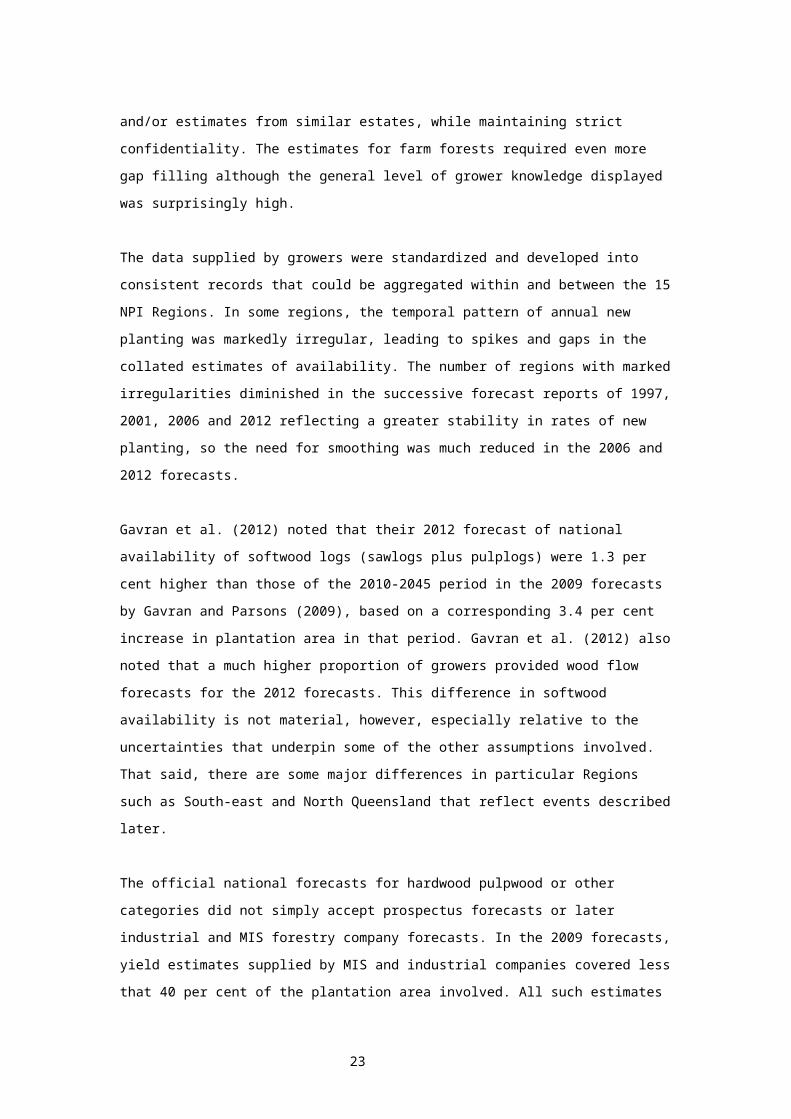
Plantation yields
Most industrial growers provided estimates of aggregate yields by
years or average plantation yields, under their planned silvicultural
regime. Some provided aggregate annual estimates that smoothed
marked irregularities in the past time pattern of ‘new planting’5 but
others did not. Some only provided data for currently planted areas
and did not assume replanting. Several did not supply estimates of
yields at all. Scientists responsible for national forecasts had to
fill the gaps, variously using extrapolation from previous data
5 The distinction between ‘new planting’ (i.e. planting of land previously in other uses) and ‘replanting’ (i.e. planting of land previously under plantations) is important, as later discussion will show. For simplicity, coppice regeneration is included under the heading of planting.
22
and/or estimates from similar estates, while maintaining strict
confidentiality. The estimates for farm forests required even more
gap filling although the general level of grower knowledge displayed
was surprisingly high.
The data supplied by growers were standardized and developed into
consistent records that could be aggregated within and between the 15
NPI Regions. In some regions, the temporal pattern of annual new
planting was markedly irregular, leading to spikes and gaps in the
collated estimates of availability. The number of regions with marked
irregularities diminished in the successive forecast reports of 1997,
2001, 2006 and 2012 reflecting a greater stability in rates of new
planting, so the need for smoothing was much reduced in the 2006 and
2012 forecasts.
Gavran et al. (2012) noted that their 2012 forecast of national
availability of softwood logs (sawlogs plus pulplogs) were 1.3 per
cent higher than those of the 2010-2045 period in the 2009 forecasts
by Gavran and Parsons (2009), based on a corresponding 3.4 per cent
increase in plantation area in that period. Gavran et al. (2012) also
noted that a much higher proportion of growers provided wood flow
forecasts for the 2012 forecasts. This difference in softwood
availability is not material, however, especially relative to the
uncertainties that underpin some of the other assumptions involved.
That said, there are some major differences in particular Regions
such as South-east and North Queensland that reflect events described
later.
The official national forecasts for hardwood pulpwood or other
categories did not simply accept prospectus forecasts or later
industrial and MIS forestry company forecasts. In the 2009 forecasts,
yield estimates supplied by MIS and industrial companies covered less
that 40 per cent of the plantation area involved. All such estimates
23
were checked for reasonableness. Yields for the remainder of the area
(60 per cent) were based on personal estimates by the respective
authors as documented in the reports – for example, an average of 17
m3 ha-1 y-1 was applied to that 60 per cent of blue gum growers, rather
than the prospectus figures of 20 to 25 m3 ha-1 y-1 commonly used in
the main growing regions. Even so, it is now apparent from the MIS
data and 2012 national forecasts for hardwoods that the actual mean
annual increment may be closer to 15 m3 ha-1 y-1.
The 2012 forecast of hardwood availability (sawlog plus pulplogs) was
15 per cent lower than the 2009 forecasts for the period 2010-2019,
notwithstanding an increase in the hardwood plantation area of 31.4
per cent over the period 2005-2012. This period is used here because
it is least affected by assumptions about replanting, given that the
overwhelming majority of the harvest will be for pulpwood grown on
short rotations. According to Gavran et al. (2012), the 2012 changes
reflect hardwood growers revising downwards their projected yields
together with some adjustment for losses of area due to pests,
diseases and cyclones. A much higher response by growers was also
apparent compared with the 2009 forecasts. Comparisons of individual
Regions indicate that the national decrease was largely due to
decreases in Western Australia, Green Triangle, Tasmania and South-
east Queensland, where the largest areas of hardwood plantations lie.
Another very significant change between the 2009 and 2012 forecasts
is the reduction in hardwood sawlog yields and increase in pulpwood
yields with the realization that to obtain quality sawlogs, pruning
and thinning will be needed (Nolan et al., 2005) and was not done on
much of the earlier sawlog planting.
Some senior figures in the industry have argued that the MIS forestry
company forecasts of future ‘log supply’ were much too high and by
inference that present and past national forecasts of availability
24
were also much too high (Parsonson, 2010). However, little difference
exists between the values given by a leading industry source
(Parsonson, 2010) and those in this paper for national hardwood
pulpwood availability in 2015-2019, those in 2012 national forecast
being generally slightly lower.
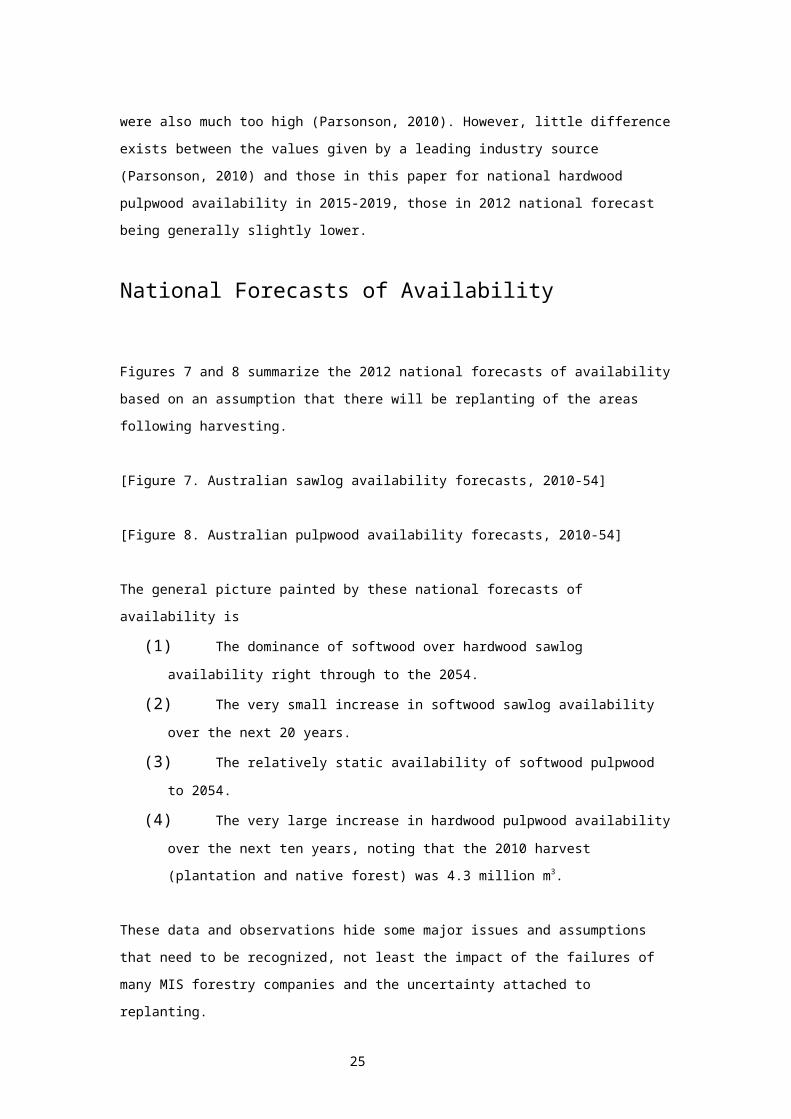
National Forecasts of Availability
Figures 7 and 8 summarize the 2012 national forecasts of availability
based on an assumption that there will be replanting of the areas
following harvesting.
[Figure 7. Australian sawlog availability forecasts, 2010-54]
[Figure 8. Australian pulpwood availability forecasts, 2010-54]
The general picture painted by these national forecasts of
availability is
(1) The dominance of softwood over hardwood sawlog
availability right through to the 2054.
(2) The very small increase in softwood sawlog availability
over the next 20 years.
(3) The relatively static availability of softwood pulpwood
to 2054.
(4) The very large increase in hardwood pulpwood availability
over the next ten years, noting that the 2010 harvest
(plantation and native forest) was 4.3 million m3.
These data and observations hide some major issues and assumptions
that need to be recognized, not least the impact of the failures of
many MIS forestry companies and the uncertainty attached to
replanting.
25
Some areas have also been the subject of losses that were not fully
apparent at the time of the last collection of area data (2009-2010)
or to losses subsequent to that collection of data. North Queensland
has suffered major losses of earlier plantings through pests and
disease problems and cyclone damage. Elders Forestry (previously ITC)
wrote off 25,650 ha of pulpwood plantations in Central Queensland
(Elders Ltd, 2010). Kirramyces spp, a fungal pathogen, attacked E
grandis x E. camaldulensis hybrids severely. Quambalaria spp, another
pathogen, attacked Corymbia citriodora sub, variegata solidwood
plantations somewhat less severely and most were replanted to other
species. In part,the 2012 forecasts reflect these problems and some
cyclone damage between 2006 and 2010, but the full effect of pests
and diseases may further reduce the hardwood availabilities.
In addition, the 2011 cyclone6 destroyed nearly 20,000 ha of softwood
and hardwood plantations in the Cardwell area now owned by FPQ
Plantations Pty Ltd. Lindsay and Dickinson (2012) subsequently
carried out a comprehensive analysis of the influence of cyclonic
winds on hardwood plantations in North Queensland. These cyclone
losses are not fully reflected in the Gavran et al. (2012) forecasts
as the damage came after the collection of area data and other
statistics. As is the case of damage due to pests and diseases, some
hardwood species appear more resistant to wind damage than others and
genetic variation may provide more resistant provenances (e.g. Luo et
al., 2006).
Blue gum plantations at Esperance in Western Australia also suffered
lower growth rates than expected due to drought and higher port and
harvesting costs than expected (Elders Ltd, 2010), such that they are
6 Former students of Dr. Max Jacobs may be prompted to remember his cautionary tale of why tropical coastal forests in North Queensland fail to attain the height of their Southern counterparts, despite generally better growing conditions.
26
unlikely to be replanted if harvest proves viable. It seems likely
that this change was not reflected in the forecasts for Western
Australia.
Is the Current Methodology Tenable in
Future?
National forecasts provide an overall picture that can help with
assessments of national supply and demand, but they are not all that
useful in guiding investment decisions, which are regionally based.
This shift from national to regional focus will place additional
pressures on the accuracy of the NPI. While the 2012 forecasts were
aided by a much better response on wood flows from the large growers,
I doubt that that situation will remain.
The competitive nature of what is now a largely privately-owned
industry places great strain on the willingness of individual
companies to provide such data, unless legally required to do so.
Most would argue that a legal requirement to do so would be unfair
and costly, relative to other industries. The NPI has done an
excellent job in maintaining confidentiality of data, but that
becomes harder to manage with respect to the publication of the final
results as growers and processors agglomerate and individual entities
become more dominant in individual regions and even across regions.
Moreover, there is no national definition of standards of the
description of log products, as witness KPMG (2012) comments on the
structure of the log price index for softwoods. Furthermore, the
numbers of hardwood log assortments are increasing, as witness the
27
Tasmanian situation of high quality sawlogs, lesser quality sawlogs,
veneer logs, peeler arisings and pulpwood (Gavran et al., 2012).
When area data are received from growers, they are verified using pre
viously supplied data and remote sensing. Yields are verified using A
BARES data, published information and expert knowledge to ensure that
they are within an expected range. However, there are no penalties
for supplying incorrect data and the opportunities for checking are
limited. Some MIS data provided prior to 2012 were clearly based on
early Prospectus statements and had to be reduced substantially.
While valuable, the present methodology lacks a scientific basis in
which data definitions and sampling are consistent, objective and
capable of audit, and allowing error bounds to be estimated. The
bounds attached to all past estimates are probably very large, even
ignoring the uncertainties of the assumptions about automatic
replanting. More importantly, some marked changes in log products mix
have taken place between the 2009 to the 2012 forecasts, especially
involving previously categorized sawlogs being reclassified and sold
as pulpwood, making it more difficult to assess change in the
standing volume of both those products over time. This is not a
criticism of the 2012 forecasts because the changes appear well-
founded but it highlights the past lack of objective reconciliation
data that enable structural changes in product mix to be assessed as
part of the ongoing changes that inevitably go on, in addition to
growth.
Finally, plantation inventory of the availability of timber resources
is based on a largely independent process to that of the inventory of
forest carbon sources and sinks by the Australian Government, and
overlaps some of the same inventory issues. The technology now
available for remote sensing of plantation areas and productivities
provides a possible platform for a better and different form of NPI
28
in which the interactions with industrial plantation owners may be
more to do with:
· continuing to ensure consistent and objective area data,
· establishing a modest national sampling base to estimate key
growth and yield metrics,
· reconciling actual against predicted volumes harvested,
· surveying landowner attitudes to replanting,
· adapting the carbon measurement tools for application to grower
data on net growth and removals, and
· estimating error bounds.
This is in contrast to the present system that includes requesting
commercially sensitive data on predicted wood flows from growers
that, in my view, may become increasingly difficult to obtain and
interpret at a regional level. As a referee has pointed out, such
regional data collection might better be left to commissioned studies
by consultants.
Regional Forecasts
The major investment decisions are made regionally because they
relate to large-scale processing and the need for access to rail and
road infrastructure to service major cities, and ports to service
exports. So let us examine some of the major regions and see what the
most recent forecasts (Gavran et al., 2012) reveal or hide in relation
to policy issues–it is a bit of both.
Short-rotation plantations
The Western Australia and Green Triangle forecasts for hardwood
pulpwood in Figure 9 tell a similar story. They both involve a very
large increase in annual volumes available from the present levels of
harvest. No significant new planting is likely, at least in the next
29
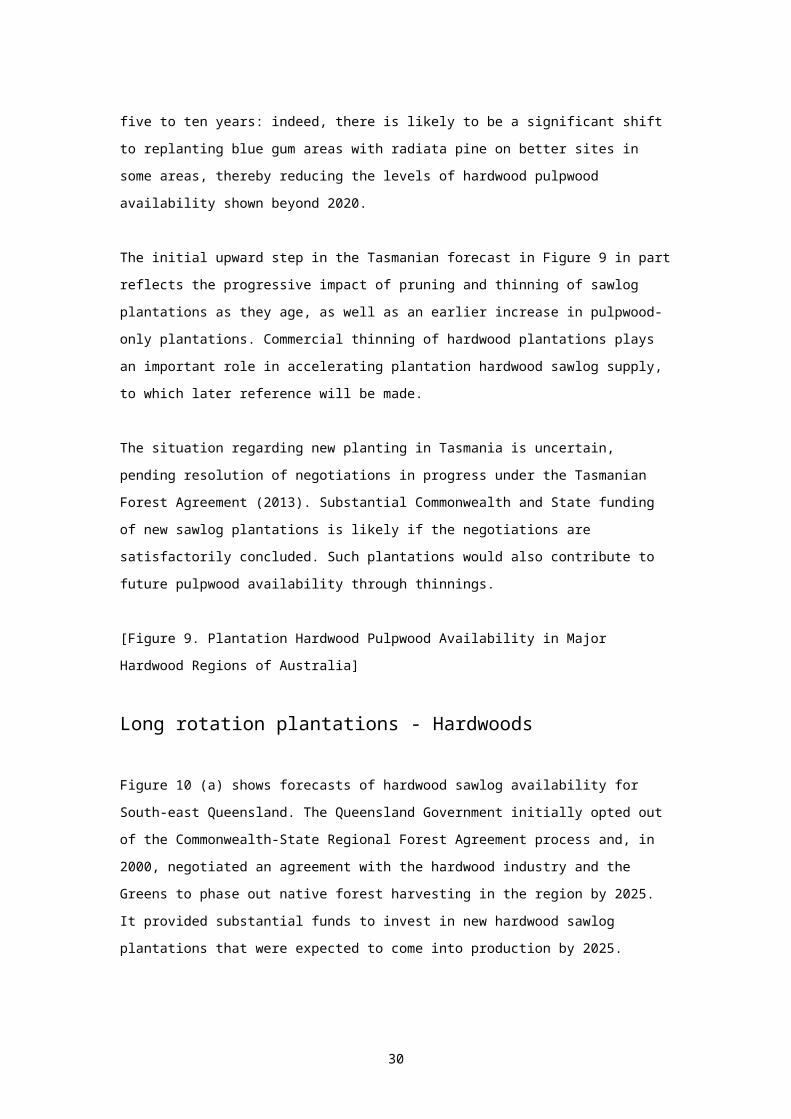
five to ten years: indeed, there is likely to be a significant shift
to replanting blue gum areas with radiata pine on better sites in
some areas, thereby reducing the levels of hardwood pulpwood
availability shown beyond 2020.
The initial upward step in the Tasmanian forecast in Figure 9 in part
reflects the progressive impact of pruning and thinning of sawlog
plantations as they age, as well as an earlier increase in pulpwood-
only plantations. Commercial thinning of hardwood plantations plays
an important role in accelerating plantation hardwood sawlog supply,
to which later reference will be made.
The situation regarding new planting in Tasmania is uncertain,
pending resolution of negotiations in progress under the Tasmanian
Forest Agreement (2013). Substantial Commonwealth and State funding
of new sawlog plantations is likely if the negotiations are
satisfactorily concluded. Such plantations would also contribute to
future pulpwood availability through thinnings.
[Figure 9. Plantation Hardwood Pulpwood Availability in Major
Hardwood Regions of Australia]
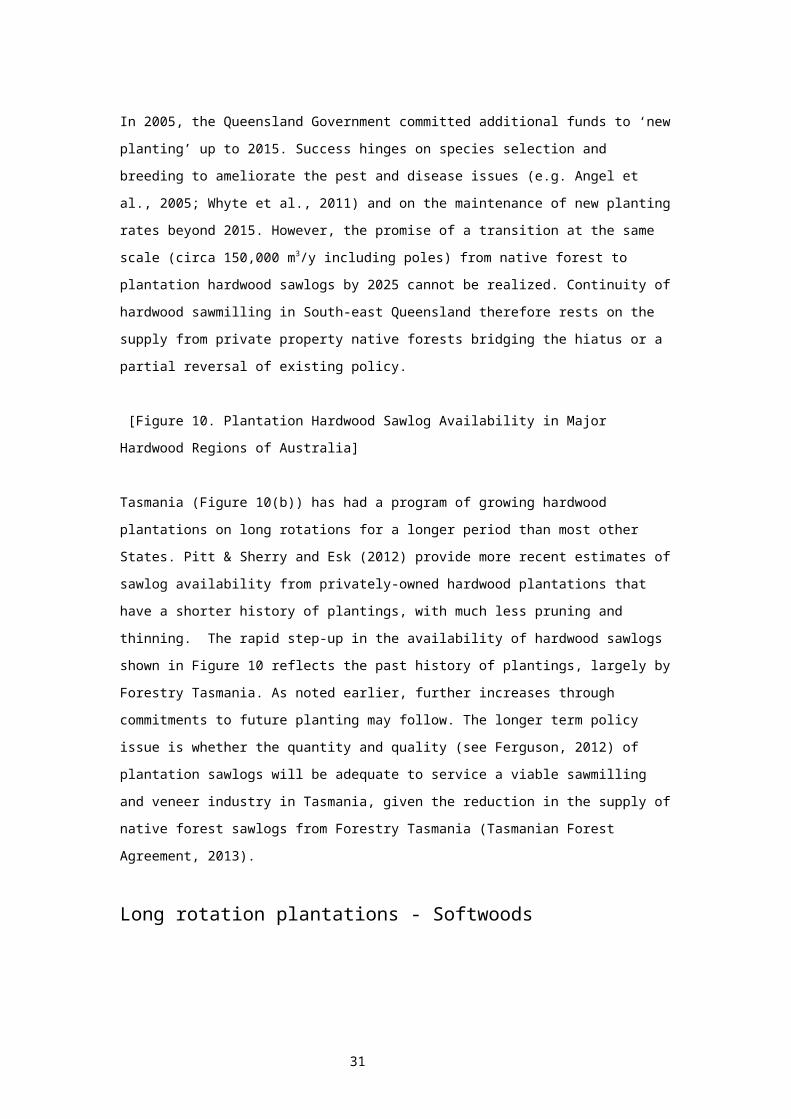
Long rotation plantations - Hardwoods
Figure 10 (a) shows forecasts of hardwood sawlog availability for
South-east Queensland. The Queensland Government initially opted out
of the Commonwealth-State Regional Forest Agreement process and, in
2000, negotiated an agreement with the hardwood industry and the
Greens to phase out native forest harvesting in the region by 2025.
It provided substantial funds to invest in new hardwood sawlog
plantations that were expected to come into production by 2025.
30
In 2005, the Queensland Government committed additional funds to ‘new
planting’ up to 2015. Success hinges on species selection and
breeding to ameliorate the pest and disease issues (e.g. Angel et
al., 2005; Whyte et al., 2011) and on the maintenance of new planting
rates beyond 2015. However, the promise of a transition at the same
scale (circa 150,000 m3/y including poles) from native forest to
plantation hardwood sawlogs by 2025 cannot be realized. Continuity of
hardwood sawmilling in South-east Queensland therefore rests on the
supply from private property native forests bridging the hiatus or a
partial reversal of existing policy.
[Figure 10. Plantation Hardwood Sawlog Availability in Major
Hardwood Regions of Australia]
Tasmania (Figure 10(b)) has had a program of growing hardwood
plantations on long rotations for a longer period than most other
States. Pitt & Sherry and Esk (2012) provide more recent estimates of
sawlog availability from privately-owned hardwood plantations that
have a shorter history of plantings, with much less pruning and
thinning. The rapid step-up in the availability of hardwood sawlogs
shown in Figure 10 reflects the past history of plantings, largely by
Forestry Tasmania. As noted earlier, further increases through
commitments to future planting may follow. The longer term policy
issue is whether the quantity and quality (see Ferguson, 2012) of
plantation sawlogs will be adequate to service a viable sawmilling
and veneer industry in Tasmania, given the reduction in the supply of
native forest sawlogs from Forestry Tasmania (Tasmanian Forest
Agreement, 2013).
Long rotation plantations - Softwoods
31
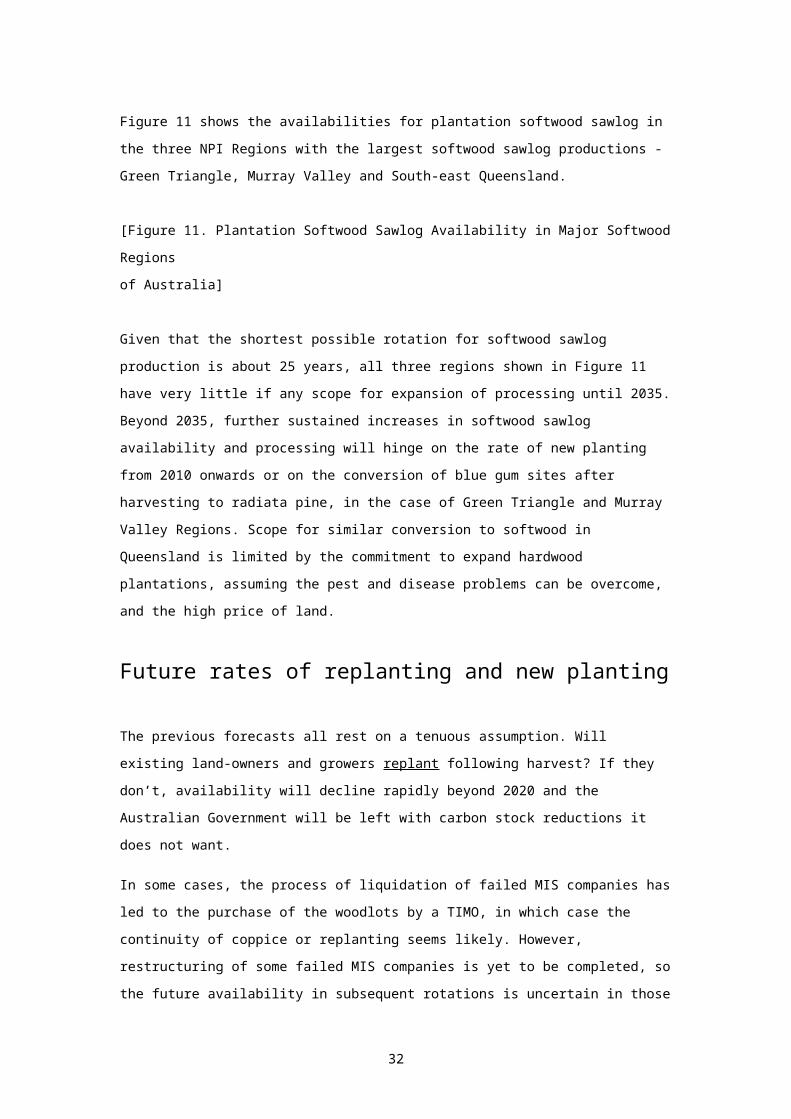
Figure 11 shows the availabilities for plantation softwood sawlog in
the three NPI Regions with the largest softwood sawlog productions -
Green Triangle, Murray Valley and South-east Queensland.
[Figure 11. Plantation Softwood Sawlog Availability in Major Softwood
Regions
of Australia]
Given that the shortest possible rotation for softwood sawlog
production is about 25 years, all three regions shown in Figure 11
have very little if any scope for expansion of processing until 2035.
Beyond 2035, further sustained increases in softwood sawlog
availability and processing will hinge on the rate of new planting
from 2010 onwards or on the conversion of blue gum sites after
harvesting to radiata pine, in the case of Green Triangle and Murray
Valley Regions. Scope for similar conversion to softwood in
Queensland is limited by the commitment to expand hardwood
plantations, assuming the pest and disease problems can be overcome,
and the high price of land.
Future rates of replanting and new planting
The previous forecasts all rest on a tenuous assumption. Will
existing land-owners and growers replant following harvest? If they
don’t, availability will decline rapidly beyond 2020 and the
Australian Government will be left with carbon stock reductions it
does not want.
In some cases, the process of liquidation of failed MIS companies has
led to the purchase of the woodlots by a TIMO, in which case the
continuity of coppice or replanting seems likely. However,
restructuring of some failed MIS companies is yet to be completed, so
the future availability in subsequent rotations is uncertain in those
32
cases. Brand (2012), Managing Director of New Forests Pty Ltd - now
one of the largest owners of former MIS plantation land, stated that,
for the former Great Southern Plantation estate, he expected that
about one third of those hardwood plantations may revert to
agricultural uses and one third may convert to softwood plantation,
leaving one third as hardwood plantation. Changes of such magnitude,
especially if applied to other former MIS blue gum estates as well,
will have major implications for land prices, rural employment, and
investment in processing industries and/or export facilities.
One factor favoring retention of coppice or replanting is that
reversion from plantation to pasture or other crops incurs a
substantial cost - indicatively, between $750 ha-1 and $1500 ha-1. The
receipt of a major cash flow at the time of harvest may also
encourage owners to let the coppice grow or to replant non-coppicing
species. But owners will still need to invest further in some tending
and protection and, where relevant, to pay lease fees. That is where
assistance may be vital to the remaining small woodlot (as distinct
from TIMO) owners, especially in creating confidence as to the future
markets. In any event, the attitude of owners to replanting will be
critical to realizing these forecasts of availability in the long
term.
What, if any, policy provisions should support replanting? The
plantation industry will not be eligible to receive Renewable Energy
Certificates enabling carbon trading (Australian Government, 2011).
Unlike new planting (see later), the public benefit from replanting
rests on carbon sequestration alone, for which the only provision is
the waiver on the carbon tax on fuel used in forest-based harvesting
and haulage. Unless other measures are introduced, replanting will
rest solely on the attitude of the owner to the costs and benefits of
wood production. MIS tax avoidance provisions are likely to be much
less important in encouraging replanting now that much of the
33
hardwood plantation estate is owned by TIMOs who are likely to reduce
the costs of management and control by progressively winding up
rather than expanding MIS schemes.
‘New planting’ is planting on new sites previously cleared for
agriculture prior to 1990 (i.e. new ‘Kyoto forest’). It has clear
public benefits in the form of structural adjustment assistance that
enables ageing farm-owners to realize on their assets and retire
(Mackarness and Malcolm, 2006), as well as potential benefits from
carbon sequestration (Garnaut, 2008). These two benefits provide the
major policy rationale for MIS-type arrangements, albeit with much
tighter regulation in the future.
Future rates of new planting are extremely uncertain in the short
term because of the impact of the current mining boom on the exchange
rate, together with the impact of high prices of suitable land
spawned by competition for land by MIS forestry companies and other
factors (Schirmer, 2009), the uncertainties pertaining to Tasmania,
and the possible conversion of substantial areas on MIS hardwood
plantation back to agriculture or to softwood plantation.
The current mining boom has resulted in a major change in exchange
rates such that imports of sawn timber from Northern Europe into
Eastern Australia have risen from almost zero to about 14 per cent in
2010-11, placing the domestic producers under severe competitive
stress. Experience from the previous mining boom suggests that the
impact of the boom will ease progressively and exchange rates will
drop, gradually easing the competition from European imports,
especially once the European economy recovers. Nevertheless, the next
three years or so will not be conducive to new planting because of
the high, albeit declining, exchange rate and because of the high
prices for land engendered by the MIS schemes.
34
Some observers argue that current land prices make softwood planting
or replanting uneconomic and predict an absolute halt to expansion.
However, over the next 5 to 10 years, inflation and the MIS
plantation use changes predicted by Brand (2012) will progressively
reduce the real (inflation free) price of land from the current high
prices engendered by the MIS boom. Moreover, between 1 and 3 per cent
of agricultural properties in NPI regions are sold each year
(Schirmer, 2009). If those properties are strategically located or
provide economies of scale so that they are accretive to overall
returns, existing plantation companies will buy them. The possibility
of a complete halt to new planting is overstated – an initially slow
but progressively increasing rate of replanting is more likely.
In southern Australia, much hinges on a possible shift of some areas
from blue gum to radiata pine. While the Western Australia, Green
Triangle and Murray Regions are likely to have low levels of ‘new
planting’ under present policies, they may see substantial change
from blue gum to radiata pine on the more productive sites as
harvesting of the former proceeds, assuming the returns are
accretive.
Nevertheless, virtually all the available volume from existing
plantations is presently committed in the key regions and the
projected increases in the domestic availability beyond 2020 are
unlikely to accommodate expected future increases in domestic demand
for softwood timber. Much therefore rests on the future trends in
timber, stumpage and land prices. If European imports decline
markedly beyond 2015 and domestic timber and stumpage prices rise as
a result, a modest expansion of new planting of softwoods could be
engendered, conditional on agricultural land prices remaining stable
or declining at the that time. Too large an increase in stumpage
price, however, would in turn reduce the demand for sawn structural
timber and advantage competitive materials and imports somewhat.
35

For both replanting and new planting, much also depends on carbon
sequestration policies: in particular, the price imposed on carbon,
especially as it affects competitive materials such as steel and
cement. Present indications are that subsidies to the steel industry
will largely (94.5 per cent) offset the proposed carbon tax for the
next three years and, if recent media reports are to be believed,
possibly up to 2017. The pegged Australian price for carbon is
currently markedly above the European market price. International
trading of emissions credits is scheduled to commence in July 2015,
introducing volatility in carbon prices thereafter. The threat of the
Federal Opposition to abandon the emissions trading scheme in favour
of incentives, if it is elected to govern, has created even more
uncertainty.
In addition, much hinges on future development in the mining sector
and its impact on the Australian economy and, in turn, on continuing
economic growth in China and India; exports of pulpwood and lower
grades of softwood sawlog being very much linked to these
developments. Australia is a relatively small trade-exposed economy
and must now ride the cyclical waves of the global economy.
All of these trends and associated uncertainties add weight to the
need for an integrated national forest policy on plantations. Given
the dominance of private ownership in the processing industry and
now, the plantation estate, such a policy should aim principally at
providing information on the national plantation estate and reducing
impediments to invest in both the plantation estate and processing,
to better enable the plantation sector to ride those cyclical waves.
The role for direct subsidies is probably small and mainly confined
to small landowners and small processors, based on clear public
benefits such as structural adjustment, innovation, infrastructure
and rural employment and diversification.
36
Conclusions
Plantation policy in Australia is approaching critical crossroads.
The Australian Government, State Governments and forestry industry
need to develop a coherent national plantation policy if they wish to
maintain and expand rural manufacturing and employment that is
internationally cost-competitive and contributing significantly to
carbon sequestration and other environmental values. Restoring
community and investor confidence about future investment in the
plantation estate and processing industry is an important component
of that policy. Ongoing support for the NPI facility is needed to
ensure it can develop the methodologies and the systems to meet the
challenges to delivering a less intrusive but more objective
inventory at a national level.
More attention also needs to be given to the need for expansion of
industrial softwood plantations in key regions to facilitate
progressive scaling up of manufacturing industry, in the battle to
maintain an internationally competitive manufacturing base. This
necessitates a greater focus on encouragement and assistance to
expanding the plantation base in key regions, in concert with
measures relating to carbon sequestration, reducing risk and
transaction costs, and rural structural adjustment.
Acknowledgements
Special thanks go to Claire Howell, Mark Parsons, and Stuart Davey
and Blair Freeman for their comments. The work of the first four and
of others in ABARES in maintaining the present form of the NPI merits
special recognition. The participants of the plantation growing and
management sector also merit thanks for their significant ongoing
37
commitment and contribution to the NPI since its establishment in the
mid-1990s.
A preliminary version of this paper was presented at the 2011 ANZIF
Conference in Auckland. In the course of this revision, data errors
were discovered in MIS data supplied by a confidential source. Most
of the results still hold but reporting of some results with low
sample numbers could no longer be justified. The author takes sole
responsibility for the views expressed and acknowledges a vested
interest as a Director of a major softwood plantation company.
Literature CitedAdviser Edge (2008). 2007-2008 Timbercorp (Single Payment) Timberlot
Project. The author, Melbourne, 24pp.
Angel, P.J., Nichols, J.D. and Stone, C., 2003. Growth increments of
Eucalyptus dunnii subsequent to damage by Creiis literatus
(Hemiptera:Psyllidae). p192-5 in E.G Mason and C.J.Perley (Eds),
Proceedings 2003 ANZIF Conference, Queenstown, New Zealand,
Ministry of Agriculture and Forestry, Wellington.
Australian Agribusiness Group (2008). Agribusiness MIS Industry Repo
rt of Funds Raised, July 2008. The author, Melbourne, 10pp.
Australian Agribusiness Group (2010). Macquarie Forestry Investment
2010: Retail Investment Research- May 2010. The author, Melbourn
e, 10pp.
Australian Government, (2011). Working together for a Clean Energy Fu
ture: Forest Activities. Available on http://www.cleanenergyfutu
re.gov.au/forest-activities/
Brand, D. (2012). Investing in a Sustainable Australian Forest Secto
r. Remarks by David Brand to the Forestworks ‘Australian Forest
Industry Development Conference’, Canberra, October 2012. New Fo
rests, Sydney, 7pp.
Elders Forestry (2010). Diversified Forestry Project, 2010. Product D
38
isclosure Statement. Elders Forestry, Melbourne, 64pp
Elders Ltd, (2010). Completion and Outcome of Forestry Asset Review,
3 May 2010. Company Announcements Office, Australian Securities
Exchange, 8pp
Elders Ltd, (2011). Completed and intended asset sales and earnings e
xpectations. Elders Ltd, Adelaide, 3 pp.
FEA (2008). Canopy, Winter 2008. Forest Enterprises Australia,
Launceston.
Ferguson, Ian (2012). Forestry Tasmania’s Sustainable Yield under the
Australian Forestry Standard. Report commissioned by NSC
International, Melbourne, 40pp. Available on
http://www.forestrytas.com.au/uploads/File/pdf/pdf2012/appendix_
a_ferguson_report.pdf
Ferguson, I., Bull, L. and Gorrie, G. (2009). Improving the
Investment Climate for Australian Forest Industries. Paper
prepared for the Asia-Pacific Forestry Commission, May 2009, The
authors, Melbourne, 50pp
Ferguson, I., Fox, J., Baker, T., Stackpole, D. and Wild, I. (2002).
Australian and regional wood availability, 2001-2044.
Consultant’s report for the 2002 National Plantation Inventory,
Bureau of Rural Sciences, Canberra, 88pp.
Garnaut, R. (2008). The Garnaut Climate Change Review: Final Report.
Cambridge University Press, Cambridge, Canberra, 680pp.
Gavran, M. and Parsons, M. (2011). Australia’s plantations statistics
2011. Australian Bureau of Agricultural and Resource Economics
and Sciences, Canberra. 43pp.
Gavran, M., Frakes, I., Davey, S. and Mahendrarajah, S. (2012). Austr
alia’s plantation log supply 2010–2054, Australian Bureau of
Agricultural and Resource Economics and Sciences, Canberra, 55p
p. Available on http://adl.brs.gov.au/data/warehouse/afplsd9abfe
001/afplsd9abfe00120120515/AustLogSupply2012_2054_v.1.0.0.pdf
GSP (2006). Great Southern Plantations 2005 & 2006 Projects, Product
Disclosure Statement, the author, Perth, 84pp.
39
Harper, R. J., Smettem, K.R.J. and Tomlimson, R.J. (2005). Using soil
and climatic data to estimate the performance of trees, carbon
sequestration and recharge potential at the catchment scale.
Australian Journal of Experimental Agriculture 45:1189-1401
Howell, C. and Mutendeudzi, M. (1997) National Plantation Inventory
of Australia. Proceedings of the Australia New Zealand
Institute of Foresters, Canberra, April 1997 p321-328
ITC Project Management Limited (2009). Diversified Forestry Project
2009, Supplementary Product Disclosure Statement. ITC Project
Management Limited, Melbourne, 4pp.
Knott, Jim (2011) Estimating plantation productivity: Lessons learnt
from a Blue Gum Retrospective. Powerpoint presentation to a
Continuing Professional Development Workshop organised by the
Australian Consulting Foresters Association of the Institute of
Foresters of Australia, Melbourne, 2011. Available on
http://www.forestry.org.au/news/articlefiles/1821-Jim
%20Knott.pdf
KPMG (2008). Independent Forestry Specialist Review of Valuation Data
5, Great Southern Blue Gum Projects 1998 to 2002, October 2008.
KPMG Corporate Finance (Aust) Pty. Ltd.
KPMG (2012). Australian Log Price Index (Stumpage), January to June,
2012. KPMG, Melbourne, 19pp.
Lindsay, A. and Dickinson, G. (2012). Influence of cyclonic winds on
the performance of hardwood plantations in tropical north
Queensland. Queensland Department of Agriculture, Fisheries and
Forestry, Brisbane, 38pp.
Luo, J., Arnold, R.K. and Aken, K. (2006). Genetic variation in
growth and cyclone resistance in Eucalyptus pellita in south-
western China. Australian Forestry 69 (1):32-47
Mackarness, P. and B. Malcolm (2006). Public policy and managed
investment schemes for hardwood plantations. Extension Farming
Systems Journal 2(1):105-116
40
Miehle, P., Battaglia. M., Sands, P.J., Forrester, D.I., Feikema, P.
M.,Livesley, S.J., Morris, J.M. and Arndt, S.K. (2009). A compar
ison of four process-based models and a statistical regression m
odel to predict growth of Eucalyptus globulus plantations. Ecolo
gical Modelling 220:734-746
Nambiar, S. and Ferguson I. (2005). (Eds) New Forests: Wood
Production and Environmental Services. CSIRO Publications,
Melbourne.
National Forest Inventory (1997). National Plantation Inventory of Au
stralia, Bureau of Rural Sciences, Canberra, 96pp.
Nolan, G., Greaves, B., Washusen, R., Parsons, M. & Jennings, S.
(2005). Eucalypt Plantations for Solid Wood Products in
Australia - A Review, ‘If you don’t prune it, we can’t use it’.
FWPRDC project Report PN04.3002, Forest & Wood Products
Research & Development Corporation, Melbourne: 138pp.
Parliamentary Joint Committee on Corporations and Financial Services
(2009). Inquiry into aspects of agribusiness managed investment
schemes. Commonwealth of Australia, Canberra. Available on www.p
lantations2020.com.au/assets/acrobat/MISParliamentaryInquiry.pdf
Parsons, M., Frakes, I. and Gavran, M. (2006). Australia’s plantation
log supply, 2005-2049. Bureau of Rural Sciences, Canberra, 48pp
Parsonson, D. (2010). MIS Hardwood Plantations in Australia –Where to
From Here. Paper presented to DANA Conference, Melbourne, 4 Nove
mber 2010 on ‘The Status & Trends of the Global-Pacific Rim For
est Industry: The Role of Australia & New Zealand’.
Pitt & Sherry, and Esk (2012). Potential timber production estimate f
rom the Tasmanian Private Plantation Estate. Report for the Inde
nedenedent Verification Group of the Tasmanian Intergovernmental
Forest Agreement. Pitt & Sherry, and Esk Mapping & GIS Services,
Hobart, 33pp. Available on http://www.environment.gov.au/land/fo
rests/independent-verification/pubs/ivg_woodsupply_2_estimates.p
df
Plantation 2020 Vision Implementation Committee (1997). Plantations f
41
or Australia The 2020 Vision. Ministerial Council on Forestry, F
isheries and Aquaculture, Canberra. Available on www.plantations
2020.com.au
Private Forests, Tasmania (2011). Farm forestry toolbox, V5,
Available on
http://www.privateforests.tas.gov.au/products/farm_forestry_tool
box
Queensland Government (1999). South East Queensland Forests Agreement
(SEQFA). Queensland Government, Brisbane. Available at
http://www.derm.qld.gov.au/parks_and_forests/managing_parks_and_
forests/forest_transfer_processes_in_queensland/
south_east_queensland_forests_agreement_seqfa/index.html.
Schirmer, J. (2009). Socioeconomic impacts of the plantation industry
on rural communities in Western Australia. CRC for Forestry
Technical Report 198. CRC for Forestry, Hobart.
Strandgard, M., Wang, Yue, Chong, D., Wild, I., and Baker, T. (2005).
Blue Gum Plantation Management System. Forest and Wood Product R
esearch and Development Corporation, Project No PN03.3903, FWPA
Melbourne, 79pp. http:// http://www.fwpa.com.au/node/233
Sun, D., Hnatiuk, R. and Handsford, M. (1997). A pilot study to
identify ways of conducting a national farm forestry inventory
in Australia. Australian Forestry 61(3):185-189
Tasmanian Government (2013). Tasmanian Forests Agreement. Home of the
Fasmanian Intergovernmental Forests Agreement, . Government of T
asmania, Hobart. Available on http://www.forestsagreement.tas.go
v.au
Turner, B. and James, R. (1997) Forecasting of wood flows from Austra
lia’s plantations – a report to the 1997 National Plantation Inv
entory. Bureau of Rural Sciences, Canberra. 22pp
Timbercorp (2005). 2005 Timbercorp (Single Payment) Timberlot
Project. Product Disclosure Statement. The author, Melbourne,
63pp.
42
Venn, T.J. (2005). Financial and economic performance of long-rotati
on hardwood plantation investments in Queensland, Australia. For
est Policy and Economics 7:437-454
Wang, Y. and Baker, T.G. (2007). A regionalised growth model for Euca
lyptus globulus plantations in south-eastern Australia. Australi
an Forestry 70, 93–107.
Whyte, G., Howard, K., Hardy, G.E.S., and Burgess, T.I. (2011).
Foliar pests and pathogens of Eucalyptus dunnii plantations in
southern Queensland. Australian Forestry 74(3): 161-169
Willmott Forests (2010). Premium Forestry Blend 2010 Project. Product
Disclosure Statement. Willmott Forests, Melbourne, 104pp.
Wong, J., Baker, T., Duncan, M., McGuire, D. and Bulman, P. (2000). F
orecasting Growth of Key Agroforestry Species in South-Eastern A
ustralia. Publication No. 00/68, RIRDC, Canberra, 59 pp.
Wood, M.S., Stephens, N.C., Allison, B.K., and Howell, C.I. (2001). P
lantations of Australia- A Report from the National Plantation I
nventory and the National Farm Forestry Inventory. National Fore
st Inventory, Bureau of Rural Sciences, Canberra, 172pp.
43