Using System Availability Management - Support
60
-
Upload
khangminh22 -
Category
Documents
-
view
3 -
download
0
Transcript of Using System Availability Management - Support


Mercury Business Availability CenterUsing System Availability Management
Version 6.2
Document Release Date: June 20, 2006

Mercury Business Availability Center, Version 6.2Using System Availability Management
This manual, and the accompanying software and other documentation, is protected by U.S. and international copyright laws, and may be used only in accordance with the accompanying license agreement. Features of the software, and of other products and services of Mercury Interactive Corporation, may be covered by one or more of the following patents: United States: 5,511,185; 5,657,438; 5,701,139; 5,870,559; 5,958,008; 5,974,572; 6,137,782; 6,138,157; 6,144,962; 6,205,122; 6,237,006; 6,341,310; 6,360,332, 6,449,739; 6,470,383; 6,477,483; 6,549,944; 6,560,564; 6,564,342; 6,587,969; 6,631,408; 6,631,411; 6,633,912; 6,694,288; 6,738,813; 6,738,933; 6,754,701; 6,792,460 and 6,810,494. Australia: 763468 and 762554. Other patents pending. All rights reserved.
Mercury, Mercury Interactive, the Mercury logo, the Mercury Interactive logo, LoadRunner, WinRunner, SiteScope and TestDirector are trademarks of Mercury Interactive Corporation and may be registered in certain jurisdictions. The absence of a trademark from this list does not constitute a waiver of Mercury's intellectual property rights concerning that trademark.
All other company, brand and product names may be trademarks or registered trademarks of their respective holders. Mercury disclaims any responsibility for specifying which marks are owned by which companies or which organizations.
Mercury provides links to external third-party Web sites to help you find supplemental information. Site content and availability may change without notice. Mercury makes no representations or warranties whatsoever as to site content or availability.
Mercury Interactive Corporation379 North Whisman RoadMountain View, CA 94043Tel: (650) 603-5200Toll Free: (800) TEST-911Customer Support: (877) TEST-HLPFax: (650) 603-5300
© 2005-2006 Mercury Interactive Corporation, All rights reserved
If you have any comments or suggestions regarding this document, please send them by e-mail to [email protected].
AMLIB_SAM6.2/01

iii
Table of Contents
Welcome to Using System Availability Management...........................vHow This Guide Is Organized ...............................................................vWho Should Read This Guide ..............................................................viGetting More Information ...................................................................vi
Chapter 1: Introduction to System Availability Management Reports1Overview of System Availability Management Reports ........................2System Availability Management Reports.............................................3
Chapter 2: SiteScope Over Time Reports .............................................5About SiteScope Over Time Reports......................................................6System Availability Management Reports.............................................7Working with System Availability Management Reports.....................8Monitor Performance Report ..............................................................10Cross-Performance Report...................................................................13Group Performance Report .................................................................24Status Summary Report .......................................................................27Warning Summary Report ..................................................................29Error Summary Report.........................................................................30Group Permissions for Reports............................................................32System Availability Management Data in Custom Reports................35
Chapter 3: The Event Log....................................................................37About the Event Log............................................................................38Working with the Event Log...............................................................39Working with Additional Filters for SiteScope....................................41Viewing Common Event Data in the Event Log Page ........................42Working with Event Details ................................................................44Working with Event History ...............................................................46
Chapter 4: User Reports ......................................................................49
Index....................................................................................................51

Table of Contents
iv

v
Welcome to Using System Availability Management
This guide describes how to work with the System Availability Management application in the Mercury Business Availability Center.
How This Guide Is Organized
The guide contains the following chapters:
Chapter 1 Introduction to System Availability Management Reports
Introduces the System Availability Management application.
Chapter 2 SiteScope Over Time Reports
Describes reports that enable you to analyze the performance of the infrastructure components and servers powering your applications. SiteScope Over Time reports are based on data collected by the SiteScope data collector.
Chapter 3 The Event Log
Describes how to view information about events collected from external applications/software and about SiteScope events.
Chapter 4 User Reports
Provides a pointer to the complete documentation for user reports, which are common to the Service Level Management, End User Management, and System Availability Management applications.

Welcome
vi
Who Should Read This Guide
This guide is intended for the following users of Mercury Business Availability Center:
➤ Mercury Business Availability Center administrators
➤ Mercury Business Availability Center end users
Readers of this guide should be knowledgeable about navigating and using enterprise applications, and be familiar with Mercury Business Availability Center and enterprise monitoring and management concepts.
Getting More Information
For information on using and updating the Mercury Business Availability Center Documentation Library, reference information on additional documentation resources, typographical conventions used in the Documentation Library, and quick reference information on deploying, administering, and using Mercury Business Availability Center, refer to Getting Started with Mercury Business Availability Center.

1
1Introduction to System Availability Management Reports
Mercury System Availability Management reports enable you to monitor system availability data from across the entire enterprise.
This chapter describes: On page:
Overview of System Availability Management Reports 2
System Availability Management Reports 3

Chapter 1 • Introduction to System Availability Management Reports
2
Overview of System Availability Management Reports
You use the System Availability Management application to view and analyze reports based on the performance data collected by the SiteScope data collector and stored in the Mercury Business Availability Center database.
In addition, using SiteScope Infrastructure Monitors, you can integrate data collected by enterprise management systems (such as BMC Patrol, Tivoli, Concord, and NetIQ) into Mercury Business Availability Center, and view the data in System Availability Management reports.
SiteScopeSystem Availability Management utilizes data collected by SiteScope and enables you to:
➤ monitor system availability across the entire enterprise infrastructure from a centralized, real-time perspective
➤ apply a business perspective to system management
➤ view data at the application level rather than viewing numerous low-level system metrics
➤ view information about events collected from external applications or software and SiteScope events
For details on configuring SiteScope, see Configuring SiteScope Monitors.
You access the System Availability Management reports from the System Availability Management application in the Applications menu.
For details on working with Mercury Business Availability Center reports, see “Working in Reports” in Working with Applications.
Report Access and Permissions
The availability of report data to a specific user is dependent on the profile access permissions granted that user. Further, access to specific data within a profile may also be filtered by using the group permission filters. For details on granting permissions, see “Configuring User Permissions” in Platform Administration. For details on defining group permission filters, see “Group Permissions for Reports” on page 32.

Chapter 1 • Introduction to System Availability Management Reports
3
Data Aggregation
Mercury Business Availability Center uses data aggregation to make data handling and management more efficient and to improve the speed and performance of report generation. For more information on data aggregation in Mercury Business Availability Center, see “Data Aggregation” in Reference Information.
System Availability Management Reports
The following reports are available:
Tab Name Description For Details, See...
SiteScope Over Time Reports
View and analyze reports, based on data collected by SiteScope, that help you track the performance of your infrastructure machines and provide insight into application availability and performance.
Chapter 2, “SiteScope Over Time Reports”
Event Log View event data over time, events that happened at a specific time, the details of a specific event, and event history.
Chapter 3, “The Event Log”
User Reports Provides tools for creating, and displays, reports that are tailored to the specific monitoring requirements of your organization or business unit.
Report data is based on Business Process Monitor, Client Monitor, WebTrace/Traceroute Monitor, SiteScope, and Custom data.
Chapter 4, “User Reports”

Chapter 1 • Introduction to System Availability Management Reports
4

5
2SiteScope Over Time Reports
Mercury System Availability Management enable you to analyze the performance of the infrastructure components and servers powering your applications. SiteScope Over Time reports are based on data collected by the SiteScope data collector.
This chapter describes: On page:
About SiteScope Over Time Reports 6
Working with System Availability Management Reports 8
Monitor Performance Report 10
Cross-Performance Report 13
Group Performance Report 24
Status Summary Report 27
Warning Summary Report 29
Error Summary Report 30
Group Permissions for Reports 32
System Availability Management Data in Custom Reports 35

Chapter 2 • SiteScope Over Time Reports
6
About SiteScope Over Time Reports
You use the System Availability Management application to view and analyze reports based on the infrastructure machine-related data collected by the SiteScope data collector and stored in the Mercury Business Availability Center database. You cross-reference this data with transaction performance problems, such as slow transaction response times and failed transactions, to understand the root cause of application performance issues.
The contents of SiteScope Over Time reports depend on the types of SiteScope monitors and measurements that are defined in Monitor Administration. For details on configuring SiteScope monitors, see Configuring SiteScope Monitors.
Mercury Business Availability Center users can use group permissions filters to control the data that System Availability Management reports display. This enables filtering data that may be irrelevant to a specific user, making reports more manageable and report generation faster. For details, see “Group Permissions for Reports” on page 32.
Note: If a SiteScope profile contains many measurements, report generation can take a few minutes.

Chapter 2 • SiteScope Over Time Reports
7
System Availability Management Reports
The following System Availability Management reports are available:
In addition, certain System Availability Management reports can be added to custom reports. For details, see “System Availability Management Data in Custom Reports” on page 35.
Category Description For Details, See...
Monitor Performance Report
Displays the best- or worst-performing SiteScope monitors across various SiteScope categories.
page 10
Cross-Performance Report
Displays data from more than one SiteScope server filtered by monitored servers, monitor types, and measurements.
page 13
Group Performance Report
Displays the infrastructure machine resource usage data for the monitors in the selected group and its subgroups.
page 24
Status Summary Report
Displays a quick snapshot of the performance of monitored infrastructure machines, organized by SiteScope group.
page 27
Warning Summary Report
Displays a list of the monitors, for the selected group and its subgroups, whose measurements fell within the Minor threshold level during the selected time period.
page 29
Error Summary Report
Displays a list of the monitors, for the selected group and its subgroups, whose measurements fell within the Critical threshold level during the selected time period.
page 30
Group Permissions for Reports
Enables you to filter data for specific SiteScope groups or subgroups from System Availability Management reports, as well as the SiteScope Monitor Performance component in custom reports.
page 32

Chapter 2 • SiteScope Over Time Reports
8
For details on generating reports, see “Working in Reports” in Working with Applications.
Note: Data collected by the SiteScope data collector can also be viewed in trend reports. Trend reports enable you to compare multiple measurements from different data sources on the same graph. For details, see “Trend Report Manager” in Working with Applications.
Working with System Availability Management Reports
System Availability Management reports help you identify server resource usage trends, as well as bottlenecks and other server-related issues that may be contributing to application performance problems. You can continually monitor report data to identify poor server performance or to spot developing trends that may lead to server performance problems.
Alternatively, when you become aware of an application performance problem with your application (for example, after analyzing End User Management reports or receiving an alert), you can use System Availability Management reports to help you identify, or rule out, infrastructure machine-related issues as the root cause of the problem. By analyzing the infrastructure machine resource usage data for the same time period during which the performance problem occurred, you can assess whether one or more infrastructure machine resource measurements are outside normal performance thresholds for that time period.
This section includes the following topics:
➤ “Color Coding in Reports” on page 9
➤ “Improving Report Generation Times” on page 9

Chapter 2 • SiteScope Over Time Reports
9
Color Coding in Reports
System Availability Management reports uses the following colors when displaying color-coded performance levels:
Improving Report Generation Times
Note to Mercury Managed Services customers: This section is not relevant for Mercury Managed Services customers.
To optimize the performance of System Availability Management report generation, we recommend that a database administrator perform an update statistics procedure on the database on a regular basis. The regularity of the update depends on the amount of data generated by the applications you are monitoring.
➤ MS SQL Server users:
➤ for a small site, you should update once every three to four days
➤ for a medium site, you should update daily
➤ for a large site, you should update every four hours.
For details on MS SQL Server maintenance, see “Maintenance Plan” in Preparing the Database Environment.
➤ Oracle Server users – Analyze all tables according to database size.
For details on optimizing performance in Oracle, see “Collecting Statistics for Databases” in Preparing the Database Environment.
Color Description
Green All measurements fell within the OK threshold range
Yellow At least one measurement fell within the critical threshold range, but no measurements fell within the minor threshold range
Red At least one measurement fell within the minor threshold range.
Gray No measurement data reported

Chapter 2 • SiteScope Over Time Reports
10
Monitor Performance Report
You generate the Monitor Performance report to view the best- or worst-performing SiteScope monitors across various SiteScope categories, such as monitor type, monitored server, or monitor title. You can generate a Monitor Performance report for multiple SiteScope profiles.
This section includes the following topics:
➤ “Generating the Monitor Performance Report” on page 10
➤ “Understanding the Monitor Performance Report” on page 11
Generating the Monitor Performance Report
To view the Monitor Performance report, you first specify the criteria upon which you want the report to be based and then generate the report.
To generate the Monitor Performance report:
1 Access the Monitor Performance report: Applications > System Availability Management > SiteScope Over Time Reports > Monitor Performance.
2 Select the SiteScope profiles for which you want to view the report.
3 From the Monitor type list, select the monitor on which you want the report data to be based. To base the report on all monitors, choose All types.
4 In the Monitor title and Server name boxes, specify the monitors (by their title, as defined in SiteScope) and/or servers on which you want the custom report data to be based.

Chapter 2 • SiteScope Over Time Reports
11
Leave a box empty to instruct Mercury Business Availability Center to base the report on all values.
If required, you can use the wildcard asterisk symbol (*) to instruct Mercury Business Availability Center to base the report on a subset of all values. For example, if you were using the naming convention cpu_<servername> to name all CPU monitors in SiteScope, specifying cpu* instructs Mercury Business Availability Center to include all CPU monitors in the custom report.
Note: Using the wildcard asterisk symbol as the first character in the string slows report generation times, as Mercury Business Availability Center is unable to use the Index tables when querying the database.
5 Specify whether you want Mercury Business Availability Center to display the worst- or best-performing monitors, and choose the number of monitors to be displayed in the report.
6 Click Generate to generate the report.
Understanding the Monitor Performance Report
The Monitor Performance report displays the following information:
Column Name Description
Monitor Title The monitor title. Use the tooltip to see the full monitor title, if required.
Server Name The name of the monitored server. Use the tooltip to see the full server name, if required.
Group The group or subgroup in which the monitor is defined. Use the tooltip to see the path from the displayed group or subgroup to the root group. Click the group or subgroup name to open the management page for the group in SiteScope.
Profile Name The name of the SiteScope profile in which the monitor is defined.

Chapter 2 • SiteScope Over Time Reports
12
Note: The Monitor Performance report does not use raw data. All data in the report is based on aggregated data.
Warning The percentage of measurement instances that return critical-level threshold status.
Error The percentage of measurement instances that return Error-level threshold status.
Total Runs The total number of measurement instances SiteScope ran for the selected time range.
Quality A color-coded representation of quality. Use the tooltip to see the exact percentage for each colored section of the bar.
Monitors are sorted in the report by quality, which is derived using a formula that takes into account the measurement values returned for the monitor during the specified time range relative to the measurement threshold ranges configured in SiteScope.
The formula used is: 1-((0.35*W+0.5*E)/(G+W+E)), where G, W, and E represent the number of measurements that occurred during the selected time range whose value was within the OK, Warning, and Error threshold range, respectively. The formula returns values from 0.5 to 1, inclusively. The better a monitor performs, the closer its value is to 1. For example, a monitor with 25% error and 75% OK values would be displayed as better than a monitor with 100% Warning values.
Column Name Description

Chapter 2 • SiteScope Over Time Reports
13
Cross-Performance Report
You can view data from more than one SiteScope filtered by monitored servers, monitor type or title, and measurements.
Using SiteScope Cross-Performance reports, you can display the behavior of a measurement running on several monitored servers, or the behavior of several measurements from various types of monitors running on one monitored server.
You can also choose to display a summary table for each monitor type. The summary table displays the percentage of uptime, warning, and failure measurements out of the total number of measurements for each selected server. Each summary table includes a summary row that indicates the uptime, warning, and error percentages for all servers for that type of monitor.

Chapter 2 • SiteScope Over Time Reports
14
When working in the Cross-Performance Reports page in System Availability Management, if you are running a SiteScope Log File or Database Query monitor that is monitoring a different machine, you should select the SiteScope machine running the monitors in the Servers list, and not the monitored machine (the target machine where the log file or database is located).
You can also re-scale the report to make it more relevant to what you are measuring.
This section includes the following topics:
➤ “Generating a SiteScope Cross-Performance Report” on page 14
➤ “Examples” on page 17
➤ “Understanding Cross-Performance Reports” on page 18
➤ “Non-Consolidated Over Time Graphs” on page 20
➤ “Consolidated Over Time Graphs” on page 18
➤ “Summary Tables” on page 22
➤ “Rescaling a SiteScope Cross-Performance Report” on page 23
Generating a SiteScope Cross-Performance Report
To view the SiteScope Cross-Performance report, specify the time period and granularity, the filters, the type of report, and generate the report.
To generate the SiteScope Cross-Performance report:
1 Access the SiteScope Cross-Performance report: Applications > System Availability Management > SiteScope Over Time Reports > SiteScope Cross-Performance.
2 Select the time period and the granularity with which you want to run the report – for details, see “Choosing the Tracking Range and Granularity” in Working with Applications.

Chapter 2 • SiteScope Over Time Reports
15
The granularity determines how many measurement samples are displayed in the report for each time interval. By default, the number of samples is limited to the maximum value of the Max Data Points in Report setting (32 by default for all reports where you can specify the granularity) and the Max Data Points in the SiteScope Cross-Performance Report setting (100 by default).
Note: You can change these settings in the Infrastructure Settings Manager. To modify these settings, select Admin > Platform > Setup and Maintenance > Infrastructure Settings, click Applications, select End User/System Availability Management and locate Max Data Points in Report and Max Data Points in the SiteScope Cross-Performance Report in the End User/System Availability Management - Data table. For details on using the Infrastructure Settings Manager, see “Infrastructure Settings” in Platform Administration.
3 Choose whether to display the monitor type or title when selecting the component to add to the report:
➤ Monitor type – the type of monitor is displayed, for example, Ping, CPU.
➤ Monitor title – the name given to the specific monitor, for example, ping: myserver, CPU finance_server.
4 Filter the data you want to include in the report:

Chapter 2 • SiteScope Over Time Reports
16
➤ From the Profile list, select one or more SiteScope profiles. The list includes the list of permitted profiles in alphabetical order.
➤ From the Server list, select one or more servers. The list includes all monitored servers associated with the selected profiles, in alphabetical order.
➤ Depending on whether you chose Filter by Monitor Type or Filter by Monitor, the Monitor Types/Monitor Titles list displays monitor types or monitor names, associated with the selected profiles and servers, in alphabetical order. Select one or more monitors.
➤ From the Measurements list, select one or more measurements. The list includes the measurements that are associated with the selected profiles, servers, and monitor types, in alphabetical order.
If you select a measurement for which data exists from more than one group or profile for the same target server, the data is averaged together in the report. For example, if you have two SiteScope profiles each containing two groups, and in three of those groups the Ping monitor is set up to monitor the same server, if you select both profiles and the round trip time measurement, all round trip time data collected from all three groups in both profiles is displayed in the report as an average value.
Note: Enter a string in one of the Contains boxes and click the filter button , to list all the elements whose name includes the string.
5 Specify whether you want to consolidate data per measurement by selecting Consolidate data per measurement – for details, see “Consolidated Over Time Graphs” on page 18 and “Non-Consolidated Over Time Graphs” on page 20). This option is selected by default.
6 If required, specify whether you want to display uptime summary tables by selecting Show uptime summary table – for details, see “Summary Tables” on page 22. This option is cleared by default.
7 If required, enter scale information in the Scale Min and Max boxes – for details, see “Rescaling a SiteScope Cross-Performance Report” on page 23.

Chapter 2 • SiteScope Over Time Reports
17
8 Click Generate to generate the report. The filter area of the page closes and the report is displayed.
Note: You cannot generate a report if you have not selected at least one measurement.
The number of selected profiles and graph lines are calculated after you click Generate. If these numbers exceed the allowed limit, a message is displayed.
9 You can print the report, send it by e-mail, or open it in Excel or PDF format. For details, see “Sharing and Storing Reports” in Working with Applications.
Note: In certain reports the selected time range is displayed along the x-axis. Mercury Business Availability Center breaks down the time range according to segments, which differ depending on the selected time range. For details on how Mercury Business Availability Center breaks down each time range in reports where time is displayed along the x-axis, see “Report Times” in Reference Information.
Depending on the time range you select, Mercury Business Availability Center generates reports using either raw data or aggregated data. The text: Note: Report uses aggregated data is displayed in the report when aggregated data is used. For details on how Mercury Business Availability Center determines when to use aggregated data, see “Data Aggregation” in Reference Information.
Examples
You can use the SiteScope Cross-Performance reports to identify a problem in a server. For example, select the SiteScope profile that refers to the SiteScope that samples the problematic server, select the relevant server, the monitor types (CPU, memory, and so forth), the measurements that can help find the problem (utilization, pages/sec, percent used, and so forth), and generate the report.

Chapter 2 • SiteScope Over Time Reports
18
You can also compare memory usage in several servers. For example, select the SiteScope profile that refers to the SiteScope that samples the servers you want to compare, the relevant servers, the memory monitor type, the pages/sec, percent used, and MB free measurements, Consolidate data per measurement, and then generate the report to compare the memory usage.
You can find out if a sub-system needs an additional server. For example, select the SiteScope profile that refers to the SiteScope that samples all servers in your sub-system, select all the servers of your sub-system, the CPU monitor type, the utilization measurements, Consolidate data per measurement, and generate the report to see whether the sub-system needs an additional server.
Understanding Cross-Performance Reports
The Cross-Performance reports can include:
➤ non-consolidated over time graphs – for details, see “Non-Consolidated Over Time Graphs” on page 20
➤ consolidated over time graphs – for details, see “Consolidated Over Time Graphs” on page 18
➤ summary tables – for details, see “Summary Tables” on page 22
You can also rescale a SiteScope cross-performance report to make it more relevant to what you are measuring; for example, if you are measuring the CPU utilization you can rescale the report so that the y-axis range is 0 to 100. For details, see “Rescaling a SiteScope Cross-Performance Report” on page 23.
Consolidated Over Time Graphs
If you select Consolidate data per measurement, the report groups data per measurement, for all the selected servers.
The graph legend shows information about the servers. The x-axis shows the time information and the y-axis shows the measurement values and the monitor type.

Chapter 2 • SiteScope Over Time Reports
19
For example, the graph represents the behavior of one measurement for all the selected servers.

Chapter 2 • SiteScope Over Time Reports
20
Non-Consolidated Over Time Graphs
If you clear Consolidate data per measurement, the report groups data per server.
The graph legend shows information about the monitors and measurements, the x-axis shows the time information, and the y-axis shows the measurement values.
For example, the graph represents the behavior of each measurement separately, grouped per server.

Chapter 2 • SiteScope Over Time Reports
21
Each graph displays information about three measurements per server. If there are more than three measurements for the server, additional graphs are added to the report with the title <server_name> continued and the other measurements for that server in alphabetical order.

Chapter 2 • SiteScope Over Time Reports
22
Summary Tables
If you select Show uptime summary table, the report displays the summary tables:
The tables are sorted in alphabetical order by monitor type. Each table includes a summary row that indicates the uptime, warning, and error percentages for all servers for that monitor type.
The summary tables display the following information:
Server – The name of the server.
Uptime % – The percentage of good measurements out of the total number of measurements.
Warning % – The percentage of warning measurements out of the total number of measurements.
Error % – The percentage of failed measurements out of the total number of measurements.

Chapter 2 • SiteScope Over Time Reports
23
Rescaling a SiteScope Cross-Performance Report
SiteScope cross-performance reports are generally scaled so that the lowest y-axis value is 0 and the highest y-axis value is the highest result of the data.
You can rescale the report to make it more relevant to what you are measuring; for example, if you are measuring the CPU utilization you can rescale the report so that the y-axis range is 0 to 100.
You can rescale the report by specifying a minimum, a maximum, or both a minimum and a maximum value in the Scale Min and Max boxes. This causes the report mechanism to rescale the report.
For example, the original report is as follows:
To rescale the range to 0-100, enter 0 in the Scale Min box and 100 in the Max box, or enter 100 in the Max box. The report is redisplayed as follows:

Chapter 2 • SiteScope Over Time Reports
24
Group Performance Report
You generate the Group Performance report and its subreports to view data that helps you spot trends in server performance that could lead to application performance problems. You can also analyze whether slow or failed transactions are being caused by server resource bottlenecks or other infrastructure machine-related problems.
This section includes the following topics:
➤ “Group Performance” on page 24
➤ “SiteScope Performance” on page 24
➤ “SiteScope Data over Time” on page 26
Group Performance
The Group Performance table is the top level of the report. For each group, the table displays a color-coded quality level, the number of subgroups, and the number of included measurements. The quality-level indicators enable you to see how monitors in the defined groups are performing. Click a group name to generate the SiteScope Performance subreport.
SiteScope Performance
The SiteScope Performance subreport displays a list of measurements collected by SiteScope for the specified group, over the selected time range. If the specified group contains subgroups, these are displayed at the top of the page. Click subgroups to view their SiteScope Performance subreports.
The SiteScope Performance subreport displays the following information:

Chapter 2 • SiteScope Over Time Reports
25
Check box – An enabled check box at left indicates that there is monitor data that can be viewed in the SiteScope Data over Time report. For details on generating this report, see “SiteScope Data over Time” on page 26.
Status – The status column, to the left of the monitor title, displays measurement threshold icons, which indicate whether the average measurement is within the OK, Warning, or Error range, as reported by SiteScope. You define measurement thresholds for each measurement when you configure the monitor in the Monitor Administration area in the Administration Console.
Monitor Title – The monitor title.
Measurement Name – The name of the measurement. Click the link to generate the SiteScope Data over Time report for that measurement. Mercury Business Availability Center displays the link only if data exists for the selected time range. For details on the SiteScope Data over Time report, see “SiteScope Data over Time” on page 26.
Host name – The name of the SiteScope host machine.
Avg. Value – The average value of each listed measurement, or counter, for the specified time period.
Last Value (Updated) – The last received SiteScope measurement, as well as the most recent date and time that SiteScope received the measurement (shown in parentheses). Mercury Business Availability Center displays the date and time in italics if the current time frame is different from the displayed date and time.
If no value was collected within the past four hours, no value is displayed.
If the last received SiteScope measurement returned the Error status, Mercury Business Availability Center displays the term Error in the Last Value (Updated) column.
Errors/Total – The number of errors that occurred while collecting measurement data, out of the total number of measurements taken during the defined time period. Click the link to view a list of errors that returned measurement error messages. Mercury Business Availability Center displays the link only if errors occurred.

Chapter 2 • SiteScope Over Time Reports
26
SiteScope Data over Time
The SiteScope Data over Time report displays specific measurement data over the selected time range. You can view this report for a single measurement, or for several measurements simultaneously.
Note: You can add the SiteScope Data over Time report to custom reports. For details, see “Custom Report Manager” in Working with Applications.
To view the SiteScope Data over Time subreport for one measurement:
1 Click a measurement in the Measurement Name column in the SiteScope Performance subreport. Mercury Business Availability Center generates and displays the SiteScope Data over Time subreport.
2 Place your cursor over a point in the graph to see a tooltip with measurement details.
3 Click the View as Table link to view the data in table format.

Chapter 2 • SiteScope Over Time Reports
27
Note: For details on SiteScope monitors and measurements, see Configuring SiteScope Monitors.
To view the SiteScope Data over Time subreport for several measurements:
1 In the SiteScope Performance subreport, select the check boxes beside the measurements that will appear in the multi-measurement graph.
2 Click the Generate button at the bottom of the table. Mercury Business Availability Center generates and displays the multi-measurement SiteScope Data over Time subreport. You use the color codes to identify each measurement in the graph.
The y-axis of the merged graph is a normalized scale from 0-100. Mercury Business Availability Center uses the following formula to convert the original y-axis value to a value in the merged y-axis:
[original y-axis value] x [scale value] = y-axis value in merged graph
Place the pointer over a point in the graph to view a tooltip with measurement details, including the measurement’s original value.
3 Click the View as Table link to view the data in table format. The table displays actual measurement values, not normalized values.
Status Summary Report
You generate the Status Summary report and its subreport to get an overall view of the performance of defined SiteScope groups and the monitors defined therein.
This section includes the following topics:
➤ “SiteScope Status Summary” on page 28
➤ “SiteScope Uptime Details” on page 28

Chapter 2 • SiteScope Over Time Reports
28
SiteScope Status Summary
The SiteScope Status Summary table is the top level of the report. For each SiteScope group in the selected profile, the report displays a color-coded quality level, the number of subgroups, and the number of included measurements. The quality-level indicators enable you to get a quick snapshot of how monitors in the defined SiteScope groups are performing.
Click a group name to generate the SiteScope Uptime Details subreport.
SiteScope Uptime Details
The SiteScope Uptime Details subreport displays uptime, warning, and error information for each monitor in the group, over the selected time range, enabling you to determine the overall performance trend of a given monitor. If the specified group contains subgroups, these are displayed at the top of the page. Click subgroups to view their SiteScope Uptime Details subreports.
The SiteScope Uptime Details subreport displays the following data:
➤ Uptime % – the percentage of measurement instances that completed successfully
➤ Warning % – the percentage of measurement instances whose values fell within the Warning threshold level
➤ Error % – the percentage of measurement instances whose values fell within the Error threshold level

Chapter 2 • SiteScope Over Time Reports
29
Warning Summary Report
You generate the Warning Summary report and its subreport to identify the SiteScope groups whose measurements fell within the minor threshold level during the selected time period.
This section includes the following topics:
➤ “Warning Summary” on page 29
➤ “Warning Details Report” on page 29
Warning Summary
The Warning Summary table is the top level of the report. For each SiteScope group in the selected profile, the report displays a color-coded quality level, the number of subgroups, and the number of included measurements. The quality-level indicators enable you to get a quick snapshot of how monitors in the defined SiteScope groups are performing.
Click a group name to generate the Warning Details subreport.
Warning Details Report
The Warning Details subreport displays minor status information for each measurement instance of each monitor in the group, over the selected time range. If the specified group contains subgroups, these are displayed at the top of the page. Click subgroups to view their SiteScope Warning Details subreports.
The Warning Details subreport displays the following data:
Chapter 2 • SiteScope Over Time Reports
30
➤ Time – the date and time of the measurement instance
➤ Monitor Title – the monitor to which the measurement is associated
➤ Measurement Name – the measurement instance whose threshold fell within the Minor level
➤ Status – the value of the measurement
Note: Mercury Business Availability Center displays raw data only in the SiteScope Warning Details report. Aggregated data is not used. Therefore, if raw historical data is removed from the profile database using the Purging Manager, you will be unable to view data in the SiteScope Warning Details report for the time period for which the data was removed.
Error Summary Report
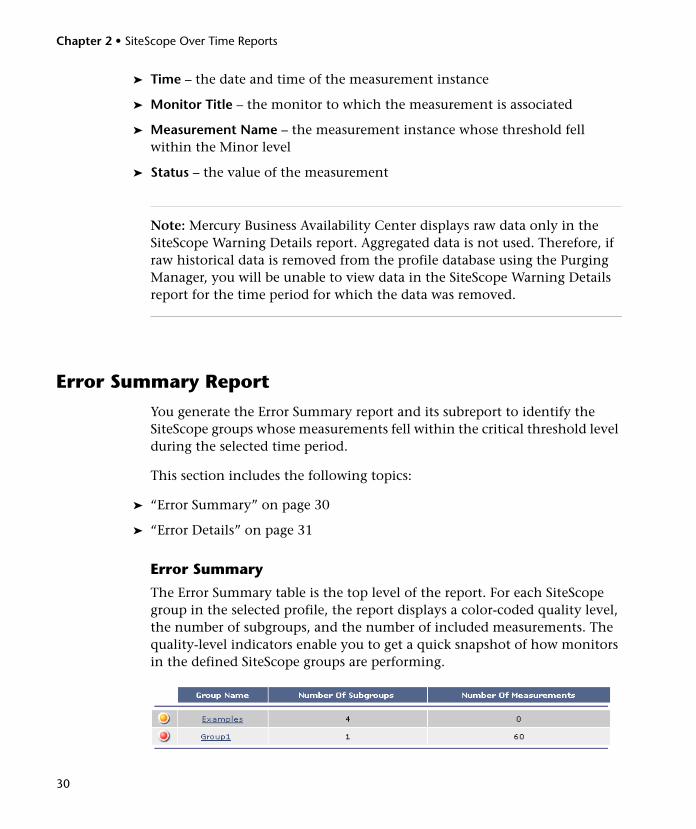
You generate the Error Summary report and its subreport to identify the SiteScope groups whose measurements fell within the critical threshold level during the selected time period.
This section includes the following topics:
➤ “Error Summary” on page 30
➤ “Error Details” on page 31
Error Summary
The Error Summary table is the top level of the report. For each SiteScope group in the selected profile, the report displays a color-coded quality level, the number of subgroups, and the number of included measurements. The quality-level indicators enable you to get a quick snapshot of how monitors in the defined SiteScope groups are performing.

Chapter 2 • SiteScope Over Time Reports
31
Click a group name to generate the Error Details subreport.
Error Details
The Error Details subreport displays error status information for each measurement instance of each monitor in the group, over the selected time range. If the specified group contains subgroups, these are displayed at the top of the page. Click subgroups to view their Error Details subreports.
The Error Details subreport displays the following data:
➤ Time – the data and time of the measurement instance
➤ Monitor Title – the monitor to which the measurement is associated
➤ Measurement Name – the measurement instance whose threshold fell within the Error level
➤ Status – error information as reported by SiteScope
Note: Mercury Business Availability Center displays raw data only in the SiteScope Error Details report. Aggregated data is not used. Therefore, if raw historical data was removed from the profile database using the Purging Manager, you will be unable to view data in the SiteScope Error Details report for the time period for which the data was removed.

Chapter 2 • SiteScope Over Time Reports
32
Group Permissions for Reports
Group permissions filters enable you to filter data for specific SiteScope groups or subgroups from System Availability Management reports, as well as the SiteScope Monitor Performance component in custom reports. When a user views a report, Mercury Business Availability Center displays only the data from the groups and subgroups for which permissions are set. A user’s ability to modify group permissions enables filtering data from reports that may be irrelevant to the specific user, making reports more manageable and increasing the speed of report generation.
This section includes the following topics:
➤ “Usage Privileges for Group Permission Filters” on page 32
➤ “Setting Group Permission Filters” on page 32
Usage Privileges for Group Permission Filters
Every Mercury Business Availability Center user can set personal group permission filters. Administrators can set group permission filters for other users, but each individual user can override those settings as required.
Users can apply group permission filters only to SiteScope profiles for which they have been granted permissions – for details on granting permissions, see “Configuring User Permissions” in Platform Administration. When a user is assigned permissions for a SiteScope profile, group permission filters for that user are not enabled by default. Either the system administrator or the user must explicitly assign the required group permission filters. The user that originally connects to the SiteScope in Monitor Administration is automatically assigned full group permissions.
Setting Group Permission Filters
You specify which SiteScope groups and subgroups to include in or filter from System Availability Management reports, for a specific SiteScope profile.

Chapter 2 • SiteScope Over Time Reports
33
To set group permission filters:
1 From the SiteScope Over Time Reports tab in System Availability Management, select Group Permissions for Reports to open the SiteScope Group Permissions page.
2 Choose the user whose permissions you want to change.
If you plan to apply the permissions to multiple users, this step is not required.
3 Choose the SiteScope profile from the list of profiles that the selected user has permission to view.
Mercury Business Availability Center displays the SiteScope groups associated with the profile.

Chapter 2 • SiteScope Over Time Reports
34
4 To make changes to the existing permissions:
➤ with the Full Permission check box cleared, select or clear the check boxes next to a group or subgroup. Click the expand (+) and collapse (-) symbols to reveal or hide the subgroups.
➤ select the Full Permission check box if you want the user to see data from all groups and subgroups. The user will also see data from any new monitors added to this group.
➤ clear the Full Permission check box, but leave all the group and subgroup check boxes selected, if you want the user to see all data, except the data from any new monitors that are added to the groups.
When you select a group, all its subgroups are also automatically selected. If you clear the check box of a group, the check boxes of all its subgroups are automatically cleared. This is because you cannot grant permissions for a user to view a subgroup, but not to view the parent group.
5 Click Apply to save the changes.
To apply specified permissions to multiple users, click Apply Multiple Users, select the users to which you want to apply permissions, and click Apply.
You can restore a previous configuration by clicking Revert before clicking Apply. Note also that if you move to another page before clicking Apply, the changes you made are not saved. When you return to this page, the previous configuration is displayed.

Chapter 2 • SiteScope Over Time Reports
35
System Availability Management Data in Custom Reports
You can add System Availability Management reports to custom reports from the User Reports tab. For details, see “Custom Report Manager” in Working with Applications. You can add the following System Availability Management reports to custom reports:
This section includes the following topics:
➤ “Monitor Performance Report” on page 35
➤ “SiteScope Data over Time Report” on page 35
➤ “Group Performance Report” on page 35
➤ “Overall Performance Report” on page 36
Monitor Performance Report
To add this report to a custom report, select the SiteScope Monitor Performance component type in the Custom Report Manager. For details on the Monitor Performance report, see “Monitor Performance Report” on page 10.
SiteScope Data over Time Report
To add this report to a custom report, select the Reports component type in the Custom Report Manager, then select the SiteScope Reports category from the Add Component dialog box. For details on the SiteScope Data over Time report, see “SiteScope Data over Time” on page 26.
Group Performance Report
To add this report to a custom report, select the Reports component type in the Custom Report Manager, choose the SiteScope Reports category from the Add Component dialog box, then select SiteScope Profile Summary from the Type list. For details on the Group Performance report, see “Group Performance Report” on page 24.

Chapter 2 • SiteScope Over Time Reports
36
Overall Performance Report
The Overall Performance report is based on SiteScope data, and is only available in custom reports. To add it to a custom report, select Reports in the Component type list in the Custom Report Manager page and click Add Component. Select the SiteScope Reports in the Category list from the Add Component dialog box, and then select Overall Performance in the Type list.
You view the Overall Performance report to get a quick snapshot of the performance of the monitored infrastructure machines in the selected SiteScope profile(s). The chart displays—for the SiteScope profile(s) and defined time frame—a pie chart for each element of the infrastructure that SiteScope is monitoring.
To get additional information, point to a segment to view a tooltip describing the exact number and percentage of measurements for each segment of the chart.

37
3The Event Log
The Mercury System Availability Management event log displays SiteScope events, as well as events collected from external applications or software by enterprise management systems (EMS) using SiteScope.
This chapter describes: On page:
About the Event Log 38
Working with the Event Log 39
Working with Event Details 44
Working with Event History 46

Chapter 3 • The Event Log
38
About the Event Log
The event log enables you to view event data over time, events that happened at a specific time, the details of a specific event, and (where possible) the event history.
The type of event that is collected depends on what is defined as an event in the external applications or software. Event types can be warnings, alerts, user logins, and so forth.
The event log displays event data that is common to all data sources: the severity of the event, the application or software from which the event is collected, the time the event occurred, the hierarchy of the event source, the name (or the IP address) of the host or device that caused the event, the status or type of event, and the external system description of the event.
You can filter the events for a specific time frame, data source, severity, and target name (for details, see “Working with the Event Log” on page 39).
You can then drill down to the common data to display data that is specific to the data source where the event occurred (for details, see “Working with Event Details” on page 44) and to display the history of a specific event (for details, see “Working with Event History” on page 46).
The event log enables you to diagnose specific issues in real time and to generate trend reports.

Chapter 3 • The Event Log
39
Working with the Event Log
The Event Log page displays the logs of events that are sent to the system (for details, see “Displaying the Event Log” on page 39). You can use filters (time frame, data source, severity, and target name) to display specific information. If you select the SiteScope data source, you can then select additional filters: SiteScope profile, groups, and monitor type (for details, see “Working with Additional Filters for SiteScope” on page 41).
When you generate the event log, the Event Log page displays the events sorted by the time of their occurrence in descending order. It also shows columns that are common to all the data sources that can send events (for details, see “Viewing Common Event Data in the Event Log Page” on page 42). The data of the SiteScope data source is filtered according to SiteScope Profile permissions (for details, see “Configuring User Permissions” in Platform Administration).
The Event Log page has two areas: the filter and action area and the data table.
This section includes the following topics:
➤ “Displaying the Event Log” on page 39
➤ “Customizing Event Logs” on page 40
Displaying the Event Log
You can display the logs of events sent to Mercury Business Availability Center.
To display the Event Log:
1 Select Applications > System Availability Management > Event Log to display the Event Log page.
2 Select the time period for which you want to gather information to display in the report in the View list. For details, see “Choosing the Tracking Range and Granularity” in Working with Applications.

Chapter 3 • The Event Log
40
3 Click Active Filters, if you want to edit the filters. For more details, see “Filtering Data Using Active Filters” in Working with Applications. Note that only one or All data sources can be selected in the Event Source tab. If no data source exists, only All appears in the list. SiteScopeAlert or SiteScopeStatusChange data sources appear only if the current user has permissions to view at least one SiteScope profile. Severities are pre-defined. By default, all check boxes are selected.
If you select SiteScopeAlert or SiteScopeStatusChange, the SiteScope Filters window is displayed (for details, see “Working with Additional Filters for SiteScope” on page 41).
4 Click one of the action buttons to print, e-mail, or open a report in Excel or PDF format. For details, see “Sharing and Storing Reports” in Working with Applications.
5 Click Generate to generate the report.
Note: If the number of events that occur during the specified time frame is larger than the maximum number of events that can be displayed in the report, a message is displayed. To reduce the number of events, select a more specific time range. For example, to see events for the past week, select the individual days of the week.
Customizing Event Logs
You can change the default setting of the maximum number of rows that can be displayed in the page. You can also change the maximum number of events that can be listed in the event log.
To change the maximum number of rows displayed in a page:
When there are too many events to display in one page of a table, a paging bar is automatically displayed.
1 Select Admin > Platform > Setup and Maintenance > Infrastructure Settings, click Application, select End User/System Availability, and locate the Max Table Rows in the Event Reports table.
2 Modify the value to the required number of rows per page.

Chapter 3 • The Event Log
41
To change the maximum number of rows displayed in the Event Log:
The maximum number of rows that can be displayed in the Event Log is 1000, by default.
1 Select Admin > Platform > Setup and Maintenance > Infrastructure Settings, click Application, select End User/System Availability, and locate the Max Fetched Rows in the Event Reports table.
2 Modify the value to the required number of rows per Event Log.
Working with Additional Filters for SiteScope
If you select a SiteScope data source in the active filter, an additional filter is automatically provided to filter the data by SiteScope profile, group, and monitor type.
To work with additional filters for SiteScope data sources:
1 Click SiteScope Filters, to open the SiteScope Filter page.
2 Select the type of monitor in the Monitor Type list. The default is All Monitor Types.
3 Select the SiteScope profile in the Profile list. The default is All Profiles. To view events of interest regarding the profile or group permissions, select one of the profiles in the Profile list (for details, see “Configuring User Permissions” in Platform Administration). The list of groups allowed for the selected profile is displayed.
Note: If you select All Profiles, your profile or group permissions are not applied to the displayed events.
Chapter 3 • The Event Log
42
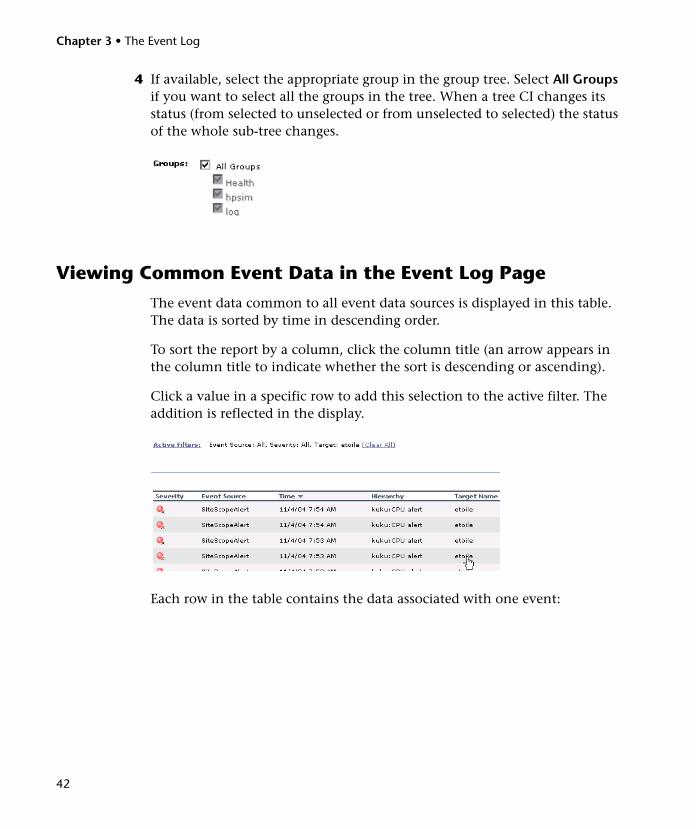
4 If available, select the appropriate group in the group tree. Select All Groups if you want to select all the groups in the tree. When a tree CI changes its status (from selected to unselected or from unselected to selected) the status of the whole sub-tree changes.
Viewing Common Event Data in the Event Log Page
The event data common to all event data sources is displayed in this table. The data is sorted by time in descending order.
To sort the report by a column, click the column title (an arrow appears in the column title to indicate whether the sort is descending or ascending).
Click a value in a specific row to add this selection to the active filter. The addition is reflected in the display.
Each row in the table contains the data associated with one event:

Chapter 3 • The Event Log
43
➤ Severity – The icon and its tooltip display the severity of the event.
➤ Event Source – The application or software from which the event is collected. Event sources can be: HP OVO, Remedy ARs, SitescopeAlert, SitescopeAlertStatusChange, Tivoli TEC, BMC Patrol, CA Unicenter, HP SIM, Compaq Insight Manager, Whatsup, or Compaq Insight Manager, depending on the external systems that sent the events to Mercury Business Availability Center.
➤ Time – The time when the event occurred. By default, the data sorted in this column is in descending order.
➤ Hierarchy – The hierarchy description of the event source. It can include the path to where the event occurred in the area, sub area, or instance and/or the event depending on the application or software from which the event is collected. Depending on the data source, the hierarchy can have two to four branches. If the hierarchy is very long, this field displays the shortened string and the tooltip displays the complete hierarchy.
➤ Target Name – The name or the IP address of the host or device that caused the event.
➤ Status – The status or type of the event. If the hierarchy is very long, the value is shortened and the tooltip displays the full hierarchy.
Icon Severity
Unknown
Informational
Warning
Minor
Major
Critical

Chapter 3 • The Event Log
44
➤ Description – The event description. If the description is very long, the value is shortened and the tooltip displays the full hierarchy.
To view additional data for this event, click the Event Details button to open the Event Details page. For details, see “Working with Event Details” on page 44.
To view details about the event history data, click the History button to open the Event History page. For details, see “Working with Event History” on page 46.
Note: By default, some data sources include a history view and others do not (the History button is disabled or does not display). You can enable the history view by changing the setting in the Infrastructure Settings Manager. To modify the setting, select Admin > Platform > Setup and Maintenance > Infrastructure Settings, click Applications, select End User/System Availability Management, and locate the Event Log Report Data Sources History entry in the End User/System Availability Management - Data table. Set the property value by adding the data source names for which you want to enable the History button (separate data source names with commas)—in the Value box. The change takes place after restart. For details, see “Infrastructure Settings” in Platform Administration.
Working with Event Details
To display all the data (common and specific) related to an event, you display the event details.
Click the Event Details button in the Event Log page to open the Event Details report in a new window.
The Event Details report displays detailed information about the specified event as well as the fields and the field values from the event data. The type of information provided depends on the data source.

Chapter 3 • The Event Log
45
The Event Details report can display any of the following fields:
➤ Time – the time of the event
➤ Severity – the severity of the event
➤ Original Severity – the original severity of the event
➤ Status – The event status or type. If the hierarchy is very long, this field displays a shortened string and the tooltip displays the complete status.
➤ Event Source – the application or software from which this event is collected
➤ Logical Group – the additional logical level of event hierarchy
➤ Hierarchy – The hierarchy of the event source. It can include the path to where the event occurred in the area, sub area, or instance and/or the event depending on the application or software from which the event is collected.
Depending on the data source, the hierarchy can have two to four branches. If the hierarchy is very long, this field displays the shortened string and the tooltip displays the complete hierarchy.
➤ Target Name and IP – the name or IP address of the host or device that caused this event
➤ Collector host – the name of the machine that collected the data
➤ Description – a description of the event
➤ Acknowledged By – the operator who acknowledged this event
➤ Value – any numeric values that are sent with the event
➤ Additional information field (1… 5) – additional rows (up to 5) that contain additional information for the current event

Chapter 3 • The Event Log
46
Working with Event History
Click the Event History button in the Event Log page to open the Event History report in a new window.
The Event History report displays detailed information about the specified event for different time periods.
The data displayed provides a historical view of the event:
➤ Event Source – The application or software from which the event was collected. Event sources can be: HP OVO, Remedy ARs, SitescopeAlert, SitescopeAlertStatusChange, Tivoli TEC, BMC Patrol, CA Unicenter, HP SIM, Compaq Insight Manager, Whatsup, or Compaq Insight Manager, depending on the external systems that sent the events to Mercury Business Availability Center.
➤ Time – The time when the event occurred. By default, the data sorted in this column is in descending order.
➤ Hierarchy – The hierarchy description of the event source. It can include the path to where the event occurred in the area, sub area, or instance and/or the event depending on the application or software from which the event was collected. Depending on the data source, the hierarchy can have two to four branches. If the hierarchy is very long, this field displays the shortened string and the tooltip displays the complete hierarchy.
➤ Target Name – The name or the IP address of the host or device that caused the event.
➤ Status – The status or type of the event. If the hierarchy is very long, the value is shortened and the tooltip displays the full hierarchy.

Chapter 3 • The Event Log
47
➤ Description – The event description. If the description is very long, the value is shortened and the tooltip displays the full hierarchy.
To view different periods of the event history select the appropriate time frame in the View list. This selection has no effect on the time frame selected in the View list in the Event Log page.
Note: By default, some data sources include a history view and others do not (the History button is disabled or does not display). You can enable the history view by changing the setting in the Infrastructure Settings Manager. To modify the setting, select Admin > Platform > Setup and Maintenance > Infrastructure Settings, click Applications, select End User/System Availability Management, and locate the Event Log Report Data Sources History entry in the End User/System Availability Management - Data table. Set the property value by adding the data source names for which you want to enable the History button (separate data source names with commas)—in the Value box. The change takes place after restart. For details, see “Infrastructure Settings” in Platform Administration.

Chapter 3 • The Event Log
48

49
4User Reports
User reports is a feature common to the Service Level Management, End User Management, and System Availability Management applications. You configure and view user reports from the User Reports tab.
For complete details on creating, viewing, and administering user reports, see “Configuring and Viewing User Reports” in Working with Applications.

Chapter 4 • User Reports
50

51
A
aggregation 3
C
custom reportsSiteScope Data over Time 35SiteScope Group Performance 35SiteScope Monitor Performance 35SiteScope Overall Performance 36System Availability Management
reports in 35
D
data aggregation 3
E
Event Logscustomizing 40displaying 39viewing 37viewing common event data 42working with event details 44working with event history 46working with reports 39
F
filtersEvent Logs 39
G
group permissionsin System Availability Management
reports 32
setting filters 32usage privileges 32
I
Infrastructure Settings Managerchanging settings for SiteScope
reports 15displaying history button 44
R
reportsaccess and permissions 2color coding 9SiteScope Cross-Performance 13SiteScope Data over Time 26, 35SiteScope Error Details 31SiteScope Error Summary 30SiteScope Group Performance 24, 35SiteScope Monitor Performance 10,
35SiteScope Over Time 6SiteScope Overall Performance 36SiteScope Performance 24SiteScope Status Summary 27SiteScope Uptime Details 28SiteScope Warning Summary 29System Availability Management 3, 5user 49
S
SiteScope Cross-Performance report 13generating 14rescaling 23summary tables 22understanding 18
Index

Index
52
SiteScope Data over Time report 26in custom reports 35
SiteScope Error Details report 31SiteScope Error Summary report 30SiteScope Group Performance report 24
in custom reports 35table 24
SiteScope Monitor Performance report 10generating 10in custom reports 35understanding 11
SiteScope Over Time graphsconsolidated 18non-consolidated 20
SiteScope Over Time reports 6SiteScope Overall Performance report
in custom reports 36SiteScope Performance report 24SiteScope reports
group filters 39monitor type filters 39profile filters 39working with additional filters 41
SiteScope Status Summary report 27table 28
SiteScope Uptime Details report 28SiteScope Warning Details report 29SiteScope Warning Summary report 29
table 29System Availability Management reports 1,
3, 5, 7group permissions 32improving report generation times 9in custom reports 35overview 2SiteScope Cross-Performance 13SiteScope Data over Time 26SiteScope Error Summary 30SiteScope Group Performance 24SiteScope Monitor Performance 10SiteScope Performance 24SiteScope Status Summary 27SiteScope Uptime Details 28SiteScope Warning Summary 29working with 8
U
user reports 49