Application of Fenton’s Reaction to Steam Explosion Prehydrolysates from Poplar Biomass
13
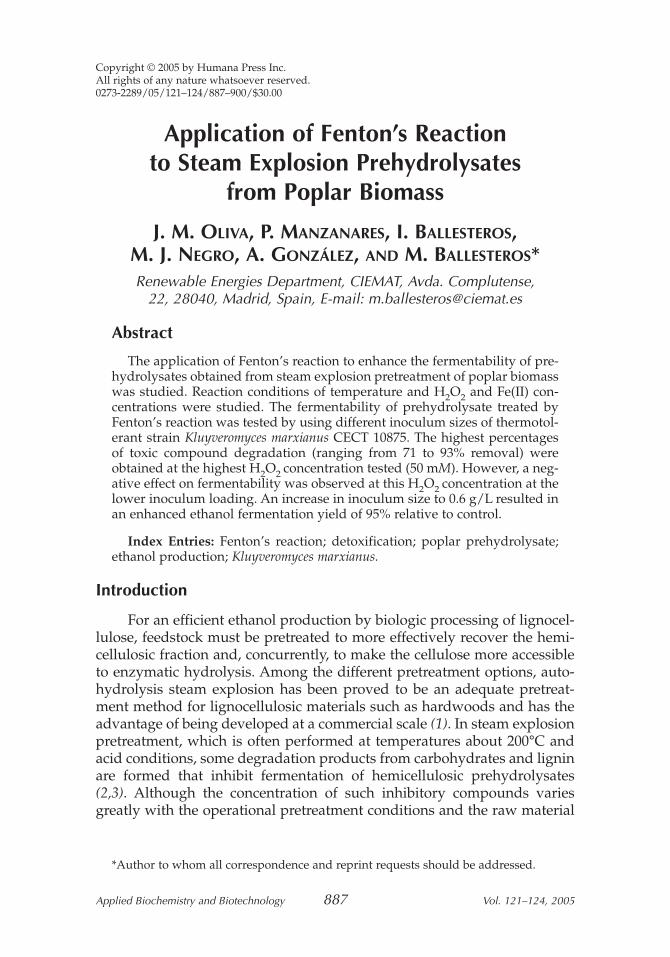
Application of Fenton’s Reaction to Steam Explosion Prehydrolysates from Poplar Biomass J. M. OLIVA, P. MANZANARES, I. BALLESTEROS, M. J. NEGRO, A. GONZÁLEZ, AND M. BALLESTEROS* Renewable Energies Department, CIEMAT, Avda. Complutense, 22, 28040, Madrid, Spain, E-mail: [email protected] Abstract The application of Fenton’s reaction to enhance the fermentability of pre- hydrolysates obtained from steam explosion pretreatment of poplar biomass was studied. Reaction conditions of temperature and H 2 O 2 and Fe(II) con- centrations were studied. The fermentability of prehydrolysate treated by Fenton’s reaction was tested by using different inoculum sizes of thermotol- erant strain Kluyveromyces marxianus CECT 10875. The highest percentages of toxic compound degradation (ranging from 71 to 93% removal) were obtained at the highest H 2 O 2 concentration tested (50 mM). However, a neg- ative effect on fermentability was observed at this H 2 O 2 concentration at the lower inoculum loading. An increase in inoculum size to 0.6 g/L resulted in an enhanced ethanol fermentation yield of 95% relative to control. Index Entries: Fenton’s reaction; detoxification; poplar prehydrolysate; ethanol production; Kluyveromyces marxianus. Introduction For an efficient ethanol production by biologic processing of lignocel- lulose, feedstock must be pretreated to more effectively recover the hemi- cellulosic fraction and, concurrently, to make the cellulose more accessible to enzymatic hydrolysis. Among the different pretreatment options, auto- hydrolysis steam explosion has been proved to be an adequate pretreat- ment method for lignocellulosic materials such as hardwoods and has the advantage of being developed at a commercial scale (1). In steam explosion pretreatment, which is often performed at temperatures about 200°C and acid conditions, some degradation products from carbohydrates and lignin are formed that inhibit fermentation of hemicellulosic prehydrolysates (2,3). Although the concentration of such inhibitory compounds varies greatly with the operational pretreatment conditions and the raw material Applied Biochemistry and Biotechnology 887 Vol. 121–124, 2005 Copyright © 2005 by Humana Press Inc. All rights of any nature whatsoever reserved. 0273-2289/05/121–124/887–900/$30.00 *Author to whom all correspondence and reprint requests should be addressed.
-
Upload
independent -
Category
Documents
-
view
1 -
download
0
Transcript of Application of Fenton’s Reaction to Steam Explosion Prehydrolysates from Poplar Biomass
Application of Fenton’s Reaction to Steam Explosion Prehydrolysates
from Poplar Biomass
J. M. OLIVA, P. MANZANARES, I. BALLESTEROS, M. J. NEGRO, A. GONZÁLEZ, AND M. BALLESTEROS*Renewable Energies Department, CIEMAT, Avda. Complutense,
22, 28040, Madrid, Spain, E-mail: [email protected]
Abstract
The application of Fenton’s reaction to enhance the fermentability of pre-hydrolysates obtained from steam explosion pretreatment of poplar biomasswas studied. Reaction conditions of temperature and H2O2 and Fe(II) con-centrations were studied. The fermentability of prehydrolysate treated byFenton’s reaction was tested by using different inoculum sizes of thermotol-erant strain Kluyveromyces marxianus CECT 10875. The highest percentagesof toxic compound degradation (ranging from 71 to 93% removal) wereobtained at the highest H2O2 concentration tested (50 mM). However, a neg-ative effect on fermentability was observed at this H2O2 concentration at thelower inoculum loading. An increase in inoculum size to 0.6 g/L resulted inan enhanced ethanol fermentation yield of 95% relative to control.
Index Entries: Fenton’s reaction; detoxification; poplar prehydrolysate;ethanol production; Kluyveromyces marxianus.
Introduction
For an efficient ethanol production by biologic processing of lignocel-lulose, feedstock must be pretreated to more effectively recover the hemi-cellulosic fraction and, concurrently, to make the cellulose more accessibleto enzymatic hydrolysis. Among the different pretreatment options, auto-hydrolysis steam explosion has been proved to be an adequate pretreat-ment method for lignocellulosic materials such as hardwoods and has theadvantage of being developed at a commercial scale (1). In steam explosionpretreatment, which is often performed at temperatures about 200°C andacid conditions, some degradation products from carbohydrates and ligninare formed that inhibit fermentation of hemicellulosic prehydrolysates(2,3). Although the concentration of such inhibitory compounds variesgreatly with the operational pretreatment conditions and the raw material
Applied Biochemistry and Biotechnology 887 Vol. 121–124, 2005
Copyright © 2005 by Humana Press Inc.All rights of any nature whatsoever reserved.0273-2289/05/121–124/887–900/$30.00
*Author to whom all correspondence and reprint requests should be addressed.
6A_01_ABAB_v2_887-900.qxd 28/03/2005 5:06 pm Page 887
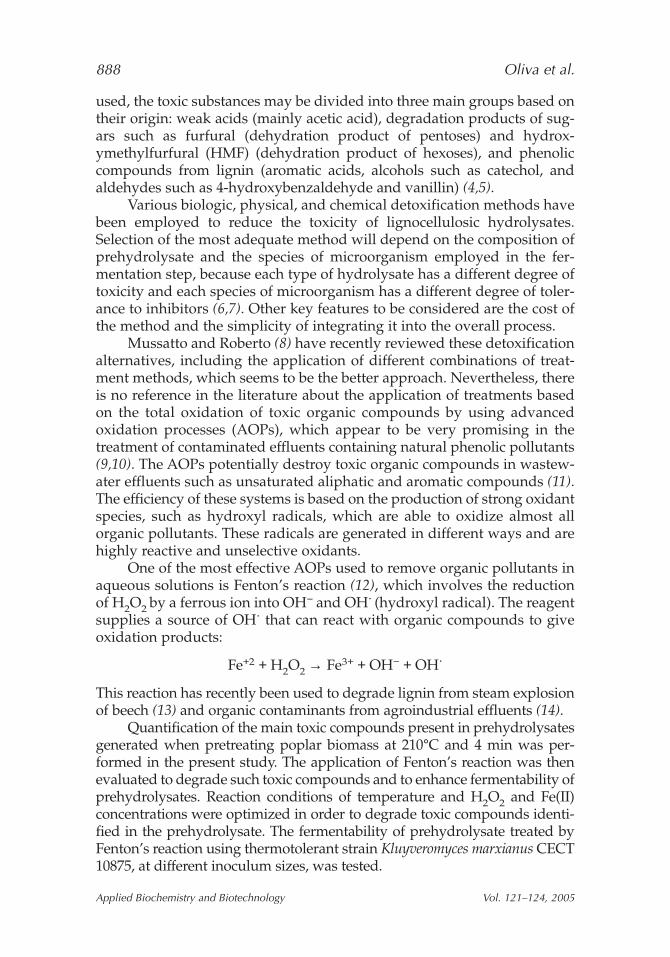
used, the toxic substances may be divided into three main groups based ontheir origin: weak acids (mainly acetic acid), degradation products of sug-ars such as furfural (dehydration product of pentoses) and hydrox-ymethylfurfural (HMF) (dehydration product of hexoses), and phenoliccompounds from lignin (aromatic acids, alcohols such as catechol, andaldehydes such as 4-hydroxybenzaldehyde and vanillin) (4,5).
Various biologic, physical, and chemical detoxification methods havebeen employed to reduce the toxicity of lignocellulosic hydrolysates.Selection of the most adequate method will depend on the composition ofprehydrolysate and the species of microorganism employed in the fer-mentation step, because each type of hydrolysate has a different degree oftoxicity and each species of microorganism has a different degree of toler-ance to inhibitors (6,7). Other key features to be considered are the cost ofthe method and the simplicity of integrating it into the overall process.
Mussatto and Roberto (8) have recently reviewed these detoxificationalternatives, including the application of different combinations of treat-ment methods, which seems to be the better approach. Nevertheless, thereis no reference in the literature about the application of treatments basedon the total oxidation of toxic organic compounds by using advancedoxidation processes (AOPs), which appear to be very promising in thetreatment of contaminated effluents containing natural phenolic pollutants(9,10). The AOPs potentially destroy toxic organic compounds in wastew-ater effluents such as unsaturated aliphatic and aromatic compounds (11).The efficiency of these systems is based on the production of strong oxidantspecies, such as hydroxyl radicals, which are able to oxidize almost allorganic pollutants. These radicals are generated in different ways and arehighly reactive and unselective oxidants.
One of the most effective AOPs used to remove organic pollutants inaqueous solutions is Fenton’s reaction (12), which involves the reductionof H2O2 by a ferrous ion into OH− and OH˙ (hydroxyl radical). The reagentsupplies a source of OH˙ that can react with organic compounds to giveoxidation products:
Fe+2 + H2O2 → Fe3+ + OH− + OH˙
This reaction has recently been used to degrade lignin from steam explosionof beech (13) and organic contaminants from agroindustrial effluents (14).
Quantification of the main toxic compounds present in prehydrolysatesgenerated when pretreating poplar biomass at 210°C and 4 min was per-formed in the present study. The application of Fenton’s reaction was thenevaluated to degrade such toxic compounds and to enhance fermentability ofprehydrolysates. Reaction conditions of temperature and H2O2 and Fe(II)concentrations were optimized in order to degrade toxic compounds identi-fied in the prehydrolysate. The fermentability of prehydrolysate treated byFenton’s reaction using thermotolerant strain Kluyveromyces marxianus CECT10875, at different inoculum sizes, was tested.
888 Oliva et al.
Applied Biochemistry and Biotechnology Vol. 121–124, 2005
6A_01_ABAB_v2_887-900.qxd 28/03/2005 5:06 pm Page 888
Materials and Methods
Chemicals
All chemicals were obtained from Sigma (St. Louis, MO), except fer-rous sulfate (FeSO4⋅7H2O) and H2O2 (33%) (w/v), which were supplied byPanreac (Barcelona, Spain).
Preparation of Hemicellulose Prehydrolysate
Chipped poplar biomass (Populus nigra) was provided by theRenewable Energy Development Center at Lubia (Soria, Spain). The steamexplosion tests were performed in a batchwise-operated reactor as describedpreviously (15). The pretreated material was suction filtered, and the filtrate(prehydrolysate) was collected (approx 1 L) and analyzed.
Experimental Procedure for Fenton’s Reaction Treatment
Experiments to achieve the reduction or complete removal of toxicorganic compounds were conducted in 100-mL Sovirel flasks. The reac-tion mixture, consisting of 75 mL of prehydrolysate (pH 3.8) and the pre-cise amount of reagent (H2O2 and heptahydrated ferrous sulfate), wascontinuously stirred and incubated at the desired temperature in a waterbath for 2 h.
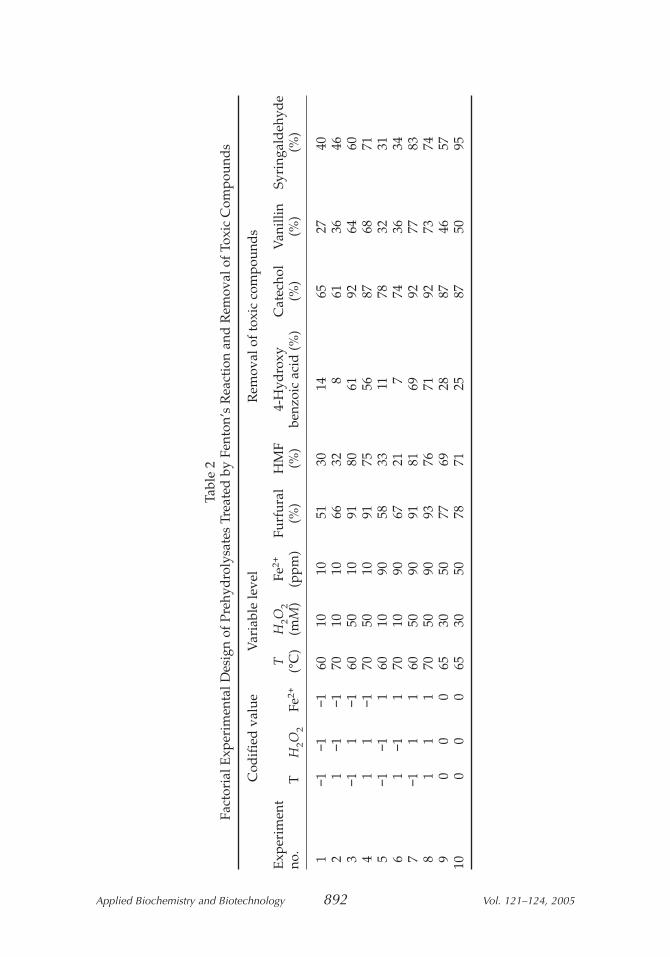
A 23 factorial experimental design based on with central point repli-cate (16) was performed considering two levels for temperature (60 and70°C), Fe(II) (10 and 90 ppm), and H2O2 (10 and 50 mM) using the softwareStatagraphics Plus 5.0 (Table 2). The percentage of toxic compoundremoval after 2 h of reaction was used as the response factor. Low, high,and central levels have been designated −1, +1, and 0, respectively.
Microorganism and Fermentation Experiments
K. marxianus CECT 10875, a thermotolerant yeast strain, was used infermentation experiments. Active cultures for inoculation were preparedby growing the microorganism overnight on a rotary shaker at 150 rpmand 42°C in a growth medium (initial pH of 5.5) containing 5 g/L of yeastextract, 2 g/L of NH4Cl, 1 g/L of KH2PO4, 0.3 g/L of MgSO4 ⋅ 7H2O, and30 g/L of glucose.
To study the effect of inoculum size on fermentability, a 24 factorialexperimental design with central point replicate was performed consideringtwo levels of inoculum concentration (0.2 and 1 g/L) (Table 3). Fermentationexperiments were carried out in 100-mL Erlenmeyer flasks with each con-taining 25 mL of detoxified prehydrolysates supplemented with the mediumjust described and incubated at 42°C and 150 rpm. Flasks were inoculatedat biomass concentrations of 0.2, 0.6, and 1 g/L under nonsterile condi-tions. Ethanol concentration was determined at 24 h from the onset of fer-mentation. Fermentation tests were evaluated in terms of ethanol yield
Application of Fenton’s Reaction to Prehydrolysates 889
Applied Biochemistry and Biotechnology Vol. 121–124, 2005
6A_01_ABAB_v2_887-900.qxd 28/03/2005 5:06 pm Page 889
(Yp/s). Yp/s was calculated by dividing the ethanol produced in 24 h by theinitial glucose concentration and expressed as a percentage of a controlwithout any toxic compound.
Analytical Procedures
4-Hydroxybenzoic acid, vanillin, syringaldehyde, syringyl alcohol,4-hydroxybenzaldehyde, catechol, guaiacol, syringic acid, and vanillic acidanalysis was performed on a high-performance liquid chromatography(HPLC) system with a photodiode-array detector. Acetic, levulinic, andformic acid analysis was carried out with an HPLC system with a refrac-tive index detector. Ethanol was measured by gas chromatography with aflame ionization detector. A more detailed description of the analyticalprocedure has been described previously (7).
Results and Discussion
Prehydrolysate Composition and Fermentability
Table 1 shows the results of the quantitative determination of degra-dation compounds identified in the prehydrolysate from steam pretreatmentof poplar at 210°C and a 4-min residence time. Acetic acid (1400 mg/L),derived from acetyl groups present in the hemicellulose of hardwoodpoplar; furfural (500 mg/L), from degradation of pentoses; and formic acid(400 mg/L), from furfural and HMF degradation, were the main compoundspresent in the prehydrolysate. HMF concentration (100 mg/L) is lowerbecause of the low quantity of hexoses in hemicellulose of hardwood andtheir slower degradation.
As a first step in the study of the fermentability of the prehydrolysatefrom steam explosion pretreatment of poplar, the medium was adjusted topH 5.5 with 2 N NaOH and supplemented with 30 g/L of glucose (pH 5.5).Growth and ethanol production by K. marxianus CECT 10875 were evalu-ated. Fermentation was completely inhibited at any inoculum concentra-tion tested (data not shown).
Degradation of Toxic Compounds by Fenton’s Reaction
The Fenton’s reaction was applied to prehydrolysate to reduce theinitial concentration of toxic compounds. Table 2 provides the factorialexperimental design, the relation between codified and real values, andthe percentage of toxic compound degradation. The choice of the particularvalues for the three factors studied (temperature, H2O2, and ferrous iron)was based on results obtained previously (17).
As can be seen in Table 2, Fenton’s reaction was an effective methodto reduce overall concentration of furans and phenolic compounds in theprehydrolysate. For all compounds tested, the highest percentages ofdegradation were obtained at the highest H2O2 concentration tested.
890 Oliva et al.
Applied Biochemistry and Biotechnology Vol. 121–124, 2005
6A_01_ABAB_v2_887-900.qxd 28/03/2005 5:06 pm Page 890
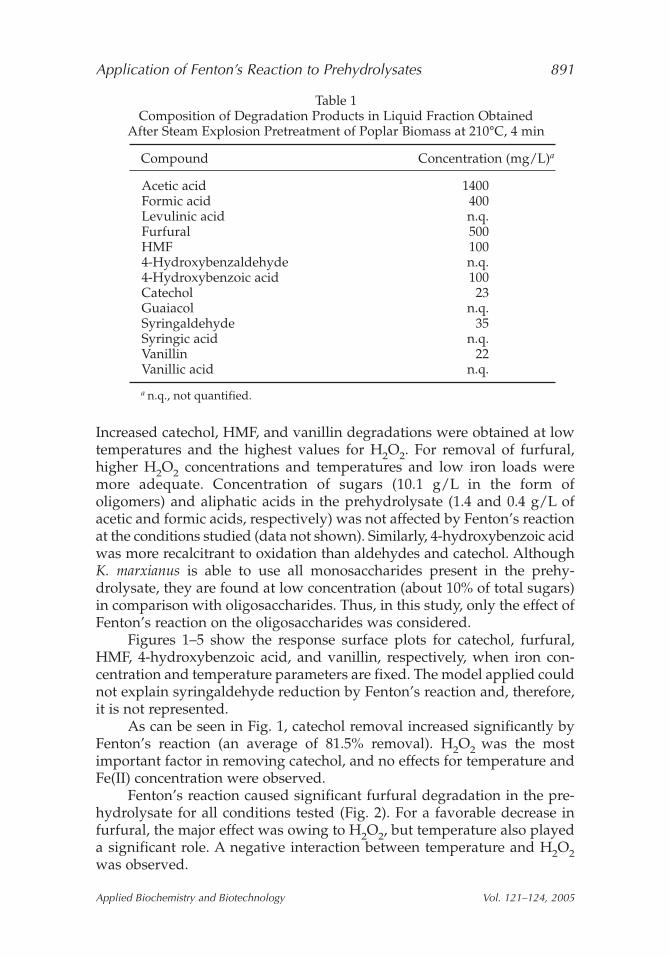
Increased catechol, HMF, and vanillin degradations were obtained at lowtemperatures and the highest values for H2O2. For removal of furfural,higher H2O2 concentrations and temperatures and low iron loads weremore adequate. Concentration of sugars (10.1 g/L in the form ofoligomers) and aliphatic acids in the prehydrolysate (1.4 and 0.4 g/L ofacetic and formic acids, respectively) was not affected by Fenton’s reactionat the conditions studied (data not shown). Similarly, 4-hydroxybenzoic acidwas more recalcitrant to oxidation than aldehydes and catechol. AlthoughK. marxianus is able to use all monosaccharides present in the prehy-drolysate, they are found at low concentration (about 10% of total sugars)in comparison with oligosaccharides. Thus, in this study, only the effect ofFenton’s reaction on the oligosaccharides was considered.
Figures 1–5 show the response surface plots for catechol, furfural,HMF, 4-hydroxybenzoic acid, and vanillin, respectively, when iron con-centration and temperature parameters are fixed. The model applied couldnot explain syringaldehyde reduction by Fenton’s reaction and, therefore,it is not represented.
As can be seen in Fig. 1, catechol removal increased significantly byFenton’s reaction (an average of 81.5% removal). H2O2 was the mostimportant factor in removing catechol, and no effects for temperature andFe(II) concentration were observed.
Fenton’s reaction caused significant furfural degradation in the pre-hydrolysate for all conditions tested (Fig. 2). For a favorable decrease infurfural, the major effect was owing to H2O2, but temperature also playeda significant role. A negative interaction between temperature and H2O2was observed.
Application of Fenton’s Reaction to Prehydrolysates 891
Applied Biochemistry and Biotechnology Vol. 121–124, 2005
Table 1Composition of Degradation Products in Liquid Fraction Obtained
After Steam Explosion Pretreatment of Poplar Biomass at 210°C, 4 min
Compound Concentration (mg/L)a
Acetic acid 1400Formic acid 400Levulinic acid n.q.Furfural 500HMF 1004-Hydroxybenzaldehyde n.q.4-Hydroxybenzoic acid 100Catechol 23Guaiacol n.q.Syringaldehyde 35Syringic acid n.q.Vanillin 22Vanillic acid n.q.
a n.q., not quantified.
6A_01_ABAB_v2_887-900.qxd 28/03/2005 5:06 pm Page 891
Applied Biochemistry and Biotechnology 892 Vol. 121–124, 2005
Tabl
e 2
Fact
oria
l Exp
erim
enta
l Des
ign
of P
rehy
dro
lysa
tes
Trea
ted
by
Fent
on’s
Rea
ctio
n an
d R
emov
al o
f To
xic
Com
poun
ds
Cod
ifie
d v
alue
Var
iabl
e le
vel
Rem
oval
of
toxi
c co
mpo
und
s
Exp
erim
ent
TH
2O2
Fe2+
Fu
rfur
al
HM
F 4-
Hyd
roxy
C
atec
hol
Van
illin
Sy
ring
ald
ehyd
e no
. T
H2O
2Fe
2+(°
C)
(mM
)(p
pm)
(%)
(%)
benz
oic
acid
(%
)(%
)(%
)(%
)
1−1
−1−1
6010
1051
3014
6527
402
1−1
−170
1010
6632
861
3646
3−1
1−1
6050
1091
8061
9264
604
11
−170
5010
9175
5687
6871
5−1
−11
6010
9058
3311
7832
316
1−1
170
1090
6721
774
3634
7−1
11
6050
9091
8169
9277
838
11
170
5090
9376
7192
7374
90
00
6530
5077
6928
8746
5710
00
065
3050
7871
2587
5095
6A_01_ABAB_v2_887-900.qxd 28/03/2005 5:06 pm Page 892
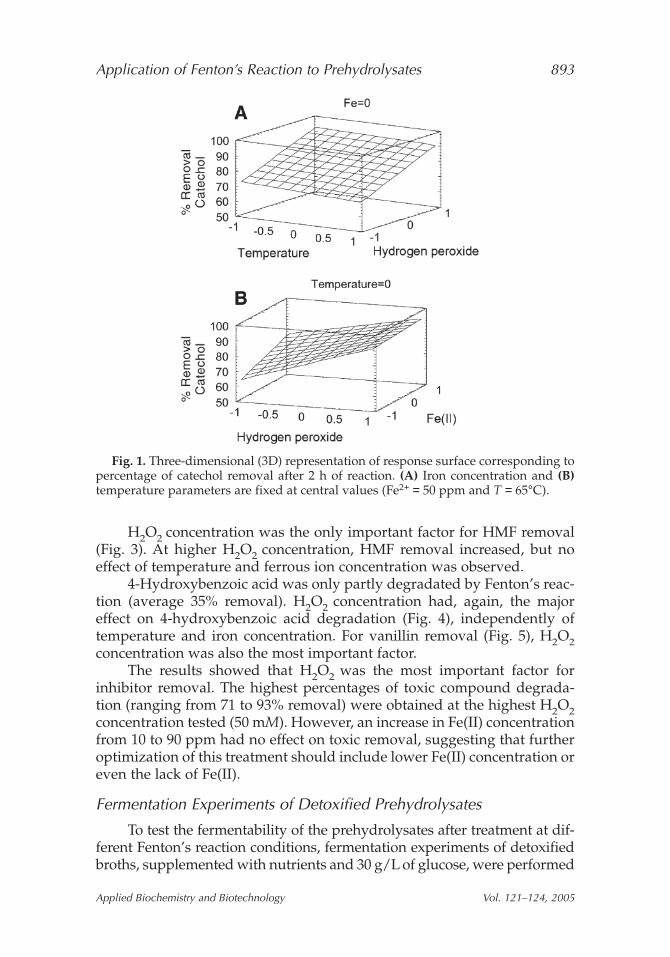
H2O2 concentration was the only important factor for HMF removal(Fig. 3). At higher H2O2 concentration, HMF removal increased, but noeffect of temperature and ferrous ion concentration was observed.
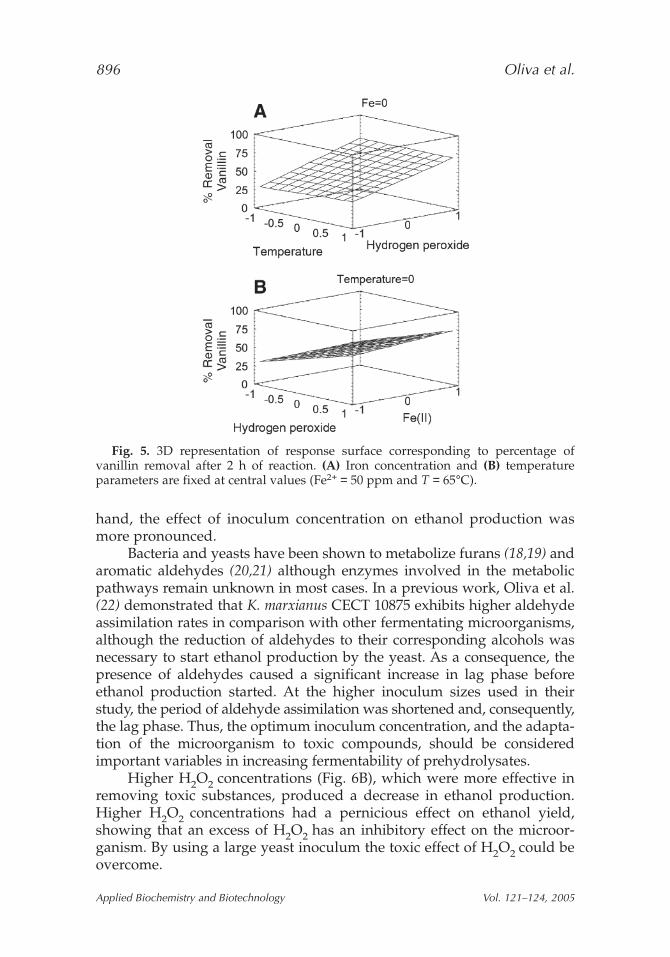
4-Hydroxybenzoic acid was only partly degradated by Fenton’s reac-tion (average 35% removal). H2O2 concentration had, again, the majoreffect on 4-hydroxybenzoic acid degradation (Fig. 4), independently oftemperature and iron concentration. For vanillin removal (Fig. 5), H2O2concentration was also the most important factor.
The results showed that H2O2 was the most important factor forinhibitor removal. The highest percentages of toxic compound degrada-tion (ranging from 71 to 93% removal) were obtained at the highest H2O2concentration tested (50 mM). However, an increase in Fe(II) concentrationfrom 10 to 90 ppm had no effect on toxic removal, suggesting that furtheroptimization of this treatment should include lower Fe(II) concentration oreven the lack of Fe(II).
Fermentation Experiments of Detoxified Prehydrolysates
To test the fermentability of the prehydrolysates after treatment at dif-ferent Fenton’s reaction conditions, fermentation experiments of detoxifiedbroths, supplemented with nutrients and 30 g/L of glucose, were performed
Application of Fenton’s Reaction to Prehydrolysates 893
Applied Biochemistry and Biotechnology Vol. 121–124, 2005
Fig. 1. Three-dimensional (3D) representation of response surface corresponding topercentage of catechol removal after 2 h of reaction. (A) Iron concentration and (B)temperature parameters are fixed at central values (Fe2+ = 50 ppm and T = 65°C).
6A_01_ABAB_v2_887-900.qxd 28/03/2005 5:06 pm Page 893
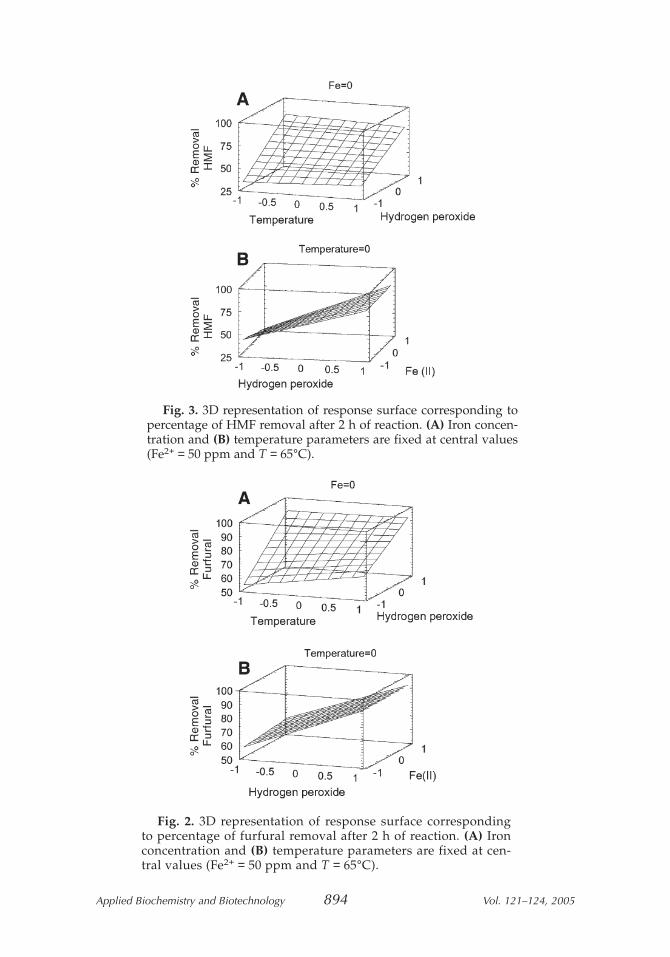
Fig. 2. 3D representation of response surface correspondingto percentage of furfural removal after 2 h of reaction. (A) Ironconcentration and (B) temperature parameters are fixed at cen-tral values (Fe2+ = 50 ppm and T = 65°C).
Fig. 3. 3D representation of response surface corresponding topercentage of HMF removal after 2 h of reaction. (A) Iron concen-tration and (B) temperature parameters are fixed at central values(Fe2+ = 50 ppm and T = 65°C).
Applied Biochemistry and Biotechnology 894 Vol. 121–124, 2005
6A_01_ABAB_v2_887-900.qxd 28/03/2005 5:06 pm Page 894
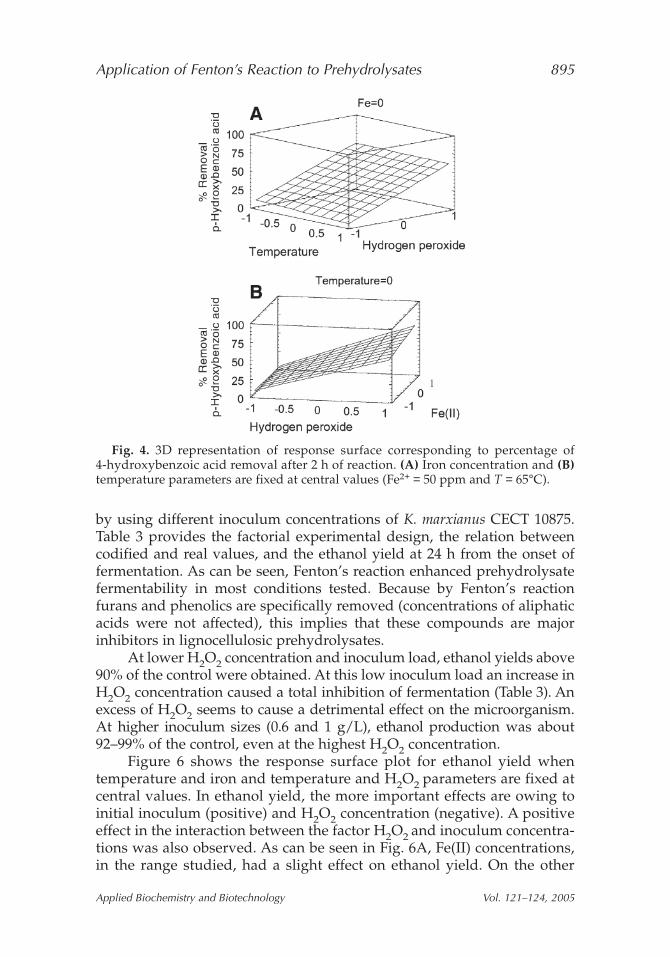
by using different inoculum concentrations of K. marxianus CECT 10875.Table 3 provides the factorial experimental design, the relation betweencodified and real values, and the ethanol yield at 24 h from the onset offermentation. As can be seen, Fenton’s reaction enhanced prehydrolysatefermentability in most conditions tested. Because by Fenton’s reactionfurans and phenolics are specifically removed (concentrations of aliphaticacids were not affected), this implies that these compounds are majorinhibitors in lignocellulosic prehydrolysates.
At lower H2O2 concentration and inoculum load, ethanol yields above90% of the control were obtained. At this low inoculum load an increase inH2O2 concentration caused a total inhibition of fermentation (Table 3). Anexcess of H2O2 seems to cause a detrimental effect on the microorganism.At higher inoculum sizes (0.6 and 1 g/L), ethanol production was about92–99% of the control, even at the highest H2O2 concentration.
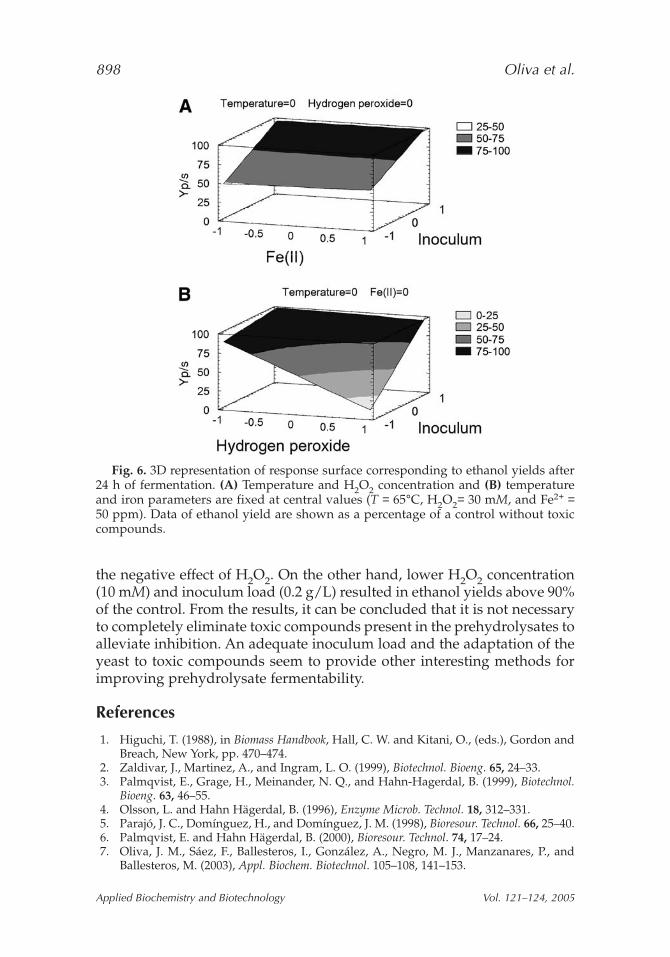
Figure 6 shows the response surface plot for ethanol yield whentemperature and iron and temperature and H2O2 parameters are fixed atcentral values. In ethanol yield, the more important effects are owing toinitial inoculum (positive) and H2O2 concentration (negative). A positiveeffect in the interaction between the factor H2O2 and inoculum concentra-tions was also observed. As can be seen in Fig. 6A, Fe(II) concentrations,in the range studied, had a slight effect on ethanol yield. On the other
Application of Fenton’s Reaction to Prehydrolysates 895
Applied Biochemistry and Biotechnology Vol. 121–124, 2005
Fig. 4. 3D representation of response surface corresponding to percentage of 4-hydroxybenzoic acid removal after 2 h of reaction. (A) Iron concentration and (B)temperature parameters are fixed at central values (Fe2+ = 50 ppm and T = 65°C).
6A_01_ABAB_v2_887-900.qxd 28/03/2005 5:06 pm Page 895
hand, the effect of inoculum concentration on ethanol production wasmore pronounced.
Bacteria and yeasts have been shown to metabolize furans (18,19) andaromatic aldehydes (20,21) although enzymes involved in the metabolicpathways remain unknown in most cases. In a previous work, Oliva et al.(22) demonstrated that K. marxianus CECT 10875 exhibits higher aldehydeassimilation rates in comparison with other fermentating microorganisms,although the reduction of aldehydes to their corresponding alcohols wasnecessary to start ethanol production by the yeast. As a consequence, thepresence of aldehydes caused a significant increase in lag phase beforeethanol production started. At the higher inoculum sizes used in theirstudy, the period of aldehyde assimilation was shortened and, consequently,the lag phase. Thus, the optimum inoculum concentration, and the adapta-tion of the microorganism to toxic compounds, should be consideredimportant variables in increasing fermentability of prehydrolysates.
Higher H2O2 concentrations (Fig. 6B), which were more effective inremoving toxic substances, produced a decrease in ethanol production.Higher H2O2 concentrations had a pernicious effect on ethanol yield,showing that an excess of H2O2 has an inhibitory effect on the microor-ganism. By using a large yeast inoculum the toxic effect of H2O2 could beovercome.
896 Oliva et al.
Applied Biochemistry and Biotechnology Vol. 121–124, 2005
Fig. 5. 3D representation of response surface corresponding to percentage ofvanillin removal after 2 h of reaction. (A) Iron concentration and (B) temperatureparameters are fixed at central values (Fe2+ = 50 ppm and T = 65°C).
6A_01_ABAB_v2_887-900.qxd 28/03/2005 5:06 pm Page 896
The response surfaces clearly show that an H2O2 concentration of50 mM, at which more toxic compounds were removed, is not adequate toobtain high ethanol production. From the results, it can be concluded thatthe overall elimination of toxic compounds present in the prehydrolysatesis not necessary to alleviate inhibition.
Conclusion
Historically, a number of detoxification methods have been proposedto transform inhibitors into inactive compounds or to reduce their concen-tration. The effectiveness of a detoxification method depends not only onreducing the presence of inhibitors in hemicellulosic prehydrolysates, butalso on the microorganism strains and fermentation conditions. Fenton’sreaction has been shown to be an effective method for removing toxic com-pounds generated during steam explosion of biomass. H2O2 was the mostimportant factor for inhibitor removal. The highest H2O2 concentrationtested (50 mM) was most effective in removing inhibitors. However, thisconcentration resulted in lower ethanol yield when using a lower inoculumsize (0.2 g/L). A larger inoculum size (0.6 g/L) was required to overcome
Application of Fenton’s Reaction to Prehydrolysates 897
Applied Biochemistry and Biotechnology Vol. 121–124, 2005
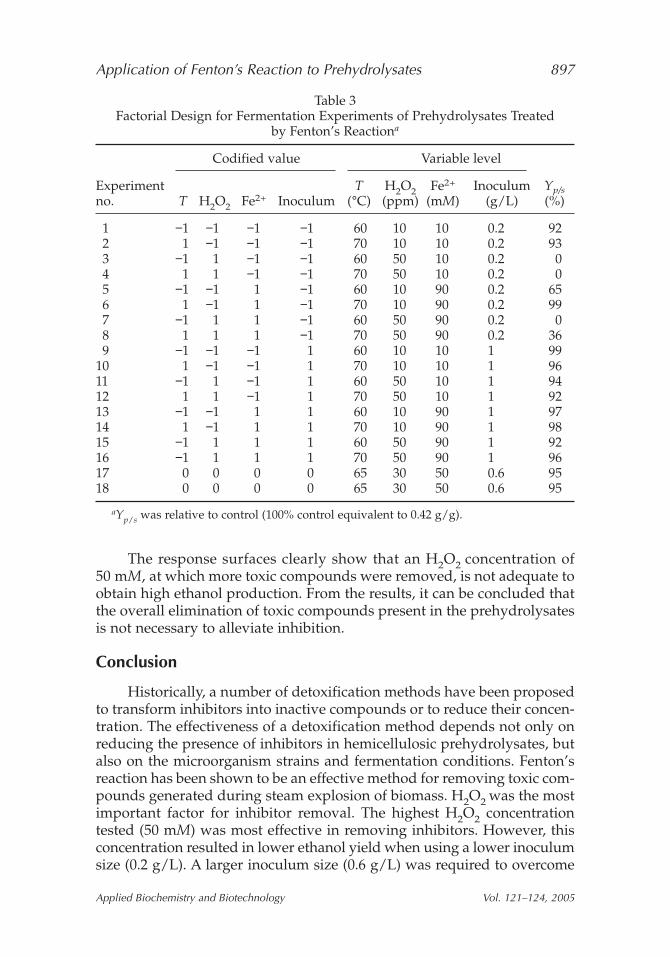
Table 3Factorial Design for Fermentation Experiments of Prehydrolysates Treated
by Fenton’s Reactiona
Codified value Variable level
Experiment T H2O2 Fe2+ Inoculum Yp/sno. T H2O2 Fe2+ Inoculum (°C) (ppm) (mM) (g/L) (%)
1 −1 −1 −1 −1 60 10 10 0.2 922 1 −1 −1 −1 70 10 10 0.2 933 −1 1 −1 −1 60 50 10 0.2 04 1 1 −1 −1 70 50 10 0.2 05 −1 −1 1 −1 60 10 90 0.2 656 1 −1 1 −1 70 10 90 0.2 997 −1 1 1 −1 60 50 90 0.2 08 1 1 1 −1 70 50 90 0.2 369 −1 −1 −1 1 60 10 10 1 99
10 1 −1 −1 1 70 10 10 1 9611 −1 1 −1 1 60 50 10 1 9412 1 1 −1 1 70 50 10 1 9213 −1 −1 1 1 60 10 90 1 9714 1 −1 1 1 70 10 90 1 9815 −1 1 1 1 60 50 90 1 9216 −1 1 1 1 70 50 90 1 9617 0 0 0 0 65 30 50 0.6 9518 0 0 0 0 65 30 50 0.6 95
aYp/s was relative to control (100% control equivalent to 0.42 g/g).
6A_01_ABAB_v2_887-900.qxd 28/03/2005 5:06 pm Page 897
the negative effect of H2O2. On the other hand, lower H2O2 concentration(10 mM) and inoculum load (0.2 g/L) resulted in ethanol yields above 90%of the control. From the results, it can be concluded that it is not necessaryto completely eliminate toxic compounds present in the prehydrolysates toalleviate inhibition. An adequate inoculum load and the adaptation of theyeast to toxic compounds seem to provide other interesting methods forimproving prehydrolysate fermentability.
References
1. Higuchi, T. (1988), in Biomass Handbook, Hall, C. W. and Kitani, O., (eds.), Gordon andBreach, New York, pp. 470–474.
2. Zaldivar, J., Martinez, A., and Ingram, L. O. (1999), Biotechnol. Bioeng. 65, 24–33.3. Palmqvist, E., Grage, H., Meinander, N. Q., and Hahn-Hagerdal, B. (1999), Biotechnol.
Bioeng. 63, 46–55.4. Olsson, L. and Hahn Hägerdal, B. (1996), Enzyme Microb. Technol. 18, 312–331.5. Parajó, J. C., Domínguez, H., and Domínguez, J. M. (1998), Bioresour. Technol. 66, 25–40.6. Palmqvist, E. and Hahn Hägerdal, B. (2000), Bioresour. Technol. 74, 17–24.7. Oliva, J. M., Sáez, F., Ballesteros, I., González, A., Negro, M. J., Manzanares, P., and
Ballesteros, M. (2003), Appl. Biochem. Biotechnol. 105–108, 141–153.
898 Oliva et al.
Applied Biochemistry and Biotechnology Vol. 121–124, 2005
Fig. 6. 3D representation of response surface corresponding to ethanol yields after24 h of fermentation. (A) Temperature and H2O2 concentration and (B) temperatureand iron parameters are fixed at central values (T = 65°C, H2O2= 30 mM, and Fe2+ =50 ppm). Data of ethanol yield are shown as a percentage of a control without toxiccompounds.
6A_01_ABAB_v2_887-900.qxd 28/03/2005 5:06 pm Page 898
8. Mussatto, S. I. and Roberto, I. C. (2004), Bioresour. Technol. 93, 1–10.9. Herrera, F., Pulgarin, C., Nadtochenko, V., and Kiwi, J. (1998), Appl. Catal. B Environ.
17, 141–156.10. Miranda, M. A., Galindo, F., Amat, A. M., and Arques, A. (2001), Appl. Catal. B Environ.
30, 437–444.11. Yeber, M. C., Rodriguez, J., Freer, J. Durán, N., and Mansilla, H. D. (2000), Chemosphere
41, 1193–1197.12. Chamarro, E., Marco, A., and Esplugas, S. (2000), Water Res. 35, 1047–1051.13. Bentivenga, G., Bonini, C., D’Auria, M., and De Bona, A. (2003), Biomass Bioenergy 24,
233–238.14. Oviedo, C., Contreras, D., Freer, J., and Rodriguez, J. (2003), Fresen Environ. Bull. 12(11),
1323–1327.15. Negro, M. J., Manzanares, P., Oliva, J. M., Ballesteros, I., and Ballesteros, M. (2003),
Biomass Bioenergy, 25, 301–308.16. Box, G. E. P., Hunter, W. G., and Hunter, J. S. (1978), Statistics for Experimenters, John
Wiley & Sons, New York.17. Oliva, J. M. (2003), PhD thesis, Biology Faculty, Complutense University, Madrid,
Spain.18. Palmqvist, E., Grage, H., Meinander, N. Q., and Hahn-Hagerdal, B. (1999), Biotechnol.
Bioeng. 63, 46–55.19. Taherzadeh, M., Gustafsson, L., Niklasson, C., and Liden, G. (2000), J. Biosci. Bioeng.
87, 169–174.20. Delgenes, J. P., Moletta, R., and Navarro, J. M. (1996), Enzyme Microb. Technol. 19,
220–225.21. Larsson, S., Quintana-Sainz, A., Reimann, A., Nilvebrant, N. O., and Jönsson, L. J.
(2000), Appl. Biochem. Biotechnol. 84–86, 617–632.22. Oliva, J., Ballesteros, I., Negro, M. J., Manzanares, P., Cabanas, A., and Ballesteros, M.
(2004), Biotechnol. Progress, 20, 715–720.
Application of Fenton’s Reaction to Prehydrolysates 899
Applied Biochemistry and Biotechnology Vol. 121–124, 2005
6A_01_ABAB_v2_887-900.qxd 28/03/2005 5:06 pm Page 899