Breakthrough in chloroplast genetic engineering of agronomically important crops
Upload
independentCategory
view
0download
0
Subscriber access provided by Helmholtz Zentrum Muenchen - Zentralbibliothek
Journal of Proteome Research is published by the American Chemical Society.1155 Sixteenth Street N.W., Washington, DC 20036Published by American Chemical Society. Copyright © American Chemical Society.However, no copyright claim is made to original U.S. Government works, or worksproduced by employees of any Commonwealth realm Crown government in thecourse of their duties.
Article
The Genetic Manipulation of Isoprene Emissions inPoplar Plants Remodels the Chloroplast Proteome
Violeta Velikova, Andrea Ghirardo, Elisa Vanzo, JulianeMerl, Stefanie M Hauck, and Joerg-Peter Schnitzler
J. Proteome Res., Just Accepted Manuscript • DOI: 10.1021/pr401124z • Publication Date (Web): 22 Jan 2014
Downloaded from http://pubs.acs.org on February 7, 2014
Just Accepted
“Just Accepted” manuscripts have been peer-reviewed and accepted for publication. They are postedonline prior to technical editing, formatting for publication and author proofing. The American ChemicalSociety provides “Just Accepted” as a free service to the research community to expedite thedissemination of scientific material as soon as possible after acceptance. “Just Accepted” manuscriptsappear in full in PDF format accompanied by an HTML abstract. “Just Accepted” manuscripts have beenfully peer reviewed, but should not be considered the official version of record. They are accessible to allreaders and citable by the Digital Object Identifier (DOI®). “Just Accepted” is an optional service offeredto authors. Therefore, the “Just Accepted” Web site may not include all articles that will be publishedin the journal. After a manuscript is technically edited and formatted, it will be removed from the “JustAccepted” Web site and published as an ASAP article. Note that technical editing may introduce minorchanges to the manuscript text and/or graphics which could affect content, and all legal disclaimersand ethical guidelines that apply to the journal pertain. ACS cannot be held responsible for errorsor consequences arising from the use of information contained in these “Just Accepted” manuscripts.
1
The Genetic Manipulation of Isoprene Emissions in Poplar Plants
Remodels the Chloroplast Proteome
Violeta Velikova1,2, Andrea Ghirardo2, Elisa Vanzo2, Juliane Merl3, Stefanie M. Hauck3, Jörg-
Peter Schnitzler2*
1Institute of Plant Physiology and Genetics, Bulgarian Academy of Sciences, Acad. G.
Bonchev Str. Bl. 21, 1113 Sofia, Bulgaria
2Helmholtz Zentrum München, Institute of Biochemical Plant Pathology, Research Unit,
Environmental Simulation, Ingolstädter Landstr. 1, D-85764 Neuherberg, Germany
3Helmholtz Zentrum München, Research Unit Protein Science, Ingolstädter Landstr. 1, D-
85764 Neuherberg, Germany
Page 1 of 49
ACS Paragon Plus Environment
Journal of Proteome Research
123456789101112131415161718192021222324252627282930313233343536373839404142434445464748495051525354555657585960
2
KEYWORDS: proteomics, photosynthesis, PSI, PSII, abiotic stress, defense, volatile organic
compounds.
ABSTRACT: Biogenic isoprene (2-methyl-1,3-butadiene) improves the integrity and
functionality of thylakoid membranes and scavenges reactive oxygen species (ROS) in plant
tissue under stress conditions. Based on available physiological studies, we hypothesized
that the suppression of isoprene production in the poplar plant by genetic engineering would
cause changes in the chloroplast protein pattern, which in turn would compensate for
changes in chloroplast functionality and overall plant performance under abiotic stress. To
test this hypothesis, we used a stable isotope-coded protein labeling technique in conjunction
with polyacrylamide gel electrophoresis and liquid chromatography tandem mass
spectrometry. We analyzed quantitative and qualitative changes in the chloroplast proteome
of isoprene-emitting (IE) and non-isoprene-emitting (NE) poplars. Here, we demonstrate that
suppression of isoprene synthase by RNA interference resulted in decreased levels of
chloroplast proteins involved in photosynthesis and increased levels of histones, ribosomal
proteins and proteins related to metabolism. Overall, our results show that the absence of
isoprene triggers a re-arrangement of the chloroplast protein profile to minimize the negative
stress effects resulting from the absence of isoprene. The present data strongly support the
idea that isoprene improves/stabilizes thylakoid membrane structure and interferes with the
production of ROS.
1. INTRODUCTION
Plant volatile isoprenoids (isoprene, monoterpenes and sesquiterpenes) have developed
various functions in plants via evolution. These compounds play critical roles in plant
communication with herbivores1 and in plant defense mechanisms against biotic and abiotic
Page 2 of 49
ACS Paragon Plus Environment
Journal of Proteome Research
123456789101112131415161718192021222324252627282930313233343536373839404142434445464748495051525354555657585960
3
stresses2 as well as modulate stress-induced signaling molecules3,4. Isoprene protects
photosynthetic processes against oxidative stresses elicited by high temperatures5-8, ozone9-
11 and drought12,13. Although the impact of volatile isoprenoids on abiotic stress protection
has been clearly demonstrated, the biophysical and biochemical mechanisms underlying the
induced protection are still unclear.
In the last decade, attempts have been made to analyze the functionality of isoprene using
molecular approaches. The role of isoprene in plant protection against thermal and oxidative
stresses has been studied using transgenic approaches either by the knock-down of the
natural isoprene emission in grey poplar (Populus x canescens)8 or by the introduction of this
trait in Arabidopsis thaliana14,15 and Nicotiana tabacum16, two naturally non-isoprene-emitting
species. Using both approaches, a positive effect of isoprene on plant stress resistance was
documented2. Detailed metabolomic analysis of transgenic poplars under various stress
conditions, e.g., ozone11, high temperature17, and atmospheric CO2 levels18 revealed
metabolome-wide re-arrangements of cellular metabolism between isoprene-emitting and
isoprene-suppressed poplars. However, these changes were also partially present under
control conditions. Moreover, recent evidence has demonstrated that isoprene improves the
integrity and functionality of thylakoid membranes under optimal conditions in transgenic
isoprene-emitting Arabidopsis19 and poplar20. Overall, the compensatory multiple stress
tolerance mechanisms in isoprene-suppressed poplar leaves most likely includes a
remodeling of the proteome of photosynthetically active cells, which in turn may influence
plant functionality.
The present study focuses on the chloroplast proteome of poplar because isoprene
biosynthesis proceeds through the chloroplastic 2-C-methyl-D-erythritol-4-phosphate (MEP)
pathway, supplying the substrate dimethylallyl diphosphate (DMADP) to isoprene synthase
(ISPS, EC 4.2.3.27)21. Chloroplasts are specialized organelles harboring the photosynthetic
apparatus essential for the production of bioenergy and CO2 fixation and serve as metabolic
Page 3 of 49
ACS Paragon Plus Environment
Journal of Proteome Research
123456789101112131415161718192021222324252627282930313233343536373839404142434445464748495051525354555657585960
4
hubs for various primary and secondary biosynthetic pathways essential for plant growth,
development and defense.
Chloroplasts have their own genome, containing approximately 120 genes. These genes
encode RNAs and proteins involved in gene expression as well as a variety of proteins that
function in photosynthesis22. Although the chloroplasts translate their own proteins, nuclear
genes encode approximately 90% of chloroplast proteins. These proteins are synthesized on
cytosolic ribosomes and are then imported into the chloroplast as complete polypeptide
chains22 via translocon complexes, followed by processing, folding and assembly by various
chaperone systems24-26. The chloroplast is surrounded by a double-membrane called the
inner and outer envelope membrane. In addition, a third membrane system is present inside
the chloroplast, known as the thylakoid membrane, which forms flattened discs or stacks
called thylakoid and grana, respectively. On thylakoid membranes, multi-subunit protein
complexes (photosystem I and II, “PSI” and “PSII”, the ATP synthase complex, and the
cytochrome b6f complex) are located27. The thylakoid membrane is the location where solar
energy is collected, converted and stored in the form of chemical compounds (ATP and
NADPH).27 Although the chloroplasts are best known for their role in photosynthesis, they
also host other essential metabolic processes, such as the synthesis of lipids, pigments,
phenylquinones, aromatic amino acids, vitamins, secondary metabolites such as isoprenoids
and alkaloids, starch, a wide set of signaling molecules, plant hormone precursors, and
others.28
Chloroplast studies are a classical field in plant physiology and ultrastructural biology;
however, the knowledge regarding the chloroplast proteome is still scarce. To understand
metabolic processes in the chloroplasts, more information regarding selected proteins and
their functions is required. Advances in proteomic techniques in combination with increasing
genomic and transcriptomic information have enabled studies on chloroplast proteins,
providing additional information regarding their functional compartmentalization and
characterization29,30 .
Page 4 of 49
ACS Paragon Plus Environment
Journal of Proteome Research
123456789101112131415161718192021222324252627282930313233343536373839404142434445464748495051525354555657585960
5
The present work is the first study specifically addressing changes in the chloroplast protein
profile of plants altered in their isoprene emission capability. The chloroplast proteome in
isoprene-emitting (IE: wild type and empty vector control, WT/EV) and non-isoprene-emitting
(NE: RA1/RA2) poplar lines was characterized. We applied an approach for quantitative and
qualitative proteomics based on stable isotope-coded protein labeling (ICPL) in combination
with polyacrylamide gel electrophoresis (PAGE) and liquid chromatography tandem mass
spectrometry (LC-MS/MS).31 We aimed to understand whether the absence of isoprene
production (i) triggers overall changes in the chloroplast proteome, (ii) affects the
composition of protein complexes of the photosynthetic electron transport chain, and alters
the enzyme abundance of chloroplast biosynthetic pathways, and (iii) how non-isoprene
emitting poplars adjust their structural proteome.
2. MATERIAL AND METHODS
Plant Materials and Growth Conditions
In the present study, two non-isoprene-emitting (NE) PcISPS-RNA interference (RNAi)
transgenic lines (RA1 and RA2) were compared to isoprene-emitting (IE) wild type (WT) and
the control of transgenic manipulation empty vector (EV) of grey poplars (Populus x
canescens; syn. Populus tremula x P. alba)8,11,17,18,20. The RA1 and RA2 lines correspond to
independently transformed lines emitting only 0.5-2% of isoprene compared to the emission
capacity of WT/EV8,20. The EV line was included in the experiments to ensure that
differences in the chloroplast proteome between NE and IE were due to specific alteration of
the PcISPS gene and not to a more general genetic manipulation effect. The plants were
grown in a greenhouse with ambient day/night temperature of 25°C/20°C, relative humidity of
60/50%, and 16 h day length. When the light intensity was less than 700 µmol m-2 s-1 of
photosynthetically active radiation (PAR), supplemental light was provided by high-pressure
sodium lamps (Philips SON T-AGRO 400W). The plants were planted into 2.2-L pots with
Page 5 of 49
ACS Paragon Plus Environment
Journal of Proteome Research
123456789101112131415161718192021222324252627282930313233343536373839404142434445464748495051525354555657585960
6
soil substrate [25% v/v Fruhstorfer Einheitserde (Bayerische Gärtnereigenossenschaft,
Aschheim, Gemany), 25% v/v silica sand (particle size 1–3 mm) and 50% v/v perlite (Agriperl
Dämmstoff GmbH, Dortmund, Germany] and fertilizer [Triabon (Compo, Münster, Germany)
and Osmocote (Scotts Miracle-Gro, Marysville, USA) (1:1, v/v; 10 g per liter of soil)]. Four-
month old plants were used for the experiments.
Chloroplast Isolation
Fully expanded leaves (9th and 10th nodes from the apical meristem) from 4 to 5 plants were
collected. Approximately 10 g of finely chopped leaf material was homogenized in 40 mL of
semi-frozen isolation medium (350 mM sorbitol, 50 mM HEPES-KOH, pH 7.5, 5 mM MgCl2, 2
mM ascorbate, 0.1% BSA, 1 mM EDTA) for 3 x 10 sec pulses in a mechanical blender. The
homogenate was filtered through four layers of Miracloth (Calbiochem, Darmstadt,
Germany). The filtrate was centrifuged for 3 min at 4°C and 4,000 x g, and the pellet (“crude
chloroplasts”) was re-suspended in grinding medium (20 ml) and re-sedimented for 3 min at
4°C and 4,000 x g (including acceleration time), and again re-suspended. The suspension
was loaded on top of sucrose gradients (4 to 10 mL per gradient 40 and 80% sucrose) and
centrifuged at 10,000 x g at 4°C for 10 min. After centrifugation, the chloroplast layer at the
interface of the two gradients was collected, washed with 40 mL of re-suspension medium
(50 mM HEPES-KOH, pH 7.5, 1 mM MgCl2, 2 mM EDTA), and centrifuged for 10 min at
5,000 x g at 4ºC. The chloroplast pellet was re-suspended in a final volume of 1 to 2 mL. This
chloroplast fraction was used to perform the ICPL reaction and PAGE for subsequent label-
free comparisons.
The protein content of the chloroplast suspension was measured according to Bradford32 and
the chlorophyll content according to Lichtenthaler and Wellburn33. Before measuring the
protein level in the samples, the chlorophyll was removed by 3-times washing procedure with
methanol. In average, 5.0 ± 0.08 !g protein (n = 9) corresponded to 10 µg chlorophyll. For
Page 6 of 49
ACS Paragon Plus Environment
Journal of Proteome Research
123456789101112131415161718192021222324252627282930313233343536373839404142434445464748495051525354555657585960
7
normalization of protein loading on the gel, a protein equivalent corresponding to 10 µg
chlorophyll was applied.
SDS-PAGE and Sample Preparation for Label-Free Comparative Analysis
The chloroplast proteins were separated on a SDS-PAGE gradient (4-16%) gel. Prior SDS-
PAGE the chloroplast proteins (10 µg chlorophyll) were solubilized in a sample buffer (62.5
mM Tris-HCl, pH 6.8, 2% SDS, 10% glycerin and 5% mercaptoethanol) by incubation for 30
min at room temperature in the dark. The electrophoresis was performed in the dark at 4°C
and constant voltage (100 V) for about 4:30 – 5:00 h. After electrophoresis, the gel was fixed
in 15% trichloracetic acid for 10 min and stained with Coomassie Brilliant Blue R-250. The
respective gel-bands at ~ 50 kDa and ~ 11-13 kDa were excised in all lanes (three replicates
of IE and NE, respectively) and subjected to in-gel digestion using trypsin as previously
described.34 The supernatants containing the eluted tryptic peptides were dried in a
speedvac (UniEquip Laboratory Instruments GmbH, Planegg, Germany) and stored at -20°C
prior to LC-MS/MS analysis.
LC-MS/MS Analysis
Dried peptides were resuspended in 2% acetonitrile/0.1% trifluoric acid. The samples were
centrifuged 1000 x g at 4°C for 5 min. LC-MS/MS analysis was performed as previously
described by using an Ultimate 3000 nano-HPLC (Dionex, Thermo Scientific, Bremen,
Germany)34,35. Briefly, every sample was automatically injected and loaded onto the trap
column. After 5 min, the peptides were eluted and separated on the analytical column (75 µm
i.d. x 15 cm, Acclaim PepMap100 C18, 3 µm, 100 Å Dionex, Idstein, Germany) by an
acetonitrile gradient at 300 nl min-1 flow rate (60 min gradients for the label-free analysis, 170
min gradients for the ICPL analysis). From the MS pre-scan, the 10 most abundant peptide
ions were fragmented by collision-induced dissociation in the linear ion trap if they showed
an intensity of at least 200 counts and if they were at least +2 charged. During fragmentation,
Page 7 of 49
ACS Paragon Plus Environment
Journal of Proteome Research
123456789101112131415161718192021222324252627282930313233343536373839404142434445464748495051525354555657585960
8
a high-resolution (60,000 full-width half maximum) MS spectrum was acquired in the LTQ
OrbitrapXL (Thermo Scientific, Bremen, Germany) with a mass range from 300 to 1,500 Da
and a dynamic exclusion of 30 sec or 60 sec for the label-free and the ICPL analysis,
respectively.
Label-Free Analysis
The acquired spectra for the two label-free datasets (11-13 kDa and 50 kDa gel slices) were
loaded into the Progenesis LC-MS software (version 2.5, Nonlinear) for label-free
quantification and were analyzed as previously described34,35. Features with only one charge
or more than eight charges were excluded from data analysis. Raw abundances of the
remaining features were normalized to allow correction for factors resulting from
experimental variation. All MS/MS spectra were exported as a Mascot generic file (mgf) and
used for peptide identification with MASCOT (version 2.3.02) in the Populus trichocarpa
protein database (version 4, 17236452 residues, 45036 sequences). The search parameters
included 10 ppm peptide mass and 0.6 Da MS/MS tolerance, one missed cleavage was
allowed, cysteine carbamidomethylation was set as the fixed modification, methionine
oxidation and asparagine or glutamine deamidation were allowed as variable modifications.
Using a MASCOT ion score cut-off of 30 and an appropriate significance threshold p, a
MASCOT-integrated decoy database search calculated a false discovery rate (FDR) of <1%.
For each dataset, the peptide assignments were re-imported into the Progenesis LC-MS
software. After summing the abundances of all the peptides allocated to each protein, the
identification and quantification results were exported and are shown in Tables 1A and 1B.
Log2 ratios of [!(NE)/!(IE)] from protein abundances were calculated and are reported in
Table 1A and 1B.
Isotope-Coded Protein Labeling and Analyses
Stable isotope labeling of chloroplast proteins isolated from IE (WT, EV) and NE (RA1, RA2)
was performed using the ICPLTM Duplex- and Quadruplex-Kits (SERVA Electrophoresis
Page 8 of 49
ACS Paragon Plus Environment
Journal of Proteome Research
123456789101112131415161718192021222324252627282930313233343536373839404142434445464748495051525354555657585960
9
GmbH, Heidelberg, Germany) following the manufacturer’s instructions. For the quatruplex
analysis with two biological replicates, 50 µg of the isotope-labeled proteins from the four
different samples (ICPL-0 = WT, ICPL-4 = EV, ICPL-6 = RA1, ICPL-10 = RA2) were
combined, and the proteins were precipitated using ice-cold 80% acetone. The same was
repeated for two biological replicates with duplex analysis paring WT/RA1 and EV/RA2. The
resulting 200 !g of protein per biological replicate was separated by 1D SDS-PAGE. After
protein staining with Coomassie Brilliant Blue each lane was cut into 5 slices and subjected
to in-gel digestion with trypsin (Sigma Aldrich) as previously described.34 LC-MS/MS analysis
was performed as described above.
The acquired MS/MS spectra were searched against the Populus trichocarpa database
(Version: 2.3, 45036 sequences) using the Mascot search engine (version 2.3.02; Matrix
Science) with the following parameters: a precursor mass error tolerance of 10 ppm and a
fragment tolerance of 0.6 D. One missed cleavage was allowed. The complete list of protein
descriptions, protein group accessions, sequence of peptides, quan usage, ion score,
number of missed cleavages, and the molecular mass of the MH+ ion is given in the
Supplemental Table S3. Carbamidomethylation was set as the fixed modification. ICPL-0,
ICPL-4, ICPL-6 and ICPL-10 for the lysine residues of the peptides were set as variable
modifications. Data processing for the identification and quantitation of the ICPL-duplex- and
quadruplex-labeled proteins was performed using Proteome Discoverer version 1.3.0.339
(Thermo Scientific). The Mascot Percolator algorithm was used for the discrimination
between correct and incorrect spectrum identifications36 with a maximum q value of 0.01.
Proteins were further filtered using the following parameters: high peptide confidence and at
least 2 peptides per protein (count only rank 1 peptides and count peptide only in top scored
proteins). Peptide lists were exported, and the abundances of all unique peptides allocated to
one respective protein were summed to determine the intensities of the individual and
differentially labeled proteins for the biological replicates. Protein lists were also exported,
containing the ICPL ratios for the individual proteins in the different samples.
Page 9 of 49
ACS Paragon Plus Environment
Journal of Proteome Research
123456789101112131415161718192021222324252627282930313233343536373839404142434445464748495051525354555657585960
10
Blue Native PAGE (BN-PAGE)
BN-PAGE is an excellent tool to analyze proteins and protein complexes in their native form.
Thylakoid isolation was performed under dim light at 4°C following the protocol of Järvi et
al.37 modified for poplar leaf material. Thylakoids were isolated from fresh leaves ground in
ice-cold grinding buffer (350 mM sorbitol; 50 mM HEPES/KOH, pH 7.5; 5 mM MgCl2; 2 mM
ascorbate; 1 mM EDTA and 0.1% BSA). The suspension was filtered through two layers of
Miracloth followed by centrifugation at 5,000 x g at 4°C for 5 min. The pellet was re-
suspended in buffer (50 mM HEPES/KOH, pH 7.5; 1 mM MgCl2 and 2 mM EDTA), followed
by centrifugation at 5,000 x g at 4°C for 5 min. The pellet was re-suspended in a small aliquot
of storage buffer (50 mM HEPES/KOH, pH 7.5; 100 mM Sorbitol and 10 mM MgCl2).
The thylakoid membranes (10 µg chlorophyll) were re-suspended in ice-cold sample buffer (1
M 6-aminocapronic acid; 100 mM BisTris/HCl, pH 7.0; 100 mM NaCl, 20% glycerol, 0.1%
SERVA Blue G) (Serva Electrophoresis) with 0.25 mg mL-1 Pefabloc (Sigma-Aldrich,
Deisenhofen, Germany). Prior to native-PAGE, the thylakoid membranes were solubilized in
1.5% dodecyl maltoside (Invitrogen, Darmstadt, Germany) in the dark for 5 min on ice. The
BN-PAGE samples were supplemented with a one-tenth volume of Serva Blue G buffer
(Serva Electrophoresis, Heidelberg, Germany). Thylakoid membrane proteins were
separated on 4 – 16% Bis-Tris gel (Novex by LifeTechnologies, Darmstadt, Germany).
Electrophoresis was performed at 0°C with a gradual increase in the voltage as follow: 75 V
for 30 min, 100 V for 30 min, 125 V for 30 min, 150 V for 60 min (total running time 2:30 h).
Anode and cathode buffer were commercially obtained from Serva Electrophoresis. After
electrophoresis, the gel was fixed in 40% methanol and 10% acetic acid solution, followed by
a destaining procedure in 8% acetic acid solution. ImageJ v.1.47 was utilized to quantify the
bands.
Acid-Urea-PAGE of Histones
Page 10 of 49
ACS Paragon Plus Environment
Journal of Proteome Research
123456789101112131415161718192021222324252627282930313233343536373839404142434445464748495051525354555657585960
11
The chloroplast suspension was used to analyze histones by acetic-acid-urea-
polyacrylamide gel electrophoresis following the protocol38. Histone proteins were separated
using 15% TBE-Urea gels (Novex by LifeTechnologies, Darmstadt, Germany). Prior to
separation, the samples were solubilized in a TBE-Urea sample buffer (Novex by
LifeTechnologies, Darmstadt, Germany) for 5 min at room temperature. Acetic acid (5%) was
used as a running buffer. Electrophoresis was performed at room temperature at a constant
voltage (300 V) for 4:30 h. Proteins were visualized with silver stain.39 For quantification of
the bands, ImageJ v.1.47 was utilized.
Statistics
Proteomic differences of ICPL chloroplast samples were analyzed using a multivariate data
analysis approach with Principal Component Analysis (PCA) and Orthogonal Partial Least
Square regression (OPLS) statistical methods from the software packages ‘SIMCA-P’ (v.
13.0.0.0, Umetrics, Umeå, Sweden). The results were validated by ‘full cross validation’40,41
using a 95% confidence level. PCA was performed on a 119-by-12 matrix of ICPL data, i.e.
using as X-variables (centered and scaled with 1 s.d.-1) the summed peptide intensities
(normalized per protein content) of the 119 proteins from the 12 samples (four lines: WT, EV,
RA1, RA2; n=3 biological replicates for each line). OPLS was used to select discriminant
proteins that significantly distinguish NE from IE samples. OPLS was calculated by defining
as Y-variable the ability of the samples to emit isoprene, with NE = 0 and IE = 1. The
regression model was tested for significance by CV-ANOVA41. Proteins showing Variable of
Importance for the Projection (VIP) greater than 1 and uncertainty bars of jack-knifing
method42 smaller than the respective VIP value were defined as discriminant proteins.
Proteins in the NE lines were classified down- or up-regulated proteins when log2 of
[!(NE)/!(IE)] MS peak sum was < -1 or > +1, respectively, otherwise unchanged.
Page 11 of 49
ACS Paragon Plus Environment
Journal of Proteome Research
123456789101112131415161718192021222324252627282930313233343536373839404142434445464748495051525354555657585960
12
3. RESULTS and DISCUSSION
1D-PAGE Shows Differences in the Chloroplast Protein Profiles of NE and IE Poplars
The comparative study of chloroplast proteins using one-dimensional gel electrophoresis (1-
DE) and subsequent LC-MS/MS and label-free proteome analysis showed obvious
differences in protein abundance in chloroplast extracts from two NE (RA1/RA2) and two IE
(WT/EV) lines (Figure 1). The analysis was conducted in duplicate using independent
chloroplast isolations and including a technical replicate, resulting in 3 1-DE gels. The
presence of the two bands at 21 and 14 kDa (Figure 1) are indicative for chloroplast integrity
during isolation. It was demonstrated that these bands disappear from the fraction when
chloroplasts are broken.43
Prominent bands present in extracts of NE plants at "50 kDa and "11-13 kDa were visually
absent in the IE chloroplast extracts (Figure 1, red arrows). We excised and subjected these
bands to LC-MS/MS and label-free quantitative analysis. The annotation of the peptides
isolated from the 50 kDa protein band of the NE and IE extracts led to the identification of 15
proteins in total (Table 1A). The most abundant protein identified in the 50 kDa band of NE
extracts compared to the IE was serine hydroxymethyl transferase (SHMT, EC 2.1.2.1, log2
= 7.2). Significant (p = 0.004, t-test) up-regulation of SHMT was confirmed later using ICPL
analysis (Figure 3, Table 2, Supplemental Figure S1). SHMT was also observed earlier in
chloroplasts preparations from poplar44. However, plants possess SHMT isoforms in the
cytoplasm and mitochondria45. Cytosolic and mitochondrial SHMTs play a primary role in
folate-dependent pathways of C1 metabolism46. They catalyze the reversible, simultaneous
conversions of L-serine to glycine and tetrahydrofolate to 5,10-methylenetetrahydrofolate47,48.
There is an experimental evidence that the chloroplastic isoform of SHMT is an important
enzyme involved in the photorespiratory pathway49. Photorespiration is a well-known process
mitigating photooxidative damage by functioning as an electron sink to prevent the over-
reduction of the photosynthetic electron transport chain in the thylakoid membranes as well
Page 12 of 49
ACS Paragon Plus Environment
Journal of Proteome Research
123456789101112131415161718192021222324252627282930313233343536373839404142434445464748495051525354555657585960
13
as photoinhibition of PSII50. This process is initiated in the chloroplasts by the oxygenase
activity of ribulose-1,5-bisphosphate-carboxylase/-oxygenase (RuBisCO, EC 4.1.1.39).
Photorespiration generates various molecules such as H2O2, glycine and serine that further
increase the dissipatory effect51. Together with SHMT, aldehyde dehydrogenase (ALDH, EC
1.2.1.3) was another highly abundant protein in NE lines (log2 = 6.8). Earlier transcriptomic
analyses in the same poplar lines showed that ALDH transcript levels were lower in
unstressed NE (log2 = -1.34), indicating that the transcript levels and protein abundance
were not strictly correlated.17 ALDHs belong to a family of NAD(P)+-dependent enzymes that
play major roles in the detoxification of aldehydes generated in plant cells exposed to abiotic
stress. Arabidopsis plants over-expressing ALDH3 show improved tolerance to oxidative
stress (caused by excess of NaCl, heavy metals, methyl viologen, and H2O2) compared to
WT plants. Stress tolerance in these transgenic plants was accompanied by a reduction of
H2O2 and malondialdehyde derived from cellular lipid peroxidation52,53. We also found
catalase (EC 1.11.1.6), one of the main H2O2-metabolizing enzymes54, at a higher
abundance in chloroplast extracts of NE compared to IE (log2 = 5.2, Table 1A). Our findings
that NE extracts have an enhanced abundance of proteins related to antioxidative stress
mechanisms are consistent with observed metabolic differences between NE and IE poplars
under ambient CO2 concentrations18.
The up-regulation of a protein of the NAD/FAD-oxidoreductase protein family (EC 2.4.1.2 and
EC 2.4.1.3; log2 = 2.7, Table 1A) may affect the cyclic and non-cyclic electron flow in NE
chloroplasts. This finding suggests that these chloroplasts may have higher demands for
ATP and reducing power compared to IE55.
The suppression of isoprene biosynthesis in the poplar also affected proteins related to the
light reactions in photosynthesis (PsbO, LHC, ATP synthase (EC 3.6.3.15)) and primary
metabolic processes such as hydroxyproline-rich glycoprotein, phosphoglycerate kinase (EC
2.7.2.3) and fructose-bisphosphate aldolase (EC 4.1.2.13). These proteins were more
abundant in NE chloroplasts compared to IE chloroplasts (Table 1A).
Page 13 of 49
ACS Paragon Plus Environment
Journal of Proteome Research
123456789101112131415161718192021222324252627282930313233343536373839404142434445464748495051525354555657585960
14
Interestingly, in the excised 50 kDa band, two proteins had lower abundance in the NE plants
compared to the IE plants (Table 1A). These two proteins are the hydroperoxide lyase (EC
4.1.2.-, log2 = -2.1) and a protein belonging to the NmrA-like family (EC 1.3.1.-., log2 = -2.7).
Hydroperoxide lyases (HPLs) are members of the cytochrome P450 family and catalyze the
cleavage of fatty acid hydroperoxides to aldehydes and oxoacids56. HPLs mediate the
formation of green leaf volatiles (GLVs syn. Lipoxygenase (LOX) products) through oxylipin
metabolism56. Data from HPL-depleted transgenic potato lines strongly suggest that the
constitutive activity of this branch of the oxylipin biosynthetic pathway influences plant
defense processes57. NmrA acts as a negative transcriptional regulator involved in N
metabolism and is a member of the short-chain dehydrogenase reductase superfamily (EC
1.1.1.300). In addition, NmrA has the ability to discriminate between the oxidized and
reduced forms of dinucleotides, a feature that is linked to a possible role in redox sensing58, a
function that may also be of importance in poplars.
The proteomic analysis of the second band (~ 11-13 kDa), visually differing in abundance
between NE and IE is characterized by an enrichment of ribosomal proteins in NE (Table
1B).
Overall, using the comparative 1-DE proteomic analysis combined with LC-MS/MS has
shown that the proteomes of NE and IE chloroplasts significantly differ.
ICPL Analysis Reveals Overall Protein Changes in NE and IE Poplars
The initial 1-DE analysis provided the first hints regarding the differences in the chloroplast
protein pattern of NE and IE plants. However, the analysis did not show sufficient resolution
to obtain a general overview of the chloroplast proteome, neither to study post-translational
modifications nor to quantify changes in protein abundance. Therefore, we applied ICPL
analysis, which is based on isotopic labeling of all free amino groups in proteins. This method
enables quantitative proteome profiling of highly complex protein mixture31 and has never
been previously used for plant chloroplasts.
Page 14 of 49
ACS Paragon Plus Environment
Journal of Proteome Research
123456789101112131415161718192021222324252627282930313233343536373839404142434445464748495051525354555657585960
15
ICPL labeling allowed the quantification of 119 chloroplastic proteins, which were annotated
by searching against in the Populus trichocarpa genome sequences (Phytozome v9.1,
http://www.phytozome.net). A complete listing of all identified accessions is provided in
Supplemental Table S1. The full data of protein identification is listed in Supplemental Table
S3.
To determine the functions of the labeled chloroplastic proteins, a MapManBin search
(http://ppdb.tc.cornell.edu/dbsearch/searchacc.aspx) was performed using the accession
numbers of Arabidopsis. We clustered the 119 proteins in 8 functional categories. The main
group (29.4% of the total number of proteins) comprised proteins associated with
photosynthetic light reactions, proton transport, oxidation-reduction, the Calvin cycle and the
oxidative phosphopentose pathway. ‘Ribosomal proteins’ represented the next prominent
group (19.3%) followed by the category of ‘Structural role’ (16.0%) summarizing proteins
involved in protein synthesis, binding and folding. Proteins clustered in the ‘Metabolism’
group (12.6%) are assigned to various metabolic processes. ‘Histones’ represented 7.6% of
the overall number of proteins. Only a few proteins were related to ‘Stress’ (1.7%) and
‘Others’ (2.5%). A total of 10.9% labeled proteins were not functionally annotated or are still
not yet identified (Figure 2). ISPS and other enzymes of the MEP-pathway were not
identified, possibly due to their relative low abundance in comparison to the annotated
proteins.
The sub-plastidial localization of the ICPL-identified proteins was annotated using the
ChloroP database (www.grenoble.prabi.fr/at_chloro/)30,59. The results are summarized in
Table 1A and 1B, Table 2 and Supplemental Table S2. Histone proteins were excluded by
the ChloroP database because the corresponding genes of these histone-like proteins are
still unknown.
All identified proteins were subjected to PCA, which clearly revealed two distinct protein
profiles in the NE and IE lines (Supplemental Figure S1). To understand the details in the
Page 15 of 49
ACS Paragon Plus Environment
Journal of Proteome Research
123456789101112131415161718192021222324252627282930313233343536373839404142434445464748495051525354555657585960
16
relationship between individual chloroplast proteins and the suppression of ISPS, OPLS was
additionally employed. NE samples were significantly (p = 0.021; CV-ANOVA) separated
from IE by means of the first principal component (PC1). PC1 accounted for 22% of protein
variation and explained 93% of the variation in the Y-variables, which were defining the two
NE and IE groups (Figure 3A). The loading plot shows that the NE samples are positively
correlated to histones, ribosomal, and metabolism proteins and are negatively correlated to
proteins involved in photosynthesis and several proteins with structural functions. The
importance of these proteins to discriminate between NE and IE samples is shown in Table
2.
Up-regulated chloroplast proteins in NE plants
The finding that histone proteins are much more abundant in chloroplasts of NE plants was
confirmed by the quantification results using acid urea-PAGE (Supplemental Figure S2A, B).
Our data show that proteins identified as linker histone H1 and H5 family members, and
histone 2A and histone H2B were significantly up-regulated in the NE lines (Table 2, Figure
3, 4). Linker histones are usually structural chromatin components that generally repress the
accessibility of the genomic DNA60. The functions of histones related to isoprene are so far
unknown; therefore, it is difficult to interpret these results. The up-regulation of histones in
NE chloroplasts may be involved in specific developmental pathways and may even play a
role in the adaptation to water or thermal stress60,61. By dint of epigenetic memory, plants can
more efficiently respond to future stressful conditions. The up-regulation of histone proteins
in chloroplasts of NE plants compared to the IE controls has to be addressed in future
studies.
Ribosomal proteins were also significantly up-regulated in the NE plants compared to the IE
plants (Table 2, Figure 3, 4) both in the ICPL and in the label-free analysis of the 11-13 kDa
band. In addition to functioning in protein biosynthesis within the ribosome of chloroplasts,
several ribosomal proteins are involved in other cellular processes62. The up-regulation of
Page 16 of 49
ACS Paragon Plus Environment
Journal of Proteome Research
123456789101112131415161718192021222324252627282930313233343536373839404142434445464748495051525354555657585960
17
ribosomal proteins in our study may be indicative for a substantial increase in protein
turnover in NE plants, which supports the higher abundance of metabolites associated with
amino acids and nitrogen metabolism in NE plants18.
Down-regulated chloroplast proteins in NE plants
Proteins with a structural role
We classified 16% of the identified and quantified proteins into a group comprising proteins
with a structural role (Figure 2). This group includes (1) cyclophilins, (2) FKBP-type peptidyl-
prolylcis-trans isomerases (EC 5.2.1.8), (3) PAP fibrillin, (4) thylakoid formation protein
(THF), (5) ubiquitin, (6) the TCT-1/cpn60 chaperonin family, (7) the peptidase family (EC
3.4.-.-) and (8) chromatin binding protein (Supplemental Table S1). The first four proteins
discriminate NE from IE chloroplast proteins (Table 2, Figure 3, 4). FKBP-type and THF were
found to be significantly down-regulated in the NE lines (log2 = -1.5, p= 0.027 and log2 = -
1.5, p= 0.017, respectively) (Table 2). The lower abundance of the THF in the NE plants may
influence the assembly of PSII63. In Arabidopsis, THF 1 is a re-modeling factor of PSII–LHCII
complexes and is involved in the repair cycle of PSII upon photo damage64. Cyclophilins and
PAP fibrillin contents negatively correlate with the NE plant (Figure 3 and Table 2), although
statistical significance was not found (t-test, p = 0.112 and 0.086, respectively). Cyclophilins
and FKBPs are collectively referred to as immunophilins65. Cyclophilins stabilize the cis-trans
transition state of proteins and accelerate isomerization, which is an important process
involved in protein folding66, the assembly and the stabilization of multi-domain proteins,
including PSII63. Recent studies showed that cyclophilins and FKBPs play roles as
chaperonins and in cell signaling67,68. Based on the possible function of chloroplast
immunophilins as chaperonin as demonstrated by Gupta et al.67, we speculate that these
proteins may be involved in protein import and/or refolding processes in chloroplasts. The
lower abundance of cyclophilins in NE chloroplasts may result in the reduced assembly and
stability of photosynthetic complexes.
Page 17 of 49
ACS Paragon Plus Environment
Journal of Proteome Research
123456789101112131415161718192021222324252627282930313233343536373839404142434445464748495051525354555657585960
18
The PAP fibrillin family comprises plastidic lipid-associated proteins (PAPs) and putative
fibrillins. PAPs are involved in the coat formation process of lipoprotein particles69. This coat
may contain receptors important for the attachment of lipoprotein particles to the thylakoid
membrane as well as regulatory proteins that may function in the transfer of lipids to and
from the thylakoid membranes. The down-regulation of PAP fibrillin in NE may influence the
lipid environment and affect thylakoid membrane fluidity. In Arabidopsis, fibrillin-related
proteins accumulate in response to water stress, and depending on plant species and/or
stress conditions, these proteins are associated with different plastid structure-like-fibrils70,
plastoglobuli71 and thylakoid membranes72. It is currently under discussion that fibrillins may
stabilize carotenoid-accumulating structures70. Due to fibrillin association with plastoglobuli,
their lower level in NE chloroplasts may impair the storage of lipophilic compounds as
suggested by Pozueta-Romero et al71. Fibrillins in the poplar chloroplast may be associated
with stromal lamellae thylakoids that participate in the structural stabilization of thylakoids,
which has already been demonstrated in Arabidopsis where these fibrillins help prevent
damage resulting from osmotic or oxidative stress73.
Proteins related to photosynthesis
Blue native-PAGE was applied to understand the dynamics in the composition of thylakoid
membrane protein complexes. When the thylakoid membranes were resolved by BN-PAGE,
the protein patterns of the two groups of poplar lines were similar in content and intensity of
the individual bands (Supplemental Figure S3A). However, after semi-quantitative analysis of
the individual protein bands, it became clear that the levels of PSI, the PSII dimer, ATP
synthase, the PSII monomer, and the cytochrome b6f complex were slightly reduced in NE
compared to IE chloroplasts (Supplemental Figure S3B).
As expected, the largest functional group of proteins identified in the ICPL dataset (Figure 2,
3) was related to photosynthesis. Most of these proteins were subunits of photosynthetic
complexes (PSI, and PsbP and PsbQ of PSII), and proteins of the ATP synthase family as
Page 18 of 49
ACS Paragon Plus Environment
Journal of Proteome Research
123456789101112131415161718192021222324252627282930313233343536373839404142434445464748495051525354555657585960
19
well of the LHC (light-harvesting complex) were also present. Ferredoxin-NADP+ reductase
(EC 1.18.1.2), plastid NADH:ubiquinone oxidoreductase I (NDH-1, EC 1.6.5.3) with
oxidoreductase activity and the cytochrome b6f complex involved in photosynthetic electron
transfer reactions were additionally identified by LC-MS/MS analysis (Supplementary Table
S1). Most of the labeled proteins related to photosynthesis were strongly down-regulated in
NE chloroplasts (Figure 3, 4 and Table 2). Two intrinsic protein subunits of PSII, PsbP and
PsbQ were even strongly down-regulated in NE chloroplasts (Table 2). PsbP together with
PsbO stabilize the intrinsic D1 and D2 proteins in the PS II reaction center. In plant mutants
lacking PsbO, PsbP or both, a strong decrease in D1 or D2 content was demonstrated74.
PsbQ contributes to the general assembly of the PSII complex75. Based on these findings,
the reduced electron transport rate (ETR), accompanied by an increased non-photochemical
quenching (NPQ) of NE leaves experienced to abiotic stress can be explained8,17,20. Indeed,
photosynthetic gas exchange analyses clearly demonstrated a lower net CO2 assimilation
rate in transgenic NE poplars17,18. Moreover, transcripts found in NE plants related to
photosynthesis/light harvesting processes were found to also be down-regulated
constitutively under unstressed conditions17. In contrast, the extrinsic manganese-containing
protein (PsbO-2) was found to be up-regulated in the chloroplasts of both NE lines (Table 1A,
Supplemental Table S1). PsbO-2 is involved in the reassembly of the manganese cluster of
PSII after disassembly of the complex and binds to the D1 protein and allows the correct
assembly of the manganese cluster76. Two chlorophyll a/b binding proteins with function in
light harvesting were also more abundant in NE chloroplasts (Table 1A). The previous gene
expression analysis of poplar leaves showed that chlorophyllase 2 transcripts, a key enzyme
in the chlorophyll metabolism, were up-regulated in NE17. The up-regulation of chlorophyllase
2 may indicate higher turnover of chlorophyll and quick degradation of potentially phototoxic
breakdown intermediates in NE plants77.
We further observed a significant down-regulation of the cytochrome b6f complex in the NE
lines (Table 2). The cytochrome b6f complex occupies a central position in the sequence of
Page 19 of 49
ACS Paragon Plus Environment
Journal of Proteome Research
123456789101112131415161718192021222324252627282930313233343536373839404142434445464748495051525354555657585960
20
photosynthetic electron transport carriers. This membrane complex mediates the transfer of
electrons between the PSII and PSI photosystems while transferring protons from the
chloroplast stroma across the thylakoid membrane into the lumen78. Electron transport via
cytochrome b6f is responsible for creating the proton gradient that drives the synthesis of
ATP in chloroplasts. The down-regulation of the cytochrome b6f complex in NE chloroplasts
suggests a disturbed production of ATP in these isoprene-suppressed lines. In fact, we
observed that extrinsic subunits of ATP synthase were also down-regulated in NE lines
supporting our assumption (Table 2). Significant down-regulation of ATP and cytochrome b6f
complex proteins (p = 0.014 and 0.016, respectively, t-test) indicates substantial negative
changes in electron transport. These data are again in accordance with previous
observations showing that the electron transport rate in the leaves of NE plants was severely
impaired after exposure to sun flecks and recovered much slower compared to the IE
leaves17.
Proteins related to redox regulation and oxidative stress defense
Chloroplasts undergo tremendous changes in redox potential during the day/night cycle and
during variation in metabolic demand for NADPH and ATP. The redox regulation plays a
central role in many chloroplastic functions79. A multi-layered antioxidative defense system,
which keeps the production of ROS under strict control, is present in the chloroplasts. This
system includes enzymatic and non-enzymatic antioxidative elements80-82. Many systematic
proteome analyses of plants, combined with functional studies, have shown that numerous
proteins associated with lumenal, peripheral, and integral thylakoid proteins are involved in
antioxidant defense and/or repair of the thylakoid system83. These proteins include
peroxiredoxins, thioredoxins84,85, Fe- and Cu, Zn-superoxide dismutases82, enzymes and
structural proteins involved in the biosynthesis and the binding of carotenoids and/or
quenching of excess light energy86.
Page 20 of 49
ACS Paragon Plus Environment
Journal of Proteome Research
123456789101112131415161718192021222324252627282930313233343536373839404142434445464748495051525354555657585960
21
Indeed, in the chloroplasts of NE lines, the PCA and OPLS analyses highlighted the
significant down-regulation of two proteins involved in the oxidative stress response,
peroxiredoxins (EC 1.11.1.15) and ascorbate peroxidase (EC 1.11.1.11) (log2 = -0.8,
p=0.003, and log2 = -2.4, p=0.037, respectively) (Table 2, Figure 3). At high H2O2
concentrations, the function of peroxiredoxin may become inactivated through over-
oxidation87. This inactivation has been proposed to explain the signaling function of H2O2 in
eukaryotes87 and ascorbate availability has been shown to limit violaxanthin de-epoxidase
(EC 1.10.99.3) activity in the thylakoid lumen88. Our results show a repression of violaxanthin
de-epoxidase in chloroplasts of NE plants compared to the IE controls (Supplemental Table
S1). In addition, the down-regulation of ferredoxin-NADP reductase (EC 1.18.1.2) in NE lines
also limited the regeneration of oxidized ascorbate (Supplemental Table S1).
Fibrillins, which belong to a family of thylakoid-bound proteins, play a role in the stress
response, including oxidative stress89,90. Fibrillins are not enzymatically active but form a
protein coat of lipid-rich particles named plastoglobuli (PGs) that are associated with
thylakoids91,92. PGs also contain various quinones and "-tocopherol as well as a significant
set of proteins likely involved in the metabolism of isoprenoid-derived molecules (i.e.,
quinones), lipids, and carotenoid cleavage. PGs are likely to play a role in various metabolic
pathways and oxidative stress defense91,92. Overall, our results demonstrate that isoprene
suppression initiates various stress response reactions. Indeed, previous biochemical and
metabolomic analyses showed higher levels of total ascorbate and #-tocopherol as well as
enhanced lipid peroxidation in unstressed leaves of NE poplars17.
Not annotated proteins
In our study involving poplar chloroplasts, a set of 13 proteins without assigned function but
with identified full length genes were detected (Figure 3 and in the Supplementary Table S1).
Twelve out of 13 share very high similarity (more than 70%) with Arabidopsis proteins. These
proteins were related to thylakoid lumen protein (TLP18.3), pentapeptide repeats, BNR/Asp-
Page 21 of 49
ACS Paragon Plus Environment
Journal of Proteome Research
123456789101112131415161718192021222324252627282930313233343536373839404142434445464748495051525354555657585960
22
box repeat related to PSII stability/assembly, Rhodonese-like domain, which relates to cell
cycle control, and the NDH-dependent cyclic electron flow. Interestingly, TLP 18.3 and TLP
15 were significantly down-regulated in NE lines (log2 = -1.5 and -2.4, respectively, p = 0.036
and 0.035, t-test) (Table 2). Recently, it was shown that the TLP18.3 protein is involved in
the regulation of both the degradation/synthesis steps of the PSII D1 protein and in the
assembly of the PSII monomers in the grana stack93. Under standard growth conditions, the
absence of TLP18.3 protein does not lead to a severe collapse of the PSII complexes,
suggesting a redundancy of proteins assisting the repair steps of PSII to secure its
functionality. The Arabidopsis mutants lacking the TLP18.3 protein possess a higher
susceptibility of PSII to photoinhibition.
4. CONCLUSION
We aimed to elucidate whether the suppression of isoprene biosynthesis and emission
modifies the abundance of chloroplast proteins and how this modification may influence the
plant functionality. The lack of PcISPS and consequently of isoprene implied that the down-
regulation of proteins related to photosynthesis light reactions, redox regulation and oxidative
stress defense, and several proteins with structural activity that are responsible for lipid
metabolism alteration occurred (Figure 5). These changes were the consequences of
alternative defense mechanisms such as photorespiration and non-photochemical quenching
that needed to compensate for the absence of isoprene. Indeed, the lower amounts of
peroxiredoxin and ascorbate peroxidase indicated their over-oxidation in the presence of
increased levels of ROS. Overall, the present proteomic analysis revealed that the absence
of isoprene in poplar leaves remodels the chloroplast protein profile to cope against oxidative
stress. The present data strongly support the idea that isoprene improves thylakoid
membrane structure and regulates the production of ROS.
Page 22 of 49
ACS Paragon Plus Environment
Journal of Proteome Research
123456789101112131415161718192021222324252627282930313233343536373839404142434445464748495051525354555657585960
23
ASSOCIATED CONTENT
Supporting Information
Supplemental Table S1 provides all proteins identified using the ICPL technique; Log 2
ratios, description and functional annotation of the proteins are listed. Supplemental Table S2
provides sub-plastidial localization of the ICPL-identified proteins. Supplemental Table S3
provides the full data of protein identification: peptide sequence, ion score, number of missed
cleavage, and exact molecular mass (MH+) of each peptide. Supplemental Figure S1
provides score and loading plots of PCA of chloroplasts proteins identified using the ICPL
technique. Supplemental Figure S2 provides representative Acid-urea-PAGE of histones in
chloroplasts isolated from IE (WT/EV) and NE (RA1/RA2) poplar leaves (A) as well as the
quantification of band intensities performed with ImageJ (B). Supplemental Figure S3
provides representative blue native-PAGE of poplar thylakoid membrane protein complexes
isolated from IE (WT/EV) and NE (RA1/RA2) poplar leaves (A) as well as the quantification
of band intensities performed using ImageJ (B). This material is available free of charge via
the Internet at http://pubs.acs.org.”
AUTHOR INFORMATION
Corresponding Author
*E-mail: [email protected]. Phone: +49 89 3187 2413. Fax: +49 89 3187
4431
Notes
The authors declare no competing financial interest.
Funding Sources
The present study was supported by Alexander-von-Humboldt-Foundation (individual
fellowship to VV).
Page 23 of 49
ACS Paragon Plus Environment
Journal of Proteome Research
123456789101112131415161718192021222324252627282930313233343536373839404142434445464748495051525354555657585960
24
ACKNOWLEDGEMENTS
We would like to thank to Werner Heller and Katja Block (both Helmholtz Zentrum München)
for critical reading, discussions and comments on the manuscript.
ABBREVIATIONS
ALDH, aldehyde dehydrogenase; ATP, adenosine triphosphate; BN-PAGE, blue native
polyacrylamide gel electrophoresis; DMADP, dimethylallyl diphosphate; ETR, electron
transport rate; HPL, hydroperoxide lyases; ICPL, isotope-coded protein labeling; IE, isoprene
emitting; ISPS - isoprene synthase; LC-MS/MS, liquid chromatography tandem mass
spectrometry; LHC, light-harvesting complex; MEP, 2-C-methyl-D-erythritol-4-phosphate
pathway; NADP(H), nicotinamide adenine dinucleotide phosphate; NE, non-isoprene
emitting; OPLS, Orthogonal Partial Least Square regression;PAGE, polyacrylamide gel
electrophoresis; PAPs, plastidic lipid-associated proteins; PCA – Principal Component
Analysis; PGs, plastoglobuli; PSI – photosystem I; PSII - photosystem II; SDS-PAGE –
sodium dodecyl sulfate polyacrylamide gel electrophoresis; SHMT - serine hydroxymethyl
transferase; VIP - Variable of Importance for the Projection; THF, thylakoid formation protein;
TLP, thylakoid lumen protein; WT, wild type
Page 24 of 49
ACS Paragon Plus Environment
Journal of Proteome Research
123456789101112131415161718192021222324252627282930313233343536373839404142434445464748495051525354555657585960
25
REFERENCES
(1) Dicke, M.; Baldwin, I.T. The evolutionary context for herbivore-induced plant
volatiles: beyond the “cry for help”. Trends Plant Sci. 2010, 15, 167-175.
(2) Loreto, F.; Schnitzler, J.P. Abiotic stresses and induced BVOCs. Trends Plant Sci.
2010, 15, 154–166.
(3) Velikova, V.; Pinelli, P.; Pasqualini, S.; Reale, L.; Ferranti, F.; Loreto, F. Isoprene
decreases the concentration of nitric oxide in leaves exposed to elevated ozone. New
Phytol. 2005, 166, 419-426.
(4) Velikova, V.; Sharkey, T.D.; Loreto, F. Stabilization of thylakoid membranes in
isoprene-emitting plants reduces formation of reactive oxygen species. Plant Signaling &
Behavior 2012, 7 (1), 139-141.
(5) Sharkey, T.D.; Singsaas, E.L. Why plants emit isoprene. Nature 1995, 374, 769.
(6) Singsaas, E.L.; Lerdau, M.; Winter, K.; Sharkey, T.D. Isoprene increases
thermotolerance of isoprene-emitting species. Plant Physiol. 1997, 115, 1413-1420.
(7) Velikova, V.; Loreto, F.; Tsonev, T.; Brilli, F.; Edreva, A. Isoprene prevents the
negative consequences of high temperature stress in Platanus orientalis leaves. Function.
Plant Biol. 2006, 33, 931-940.
(8) Behnke, K.; Ehlting, B.; Teuber, M.; Bauerfeind, M.; Louis, S.; Hänsch, R.; Polle, A.;
Bohlmann, J.; Schnitzler, J.-P. Transgenic, non-isoprene-emitting poplars don’t like it hot.
Plant J. 2007, 51, 485-499.
(9) Loreto, F.; Mannozzi, M.; Maris, C.; Nascetti, P.; Ferranti, F.; Pasqualini, S. Ozone
quenching properties of isoprene and its antioxidant role in plants. Plant Physiol. 2001,
126, 993-1000.
(10) Loreto, F.; Velikova, V. Isoprene produced by leaves protects the photosynthetic
apparatus against ozone damage, quenches ozone products, and reduces lipid
peroxidation of cellular membranes. Plant Physiol. 2001, 127, 1781-1787.
(11) Behnke, K.; Kleist, E.; Uerlings, R.; Wildt, J.; Rennenberg, H.; Schnitzler, J.-P.
RNAi-mediated suppression of isoprene biosynthesis in hybrid poplar impacts ozone
tolerance. Tree Physiol. 2009, 29, 725-736.
Page 25 of 49
ACS Paragon Plus Environment
Journal of Proteome Research
123456789101112131415161718192021222324252627282930313233343536373839404142434445464748495051525354555657585960
26
(12) Brilli, F.; Barta, C.; Fortunati, A.; Lerdau, M.; Loreto, F.; Centritto, M. Response of
isoprene emission and carbon metabolism to drought in white poplar (Populus alba)
saplings. New Phytol. 2007,175, 244–254.
(13) Ryan, A.C.; Hewitt, C.N.; Possell, M.; Vickers, C.E.; Purnell, A.; Mullineaux, P.M.;
Davies, W.J.; Dodd, I.C. Isoprene emission protects photosynthesis but reduces plant
productivity during drought in transgenic tobacco (Nicotiana tabacum) plants. New Phytol.
2013, DOI: 10.1111/nph.12477
(14) Sasaki, K.; Saito, T.; Lämsä, M.; Oksman-Caldentey, K.-M.; Suzuki, M.; Ohyama,
K.; Muranaka, T.; Ohara, K.; Yazaki, K. Plants utilize isoprene emission as a
thermotolerance mechanism. Plant Cell Physiol. 2007, 48, 1254-1262.
(15) Loivamäki, M.; Gilmer, F.; Fischbach, R.J.; Sörgel, C.; Bachl, A.; Walter, A.;
Schnitzler, J-P. Arabidopsis, a model to study biological functions of isoprene emission?
Plant Physiol. 2007, 144, 1066-1078.
(16) Vickers, C.E.; Possell, M.; Cojocariu, C.I.; Velikova, V.B.; Laothawornkitkul, J.;
Ryan, A.; Mullineaux P.M.; Hewitt, C.N. Isoprene synthesis protects transgenic plants
from oxidative stress. Plant Cell Environ. 2009, 32, 520-531.
(17) Behnke, K.; Loivamäki, M.; Zimmer, I.; Rennenberg, H.; Schnitzler, JP.; Louis, S.
Isoprene emission protects photosynthesis in sunfleck exposed grey poplar. Photosyn.
Res. 2010, 104, 5-17.
(18) Way, D.A.; Ghirardo, A.; Kanawati, B.; Esperschütz, J.; Monson, R.K.; Jackson,
R.B.; Schmitt-Kopplin, P.; Schnitzler, J.P. Increasing atmospheric CO2 reduces metabolic
and physiological differences between isoprene and non-isoprene-emitting poplars. New
Phytol. 2013, 200, 534-546.
(19) Velikova, V.; Várkonyi, Z.; Szabó, M.; Maslenkova, L.; Nogues, I.; Kovács, L.;
Peeva, V.; Busheva, M.; Garab, G.; Sharkey, T.D.; Loreto, F. Increased thermostability of
thylakoid membranes in isoprene-emitting leaves probed with three biophysical
techniques. Plant Physiol. 2011, 157, 905-916.
(20) Behnke, K.; Ghirardo, A.; Janz, D.; Kanawati, B.; Esperschütz, J.; Zimmer, I.;
Schmitt-Kopplin, P.; Niinemets, Ü.; Polle, A.; Schnitzler, JP.; Rosenkranz, M. Isoprene
function in two contrasting poplars under salt and sunflecks. Tree Physiol. 2013, 33, 562-
578.
Page 26 of 49
ACS Paragon Plus Environment
Journal of Proteome Research
123456789101112131415161718192021222324252627282930313233343536373839404142434445464748495051525354555657585960
27
(21) Lichtenthaler, H.K. The 1-deoxy-d-xylulose-5-phosphate pathway of isoprenoid
biosynthesis in plants. Annu. Rev. Plant Physiol. Plant Mol. Biol. 1999, 50, 47–65.
(22) Cooper, G.M. Chloroplasts and Other Plastids. In The Cell: A Molecular Approach
2nd Ed. 2000, Amer. Soc. Microbiol., Washington and Sinauer Assoc., Sunderland, MA
(23) Jarvis, P. Targeting of nucleus-encoded proteins to chloroplasts in plants. New
Phytol. 2008, 179, 257-285.
(24) Jarvis, P.; Soll, J. Toc, tic, and chloroplast protein import. Biochim. Biophys. Acta
2002, 1590, 177-189.
(25) Jarvis, P.; Robinson, C. Mechanisms of protein import and routing in chloroplasts.
Curr. Biol. 2004, 14, R1064-R1077.
(26) Soll, J.; Schleiff, E. Protein import into chloroplasts. Nat. Rev. Mol. Cell Biol. 2004,
5, 198-208.
(27) Ort, D.R.; Yocum, C.F. Electron transfer and energy transduction in
photosynthesis: an overview. In Oxygenic Photosynthesis: The Light Reactions. Advances
in Photosynthesis, vol. 4, Ort, D.R., Yocum, C.F. Eds.; Kluwer cademic Publishers,
Dordrecht, The Netherlands, 1996; pp 1-9.
(28) Finkemeier, I.; Leister, D. Plant chloroplasts and other plastids. In Encyclopedia of
Life Sciences (ELS); 2010, John Wiley & Sons, Ltd, Chichester.
(29) van Wijk, K.J.; Baginsky, S. Plastid proteomics in higher plants: current state and
future goals. Plant Physiol. 2011, 155, 1578–1588.
(30) Bruley, C.; Dupierris, V.; Salvi, D.; Rolland, N.; Ferro, M. AT_CHLORO: a
chloroplast protein database dedicated to sub-plastidial localization. Front. Plant Sci.
2012, 3, Article 205
(31) Prange, A.; Pröfrock, D. Chemical labels and natural element tags for the
quantitative analysis of bio-molecules. J. Anal. At. Spectrom. 2008, 23, 432-459.
(32) Bradford, M.M. A rapid and sensitive method for the quantitation of microgram
quantities of protein utilising the principle of protein-dye binding. Analyt. Biochem. 1976,
72, 248–254.
Page 27 of 49
ACS Paragon Plus Environment
Journal of Proteome Research
123456789101112131415161718192021222324252627282930313233343536373839404142434445464748495051525354555657585960
28
(33) Lichtenthaler, H.K.; Wellburn, A.R. Determinations of total carotenoids and
chlorophyll a and b of leaf extracts in different solvents. Biochem. Soc. Transactions 1983,
603, 591–592.
(34) Merl, J.; Ueffing, M.; Hauck, S.M.; von Toerne, C. Direct comparison of MS-based
label-free and SILAC quantitative proteome profiling strategies in primary retinal Müller
cells. Proteomics 2012, 12, 1902–1911.
(35) Hauck, S.M.; Dietter, J.; Kramer, R.L.; Hofmaier, F.; Zipplies, J.K.; Amann, B.;
Feuchtinger, A.; Deeg, C.A.; Ueffing, M. Deciphering membrane-associated molecular
processes in target tissue of autoimmune uveitis by label-free quantitative mass
spectrometry. Mol. Cell. Proteomics 2010, 9, 2292 –2305.
(36) Brosch, M.; Hubbard, T.; Choudhary, J. Accurate and sensitive peptide
identification with Mascot Percolator. J. Proteome Res. 2009, 8(6), 3176-3181.
(37) Järvi, S.; Soursa, M.; Paakkapinen, V.; Aro, E.-M. Optimized native gel systems
for separation of thylakoid protein complexes: novel super- and mega-complexes.
Biochem. J. 2011, 439, 207-214.
(38) Waterborg, J. Acid-urea-triton polyacrylamide gel electrophoresis of histones. In:
The Protein Protocols Handbook, 2nd Edition, Walker, J.M., Ed.; series Springer Protocols
Handbooks, Humana Press Inc., Totowa, NJ, 2002; pp. 103-111.
(39) Chevallet, M.; Luche, S.; Rabilloud, T. Silver staining of proteins in polyacrylamide
gels. Nature Protocols 2006, 1 (4), 1852-1858.
(40) Eriksson, L.; Johansson, E.; Kettaneh-Wold, N.; Trygg, J.; Wikström, C.; Wold, S.
Multi- and Megavariate Data Analysis. Part I: Basic Principles and Applications. 2006,
Umetrics Academy, Umeå, Sweden.
(41) Eriksson, L.; Trygg, J.; Wold, S. CV-ANOVA for significance testing of PLS and
OPLS models. J Chemometrics 2008, 22, 594-600.
(42) Efron, B.; Gong, G. A leisurely look at the bootstrap, the jack-knife, and cross-
validation. American Statistician 1983, 37, 36-48.
(43) Kley, J.; Heil, M.; Muck, A.; Svato!, A.; Boland, W. Isolating intact chloroplasts
from Arabidopsis samples for proteomic studies. Anal. Biochem. 2010, 398: 198-202.
(44) Bohler, S.; Sergeant, K.; Hoffmann, L.; Dizengremel, P,; Hausman, J.-F.; Renaut,
J.; Jolivet, Y. A difference gel electrophoresis study on thylakoids isolated from poplar
Page 28 of 49
ACS Paragon Plus Environment
Journal of Proteome Research
123456789101112131415161718192021222324252627282930313233343536373839404142434445464748495051525354555657585960
29
leaves reveals a negative impact of ozone exposure on membrane proteins. J. Proteome
Res. 2011, 10: 3003-3011.
(45) Besson, V.; Nauburger, M.; Rebeille, F.; Douce, R. Evidence for three serine
hydroxymethyltransferases in green leaf cells. Purification and characterization of the
mitochondrial and chloroplastic isoforms. Plant Physiol. Biochem. 1995, 33 (6): 665–673.
(46) Cossins, EA.; Chen, L. Folates and one-carbon metabolism in plants and fungi.
Phytochemistry 1997, 45 (3): 437-452.
(47) Appaji Rao, N.; Ambili, M.; Jala, V.R.; Subramanya, H.S.; Savithri, H.S. Structure-
function relationship in serine hydroxymethyltransferase. Biochim. Biophys. Acta 2003,
1647 (1–2): 24–29.
(48) Stover, P.; Schirch, V. Serine hydroxymethyltransferase catalyzes the hydrolysis
of 5,10-methenyltetrahydrofolate to 5-formyltetrahydrofolate. J. Biol. Chem. 1990, 265
(24): 14227–14233.
(49) Moreno, J.I.; Martín, R.; Castresana, C. Arabidopsis SHMT1, a serine
xydroxymethyltransferase that functions in the photorespiratory pathway influences
resistance to biotic and abiotic stress. Plant J. 2005, 41, 451-463.
(50) Karpinski, S.; Gabrys, H.; Mateo, A.; Karpinska, B.; Mullineaux, P.M. Light
perception in plant disease defence signalling. Curr. Opin. Plant Biol. 2003, 6, 390–396.
(51) Leegood, R.C.; Lea, P.J.; Adcock, M.D.; Häusler, R.E. The regulation and control
of photorespiration. J. Exp. Bot. 1995, 46, 1397– 1414.
(52) Sunkar, R.; Bartels, D.; Kirch, H.H. Overexpression of a stress-inducible aldehyde
dehydrogenase gene from Arabidopsis thaliana in transgenic plants improves stress
tolerance. Plant J. 2003, 35 (4), 452-464.
(53) Kotchoni, S.O.; Kuhns, C.; Ditzer, A.; Kirch, H.H.; Bartels, D. Over-expression of
different aldehyde dehydrogenase genes in Arabidopsis thaliana confers tolerance to
abiotic stress and protects plants against lipid peroxidation and oxidative stress. Plant Cell
Environ. 2006, 29 (6), 1033-1048.
(54) Mhamdi, A.; Queval, G.; Chaouch, S.; Vanderauwera, S.; Van Breusegem, F.;
Noctor, G. Catalase function in plants: a focus on Arabidopsis mutants as stress-mimic
models. J. Exp. Bot. 2010, 61, 4197-4220.
Page 29 of 49
ACS Paragon Plus Environment
Journal of Proteome Research
123456789101112131415161718192021222324252627282930313233343536373839404142434445464748495051525354555657585960
30
(55) Karplus, P.A.; Bruns, C.M.; Structure-function relations for ferredoxin reductase. J.
Bioenergetics Biomembranes 1994, 26 (1), 89-99.
(56) Matsui, K. Green leaf volatiles: hydroperoxide lyase pathway of oxylipin
metabolism. Curr. Opin. Plant Biol. 2006, 9, 274-280.
(57) Vancanneyt, G.; Sanz, C.; Farmaki, T.; Paneque, M.; Ortego, F.; Castañera, P.;
Sánchez-Serrano, J.J. Hydroperoxide lyase depletion in transgenic potato plants leads to
an increase in aphid performance. Proc. Natl. Acad. Sci. U.S.A. 2001, 98, 8139-8144.
(58) Lamb, H.K.; Leslie, K.; Dodds, A.L.; Nutley, M.; Cooper, A.; Johnson, C.;
Thompson, P.; Stammers, D.K.; Hawkins, A.R. The negative transcriptional regulator
NmrA discriminates between oxidised and reduced dinucleotides. J. Biol. Chem. 2003.
278, 32107–32114.
(59) Ferro, M.; Brugière, S.; Salvi, D.; Seigneurin-Berny, D.; Court, M.; Moyet, L.;
Ramus, C.; Miras, S.; Mellal, M.; Le Gall, S.; Kieffer-Jaquinod, S.; Bruley, C.; Garin, J.;
Joyard, J.; Masselon, C.; Rolland, N. AT_CHLORO, a comprehensive chloroplast
proteome database with subplastidial localization and curated information on envelope
proteins. Mol. Cell. Proteomics 2010, 9, 1063-1064.
(60) Jerzmanowski, A.; Przew#oka, M.; Grasser, K. D. Linker histones and HMG1
proteins of higher plants. Plant Biol. 2000, 2, 586–597.
(61) Boden, S.A.; Kavanová, M.; Finnegan, E.J.; Wigge, P.A. Thermal stress effects on
grain yield in Brachypodium distachyon occur via H2A.Z-nucleosomes. Genome Biol.
2013, 14, R65
(62) Stelzl, U.; Connell, S.; Nierhaus, K.H.; Wittmann-Liebold, B. Ribosomal proteins:
role in ribosomal functions. Encyclopedia Life Sci. 2001, 1-12.
(63) Fu, A.; He, Z.; Cho, H.S.; Lima, A.; Buchanan, B.B.; Luan, S. A chloroplast
cyclophilin functions in the assembly and maintenance of photosystem II in Arabidopsis
thaliana. Proc. Natl. Acad. Sci. U.S.A. 2007, 104 (40), 15947-15952.
(64) Huang, W.; Chen, Q.; Zhu, Y.; Hu, F.; Zhang, L.; Ma, Z.; He, Z.; Huang, J.
Arabidopsis thylakoid formation 1 is a critical regulator for dynamics of PSII-LHCII
complexes in leaf senescence and excess light. Mol. Plant. 2013, 6, 1673-1691.
(65) Pratt, W.B.; Krishna, P.; Olsen, L.J. Hsp90-binding immunophilins in plants: the
protein movers. Trends Plant Sci. 2001, 6 (2), 54-58.
Page 30 of 49
ACS Paragon Plus Environment
Journal of Proteome Research
123456789101112131415161718192021222324252627282930313233343536373839404142434445464748495051525354555657585960
31
(66) Gothel, S.F.; Marahiel, M.A. Peptidyl-prolyl cis-trans isomerases, a superfamily of
ubiquitous folding catalysts. Cell Mol. Life Sci. 1999, 55,423-436.
(67) Gupta, R.; Mould, R.M.; He, Z.; Luan, S. A chloroplast FKBP interacts with and
affects the accumulation of Rieske subunit of cytochrome bf complex. Proc. Natl. Acad.
Sci. U.S.A. 2002, 99 (24), 15806-15811.
(68) Wang, P.; Heiman, J. The cyclophilis. Genome Biol. 2005, 6: Article 226.
(69) Bréhélin, C.; Kessler, F.; van Wijk, K.J. Plastoglobules: versatile lipoprotein
particles in plastids. Trends Plant Sci. 2007, 12(6), 260-266.
(70) Deruère, J.; Römer, S.; d’Harlingue, A.; Backhaus, R.A.; Kuntz, M.; Camara, B.
Fibril assembly and carotenoid overaccumulation in chromoplasts: A model for
supramolecular lipoprotein structures. Plant Cell. 1994, 6, 119–133.
(71) Pozueta-Romero, J.; Rafia, F.; Houlné, G.; Cheniclet, C.; Carde, J.P.; Schantz, M.-
L., Schantz, R. A ubiquitous plant housekeeping gene, PAP, encodes a major protein
component of bell pepper chromoplasts. Plant Physiol. 1997, 115, 1185–1194.
(72) Pruvot, G.; Cuiné, S.; Peltier, G.; Rey, P. Characterization of a novel drought-
induced 34-kDa protein located in the thylakoids of Solanum tuberosum L. plants. Planta
1996, 198 (3), 471–479.
(73) Gillet, B.; Beyly, A.; Peltier, G.; Rey, P. Molecular characterization of CDSP 34, a
chloroplastic protein induced by water deficit in Solanum tuberosum L. plants, and
regulation of CDSP 34 expression by ABA and high illumination. Plant J. 1998, 16 (2),
257-262.
(74) Yi, X.; Hargett, S.; Frankel, L.; Bricker, T. The effects of simultaneous RNAi
suppression of PsbO and PsbP protein expression in photosystem II of Arabidopsis.
Photosynth. Res. 2008, 98 (1), 439–448.
(75) Yi, X.; Hargett, S. R.; Frankel, L. K.; Bricker, T. M. The PsbQ protein is required in
Arabidopsis for photosystem II assembly/stability and photoautotrophy under low light
conditions. J. Biol. Chem. 2006, 281 (36), 26260–26267.
(76) Roose, J. L.; Pakrasi, H. B. The Psb27 protein facilitates manganese cluster
assembly in photosystem II. J. Biol. Chem. 2008, 283 (7), 4044–4050.
(77) Hörtensteiner, S.; Kräutler, B. Chlorophyll breakdown in higher plants. Biochim.
Biophys. Acta 2011, 1807, 977–88.
Page 31 of 49
ACS Paragon Plus Environment
Journal of Proteome Research
123456789101112131415161718192021222324252627282930313233343536373839404142434445464748495051525354555657585960
32
(78) Kurisu, G.; Zhang, H.; Smith, JL.; Cramer, W.A. Structure of the cytochrome b6f
complex of oxygenic photosynthesis: tuning the cavity. Science 2003, 302 (5647): 1009–
1014.
(79) Scheibe, R.; Dietz, K.H. Reduction–oxidation network for flexible adjustment of
cellular metabolism in photoautotrophic cells. Plant Cell Environ. 2012, 35, 202-216.
(80) Mullineaux, P.; Karpinski, S. Signal transduction in response to excess light:
getting out of the chloroplast. Curr. Opin. Plant Biol. 2002, 5, 43–48.
(81) Apel, K.; Hirt, H. Reactive oxygen species: metabolism, oxidative stress, and
signal transduction. Annu. Rev. Plant Biol. 2004, 55, 373–399.
(82) Mittler, R.; Vanderauwera, S.; Gollery, M.; Van Breusegem, F. Reactive oxygen
gene network of plants. Trends Plant Sci. 2004, 9 (10), 490–498.
(83) van Wijk, K.J. Plastid proteomics. Plant Physiol. Biochem. 2004, 42, 963–977.
(84) Dietz, K.J.; Horling, F.; König, J.; Baier, M. The function of the chloroplast 2-
cysteine peroxiredoxin in peroxide detoxification and its regulation. J. Exp. Bot. 2002, 53
(372), 1321-1329.
(85) Buchanan, B.B.; Balmer, Y. Redox regulation: a broadening horizon. Annu. Rev.
Plant Biol. 2005, 56, 187–220.
(86) Bassi, R.; Caffarri, S. Lhc proteins and the regulation of photosynthetic light
harvesting function by xanthophylls. Photosyn. Res. 2000, 64, 243–256.
(87) Puerto-Galán, L.; Pérez-Ruiz, J.M.; Ferrández, J.; Cano, B., Naranjo, B.; Nájera,
V.A.; González, M.; Lindahl, A.M.; Cejudo, F.J. Overoxidation of chloroplast 2-Cys
peroxiredoxins: balancing toxic and signaling activities of hydrogen peroxide. Front Plant
Sci. 2013, 4, Article 310.
(88) Giacomelli, L.; Rudella, A.; Wijk, K.J. High light response of the thylakoid proteome
in Arabidopsis wild type and the ascorbate-deficient mutant vtc2-2. A comparative
proteomics study. Plant Physiol. 2006, 141, 685-701.
(89) Rey, P.; Gillet, B.; Romer, S.; Eymery, F.; Massimino, J.; Peltier, G.; Kuntz, M.
Over-expression of a pepper plastid lipid-associated protein in tobacco leads to changes
in plastid ultrastructure and plant development upon stress. Plant J. 2000, 21, 483–494.
Page 32 of 49
ACS Paragon Plus Environment
Journal of Proteome Research
123456789101112131415161718192021222324252627282930313233343536373839404142434445464748495051525354555657585960
33
(90) Langenkämper, G.; Mana'h, N.; Broin, M.; Cuiné, S.; Becuwe, N.; Kuntz, M.; Rey,
P. Accumulation of plastid lipid-associated proteins (fibrillin/ CDSP34) upon oxidative
stress, ageing and biotic stress in Solanaceae and in response to drought in other
species. J. Exp. Bot. 2001, 52 (360), 1545–1554.
(91) Vidi, P.A.; Kanwischer, M.; Baginsky, S.; Austin, J.R.; Csucs, G.; Dörmann, P.;
Kessler, F.; Bréhélin, C. Tocopherol cyclase (VTE1) localization and vitamin E
accumulation in chloroplast plastoglobule lipoprotein particles. J. Biol. Chem. 2006, 281,
11225–11234.
(92) Ytterberg, A.J.; Peltier, J.B.; van Wijk, K.J. Protein profiling of plastoglobules in
chloroplasts and chromoplasts: a surprising site for differential accumulation of metabolic
enzymes. Plant Physiol. 2006, 140, 984–997.
(93) Sirpiö, S.; Allahverdiyeva, Y.; Suorsa, M.; Paakkarinen, V.; Vainonen, J.;
Battchikova, N.; Aro, E.-M. TLP18.3, a novel thylakoid lumen protein regulating
photosystem II repair cycle. Biochem. J. 2007, 406, 415–425.
Page 33 of 49
ACS Paragon Plus Environment
Journal of Proteome Research
123456789101112131415161718192021222324252627282930313233343536373839404142434445464748495051525354555657585960
34
FIGURE LEGENDS
Figure 1. Representative Coomassie blue-stained polyacrylamide gel displaying the protein
pattern in chloroplasts isolated from IE (WT, EV) lines and two NE lines (RA1, RA2) of grey
poplar plants. Chloroplast protein patterns were different between the IE and NE grey poplar
plants. Red arrows indicate the excised bands that were further subjected to LC-MS/MS and
Label-free analyses.
Figure 2. Functional summary of the 119 chloroplast proteins identified using the ICPL
technique in NE (RA1/RA2) and IE (WT/EV) grey poplar lines. Identified proteins are
clustered in 8 categories, according to their functions.
Figure 3. Score (A) and loading (B) plots of Orthogonal Partial Least Squares (OPLS) of
chloroplast proteins identified using the ICPL technique and analyzed by LC-MS/MS (x-axis =
PC1 = 22%; y-axis = PC2 = 21%). A – NE (RA1/RA2) – blue triangles, IE (WT/EV) – red
circles; B - each functional group of proteins is indicated with different symbols, zoomed
symbols with a dot represent the significantly different proteins between the IE and NE grey
poplar plants; red circle – histones; yellow square – ribosomal; blue diamond – structural;
green triangle-up – photosynthesis; purple star – metabolism; dark red circle – stress; dark
grey square – others; grey triangle-down – unknown (not annotated or not identified).
Figure 4. The number of proteins with low (grey bars) or high (dark red bars) levels in NE
grey poplar lines. Suppression of the PcISPS protein by RNAi caused changes in protein
regulation of both NE lines (RA1/RA2) compared to the IE lines (WT/EV). Low or high
abundance of chloroplast proteins was counted when log2 [!(NE)/!(IE)] was < -1 or >1,
respectively. In total, the abundance of 31 proteins out of 119 was unchanged. The
chloroplast proteins were grouped based on their function.
Figure 5. Sub-organelle structure of NE poplar chloroplasts. The suppression of isoprene
biosynthesis modified the protein profiles. Blue symbols with the arrow pointing down
Page 34 of 49
ACS Paragon Plus Environment
Journal of Proteome Research
123456789101112131415161718192021222324252627282930313233343536373839404142434445464748495051525354555657585960
35
indicate the spatial loci where proteins were down-regulated and red symbols with the arrow
pointing up indicate the spatial loci where proteins were up-regulated. Isoprene suppression
caused significant down-regulation of specific proteins related to photosynthetic electron
transport, redox regulation and oxidative stress defense, and several proteins with structural
role, which responsible for the alteration of lipid metabolism. The chloroplast proteome of
transgenic poplar were further characterized by a higher abundance of histones and
ribosomal proteins, which may be linked to a higher protein turnover in NE chloroplasts.
Page 35 of 49
ACS Paragon Plus Environment
Journal of Proteome Research
123456789101112131415161718192021222324252627282930313233343536373839404142434445464748495051525354555657585960
36
LEGENDS OF SUPPLEMENTARY FIGURES AND TABLES
Supplemental Figure S1. Score (A) and loading (B) plots of Principal Component Analyses
(PCA) of chloroplasts proteins identified using the ICPL technique and analyzed by LC-
MS/MS (x-axis = PC1 = 27%; y-axis = PC2 = 21% of explained variance). A - blue triangles -
NE (RA1/RA2), red circles - IE (WT/EV) poplar plants; B - each functional group of proteins
is indicated with different symbols; red circle – histones; yellow square – ribosomal; blue
diamond – structural; green triangle-up – photosynthesis; purple star – metabolism; dark red
circle – stress; dark grey square – others; grey triangle-down – unknown (not annotated or
not identified).
Supplemental Figure S2. Isoprene suppression caused the up-regulation of histone
proteins. (A) Representative acid-urea-PAGE of histones in chloroplasts isolated from IE
(WT/EV) and NE (RA1/RA2) grey poplar leaves. Chloroplast histones were stained with
Silver. (B) The quantification of histone band intensities was performed with using ImageJ.
Asterisk indicate statistically significant difference from WT (Student’s t-test, *P<0.05)
Supplemental Figure S3. (A) Representative blue native-PAGE of poplar thylakoid
membrane protein complexes isolated from IE (WT/EV) and NE transgenic grey poplar
leaves (RA1/RA2). (B) The quantification of band intensities was performed using ImageJ.
Asterisk indicate statistically significant difference from WT (Student’s t-test, *P<0.05)
Supplemental Table S1. Chloroplast proteins identified by isotope-coded protein labeling in
IE (ET/EV) and in NE (RA1/RA2) grey poplar leaves. Proteins were analyzed with LC-
MS/MS. Log2 ratios are presented. Down- (negative numbers) or up-regulated (positive
numbers) proteins were counted when log2 was < -1 or >1, respectively. Empty spaces
mean that in one of the samples the protein was not found. MW - molecular mass, kDa; A -
Coverage, %; B - Unique peptides used for identification.
Supplemental Table S2. Chloroplast proteins identified by isotope-coded protein labeling in
IE and NE grey poplar leaves. Associated information is extracted from PPDB
Page 36 of 49
ACS Paragon Plus Environment
Journal of Proteome Research
123456789101112131415161718192021222324252627282930313233343536373839404142434445464748495051525354555657585960
37
(http://ppdb.tc.cornell.edu/dbsearch/searchacc.aspx; http://www.grenoble.prabi.fr/at_chloro).
Empty spaces mean that an information was not found. TargetP – prediction of subcellular
localization using TargetP, Curated localization (PPDB) – curated subcellular or sub-
plastidial localization as stated in PPDB.
Supplemental Table S3. Full data set for protein identification (Protein Description, Protein
Group Accessions, Sequence of Peptides, QuanUsage, IonScore, # of Missed Cleavages,
molecular mass MH+ [Da]) by isotope-coded protein labeling in IE and NE grey poplar
leaves. The acquired MS/MS spectra were searched against the Populus trichocarpa
genome database (Phytozome v9.1, http://www.phytozome.net) using the Mascot search
engine (version 2.3.02; Matrix Science) with the following parameters: a precursor mass
error tolerance of 10 ppm and a fragment tolerance of 0.6 D. One missed cleavage was
allowed.
Page 37 of 49
ACS Paragon Plus Environment
Journal of Proteome Research
123456789101112131415161718192021222324252627282930313233343536373839404142434445464748495051525354555657585960
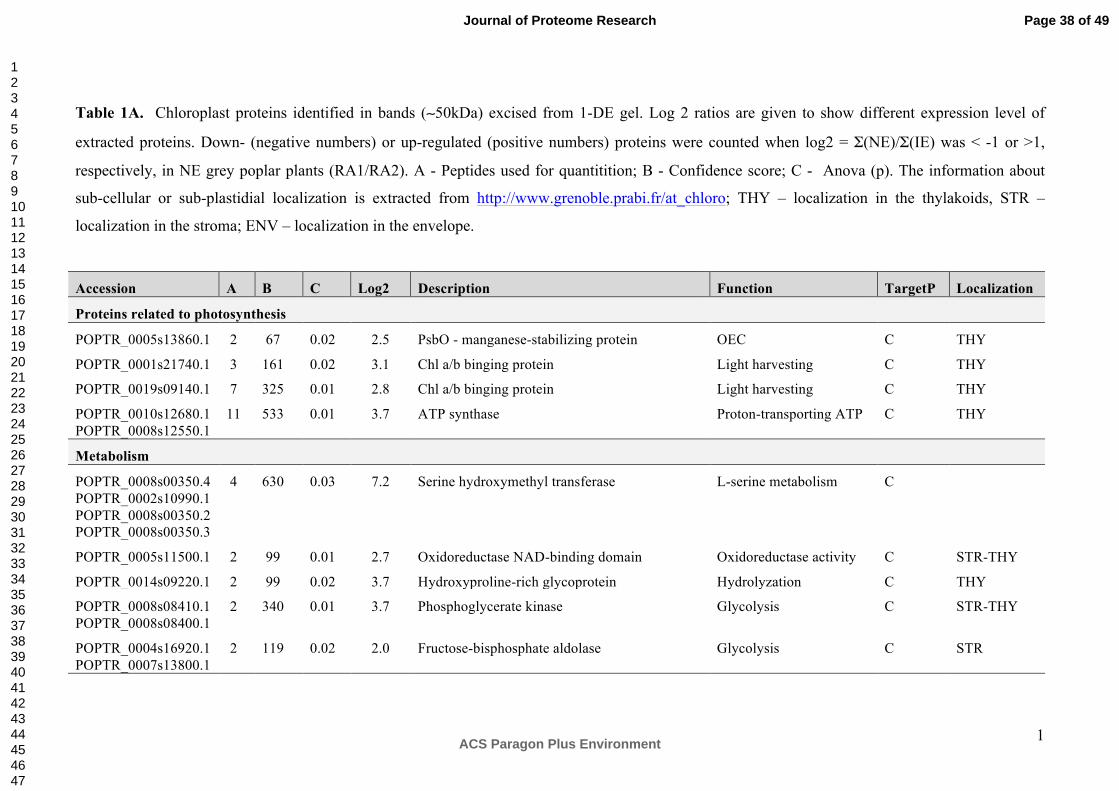
1
Table 1A. Chloroplast proteins identified in bands (!50kDa) excised from 1-DE gel. Log 2 ratios are given to show different expression level of
extracted proteins. Down- (negative numbers) or up-regulated (positive numbers) proteins were counted when log2 = "(NE)/"(IE) was < -1 or >1,
respectively, in NE grey poplar plants (RA1/RA2). A - Peptides used for quantitition; B - Confidence score; C - Anova (p). The information about
sub-cellular or sub-plastidial localization is extracted from http://www.grenoble.prabi.fr/at_chloro; THY – localization in the thylakoids, STR –
localization in the stroma; ENV – localization in the envelope.
Accession A B C Log2 Description Function TargetP Localization
Proteins related to photosynthesis
POPTR_0005s13860.1 2 67 0.02 2.5 PsbO - manganese-stabilizing protein OEC C THY
POPTR_0001s21740.1 3 161 0.02 3.1 Chl a/b binging protein Light harvesting C THY
POPTR_0019s09140.1 7 325 0.01 2.8 Chl a/b binging protein Light harvesting C THY
POPTR_0010s12680.1 POPTR_0008s12550.1
11 533 0.01 3.7 ATP synthase Proton-transporting ATP C THY
Metabolism
POPTR_0008s00350.4 POPTR_0002s10990.1 POPTR_0008s00350.2 POPTR_0008s00350.3
4 630 0.03 7.2
Serine hydroxymethyl transferase L-serine metabolism C
POPTR_0005s11500.1 2 99 0.01 2.7 Oxidoreductase NAD-binding domain Oxidoreductase activity C STR-THY
POPTR_0014s09220.1 2 99 0.02 3.7 Hydroxyproline-rich glycoprotein Hydrolyzation C THY
POPTR_0008s08410.1 POPTR_0008s08400.1
2 340 0.01 3.7 Phosphoglycerate kinase Glycolysis C STR-THY
POPTR_0004s16920.1 POPTR_0007s13800.1
2 119 0.02 2.0 Fructose-bisphosphate aldolase Glycolysis C STR
Page 38 of 49
ACS Paragon Plus Environment
Journal of Proteome Research
123456789101112131415161718192021222324252627282930313233343536373839404142434445464748495051525354555657585960
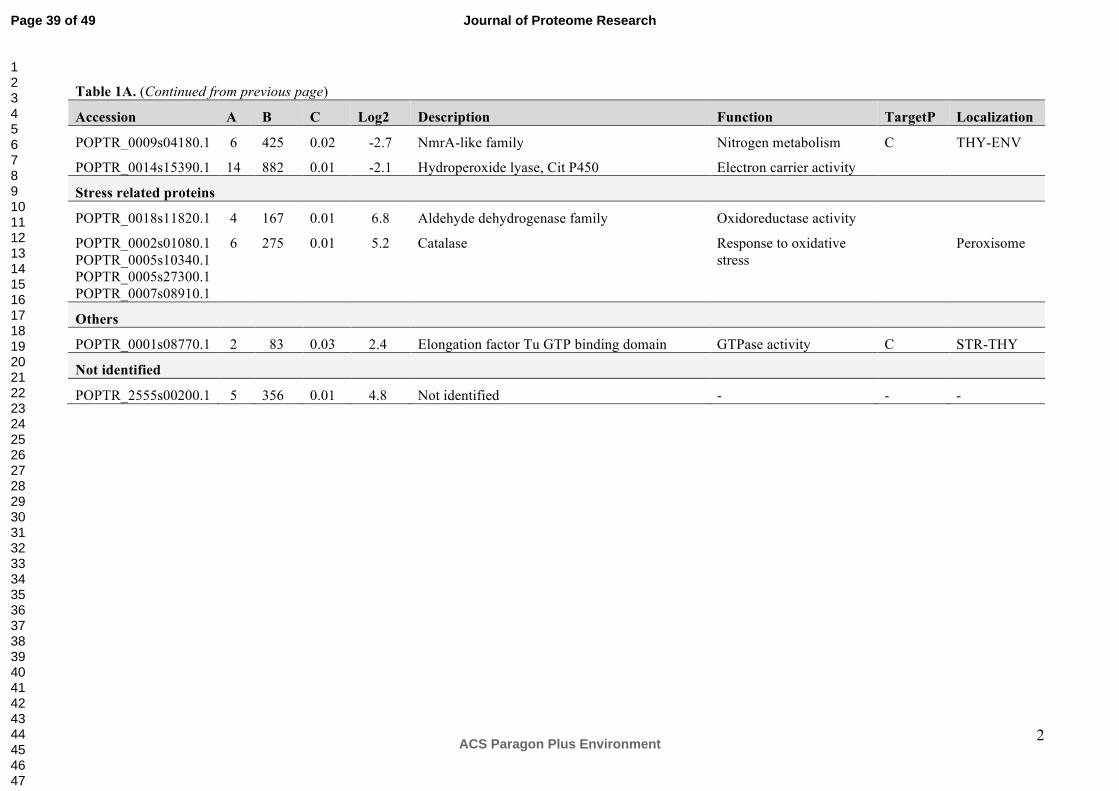
2
Table 1!. (Continued from previous page)
Accession A B C Log2 Description Function TargetP Localization
POPTR_0009s04180.1 6 425 0.02 -2.7 NmrA-like family Nitrogen metabolism C THY-ENV
POPTR_0014s15390.1 14 882 0.01 -2.1 Hydroperoxide lyase, Cit P450 Electron carrier activity
Stress related proteins
POPTR_0018s11820.1 4 167 0.01 6.8 Aldehyde dehydrogenase family Oxidoreductase activity
POPTR_0002s01080.1 POPTR_0005s10340.1 POPTR_0005s27300.1 POPTR_0007s08910.1
6 275 0.01 5.2
Catalase Response to oxidative stress
Peroxisome
Others
POPTR_0001s08770.1 2 83 0.03 2.4 Elongation factor Tu GTP binding domain GTPase activity C STR-THY
Not identified
POPTR_2555s00200.1 5 356 0.01 4.8 Not identified - - -
Page 39 of 49
ACS Paragon Plus Environment
Journal of Proteome Research
123456789101112131415161718192021222324252627282930313233343536373839404142434445464748495051525354555657585960
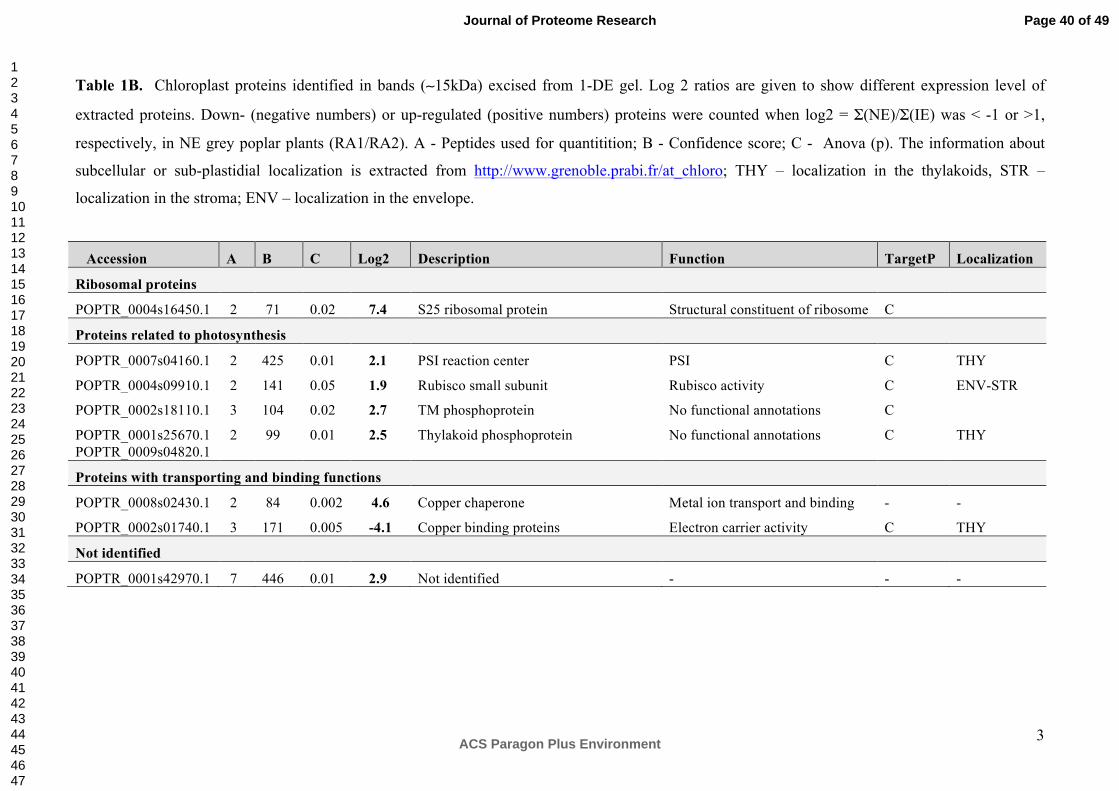
3
Table 1B. Chloroplast proteins identified in bands (!15kDa) excised from 1-DE gel. Log 2 ratios are given to show different expression level of
extracted proteins. Down- (negative numbers) or up-regulated (positive numbers) proteins were counted when log2 = "(NE)/"(IE) was < -1 or >1,
respectively, in NE grey poplar plants (RA1/RA2). A - Peptides used for quantitition; B - Confidence score; C - Anova (p). The information about
subcellular or sub-plastidial localization is extracted from http://www.grenoble.prabi.fr/at_chloro; THY – localization in the thylakoids, STR –
localization in the stroma; ENV – localization in the envelope.
Accession A B C Log2 Description Function TargetP Localization
Ribosomal proteins
POPTR_0004s16450.1 2 71 0.02 7.4 S25 ribosomal protein Structural constituent of ribosome C
Proteins related to photosynthesis
POPTR_0007s04160.1 2 425 0.01 2.1 PSI reaction center PSI C THY
POPTR_0004s09910.1 2 141 0.05 1.9 Rubisco small subunit Rubisco activity C ENV-STR
POPTR_0002s18110.1 3 104 0.02 2.7 TM phosphoprotein No functional annotations C
POPTR_0001s25670.1 POPTR_0009s04820.1
2 99 0.01 2.5 Thylakoid phosphoprotein No functional annotations C THY
Proteins with transporting and binding functions
POPTR_0008s02430.1 2 84 0.002 4.6 Copper chaperone Metal ion transport and binding - -
POPTR_0002s01740.1 3 171 0.005 -4.1 Copper binding proteins Electron carrier activity C THY
Not identified
POPTR_0001s42970.1 7 446 0.01 2.9 Not identified - - -
Page 40 of 49
ACS Paragon Plus Environment
Journal of Proteome Research
123456789101112131415161718192021222324252627282930313233343536373839404142434445464748495051525354555657585960
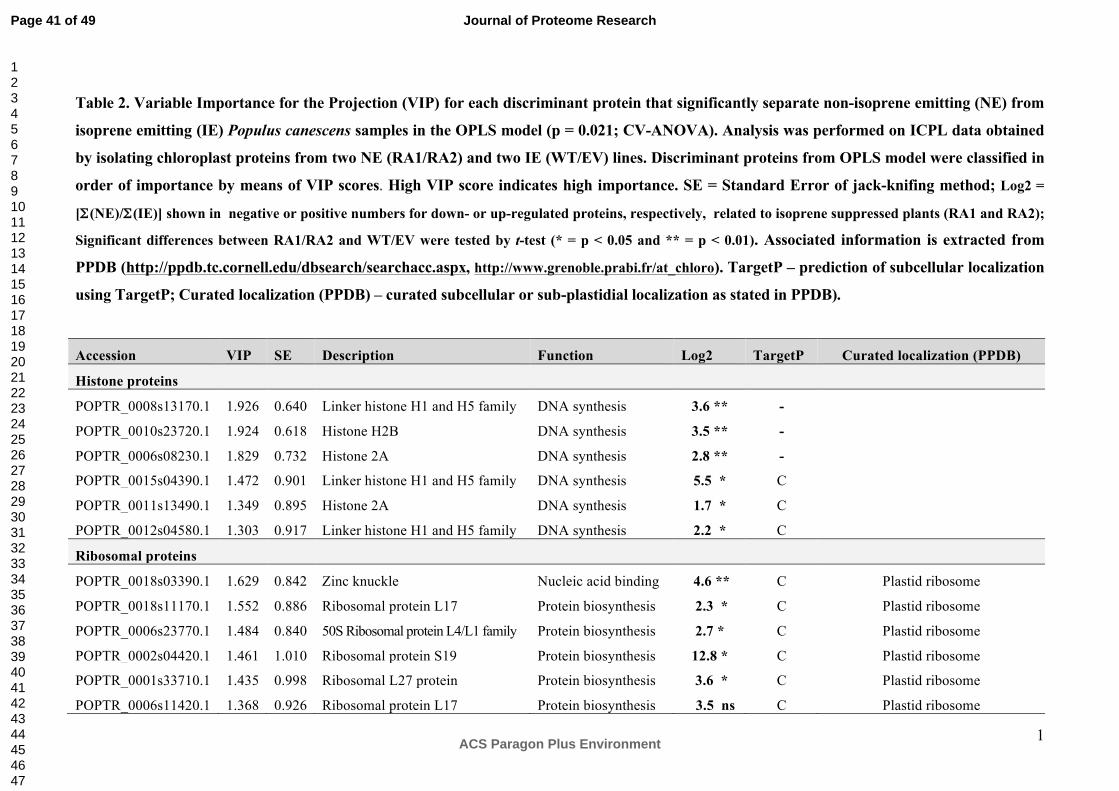
1
Table 2. Variable Importance for the Projection (VIP) for each discriminant protein that significantly separate non-isoprene emitting (NE) from
isoprene emitting (IE) Populus canescens samples in the OPLS model (p = 0.021; CV-ANOVA). Analysis was performed on ICPL data obtained
by isolating chloroplast proteins from two NE (RA1/RA2) and two IE (WT/EV) lines. Discriminant proteins from OPLS model were classified in
order of importance by means of VIP scores. High VIP score indicates high importance. SE = Standard Error of jack-knifing method; Log2 =
[!!(NE)/!!(IE)] shown in negative or positive numbers for down- or up-regulated proteins, respectively, related to isoprene suppressed plants (RA1 and RA2);
Significant differences between RA1/RA2 and WT/EV were tested by t-test (* = p < 0.05 and ** = p < 0.01). Associated information is extracted from
PPDB (http://ppdb.tc.cornell.edu/dbsearch/searchacc.aspx, http://www.grenoble.prabi.fr/at_chloro). TargetP – prediction of subcellular localization
using TargetP; Curated localization (PPDB) – curated subcellular or sub-plastidial localization as stated in PPDB).
Accession VIP SE Description Function Log2 TargetP Curated localization (PPDB)
Histone proteins
POPTR_0008s13170.1 1.926 0.640 Linker histone H1 and H5 family DNA synthesis 3.6 ** -
POPTR_0010s23720.1 1.924 0.618 Histone H2B DNA synthesis 3.5 ** -
POPTR_0006s08230.1 1.829 0.732 Histone 2A DNA synthesis 2.8 ** -
POPTR_0015s04390.1 1.472 0.901 Linker histone H1 and H5 family DNA synthesis 5.5 * C
POPTR_0011s13490.1 1.349 0.895 Histone 2A DNA synthesis 1.7 * C
POPTR_0012s04580.1 1.303 0.917 Linker histone H1 and H5 family DNA synthesis 2.2 * C
Ribosomal proteins
POPTR_0018s03390.1 1.629 0.842 Zinc knuckle Nucleic acid binding 4.6 ** C Plastid ribosome
POPTR_0018s11170.1 1.552 0.886 Ribosomal protein L17 Protein biosynthesis 2.3 * C Plastid ribosome
POPTR_0006s23770.1 1.484 0.840 50S Ribosomal protein L4/L1 family Protein biosynthesis 2.7 * C Plastid ribosome
POPTR_0002s04420.1 1.461 1.010 Ribosomal protein S19 Protein biosynthesis 12.8 * C Plastid ribosome
POPTR_0001s33710.1 1.435 0.998 Ribosomal L27 protein Protein biosynthesis 3.6 * C Plastid ribosome
POPTR_0006s11420.1 1.368 0.926 Ribosomal protein L17 Protein biosynthesis 3.5 ns C Plastid ribosome
Page 41 of 49
ACS Paragon Plus Environment
Journal of Proteome Research
123456789101112131415161718192021222324252627282930313233343536373839404142434445464748495051525354555657585960
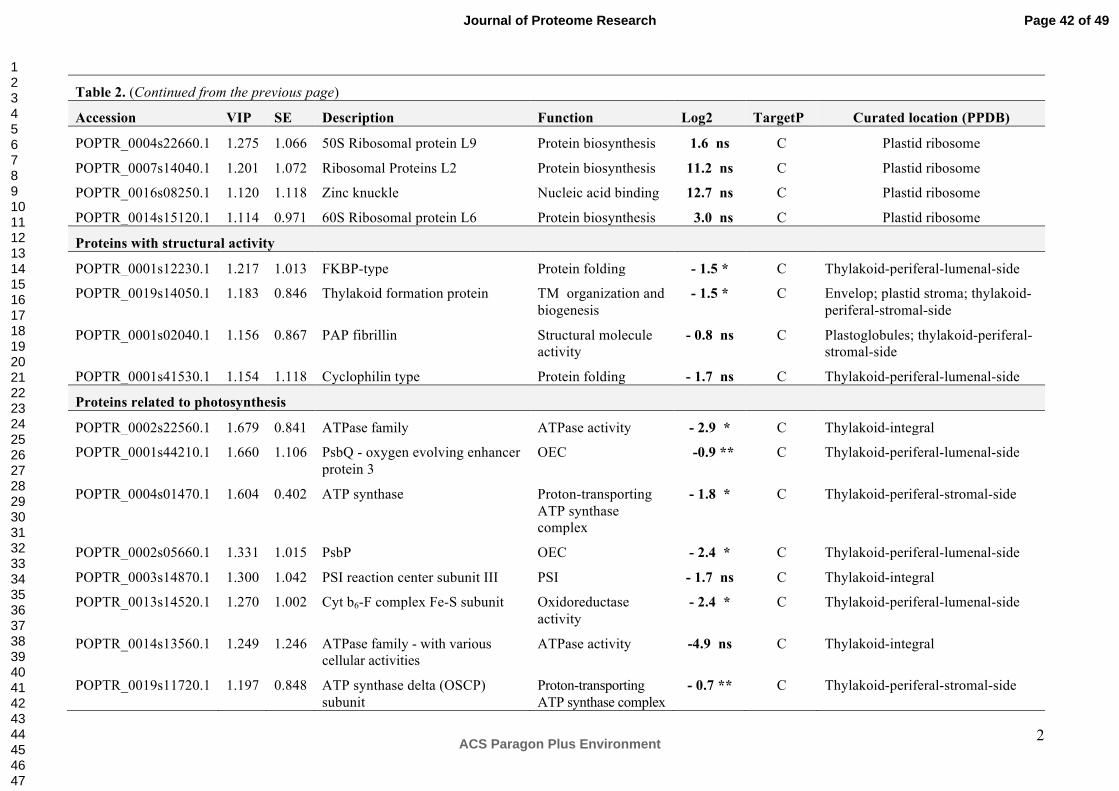
2
Table 2. (Continued from the previous page)
Accession VIP SE Description Function Log2 TargetP Curated location (PPDB)
POPTR_0004s22660.1 1.275 1.066 50S Ribosomal protein L9 Protein biosynthesis 1.6 ns C Plastid ribosome
POPTR_0007s14040.1 1.201 1.072 Ribosomal Proteins L2 Protein biosynthesis 11.2 ns C Plastid ribosome
POPTR_0016s08250.1 1.120 1.118 Zinc knuckle Nucleic acid binding 12.7 ns C Plastid ribosome
POPTR_0014s15120.1 1.114 0.971 60S Ribosomal protein L6 Protein biosynthesis 3.0 ns C Plastid ribosome
Proteins with structural activity
POPTR_0001s12230.1 1.217 1.013 FKBP-type Protein folding - 1.5 * C Thylakoid-periferal-lumenal-side
POPTR_0019s14050.1 1.183 0.846 Thylakoid formation protein TM organization and biogenesis
- 1.5 * C Envelop; plastid stroma; thylakoid-periferal-stromal-side
POPTR_0001s02040.1 1.156 0.867 PAP fibrillin Structural molecule activity
- 0.8 ns C Plastoglobules; thylakoid-periferal-stromal-side
POPTR_0001s41530.1 1.154 1.118 Cyclophilin type Protein folding - 1.7 ns C Thylakoid-periferal-lumenal-side
Proteins related to photosynthesis
POPTR_0002s22560.1 1.679 0.841 ATPase family ATPase activity - 2.9 * C Thylakoid-integral
POPTR_0001s44210.1 1.660 1.106 PsbQ - oxygen evolving enhancer protein 3
OEC -0.9 ** C Thylakoid-periferal-lumenal-side
POPTR_0004s01470.1 1.604 0.402 ATP synthase Proton-transporting ATP synthase complex
- 1.8 * C Thylakoid-periferal-stromal-side
POPTR_0002s05660.1 1.331 1.015 PsbP OEC - 2.4 * C Thylakoid-periferal-lumenal-side
POPTR_0003s14870.1 1.300 1.042 PSI reaction center subunit III PSI - 1.7 ns C Thylakoid-integral
POPTR_0013s14520.1 1.270 1.002 Cyt b6-F complex Fe-S subunit Oxidoreductase activity
- 2.4 * C Thylakoid-periferal-lumenal-side
POPTR_0014s13560.1 1.249 1.246 ATPase family - with various cellular activities
ATPase activity -4.9 ns C Thylakoid-integral
POPTR_0019s11720.1 1.197 0.848 ATP synthase delta (OSCP) subunit
Proton-transporting ATP synthase complex
- 0.7 ** C Thylakoid-periferal-stromal-side
Page 42 of 49
ACS Paragon Plus Environment
Journal of Proteome Research
123456789101112131415161718192021222324252627282930313233343536373839404142434445464748495051525354555657585960
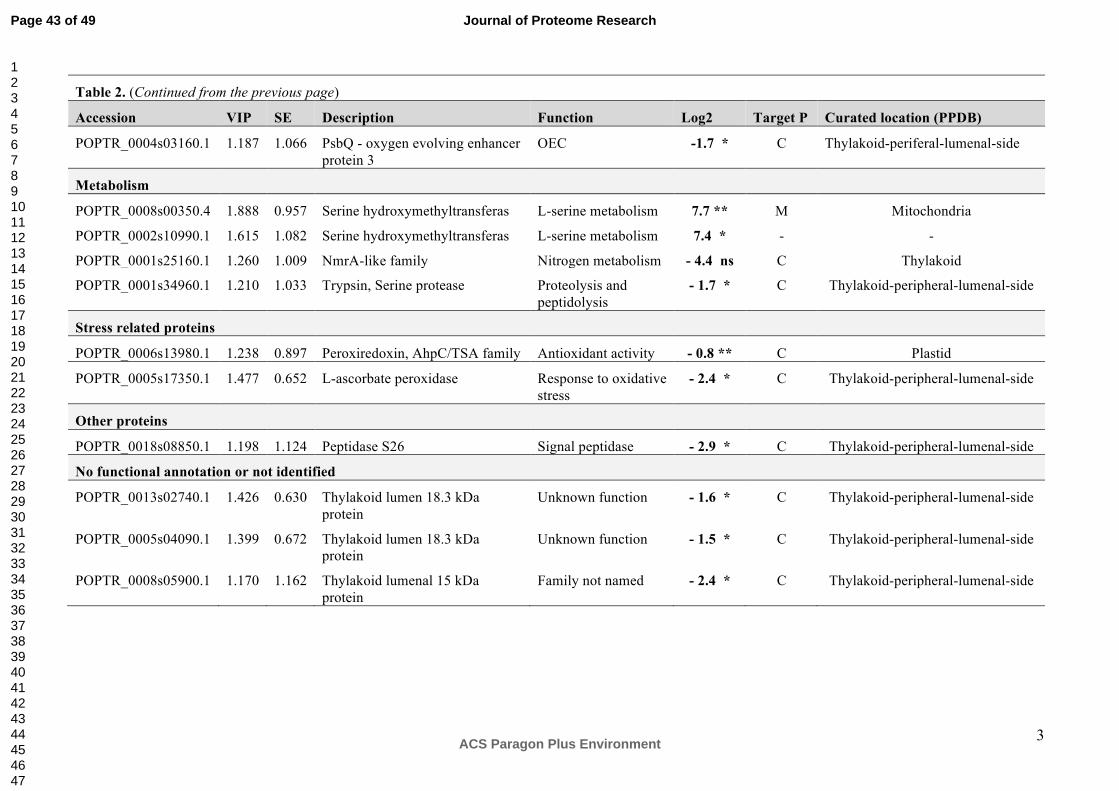
3
Table 2. (Continued from the previous page)
Accession VIP SE Description Function Log2 Target P Curated location (PPDB)
POPTR_0004s03160.1 1.187 1.066 PsbQ - oxygen evolving enhancer protein 3
OEC -1.7 * C Thylakoid-periferal-lumenal-side
Metabolism
POPTR_0008s00350.4 1.888 0.957 Serine hydroxymethyltransferas L-serine metabolism 7.7 ** M Mitochondria
POPTR_0002s10990.1 1.615 1.082 Serine hydroxymethyltransferas L-serine metabolism 7.4 * - -
POPTR_0001s25160.1 1.260 1.009 NmrA-like family Nitrogen metabolism - 4.4 ns C Thylakoid
POPTR_0001s34960.1 1.210 1.033 Trypsin, Serine protease Proteolysis and peptidolysis
- 1.7 * C Thylakoid-peripheral-lumenal-side
Stress related proteins
POPTR_0006s13980.1 1.238 0.897 Peroxiredoxin, AhpC/TSA family Antioxidant activity - 0.8 ** C Plastid
POPTR_0005s17350.1 1.477 0.652 L-ascorbate peroxidase Response to oxidative stress
- 2.4 * C Thylakoid-peripheral-lumenal-side
Other proteins
POPTR_0018s08850.1 1.198 1.124 Peptidase S26 Signal peptidase - 2.9 * C Thylakoid-peripheral-lumenal-side
No functional annotation or not identified
POPTR_0013s02740.1 1.426 0.630 Thylakoid lumen 18.3 kDa protein
Unknown function - 1.6 * C Thylakoid-peripheral-lumenal-side
POPTR_0005s04090.1 1.399 0.672 Thylakoid lumen 18.3 kDa protein
Unknown function - 1.5 * C Thylakoid-peripheral-lumenal-side
POPTR_0008s05900.1 1.170 1.162 Thylakoid lumenal 15 kDa protein
Family not named - 2.4 * C Thylakoid-peripheral-lumenal-side
Page 43 of 49
ACS Paragon Plus Environment
Journal of Proteome Research
123456789101112131415161718192021222324252627282930313233343536373839404142434445464748495051525354555657585960
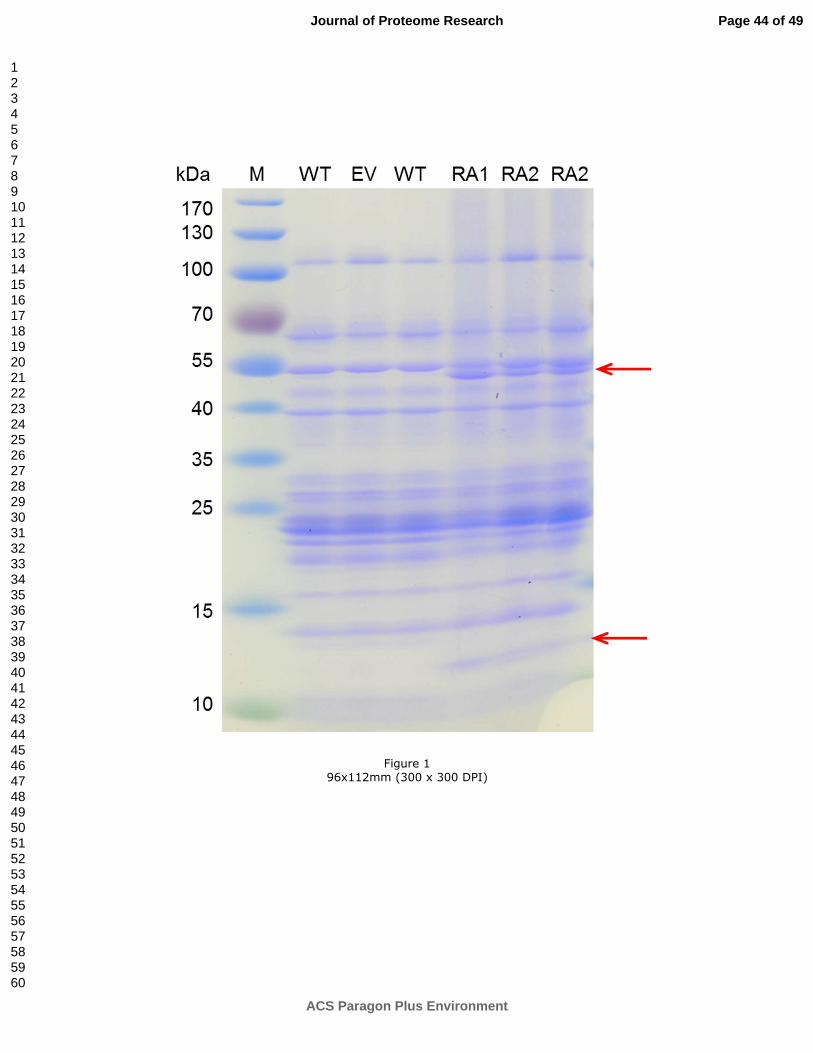
Figure 1
96x112mm (300 x 300 DPI)
Page 44 of 49
ACS Paragon Plus Environment
Journal of Proteome Research
123456789101112131415161718192021222324252627282930313233343536373839404142434445464748495051525354555657585960
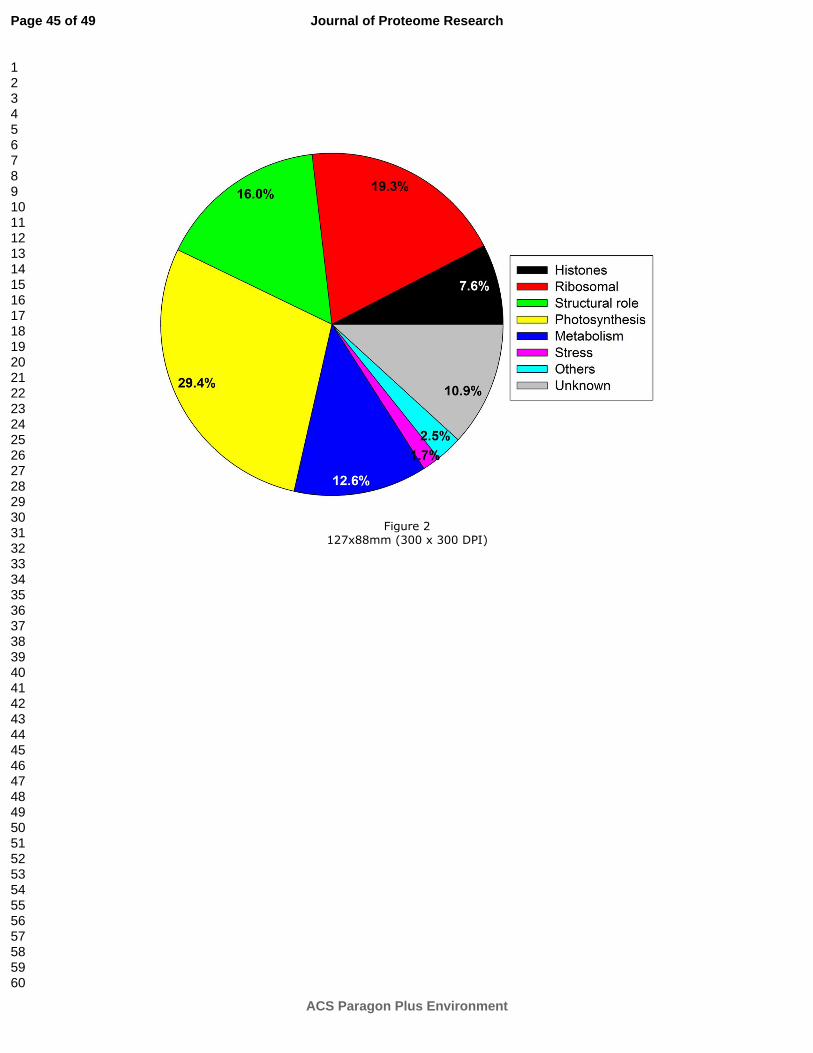
Figure 2
127x88mm (300 x 300 DPI)
Page 45 of 49
ACS Paragon Plus Environment
Journal of Proteome Research
123456789101112131415161718192021222324252627282930313233343536373839404142434445464748495051525354555657585960
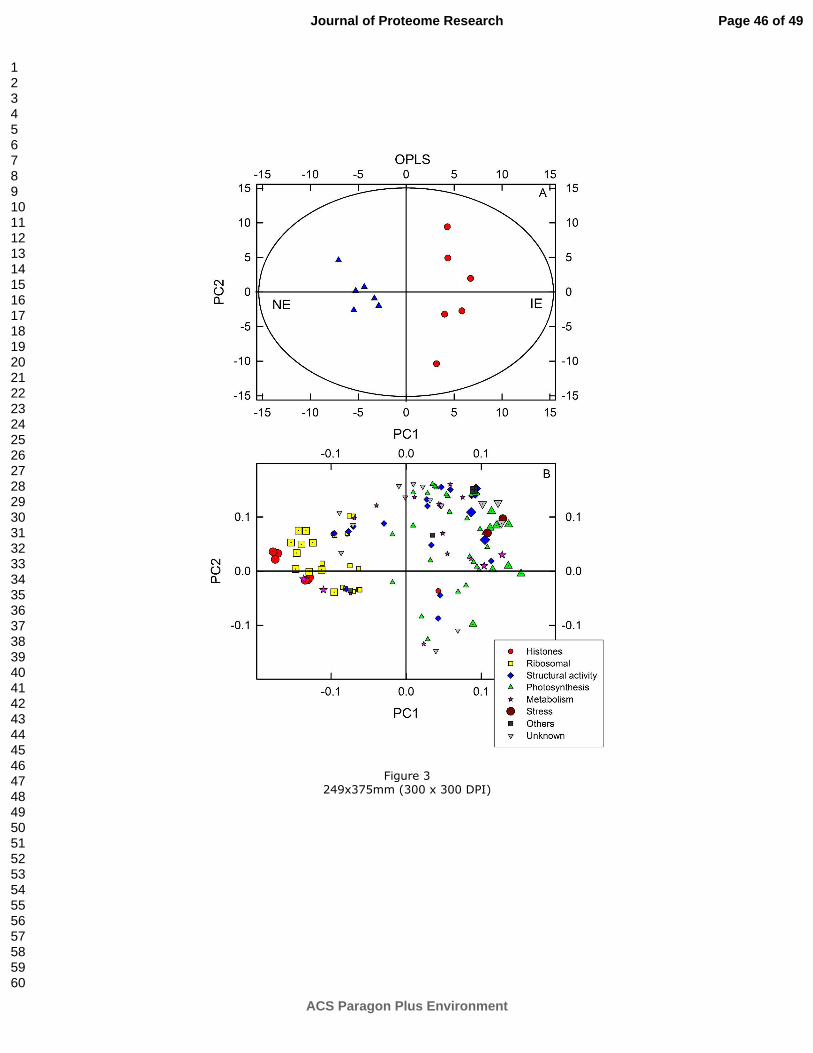
Figure 3
249x375mm (300 x 300 DPI)
Page 46 of 49
ACS Paragon Plus Environment
Journal of Proteome Research
123456789101112131415161718192021222324252627282930313233343536373839404142434445464748495051525354555657585960
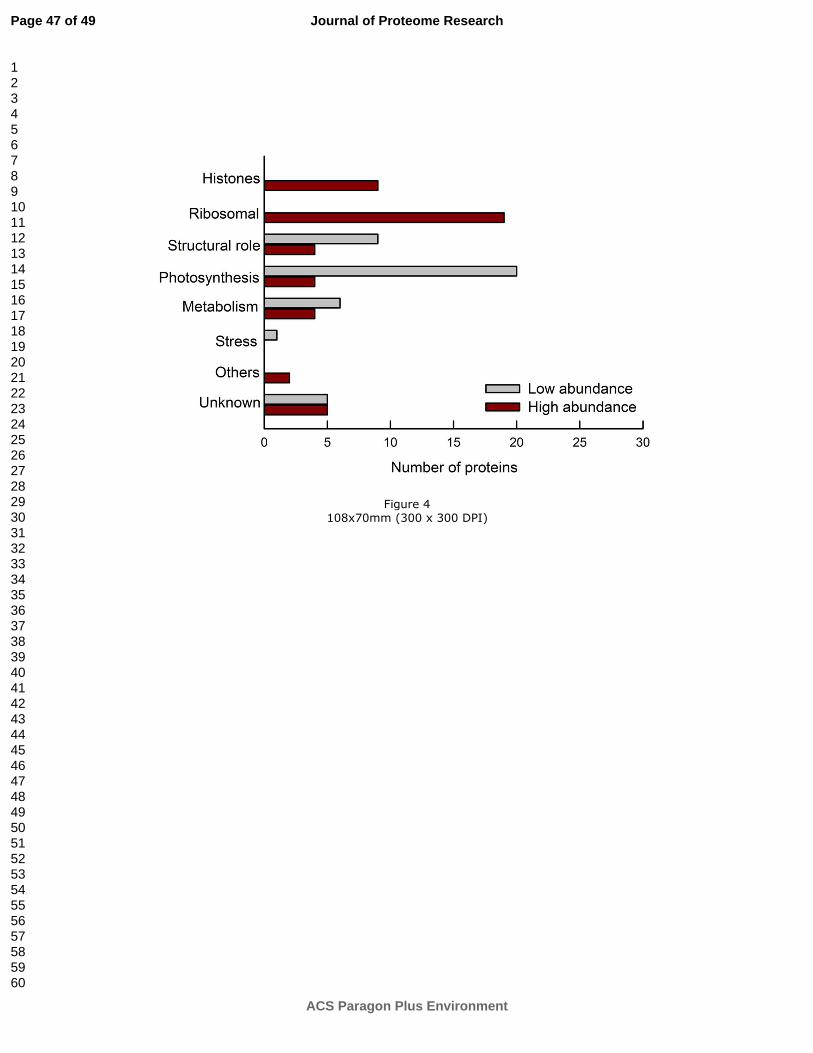
Figure 4
108x70mm (300 x 300 DPI)
Page 47 of 49
ACS Paragon Plus Environment
Journal of Proteome Research
123456789101112131415161718192021222324252627282930313233343536373839404142434445464748495051525354555657585960
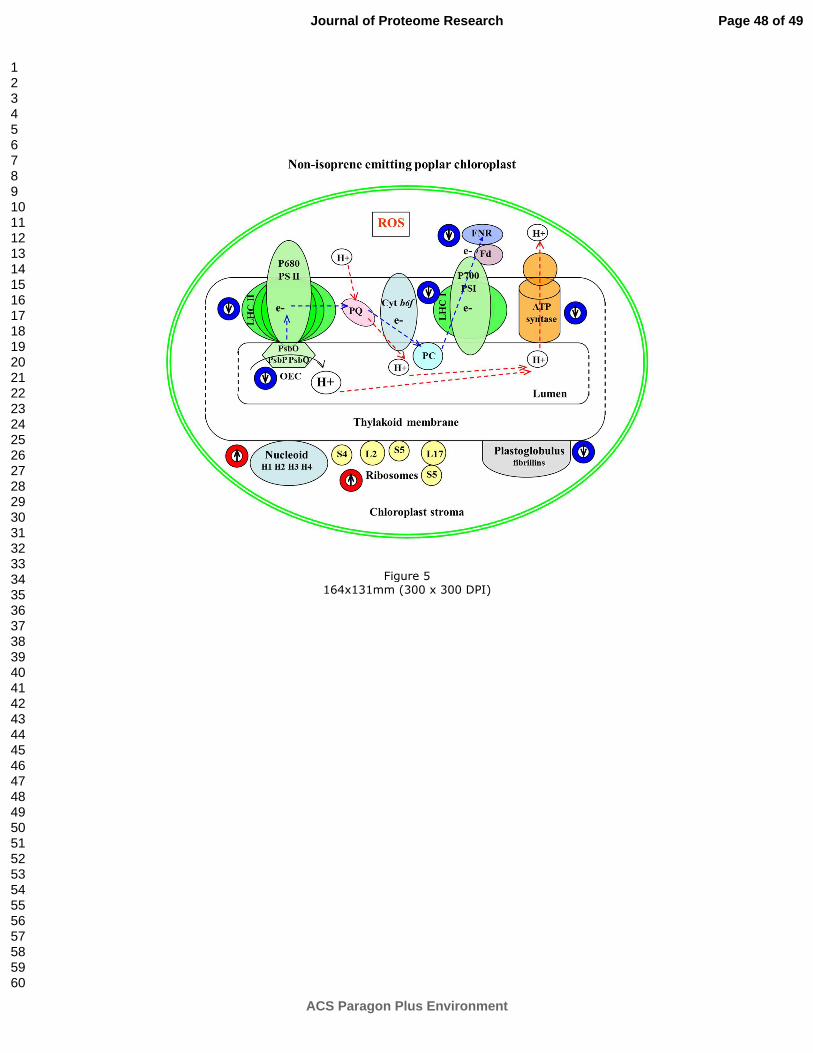
Figure 5
164x131mm (300 x 300 DPI)
Page 48 of 49
ACS Paragon Plus Environment
Journal of Proteome Research
123456789101112131415161718192021222324252627282930313233343536373839404142434445464748495051525354555657585960
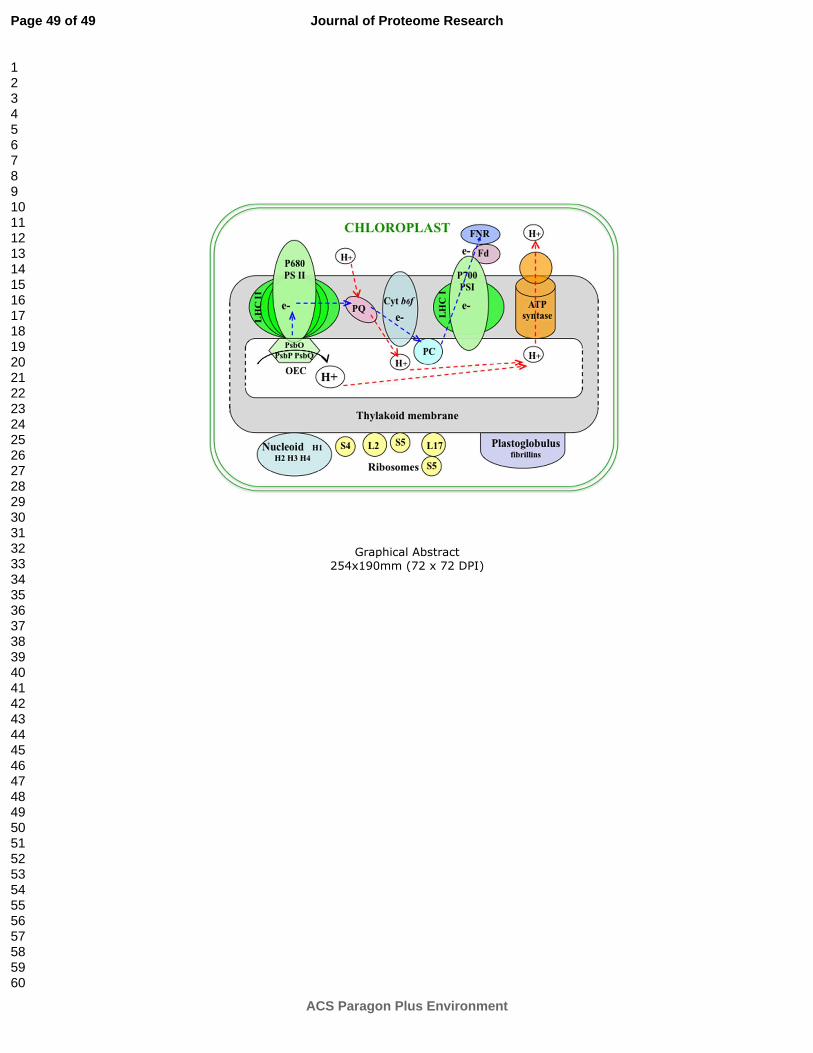
Graphical Abstract
254x190mm (72 x 72 DPI)
Page 49 of 49
ACS Paragon Plus Environment
Journal of Proteome Research
123456789101112131415161718192021222324252627282930313233343536373839404142434445464748495051525354555657585960
Copyright © 2022 FDOKUMEN