Thermoluminescence in Chloroplast Thylakoid
16
6 Thermoluminescence in Chloroplast Thylakoid Amarendra Narayan Misra 1,2 , Meena Misra 1,2 and Ranjeet Singh 1,2 1 Post-Graduate Department of Biosciences & Biotechnology, Fakir Mohan University, Balasore 2 Centre for Life Sciences, School of Natural Sciences, Central University of Jharkhand, Ratu-Lohardaga Road, Brambe, Ranchi, India 1. Introduction 1.1 Historical perspective Luminescence occurs in almost all the materials absorbing photon energy and is a phenomenon of light emitting process. There are various types of luminescence, e.g. fluorescence, phosphorescence, delayed luminescence, chemiluminescence and thermoluminescence. In these cases, light is emitted when a photo- or chomo-excited molecules is deexcited to its ground state. During this deexcitation process, radiationless internal conversion and heat dissipation occurs, which reduces the quantum yield of light emission. Luminescence can be also thermally induced and enhanced by heating the sample in the dark. This process is called thermoluminescence (TL) and describes the emission of light at characteristic temperatures from samples containing chemiluminescent active species, radical pair states or electron hole pairs (Ducruet, 2003; Misra et al., 2001). Many minerals heated at very high temperature emit luminescence and so TL has been used initially in geology, archeological dating and radiation dosimetry. The theory of charge recombination in these processes was first worked out for such minerals (Randall & Wilkins, 1945). Thermally induced photon emission by a pre-irradiated chloroplast or thylakoid or by leaf samples in darkness is known as thermoluminescence (TL) (Misra et al., 2001; Misra & Ramaswamy, 2001). This is characteristic of solid states (semi-conductors) under thermally activated recombination of electrons and positive holes that are generated by particle radiation or electromagnetic field at room or low temperature prior to their heating in dark (Chen & McKeever, 1997). TL signals were first detected in dried chloroplasts samples (Arnold & Sherwood, 1957; Tollin & Calvin 1957). Photosynthetic systems in dried chloroplasts are supposed to be severely damaged. TL emission was also recorded in intact leaves and algal cells (Arnold & Sherwood, 1957). Arnold (1966) proposed a model of recombination of free holes in PS I and of free electrons from PS II as the sources of thermally induced luminescence from algae (Chlorella) cells in darkness. However, Arnold & Azzi (1968) refuted the role of free holes from PS I. Based on further evidence on the generation of charges in irradiated chloroplast, in the new model for TL charge recombination the positive and negative charge traps were proposed to reside within PS II (Arnold & Azzi, 1968). Further, biophysical studies and availability of photosynthetic
-
Upload
independent -
Category
Documents
-
view
1 -
download
0
Transcript of Thermoluminescence in Chloroplast Thylakoid
6
Thermoluminescence in Chloroplast Thylakoid
Amarendra Narayan Misra1,2, Meena Misra1,2 and Ranjeet Singh1,2
1Post-Graduate Department of Biosciences & Biotechnology, Fakir Mohan University, Balasore
2Centre for Life Sciences, School of Natural Sciences, Central University of Jharkhand, Ratu-Lohardaga Road, Brambe, Ranchi,
India
1. Introduction
1.1 Historical perspective
Luminescence occurs in almost all the materials absorbing photon energy and is a phenomenon of light emitting process. There are various types of luminescence, e.g. fluorescence, phosphorescence, delayed luminescence, chemiluminescence and thermoluminescence. In these cases, light is emitted when a photo- or chomo-excited molecules is deexcited to its ground state. During this deexcitation process, radiationless internal conversion and heat dissipation occurs, which reduces the quantum yield of light emission. Luminescence can be also thermally induced and enhanced by heating the sample in the dark. This process is called thermoluminescence (TL) and describes the emission of light at characteristic temperatures from samples containing chemiluminescent active species, radical pair states or electron hole pairs (Ducruet, 2003; Misra et al., 2001). Many minerals heated at very high temperature emit luminescence and so TL has been used initially in geology, archeological dating and radiation dosimetry. The theory of charge recombination in these processes was first worked out for such minerals (Randall & Wilkins, 1945). Thermally induced photon emission by a pre-irradiated chloroplast or thylakoid or by leaf samples in darkness is known as thermoluminescence (TL) (Misra et al., 2001; Misra & Ramaswamy, 2001). This is characteristic of solid states (semi-conductors) under thermally activated recombination of electrons and positive holes that are generated by particle radiation or electromagnetic field at room or low temperature prior to their heating in dark (Chen & McKeever, 1997). TL signals were first detected in dried chloroplasts samples (Arnold & Sherwood, 1957; Tollin & Calvin 1957). Photosynthetic systems in dried chloroplasts are supposed to be severely damaged. TL emission was also recorded in intact leaves and algal cells (Arnold & Sherwood, 1957). Arnold (1966) proposed a model of recombination of free holes in PS I and of free electrons from PS II as the sources of thermally induced luminescence from algae (Chlorella) cells in darkness. However, Arnold & Azzi (1968) refuted the role of free holes from PS I. Based on further evidence on the generation of charges in irradiated chloroplast, in the new model for TL charge recombination the positive and negative charge traps were proposed to reside within PS II (Arnold & Azzi, 1968). Further, biophysical studies and availability of photosynthetic

Biophysics 156
mutants, paved the way to the charaterisation and conformation of the origin of TL peaks between the temperature range of -40°C to +50°C is unequivocally from the charge recombinations in PSII. This finding has been further corroborated by subsequent experimentation by several workers using bundle sheath chloroplasts of C-4 plants that apparently lack PSII and, therefore, show very weak TL. The inhibition of PSI activity by HgCl2 does not affect the glow peak yield of isolated chloroplast (Sane et al., 1977; Horvath et al., 1978). Several other studies using herbicides and inhibitors that interact with PSI electron flow supports this conclusion.
Photosynthetic TL could be defined as an emission of light at characteristic temperatures from pre-illuminated photosynthetic samples (leaves, isolated chloroplasts or algae) during warming in the dark starting from low temperature (Sane, 2004). A set of different bands in TL emission curves appear as a result of recombination of different charge pairs. Even small changes in the redox properties of radical pairs affect the intensity and the peak position of TL bands. This complexity of information of TL emission curves can be used for selective monitoring of the effects of various biotic and abiotic stress factors. Thermoluminescence emission from freshly detached unfrozen leaves is defined as secondary or “afterglow” (AL) emission with Tm at 45°C and proves to be a sensitive test of energetic imbalance in the chloroplasts during various stress conditions (Ducruet, 2003). High-temperature thermoluminescence (HT1, HT2 and HT3 bands with Tm above 60°C) appears as a result of accumulation of lipid peroxides and can be used as a simple and efficient tool to monitor oxidative stress in leaves.
Randall & Wilkins (1945) considered that the charge recombination of fixed +/- charge pairs obeys a first order kinetics. Vass et al. (1981) postulate to photosynthetic TL studies. The probability of recombination L(T) for eachTL band at every measured temperature can be calculated, using the Arrhenius equation (Ducruet, 2003):
L(T)=NRPTΔtexp (-EA/kBT)
Where:
N = number of charge pairs able to recombine at temperature T. R = order of reaction (R=1, as charge pairs are not exchangeable between PSII centres). P = Pre-exponential factor related to the Arrhenius frequency factor s as P=K(T) x s, K(T) being an unknown factor; Δt sampling duration (~1 s); EA is the activation energy, and kB is the Boltzmann constant.
However, charge recombination in PSII varies from that of the minerals. So, DeVault et al. (1983) and DeVault & Govindjee (1990) proposed a theoretical calculation of photosynthetic TL (cf. Tyysjarvi & Vass, 2003).
Further, developments in the TL techniques and biophysical probing revealed that the charge arise as a reversal of the primary photochemical processes in PS II (Misra et al., 2001a, b; Sane, 2004). Therefore they are also in some relation with characteristics of fluorescence induction and emission (Ducruet, 1999; Setikova et al.,1999). There are reviews on thermoluminescence use in herbicide research (Horvath, 1986) and general reviews on TL in chloroplasts or photosynthetic organisms (Sane & Rutherford, 1986;, Inoue, 1996; Vass & Govindjee, 1996). In the present chapter, we focus mainly on the use of TL in studies of
Thermoluminescence in Chloroplast Thylakoid 157
primary photochemical processes in chloroplast thylakoid membranes particularly in PSII. The use of TL technique in the studies of thylakoid development, and the impact of environmental stresses are discussed.
TL measurements need excitation of the sample and the cooling of the sample at low temperature (liquid nitrogen), which is then followed by heating in the darkness and simultaneous recording the luminescence emitted during heating. There are several types of TL apparatus assembled and built so far (Tatake et al., 1971; Manche, 1979; Zeinalov & Maslenkova, 1996; Gilbert et al., 2003; Ducruet, 2004). For the measurement of steady-state TL, a sample such as a section of leaf, chloroplast, or algal material is placed on the sample holder and is illuminated by white light or light of a particular wavelength through a monochromator. A heater coil placed under the cupperplanchet (sample holder) slowly and linearly heats up the sample. A peltier cooling and heating system is used recently. The ultra weak TL emission is amplified several fold and is measured with a red sensitive photomultiplier. The emission(maxima same as prompt fluorescence at about 730 nm in leaves) recorded against temperature gives rise to the TL glow curve or a TL band as shown in Fig. 1. The shape of the glow curve depends on the excitation temperature, time period of excitation, heating and cooling rate, and intensity and wavelength of excitation light. The sample heating varies from 0.5 to 18°C/sec. A single flash illumination or continuous light illumination at low temperature gives rise to one TL band where as continuous illumination during sample cooling gives rise to multiple components as shown in Fig. 1. Luminescence emission from a leaf disc is sufficiently strong to be recorded with an analogue photomultiplier tube (PMT) positioned very close (about 1.5 cm above) to the sample by a light-proof holder that can slide laterally to an illumination position where a light guide comes in front of the sample whilst the PMT is protected from strong actinic light (Ducruet et al., 1998). Alternatively, luminescence can be conveyed to the detector by a light guide, which prevents heating of the PMT. In the conventional TL apparatus, the sample is frozen by liquid nitrogen in order to ensure that no recombination occurs before TL recording. A complete study on the effect of freezing on TL emission has been reported by Homann (1999), who reported few artifacts during freezing. So before the start of experiments, a comparison between TL emission in frozen and unfrozen samples be done, to ascertain the quality of TL signals.
2. Charge recombinations
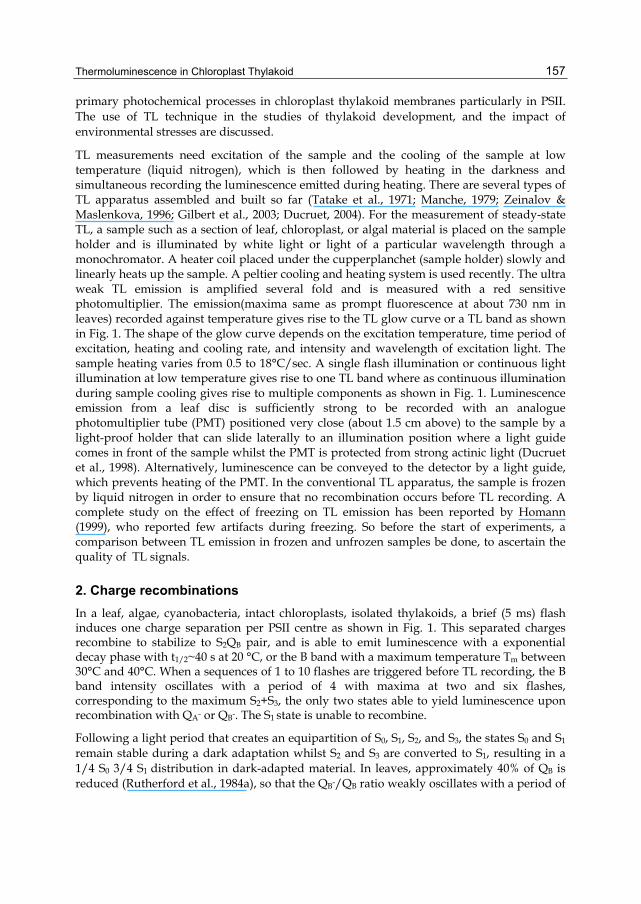
In a leaf, algae, cyanobacteria, intact chloroplasts, isolated thylakoids, a brief (5 ms) flash induces one charge separation per PSII centre as shown in Fig. 1. This separated charges recombine to stabilize to S2QB pair, and is able to emit luminescence with a exponential decay phase with t1/2~40 s at 20 °C, or the B band with a maximum temperature Tm between 30°C and 40°C. When a sequences of 1 to 10 flashes are triggered before TL recording, the B band intensity oscillates with a period of 4 with maxima at two and six flashes, corresponding to the maximum S2+S3, the only two states able to yield luminescence upon recombination with QA- or QB-. The S1 state is unable to recombine.
Following a light period that creates an equipartition of S0, S1, S2, and S3, the states S0 and S1 remain stable during a dark adaptation whilst S2 and S3 are converted to S1, resulting in a 1/4 S0 3/4 S1 distribution in dark-adapted material. In leaves, approximately 40% of QB is reduced (Rutherford et al., 1984a), so that the QB-/QB ratio weakly oscillates with a period of
Biophysics 158
2 according to flash number. In isolated thylakoids at low pH (<6.5) the B band, induced by two flashes, splits into two bands B1 (S3QB-) and B2 (S2QB-), because S3 is more destabilized by protonation than S2 (Joliot & Joliot, 1980; Rutherfordet al., 1984b; Demeter & Sallai, 1986; Miranda & Ducruet, 1995b). Upon treatment by a PSII-inhibiting herbicide (diuron, atrazine) which blocks the QA to QB electron transfer, the electron is stored as QA-, a less stabilized state (i.e. the activation barrier is smaller) than QB- and produces a Q-band peaking at a lower temperature (around 5 °C at neutral pH) than the B band upon recombination with S2/S3. This band is associated with a C-band at about 55 °C due to D+QA
− (Johnson et al., 1994), D+ being the oxidized form of Tyrosine D on the inactive branch of PSII. The functional electron donor to the PSII P680 centre is Tyrosine Z: Z+P680* TyrZ++P680-.
Fig. 1. Schematic view of the +ve and -ve charge formation in PS II. (Adapted from Misra et al., 2001a,b).
A fast rereduction of Z+ by S states occurs, except when the oxygen-evolving manganese complex is damaged, which leads to the emergence of A band Z+QB
− at about -15 °C. Other TL bands exist at lower temperatures which are not fully explained and will not be considered here since they have been of little interest in plant biology. Twenty years ago, thermoluminescence brought a conformation of the charge stabilization model of PSII. It remains a valuable technique that gives a global view complementing more analytical tools and it is particularly well adapted to the study of PSII mutants. Furthermore, like chlorophyll fluorescence, TL is relevant to various levels of integration, from subchloroplast particles to algal cells or leaves (Farineau, 1993; Homann, 1999). However, applications to leaf photosynthesis have been relatively few until now, due to instrumental constraints and to a lack of understanding of in vivo signals. Several reviews already exist on photosynthesis TL (Sane & Rutherford, 1986; Vass & Inoue, 1992; Misra et al., 2001; Tyysjarvi & Vass, 2003). The present chapter will be focused on TL emission by leaves and will address the instrumental, theoretical and practical issues of measuring TL in leaf discs. Taking advantage of new and recently available components, simple instruments designed for leaf studies can now be built.

Thermoluminescence in Chloroplast Thylakoid 159
The properties of TL bands already characterized in thylakoids or subchloroplast particles are modified in vivo by the cellular environment, particularly when leaves are kept unfrozen during the cooling step. Different types of stresses also modify the shape and intensity of the existing bands or enhance minor bands. Furthermore, a TL `afterglow' band observable only in intact systems (intact chloroplasts, algae and leaf fragments) reflects the flow of electrons from reducing compounds present in the stroma to the plastoquinone pool and the quinonic acceptors of PSII. This back-transfer follows one of the pathways involved in the cyclic/chlororespiratory electron flow and appears to be a sensitive indicator of photosynthetic metabolism. Although PSII is totally destroyed at about 60 °C, huge chlorophyll TL bands can be observed at higher temperatures.
They correspond to a heat-enhanced chemiluminescence from molecular species generated by radical forms of oxygen, such as lipid peroxides, which accumulate in stress situations. Despite the fact that the mechanisms of high-temperature TL emission (HTL) is completely different from photosynthetic TL, recorded through a single temperature scan from 0 °C to 160 °C on the same leaf disc. Both the photosynthesis TL bands and the oxidative stress HTL bands proves to be of practical interest.
3. TL glow peaks: Nomenclatures and classifications
There are several classifications of TL glow bands. However, more acceptable are ‘Roman number system – I, II, III, IV etc’ (Table 1) or ‘Alphabetic form - A, B1, B2, C, Z, Zv or Mo’ (Fig. 2, Misra et al., 2001) (Table 1). TL glow peaks that are well characterized are- A, AG AT, B, C, Mo, Q,Z and Zv bands (Table 1). The TL band Z and Zv arise at -169˚C and at -80˚C to -30˚C (Inoue, 1996). These two bands are assigned to charge recombination between charged pigment molecules. The Chl+Chl- charge recombination give rise to Z-band and P680+ QA- charged recombination gives rise to Zv- band of the TL spectra. However alteration in the PS II RC is mainly studied through the changes in the TL bands A, AG, AT, B, C, Mo, or Q. So a detailed characteristic of the charge pairs and the factors responsible for such glow peaks are explained.
Fig. 2. Theoreticel picture of thermoluminescence (TL) glow peaks of photosynthetic materials.

Biophysics 160
3.1 A-band (II band)
A TL glow peak at -10˚C originates by photo-exiting photosynthetic samples by two flashes at room temperature, then cooling of samples to 77K, and further continuous irradiation of the sample (Laufer et al., 1978; Inoue, 1981; Tatake et al.,1981; Demeter et al., 1985). This band is designated as A-band. The charge recombination of S3QA- is responsible for the origin of the A-band (Koike et al., 1986).
3.2 AG- band
An after glow (AG) or delayed luminescence rise is induced by far-red radiation (Bertsch & Azzi, 1965). This emission was reported by only in intact systems such as intact chloroplasts (Hideg et al., 1991), leaves (Bjorn, 1971), or protoplasts (Nakamoto et al., 1988), and could not be detected in isolated thylakoids or PS II RC complexes. This AG glow peak at 45˚C could be resolved by slow heating of leaf samples (Miranda & Ducruet, 1995a,b; Ducruet et al., 1997). The AG-band is suppressed by the PS II electron transport inhibitor diuron ( Miranda & Ducruet, 1995a,b) and by the PS I cyclic electron transport inhibitor antimycin or uncouplers (Bjorn, 1971). This suggests that in addition to PS II, also the cyclic electron transport and/or the trans-thylakoid proton gradient are involved in the generation of AG glow peaks in leaves. Sundblad et al. (1988) assigned the AG glow peak primarily to the back reaction of S2/S3QB- charge recombination. The occurrence of AG peaks was also assigned to the presence of high concentrations of ATP and/or NADPH in the plant cells (Inoue et al., 1976).
3.3 AT-band
The Tris-washed PS II particles show a TL glow peak similar to A-band (Inoue et al., 1977; Rozsa & Demeter, 1982). Tris washing depletes functional Mn cluster from PS II particles. So the generation of S-states is impaired. Unlike the A-band, this band at -10˚C arises due to charge recombination of His+QA- (One & Inoue, 1991; Kramer et al., 1994). This positive charge is assigned to His195 residue and His190 residue of the D1 polypeptide (Kramer et al., 1994). This was confirmed by the impaired AT-band in Chlamydomonas reinhardtii mutants substituted for the above His residues (Kramer et al., 1994).
3.4 B-band (III (B1), IV (B2))
This is the best-characterised TL glow peak in photosynthetic materials. The B-band arises usually at around 30-35˚C. It is correlated to the water-oxidising complex of PS II (Inoue, 1976; Rozsa & Demeter, 1982). Charge recombination between S2QB- (band III or B1 band) and S3BQ-
(band IV or B2 band), together generate the B-band (Rutherford et al., 1982). In dark-adapted chloroplasts, the distribution of S0 and S1 are 25% and 75%, respectively. Thus, the maxima obtained after the second flash indicate the participation of the S3 state in the generation of peak IV (B band). Based on several studies it has been concluded that peak III (B1 band) originates from S3QB- and peak IV (B2 band) originates from the recombination of S2QB-.
The peak V (C band) is not related to the photosynthetic electron chain (Table 1). Peak V (C band) was first observed in DCMU treated chloroplasts and in etiolated leaves (Vass et al. 1981). Since in etiolated leaves the oxygen evolving system is inactive, it has been suggested

Thermoluminescence in Chloroplast Thylakoid 161
that peak V is not related to the water splitting enzyme. However, several studies have shown that this peak also undergoes a period four oscillation and it has been proposed that this band may be originating from the charge recombination of the S0QA- and S1QA- redox couple (Demeter & Govindjee, 1989; Sane et al., 1983).
Peak ApproximateTemperature (oC) Origin Mean Lifetime
(t, sec) Remarks
Illuminated samplesZ -160 Chl+Chl- 0.2 Z1 -70 P680+QA- 1.3
II (A) -10 S3QA- - Mn oxygen-evolving complex
Q +5oC S2QA- - Secondary Qb, quinone acceptor (induced by herbicides)
III (B1) +20 S3QB- - After one flash IV (B2) +30 S2QB- 29 After three flashes V (C) +50 YD+ QA- 1062AG +45 S2/S3QB 1.3Oxidative bands(do not depend on preillumination)HTL1 (=Mo band*) 65 to85 °C Aldehydes+H2O A pseudo-HTL2 occurs
in wet samples HTL2 120 to140 °C Lipid peroxides dry samples
HTL3 > 160°C Induce by warming
Oxidative band increases during TL warming
Notes: Peaks Z1, II (A), IV (B2), and V (C) oscillate with flash number and the maxima differs between S3 for peak II, S2/S3 for peak IV (B), and S1 for peak V (C). Some peaks oscillate when diuron was added after excitation, for example, peaks II and V (C). *Misra et al. (2001)
Table 1. Nomenclature of TL Glow Peaks in Plants
3.5 High temperature (HTL) bands
Strong TL bands are observed even in dark adapted samples above physiological temperatures >50/60 °C. These bands are ascribed to chemiluminescence bands or HTL, and are few oxidative bands unrelated to PS II. Such TL bands in algae or leaves were reported by Venediktov et al., (1989), Vavilin et al., (1991) and Merzlyaket al., (1992). A HTL band around 60-75°C was also reported by Hideg & Vass (1993), Stallaert et al., (1995) and Marder et al., (1998). This band is reported to be due to the accumulation of lipidperoxides (Vavilin & Ducruet, 1998). When the samples were kept in water while heating to prevent desiccation a band at 130 °C was observed and this was proposed to be due to the hydrolysis of lipid peroxides (Ducruet & Vavilin, 1999) or an indicator of oxidative stress (Havaux & Niyogi, 1999). Similar HTL bands around 60-75°C is reported by other authors also (Skotnica et al., 1999; Havaux & Niyogi, 1999; Ducruet & Vavilin, 1999).
Biophysics 162
4. Thylakoid organization and changes in TL glow peak characteristics
In a healthy leaf, the B band at about 35 °C is prominent, although other bands the Q-band, AG or C-bands can also be detected. Oscillations were also seen in the case of TL bands, especially peaks III B1), IV (B2) and V(C) (Bhagawat & Bhattacharjee, 2005). The oscillation of peak IV (B band) of the TL band is the best-characterized band showing maxima at 2, 6, 10, etc., flashes with a periodicity of four (Misra et al., 1998). Manganese oxidation states S2/S3 were found to be the most luminescent states. The different TL peaks attributed to S2QA- and S2QB- reflects different activation energies for the recombination reaction to take place in each of these states. This energy difference may, in part, reflect a different midpoint potential between the QA/QA- and QB/QB- redox couple.
Increase of the Q-band (Tm ~5 °C), and the associated C-band (~55 °C), reflects a damage to QB of PSII e.g. during photoinhibition (Misra et al., 1996; 1998; Janda et al., 1992). The A band (~ +15 °C) is prominent in thylakoid samples or leaf with damaged oxygen evolving complex. However, frozen samples show Q and A bands, which are reported to be artefacts (Homann, 1999).
5. Stress induced changes in TL glow peaks
TL is a useful tool for the study of photosynthetic electron transfer both at the acceptor and the donor sides of PS II (Misra et al., 2001a, b; Misra & Ramaswamy, 2001) as well from the water–oxidase complex to PSI (secondary quinone acceptor) (Bhagawat & Bhattacharjee, 2005).
The effects of various abiotic and biotic stress factors that influence PSII activity, such as UV, high light, high temperature, drought, viral infection, hormonal effect, have also been studied. Major TL bands are missing in etiolated leaves. Intermittent illumination to greening leaves which does not develop Mn clusture properly do not show the TL bands (Inoue et al., 1976; Sane et al., 1977). Misra et al. (1998b) reported a gradual increase in the Q and B band from base to apex of that wheat leaves greening under continuous illumination, which confirms a developmental gradient across the wheat leaf lamina and a gradual development and organization of the photosynthetic PSII complexes. Leaf aging under continuous light or under continuous darkness resulted in a decrease in Q and B bands (Joshi et al., 1993). Biswal et al. (2001) showed through an elegant TL experiment a block in the electron flow from QA to QB during leaf aging and also showed a decrease in the quinone pools in PS II.
Salt stress affects differentially the Q and B band (Biswal et al. 2002; Sahu et al. 1998; Misra et al. 1998c). Relatively the B band is more affected than the Q band. These are dose and time dependant. Zurita et al. (2005) showed that not only the B band is affected, but there is a back flow of electrons in the salt stressed photosynthetic system.
Mineral supplementation of N, P, K or their mixtures induce a shift in the A band from nearly -13°C to 8°C, suggesting the accumulation of S4 states in the mineral supplemented leaf (Soltnev et al., 1998). Heavy metals such as Cu2+, Ni2+, Co2+ and Zn2+ affects B band only (Mohanty et al., 1989). Inert gases (N2, He, Ar, Xe) and anoxic environment reduces the B and C band intensities in leaves (Soltnev et al., 1999). Halogens like I- quenches the TL peaks probably by donating electrons to the S-states (Solntsev et al., 1995). Drought stress shifts the
Thermoluminescence in Chloroplast Thylakoid 163
B band to a lower temperature, which is explained by the redox changes in the thylakoid membranes changing the redox pool in the chloroplast (Ducruet & Vavilin, 1999; Janda et al., 1999).
Leaves irradiated with 725 nm illumination showed B- and C- bands, but A- band was missing (Mirand & Ducruet, 1995a). Probably this is due to photoabsorption by P700 pigment in PSI and not by PSII. Increasing the duration of the illumination decreased the peak temperature of B-band, probably due to a progressive lumen acidification.
Photoinhibitory treatment which usually result in the decreased quantum efficiency of PSII and degradation of D1 polypeptide, do not affect the S-states but affects B-band with least effect on C-band (Misra et al., 1997; 1998a). Isolated thylakoids showed a parallel decrease in Q- and B-band (Vass et al., 1988) suggesting both QA and QB is affected by photoinhibition. Ohad et al. (1990) reported a band shift of B-band to lower temperature, suggesting lumen acidification and redox changes in PSII. Misra et al. (1997, 1998a) reported Q- and B-band intensity decreased with high temperature in pothos and spinach leaves. Janda et al. (1999) reported membrane leakiness and grana destacking might be the reason for the changes in AG bands both at high temperature and freezing.
Viral infection of the plant shifts the B-band to a higher temperature with a decrease in its intensity (Rahoutei et al., 1999). There appears a new peak at 70C, which is suggested to be due to membrane lipid peroxidation due to hypersensitive reactions in the leaf cells (Stallaert et al., 1995).
6. Conclusion and future perspective
The phenomenon of thermoluminescence in photosynthetic materials has been used routinely in characterizing the redox reactions of PSII in thylakoid membrane both in isolated systems and intact leaves. TL methods are also used as a non-invasive method for the detection of genetic lessions or genetic modifications in the plants (Lurie & Bertsch, 1974; Ichikawa et al., 1975; Debus et al., 1988; Minagawa et al., 1999). Also, the screening of photosynthetic mutants from these genetically modified organism, led to the confirmation of the origin of TL bands. This simple instrument can be fabricated in a laboratory with minimum infrastructure facility. The charge pair interactions giving rise to TL bands of characteristic peaks is used routinely for the stress characterization both donor side and acceptor side of PS II in photosynthetic materials. The oscillation pattern of TL can denote the ‘‘S’’ state transition and can be used for a titre of the Mn clusture of oxygen evolving complex.
TL characteristics may help in identifying new site(s) of action of herbicides and other chaotropic agents. However, TL studies are only confined to PS II and the method has such limitations or confines. The other limitations are the shift in the peak temperature of TL bands due to differences in the instrumentation, illumination temperature, and several other parameters that are obscure. The phenomenon of HTL is now a days used as an useful tool for understanding oxidative changes in photosynthetic systems. Also this system is now used in ‘sensors’ for developing ‘biosensors’ (Zhang et al., 2007). However, before this proposition comes true, the instrumentation needs more precission and miniaturization.
Biophysics 164
7. Acknowledgements
This work was supported by funds from UGC-MRP No.36-302/2008(SR) and DST- INT/ BULGARIA/ B70/06 to ANM. MM acknowledges the award of DST-WoS and UGC PDF for Women.
8. References
Bendall, D.S. & Manasse, R.S. (1995). Cyclic photophosphorylation and electron transport, Biochimica et Biophysica Acta, 1229, 23-38
Bennoun, P. (1982). Evidence for a respiratory chain in the chloroplast, Proc Natl Acad Sci USA, 79, 4352-4356
Bertsch, W.F. & Azzi, J.R. (1965). A relative maximum in the decay of long-term delayed light emission from the photosynthetic apparatus, Biochimica et Biophysica Acta, 94, 1526
Bhagwat, A.S. & Bhattacharjee, S.K. (2005).Thermoluminescence as a tool in the study of photosynthesis, Taylor & Francis Group, LLC
Biswal, A.K.; Dilnawaz, F.; David, K.A.V.; Ramaswamy, N. K. & Misra, A.N. (2001). Increase in the intensity of thermoluminescence Q-band during leaf ageing is due to a block in the electron transfer from QA to QB, Luminescence, 16, 309-313
Biswal, A.K.; Dilnawaz, F.; Ramaswamy, N.K.; David, K.A.V. & Misra, A.N. (2002). Thermoluminescence characteristics of sodium chloride salt stressed Indian mustard seedlings, Luminescence, 17, 135-140
Bjorn, L.O. (1971). Far-red induced, long-live after glow from photosynthetic cells. Size of after glow unit and paths of energy accumulation and dissipation, Photochemistry and Photobiology, 13, 5-20
Briantais, J.M.; Ducruet, J.M.; Hogdes, M. & Krause, H. (1992). Effects of high light at chilling temperature on photosystem II in spinach leaves, Photosynthesis Research, 31, 1-10
Cser, K.; Deak, Z.; Telfer, A.; Barber, J. & Vass, I. (2008). Energetics of Photosystem II charge recombination in Acaryochloris marina studied by thermoluminescence and flash-induced chlorophyll fluorescence measurements, Photosynthesis Research, 98, 131–140
Demeter, S. & Govindjee (1989). Thermoluminescence in plants, Physiological Plantarum, 75, 121–130
Demeter, S. & Sallai, A. (1986). Effect of pH on thethermoluminescence of spinach chloroplasts in the presence and absence of photosystem II inhibitors, Biochimica et Biophysica Acta, 851, 267-275
Demeter, S. & Vass, I. (1984). Charge accumulation and recombination in photosystem II studied by thermoluminescence. I. Participationof the primary acceptor Q and secondary acceptor B in the generation of thermoluminescence in chloroplasts, Biochimicaet Biophysica Acta, 764, 24-32
DeVault, D.; Govindjee & Arnold W. (1983). Energetics of photosynthesis glow peaks. Proceedings of the National Academy of Sciences, USA, 80, 983-987
DeVault, D & Govindjee (1990). Photosynthetic glow peaks and their relationship with the free energy changes, Photosynthesis Research, 24, 175-181
Dilnawaz, F.; Vass, I. & Misra, A.N. (2001). Thermoluminescence glow peaks of chloroplasts along the axis of wheat leaf lamina, Photosynthsis, PS2001. CSIRO Publ., Melbourne, Australia S2-001

Thermoluminescence in Chloroplast Thylakoid 165
Ducruet, J.M. & Vavilin, D. (1999). Chlorophyll high-temperature thermoluminescence emission as an indicator of oxidative stress. Perturbating effects of oxygen and leaf water content, Free Radical Research, 31S, 187-192
Ducruet, J.M. & Vass, I. (2009). Thermoluminescence: experimental. Photosynthesis Research, 101, 195–204
Ducruet, J.M. & Miranda, T. (1992). Graphical and numerical analysis of thermoluminescence and fluorescence F0 emission in photosynthetic material, Photosynthesis Research, 33, 15–27
Ducruet, J.M. (2003). Chlorophyll thermoluminescence of leaf discs: simple instruments and progress in signal interpretation open the way to new ecophysiological indicators. Journal of Experimental Botany, 54, 2419–2430
Ducruet, J.M.; Peeva, V. & Havaux, M. (2007). Chlorophyll thermofluorescence and thermoluminescence as complementary tools for the study of temperature stress in plants. Photosynthesis Research, 93, 159–171
Ducruet, J.M.; Roman, M.; Ortega, J.M. & Janda, T. (2005). Role of the oxidized secondary acceptor QB of Photosystem II in the delayed ‘after glow’ chlorophyll luminescence, Photosynthesis Research, 84, 161–166
Ducruet, J.M.; Toulouse, A. & Roman, M. (1998). Thermoluminescence of plant leaves: instrumental and experimental aspects. In: Garab G (ed) Photosynthesis: mechanisms and effects, vol V. Kluwer Academic Publishers, Dordrecht, pp 4353–4356
Farineau, J. (1993). Compared thermoluminescence characteristics of pea thylakoids studied in vitro and in situ (leaves). The effect of photoinhibitory treatments, Photosynthesis Research, 36, 25-34
Fedoulov, Y.P. (1998). System analysis of frost resistance in winter wheat and its use in breeding, Euphytica, 100, 101-108
Finazzi, G.; Rappaport, F.; Furia, A.; Fleischmann, M.; Rochaix, J.D.; Zito, F. & Forti G. (2002). Involvement of state transitions in the switch between linear and cyclic electron flow in Chlamydomonas reinhardtii, EMBO Reports, 31, 280-285
Garab, G.; Lajko, F.; Mustardy, L. & Marton L. (1989). Respiratory control over photosynthetic electron transport in chloroplasts of higher-plant cells: evidence for chloro-respiration, Planta, 179, 349-358
Gilbert, M.; Skotnica, J.; Weingart, I. & Wilhelm, C. (2004a). Effects of UV irradiation on barley and tomato leaves: thermoluminescence as a method to screen the impact of UV radiation on crop plants, Functional Plant Biololgy, 31, 825–845
Gilbert, M.; Wagner, H.; Weingart, I.; Skotnica, J.; Nieber, K.; Tauer, G.; Bergmann, F.; Fischer, H. & Wilhelm, C. (2004b). A new type of thermoluminometer: a highly sensitive tool in applied photosynthesis research and plant stress physiology. Journal of Plant Physiology, 161, 641–651
Glemin, A.; Miranda, T.; Ducruet, J.M. (1992). Temperature behavior of photosystem II in chilling-resistant and chilling-susceptible plant species, studied by fluorescence and luminescence methods. In: Murata N, ed. Research in photosynthesis, Vol. IV. Utrecht:Kluwer, 85-188
Havaux, M. & Niyogi K.K. (1999). The violaxanthin cycle protects plants from photo-oxidative damage by more than one mechanism. Proceedings of the National Academy of Sciences, USA, 96, 8762-8767
Biophysics 166
Havaux, M. (1996). Short-term responses of photosystem I to heat stress. Photosynthesis Research, 47, 85-97
Heber, U.; Neimanis, S.; Dietz, K.J. & Viil, J. (1986). Assimilation power as a driving force in photosynthesis, Biochimica et Biophysica Acta, 852, 144-155
Heldt, H.W.; Werdan, K.; Milovancev, M. & Geller G. (1973). Alkalization of the chloroplast stroma caused by light dependent proton flux into the thylakoid space, Biochimica et Biophysica Acta, 314, 224-241
Hideg, E. & Demeter S. (1985). Binary oscillation of delayed luminescence: evidence of the participation of QB in the charge recombination, Zeitschriftfu Èr Naturforschung, 40c, 827-831
Hideg, E.; Kobayashi, M. & Inaba H. (1991). The far-red induced slow component of delayed light from chloroplasts is emitted from Photosystem II. Evidence from emission spectroscopy. Photosynthesis Research, 29, 107-112
Hideg, E. & Vass I. (1993). The 75°C thermoluminescence band of green tissues: chemiluminescence from membrane-chlorophyll interaction, Photochemistry and Photobiology, 58, 280-283
Homann, P.H. (1999). Reliability of photosystem II thermoluminescence measurements after sample freezing: few artifacts with Photosystem II membranes but gross distortions with certain leaves, Photosynthesis Research, 62, 219-229.
Horvath, G.; Droppa, M.; Mustardy, L.A. & Faludi-Daniel, A. (1978). Functional characteristics of intact chloroplasts isolated from mesophyll and bundle sheath cells of maize, Plant 141, 239–251
Janda, T.; Szalai, G.; Giauffret, C.; Paldi, E.; Ducruet, J.M. (1999). The thermoluminescence 'After glow' band as a sensitive indicator of abiotic stresses in plants, Zeitschriftfu Èr Naturforschung, 54c, 629-633
Janda, T.; Szalai, G. & Paldi, E. (2000). Thermoluminescence investigation of low temperature stress in maize, Photosynthetica, 38, 635-639
Janda, T.; Wiessner, W.; Paldi, E.; Mende, D. & Demeter, S. (1992). Thermoluminescence investigation of photoinhibition in the green alga Chlamydomonas stellata and in Pisum sativum L. leaves, Zeitschriftfu Èr Naturforschung 47c, 585-590
Johnson, G.N.; Boussac, A. & Rutherford, A.W. (1994). The origin of 40-50°C thermoluminescence bands in Photosystem II, Biochimica et Biophysica Acta, 1184, 85-92
Joliot, P. & Joliot, A. (1980). Dependence of delayed luminescence upon adenosine triphosphatase activity in Chlorella, Plant Physiology, 65, 691-696
Jursinic, P.A. (1986). Delayed fluorescence: current concepts and status. In: Govindjee, Amesz, J. and Fork, D.C., eds. Light emission by plants and bacteria. Orlando: Academic Press, 291-328
Krieger, A.; Bolte, S.; Dietz, K.J. & Ducruet, J.M. (1998). Thermoluminescence studies on the facultative crassulean-acid metabolism plant Mesembryanthemum crystallinum L, Planta, 205, 587-594
Lavergne, J. & Junge, W. (1993). Proton release during the redox cycle of the water oxidase, Photosynthesis Research, 38, 279-296
Lavorel, J. (1975). Luminescence. In Govindjee, ed. Bioenergetics of photosynthesis, New York: Academic Press, 223-317
Thermoluminescence in Chloroplast Thylakoid 167
Malkin, S.; Bilger, W. & Schreiber U. (1994). The relationship between millisecond luminescence and fluorescence in tobacco leaves during the induction period, Photosynthesis Reserach 39, 57-66
Manche, E.P. (1979). Thermoluminescence. In: Ewing, G.W. (ed.). Topics in Chemical Instrumentation, Journal of Chemical Education, 56A, 273
Manuel, N.; Cornic, G.; Aubert, S.; Cholet Bligny, P. & Heber, U. (1999). Protection against photoinhibition in the alpine plant Geummontanum, Oecologia, 119, 149-158
Marder, J,B.; Droppa, M.; Caspi, V.; Raskin, V.I. & Horvath, G. (1998). Light-independent thermoluminescence from greening barley leaves: evidence for involvement of oxygen radicals and free chlorophylls. Physiologia Plantarum, 104, 713-719
Maslenkova, L. (2010).Thermoluminescence from photosynthesizing systems as a method for detection of early plant stress symptoms. Effect of desiccation on thermoluminescence emission parameters in mesophytic and poikilohydric plants, General and Applied Plant Physiology, 36, 87–99
Mellvig, S. & Tillberg, J.S. (1986). Transient peaks in the delayed luminescence from Scenedesmus obtusiusculus induced by phosphorous starvation and carbon dioxide deficiency. Physiologia Plantarum, 28, 180-188
Merzlyak, M.N.; Pavlov, V.K. & Zhigalova, T.V. (1992). Effect of desiccation on chlorophyll high temperature chemiluminescence in Acer platanoides L. and Aesculushippo castanum L. leaves, Journal of Plant Physiology, 139, 629-631
Miranda, T. & Ducruet J.M. (1995a). Characterization of the chlorophyll thermoluminescence after glow in dark-adapted or far-red-illuminated plant leaves, Plant Physiology and Biochemistry, 33, 689-699
Miranda, T. & Ducruet, J.M. (1995b). Effects of dark- and light induced proton gradients in thylakoids on the Q and B thermoluminescence bands, Photosynthesis Research, 43, 251-262
Misra, A.N. & Ramaswamy, N.K. (2001). Thermoluminescence of green plants (Review, New Trends in Photosciences). Indian Photobiology Society News Lett, 40, 45-50
Misra, A.N.; Dilnawaz, F.;Misra, M. & Biswal, A.K. (2001b). Thermoluminescence in chloroplasts. In Biophysical processes in living systems.Chapter 17. (PadhaSaradhiB,ed.), Oxford/IBH, New Delhi/ Science Publ., Enfield (NH), USA, Plymouth, UK. pp.303-311.
Misra, A.N.; Dilnawaz, F.; Misra, M. & Biswal, A.K. (2001a). Thermoluminescence in chloroplasts as an indicator of alterations in photosystem II reaction center by biotic and abiotic stress. Photosynthetica, 39, 1-9
Misra, A.N.; Ramaswamy, N.K. & Desai, T.S. (1997). Thermoluminescence studies on photoinhibition of pothos leaf discs at chilling, room and high temperature. Journal of Photochemistry and Photobiology, 38, 164-168
Misra, A.N.; Ramaswamy, N.K. & Desai, T.S. (1998a). Thermoluminescence properties and changes in D1 polypeptide of spinach chloroplasts during photoinhibition of spinach leaf discs at chilling, room and high temperatures. In Photosynthesis : Mechanism and Effects.Vol. III (Garab G, ed.), Kluwer Acad. Publ., The Netherlands pp.2213-2216
Misra, A.N.; Sahu, S.M.; Dilnawaz, F.; Mahapatra, P.; Misra, M.; Ramaswamy, N.K. & Desai, T.S. (1998b). Photosynthetic pigment-protein content, electron transport activity and thermoluminescence properties of chloroplasts along the developmental

Biophysics 168
gradient in greening wheat (Triticum aestivum L.) leaves. In Photosynthesis : Mechanism and Effects. Vol. IV (Garab G, ed.), Kluwer Acad. Publ., The Netherlands pp.3179-3182
Misra, A.N.; Sahu, S.M.; Misra, M.; Ramaswamy, N.K. & Desai, T.S. (1998c). Sodium chloride salt stress induced changes in thylakoid pigment-protein complexes, PS II activity and TL glow peaks of chloroplasts from mung bean (Vigna radiata L.) and Indian mustard (Brassica juncea Coss.) seedlings. Z. Naturforsch. Part: C, 54, 640-644
Nakamoto, I.; Sundblad, L.G.; Garderstro, È. P. & Sundbom E. (1988). Far-red stimulated long-lived luminescence from barley protoplasts, Plant Science, 55, 1-7
Palmqvist, K.; Sundblad, L.G.; Samuelsson, G. & Sundbom, E. (1986). A correlation between changes in luminescence decay kinetics and the appearance of a CO2-accumulating mechanism in Scenedes musobliquus, Photosynthesis Research, 10, 113-123.
Pieralice, M.; Sergio, L.; Di Venere, D. & Venediktov, P. (2011). A brief note on thermoluminescence analysis of photosystem II and lipid peroxidation during the shelf life of ready-to-use rocket (Diplotaxis tenuifolia L.), European Food Research Technology, 232, 919–923
Rahoutei, J.; Baron, M.; Garcia-Luque, I.; Droppa, M.; Nemenyi, A. & Horvath, G. (1999). Effect of tobamo virus infection on thermoluminescence characteristics of chloroplasts from infected plants, Zeitschriftfu Èr Naturforschung, 54c, 634-639
Randall, J.T. & Wilkins, M.H.F. (1945). Phosphorescence and electron traps, Proceedings of the Royal Society (London) Series A, 184, 366-408
Ravenel, R.; Peltier, G. & Havaux, M. (1994). The cyclic electron pathways around photosystem I in Chlamydomonas reinhardtii as determined in vivo by photo-acoustic measurements of energy storage, Planta, 193, 251-259
Roman, M & Ducruet, J.M. (2000). Evidence from leaf thermoluminescence for a decrease of the [NADPH+ATP] energetic potential in cold-sensitive Pisum sativum L. varieties upon hardening at 5°C, Journal of Plant Physiology, 157, 177-181
Roman, M. (2002). Whole leaf thermoluminescence emission in Pisum sativum L: influence of leaflet position, Photosynthetica 40, 153-156
Rose, S.; Minagawa, J.; Seufferheld, M.; Padden, S.; Svensson, B.; Kolling, D R. J.; Crofts, A R. & Govindjee (2008). D1-arginine257 mutants (R257E, K, and Q) of Chlamydomonas reinhardtii have a lowered QB redox potential: analysis of thermoluminescence and fluorescence measurements, Photosynthesis Research, 98, 449–468
Rutherford, A.W.; Crofts, A.R. & Inoue, Y. (1982).Thermoluminescence as a probe of photosystem II photochemistry. The origin of the flash-induced glow peaks, Biochimica et Biophysica Acta, 682, 457-465
Rutherford, A.W. & Inoue, Y. (1984). Oscillations of delayed luminescence from PSII: recombination of S2QB− and S3QB+, FEBS Letters, 165, 163-170
Rutherford, A.W.; Renger, G.; Koike, H. & Inoue, Y. (1984b). Thermoluminescence as a probe of photosystem II. The redox and protonation states of the secondary acceptor quinone and O2-evolving enzyme, Biochimica et Biophysica Acta, 767, 548-556
Rutherford, A.W.; Govindjee; Inoue, Y. (1984a). Charge accumulation and photochemistry in leaves studied by thermoluminescence and delayed light emission, Proceedings of the National Academy of Sciences, USA, 81, 1107-1111
Sahu, S. M.; Dilnawaz, F.; Meera, I.; Misra, M.; Ramaswamy, N.K.; Desai, T.S. & Misra, A.N. (1999). Photosynthetic efficiency of mung bean (Vigna radiata L. Wilczek) and

Thermoluminescence in Chloroplast Thylakoid 169
Indian mustard (Brassica juncea Coss.) during seedling establishment under NaCl salinity, InPlant Physiology for Sustainable Agriculture.(Srivastava G C, Singh K and Pal M, eds.), Pointer Publ., Jaipur, India pp. 388-391.
Sane, P. & Rutherford, A.W. (1986). Thermoluminescence from photosynthetic membranes. In: Govindjee, Amesz J, Fork DC (Eds.).Light emission by plants and bacteria. Orlando: Academic Press, 291-329
Sane, P.V.; Desai, T.S. & Tatake, V.G. (1983). Characterization of glow peaks of chloroplast membranes. I. Relationship with ‘‘S’’ states, Indian Journal Experimental Biology, 21, 396–405
Sane, P.V. (2004). Thermoluminescence. A technique for probing photosystem II. In: Methods in molecular biology. Photosynthesis research protocols, ed. R. Carpentier, 229–248, Totowa, NJ: Humana Press. Inc.
Sane, P.V.; Desai, T.S. & Tatake, V.G. (1977). On the origin of glow peaks in Euglena cells, spinach chloroplasts and subchloroplast fragments enriched in system I and II, Photochemistry and Photobiology, 26, 33–39
Sane, P.V.; Ivanov, A.; Hurry, V.; Huner, N. & Oquist, G. (2003). Changes in the redox potential of primary and secondary electron-accepting quinones in photosystem II confer increased resistance to photoinhibition in Low-temperature-acclimated Arabidopsis, Plant Physiology, 132, 2144–2151
Scheller, H.V. (1996). In vitro cyclic electron transport in barley thylakoids follows two independent pathways. Plant Physiology, 110, 187-194
Schmidt, W. & Senger, H. (1987). Long-term delayed luminescence in Scenedesmus obliquus, Biochimica et Biophysica Acta, 891, 15-27
Schreiber, U. & Berry, J.A. (1977). Heat-induced changes in chlorophyll fluorescence in intact leaves correlated with damage to the photosynthetic apparatus, Planta, 136, 233-238
Schumann, A.; Bauer, A.; Hermes, M.; Gilbert, M.; Hengstler, J.G. & Wilhelm, G. (2009). A rapid and easy to handle thermoluminescence based technique for evaluation of carbon tetrachloride-induced oxidative stress on rat hepatocytes, Arch. Toxicology, 83, 709–720.
Skotnica, J.; Fiala, J.; Ilik, P. & Dvorak, L. (1999). Thermally induced chemiluminescence of barley leaves, Photochemistry Photobiology, 69, 211-217
Stallaert, V.M.; Ducruet, J.M.; Tavernier, E. & Blein, J.P. (1995). Lipid peroxidation in tobacco leaves treated with the elicitor cryptogein: evaluation by high-temperature thermoluminescence emission and chlorophyll fluorescence, Biochimica et Biophysica Acta, 1229, 290-295
Sundblad, L.G.; Palmqvist, K. & Samuelsson, G. (1986). Luminescence decay kinetics in relation to the relaxation of the trans-thylakoid ∆pH from high and low CO2 adapted cells of Scenedesmus obliquus. FEBS Letters, 209, 28-32
Sundblad, L.G.; Schroder, W.P. & Akerlung, H.E. (1988). S-state distribution and redox state of QA in barley in relation to luminescence decay kinetics. Biochimica et Biophysica Acta, 973, 47-52
Sundby, C.; Melis, A.; MaÈenpaÈaÈ, P. & Andersson, B. (1986).Temperature-dependent changes in the antenna size of photosystem II. Reversible conversion of photosystem IIa to photosystem IIb, Biochimica et Biophysica Acta, 851, 475-483
Tatake, V.G.; Desai, T.S. & Bhattacharjee, S.K. (1971). A variable temperature cryostat for thermoluminescence studies, Journal of Physics E: Scientific Instruments, 4, 755–762

Biophysics 170
Thomas, P.G.; Quinn, P.J. & Williams, W.P. (1986). The origin of photosystem-I-mediated electron transport stimulation in heat stressed chloroplasts, Planta, 167, 133-139
Tyystjarvi, E. & Vass, I. (2004). Light emission as a probe of charge separation and recombination in the photosynthetic apparatus: relation of prompt fluorescence to delayed light emission and thermoluminescence. In: Papageorgiou GC, Govindjee (eds) Chlorophyll a fluorescence: a signature of photosynthesis. Advances in Photosynthesis and Respiration. Vol. 19, Springer, Dordrecht, pp 363–388
Vass, I.; Horvath, G.; Herczeg, T. & Demeter, S. (1981). Photosynthetic energy conservation investigated by thermoluminescence activation energies and half-lives of thermoluminescence bands of chloroplasts determined by mathematical resolution of glow curve. Biochimica et Biophysica Acta, 634, 140-152
Vass, I.; Horvath, G.; Herczeg, T. & Demeter, S. (1981). Photosynthetic energy conservation investigated by thermoluminescence. Activation energy and half life of thermoluminescence bands of chloroplasts determined by mathematical resolution of glow curves, Biochim Biophys Acta, 634, 140–152
Vass, I. & Inoue, Y. (1992). Thermoluminescence in the study of photosystem II. In: Barber J, ed. The photosystems: structure,function and molecular biology, Amsterdam: Elsevier, 259-294
Vass, I. (2005). The history of photosynthetic thermoluminescence. In: Govindjee, Beatty JT, Gest H, Allen JF (eds) Discoveries in photosynthesis. Advances in Photosynthesis and Respiration. Vol. 20, Springer, Dordrecht, pp 665–680.
Vavilin, D.V. & Ducruet, J.M. (1998). The origin of 120-130°C thermoluminescence bands in chlorophyll-containing material, Photochemistry and Photobiology, 68, 191-198
Vavilin, D.V.; Matorin, D.N.; Kafarov, R.S.; Bautina, A.L. & Venediktov, P.S. (1991). High-temperature thermoluminescence of chlorophyll in lipid peroxidation, Biologicheskie Membrany, 8, 89-98
Vavilin, D.V. & Vermaas, W.F. (2000). Mutations in the CD-loop region of the D2 protein in Synechocystis sp. PCC 6803 modify charge recombination pathways in photosystem II in vivo, Biochemistry, 39, 14831–14838
Venediktov, P.S.; Matorin, D.N. & Kafarov, R.S. (1989). Chemiluminescence of chlorophyll upon lipid photoperoxidation in thylakoid membranes. Biofizika (Moscow), 34, 241-245
Weiss, E. (1984). Short term acclimation of spinach to high temperatures, Plant Physiology, 74, 402-407
Zeinalov, Y. & Maslenkova, L. (1996). A computerized equipment for thermoluminescence investigations, Bulgarain Journal of Plant Physiology, 22, 88–94
Zhang, L.; Xing, D. & Wang, J. (2007). A non-invasive and real-time monitoring of the regulation of photosynthetic metabolism biosensor based on measurement of delayed fluorescence in vivo, Sensors, 7, 52-66
Zurita, J. L.;Roncel, M.; Aguilar, M. & Ortega, J.M. (2005). A thermoluminescence study of Photosystem II back electron transfer reactions in rice leaves – effects of salt stress, Photosynthesis Research, 84, 131–137