Sequence analysis of porothramycin biosynthetic gene cluster

Linking Metabolic QTLs with Network andcis-eQTLs Controlling BiosyntheticPathwaysAdam M. Wentzell
1,2[, Heather C. Rowe
1,2[, Bjarne Gram Hansen
3, Carla Ticconi
1, Barbara Ann Halkier
3,
Daniel J. Kliebenstein1,2*
1 Department of Plant Sciences, University of California Davis, Davis, California, United States of America, 2 Genetics Graduate Group, University of California Davis, Davis,
California, United States of America, 3 Plant Biochemistry Laboratory, Department of Plant Biology, Faculty of Life Sciences, University of Copenhagen, Copenhagen,
Denmark
Phenotypic variation between individuals of a species is often under quantitative genetic control. Genomic analysis ofgene expression polymorphisms between individuals is rapidly gaining popularity as a way to query the underlyingmechanistic causes of variation between individuals. However, there is little direct evidence of a linkage betweenglobal gene expression polymorphisms and phenotypic consequences. In this report, we have mapped quantitativetrait loci (QTLs)–controlling glucosinolate content in a population of 403 Arabidopsis Bay 3 Sha recombinant inbredlines, 211 of which were previously used to identify expression QTLs controlling the transcript levels of biosyntheticgenes. In a comparative study, we have directly tested two plant biosynthetic pathways for association betweenpolymorphisms controlling biosynthetic gene transcripts and the resulting metabolites within the Arabidopsis Bay 3
Sha recombinant inbred line population. In this analysis, all loci controlling expression variation also affected theaccumulation of the resulting metabolites. In addition, epistasis was detected more frequently for metabolic traitscompared to transcript traits, even when both traits showed similar distributions. An analysis of candidate genes forQTL-controlling networks of transcripts and metabolites suggested that the controlling factors are a mix of enzymesand regulatory factors. This analysis showed that regulatory connections can feedback from metabolism to transcripts.Surprisingly, the most likely major regulator of both transcript level for nearly the entire pathway and aliphaticglucosinolate accumulation is variation in the last enzyme in the biosynthetic pathway, AOP2. This suggests thatnatural variation in transcripts may significantly impact phenotypic variation, but that natural variation in metabolitesor their enzymatic loci can feed back to affect the transcripts.
Citation: Wentzell AM, Rowe HC, Hansen BG, Ticconi C, Halkier BA, et al. (2007) Linking metabolic QTL with network and cis-eQTLs controlling biosynthetic pathways. PLoSGenet 3(9): e162. doi:10.1371/journal.pgen.0030162
Introduction
A longstanding goal in genetics is to unravel the molecularand genetic bases of complex traits such as disease resistance,growth, and development. While phenotypic variation innatural populations is largely quantitative and polygenic,understanding this variation is complicated by the interac-tion of environmental and genetic factors [1,2]. Quantitativetrait mapping, the most common approach to analyzecomplex traits, measures the association of genetic markerswith phenotypic variation, delineating quantitative trait loci(QTLs) [1,3]. Advances in statistical models, improvements inmarker technology, and expanding genomic resources havelead to increasingly refined QTL maps for a wide array oftraits, ranging from development and morphology tometabolism and disease resistance [4–10]. In spite of theseconsiderable efforts, the molecular basis of many quantitativetraits remains unknown.
Recently, our understanding of quantitative traits has beenenhanced by genomic approaches that use microarraytechnology to measure global transcript levels in mappingpopulations and map expression QTL (eQTL) [11–13].Whole-genome eQTL analysis in yeast, mice, and humanshas revealed that gene expression traits are highly heritable,and can have surprisingly complex underlying genetic
architecture [13–15]. Recently, similar global analysis of geneexpression was conducted in two independent A. thalianarecombinant inbred line (RIL) mapping populations [16,17].These studies revealed large numbers of both cis- and trans-acting eQTL, with evidence of nonadditive genetic variationand transgressive segregation, consistent with results fromanimal systems. In addition, network eQTL analysis in the Bay3 Sha RIL population showed that transcript variation wascontrolled by variation in specific biological networksincluding both biosynthetic and signal transduction pathways
Editor: Vivian G. Cheung, University of Pennsylvania, United States of America
Received May 31, 2007; Accepted August 1, 2007; Published September 14, 2007
A previous version of this article appeared as an Early Online Release on August 1,2007 (doi:10.1371/journal.pgen.0030162.eor).
Copyright: � 2007 Wentzell et al. This is an open-access article distributed underthe terms of the Creative Commons Attribution License, which permits unrestricteduse, distribution, and reproduction in any medium, provided the original authorand source are credited.
Abbreviations: 4-MSO, 4-methylsulfinylbutyl; 4-MT, 4-methylthiobutyl; ANOVA,analysis of variance; AOP, alkenyl/hydroxypropyl locus; eQTL, expression QTL; GSL,glucosinolate locus; HPLC, high-performance liquid chromatography; Ler, Lands-berg erecta; QTL, quantitative trait locus; RIL, recombinant inbred line
* To whom correspondence should be addressed. E-mail: [email protected]
[ These authors contributed equally to this work.
PLoS Genetics | www.plosgenetics.org September 2007 | Volume 3 | Issue 9 | e1621687
[18]. These studies present a detailed picture of variation ingene expression and its underlying genetic architecture, butthe relationship between transcript levels and the resultantphenotypic variation remains poorly understood.
Testing the connection between eQTLs and downstreamphenotypic variation requires a phenotype with detailedmolecular and quantitative genetic information. Metabolicphenotypes are ideal for these studies, because these traits arehighly variable and can be accurately measured using high-throughput techniques [5,19,20]. Knowledge of biochemicalpathways enables comparison between the transcript level ofa biosynthetic gene and downstream metabolic phenotypes.This engenders detailed hypotheses about the basis ofmetabolic variation that incorporate biochemical relation-ships, flux concepts, and transcriptional regulation [21].Derived traits generated from the raw metabolite accumu-lation data can provide unique insights into the metabolicnetwork [22,23]. These derived traits can include the sum ofrelated metabolites, providing information about the wholepathway, or the ratio of two metabolites related as precursorand product can be used to query variation in a specificenzymatic process.
We test our ability to link eQTLs with phenotypic variationusing two secondary metabolite pathways responsible for thesynthesis of aliphatic and indolic glucosinolates within A.thaliana. These metabolites play an important role in plantdefense against herbivory, and have chemopreventive activityin the human diet. An improved understanding of the geneticbasis of glucosinolate variation thus affects evolution andecology as well as nutrition and agriculture [24,25]. Glucosi-nolates are synthesized by a well-studied biosynthetic pathway[24,26,27], with known transcription factors [28,29] andcloned QTLs controlling structural diversity and contentwithin Arabidopsis [19,30] (Figure 1).
Aliphatic and indolic glucosinolates, derived from elon-gated methionine derivatives and tryptophan, respectively,are synthesized and subsequently modified by two independ-ent yet parallel pathways (Figure 1A). These biosyntheticpathways possess distinct enzymes and divergent regulation[27]. Production of aliphatic glucosinolates is controlled bythree cloned QTLs controlling specific biosynthetic enzymes:GSL.Elong, GSL.ALK, and GSL.OX (GSL ¼ GlucoSinoLate;
Figure 1B and 1C) [31–33]. Additional QTLs have beenidentified which, according to current knowledge, are notassociated with known biosynthetic genes [30,34]. As such, thealiphatic and indolic glucosinolate metabolic pathwaysprovide a useful model system to link phenotypic QTLs witheQTLs.To compare phenotypic QTLs and eQTLs, we measured
the accumulation of aliphatic and indolic glucosinolates inthe Bay 3 Sha RIL population. In addition to 14 and 11metabolic QTL for the indolic and aliphatic metabolites,respectively, several epistatic interactions were detected.Using the same seeds and developmental stages as the
Figure 1. Glucosinolate Biosynthesis
Arrows show the known and predicted steps for glucosinolate biosyn-thesis with the gene name for each biochemical reaction within thearrow. For compounds that are undetected intermediates, chemicalnames only are provided. For detected compounds, both the structureand chemical name are provided. The position of known genetic locicontrolling biosynthetic variation is shown in italics.(A) The pathway and genes responsible for the production of the coreglucosinolate structure from tryptophan (indolic glucosinolates) andmethionine (aliphatic glucosinolates).(B) The chain elongation cycle for aliphatic glucosinolate production.Each cycle of these reactions adds a single carbon to a 2-oxo-acid, whichis then transaminated to generate homo-methionine for aliphaticglucosinolate biosynthesis. The GSL.Elong QTL alters this cycle throughvariation at the MAM1, MAM2, and MAM3 genes that leads to differentialglucosinolate structure and content [32].(C) The enzymes and genetic loci controlling aliphatic glucosinolate sidechain modification within the Bay-0 3 Sha RIL population. Side-chainmodification is controlled by variation at the GSL.ALK QTL via cis-eQTLs atthe AOP2 and AOP3 genes. The Cvi and Sha accessions express AOP2 toproduce alkenyl glucosinolates. In contrast, the Ler and Bay-0 accessionsexpress AOP3 to produce hydroxyl glucosinolates. Col-0 is null for bothAOP2 and AOP3, producing only the precursor methylsulfinyl glucosino-lates [31]. The GSL.OX QTL appears to be controlled by cis-eQTLsregulating flavin-monoxygenase enzymes that oxygenate a methylthioto methylsulfinyl glucosinolate [33].doi:10.1371/journal.pgen.0030162.g001
PLoS Genetics | www.plosgenetics.org September 2007 | Volume 3 | Issue 9 | e1621688
Phenotype to eQTL Linkage
Author Summary
Natural genetic variation and the resulting phenotypic variationbetween individuals within a species have been of longstandinginterest in wide-ranging fields. However, the molecular under-pinnings of this phenotypic variation are relatively uncharted.Recently, genomics methodologies have been applied to under-standing natural genetic variation in global gene expression. This,however, did not resolve the connection between variation in geneexpression and the resulting physiological phenotype. We used twometabolic pathways within the model plant Arabidopsis to showthat it is possible to connect genomic analysis of genetic variation tothe resulting phenotype. This analysis showed that the connectionsbetween gene expression and metabolite variation were complex.Finally, the major regulators of gene expression variation for thesepathways are two biosynthetic enzymes rather than traditionaltranscription factors. This analysis provides insights into how toconnect transcriptomic and metabolomic datasets using naturalgenetic variation.

previous eQTL mapping in the Bay 3 Sha RIL populationallowed us to compare metabolite QTL and eQTL locations[17]. Comparing metabolite QTLs with network eQTLscontrolling the expression of aliphatic and indolic glucosi-nolate biosynthetic pathways indicates that all networkeQTLs colocate with metabolic QTLs, but the inversestatement is not true, as some QTLs are detected only formetabolite traits. We obtained evidence that variation inbiosynthetic enzymes and possibly transcription factors cancontrol natural variation for transcript levels of glucosinolatebiosynthetic genes. The heritability of metabolic traits was onaverage lower than that for transcript levels, suggesting thatmetabolite accumulation may be more susceptible to envi-ronmental factors. This detailed picture of glucosinolateaccumulation and modification shows that eQTLs can beassociated with changes in the resulting phenotype, allowingus to generate testable mechanistic hypotheses regarding theinterplay between expression variation and downstreamphenotypic variation.
Results
Metabolite Trait DistributionsWe measured glucosinolate production by the A. thaliana
accessions, Bayreuth (Bay-0) and Shahdara (Sha), the parentsof the Bay 3 Sha RIL population. The Bay-0 and Shaaccessions differed in both the quantity of glucosinolatesaccumulated and the specific structures synthesized, verifyingthat the Bay-0 3 Sha RIL population is potentially informa-tive for analyzing the relationship of eQTLs to metabolicvariation. The glucosinolate profile of Sha is similar to thatpreviously published for the Cape Verdi Islands (Cvi-1)accession, which forms predominantly three carbon (C3)and four carbon (C4) alkenyl glucosinolates, with high totalaliphatic glucosinolate content (Tables 1, S1, and S2) [19,30].In contrast, Bay-0 resembles Landsberg erecta (Ler), whichcontains mostly C3 hydroxy glucosinolates, with lower totalaliphatic glucosinolate content (Table 1) [19,30]. The parentalaccessions also differed in partitioning of indolic glucosino-
lates into different structures, with Bay-0 producing signifi-cantly more 4-methoxy-indol-3-ylmethyl glucosinolate (Table1).We measured the average glucosinolate content within the
Bay-0 3 Sha RILs and compared the trait distribution among403 RILs to the Bay-0 and Sha parental means (Table 1). SomeRILs accumulated two aliphatic glucosinolates (4-methylsulfi-nylbutyl [4-MSO] and 4-methylthiobutyl [4-MT]) that are notfound in the parental accessions. Transgressive segregationfor this biosynthetic capability was previously observed in theLer x Cvi RIL population and shown to result from epistasisbetween the GSL.AOP and GSL.Elong loci [6,30–32,35–37]. Inthe Sha parent, the AOP2 enzyme fully converts all 4-MSOinto but-3-enyl glucosinolate, preventing the detectableaccumulation of 4-MSO within Sha. In Bay-0, 4-MSO doesnot accumulate due to the Bay-0 allele at Elong, preventingthe formation of 4C glucosinolates. Plants containing theGSL.AOPOHP (AOP3) allele from the Bay-0 parent and theGSL.ElongC4 (MAM1) allele from Sha accumulate 4-MSO and4-MT because the AOP3 enzyme expressed by the GSL.AO-POHP allele from Bay-0 can not convert the 4-MSO precursorto hydroxyl glucosinolates (Figure 1) [31].In addition to transgressive segregation for biosynthetic
potential, there is transgressive segregation for glucosinolatelevels. For this population, the transgressive segregation forthe quantity of glucosinolates produced is almost entirelynegative, as the RIL population includes numerous linesproducing less total aliphatic glucosinolate than eitherparental accession, but no lines that accumulate averagelevels higher than the Sha parent (Table 1). This is especiallystriking for total indolic glucosinolate content, where all ofthe RILs were significantly lower than both parents. Becausethe Bay-0 and Sha parents were grown concurrently with theRILs, this is not due to environmental effects. This observa-tion of negative transgressive segregation contrasts with theLer 3 Cvi RIL population, where both positive and negativetransgressive segregation was observed, with RILs producingboth greater and lesser quantities of glucosinolates thaneither parental accession [30]. Given that the GSL.AOP and
Table 1. Variation in Aliphatic Glucosinolates within Bay-0, Sha, and the Bay-0 3 Sha RILs
Pathway Glucosinolate Abbreviation Bay-0 Sha RIL Percentile
Mean SE Mean SE 95th 5th
Aliphatic 3-hydroxypropyl 3-OHP 2.90 0.40 0.00 - 2.24 0.00
Aliphatic 4-methylsulfinylbutyl 4-MSO 0.00 - 0.00 - 0.79 0.00
Aliphatic Allyl Allyl 0.00 - 2.52 0.38 2.58 0.00
Aliphatic But-3-enyl But-3-enyl 0.00 - 6.38 1.08 4.92 0.00
Aliphatic 3-methylthiopropyl 3-MT 0.19 0.03 0.08 0.02 0.11 0.00
Aliphatic 4-methylthiobutyl 4-MT 0.00 - 0.00 - 0.36 0.00
Aliphatic 8-methylsulfinyloctyl 8-MSO 1.48 0.29 0.51 0.16 1.25 0.05
Aliphatic 8-methylthiooctyl 8-MT 0.19 0.02 0.08 0.01 0.22 0.02
Aliphatic Total aliphatic 4.71 0.69 9.56 1.53 7.03 0.77
Indolic Indol-3-ylmethyl I3M 0.64 0.10 0.69 0.10 0.52 0.10
Indolic 4-methoxy-indol-3-ylmethyl 4MO-I3M 0.26 0.03 0.08 0.01 0.20 0.05
Indolic N-methoxy-indol-3-ylmethyl NMO-I3M 0.05 0.01 0.04 0.01 0.05 0.01
Indolic Total indolic 0.95 0.13 0.81 0.11 0.65 0.22
Mean glucosinolate content in lmol cm�2 is shown for Bay-0 and Sha grown concurrently with RILs, as well as the 95th and 5th percentile values for the RILs. SE shows the standard errorof the measurement. Pathway indicates whether the glucosinolate is derived from methionine (aliphatic) or tryptophan (indolic). Total aliphatic and total indolic are the sum of all aliphaticand indolic glucosinolates, respectively.doi:10.1371/journal.pgen.0030162.t001
PLoS Genetics | www.plosgenetics.org September 2007 | Volume 3 | Issue 9 | e1621689
Phenotype to eQTL Linkage
GSL.ELONG loci are in common between both populations,this difference in transgressive segregation suggests theinfluence of additional QTLs that are not variable in bothpopulations.
HeritabilityTo compare the underlying genetics controlling metabolite
variation with variation in gene expression, we estimated theheritability of individual glucosinolate metabolic traits andtotal glucosinolate content traits, as well as transcript levelsfor glucosinolate biosynthetic genes (Figure 2 and Tables S1and S2). Heritability estimates for glucosinolate content traitswere significantly lower than the heritability of RMA (robustmultichip analysis) estimated transcript levels of theirrespective biosynthetic genes. This was true for both indolicand aliphatic glucosinolates (Figure 2). Differences in herit-ability of metabolite and expression traits could arise fromdifferences in population size used for these estimates (403lines for metabolites and 211 lines for transcript levels).However, recalculating heritabilities for the glucosinolatemetabolites using the same 211 RILs measured in the eQTLanalysis did not significantly change the values (unpublisheddata).
Aliphatic Glucosinolate QTLsAnalysis of aliphatic glucosinolate variation among the
RILs identified 11 QTLs that control either aliphaticglucosinolate content or the partitioning of aliphaticglucosinolates into particular structures (Figure 3). The QTLsaffecting the largest number of aliphatic glucosinolate traitsand causing the largest phenotypic differences were thepreviously identified GSL.AOP and GSL.Elong loci (Tables S4and S5 and Figure 1). Polymorphism at these QTLs alteredaliphatic glucosinolate content as well as derived ratio andsummation traits. The GSL.ALIPH.II.42 and GSL.ALIPH.V.66QTLs altered individual glucosinolate content and summa-tions but did not have as dramatic an affect on theglucosinolate ratios (Figures 3 and 4). In contrast, GSL.ALI-PH.I.0, GSL.ALIPH.III.10, and GSL.ALIPH.IV.48 QTLs were
more specific to the derived summation and ratio traits thanto the raw glucosinolate metabolite accumulation (Figure 3and Tables S4 and S5). For example, the GSL.ALIPH.IV.48QTL influences only 3C aliphatic glucosinolate accumulation,and the GSL.ALIPH.I.0 QTL controls ratio traits involving 4-MT and 8C glucosinolate (Figure 4 and Tables S4 and S5).These QTLs highlight the ability of derived traits to provideunique insights into metabolic variation.Mapping eQTLs controlling transcript levels for the known
aliphatic glucosinolate biosynthetic genes identified eighteQTL clusters that all coincided with aliphatic glucosinolatemetabolite QTLs (GSL.ALIPH.I.0, GSL.ALIPH.I.73, GSL.ALI-PH.II.15, GSL.ALIPH.II.42, GSL.ALIPH.III.10, GSL.AOP, GSL.E-long, and GSL.ALIPH.V.66; Figures 3 and 4 and Table S6). Twoof these eQTLs, GSL.AOP and GSL.Elong, are known to be cis-eQTLs controlling the expression of four biosynthetic genes[31]. However, these loci appear to modify in trans thetranscript levels for a broad set of aliphatic glucosinolatebiosynthetic genes. Conducting a network expression analysisusing an updated gene list for the aliphatic biosyntheticpathway showed that six of these eQTL clusters (includingGSL.AOP and GSL.Elong) were also detected using the networkmean z-score for the aliphatic glucosinolate biosynthetic genenetwork. The network mean z-score is a derived traitobtained by averaging across the aliphatic glucosinolatetranscripts within a RIL (Table S7) [18]. As the aliphaticglucosinolate transcripts are believed to participate in ahighly coregulated network, this derived trait is potentiallyinformative regarding network control [18,38,39]. These sixnetwork eQTLs appear to control transcript levels of thepathway in trans, but whether trans functionality occurs viametabolite feedback or transcriptional mechanisms remainsto be elucidated (Figure 4). The eQTLs detected in thenetwork analysis predominantly controlled biosyntheticenzymes acting early in the aliphatic glucosinolate path-way—in the elongation and core biosynthetic stages—and notthe secondary modification stages (Figures 4 and S1). Of theother three metabolite QTLs that did not show a networkeQTL, the GSL.ALIPH.I.20 QTL overlapped with a cis-eQTL
Figure 2. Estimated Heritability for Different Glucosinolate Traits
Heritability of glucosinolate traits for both the aliphatic and indolic glucosinolate pathways as estimated from 403 Bay-0 3 Sha RILs. These include theContent¼ content of individual glucosinolates, Summation¼ the summation of various glucosinolates, Ratio¼ the ratio of glucosinolates to each other,and Gene Expression ¼ the expression of glucosinolate biosynthetic genes. Heritability for Gene Expression was estimated using the RMA obtainedexpression values. Error bars show standard error of the mean.doi:10.1371/journal.pgen.0030162.g002
PLoS Genetics | www.plosgenetics.org September 2007 | Volume 3 | Issue 9 | e1621690
Phenotype to eQTL Linkage

for UGT74B1, and the other two did not coincide with lociaffecting the expression of any known biosynthetic genes.
Enzyme-Encoding Genes and Network eQTLsVariation at the side-chain–modifying GSL.AOP and GSL.E-
long loci controlled the accumulation of most metabolites andtranscripts (Figures 3 and 4). Neither locus had beenpreviously identified as impacting transcript accumulationfor the whole glucosinolate biosynthetic network. BothGSL.AOP and GSL.Elong are controlled by cis-eQTLs leadingto differential enzyme expression. As in Cvi, the Sha GSL.AOPlocus expresses the AOP2 enzyme, leading to alkenylglucosinolate production, higher glucosinolate content, andelevated transcript levels for most aliphatic glucosinolategenes (Figure 4 and 5). We used Col-0 (which is null for AOP2and AOP3) transformed with a functional AOP2 gene fromBrassica oleracea to test if the presence of functional AOP2transcript can affect both metabolite and transcript levels[40]. AOP2 from B. oleracea conducts the same reaction asAOP2 from Sha and is also associated with elevated aliphaticglucosinolate content in Brassica, allowing us to test theconservation of this locus across the two species [40,41].Introduction of a transcript encoding functional AOP2
results in the production of alkenyl glucosinolates and astatistically significant doubling of total aliphatic glucosino-late content, as is the case with the presence of a functionalAOP2 transcript contributed by the Sha allele at the GSL.AOPQTL (Figure 5). The introduction of the AOP2 transcript alsoleads to induction of 17 of 22 aliphatic glucosinolatebiosynthetic genes and three of seven regulatory genes(Figure 5). This supports the hypothesis that the Sha alleleat the GSL.AOP QTL controls metabolite and transcript levelsfor aliphatic glucosinolates due to increased expression of theAOP2 gene. This suggests the presence of a previouslyunrecognized regulatory effect of AOP2, whereby it controlstranscript accumulation for most biosynthetic genes poten-tially through transcription factors. While we could notdetect any micro-RNA signatures within the AOP2 transcriptor gene, it remains to be shown whether the metabolite andtranscript effect is due to the enzymatic activity of AOP2 or
Figure 3. QTL Summary for Aliphatic Glucosinolates
QTL position for aliphatic glucosinolate biosynthetic gene expressionestimates and aliphatic glucosinolate metabolite accumulation is shownon the x-axis with the Roman numeral representing the chromosomenumber (I–V), while the arabic numeral shows the cM position on thatchromosome. All five Arabidopsis chromosomes are representedcontiguously. Names of the QTL positions that were shown by ANOVA
to be statistically significant are included within the figure for reference.(A) The left-hand y-axis and the dotted line show the number of genes inthe aliphatic glucosinolate biosynthetic pathway (22 total) that have aneQTL at a given position as determined within QTL Cartographer. Theright-hand y-axis and solid line shows the likelihood ratio (LR) trace fordirect QTL analysis of the average transcript level across the genes forthe aliphatic glucosinolate biosynthetic pathway as estimated using themean z-score approach. The dashed and solid horizontal lines showsignificance thresholds (a ¼ 0.05) as estimated by 1,000 permutations.Breaks in lines show the end of chromosomes.(B) The QTLs for the nine aliphatic glucosinolate metabolites weremapped independently using the average across all experiments as wellas the average within each experiment. QTL positions for all indolicglucosinolate traits were then summed across experiments to identifymetabolite QTL ‘‘hotspots.’’(C) The QTLs for the 11 derived summation aliphatic glucosinolatemetabolite traits were mapped independently using the average acrossall experiments as well as the average within each experiment. QTLpositions for all indolic glucosinolate traits were then summed acrossexperiments to identify metabolite QTL ‘‘hotspots.’’(D) The QTLs for the 39 derived ratio aliphatic glucosinolate metabolitetraits were mapped independently using the average across all experi-ments as well as the average within each experiment. QTL positions forall indolic glucosinolate traits were then summed across experiments toidentify metabolite QTL ‘‘hotspots.’’doi:10.1371/journal.pgen.0030162.g003
PLoS Genetics | www.plosgenetics.org September 2007 | Volume 3 | Issue 9 | e1621691
Phenotype to eQTL Linkage

some other regulatory signature within the AOP2 transcript.The association of both GSL.AOP and GSL.Elong with eQTLsfor the majority of aliphatic glucosinolate biosynthetic genesand metabolites (Figure 4) suggests a regulatory interplaybetween the metabolites directly synthesized by theseenzymes and transcript levels for the aliphatic glucosinolatebiosynthetic genes.
Epistasis for Transcripts versus MetabolitesWe tested the identified QTLs for pairwise epistatic
interactions controlling metabolite accumulation, partition-ing, or transcript levels. This analysis identified at least onepairwise epistatic QTL interaction for all metabolites, with
variation in at least half of the metabolites controlled byinteractions between GSL.AOP, GSL.Elong, and GSL.V.66(Figure 4). The most common pairwise interaction wasdetected between GSL.AOP and GSL.Elong, controlling 7 of 9aliphatic glucosinolate metabolites (Figure 4). In contrast tothe metabolites, most expression traits did not identifyepistatic eQTL interactions. The few transcripts traits thatidentified epistatic eQTL interactions encode biosyntheticenzymes functioning in the early steps of the elongation cycle:MAM1, BCAT4, and an Aconitase. This suggests that genes inthe elongation cycle may be regulated differently from therest of the aliphatic glucosinolate pathway genes (Figures 1, 4,and S1).
Figure 4. Pathway Summary of Aliphatic Glucosinolate QTLs
Results of ANOVA testing of all identified aliphatic glucosinolate QTLs for significant impact upon the accumulation of individual glucosinolatemetabolites, transcript level of all biosynthetic genes, total aliphatic glucosinolate content, and the average expression of the aliphatic glucosinolatebiosynthetic pathway is presented graphically. The genes and metabolites are shown with respect to the currently theorized biosynthetic pathway. Traitabbreviations are as listed in Table S1. Gene names are as listed in Table S3, and TAIR locus identifiers are used for gene families where there is nosettled naming system.Cells within boxes represent aliphatic glucosinolate QTLs. The legend at the bottom right contains the QTL name. Cells representing QTLs significantlycontrolling the represented trait are colored to show the directionality of the allele substitution effect; a positive effect of the Bay-0 allele is blue, and apositive effect of the Sha allele is red. Dark red and dark blue show that the allele substitution at the given QTL led to greater than 50% phenotypicchange in the trait, while the lighter colors represent QTLs of smaller phenotypic effect. Significant epistasis between the GSL.Aliph.AOP, GSL.Aliph.Elong,and GSL.Aliph.V.66 QTLs are shown by black cross-hatching within the respectively labeled cell. For example, but-3-enyl is controlled by QTL at GSL.AOP,GSL.Elong, and GSL.I.20 with epistasis between the GSL.AOP and GSL.Elong loci. QTLs for gene expression are shown in smaller font with a smallerANOVA box, while QTLs for metabolites are shown in bold larger font with a larger box.(A) QTLs for the whole pathway broken down into individual metabolites and transcripts.(B) QTLs for total aliphatic glucosinolate content and the mean z-score for the biosynthetic pathway.doi:10.1371/journal.pgen.0030162.g004
PLoS Genetics | www.plosgenetics.org September 2007 | Volume 3 | Issue 9 | e1621692
Phenotype to eQTL Linkage

To investigate the nature of the epistatic interactionbetween GSL.AOP and GSL.Elong, we calculated mean pheno-typic values for the RILs containing each of the alleliccombinations at these two loci (Figure 6). GSL.AOP 3
GSL.Elong interaction had a negative epistatic effect on thetotal content of both aliphatic and indolic glucosinolates,with lines possessing the nonparental allelic combination ofGSL.AOPOHP from Bay-0 and GSL.ElongC4 from Sha exhibitingsignificantly lower glucosinolate content than either parent(Figure 6). Lines possessing Sha alleles at both loci had thehighest glucosinolate accumulation.
The GSL.AOP and GSL.Elong loci also control the networkexpression mean z-score for the aliphatic biosynthetic genenetwork, but did not exhibit a pairwise epistasis for this trait(Figure 4). In contrast, the genes in the methionineelongation cycle did identify an epistatic interaction between
GSL.AOP and GSL.Elong (Figure 6; BCAT4 is shown as anexample). This lack of an epistatic effect on aliphaticglucosinolate network expression is not likely a statisticalartifact, as the pattern of the group means shows a strikingdifference between aliphatic glucosinolate accumulation andnetwork expression of the aliphatic biosynthetic genes(Figure 6). Substitution of the Bay-0 GSL.ElongC3 allele forthe Sha allele in a background containing the Sha GSL.AOPAlk
allele leads to increased accumulation of aliphatic glucosino-late biosynthetic transcripts but lower aliphatic glucosinolatecontent (Figure 6). This suggests that these two loci regulateboth transcript and metabolite accumulation via distinctmechanisms.
Indolic Glucosinolate QTLsWe analyzed the indolic glucosinolate pathway as a second
test of our ability to link eQTLs altering transcript levels for
Figure 5. AOP2 Transcript Alters Metabolic Profiles, Content, and Gene Expression
Wild-type Col-0 that is null for AOP2 and AOP3 was modified through the introduction of a functional AOP2 transcript from B. oleracea. All glucosinolateabbreviations are as described in Table S1.(A) HPLC profile of aliphatic glucosinolates detected in foliar tissue of wild-type Col-0.(B) HPLC profile of aliphatic glucosinolates detected in foliar tissue of Col-0 containing the functional AOP2 transcript.(C) Average total foliar aliphatic glucosinolate content in Col-0 and Col-0::AOP2 is shown with standard error bars. Six plants per genotype weremeasured for total aliphatic glucosinolate content within an experiment, and the experiment was conducted twice to provide 32 total measurements.**p , 0.0001 as determined by ANOVA.(D) Percentage increase in transcript levels in Col-0::AOP2 as compared with Col-0 is presented. RNA from 3 plants per genotype were individuallyhybridized to ATH1 Affymetrix arrays to obtain transcript levels for the aliphatic glucosinolate genes. ANOVA was used to test for significant differencesbetween the two genotypes for the glucosinolate biosynthetic and regulatory genes via ANOVA with a false discovery rate of 0.05. Gray bars showtranscripts significantly increased by the introduction of the AOP2 transcript. Nonsignificant changes are shown in white bars.doi:10.1371/journal.pgen.0030162.g005
PLoS Genetics | www.plosgenetics.org September 2007 | Volume 3 | Issue 9 | e1621693
Phenotype to eQTL Linkage

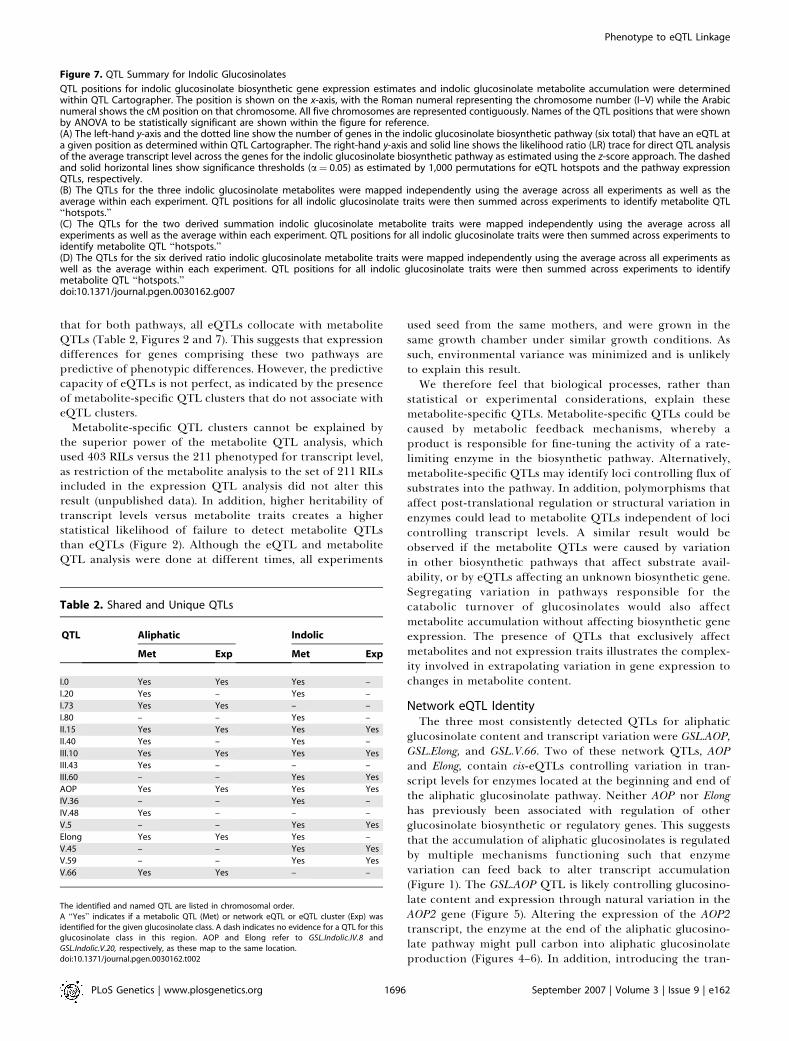
biosynthetic genes with metabolite accumulation QTLs. Atotal of 13 QTLs were identified that control the accumu-lation of indolic glucosinolates, their partitioning intoparticular structures, or both (Figure 7 and Table S8). Theseloci affect one or more of the indolic glucosinolate traits inthis population, with the directionality of allelic effectsmixed, so that Bay-0 alleles at some loci increase trait values
while the Bay-0 alleles at other loci decrease the metabolitetrait values (Table S8). Interestingly, the GSL.INDOLIC.IV.8and GSL.INDOLIC.V.20 QTLs map to the same genomiclocations as the previously known GSL.AOP and GSL.ELONGloci, which control aliphatic glucosinolate variation. Trans-genic analysis confirmed that simulating the Sha GSL.AOPallele by introducing the AOP2 gene into a null backgroundincreases total indolic glucosinolate content by about 30% (p¼ 0.035). This shows that variation at GSL.AOP affects indolicglucosinolate metabolism and that there is cross-talk betweenthe pathways for indolic and aliphatic glucosinolate produc-tion.Testing the identified indolic metabolite QTLs for pairwise
epistatic interactions identified numerous epistatic interac-tions affecting indolic glucosinolate accumulation. Notably,the GSL.INDOLIC.II.15 QTL was detected as epistaticallyinteracting with five other QTLs (GSL.INDOLIC.III.7, GSL.IN-DOLIC.III3.60, GSL.INDOLIC.IV4.36, GSL.INDOLIC.V.45, andGSL.INDOLIC.V.59; Table S8). These epistatic interactionsaffect the partitioning of the indolic glucosinolates into twodistinct methoxylated derivatives without significantly alter-ing the total indolic glucosinolate content. GSL.INDOLIC.II.15might encode or regulate enzymes responsible for thismethoxylation (Table S8). A regulation hypothesis is sup-ported by the fact that the GSL.INDOLIC.II.15 region containsa massive trans-acting eQTL that influences transcript levelsfor more than 5,000 genes [17].Analysis of eQTLs controlling transcript levels of individ-
ual indolic glucosinolate biosynthetic genes identified foureQTL clusters (GSL.INDOLIC.III.60, GSL.INDOLIC.IV.8,GSL.INDOLIC.V.45, and GSL.INDOLIC.V.59; Figure 7 andTables S6 and S7). Because the indolic glucosinolatebiosynthetic genes are also believed to be coregulated, weestimated pathway expression mean z-value to map networkQTLs. This identified the same four loci, plus three additionalQTLs affecting expression of the indolic gene network(GSL.INDOLIC.II.15, GSL.INDOLIC.III.7, and GSL.INDO-LIC.V.5). All three of these network-specific eQTLs colocal-ized with metabolite QTLs, supporting the ability of the z-scale network approach to derive biological information. Allseven eQTLs colocalize with loci that control either theaccumulation or partitioning of the indolic glucosinolatesproduced by these genes. This suggests that the eQTLscontrolling transcript levels for the indolic glucosinolatebiosynthetic genes also affect variation in their metaboliteproducts. Again, it remains to be tested whether the QTLsprimarily affect transcript levels, causing downstream metab-olite effects, or if the polymorphisms first affect themetabolites, influencing transcript levels through some formof feedback. There are also indolic metabolite QTLs, such asGSL.INDOLIC.IV.36, with no detectable impact on geneexpression traits.
Discussion
We used the Arabidopsis aliphatic and indolic glucosinolatebiosynthetic pathways to test our ability to link QTLscontrolling metabolic and expression polymorphisms. Thesemetabolic pathways are well characterized with near com-plete identification of most biosynthetic enzymes and genes,as well as detailed quantitative genetic analysis [25,27]. Adirect comparison of metabolite QTL and eQTL maps reveals
Figure 6. AOP and Elong Epistasis
The Bay-0 3 Sha RILs were grouped by their GSL.AOP and GSL.Elonggenotypes. The mean (6 standard error) for each group is presented for:(A) Mean z-score for the aliphatic glucosinolate biosynthetic pathway.(B) Transcript level for the BCAT4 gene.(C) Total aliphatic glucosinolate content.(D) Total indolic glucosinolate content.doi:10.1371/journal.pgen.0030162.g006
PLoS Genetics | www.plosgenetics.org September 2007 | Volume 3 | Issue 9 | e1621694
Phenotype to eQTL Linkage

PLoS Genetics | www.plosgenetics.org September 2007 | Volume 3 | Issue 9 | e1621695
Phenotype to eQTL Linkage
that for both pathways, all eQTLs collocate with metaboliteQTLs (Table 2, Figures 2 and 7). This suggests that expressiondifferences for genes comprising these two pathways arepredictive of phenotypic differences. However, the predictivecapacity of eQTLs is not perfect, as indicated by the presenceof metabolite-specific QTL clusters that do not associate witheQTL clusters.
Metabolite-specific QTL clusters cannot be explained bythe superior power of the metabolite QTL analysis, whichused 403 RILs versus the 211 phenotyped for transcript level,as restriction of the metabolite analysis to the set of 211 RILsincluded in the expression QTL analysis did not alter thisresult (unpublished data). In addition, higher heritability oftranscript levels versus metabolite traits creates a higherstatistical likelihood of failure to detect metabolite QTLsthan eQTLs (Figure 2). Although the eQTL and metaboliteQTL analysis were done at different times, all experiments
used seed from the same mothers, and were grown in thesame growth chamber under similar growth conditions. Assuch, environmental variance was minimized and is unlikelyto explain this result.We therefore feel that biological processes, rather than
statistical or experimental considerations, explain thesemetabolite-specific QTLs. Metabolite-specific QTLs could becaused by metabolic feedback mechanisms, whereby aproduct is responsible for fine-tuning the activity of a rate-limiting enzyme in the biosynthetic pathway. Alternatively,metabolite-specific QTLs may identify loci controlling flux ofsubstrates into the pathway. In addition, polymorphisms thataffect post-translational regulation or structural variation inenzymes could lead to metabolite QTLs independent of locicontrolling transcript levels. A similar result would beobserved if the metabolite QTLs were caused by variationin other biosynthetic pathways that affect substrate avail-ability, or by eQTLs affecting an unknown biosynthetic gene.Segregating variation in pathways responsible for thecatabolic turnover of glucosinolates would also affectmetabolite accumulation without affecting biosynthetic geneexpression. The presence of QTLs that exclusively affectmetabolites and not expression traits illustrates the complex-ity involved in extrapolating variation in gene expression tochanges in metabolite content.
Network eQTL IdentityThe three most consistently detected QTLs for aliphatic
glucosinolate content and transcript variation were GSL.AOP,GSL.Elong, and GSL.V.66. Two of these network QTLs, AOPand Elong, contain cis-eQTLs controlling variation in tran-script levels for enzymes located at the beginning and end ofthe aliphatic glucosinolate pathway. Neither AOP nor Elonghas previously been associated with regulation of otherglucosinolate biosynthetic or regulatory genes. This suggeststhat the accumulation of aliphatic glucosinolates is regulatedby multiple mechanisms functioning such that enzymevariation can feed back to alter transcript accumulation(Figure 1). The GSL.AOP QTL is likely controlling glucosino-late content and expression through natural variation in theAOP2 gene (Figure 5). Altering the expression of the AOP2transcript, the enzyme at the end of the aliphatic glucosino-late pathway might pull carbon into aliphatic glucosinolateproduction (Figures 4–6). In addition, introducing the tran-
Table 2. Shared and Unique QTLs
QTL Aliphatic Indolic
Met Exp Met Exp
I.0 Yes Yes Yes –
I.20 Yes – Yes –
I.73 Yes Yes – –
I.80 – – Yes –
II.15 Yes Yes Yes Yes
II.40 Yes – Yes –
III.10 Yes Yes Yes Yes
III.43 Yes – – –
III.60 – – Yes Yes
AOP Yes Yes Yes Yes
IV.36 – – Yes –
IV.48 Yes – – –
V.5 – – Yes Yes
Elong Yes Yes Yes –
V.45 – – Yes Yes
V.59 – – Yes Yes
V.66 Yes Yes – –
The identified and named QTL are listed in chromosomal order.A ‘‘Yes’’ indicates if a metabolic QTL (Met) or network eQTL or eQTL cluster (Exp) wasidentified for the given glucosinolate class. A dash indicates no evidence for a QTL for thisglucosinolate class in this region. AOP and Elong refer to GSL.Indolic.IV.8 andGSL.Indolic.V.20, respectively, as these map to the same location.doi:10.1371/journal.pgen.0030162.t002
Figure 7. QTL Summary for Indolic Glucosinolates
QTL positions for indolic glucosinolate biosynthetic gene expression estimates and indolic glucosinolate metabolite accumulation were determinedwithin QTL Cartographer. The position is shown on the x-axis, with the Roman numeral representing the chromosome number (I–V) while the Arabicnumeral shows the cM position on that chromosome. All five chromosomes are represented contiguously. Names of the QTL positions that were shownby ANOVA to be statistically significant are shown within the figure for reference.(A) The left-hand y-axis and the dotted line show the number of genes in the indolic glucosinolate biosynthetic pathway (six total) that have an eQTL ata given position as determined within QTL Cartographer. The right-hand y-axis and solid line shows the likelihood ratio (LR) trace for direct QTL analysisof the average transcript level across the genes for the indolic glucosinolate biosynthetic pathway as estimated using the z-score approach. The dashedand solid horizontal lines show significance thresholds (a¼ 0.05) as estimated by 1,000 permutations for eQTL hotspots and the pathway expressionQTLs, respectively.(B) The QTLs for the three indolic glucosinolate metabolites were mapped independently using the average across all experiments as well as theaverage within each experiment. QTL positions for all indolic glucosinolate traits were then summed across experiments to identify metabolite QTL‘‘hotspots.’’(C) The QTLs for the two derived summation indolic glucosinolate metabolite traits were mapped independently using the average across allexperiments as well as the average within each experiment. QTL positions for all indolic glucosinolate traits were then summed across experiments toidentify metabolite QTL ‘‘hotspots.’’(D) The QTLs for the six derived ratio indolic glucosinolate metabolite traits were mapped independently using the average across all experiments aswell as the average within each experiment. QTL positions for all indolic glucosinolate traits were then summed across experiments to identifymetabolite QTL ‘‘hotspots.’’doi:10.1371/journal.pgen.0030162.g007
PLoS Genetics | www.plosgenetics.org September 2007 | Volume 3 | Issue 9 | e1621696
Phenotype to eQTL Linkage

script for AOP2 increases transcript level for the aliphaticbiosynthetic pathway, suggesting that regulation also occursby control of gene expression and potentially metabolicfluxes through the beginning of the aliphatic glucosinolatepathway (Figures 5 and 6). It is possible that a metaboliteproduced by or used by the AOP2 enzyme may have thecapacity to regulate transcript accumulation for the rest ofthe biosynthetic network through feedback. Direct regulationof transcript accumulation by metabolites has been noted fora variety of riboswitches [42–45].
For the GSL.Elong network QTLs, the comparison of eQTLsto metabolite QTLs suggests that variation in transcript levelsfor at least two biosynthetic genes (MAM1 and MAM3) atGSL.Elong directly causes metabolic variation, and that thisbiosynthetic variation may alter transcript regulation fornearly the entire biosynthetic pathway. Specifically, lines thatcontain 4C glucosinolates have lower transcript levels foralmost all biosynthetic genes. One possibility is that ametabolic intermediate produced in the GSL.Elong4C back-ground negatively regulates gene expression. Alternatively,both the GSL.AOP and GSL.Elong loci could possess tightlylinked second loci that cause the observed transcriptionalpolymorphisms and also interact epistatically. Testing theinteraction between biosynthetic loci and transcript levelswill require careful genetic manipulation with full tran-scriptome analysis.
Comparing the remaining network eQTLs to candidateglucosinolate transcriptional regulators shows that theGSL.ALIPH.V.66 QTL overlaps the physical position of theMYB28 transcription factor, which has a large-effect cis-eQTL[17,39]. Likewise, the GSL.INDOLIC.V.45 and GSL.INDO-LIC.V.59 QTLs overlap the physical position of the indolictranscription factors, ATR1 and ATR2, and both genes havecis-eQTLs [17,29,46]. This suggests that these three QTLs maybe explained by variation in the expression of these knownregulatory genes. In addition, the GSL.ALIPH.I.0 and GSL.A-LIPH.III.10 QTLs overlap with the physical position for thealiphatic glucosinolate transcriptional regulators AtDOF1.1and IQD1, respectively [28,47]. Neither gene exhibits a cis-eQTL, suggesting that if these genes are responsible forGSL.ALIPH.I.0 and GSL.ALIPH.III.10 QTLs, it is potentiallydue to an activity polymorphism. Alternatively, small changesin transcript levels for these transcription factors might leadto large changes in network regulation (Figure S1).
The GSL.ALIPH.II.15 QTL, a major network eQTL fortranscript levels for both aliphatic and indolic glucosinolatepathways, does not overlap any known biosynthetic orregulatory genes. This locus does colocalize with a massiveeQTL cluster controlling the expression of several thousandgenes [17]. This suggests that this region may be highlypleiotropic and its effects on glucosinolate content may beindirect. These results suggest that eQTLs can controlmetabolite production through a variety of direct andindirect regulatory mechanisms.
cis-eQTLs and QTLs for Specific MetabolitesWhile most eQTLs co-located with QTL clusters control-
ling several metabolites, there were also instances in which astatistically significant association between expression andmetabolic phenotypes was limited to one or few metabolictraits. For example, SGT74B1 catalyzes glycosylation of thecharacteristic glucosinolate backbone structure, and its
expression is controlled by a single eQTL at GSL.ALIPH.I20[48]. This large-effect cis-eQTL maps to a 100-kb interval thatincludes the physical position of SGT74B1. While we mightpredict that variation in the expression of SGT74B1 wouldinfluence production of multiple aliphatic glucosinolates, thislocus was only identified as controlling one metabolic trait,the accumulation of but-3-enyl glucosinolate. This gene is notspecific to the synthesis of but-3-enyl glucosinolate, asprevious work has demonstrated that SGT74B1 has a broadbiochemical capacity to glucosylate glucosinolates [48].Instead, the lack of detected effects in this study for thiseQTL on the accumulation of other glucosinolates is likelybecause genotypes accumulating but-3-enyl glucosinolate alsoexhibit the highest level of total aliphatic glucosinolateswithin this population (Table 1). This suggests that theSGT74B1 expression polymorphism is only limiting when fluxacross the biosynthetic pathway is maximized. Consequently,unexpected factors directly related to biochemical pathwayconnectivity and flux can interfere with our ability to directlyassociate eQTLs for biosynthetic genes with specific metab-olite QTLs. As such, eQTLs are not predictive in all contexts.
QTL CausalityThis comparative analysis of eQTLs to metabolic QTLs has
provided novel insights, including the identification of theenzymes AOP2 and MAM1 as well as the transcription factorMYB28 as potential regulators of transcript accumulation forthe complete aliphatic glucosinolate biosynthetic pathway. Inaddition, differential expression of the ATR1 and ATR2transcription factors have been implicated as the underlyingcause of QTLs controlling the indolic glucosinolate pathway.Data presented in this study validate the potential of theenzyme AOP2 to control aliphatic glucosinolate gene ex-pression. The other regulatory roles hypothesized aboveremain to be verified. Identification and validation of themolecular causes of the 17 different QTLs identified in thisstudy will require a complex mixture of experiments rangingfrom transgenic complementation to validate the gene,promoter swaps to validate the difference in gene expression,and recombination mapping to more precisely identify thecausal polymorphism [49].
Trait Heritability and EpistasisFor glucosinolates and their biosynthetic genes, we
observed significant differences between the estimatedheritability of metabolite accumulation and transcript levels,respectively (Figure 2). Expression traits had consistentlyhigher broad sense heritability than the accumulation ofindividual metabolites or metabolite summation traits.Because genetically identical individuals were used for bothexperiments, there is no difference in the amount ofgenotype variation available to transcript and metabolitetraits. Thus, environmental inputs may affect metabolic traitsmore strongly than transcripts. The mechanistic link betweensequence polymorphism and variation in transcript levelsmay have fewer intervening processes than a causal sequencepolymorphism and metabolic variation. The presence ofadditional regulatory processes, both metabolic and post-transcriptional, may allow greater environmental heteroge-neity effects on metabolite accumulation. It is also possiblethat the results obtained for the glucosinolate pathway arenot indicative of typical transcript or metabolite heritability.
PLoS Genetics | www.plosgenetics.org September 2007 | Volume 3 | Issue 9 | e1621697
Phenotype to eQTL Linkage

There is evidence that glucosinolate production is underdiverse selection pressures, favoring high levels of plasticity inglucosinolate accumulation mediated by environmentalstimuli such as nutrient and water availability and wounding[50–52]. This would require that metabolite traits beinfluenced by subtle environmental heterogeneity, leadingto reduced estimates of their heritability. It is thereforeimportant to expand this analysis to other metabolic path-ways to determine the extent to which these conclusions aregeneralizable.
We also observed that metabolic traits identified signifi-cantly more epistasic interactions than the correspondingtranscripts. Regulatory processes that occur between tran-script accumulation and metabolite accumulation, e.g.,metabolic feedback, post-transcriptional regulation, andenzyme activity regulation, may increase regulatory interac-tions between loci, leading to metabolite traits showing higherlevels of epistasis. The constant adjustment of metabolite fluxthrough complex networks may also enhance the potential forepistasis. This finding may be specific to the glucosinolatesystem. A broader metabolomics analysis in comparison toeQTLs for all known enzymatic loci will be required to testwhether these differences in heritability and epistasis are ageneral feature of transcriptomic and metabolomic networks.If this is the case, a detailed modeling approach maycontribute to understanding differences in genetic architec-ture between metabolic and transcript networks.
ConclusionIn this report, we show that it is possible to relate natural
variation at the transcript and metabolite levels for twoglucosinolate biosynthetic networks. Furthermore, this anal-ysis shows that the comparison of eQTLs to metabolite QTLswithin an a priori–defined framework can identify complexregulatory mechanisms whereby variation in enzymes ormetabolites may feed back to alter transcript accumulation.For aliphatic glucosinolates, the beginning and end of thebiosynthetic pathway interact to control the whole pathway.These feedback associations can lead to the rapid generationof new hypotheses about the regulation of biosyntheticnetworks, but also show that the de novo reconstruction ofbiosynthetic relationships from metabolite data will requiregreat care. In all cases, variation in gene expression alsoaffected the resultant metabolites, although extrapolating theeffects of gene expression on metabolism requires cautiondue to interplay of biochemical mechanisms. Combiningdifferent genomics datasets will greatly expand our ability tounderstand both the regulation of metabolism and therelationship between transcription and metabolism.
Materials and Methods
Mapping populations. The Bay 3 Sha population of 403 A. thalianaRILs [53] was used to map QTLs controlling individual and totalglucosinolate content for both the aliphatic and indolic glucosino-lates. The QTL on Chromosome V for total content of aliphaticglucosinolates in the August 2005 experiment is also presentedelsewhere for clarity (Sonderby, Hansen, Halkier, and Kliebenstein,unpublished data). Further, 211 of these lines have been analyzed forvariation in gene expression and used to map QTLs controllingtranscript levels [17,18], allowing comparison of QTLs controllingmetabolite accumulation with transcript levels for the underlyingbiosynthetic genes.
Plant growth conditions. Seeds were imbibed and cold-stratified at4 8C for 3 d to break dormancy. Two complete plantings were grown
simultaneously in neighboring growth chambers to provide inde-pendent biological replicates for each experiment. The full experi-ment was replicated three times between March of 2004 and Augustof 2005, providing six glucosinolate measurements for most lines,totaling nearly 2,600 measurements. The replicates were labeled May2004, May 2005, and August 2005. For the May 2005 and August 2005experiments, plants were grown in flats with 36 cells per flat, andmaintained under short-day conditions in controlled environmentgrowth chambers. For the May 2004 experiment, plants were grownin flats with 96 cells per flat, and maintained under short-dayconditions in controlled environment growth chambers. Using thesame growth chambers, similar growth conditions, and assayingglucosinolate content at the same developmental stage analyzed inthe eQTL mapping experiment maximizes our ability to compare themetabolic QTL results with eQTLs for the biosynthetic genes [17,18].At 35 days after germination, a fully expanded mature leaf washarvested, digitally photographed, and analyzed for glucosinolatecontent as described below at the same age as the plants used foreQTL analysis [17,18].
Analysis of glucosinolate content. The glucosinolate content ofexcised leaves was measured using a previously described high-throughput analytical system [30,54]. Briefly, one leaf was removedfrom each plant, digitally photographed, and placed in a 96-wellmicrotiter plate with 500 lL of 90% methanol and one 3.8-mmstainless steel ball-bearing. Tissue was homogenized for 5 min in apaint shaker, centrifuged, and the supernatant was then transferredto a 96-well filter plate with 50 lL of DEAE sephadex. The sephadex-bound glucosinolates were eluted by incubation with sulfatase.Individual desulfo-glucosinolates within each sample were separatedand detected by high-performance liquid chromatography (HPLC)–diode-array detection, and identified and quantified by comparisonto purified standards. Tissue area for each leaf was digitally measuredusing Image J with scale objects included in each digital image [55].The glucosinolate traits are reported per square centimeter of leafarea. There was no significant variation detected for leaf densitywithin these lines (unpublished data).
In addition to the content of individual glucosinolates, wedeveloped a series of summation and ratio traits based on priorknowledge of the glucosinolate pathways (Table S1) [56]. For instance,the content of 3-MT, 3-MSO, 3-OHP, and allyl glucosinolates weresummed (sum3C) to provide an estimate of the content of 3Caliphatic glucosinolates within these lines (Figure 1C and Table S1).This enables the detection of QTLs that specifically alter 3Cglucosinolate accumulation irrespective of specific side-chain mod-ification. The ratio traits were created to measure the efficiency ofpartitioning a class of glucosinolates into particular structures. Forexample, the ratio allyl glucosinolate to total 3C aliphatic glucosino-lates (all_r3) allows discrimination of the efficiency of production of3C alkenyl glucosinolates independent of the accumulation of 3Cglucosinolates (Figure 1C and Table S1). These ratios and summationtraits allow us to isolate the effects of variation at individual steps ofglucosinolate biosynthesis from variation affecting the rest of thebiosynthetic pathway [56].
For each glucosinolate trait, we determined the average value perRIL per experiment for QTL mapping. Because there was nosignificant difference in the variance of the traits between theexperiments, we also calculated the average value per RIL across allthree experiments for all traits (Table S2). Heritability of eachglucosinolate trait was estimated using the general linear modelprocedure within SAS (http://www.sas.com) where broad senseheritability was defined as r2
g/r2p (Table S1), where r2
g is theestimated genetic variance for the metabolite among differentgenotypes in this sample of RILs, and r2
p is the estimated phenotypicvariance for the metabolite [2].
Analysis of gene expression QTL. We used previously publishedbiochemical and coexpression data to identify all known or predictedgenes encoding glucosinolate biosynthetic enzymes [27,31,38,57,58].For these purposes, the indolic and aliphatic glucosinolate pathwaysare considered to be independent biosynthetic processes. Thisappears to reflect the biological reality, as the two pathways usedifferent genes and amino acid precursors [25,27]. Gene families wereseparated into genes involved in aliphatic or indolic glucosinolatepathways based on biochemical or phenotypic data where possible[59–61]. Where this was not possible, coexpression with the knownindolic or aliphatic glucosinolate genes was combined with publishedbiochemistry to separate gene family members into their respectivepathways [38]. This generated a list of genes involved in aliphatic andindolic glucosinolate biosynthesis (Table S3).
Heritability, eQTL position, eQTL effect, and transcript levels forindividual transcripts were obtained using the RMA estimated
PLoS Genetics | www.plosgenetics.org September 2007 | Volume 3 | Issue 9 | e1621698
Phenotype to eQTL Linkage

expression values from the previously published analysis of geneexpression in the Bay 3 Sha population [17]. To conduct networkexpression analysis, transcript levels for each biosynthetic genewithin each RIL were standardized as z-scores. This is done by takingthe transcript level for a gene within a RIL, subtracting the meantranscript level for that gene among the RILs, then dividing theresulting value by the standard deviation for that transcript amongthe RILs [18]. The mean z-score for the aliphatic and indolicglucosinolate biosynthetic genes was calculated within each RIL foreach replicate [18]. This pathway mean z-score per RIL per replicatewas then used to estimate heritability of the aliphatic and indolicglucosinolate pathway gene expression as described for the metab-olites. The mean z-score per RIL across replicates was calculated andused to map QTLs controlling transcript levels of the aliphatic andindolic glucosinolate biosynthetic pathways (Table S4). Because theseglobal transcription studies were conducted in the same mappingpopulation grown under the similar conditions and in the samegrowth chambers, it was possible to compare the expression andmetabolite data.
QTL analysis. The Bay 3 Sha RIL population has been previouslygenotyped [53], and additional markers were obtained from theexpression QTL analysis [62] as well as markers specific for theGSL.AOP and GSL.Elong loci [6,30]. To maximize our ability to detectall possible QTLs, we used the averages from each experiment, May2004, May 2005, and August 2005, as well as the average across allexperiments to conduct four QTL mapping tests. This was done forall individual glucosinolate traits, summation traits, and ratio traits(Table S1).
The four averages for each trait were independently used for QTLmapping within Windows QTL Cartographer v2.5 (http://statgen.ncsu.edu/qtlcart/WQTLCart.htm) [63–65]. Composite interval mappingwas implemented using Zmap (Model 6 within Windows QTLCartographer v2.5) with a 10-cM window and an interval mappingincrement of 2 cM. Forward regression was used to identify fivecofactors per quantitative trait. The declaration of statisticallysignificant QTLs is based on permutation-derived empirical thresh-olds using 1,000 permutations for each trait mapped [66,67]. The Eqtlmodule of QTL Cartographer was used to automatically identify thelocation of each significant QTL for each trait from each experimentand the whole experiment average (Tables S5–S7) [65]. Compositeinterval mapping with permutations to assign significance using theunderlying trait distribution is fairly robust at handling normal ornear-normal traits as found for most of our traits [68]. In addition, alldata from the three different experiments were used in the multi-trait composite interval algorithm within QTL Cartographer v2.5.
QTL clusters were identified by using the QTL summationapproach, where the position of each QTL for each trait for eachexperiment is indicated by a 1, and the number of traits controlled bya QTL at a given position is totaled [18]. This summation wasconducted using four groups: Group I, all aliphatic glucosinolatemetabolite traits; Group II, all eQTLs for aliphatic glucosinolatebiosynthetic genes; Group III, all indolic glucosinolate metabolitetraits; and Group IV, all eQTLs for indolic glucosinolate biosyntheticgenes. These QTL clusters identified a set of defined genetic positionsthat were then named respective to their position and whether theyaffected aliphatic or indolic glucosinolate content (Tables S5–S7).The QTLs at the previously characterized and cloned AOP and Elongloci were named as such [30–32,69].
To further validate each QTL identified and query for potentialepistasis, we conducted an analysis of variance (ANOVA) using allexperiments. For each trait, the markers most closely associated witheach significant main-effect QTL for that trait were used as maineffect cofactors. In addition, experiment (May 2004, May 2005, andAugust 2005) was used as a main effect cofactor. An automated SASscript was then developed to directly test all main effects as well as allpossible pairwise interactions, including experiment 3 marker(QTL)and marker(QTL) 3 marker(QTL) interactions. Significance valueswere corrected for multiple testing within a model using falsediscovery rate (, 0.05) in the automated script. The script returnedall significance values as well as QTL main-effect estimates in terms ofallelic substitution values (Tables S5–S7). No significant three-wayinteractions were identified.
AOP2 analysis. Two independent homozygous lines containingfunctionally expressed AOP2 transcript from B. oleracea expressedfrom a 35S promoter were obtained in the Col-0 background that isnull for AOP2 and AOP3 [31,40]. These two lines were grown in arandomized block design with wild-type Col-0 and tested by HPLCfor glucosinolate content and by ATH1 Affymetrix microarrays(http://www.affymetrix.com) for altered transcript levels [17,18]. Fortotal aliphatic glucosinolate content, six individual plants per line
were measured and ANOVA used to test for altered glucosinolateaccumulation. The complete experiment was conducted twice. Asthere was no difference between the independent transgenic lines,this factor was removed from the model. From each experiment, twoindependent RNA samples from Col-0 and two independent RNAsamples from Col-0::AOP2 were obtained and hybridized with ATH1Affymetrix microarrays as described [17,18]. Transcript levels for thegenes involved in aliphatic glucosinolate biosynthesis (Table S3) wereobtained and used in a targeted ANOVA testing the effect of theAOP2 transgene. p-values were tested for significance against a falsediscovery rate of 0.05 using this subset of genes [70].
Supporting Information
Figure S1. Gene Family and Transcription Factor eQTLs for theAliphatic Glucosinolates
QTL position information for the FMOs, aconitases, and putativeglucosinolate regulatory factors are presented as described in Figure 3.
Found at doi:10.1371/journal.pgen.0030162.sg001 (1.2 M TIF).
Table S1.Heritability of Glucosinolate Variation within the Bay3ShaRILs
For all traits, ANOVA was conducted to test for the effect of variationbetween the RILs (Line), Experiment, Flat within an Experiment(Rep(Exp)) and an interaction between Line and Experiment. The p-values, sums of squares, and percent of total variance are presented.
Found at doi:10.1371/journal.pgen.0030162.st001 (38 KB XLS).
Table S2. Mean Values for Glucosinolate Traits in Each RIL
The mean value and standard deviation for each trait as measuredwithin the described experiments is provided. Trait abbreviations areas listed in Table S1. All glucosinolate values are in lmol mg�1. Linerepresents the specific Bay 3 Sha RIL and N is the number ofmeasurements obtained for this RIL.
Found at doi:10.1371/journal.pgen.0030162.st002 (841 KB XLS).
Table S3. Gene lists for Glucosinolate Pathway Genes
The genes defined as being involved in glucosinolate biosynthesis arepresented along with their pathway. Functional Proof indicateswhether the gene has been experimentally validated as playing a rolein glucosinolate production or if the function is predicted.
Found at doi:10.1371/journal.pgen.0030162.st003 (29 KB XLS).
Table S4. Metabolic QTLs for Aliphatic Glucosinolate Traits
The average trait value per RIL across experiments along with thetrait value per RIL for each individual experiment was used for QTLmapping; the presence of a QTL in a specific experiment is shownunder ‘‘QTL Detection in Given Experiment.’’ The MT QTL columnshows the complete results from the multitrait composite intervalmapping within QTL Cartographer. M means that the QTL wasidentified as a main effect, while I means that it had an experimentspecific interaction, and MI shows that it was found with both mainand interaction effects using multitrait composite interval mapping.The data from each experiment were used to conduct ANOVA to testeach QTL using the nearest marker as the main effect, withsignificance presented under ‘‘Main Effect’’ column. For eachmarker/QTL, the model tested for a QTL 3 Experiment interaction,‘‘Exp Interaction.’’ The model tested all pairwise marker 3 markerinteractions for evidence of epistasis. The significance of eachpairwise test is presented under the columns marked ‘‘Pairwiseassessment of Epistasis.’’ Finally, the model was used to estimate theallele substitution effect of each locus as shown. NS representsnonsignificant results within this model.
Found at doi:10.1371/journal.pgen.0030162.st004 (53 KB XLS).
Table S5. QTLs for Aliphatic Glucosinolate Summation Traits
QTLs detected for each aliphatic summation glucosinolate trait arepresented as a separate table. The average trait value per RIL acrossexperiments along with the trait value per RIL for each individualexperiment was used for QTL mapping; the presence of a QTL in aspecific experiment is shown under ‘‘QTL Detection in GivenExperiment.’’ The MT QTL column shows the complete results fromthe multitrait composite interval mapping within QTL Cartographer.M means that the QTL was identified as a main effect, while I meansthat it had an experiment specific interaction, and MI shows that itwas found with both main and interaction effects using multitraitcomposite interval mapping. The data from each experiment were
PLoS Genetics | www.plosgenetics.org September 2007 | Volume 3 | Issue 9 | e1621699
Phenotype to eQTL Linkage

used to test each QTL using the nearest marker as main effect, withsignificance determined by this ANOVA presented under the ‘‘MainEffect’’ column. For each marker/QTL, the same model tested for aQTL 3 Experiment interaction, ‘‘Exp Interaction.’’ This model alsotested all pairwise marker 3 marker interactions for evidence ofepistasis. The significance of each pairwise test is presented under thecolumns marked ‘‘Pairwise assessment of Epistasis.’’ Finally, themodel estimated the allele substitution effect of each locus. For allcells, NS represents nonsignificance within the model.
Found at doi:10.1371/journal.pgen.0030162.st005 (50 KB XLS).
Table S6. eQTL for Glucosinolate Biosynthetic Genes
Significant eQTLs previously detected for each glucosinolate bio-synthetic gene. The genetic position in chromosome and cM ispresented along with the genes’ identities. In addition, the additiveeffect of the Bay-0 allele at each eQTL is provided.
Found at doi:10.1371/journal.pgen.0030162.st006 (31 KB XLS).
Table S7. Average Gene Network Expression (z-Score)The mean z-score for each RIL for the aliphatic glucosinolate andindolic glucosinolate biosynthetic pathways are presented for the 211RILs where there are available data.
Found at doi:10.1371/journal.pgen.0030162.st007 (27 KB XLS).
Table S8. Metabolic QTLs for Indolic Glucosinolate Traits
QTLs detected for each indolic glucosinolate trait are presented as aseparate table. The average trait value per RIL across experimentsalong with the trait value per RIL for each individual experiment wasused for QTL mapping, and the presence of a QTL in a specificexperiment is shown under ‘‘QTL Detection in Given Experiment.’’The MT QTL column shows the complete results from the multitraitcomposite interval mapping within QTL Cartographer. M means thatthe QTL was identified as a main effect, while I means that it had anexperiment specific interaction, and MI shows that it was found withboth main and interaction effects using multitrait composite intervalmapping. The data from each experiment were used within an
ANOVA to test each QTL using the nearest marker as main effect;significance is presented under the ‘‘Main Effect’’ column. For eachmarker/QTL, the same model tested for a QTL 3 Experimentinteraction, ‘‘Exp Interaction.’’ Finally, the same model tested allpairwise marker 3 marker interactions for evidence of epistasis. Thesignificance of each pairwise test is presented under the columnsmarked ‘‘Pairwise assessment of Epistasis.’’ Finally, the model wasused to estimate the allele substitution effect of each locus as shown.For all cells, NS represents nonsignificance within the model.
Found at doi:10.1371/journal.pgen.0030162.st008 (32 KB XLS).
Accession Numbers
The microarray dataset used in this study has been deposited atEuropean Bioinformatics Institute ArrayExpress (http://www.ebi.ac.uk/arrayexpress) under numbers E-TABM-126 and E-TABM-224. Allgene identifiers are listed in Table S3.
Acknowledgments
We would like to thank Steffen Abel, Katherine Denby, Dina St. Clair,and Olivier Loudet for useful discussions and manuscript reviews.The Danish National Research Foundation is acknowledged for itssupport to PlaCe (Center for Molecular Plant Physiology). Forsker-skole for Bioteknologi (FOBI) graduate school is thanked for the PhDstipend to BGH.
Author contributions. HCR and DJK conceived and designed theexperiments. HCR and DJK performed the experiments. HCR, BGH,BAH, and DJK analyzed the data. BGH, CT, BAH, and DJKcontributed reagents/materials/analysis tools. AMW, HCR, BGH,BAH, and DJK wrote the paper.
Funding. Funding for this project was obtained by NationalScience Foundation grants DBI 0642481 and MCB 0323759 to DJK.
Competing interests. The authors have declared that no competinginterests exist.
References1. Lynch M, Walsh B (1998) Genetics and analysis of quantitative traits.
Sunderland (Massachusetts): Sinauer Associates, Inc. 980 p.2. Falconer DS, Mackay TFC (1996) Introduction to quantitative genetics.
Essex (United Kingdom): Longman, Harlow. 340 p.3. Liu BH (1998) Statistical genomics: Linkage, mapping and QTL analysis.
Boca Raton (Florida): CRC Press. 611 p.4. Symonds VV, Godoy AV, Alconada T, Botto JF, Juenger TE, et al. (2005)
Mapping quantitative trait loci in multiple populations of Arabidopsisthaliana identifies natural allelic variation for trichome density. Genetics169: 1649–1658.
5. Keurentjes JB, Fu J, de Vos CH, Lommen A, Hall RD, et al. (2006) Thegenetics of plant metabolism. Nat Genet 38: 842–849.
6. Kliebenstein DJ, Pedersen D, Mitchell-Olds T (2002) Comparative analysisof insect resistance QTL and QTL controlling the myrosinase/glucosinolatesystem in Arabidopsis thaliana. Genetics 161: 325–332.
7. Yagil C, Barkalifa R, Sapojnikov M, Wechsler A, Ben-Dor D, et al. (2007)Metabolic and genomic dissection of diabetes in the Cohen rat. PhysiolGenomics. 29: 181–192.
8. Anderson JR, Schneider JR, Grimstad PR, Severson DW (2006) Identifica-tion of quantitative trait loci for larval morphological traits in interspecifichybrids of Ochlerotatus triseriatus and Ochlerotatus hendersoni (Diptera:Culicidae). Genetica 127: 163–175.
9. Lexer C, Rosenthal DM, Raymond O, Donovan LA, Rieseberg LH (2005)Genetics of species differences in the wild annual sunflowers, Helianthusannuus and H. petiolaris. Genetics 169: 2225–2239.
10. Hoffmann AA, Weeks AR (2007) Climatic selection on genes and traits aftera 100 year-old invasion: A critical look at the temperate-tropical clines inDrosophila melanogaster from eastern Australia. Genetica 129: 133–147.
11. Doerge RW (2002) Mapping and analysis of quantitative trait loci inexperimental populations. Nat Rev Genet 3: 43–52.
12. Jansen RC, Nap JP (2001) Genetical genomics: The added value fromsegregation. Trends Genet 17: 388–391.
13. Schadt EE, Monks SA, Drake TA, Lusis AJ, Che N, et al. (2003) Genetics ofgene expression surveyed in maize, mouse and man. Nature 422: 297–302.
14. Brem RB, Yvert G, Clinton R, Kruglyak L (2002) Genetic dissection oftranscriptional regulation in budding yeast. Science 296: 752–755.
15. Morley M, Molony CM, Weber TM, Devlin JL, Ewens KG, et al. (2004)Genetic analysis of genome-wide variation in human gene expression.Nature 430: 743–747.
16. Keurentjes JJB, Fu JY, Terpstra IR, Garcia JM, van den Ackerveken G, et al.(2007) Regulatory network construction in Arabidopsis by using genome-
wide gene expression quantitative trait loci. Proc Nat Acad Sci U S A 104:1708–1713.
17. West MAL, Kim K, Kliebenstein DJ, van Leeuwen H, Michelmore RW, et al.(2007) Global eQTL mapping reveals the complex genetic architecture oftranscript level variation in Arabidopsis. Genetics 175: 1441–1450.
18. Kliebenstein D, West M, van Leeuwen H, Loudet O, Doerge R, et al. (2006)Identification of QTLs controlling gene expression networks defined apriori. BMC Bioinformatics 7: 308.
19. Kliebenstein DJ, Kroymann J, Brown P, Figuth A, Pedersen D, et al. (2001)Genetic control of natural variation in Arabidopsis thaliana glucosinolateaccumulation. Plant Physiol 126: 811–825.
20. McMullen MD, Byrne PF, Snook ME, Wiseman BR, Lee EA, et al. (1998)Quantitative trait loci and metabolic pathways. Proc Nat Acad Sci U S A 95:1996–2000.
21. Fiehn O (2001) Combining genomics, metabolome analysis, and biochem-ical modelling to understand metabolic networks. Comp Funct Genomics 2:155–168.
22. Weckwerth W, Loureiro ME, Wenzel K, Fiehn O (2004) Differentialmetabolic networks unravel the effects of silent plant phenotypes. ProcNat Acad Sci U S A 101: 7809–7814.
23. Sauer U, Lasko DR, Fiaux J, Hochuli M, Glaser R, et al. (1999) Metabolic fluxratio analysis of genetic and environmental modulations of Escherichia colicentral carbon metabolism. J Bacteriol 181: 6679–6688.
24. Wittstock U, Halkier BA (2002) Glucosinolate research in the Arabidopsisera. Trends Plant Sci 7: 263–270.
25. Kliebenstein DJ, Kroymann J, Mitchell-Olds T (2005) The glucosinolate-myrosinase system in an ecological and evolutionary context. Curr OpPlant Bio 8: 264–271.
26. Grubb CD, Abel S (2006) Glucosinolate metabolism and its control. TrendsPlant Sci 11: 89–100.
27. Halkier BA, Gershenzon J (2006) Biology and biochemistry of glucosino-lates. Ann Rev Plant Bio 57: 303–333.
28. Levy M, Wang QM, Kaspi R, Parrella MP, Abel S (2005) Arabidopsis IQD1, anovel calmodulin-binding nuclear protein, stimulates glucosinolate accu-mulation and plant defense. Plant J 43: 79–96.
29. Celenza JL, Quiel JA, Smolen GA, Merrikh H, Silvestro AR, et al. (2005) TheArabidopsis ATR1 Myb transcription factor controls indolic glucosinolatehomeostasis. Plant Physiol 137: 253–262.
30. Kliebenstein DJ, Gershenzon J, Mitchell-Olds T (2001) Comparativequantitative trait loci mapping of aliphatic, indolic and benzylicglucosinolate production in Arabidopsis thaliana leaves and seeds. Genetics159: 359–370.
31. Kliebenstein D, Lambrix V, Reichelt M, Gershenzon J, Mitchell-Olds T
PLoS Genetics | www.plosgenetics.org September 2007 | Volume 3 | Issue 9 | e1621700
Phenotype to eQTL Linkage

(2001) Gene duplication and the diversification of secondary metabolism:Side chain modification of glucosinolates in Arabidopsis thaliana. Plant Cell13: 681–693.
32. Kroymann J, Donnerhacke S, Schnabelrauch D, Mitchell-Olds T (2003)Evolutionary dynamics of an Arabidopsis insect resistance quantitative traitlocus. Proc Nat Acad Sci U S A 100: 14587–14592.
33. Hansen BG, Kliebenstein DJ, Halkier BA (2007) Identification of a flavin-monooxygenase as the S-oxygenating enzyme in aliphatic glucosinolatebiosynthesis in Arabidopsis. Plant J 50: 902–910.
34. Kliebenstein DJ, Figuth A, Mitchell-Olds T (2002) Genetic architecture ofplastic methyl jasmonate responses in Arabidopsis thaliana. Genetics 161:1685–1696.
35. Textor S, Bartram S, Kroymann J, Falk KL, Hick A, et al. (2004) Biosynthesisof methionine-derived glucosinolates in Arabidopsis thaliana: Recombinantexpression and characterization of methylthioalkylmalate synthase, thecondensing enzyme of the chain-elongation cycle. Planta 218: 1026–1035.
36. de Quiros HC, Magrath R, McCallum D, Kroymann J, Schnabelrauch D, etal. (2000) a-Keto acid elongation and glucosinolate biosynthesis inArabidopsis thaliana. Theor Appl Genet 101: 429–437.
37. Keurentjes JJB, Fu JY, de Vos CHR, Lommen A, Hall RD, et al. (2006) Thegenetics of plant metabolism. Nat Genet 38: 842–849.
38. Hirai MY, Klein M, Fujikawa Y, Yano M, Goodenowe DB, et al. (2005)Elucidation of gene-to-gene and metabolite-to-gene networks in Arabidopsisby integration of metabolomics and transcriptomics. J Biol Chem 280:25590–25595.
39. Hirai M, Sugiyama K, Sawada Y, Tohge T, Obayashi T, et al. (2007) Omics-based identification of Arabidopsis Myb transcription factors regulatingaliphatic glucosinolate biosynthesis. Proc Nat Acad Sci U S A 104: 6478–6483.
40. Li G, Quiros CF (2003) In planta side-chain glucosinolate modification inArabidopsis by introduction of dioxygenase Brassica homolog BoGSL-ALK.Theor Appl Genet 106: 1116–1121.
41. Mithen R, Clarke J, Lister C, Dean C (1995) Genetics of aliphaticglucosinolates. III. Side-chain structure of aliphatic glucosinolates inArabidopsis thaliana. Heredity 74: 210–215.
42. Nudler E, Mironov AS (2004) The riboswitch control of bacterialmetabolism. Trends Biochem Sci 29: 11–17.
43. Montange RK, Batey RT (2006) Structure of the S-adenosylmethionineriboswitch regulatory mRNA element. Nature 441: 1172–1175.
44. Nudler E (2006) Flipping riboswitches. Cell 126: 19–22.45. Cheah MT, Wachter A, Sudarsan N, Breaker RR (2007) Control of
alternative RNA splicing and gene expression by eukaryotic riboswitches.Nature 447: 497–500.
46. Smolen GA, Pawlowski L, Wilensky SE, Bender J (2002) Dominant alleles ofthe basic helix-loop-helix transcription factor ATR2 activate stress-responsive genes in Arabidopsis. Genetics 161: 1235–1246.
47. Skirycz A, Reichelt M, Burow M, Birkemeyer C, Rolcik J, et al. (2006) DOFtranscription factor AtDof1.1 (OBP2) is part of a regulatory networkcontrolling glucosinolate biosynthesis in Arabidopsis. Plant J 47: 10–24.
48. Grubb CD, Zipp BJ, Ludwig-Muller J, Masuno MN, Molinski TF, et al. (2004)Arabidopsis glucosyltransferase UGT74B1 functions in glucosinolate biosyn-thesis and auxin homeostasis. Plant J 40: 893–908.
49. Mackay TFC (2001) The genetic architecture of quantitative traits. Ann RevGenet 35: 303–339.
50. Clauss MJ, Dietel S, Schubert G, Mitchell-Olds T (2006) Glucosinolate andtrichome defenses in a natural Arabidopsis lyrata population. J Chem Ecol 32:2351–2373.
51. Benderoth M, Textor S, Windsor AJ, Mitchell-Olds T, Gershenzon J, et al.(2006) Positive selection driving diversification in plant secondarymetabolism. Proc Natl Acad Sci U S A 103: 9118–9123.
52. Windsor AJ, Reichelt M, Figuth A, Svatos A, Kroymann J, et al. (2005)Geographic and evolutionary diversification of glucosinolates among nearrelatives of Arabidopsis thaliana (Brassicaceae). Phytochem 66: 1321–1333.
53. Loudet O, Chaillou S, Camilleri C, Bouchez D, Daniel-Vedele F (2002) Bay-03 Shahdara recombinant inbred line population: A powerful tool for thegenetic dissection of complex traits in Arabidopsis. Theor Appl Genet 104:1173–1184.
54. Kliebenstein DJ, Rowe HC, Denby KJ (2005) Secondary metabolitesinfluence Arabidopsis/Botrytis interactions: Variation in host productionand pathogen sensitivity. Plant J 44: 25–36.
55. Abramoff MD, Magelhaes PJ, Ram SJ (2004) Image processing with ImageJ.Biophotonics Intl 11: 36–42.
56. Kliebenstein DJ (2007) Metabolomics and plant quantitative trait locusanalysis—The optimum genetical genomics platform? In: Nikolau BJ,Wurtele ES, editors. Concepts in plant metabolomics. Dordrect (theNetherlands): Springer. pp. 29–45.
57. Schuster J, Knill T, Reichelt M, Gershenzon J, Binder S (2006) BRANCHED-CHAIN AMINOTRANSFERASE4 is part of the chain elongation pathway inthe biosynthesis of methionine-derived glucosinolates in Arabidopsis. PlantCell 18: 2664–2679.
58. Gachon CMM, Langlois-Meurinne M, Henry Y, Saindrenan P (2005)Transcriptional co-regulation of secondary metabolism enzymes inArabidopsis: Functional and evolutionary implications. Plant Mol Biol 58:229–245.
59. Klein M, Reichelt M, Gershenzon J, Papenbrock J (2006) The threedesulfoglucosinolate sulfotransferase proteins in Arabidopsis have differentsubstrate specificities and are differentially expressed. FEBS J 273: 122–136.
60. Hansen CH, Du LC, Naur P, Olsen CE, Axelsen KB, et al. (2001) CYP83B1 isthe oxime-metabolizing enzyme in the glucosinolate pathway in Arabidopsis.J Biol Chem 276: 24790–24796.
61. Bak S, Nielsen HL, Halkier BA (1998) The presence of CYP79 homologuesin glucosinolate-producing plants shows evolutionary conservation of theenzymes in the conversion of amino acid to aldoxime in the biosynthesis ofcyanogenic glucosides and glucosinolates. Plant Mol Biol 38: 725–734.
62. West MAL, van Leeuwen H, Kozik A, Kliebenstein DJ, Doerge RW, et al.(2006) High-density haplotyping with microarray-based expression andsingle feature polymorphism markers in Arabidopsis. Genome Res 16: 787–795.
63. Zeng ZB, Kao CH, Basten CJ (1999) Estimating the genetic architecture ofquantitative traits. Gen Res 75: 345–355.
64. Basten CJ, Weir BS, Zeng ZB (1999) QTL Cartographer, version 1.13.Department of Statistics, North Carolina State University, Raleigh, NC[computer program]. Available at: http://statgen.ncsu.edu/qtlcart/WQTLCart.htm. Accessed 10 January 2001.
65. Wang S, Basten CJ, Zeng ZB (2006) Windows QTL Cartographer 2.5.Department of Statistics, North Carolina State University, Raleigh, NCAvailable at: http://statgen.ncsu.edu/qtlcart/WQTLCart.htm. Accessed 10January 2006.
66. Churchill GA, Doerge RW (1994) Empirical threshold values for quantita-tive trait mapping. Genetics 138: 963–971.
67. Doerge RW, Churchill GA (1996) Permutation tests for multiple lociaffecting a quantitative character. Genetics 142: 285–294.
68. Rebai A (1997) Comparison of methods for regression interval mapping inQTL analysis with non-normal traits. Genet Rec 69: 69–74.
69. Magrath R, Bano F, Morgner M, Parkin I, Sharpe A, et al. (1994) Genetics ofaliphatic glucosinolates. I. Side chain elongation in Brassica napus andArabidopsis thaliana. Heredity 72: 290–299.
70. Benjamini Y, Hochberg Y (1995) Controlling the false discovery rate—Apractical and powerful approach to multiple testing. J Royal Stat Soc SeriesB Methodol 57: 289–300.
PLoS Genetics | www.plosgenetics.org September 2007 | Volume 3 | Issue 9 | e1621701
Phenotype to eQTL Linkage
Copyright © 2022 FDOKUMEN