Genetic mapping and QTL analysis for sugar yield-related traits in sugarcane
21
Genetic mapping and QTL analysis for sugar yield-related traits in sugarcane Ram Kushal Singh • Sujeet Pratap Singh • Dinesh Kumar Tiwari • Shraddha Srivastava • Surendra Bahadur Singh • Mukut Lal Sharma • Rakesh Singh • Trilochan Mohapatra • Nagendra Kumar Singh Received: 17 June 2012 / Accepted: 17 November 2012 / Published online: 16 December 2012 Ó Springer Science+Business Media Dordrecht 2012 Abstract Genetic improvement of sugar content in sugarcane would benefit from the availability of sufficient DNA markers and a genetic map. Genetic linkage maps were constructed to identify quantitative trait loci (QTLs) for seedling brix (SB), brix (B), sucrose percent in juice (SUC), stalk number (SN), stalk length (SL), stalk diameter (SD), internodes (INT), number of green leaves (NGL), at three crop cycles across seven environments in a segregating population with 207 individuals derived from a bi- parental cross of sugarcane elite cultivars. Linkage analysis led to the construction of eight linkage groups (LGs) for Co86011 and sixteen LGs for CoH70. The combined length of the two linkage maps was 2606.77 cM distributed over 24 LGs. 31 QTLs were identified: 2 for SB, 7 for B, 6 for SUC, 4 for SN, 1 for SL, 3 for SD, 6 for INT and 2 for NGL at LOD scores ranging from 2.69 to 4.75. 7 QTLs (22 %) had stable effect across crop year and locations. Markers from parents were found to be associated with both positive and negative effect on all of the traits analyzed. The most important QTLs intervals identified in this study using single-dose marker, were qB2, qSUC2, qINT2 and qB2, qSUC2, qSL2, qINT2 located between SSR markers UGSM31 548 and UGSM31 649 . These QTLs could be put into use in marker assisted breeding. Keywords Sugarcane Simple sequence repeats Quantitative trait loci Linkage map Introduction Sugarcane (Saccharum spp.) is not only important for sugar production, but also it is used as raw material for paper, alcohol, plywood, industrial enzymes, and animal feed (Arencibia 1998). The genetics of modern sugarcane cultivars (Saccharum spp. hybrids) is very complex, due to their highly heterozygous and com- plex aneuploid nature. This has also led to the presence of a variable number of chromosomes (2n = 100–140) in the cultivars belonging to the two ancestral genomes (Piperidis and D’Hont 2001). Improving sugar content in sugarcane is highly attractive from a commercial perspective, since higher sucrose content in the stalks increases revenue without an associated increase in cane production, transport, and milling costs. An understanding of the relationship between sugar R. K. Singh (&) S. P. Singh D. K. Tiwari S. Srivastava S. B. Singh M. L. Sharma Centre for Sugarcane Biotechnology, Sugarcane Research Institute, (UP Council of Sugarcane Research), Shahjahanpur 242001, UP, India e-mail: [email protected] R. Singh National Research Centre for DNA Fingerprinting, NBPGR, New Delhi 110012, India T. Mohapatra N. K. Singh National Research Centre on Plant Biotechnology, IARI, New Delhi 110012, India 123 Euphytica (2013) 191:333–353 DOI 10.1007/s10681-012-0841-7
Transcript of Genetic mapping and QTL analysis for sugar yield-related traits in sugarcane
Genetic mapping and QTL analysis for sugar yield-relatedtraits in sugarcane
Ram Kushal Singh • Sujeet Pratap Singh • Dinesh Kumar Tiwari •
Shraddha Srivastava • Surendra Bahadur Singh • Mukut Lal Sharma •
Rakesh Singh • Trilochan Mohapatra • Nagendra Kumar Singh
Received: 17 June 2012 / Accepted: 17 November 2012 / Published online: 16 December 2012
� Springer Science+Business Media Dordrecht 2012
Abstract Genetic improvement of sugar content in
sugarcane would benefit from the availability of
sufficient DNA markers and a genetic map. Genetic
linkage maps were constructed to identify quantitative
trait loci (QTLs) for seedling brix (SB), brix (B),
sucrose percent in juice (SUC), stalk number (SN),
stalk length (SL), stalk diameter (SD), internodes
(INT), number of green leaves (NGL), at three crop
cycles across seven environments in a segregating
population with 207 individuals derived from a bi-
parental cross of sugarcane elite cultivars. Linkage
analysis led to the construction of eight linkage groups
(LGs) for Co86011 and sixteen LGs for CoH70. The
combined length of the two linkage maps was
2606.77 cM distributed over 24 LGs. 31 QTLs were
identified: 2 for SB, 7 for B, 6 for SUC, 4 for SN, 1 for
SL, 3 for SD, 6 for INT and 2 for NGL at LOD scores
ranging from 2.69 to 4.75. 7 QTLs (22 %) had stable
effect across crop year and locations. Markers from
parents were found to be associated with both positive
and negative effect on all of the traits analyzed. The
most important QTLs intervals identified in this study
using single-dose marker, were qB2, qSUC2, qINT2
and qB2, qSUC2, qSL2, qINT2 located between SSR
markers UGSM31548 and UGSM31649. These QTLs
could be put into use in marker assisted breeding.
Keywords Sugarcane � Simple sequence repeats �Quantitative trait loci � Linkage map
Introduction
Sugarcane (Saccharum spp.) is not only important for
sugar production, but also it is used as raw material for
paper, alcohol, plywood, industrial enzymes, and
animal feed (Arencibia 1998). The genetics of modern
sugarcane cultivars (Saccharum spp. hybrids) is very
complex, due to their highly heterozygous and com-
plex aneuploid nature. This has also led to the presence
of a variable number of chromosomes (2n = 100–140)
in the cultivars belonging to the two ancestral genomes
(Piperidis and D’Hont 2001). Improving sugar content
in sugarcane is highly attractive from a commercial
perspective, since higher sucrose content in the stalks
increases revenue without an associated increase in
cane production, transport, and milling costs. An
understanding of the relationship between sugar
R. K. Singh (&) � S. P. Singh � D. K. Tiwari �S. Srivastava � S. B. Singh � M. L. Sharma
Centre for Sugarcane Biotechnology, Sugarcane Research
Institute, (UP Council of Sugarcane Research),
Shahjahanpur 242001, UP, India
e-mail: [email protected]
R. Singh
National Research Centre for DNA Fingerprinting,
NBPGR, New Delhi 110012, India
T. Mohapatra � N. K. Singh
National Research Centre on Plant Biotechnology,
IARI, New Delhi 110012, India
123
Euphytica (2013) 191:333–353
DOI 10.1007/s10681-012-0841-7
content and yield-related traits in different cane-
growing environments would help to enhance the
efficiency of selection for sugar yield. A high priority is
therefore placed on improving sugar content in Florida
sugarcane breeding program. Lingle et al. (2009)
concluded that recurrent selection for sucrose content
in sugarcane has altered the allocation of photosynth-
ates from growth to storage in the internodes. A plateau
for cane yield was detected since the early 1970s;
however there was no evidence of a plateau for sugar
content in the sugarcane breeding programs (Edme
et al. 2005).
Several studies have shown genetic correlations
between sugar content and brix % juice, from com-
paring early with late sugar accumulation in the stalks
(Singh and Singh 1994, 1998, 2000; Jackson 2005).
There have been a number of studies on DNA marker-
trait associations in sugarcane, but due to the complex
ploidy structure, a limited number of markers were
generated which resulted in poor genome map cover-
age (Piperidis et al. 2008). Another problem associ-
ated with sugarcane is the occurrence of multiple
alleles which segregate at key loci governing the sugar
traits (Pinto et al. 2010). Therefore, individual QTL
effects may be quite small compared with those
detected in diploid species, especially for traits that
have been selected for several generations (Ming et al.
2002).
Molecular markers have been used to develop
genetic maps in sugarcane to improve our understand-
ing of the genome structure, to locate genes of
agronomic importance and to identify quantitative
trait loci (QTL) associated with such traits in order to
facilitate marker-assisted selection (Aitken et al. 2008;
Pinto et al. 2010). QTL mapping can improve our
understanding of the relationship among the genes
influencing sugar content and can facilitate determin-
istic manipulation of these traits towards development
of an elite sugarcane variety (Paterson 1996). Molec-
ular markers can play a pivotal role in tracking
favorable alleles from wild species and in ascertaining
their introgression into the cultivated background
(Edme et al. 2006).
Better understanding of genotype-by-environment
(G 9 E) interactions is expected to provide a solid
foundation for genetic improvement of crop produc-
tivity. To overcome this problem, huge trials have to
be conducted across years and environments to
identify the most suitable genotypes. The productivity
of sugarcane clones varies from one location to
another, indicating the presence of an environment
effect. The importance of G 9 E interaction is a
widely recognized phenomenon in sugarcane clonal
selection trials (Kang et al. 1987; Jackson and Hogarth
1992; Kimbeng et al. 2002; Tiwari et al. 2011). The
main difficulty in QTL mapping and its stability is that
several genetic and environmental factors affect the
final phenotype expression. Thus the experimental
design utilized for this must involve measurements
and genotyping of a large number of segregating
genotypes in order to allow the necessary precision for
QTL identification (Paterson 1998).
Among the DNA marker systems available, micro-
satellite or simple sequence repeats (SSRs) are the
most widely used for plant genome analysis (Morgante
and Olivieri 1993). These markers are characterized
by their simplicity, abundance, co-dominance and
multiple alleles among genomes (Varshney et al.
2005). SSRs are ideal for genetic fingerprinting and
construction of linkage maps because they are ran-
domly distributed across the genome. Recent studies
have revealed that gene transcripts also contain SSRs
and the abundance of Expressed Sequence Tag (ESTs)
in the databases has become an attractive source of
microsatellite markers (Cordeiro et al. 2001; Parida
et al. 2009). Moreover, their presence in conserved
transcribed regions makes them valuable in a breeding
program (Singh et al. 2011).
Due to polyploidy, the development of a high-
density genetic map for sugarcane requires much more
work than for a diploid species. The estimation of
genetic linkage maps in sugarcane on track after the
development of single-dose markers (SDMs) (Wu
et al. 1992). In a bi-parental mapping population, an
SDM has either a single copy of an allele in one parent
only segregating in 1:1 (presence: absence) or a single
copy of the same allele in both parents segregating in
3:1 (presence: absence). For higher polyploids with
irregular chromosome pairing, the loci showing either
a 1:1 or a 3:1 segregation pattern are much more
informative for genetic map construction than those
showing more complex segregation pattern (Wu et al.
2002). Based on this method, partial genetic maps
have been produced for S. spontaneum (Aljanabi et al.
1993; da Silva et al. 1993, 1995; Ming et al. 1998),
S. officinarum (Mudge et al. 1996; Guimaraes et al.
1999; Aitken et al. 2006), interspecific hybrids
(Daugrois et al. 1996; Ming et al. 2001; Alwala et al.
334 Euphytica (2013) 191:333–353
123
2009) and modern cultivars of sugarcane (Hoarau et al.
2002; Edme et al. 2006; Garcia et al. 2006; Raboin
et al. 2006; Oliveira et al. 2007; Alwala et al. 2008;
Pastina et al. 2012). The earliest molecular linkage
maps of the progenitors of modern sugarcane were
developed for S. spontaneum using 216 RFLP markers
(da Silva et al. 1993) and 279 RAPD markers
(Aljanabi et al. 1993), for S. officinarum using RAPD
(Mudge et al. 1996) and in cultivated sugarcane are
using 408 RFLP markers (Grivet et al. 1996). AFLP
markers have been used to construct genetic linkage
maps of a commercial sugarcane cultivar R 570, using
1185 loci (Hoarau et al. 2001); Q165 using 1365 loci
(Aitken et al. 2005); LCP 85-384 using 1111 loci
(Andru et al. 2011) and an interspecific cross of
S. officinarum and S. spontaneum using 344 loci
(Alwala et al. 2008). Edme et al. 2006 developed a
S. spontaneum/S. officinarum map using 193 microsat-
ellite (SSR) loci. However, coverage of the genomes
surveyed in these maps is still incomplete. Hence,
enriching the existing sugarcane linkage maps with
more SSR markers is a valuable objective for the
sugarcane breeding community. Past reports on QTL
analysis of sucrose content in sugarcane have used
populations derived from crosses with S. spontaneum
(Ming et al. 2001, 2002), commercial cultivars (Pastina
et al. 2012) and arising from self pollination of a clone
(Grivet et al. 1996; Hoarau et al. 2002; Aitken et al.
2005). While such studies provide useful information,
they do differ from the practice normally used to
generate commercial cultivars in the breeding
programs.
The objective of this study was to take advantage of
the large number of recently published SSR markers
for Saccharum species (Parida et al. 2009, 2010) and
construct a genetic map of sugarcane. Also, to map the
QTLs control sugar yield-related traits in three loca-
tions and two consecutive crop years with 207
segregating population of a bi-parental cross involving
a high and a low-sugar commercial cultivars.
Materials and methods
Mapping population
The mapping population was derived from a bi-parental
cross involving a commercial sugarcane variety
(Co86011) as female parent, having genes for earliness,
high sugar content and low cane yield and CoH70 as the
male parent, having genes for low sugar content, high
cane yield and tolerance to a wide range of biotic/abiotic
stresses. The F1 population was comprised of 857
genotypes of which, 207 were randomly chosen for
mapping. The seedlings were transplanted in June 2005
at the Sugarcane Research Institute (SRI), Shahjahan-
pur, 90 cm apart and at a row-to-row distance of
100 cm. The parents (Co86011 and CoH70) were used
to validate the amplification and polymorphism of the
markers. The same population and parents were clonally
propagated in two 5 m long rows in the C1 (first clonal
multiplication) in 2007 and C2 (second clonal multipli-
cation) stages in 2008 at three locations, namely
Shahjahanpur, (Longitude 79�370E and latitude
27�350N) in sandy loam soil at the Sugarcane Research
Station (SRS) Sultanpur, (Longitude 82�040E and
Latitude 26�160N) on a loam soil, and at Balrampur,
(Longitude 82�150E and Latitude 27�250N) on a lateritic
soil on March 2006 and 2007. Phenotyping for all traits
were completed on each plot at plant cane on January
2007 in C1 and January 2008 in C2 clonal multiplication
trails at all three locations.
Phenotyping and field data analysis
The mapping population and two parents were
phenotyped for sugar content and yield-related traits.
Brix (B) measurements, taken as a measure of sugar
content in the seedling and C1 and C2 stages across
locations, were coded as SB and B respectively.
Sucrose percent in juice (SUC) was measured at the
Shahjahanpur location in both the C1 and C2 stages. In
addition, data on stalk number (SN), stalk length
(SL), stalk diameter (SD), number of internodes
(INT), internode length (INTL), number of green
leaves (NGL) and leaf length (LL) were recorded on
each individual plot during January at all three
locations in both C1 and C2 stages. SUC was
estimated by polarization (pol value; grams of sucrose
per 100 g of fresh cane) on January, 2007 and 2008.
Brix was measured in November with a hand-held
refractometer on the juice of a sampling punch taken
at half-height of the stalk. Five randomly chosen
stalks were used to estimate B, SB and SN. Five stalks
per plot were chosen at random to evaluate SL, SD,
INT, INTL, NGL and LL. The SL was measured from
ground level to the last visible dewlap. SD and INTL
were measured at mid-length of the stalk.
Euphytica (2013) 191:333–353 335
123
Phenotypic data from each trial were analyzed for
QTL 9 E by using C1 as replication 1 and C2 as
replication 2 at each location. The same set of
segregating population with 207 individuals recorded
on markers is evaluated phenotypically in different
environments. The statistical design was laid out as an
augmented randomized complete block design with
two replications. Genotypes were planted in seven
blocks with 30 each in six blocks and 27 individuals in
7th block. Each group of individuals was augmented
by four standards (commercial cultivars CoS95255,
CoS96268, CoSe92423 and Co1148). Both parents
were also included in one of the groups, but not
considered in the analysis. The analysis of variance
and correlations among traits was performed by the
Multi QTL software. The essence of analysis of
variance is to compare variability within groups versus
variability among different groups, using the ratio of
the F-statistics. Analysis of variance (ANOVA) was
made in 6 trials with 2 replications (C1 2007-rep1 and
C2 2008-rep2) at three locations. For ANOVA,
partitioning of the total sum of squares (SST), is
achieved by calculating sums of squared differences
(i) between individual replicates and their group mean
and between group means and the overall sample
mean (SSA, the among-group sum of squares).The
phenotypic variance and the error variance obtained
from the analysis of variance were used to estimate the
broad sense heritability for each trait. The traits
processed were: (i) sugar-related traits: SB, B, SUC
and (ii) yield-related traits: SN, SL, SD, INT, INTL,
NGL and LL.
DNA extraction and genotyping
For genomic DNA extraction, disease-free, whorl and
young-immature leaves were collected from the SRI
farm at Shahjahanpur. The samples were freeze-dried
and then stored at -86�C. Genomic DNA was
extracted from 500 mg of lyophilized powder of
young leaf tissue using the CTAB method (Hoisington
et al. 1994), with minor modification for sugarcane.
Six types of SSR markers, viz. unigenes-derived
Saccharum microsatellites (UGSM), sugarcane enriched-
genomic microsatellites (SEGM), EST-derived micro-
satellites (STMS) from the public domain, sugarcane
microsatellite (SMS), sugarcane genomic microsatellite
(SGM) and sugarcane cDNA microsatellites (SCM) were
used for genotyping the parents and the 207 segregating
F1 clones. SMS and STMS referred to the primer
developed by Mohapatra et al. (2003). Five hundred and
seventy-six of the SSR markers used for parental
polymorphism survey were developed at the National
Research Centre on Plant Biotechnology, Indian Agri-
cultural Research Institute, in New Delhi, India under a
collaborative project involving SRI, Shahjahanpur and
Sugarcane Breeding Institute, Coimbatore. PCR reactions
were carried out in 10 ll volume containing 25 ng of
template DNA, 1.0 ll each of forward and reverse
primers, 100 mM of dNTPs, 0.5 U of Taq DNA
polymerase, 1.0 ll of 109 PCR buffer and 2.5 mM of
MgCl2. Amplifications were performed in a Peltier
thermal cycler (MJ Research) with initial denaturation
at 94 �C for 5 min followed by 25 cycles of denaturation
at 94 �C for 1 min, annealing at (50–58 �C) for 1 min
and extension at 72 �C for 2 min; a final extension at
72 �C for 7 min was added to the program. The amplified
products were stored at 4 �C until electrophoresis, which
was done within 7.5 % denaturing polyacrylamide gel in
0.59 TBE buffer. Bands were visualized by staining with
0.5 lg/ml ethidium bromide. Gel photographs were
taken under UV light using the Gel Doc system by
Alpha Innotech.
Marker analysis and annotation
All unambiguously segregating bands in the mapping
population were scored independently as a dominant
marker, and assigned A if present exclusively in one
parent and B if present exclusively in the other parent.
Since sugarcane is highly poly-aneuploid, markers in
pseudo test-cross configurations between the parents
(1:1 segregation) and heterozygous in both parents
(3:1 segregation) were used for map construction (Wu
et al. 2002). Each marker was tested against its
expected ratio using v2 tests. Single-dose markers are
present only once in the genome, either in a 1:1 ratio
(markers present once in one parental genome) or in a
3:1 ratio (marker present in both parents). All loci with
strong deviations from expected proportions were
discarded after Bonferroni correction. Five hundred
and seventy-six SSR primer pairs, including 72 STMS,
20 SMS, 210 UGSM (class I type), 192 SEGM (class I
type), 50 SGM (class I type) and 32 SCM primers were
used for screening of the parents and two bulks of 20
F1 individuals with of high and low sugar content from
the mapping population in order to determine poly-
morphism levels.
336 Euphytica (2013) 191:333–353
123
Map construction
The linkage map from the cross Co86011 9 CoH70 was
constructed using MultiPoint software (www.multiqtl.
com). The male (CoH70) and the female (Co86011)
maps were constructed in two steps. An initial map was
made with the 1:1 markers. The bi-parental simplex 3:1
markers were then included and mapped to the first
matrix of 1:1 markers 9 207 genotypes. This approach
gives approximate locations for the bi-parental simplex
3:1 markers. The pseudo test-cross population setting
was selected and a maximum threshold recombination
fraction (rfs) value of 0.35 was used to initially group the
markers into clusters. The polymorphic bands were tes-
ted for 1:1 and 3:1 segregation ratios using v2 analysis at
p \ 0.01 after Bonferonni correction. Chi square tests
were performed using 1:1 and 3:1 segregating markers to
further confirm the mode of segregation in the two par-
ents based on a 5 % label of significance (da Silva et al.
1993). Markers within each linkage group (LG) were
then order by multipoint analysis using Kosambi map-
ping function. Multipoint linkage analysis of loci within
each cluster was then performed and marker order was
further verified through re-sampling for quality control
via jack-knifing (Mester et al. 2003; Ritter et al. 2008;
Parh et al. 2008). Markers that could be ordered with a
jack-knife value of 90 % or greater were included as
‘framework’ markers and any remaining markers caus-
ing unstable neighborhoods were initially excluded from
the map. Following a repeated multipoint linkage anal-
ysis with the reduced set of markers from each cluster to
achieve a stabilized neighborhood, the previously
excluded markers were attached by assigning them to the
best intervals on the framework map. The map was
constructed after deleting 0 cM distance and high v2
values ([10.0) with a LOD threshold[3.0 and an rfs of
0.35. Distances between markers in cM were estimated
using Kosambi function (Kosambi 1944). Marker names
and map distances (cM) are indicated on the left and right
sides of each linkage group, respectively.
QTL mapping
QTL mapping was carried out by using Composite
Interval Mapping (CIM). The main advantage of CIM is
that it is more precise and effective at mapping QTLs
compared to single-point analysis and interval mapping,
especially when linked QTLs are involved. CIM
analysis also increased the control of the genetic
background and resolution of QTL mapping. QTL
analysis was performed on the trait values from the three
locations over two crop years using the Windows QTL
Cartographer Version 2.5 software package (Wang et al.
2004). To confirm the location of these QTLs, compos-
ite interval mapping (CIM) was undertaken with all
default settings. A permutation (1,000 permutations)
based LOD threshold of 3.0 was used to declare
significant QTLs (Churchill and Doerge 1994). QTLs
were named based on the nomenclature suggested by
McCouch et al. (1997). In the proposed nomenclature,
‘‘q’’ stands for QTL followed by the corresponding trait
and linkage distance in centimorgan (cM) and a number
at the end of the locus name designating the linkage
groups (LG) onto which the QTL has been mapped. The
QTL effect was estimated by combining interval
mapping with multiple regressions.
Results
Phenotypic segregation of sugar content
and morphological traits in the mapping
population
The means and variance for sugar content and yield-
related traits of the parents and segregating F1progeny in
the seedling, C1 and C2 stages at the three locations are
shown in Table 1. The result has shown that substantial
differences of population statistics in the measured traits
existed in the F1 population derived from biparental
commercial cultivars. These 207 clones were true F1
because the bands could be scored for presence or
absence with origin traced in the two parents. The
parents showed differences in their phenotypic values
for sugar content and yield-related traits. Evaluated,
contributing to the phenotypic segregation observed in
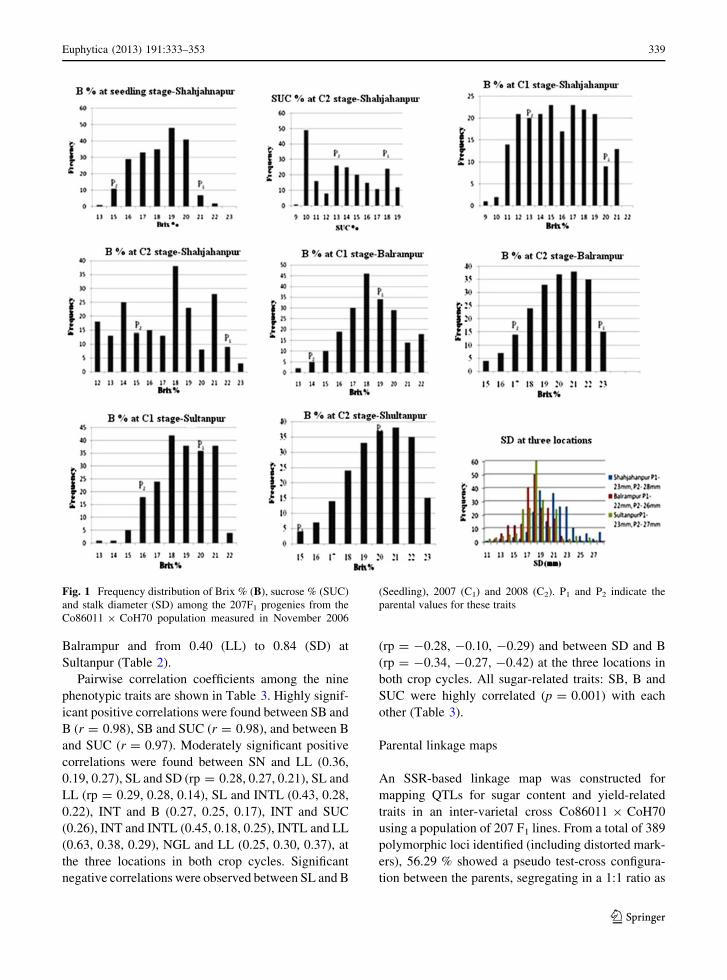
progenies. The population showed a significantly wider
range of variation than the two parents for all traits
across locations (SB and SUC only at Shahjahanpur),
highlighting transgressive segregation in the progenies
(Fig. 1, Table 1). Transgressive segregation was pro-
nounced particularly for SB, B and SUC with progeny
values ranging from 13.0 to 22.3 % in the seedling stage,
from 9.8 to 21.4 % in the C1 stage and from 9.25
to 19.96 % in the C2 stage at Shahjahanpur. A range
that was about 55 % (SBR), 53 % (B) and 58 %
(SUC) wider than the difference between the parents
Euphytica (2013) 191:333–353 337
123
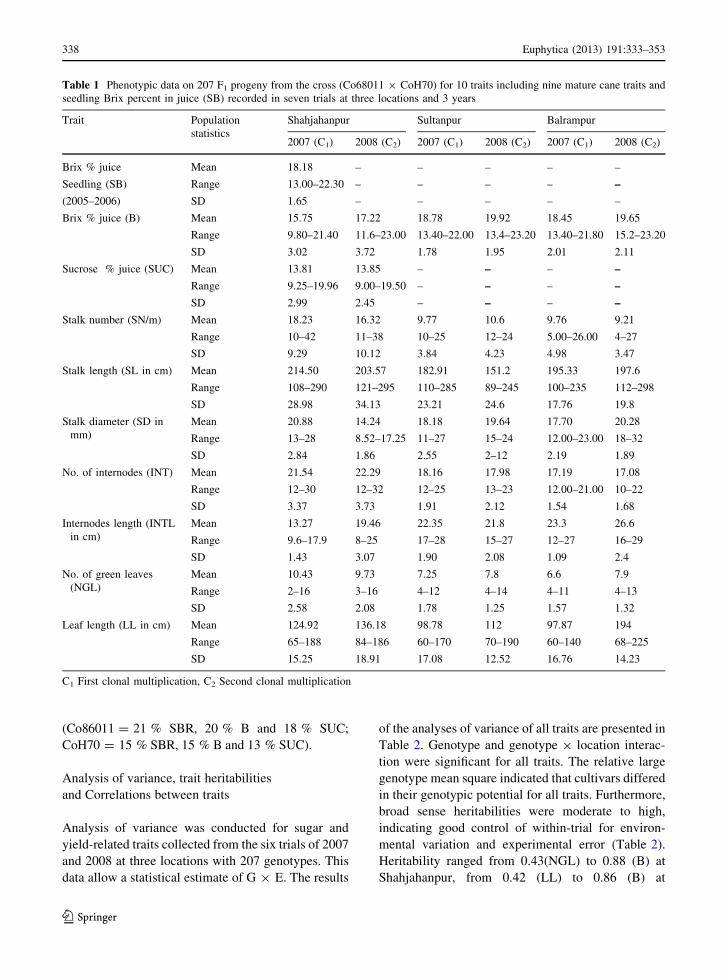
(Co86011 = 21 % SBR, 20 % B and 18 % SUC;
CoH70 = 15 % SBR, 15 % B and 13 % SUC).
Analysis of variance, trait heritabilities
and Correlations between traits
Analysis of variance was conducted for sugar and
yield-related traits collected from the six trials of 2007
and 2008 at three locations with 207 genotypes. This
data allow a statistical estimate of G 9 E. The results
of the analyses of variance of all traits are presented in
Table 2. Genotype and genotype 9 location interac-
tion were significant for all traits. The relative large
genotype mean square indicated that cultivars differed
in their genotypic potential for all traits. Furthermore,
broad sense heritabilities were moderate to high,
indicating good control of within-trial for environ-
mental variation and experimental error (Table 2).
Heritability ranged from 0.43(NGL) to 0.88 (B) at
Shahjahanpur, from 0.42 (LL) to 0.86 (B) at
Table 1 Phenotypic data on 207 F1 progeny from the cross (Co68011 9 CoH70) for 10 traits including nine mature cane traits and
seedling Brix percent in juice (SB) recorded in seven trials at three locations and 3 years
Trait Population
statistics
Shahjahanpur Sultanpur Balrampur
2007 (C1) 2008 (C2) 2007 (C1) 2008 (C2) 2007 (C1) 2008 (C2)
Brix % juice
Seedling (SB)
(2005–2006)
Mean 18.18 – – – – –
Range 13.00–22.30 – – – – –
SD 1.65 – – – – –
Brix % juice (B) Mean 15.75 17.22 18.78 19.92 18.45 19.65
Range 9.80–21.40 11.6–23.00 13.40–22.00 13.4–23.20 13.40–21.80 15.2–23.20
SD 3.02 3.72 1.78 1.95 2.01 2.11
Sucrose % juice (SUC) Mean 13.81 13.85 – – – –
Range 9.25–19.96 9.00–19.50 – – – –
SD 2.99 2.45 – – – –
Stalk number (SN/m) Mean 18.23 16.32 9.77 10.6 9.76 9.21
Range 10–42 11–38 10–25 12–24 5.00–26.00 4–27
SD 9.29 10.12 3.84 4.23 4.98 3.47
Stalk length (SL in cm) Mean 214.50 203.57 182.91 151.2 195.33 197.6
Range 108–290 121–295 110–285 89–245 100–235 112–298
SD 28.98 34.13 23.21 24.6 17.76 19.8
Stalk diameter (SD in
mm)
Mean 20.88 14.24 18.18 19.64 17.70 20.28
Range 13–28 8.52–17.25 11–27 15–24 12.00–23.00 18–32
SD 2.84 1.86 2.55 2–12 2.19 1.89
No. of internodes (INT) Mean 21.54 22.29 18.16 17.98 17.19 17.08
Range 12–30 12–32 12–25 13–23 12.00–21.00 10–22
SD 3.37 3.73 1.91 2.12 1.54 1.68
Internodes length (INTL
in cm)
Mean 13.27 19.46 22.35 21.8 23.3 26.6
Range 9.6–17.9 8–25 17–28 15–27 12–27 16–29
SD 1.43 3.07 1.90 2.08 1.09 2.4
No. of green leaves
(NGL)
Mean 10.43 9.73 7.25 7.8 6.6 7.9
Range 2–16 3–16 4–12 4–14 4–11 4–13
SD 2.58 2.08 1.78 1.25 1.57 1.32
Leaf length (LL in cm) Mean 124.92 136.18 98.78 112 97.87 194
Range 65–188 84–186 60–170 70–190 60–140 68–225
SD 15.25 18.91 17.08 12.52 16.76 14.23
C1 First clonal multiplication, C2 Second clonal multiplication
338 Euphytica (2013) 191:333–353
123
Balrampur and from 0.40 (LL) to 0.84 (SD) at
Sultanpur (Table 2).
Pairwise correlation coefficients among the nine
phenotypic traits are shown in Table 3. Highly signif-
icant positive correlations were found between SB and
B (r = 0.98), SB and SUC (r = 0.98), and between B
and SUC (r = 0.97). Moderately significant positive
correlations were found between SN and LL (0.36,
0.19, 0.27), SL and SD (rp = 0.28, 0.27, 0.21), SL and
LL (rp = 0.29, 0.28, 0.14), SL and INTL (0.43, 0.28,
0.22), INT and B (0.27, 0.25, 0.17), INT and SUC
(0.26), INT and INTL (0.45, 0.18, 0.25), INTL and LL
(0.63, 0.38, 0.29), NGL and LL (0.25, 0.30, 0.37), at
the three locations in both crop cycles. Significant
negative correlations were observed between SL and B
(rp = -0.28, -0.10, -0.29) and between SD and B
(rp = -0.34, -0.27, -0.42) at the three locations in
both crop cycles. All sugar-related traits: SB, B and
SUC were highly correlated (p = 0.001) with each
other (Table 3).
Parental linkage maps
An SSR-based linkage map was constructed for
mapping QTLs for sugar content and yield-related
traits in an inter-varietal cross Co86011 9 CoH70
using a population of 207 F1 lines. From a total of 389
polymorphic loci identified (including distorted mark-
ers), 56.29 % showed a pseudo test-cross configura-
tion between the parents, segregating in a 1:1 ratio as
Fig. 1 Frequency distribution of Brix % (B), sucrose % (SUC)
and stalk diameter (SD) among the 207F1 progenies from the
Co86011 9 CoH70 population measured in November 2006
(Seedling), 2007 (C1) and 2008 (C2). P1 and P2 indicate the
parental values for these traits
Euphytica (2013) 191:333–353 339
123
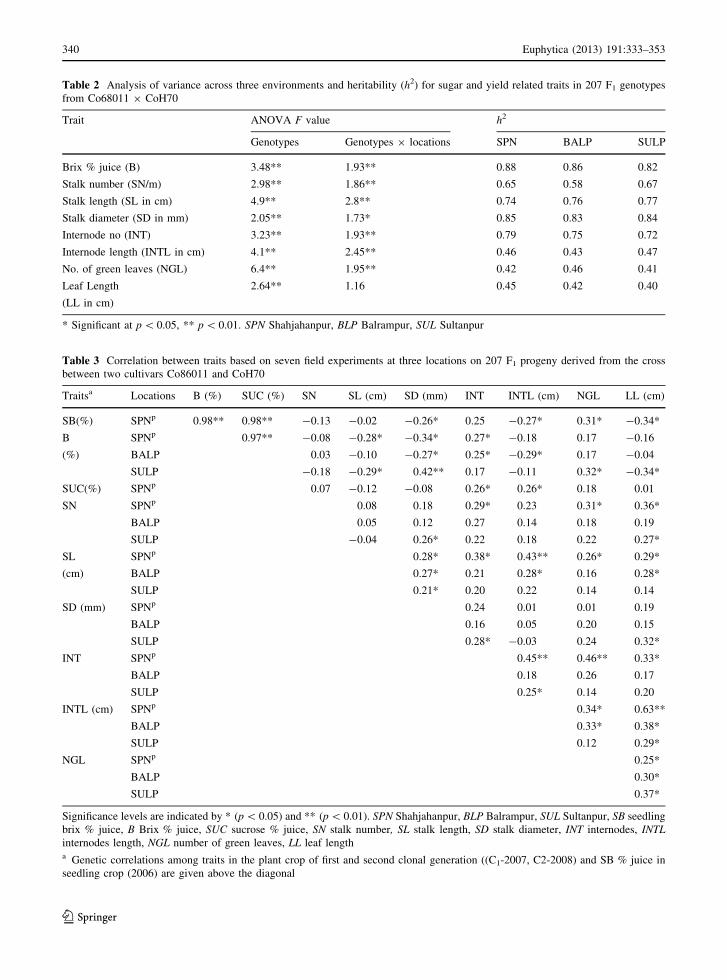
Table 2 Analysis of variance across three environments and heritability (h2) for sugar and yield related traits in 207 F1 genotypes
from Co68011 9 CoH70
Trait ANOVA F value h2
Genotypes Genotypes 9 locations SPN BALP SULP
Brix % juice (B) 3.48** 1.93** 0.88 0.86 0.82
Stalk number (SN/m) 2.98** 1.86** 0.65 0.58 0.67
Stalk length (SL in cm) 4.9** 2.8** 0.74 0.76 0.77
Stalk diameter (SD in mm) 2.05** 1.73* 0.85 0.83 0.84
Internode no (INT) 3.23** 1.93** 0.79 0.75 0.72
Internode length (INTL in cm) 4.1** 2.45** 0.46 0.43 0.47
No. of green leaves (NGL) 6.4** 1.95** 0.42 0.46 0.41
Leaf Length
(LL in cm)
2.64** 1.16 0.45 0.42 0.40
* Significant at p \ 0.05, ** p \ 0.01. SPN Shahjahanpur, BLP Balrampur, SUL Sultanpur
Table 3 Correlation between traits based on seven field experiments at three locations on 207 F1 progeny derived from the cross
between two cultivars Co86011 and CoH70
Traitsa Locations B (%) SUC (%) SN SL (cm) SD (mm) INT INTL (cm) NGL LL (cm)
SB(%) SPNp 0.98** 0.98** -0.13 -0.02 -0.26* 0.25 -0.27* 0.31* -0.34*
B
(%)
SPNp 0.97** -0.08 -0.28* -0.34* 0.27* -0.18 0.17 -0.16
BALP 0.03 -0.10 -0.27* 0.25* -0.29* 0.17 -0.04
SULP -0.18 -0.29* 0.42** 0.17 -0.11 0.32* -0.34*
SUC(%) SPNp 0.07 -0.12 -0.08 0.26* 0.26* 0.18 0.01
SN SPNp 0.08 0.18 0.29* 0.23 0.31* 0.36*
BALP 0.05 0.12 0.27 0.14 0.18 0.19
SULP -0.04 0.26* 0.22 0.18 0.22 0.27*
SL
(cm)
SPNp 0.28* 0.38* 0.43** 0.26* 0.29*
BALP 0.27* 0.21 0.28* 0.16 0.28*
SULP 0.21* 0.20 0.22 0.14 0.14
SD (mm) SPNp 0.24 0.01 0.01 0.19
BALP 0.16 0.05 0.20 0.15
SULP 0.28* -0.03 0.24 0.32*
INT SPNp 0.45** 0.46** 0.33*
BALP 0.18 0.26 0.17
SULP 0.25* 0.14 0.20
INTL (cm) SPNp 0.34* 0.63**
BALP 0.33* 0.38*
SULP 0.12 0.29*
NGL SPNp 0.25*
BALP 0.30*
SULP 0.37*
Significance levels are indicated by * (p \ 0.05) and ** (p \ 0.01). SPN Shahjahanpur, BLP Balrampur, SUL Sultanpur, SB seedling
brix % juice, B Brix % juice, SUC sucrose % juice, SN stalk number, SL stalk length, SD stalk diameter, INT internodes, INTLinternodes length, NGL number of green leaves, LL leaf lengtha Genetic correlations among traits in the plant crop of first and second clonal generation ((C1-2007, C2-2008) and SB % juice in
seedling crop (2006) are given above the diagonal
340 Euphytica (2013) 191:333–353
123
single-dose markers and 43.02 % segregated in a 3:1
ratio (referred to as double single—dose markers). The
markers that did not fit these expected segregation
ratios were considered as distorted or at a higher allele
dosage and hence were ignored from subsequent
analysis. The 389 polymorphic loci produced by 119
SSR primer pairs, including 74 UGSM, 19 SEGM, 14
SCM, 10 SGM and 2 STMS markers were investigated
for segregation distortion. Fifty-three (13.63 %) of
these markers deviated from the 1:1 and 3:1 Mende-
lian segregation ratios and were not used subsequent
analyses. The 119 SSR primer pairs amplified 389
scorable markers, with an average of 3.33 markers per
primer pair. Out of these markers, 208 (53.47 %)
showed polymorphism between the parents and
segregated in a 1:1 ratio expected for single-dose
markers, whereas 128 markers (32.90 %) were mono-
morphic between the parents and segregated in a 3:1
ratio in the mapping population. In present studies
three point analyses were performed at a log of odds
(LOD) score threshold of 5 and a recombination
fraction threshold of 0.35. Markers were tested by a v2
goodness-of-fit test at a significance level of 5 %.The
distribution of different classes of SSR markers across
the genetic map was examined in term of map
coverage and tendency to cluster. The distribution of
different types of SSR loci on LGs was variable, with
substantial clustering around various LGs. The major-
ity (64.6 %) of the 336 linked markers were unigene-
derived (UGSM) whereas 18.15, 15.18, 1.5 and
0.57 % were SEGM, SCM, SGM and STMS-derived,
respectively.
Only eight and sixteen linkage groups were con-
structed with 208 and 128 linked EST-SSR markers
found in the CoH70 and Co86011 maps, respectively.
These 336 markers were mapped on 24 linkage groups
(LGs). A total of 188 loci were grouped into 8 LGs on
sugarcane commercial cultivar Co86011, of which 122
(36.31 %) were polymorphic on Co86011 and 66 were
common from both parents (Co86011 & CoH70). 188
loci were assigned to 8 LGs, with between 2 and 86 loci
per group. LG 1was the most densely populated
linkage group with 86 markers covering a map distance
of 529.2 cM (Fig. 2). Eighty-six loci (25.6 %) were
polymorphic on CoH70 and 62 markers were common
from both parents (Co86011 & CoH70), forming 16
LGs. Thus, 148 loci were assigned to 16 LGs with
between 2 and 50 loci per group (Fig. 3). The LGs
ranged in length from 1.5 cM for LG 15 with two
markers to 654.6 cM for LG 2 with 50 markers. The
cumulative length of the Co86011 map was 1,502.9 cM,
while that of the CoH70 map was 1,103.87 cM. The 24
linkage groups of the map spanned a total length of
2,606.77 cM with an average distance of 7.75 cM
between loci along the linkage groups (Figs. 2, 3).
QTLs for sugar content and yield-related traits
A major objective of this study is to map QTLs
associated with sugar content (B) and yield-related
traits in sugarcane commercial cultivars. QTLs detec-
tion were carried out by CIM using QTL Cartographer
Version 2.5 software, forward step-wise regression
with five markers as cofactors to control genetic
background and a 10 cM genome-wide scan window,
were used for the detection of QTLs. As sugarcane is
poly-aneuploid up to 12 alleles were considered to be
segregating at any given locus, suggesting that only
the most significantly different alleles were likely to be
detected. Other alleles at that locus may also contrib-
ute to the traits resulting in many quantitative
traits alleles of small effect (Aitken et al. 2008).
A permutation (1,000 permutations) based LOD
threshold of 3.0 was used to declare putative QTLs
(Churchill and Doerge 1994).
The CIM analysis identified 24 chromosomal
regions harboring 31 QTLs for traits controlling sugar
content and yield-related traits. QTL analysis identi-
fied 31 single-dose markers on five linkage groups with
LOD scores ranging from 2.69 to 4.75. These 31
marker trait association (MTA) were found to be
significant at the 5 % threshold using permutation tests
with at least one trait; individually, they explained
from 1.4 to 19.0 % of the phenotypic variation across
locations. The CIM mapping identified nine, six, six,
four, three, two and one QTLs linked to EST-SSR
markers for B, SUC, INT, SN, SD, NGL and SL,
respectively (Table 4).
The 15 QTLs for sugar content, identified using
CIM analysis included 9 for B on LG 1, LG 2, LG3,LG
6, LG 10 and 6 for SUC on LG 1, LG 2, LG 3 (Table 4,
Figs. 2, 3). The QTLs for sugar content and yield-
related traits were located on linkage groups : LG 1
(qB1, qSUC1, qSD1); LG 2 (qB2, qSUC2, qSN2, qSL2,
qSD2, qINT2); LG 3 (qSB3, qSUC3, qSN3, qINT3);
LG 4 (qSD4); LG 5 (qINT5); LG 6 (qB6); LG 10
(qSB10, qNGL10). The LOD value of each QTL
ranged from 2.69 to 4.75. These QTLs were dispersed
Euphytica (2013) 191:333–353 341
123
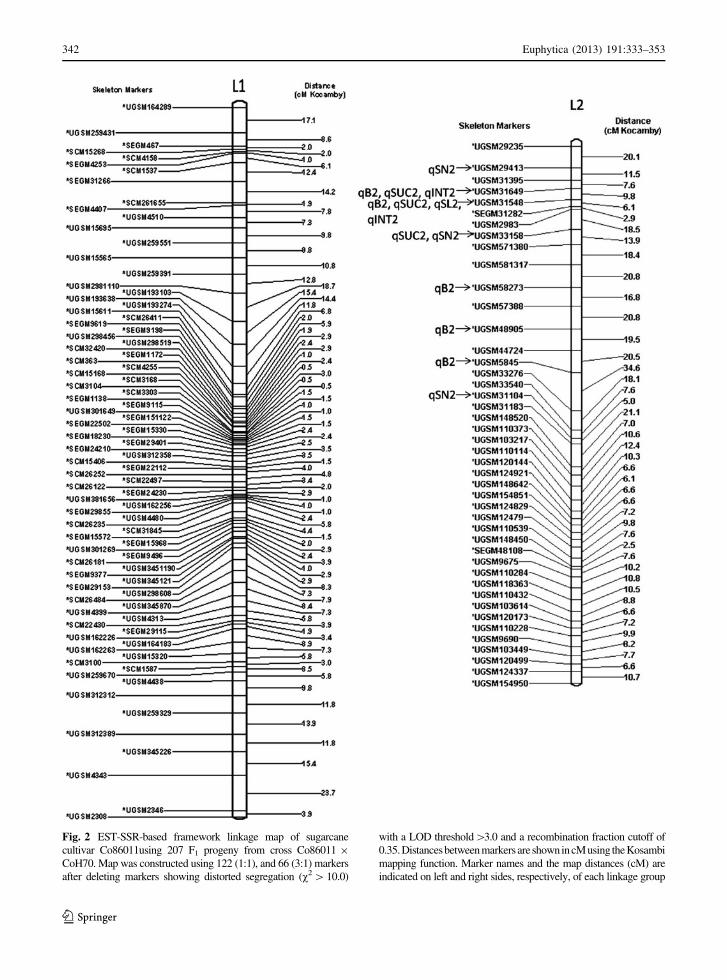
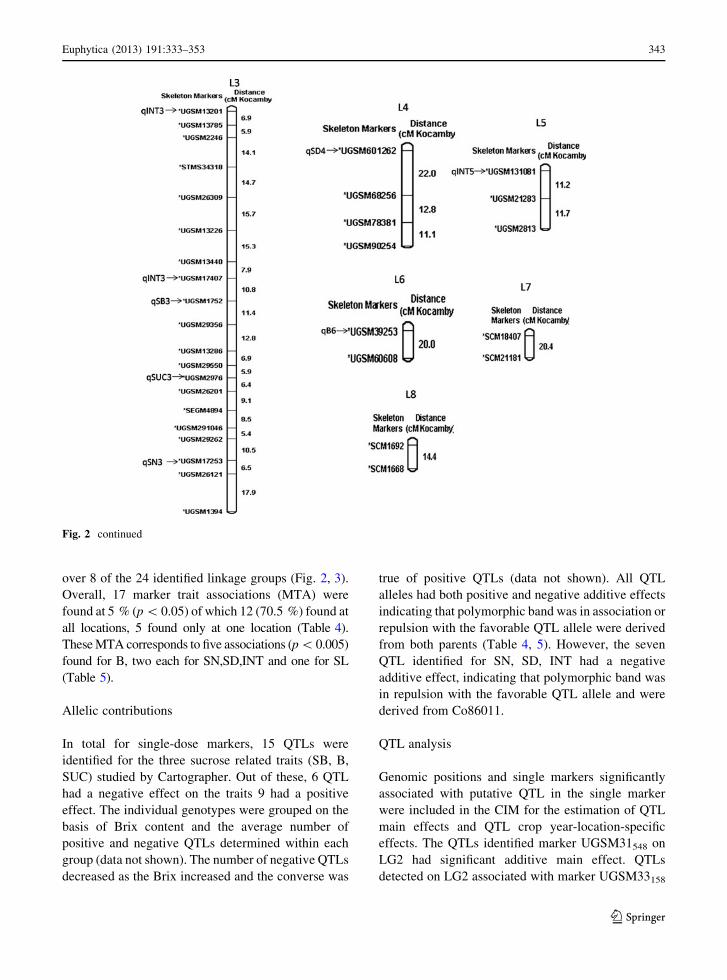
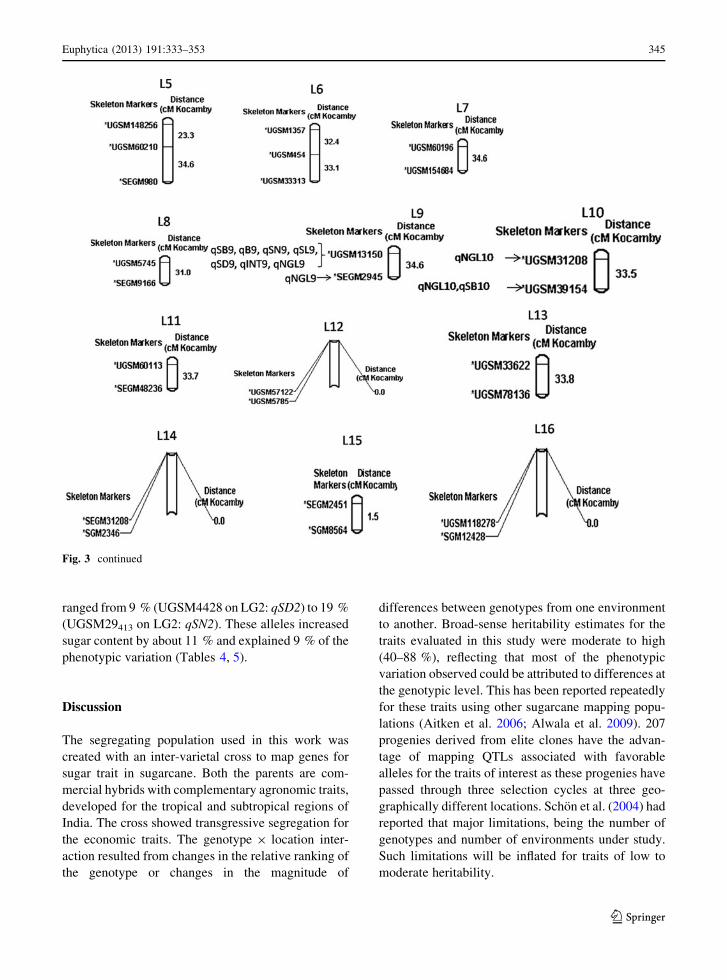
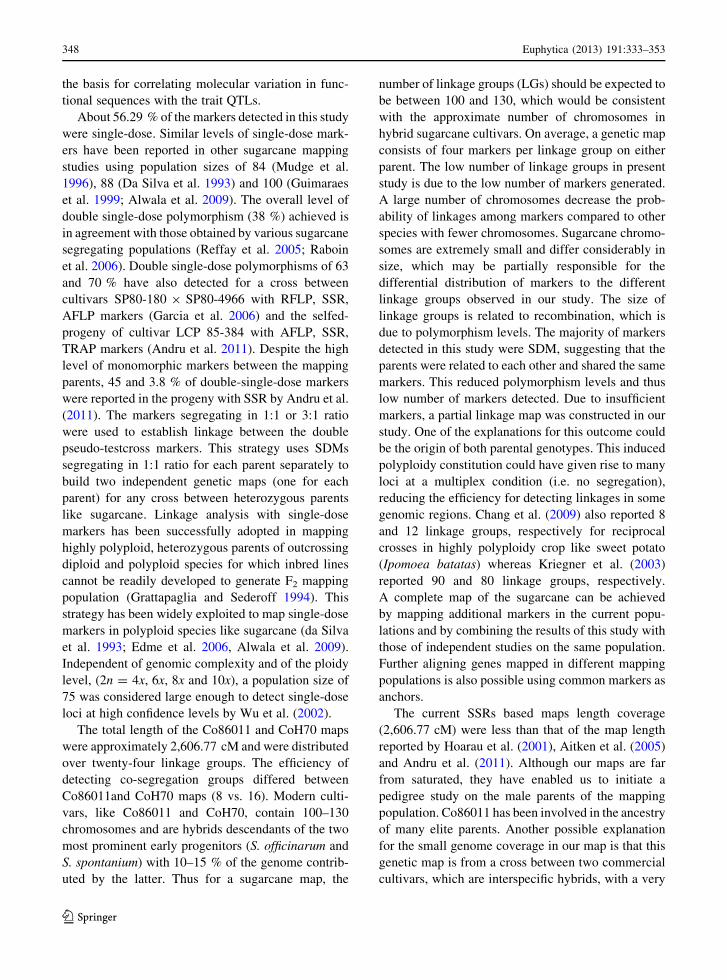
Fig. 2 EST-SSR-based framework linkage map of sugarcane
cultivar Co86011using 207 F1 progeny from cross Co86011 9
CoH70. Map was constructed using 122 (1:1), and 66 (3:1) markers
after deleting markers showing distorted segregation (v2 [10.0)
with a LOD threshold[3.0 and a recombination fraction cutoff of
0.35.Distancesbetween markers are shownincM using theKosambi
mapping function. Marker names and the map distances (cM) are
indicated on left and right sides, respectively, of each linkage group
342 Euphytica (2013) 191:333–353
123
over 8 of the 24 identified linkage groups (Fig. 2, 3).
Overall, 17 marker trait associations (MTA) were
found at 5 % (p \ 0.05) of which 12 (70.5 %) found at
all locations, 5 found only at one location (Table 4).
These MTA corresponds to five associations (p\ 0.005)
found for B, two each for SN,SD,INT and one for SL
(Table 5).
Allelic contributions
In total for single-dose markers, 15 QTLs were
identified for the three sucrose related traits (SB, B,
SUC) studied by Cartographer. Out of these, 6 QTL
had a negative effect on the traits 9 had a positive
effect. The individual genotypes were grouped on the
basis of Brix content and the average number of
positive and negative QTLs determined within each
group (data not shown). The number of negative QTLs
decreased as the Brix increased and the converse was
true of positive QTLs (data not shown). All QTL
alleles had both positive and negative additive effects
indicating that polymorphic band was in association or
repulsion with the favorable QTL allele were derived
from both parents (Table 4, 5). However, the seven
QTL identified for SN, SD, INT had a negative
additive effect, indicating that polymorphic band was
in repulsion with the favorable QTL allele and were
derived from Co86011.
QTL analysis
Genomic positions and single markers significantly
associated with putative QTL in the single marker
were included in the CIM for the estimation of QTL
main effects and QTL crop year-location-specific
effects. The QTLs identified marker UGSM31548 on
LG2 had significant additive main effect. QTLs
detected on LG2 associated with marker UGSM33158
Fig. 2 continued
Euphytica (2013) 191:333–353 343
123
and UGSM4428 had significant QTL 9 crop year
interaction for SN and SD, respectively, indicating
that these QTLs showed the same behavior along the
three locations. The QTL identified on LG1 associ-
ated with marker UGSM21081 for B and SD,
UGSM5845 and UGSM31649 on LG2 for B and
INT and marker associated withUGSM17253 on LG3
for SN, had QTL 9 crop year 9 location interac-
tions, which means that the effects of each QTL are
significantly different for at least one crop year-
location combination (Table 5). The most important
QTLs intervals identified in this study, were qB2,
qSUC2, qSL2 and qINT2 located between SSR
markers UGSM31548 and UGSM31649 covering
6.1 cM map distance. This QTL interval was located
in Co86011 map on LG 2, with stable additive effects
of 34 % for B, 19 % for SUC, 28.3 % for SL, and
30.7 % for INT, respectively, across crop year and
locations. The variation explained by individual Brix
QTLs ranged from 2.4 % (UGSM39154 on LG 10:
qSB10) to 9 % (UGSM21081 on LG1: qB1, UGSM31548
on LG 2: qB2). The variation explained by individual
SUC QTLs ranged from 2.5 % (UGSM21081 on LG1:
qSUC1, UGSM2976 on LG3: qSUC3) to 8.9 %
(UGSM31548 on LG2: qSUC2). Phenotypic variation
explained (r2 %) by sugar yield-related QTLs, were
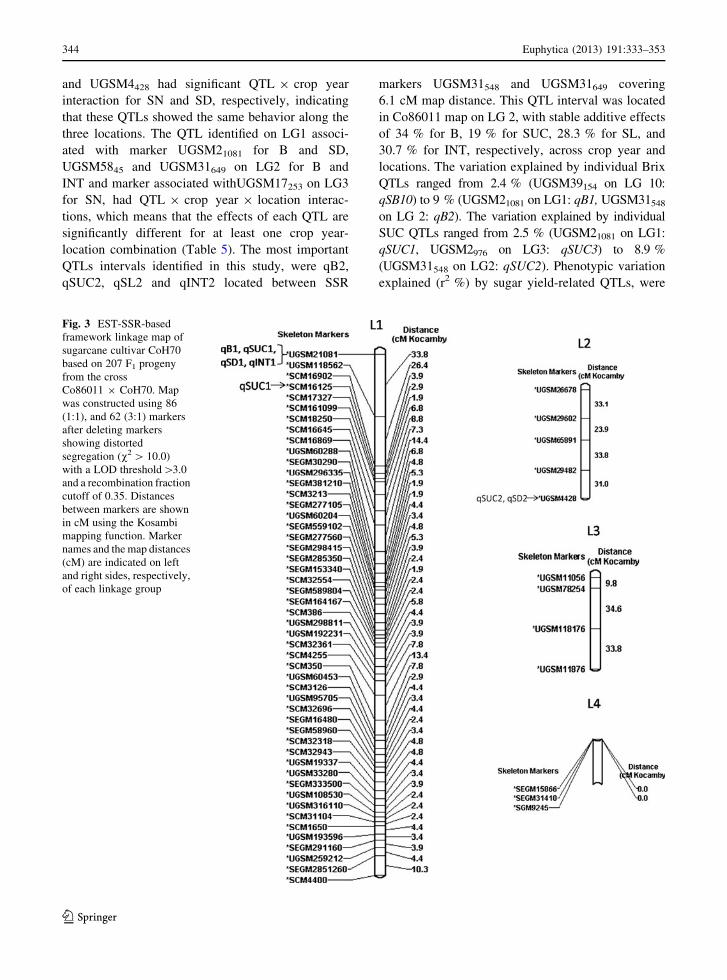
Fig. 3 EST-SSR-based
framework linkage map of
sugarcane cultivar CoH70
based on 207 F1 progeny
from the cross
Co86011 9 CoH70. Map
was constructed using 86
(1:1), and 62 (3:1) markers
after deleting markers
showing distorted
segregation (v2 [ 10.0)
with a LOD threshold[3.0
and a recombination fraction
cutoff of 0.35. Distances
between markers are shown
in cM using the Kosambi
mapping function. Marker
names and the map distances
(cM) are indicated on left
and right sides, respectively,
of each linkage group
344 Euphytica (2013) 191:333–353
123
ranged from 9 % (UGSM4428 on LG2: qSD2) to 19 %
(UGSM29413 on LG2: qSN2). These alleles increased
sugar content by about 11 % and explained 9 % of the
phenotypic variation (Tables 4, 5).
Discussion
The segregating population used in this work was
created with an inter-varietal cross to map genes for
sugar trait in sugarcane. Both the parents are com-
mercial hybrids with complementary agronomic traits,
developed for the tropical and subtropical regions of
India. The cross showed transgressive segregation for
the economic traits. The genotype 9 location inter-
action resulted from changes in the relative ranking of
the genotype or changes in the magnitude of
differences between genotypes from one environment
to another. Broad-sense heritability estimates for the
traits evaluated in this study were moderate to high
(40–88 %), reflecting that most of the phenotypic
variation observed could be attributed to differences at
the genotypic level. This has been reported repeatedly
for these traits using other sugarcane mapping popu-
lations (Aitken et al. 2006; Alwala et al. 2009). 207
progenies derived from elite clones have the advan-
tage of mapping QTLs associated with favorable
alleles for the traits of interest as these progenies have
passed through three selection cycles at three geo-
graphically different locations. Schon et al. (2004) had
reported that major limitations, being the number of
genotypes and number of environments under study.
Such limitations will be inflated for traits of low to
moderate heritability.
Fig. 3 continued
Euphytica (2013) 191:333–353 345
123
To assess the relationships between traits, correla-
tion coefficients were calculated from the measured
trait values. The strongest correlations were found
between SB and SUC with r-value of 0.98 and
between B and SUC with r-value of 0.97. SUC was
highly and positively correlated with B and SB.
Sucrose percent in juice (SUC), seedling Brix (SB)
and clonal Brix (B) are components of sugar content,
and this was confirmed by the significant positive
correlation among them. Similar association between
SUC and Brix (B or SB) had been identified previously
in the plant cane and ratoon crops (Gravois and
Milligan 1992). Sugar content traits such as SB, B and
SUC were highly significant among sugar-related
traits but have minor or no significant effect on sugar
yield contributing traits.
Among the yield-related traits, SD and SL were
negatively correlated with sugar content (B). Other
traits e.g. INT, INTL, NGL, LL,which were reported
to be associated with sugar content by Singh and Singh
(1994, 1998), showed no significant correlation with
sugar content in the present study, suggesting that the
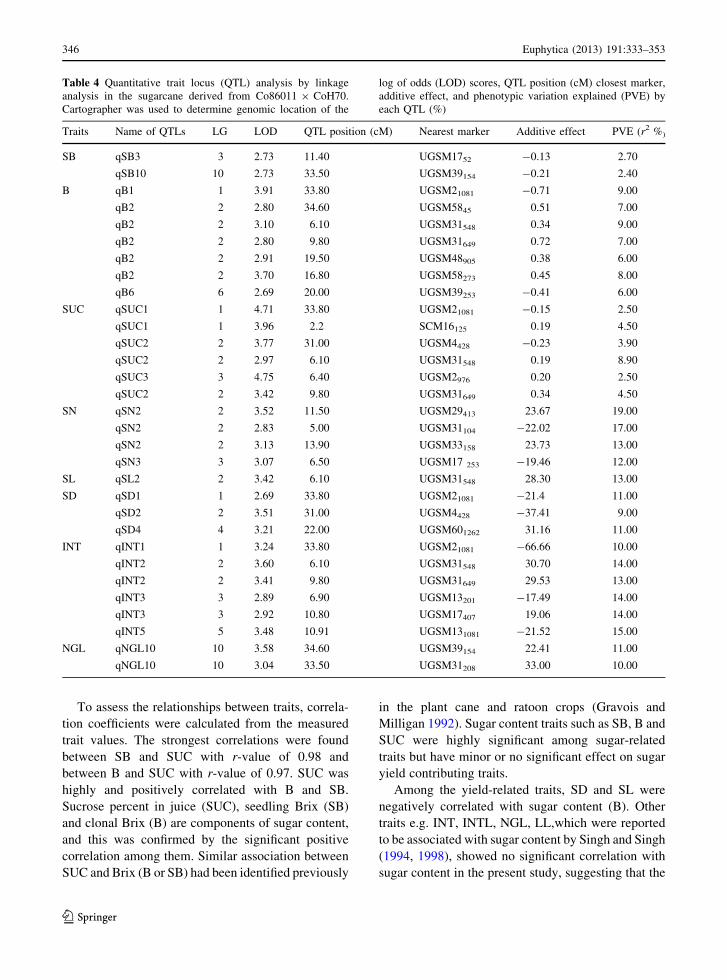
Table 4 Quantitative trait locus (QTL) analysis by linkage
analysis in the sugarcane derived from Co86011 9 CoH70.
Cartographer was used to determine genomic location of the
log of odds (LOD) scores, QTL position (cM) closest marker,
additive effect, and phenotypic variation explained (PVE) by
each QTL (%)
Traits Name of QTLs LG LOD QTL position (cM) Nearest marker Additive effect PVE (r2 %)
SB qSB3 3 2.73 11.40 UGSM1752 -0.13 2.70
qSB10 10 2.73 33.50 UGSM39154 -0.21 2.40
B qB1 1 3.91 33.80 UGSM21081 -0.71 9.00
qB2 2 2.80 34.60 UGSM5845 0.51 7.00
qB2 2 3.10 6.10 UGSM31548 0.34 9.00
qB2 2 2.80 9.80 UGSM31649 0.72 7.00
qB2 2 2.91 19.50 UGSM48905 0.38 6.00
qB2 2 3.70 16.80 UGSM58273 0.45 8.00
qB6 6 2.69 20.00 UGSM39253 -0.41 6.00
SUC qSUC1 1 4.71 33.80 UGSM21081 -0.15 2.50
qSUC1 1 3.96 2.2 SCM16125 0.19 4.50
qSUC2 2 3.77 31.00 UGSM4428 -0.23 3.90
qSUC2 2 2.97 6.10 UGSM31548 0.19 8.90
qSUC3 3 4.75 6.40 UGSM2976 0.20 2.50
qSUC2 2 3.42 9.80 UGSM31649 0.34 4.50
SN qSN2 2 3.52 11.50 UGSM29413 23.67 19.00
qSN2 2 2.83 5.00 UGSM31104 -22.02 17.00
qSN2 2 3.13 13.90 UGSM33158 23.73 13.00
qSN3 3 3.07 6.50 UGSM17 253 -19.46 12.00
SL qSL2 2 3.42 6.10 UGSM31548 28.30 13.00
SD qSD1 1 2.69 33.80 UGSM21081 -21.4 11.00
qSD2 2 3.51 31.00 UGSM4428 -37.41 9.00
qSD4 4 3.21 22.00 UGSM601262 31.16 11.00
INT qINT1 1 3.24 33.80 UGSM21081 -66.66 10.00
qINT2 2 3.60 6.10 UGSM31548 30.70 14.00
qINT2 2 3.41 9.80 UGSM31649 29.53 13.00
qINT3 3 2.89 6.90 UGSM13201 -17.49 14.00
qINT3 3 2.92 10.80 UGSM17407 19.06 14.00
qINT5 5 3.48 10.91 UGSM131081 -21.52 15.00
NGL qNGL10 10 3.58 34.60 UGSM39154 22.41 11.00
qNGL10 10 3.04 33.50 UGSM31208 33.00 10.00
346 Euphytica (2013) 191:333–353
123
earlier reported correlations may be pedigree-related.
Sugarcane breeders concentrate on both increasing the
sugar content and sugar yield by increasing the
biomass, as both enhance the final sugar yield. There
is evidence that breeders have been more successful in
increasing the biomass than sugar content (Jackson
2005). Genotypic correlations between the seven trials
for sugar-related traits indicated that crossover geno-
type by environment interaction was relatively low for
the traits analysed. Zhang et al. (2011) also reported
that genetic factors controlling positive and negative
correlations between the traits and QTL with major
effects are more likely to be stable across multiple
environments in Brassica. From a phenotyping per-
spective, the close relationship between sugar-related
traits in this study suggested that the slower and more
expensive measurements of sugar content are not
required as Brix, a simpler to measure trait, provided
similar QTL results.
The complex genetic structure of sugarcane
genome makes mapping a challenging task. The large
number of variable chromosomes in sugarcane indi-
cates that a large number of markers are required to
build a saturated genetic map. The molecular sugar-
cane map presented here is largely based on ESTs-
derived genic-SSR markers and also with inclusion of
some genomic-SSR markers. The value of genic-SSR
markers is enhanced due to their good transferability
across taxon boundaries, as reported in grape by
Decroocq et al. (2003) and in sugarcane by Cordeiro
et al. (2001); Oliveira et al. (2007). Furthermore,
genic-SSR markers are sometimes directly associated
with the trait of interest due to functional polymor-
phism. However, in terms of marker development and
detection of polymorphic genic-SSR markers are less
efficient than genomic SSRs, requiring considerably
more to map a genome. Development of a functionally
defined gene-based genetic map of sugarcane provides
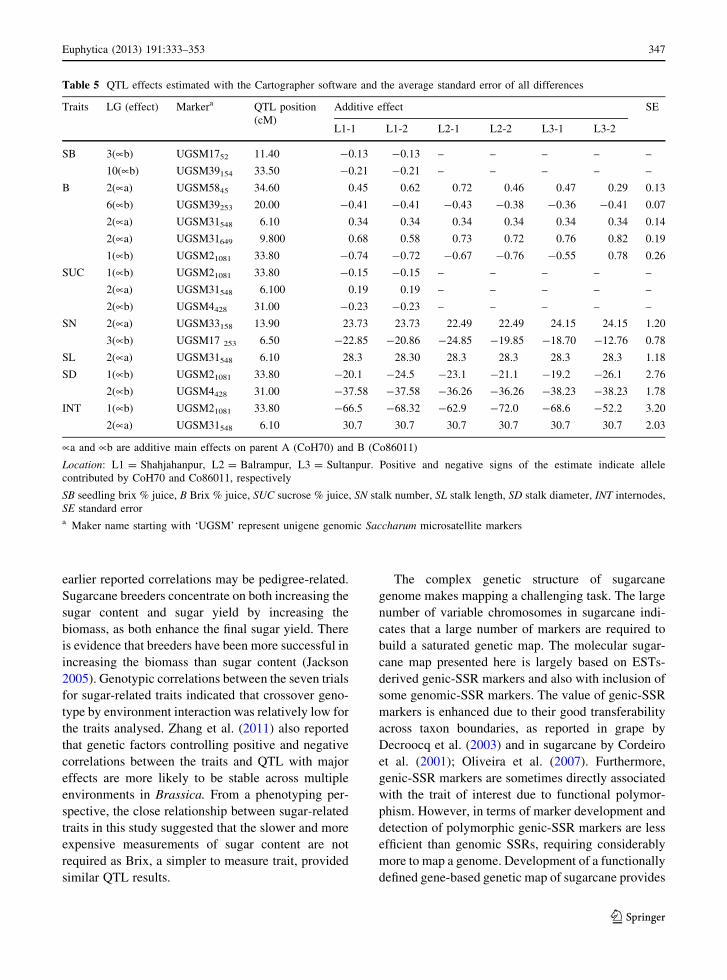
Table 5 QTL effects estimated with the Cartographer software and the average standard error of all differences
Traits LG (effect) Markera QTL position
(cM)
Additive effect SE
L1-1 L1-2 L2-1 L2-2 L3-1 L3-2
SB 3(�b) UGSM1752 11.40 -0.13 -0.13 – – – – –
10(�b) UGSM39154 33.50 -0.21 -0.21 – – – – –
B 2(�a) UGSM5845 34.60 0.45 0.62 0.72 0.46 0.47 0.29 0.13
6(�b) UGSM39253 20.00 -0.41 -0.41 -0.43 -0.38 -0.36 -0.41 0.07
2(�a) UGSM31548 6.10 0.34 0.34 0.34 0.34 0.34 0.34 0.14
2(�a) UGSM31649 9.800 0.68 0.58 0.73 0.72 0.76 0.82 0.19
1(�b) UGSM21081 33.80 -0.74 -0.72 -0.67 -0.76 -0.55 0.78 0.26
SUC 1(�b) UGSM21081 33.80 -0.15 -0.15 – – – – –
2(�a) UGSM31548 6.100 0.19 0.19 – – – – –
2(�b) UGSM4428 31.00 -0.23 -0.23 – – – – –
SN 2(�a) UGSM33158 13.90 23.73 23.73 22.49 22.49 24.15 24.15 1.20
3(�b) UGSM17 253 6.50 -22.85 -20.86 -24.85 -19.85 -18.70 -12.76 0.78
SL 2(�a) UGSM31548 6.10 28.3 28.30 28.3 28.3 28.3 28.3 1.18
SD 1(�b) UGSM21081 33.80 -20.1 -24.5 -23.1 -21.1 -19.2 -26.1 2.76
2(�b) UGSM4428 31.00 -37.58 -37.58 -36.26 -36.26 -38.23 -38.23 1.78
INT 1(�b) UGSM21081 33.80 -66.5 -68.32 -62.9 -72.0 -68.6 -52.2 3.20
2(�a) UGSM31548 6.10 30.7 30.7 30.7 30.7 30.7 30.7 2.03
�a and �b are additive main effects on parent A (CoH70) and B (Co86011)
Location: L1 = Shahjahanpur, L2 = Balrampur, L3 = Sultanpur. Positive and negative signs of the estimate indicate allele
contributed by CoH70 and Co86011, respectively
SB seedling brix % juice, B Brix % juice, SUC sucrose % juice, SN stalk number, SL stalk length, SD stalk diameter, INT internodes,
SE standard errora Maker name starting with ‘UGSM’ represent unigene genomic Saccharum microsatellite markers
Euphytica (2013) 191:333–353 347
123
the basis for correlating molecular variation in func-
tional sequences with the trait QTLs.
About 56.29 % of the markers detected in this study
were single-dose. Similar levels of single-dose mark-
ers have been reported in other sugarcane mapping
studies using population sizes of 84 (Mudge et al.
1996), 88 (Da Silva et al. 1993) and 100 (Guimaraes
et al. 1999; Alwala et al. 2009). The overall level of
double single-dose polymorphism (38 %) achieved is
in agreement with those obtained by various sugarcane
segregating populations (Reffay et al. 2005; Raboin
et al. 2006). Double single-dose polymorphisms of 63
and 70 % have also detected for a cross between
cultivars SP80-180 9 SP80-4966 with RFLP, SSR,
AFLP markers (Garcia et al. 2006) and the selfed-
progeny of cultivar LCP 85-384 with AFLP, SSR,
TRAP markers (Andru et al. 2011). Despite the high
level of monomorphic markers between the mapping
parents, 45 and 3.8 % of double-single-dose markers
were reported in the progeny with SSR by Andru et al.
(2011). The markers segregating in 1:1 or 3:1 ratio
were used to establish linkage between the double
pseudo-testcross markers. This strategy uses SDMs
segregating in 1:1 ratio for each parent separately to
build two independent genetic maps (one for each
parent) for any cross between heterozygous parents
like sugarcane. Linkage analysis with single-dose
markers has been successfully adopted in mapping
highly polyploid, heterozygous parents of outcrossing
diploid and polyploid species for which inbred lines
cannot be readily developed to generate F2 mapping
population (Grattapaglia and Sederoff 1994). This
strategy has been widely exploited to map single-dose
markers in polyploid species like sugarcane (da Silva
et al. 1993; Edme et al. 2006, Alwala et al. 2009).
Independent of genomic complexity and of the ploidy
level, (2n = 4x, 6x, 8x and 10x), a population size of
75 was considered large enough to detect single-dose
loci at high confidence levels by Wu et al. (2002).
The total length of the Co86011 and CoH70 maps
were approximately 2,606.77 cM and were distributed
over twenty-four linkage groups. The efficiency of
detecting co-segregation groups differed between
Co86011and CoH70 maps (8 vs. 16). Modern culti-
vars, like Co86011 and CoH70, contain 100–130
chromosomes and are hybrids descendants of the two
most prominent early progenitors (S. officinarum and
S. spontanium) with 10–15 % of the genome contrib-
uted by the latter. Thus for a sugarcane map, the
number of linkage groups (LGs) should be expected to
be between 100 and 130, which would be consistent
with the approximate number of chromosomes in
hybrid sugarcane cultivars. On average, a genetic map
consists of four markers per linkage group on either
parent. The low number of linkage groups in present
study is due to the low number of markers generated.
A large number of chromosomes decrease the prob-
ability of linkages among markers compared to other
species with fewer chromosomes. Sugarcane chromo-
somes are extremely small and differ considerably in
size, which may be partially responsible for the
differential distribution of markers to the different
linkage groups observed in our study. The size of
linkage groups is related to recombination, which is
due to polymorphism levels. The majority of markers
detected in this study were SDM, suggesting that the
parents were related to each other and shared the same
markers. This reduced polymorphism levels and thus
low number of markers detected. Due to insufficient
markers, a partial linkage map was constructed in our
study. One of the explanations for this outcome could
be the origin of both parental genotypes. This induced
polyploidy constitution could have given rise to many
loci at a multiplex condition (i.e. no segregation),
reducing the efficiency for detecting linkages in some
genomic regions. Chang et al. (2009) also reported 8
and 12 linkage groups, respectively for reciprocal
crosses in highly polyploidy crop like sweet potato
(Ipomoea batatas) whereas Kriegner et al. (2003)
reported 90 and 80 linkage groups, respectively.
A complete map of the sugarcane can be achieved
by mapping additional markers in the current popu-
lations and by combining the results of this study with
those of independent studies on the same population.
Further aligning genes mapped in different mapping
populations is also possible using common markers as
anchors.
The current SSRs based maps length coverage
(2,606.77 cM) were less than that of the map length
reported by Hoarau et al. (2001), Aitken et al. (2005)
and Andru et al. (2011). Although our maps are far
from saturated, they have enabled us to initiate a
pedigree study on the male parents of the mapping
population. Co86011 has been involved in the ancestry
of many elite parents. Another possible explanation
for the small genome coverage in our map is that this
genetic map is from a cross between two commercial
cultivars, which are interspecific hybrids, with a very
348 Euphytica (2013) 191:333–353
123
complex genetic system. The number of unlinked
markers was smaller than the numbers obtained in the
previous genetic maps of such bi-parental mapping
populations (Reffay et al. 2005; Garcia et al. 2006;
Oliveira et al. 2007). Similar levels of distorted/
unlinked markers have been reported in other sugar-
cane mapping studies using progeny sizes of 200
(Hoarau et al. 2001; Aitken et al. 2005). However, it is
higher than that obtained in other map for 300 self
progenies of LCP 85-384 (Andru et al. 2011). High
percentages (60 %) of unlinked marker were also
reported by Alwala et al. (2008). Segregation distor-
tion may also be depending on the distance/divergence
of the two parents within regions experiencing selec-
tion (Woram et al. 2004).
Mapping population of 207 F1 segregating individ-
uals at three locations and 2 years, considered large
enough to detect QTL associated with the quantitative
traits of interest. Despite varietal selection of sugar-
cane based on quantitative traits is usually done with
measurements taken from series of field trials in
multiple locations and crop years, fitting alternative
variance–covariance structures for studying genetic
effect across locations and crop years is rarely pursued
(Smith et al. 2007; Pastina et al. 2012). An increase in
population size provides gains in statistical power,
estimates of gene effects and confidence intervals of
the locations of QTLs (Beavis 1998). Jiang and Zeng
(1995) had reported that mapping QTL and testing
QTL 9 environment interaction, when n1 = n2 = n
and n is large, the test statistic under this analysis have
more statistical power. Asins (2002) also reported that a
way of improving the power and accuracy in detection
of true QTLs is by increasing population sizes or by
multiplying the number of environments in which the
population is evaluated.
QTL-marker associations are of great interest to
breeders as they may be useful for molecular breeding
applications. None of these traits are simply inherited
and many genes are expected to control each of them.
Although, other approaches such as interval mapping
(Lander and Botstein 1994) and composite interval
mapping (Zeng 1994), have more power than single-
marker analysis (Liu 1998) to detect QTLs. The main
advantage of CIM is that it is more precise and effective
at mapping QTLs compared to single-point analysis
and interval mapping, especially when linked QTLs
are involved. The results from CIM-QTL method are
usually comparable to those obtained from multi QTL
analysis (Aljanabi et al. 2007). Nevertheless, a dense
map is necessary to better appreciate the number of loci
governing quantitative traits. The common crop-year
markers with positive effects could be regarded as
strong marker-QTL associations and could potentially
be useful for MAS. In a clonally propagated crop like
sugarcane once a strong marker-QTL association is
detected in a progeny population, it has an immediate
role in crop improvement via clonal propagation as
there is no further probability of cross-over between
the marker and the QTL.
The large differences in parental phenotypic values
observed of the segregating population provided the
basis for QTL mapping. Our population involves elite
sugarcane commercial cultivars which are likely to
have been enriched for superior alleles (Co86011) are
controlling high sugar content during various cycles of
breeding and selection, resulting in an enhanced allele
contrast between loci underlining the sugar traits. This
may be responsible for the transgressive segregation
observed for these traits and highlights the importance
of implementing marker-assisted selection in sugar-
cane improvement program. A bi-parental mapping
seems more suitable than a selfed population when
QTL detection is the ultimate objectives, especially if
the two parents have highly contrasting phenotypes for
the traits of interest (Raboin et al. 2006). The first QTLs
mapped for sugar yield and related traits in sugarcane
were reported using segregating populations derived
from two interspecific crosses (Ming et al. 2001, 2002).
Recently, QTLs have been detected for basic sucrose
content and yield contributing traits viz; sucrose
content, fibre percent, cane yield, sugar yield and
suckering using biparental crosses (Da Silva and
Bressiani 2005; Pinto et al. 2010; Pastina et al. 2012).
The majority of the QTLs affected more than one trait;
since all the sugar-related traits are highly correlated.
In all sugar-related traits studied, both positive and
negative effects were detected. These findings are
similar and in the same range as other studies that
detected QTAs in sugarcane (Hoarau et al. 2002; Ming
et al. 2002). Out of 17 QTLs identified for sugar
related traits, 70.5 % of QTLs were stable across all
crop year-location combinations; corroborating the
speculated fact raised by many breeders that sucrose %
in juice has reached the plateau of adaptability and
stability. Stability of QTLs across environments were
inferred based on their genotype by environment
interaction effect for Pol % in cane (Pastina et al.
Euphytica (2013) 191:333–353 349
123
2012). Some QTLs of different traits were identified in
common linkage groups or associated with common
markers. B, SUC, SL and INT had QTL mapped on LG
2 and associated with markers: UGSM31548 and
UGSM31649. As all the QTLs were close by, it is
possible that they are pleiotropic QTLs. In breeding
programs, special attention should be given to these
QTLs when simultaneous improvement is aimed for
sugar and yield-related traits.
The detection of significant associations between
markers in the same genomic region of sugarcane
commercial cultivar Co86011 provided independent
confirmation of the importance of this genomic region
for increasing sugar content. In addition, based on
phenotypic segregation data and QTL analysis, this
genomic region probably contains putative major
genes that control sugar accumulation/high sugar
content. Despite the significant association between
two SSR markers-determined using single-factor
ANOVA and sugar content on LG 2, all SSR markers
UGSM31548 and UGSM31649, were significant by the
CIM method on this linkage group. The CIM method
allowed more than one QTL to be mapped on the same
chromosome (Zeng 1994) if they are relatively far
apart. However, as both significant markers fell within
a distance of 6.1–9.8 cM on LG 2, the CIM peak
detecting a QTL on the marker with the highest
significance level. A validation study will have to use
these markers to confirm. The co-location of QTL
could be due to genes in these genomic locations that
affect a number of traits (pleiotropy). Alternatively,
these genomic regions may contain several genes,
each of which affects a different trait and the
co-location of QTL for different traits is simply a
result of linkage. Combined across both locations and
crop-years, the QTL detected on similar region were
consistent for B, SUC, SL and INT respectively.
The consistency of marker-QTL associations in
different populations across different locations and
years is the key to successful marker-assisted selection
(MAS) breeding. In this study, ten QTLs mapped for
sugar content, including two for SB, five for B and
three for SUC were consistent in 2006, 2007 and 2008.
However, the previous studies showed low numbers of
common QTLs across the crop-years which may be
due to genotype-year interactions as noticed for most
quantitative traits in sugarcane (Kang et al. 1987;
Jackson and Hogarth 1992). Nevertheless, the effects
of these common markers across crop-years were
remarkably in the same direction. Earlier sugarcane
studies have also reported consistency of QTL effects
for brix and sugar content (Pol) across location and
crop years (Hoarau et al. 2002; Aitken et al. 2006;
Pastina et al.2012).
Conclusions
Three hundred thirty-six (336) polymorphic marker
loci were mapped on 24 linkage groups (LGs),
spanning a total map distance of 2606.77 cM with
an average distance of 7.758 cM between adjacent
markers. As an increase in stalk sugar content is an
important objective in sugarcane breeding, the robust
co-locating sugar QTLs (qB2, qSUC2,) and yield-
related QTL (qSL2, qINT2, qSN2, qSD2) identified in
this study using single-dose markers. These QTLs
were stable across three locations and two crop years.
The association between EST-SSRs and sugar con-
tent-related traits with 207 segregating individuals in
seven environments to the same linkage group
confirms the role of these linkages in the trait
expression. Most linked markers were unique to a
specific parent and trait, and may be useful in crop
improvement programs employing MAS. MAS for
sugar-yield related traits can be efficiently conducted
by selecting individual that contain QTL-linked
markers, which would thus facilitate conventional
breeding using either CoH70 or Co86011 as a donor
parent. Future studies are planned to include more
markers to obtained higher genome coverage.
Acknowledgments The authors want to thank the anonymous
reviewers for their valuable suggestions. We are also thankful to
Department of Biotechnology (DBT), Government of India for
funding this research project. We acknowledge the help of
Mr. Sudhir Pratap Singh, Miss. Parul Singh, Pradeep Kumar and
Miss. Nidhi Subhanand in field and laboratory work.
References
Aitken KS, Jackson PA, McIntyre CL (2005) A combination of
AFLP and SSR markers provides extensive map coverage
and identification of homo(eo)logous linkage groups in a
sugarcane cultivar. Theor Appl Genet 110:789–801
Aitken KS, Jackson PA, McIntyre CL (2006) Quantitative trait
loci identified for sugar related traits in sugarcane (Sac-charum spp.) cultivar 9 Saccharum officinarum popula-
tion. Theor Appl Genet 112:1306–1317
350 Euphytica (2013) 191:333–353
123
Aitken KS, Hermann S, Karno K, Bonnett GD, McIntyre
LC, Jackson PA (2008) Genetic control of yield related
stalk traits in sugarcane. Theor Appl Genet 117:1191–
1203
Aljanabi SM, Honeycutt RJ, McClelland M, Sobral BWS (1993)
A genetic linkage map of Saccharum spontaneum L. ‘SES
208’. Genetics 134:1249–1260
Aljanabi SM, Parmessur Y, Kross H, Dhayan S, Saumtally S,
Ramdoyal K, Autrey LJC, Dookun-Saumtally A (2007)
Identification of a major quantitative trait locus (QTL) for
yellow spot (Mycovellosiella koepkei) disease resistance in
sugarcane. Mol Breed 19:1–14
Alwala S, Collins A, Kimbeng J, Veremis C, Gravois KA (2008)
Linkage mapping and genome analysis in a Saccharuminterspecific cross using AFLP, SRAP and TRAP markers.
Euphytica 164:37–51
Alwala S, Collins A, Kimbeng J, Veremis C, Gravois KA (2009)
Identification of molecular markers associated with sugar-
related traits in a Saccharum interspecific cross. Euphytica
167:127–142
Andru S, Pan YB, Thongthawee S, Burner DM, Kimbeng CA
(2011) Genetic analysis of the sugarcane (Saccharum spp.)
cultivar ‘LCP 85–384’.I. Linkage mapping using AFLP,
SSR, and TRAP markers. Theor Appl Genet 123:77–93
Arencibia A (1998) Gene transfer in sugarcane. In: Biotech-
nology of food crops in developing countries. Springer,
New York, pp 79–104
Asins MJ (2002) Present and future of quantitative trait locus
analysis in plant breeding. Plant Breed 121:281–291
Beavis W (1998) QTL analyses: power, precision and accuracy.
In: Paterson AH (ed) Molecular dissection of complex
traits.CRC Press, Boca Raton
Chang KY, Lo HF, Lai CY, Yao PJ, Lin KH, Hwang SY (2009)
Identification of quantitative trait loci associated with
yield-related traits in sweet potato (Ipomoea batatas).
Botanical Stud 50:43–55
Churchill GA, Doerge RW (1994) Empirical threshold values
for quantitative trait mapping. Genetics 138:963–971
Cordeiro GM, Casu R, McIntyre CL, Manners JM, Henry RJ
(2001) Microsatellite markers from sugarcane (Saccharumspp) ESTs cross transferable to Erianthus and Sorghum.
Plant Sci 160:1115–1123
Da Silva JA, Bressiani JA (2005) Sucrose synthase molecular
marker associated with sugar content in elite sugarcane
progeny. Genet Mol Bio l 28:294–298
Da Silva JAG, Sorrells ME, Burnquist W, Tanksley SD (1993)
RFLP linkage map and genome analysis of Saccharum
spontaneum. Genome 36:782–791
Da Silva J, Honeycutt RJ, Burnquist W, Al-Janabi SM,
Sorrells ME, Tanksley SD, Sobral BWS (1995) Saccha-
rum spontaneum L. ‘SES 208’ genetic linkage map
combining RFLP- and PCR-based markers. Mol Breed 1:
165–179
Daugrois JH, Grivet L, Roques D, Hoarau JY, Lombard H,
Glaszimann JC, Hont AD (1996) A putative major gene for
rust resistance linked with an RFLP marker in sugarcane
cultivar R 570. Theor Appl Genet 92:1059–1064
Decroocq V, Fave M, Hagen L, Bordenhave L, Decroocq S
(2003) Development and transferability of apricot and
grape EST microsatellite markers across taxa. Theor Appl
Genet 106:912–922
Edme SJ, Miller JD, Glaz B, Tai PYP, Comstock JC (2005)
Genetic contribution to yield gains in the Florida sugarcane
industry across 33 years. Crop Sci. 45:92–97
Edme SJ, Glynn NG, Comstock JC (2006) Genetic segregation
of microsatellite markers in Saccharum officinarum and
S. spontaneum. Heredity 97:366–375
Garcia AAF, Kido EA, Meza AN, Souza HMB, Pinto LR, Pastina
MM, Leite CS, da Silva JAG, Ulian EC, Figueira A, Souza
AP (2006) Development of an integrated genetic map of a
sugarcane (Saccharum spp.) commercial cross, based on a
maximum-likelihood approach for estimation of linkage
and linkage phases. Theor Appl Genet 112:298–314
Grattapaglia D, Sederoff R (1994) Genetic linkage maps of
Eucalyptus grandis and Eucalyptus urophylla using a
pseudo-testcross: mapping strategy and RAPD markers.
Genetics 137:1121–1137
Gravois KA, Milligan SB (1992) Genetic relationship between
fiber and sugarcane yield components. Crop Sci 32:62–67
Grivet L, D’Hont A, Roques D, Feldmann P, Lanaud C,
Glaszmann JC (1996) RFLP mapping in cultivated sugar-
cane (Saccharum spp.): genome organization in a highly
polyploid and aneuploids interspecific hybrid. Genetics
142:987–1000
Guimaraes CT, Honeycutt RJ, Sills GR, Sobral BWS (1999)
Genetic maps of Saccharum officinarum L. and Saccharum
robustum Brandes & Jew. Ex Grassl. Genet Mol Biol
22:125–132
Hoarau JY, Offmann B, D’Hont A, Risterucci AM, Roques D,
Glaszmann JC, Grivet L (2001) Genetic dissection of a
modern sugarcane cultivar (Saccharum spp.). I. Genome
mapping with AFLP markers. Theor Appl Genet 103:
84–97
Hoarau JY, Grivet L, Offmann B, Raboin LM, Diorflat JP, Payet
J, Hellmann M, D’Hont A, Glaszmann JC (2002) Genetic
dissection of a modern sugarcane cultivar (Saccharumspp.). II. Detection of QTLs for yield components. Theor
Appl Genet 105:1027–1037
Hoisington D, Khairallah M, Gonzalez-de-Leon D (1994) Lab-
oratory protocols: CIMMYT applied molecular genetics
laboratory, 2nd edn. CIMMYT, Mexico DF
Jackson PA (2005) Breeding for improved sugar content in
sugarcane. Field Crops Res 92:277–290
Jackson PA, Hogarth DM (1992) Genotype environment inter-
actions in sugarcane I. Patterns of response across locations
and crop-years in North Queensland. Aust J Agric Re 43:
1447–1459
Jiang C, Zeng ZB (1995) Multiple trait analysis of genetic
mapping for quantitative trait loci. Genetics 140(11):
11–1127
Kang MS, Miller JD, Tai PYP, Dean JL, Glaz B (1987) Impli-
cations of confounding genotype 9 year and geno-
type 9 crop effects in sugarcane. Field Crops Res 15:
349–355
Kimbeng CA, Rattey AR, Hetherington M (2002) Interpretation
and implications of genotype by environment interactions
in advanced stage sugarcane selection trails in central
Queensland. Aust J Agric Res 53:1035–1045
Kosambi DD (1944) The estimation of map distances from
recombination values. Ann Eugen 12:172–175
Kriegner A, Cervantes JC, Burg K, Mwanga ROM, Zhang D
(2003) A genetic linkage map of sweet potato [Ipomoea
Euphytica (2013) 191:333–353 351
123
batatas (L.) Lam.] based on AFLP markers. Mol Breed
11:169–185
Lander ES, Botstein D (1994) Mapping Mendelian factors
underlying quantitative traits using RFLP linkage maps.
Genetics 36:705
Lingle SE, Viator RP, Johnson RM, Tew TL, Boykin DL (2009)
Recurrent selection for sucrose content has altered growth
and sugar accumulation in sugarcane. Field Crop Res
113:306–311
Liu BH (1998) Statistical genomics. CRC Press, New York
611 pp
McCouch SR, Chen X, Panaud O, Temnyk S, Xu Y (1997)
Microsatellite marker development, mapping and appli-
cations in rice genetics and breeding. Plant Mol Bio
35:89–99
Mester D, Robin Y, Minkov D, Nevo E, Korol A (2003) Con-
struction large-scale genetic maps using an evolutionary
strategy algorithm. Genetics 165:2269–2282
Ming R, Liu SC, Lin YR, da Silva J, Wilson W, Braga D, van
Deynze A, Wenslaff TF, Wu KK, Moore PH, Burnquist W,
Sorrells ME, Irvine JE, Paterson AH (1998) Detailed
alignment of Saccharum and Sorghum chromosome:
comparative organization of closely related diploid and
polyploidy genome. Genetics 150:1663–1682
Ming R, Liu SC, Moore PH, Irvine JE, Paterson AH (2001) QTL
analysis in a complex autopolyploid: genetic control of
sugar content in sugarcane. Genomic Res 11:2075–2084
Ming R, Wang YW, Draye X, Moore PH, Irvine JE, Paterson
AH (2002) Molecular dissection of complex traits in
autopolyploids: mapping QTLs affecting sugar yield and
related traits in sugarcane. Theor Appl Genet 105:332–345
Mohapatra T, Singh KS, Swain S, Sharma RK, Singh NK (2003)
STMS-based DNA fingerprints of the new plant type wheat
lines. Curr Sci 84:1125–1129
Morgante M, Olivieri AM (1993) PCR-amplified microsatellites
as markers in plant genetics. Plant J 3:175–182
Mudge J, Andersen WR, Kehrer RL, Fairbanks DJ (1996) A
RAPD genetic map of Saccharum officinarum. Crop Sci
36:1362–1366
Oliveira KM, Pinto LR, Marconi TG, Margarido GRA, Pastina
MM, Teixeira LHM, Figueira AM, Ulian EC, Garcia AAF,
Souza AP (2007) Functional genetic linkage map on EST
markers for a sugarcane (Saccharum spp.) commercial
cross. Mol Breed 20:89–208
Parh DK, Jordan DR, Aitken EAB, Mace ES, Jun-ai P, McIntyre
CL, Godwin ID (2008) QTL analysis of ergot resistance in
sorghum. Theor Appl Genet 117:369–382
Parida SK, Kalia SK, Kaul S, Dalal V, Hemaprabh G, Selvi A,
Pandit A, Singh A, Gaikwad K, Sharma TR, Srivastava PS,
Singh NK, Mohapatra T (2009) Informative genomic
microsatellite markers for efficient genotyping applica-
tions in sugarcane. Theor Appl Genet 118:327–338
Parida SK, Pandit A, Gaikwad K, Sharma TR, Srivastava PS,
Singh NK, Mohapatra T (2010) Functionally relevant
microsatellites in sugarcane unigenes. BMC Plant Biol
10:251
Pastina MM, Malosetti M, Gazaffi R, Mollinari M, Margarido
GRA, Oliveira KM, Pinto LR, Souza AP, van Eeuwijk FA,
Garcia AAF (2012) A mixed model QTL analysis for
sugarcane multiple-harvest-location trial data. Theor Appl
Genet 124:835–849
Paterson AH (1996) Making genetic maps. In: Paterson AH (ed)
Genome mapping in plants. R. G. Landes Company, San
Diego, pp 23–39
Paterson AH (1998) Molecular dissection of complex traits.
CRC Press, Boca Raton
Pinto LR, Garcia AAF, Pastina MM, Teixeira LHM, Bressiani
JA, Ulian EC, Bidoia MAP, Souza AP (2010) Analysis of
genomic and functional RFLP derived markers associated
with sucrose content, fiber and yield QTLs in a sugarcane
(Saccharum spp.) commercial cross. Euphytica 172:
313–327
Piperidis G, D’Hont A (2001) Chromosome composition anal-
ysis of various Saccharum interspecific hybrids by genomic
in situ hybridisation (GISH). Int Soc Sugar Cane Technol
Congress, vol 11, p 565
Piperidis N, Jackson PA, Hont AD, Besse P, Hoarau JY,
Courtois B, Aitken KS, McIntyre CL (2008) Comparative
genetics in sugarcane enables structured map enhancement
and validation of marker-trait associations. Mol Breed
21:233–247
Raboin LM, Oliveira KM, Lecunff L, Telismart H, Roques D,
Butterfield M, Hoarau JY, D’Hont A (2006) Genetic
mapping in the high polyploid sugarcane using a bi-
parental progeny; identification of a gene controlling stalk
colour and a new rust resistance gene. Theor Appl Genet
112:1382–1391
Reffay N, Jackson PA, Aitken KS, Hoarau JY, D’Hont A, Besse
P, McIntyre CL (2005) Characterisation of genome regions
incorporated from an important wild relative into Austra-
lian sugarcane. Mol Breed 15:367–381
Ritter KB, Jordan DR, Chapman SC, Godwin ID, Mace ES,
McIntyre CL (2008) Identification of QTL for sugar-related
traits in a sweet 9 grain sorghum (Sorghum bicolor L. Mo-
ench) recombinant inbred population. Mol Breed 22:367–384
Schon C, Utz HF, Groh S, Truberg B, Openshaw S, Melchinger
AE (2004) Quantitative trait locus mapping based on
resampling in a vast maize testcross experiment and its
relevance to quantitative genetics for complex traits.
Genetics 167:485–498
Singh RK, Singh S (1994) Early evaluation of sucrose for
varietal improvement in sugarcane. Sugar Cane 3:17–21
Singh RK, Singh GP (1998) Effect of sampling time on efficacy
of selection for quality traits in sugarcane. Sugar Cane
3:3–17
Singh RK, Singh GP (2000) Early evaluation of sugarcane for
quality improvement as an effective approach for varietal
selection in subtropical climate. Indian J Agric Sci 70:8–12
Singh RK, Singh RB, Singh SP, Sharma ML (2011) Identifi-
cation and transferability of sugarcane microsatellite to
other cereal genome. Euphytica 182:335–354
Smith AB, Stringer JK, Wei X, Cullis BR (2007) Varietal
selection for perennial crops where data relate to multiple
harvests from a series of field trials. Euphytica 157:
253–266
Tiwari DK, Pandey P, Singh RK, Singh SP, Singh SB (2011)
Genotype 9 environment interaction and stability analysis
in elite clones of sugarcane (Saccharum officianarum L.).
Int J Plant Breed Genet 5:93–99
Varshney RK, Graner A, Sorrells ME (2005) Genic microsat-
ellite markers in plants: features and applications. Trends
Biotech 23:48–55
352 Euphytica (2013) 191:333–353
123
Wang S, Basten C, Gaffney P, Zeng ZB (2004) Window QTL
cartographer version 2.0. Bioinformatics Research Center,
North Carolina State University, Raleigh, US
Woram RA, McGowan C, Stout JA, Gharbi K, Ferguson MM,
Hoyheim B, Davidson EA, Davidson WS, Rexraod C,
Danzmann (2004) A genetic linkage map for Arctic char
(Salvelinus alpinus): evidence for higher recombination
rates and segregation distortion in hybrid versus pure strain
mapping parents. Genome 47:304–315
Wu K, Burnquist W, Sorrels M, Tew T, Moore P, Tanksley S
(1992) The detection and estimation of linkage in polyp-
loids using single-dose restriction fragments. Theor Appl
Genet 83:294–300
Wu R, Maa CX, Painter I, Zeng ZB (2002) Simultaneous
maximum liklyhood estimation of linkage and linkage
phases in out crossing species. Theor Popul Biol 61:
349–363
Zeng ZB (1994) Precision mapping of quantitative trait loci.
Genetics 136:1457–1468
Zhang L, Yang G, Liu P, Hong D, Li S, He Q (2011) Genetic and
correlation analysis of silique-traits in Brassica napus L. by
quantitative trait locus mapping. Theor Appl Genet 122:
21–31
Euphytica (2013) 191:333–353 353
123