STUDY OF ENZYMATIC HYDROLYSIS OF PRETREATED BIOMASS AT INCREASED SOLIDS LOADING
Upload
wageningen-urCategory
view
0download
0
1
Analysis of by-product formation and sugar
monomerization in sugarcane bagasse pretreated at pilot
plant scale: differences between autohydrolysis, alkaline
and acid pretreatment.
Edwin van der Pol1,2*, Rob Bakker1, Alniek van Zeeland1, David Sanchez3, Arjan
Punt4, Gerrit Eggink1,2
1) Food and Biobased Research, Wageningen University and Research Center, PO Box 17,
6700 AA Wageningen, The Netherlands
2) Bioprocess Engineering, Wageningen University and Research Center, PO Box 16, 6700 AA
Wageningen, The Netherlands
3) Corbion Purac Biochem, PO Box 21, 4200 AA Gorinchem, The Netherlands
4) Laboratory of Food Chemistry, Wageningen University and Research center, Bornse
Weilanden 9, 6708 WG, The Netherlands
*Corresponding author at: Bioprocess Engineering, Wageningen University and Research Center, PO
Box 16, 6700 AA Wageningen, The Netherlands, +31 317 483685, [email protected]
2
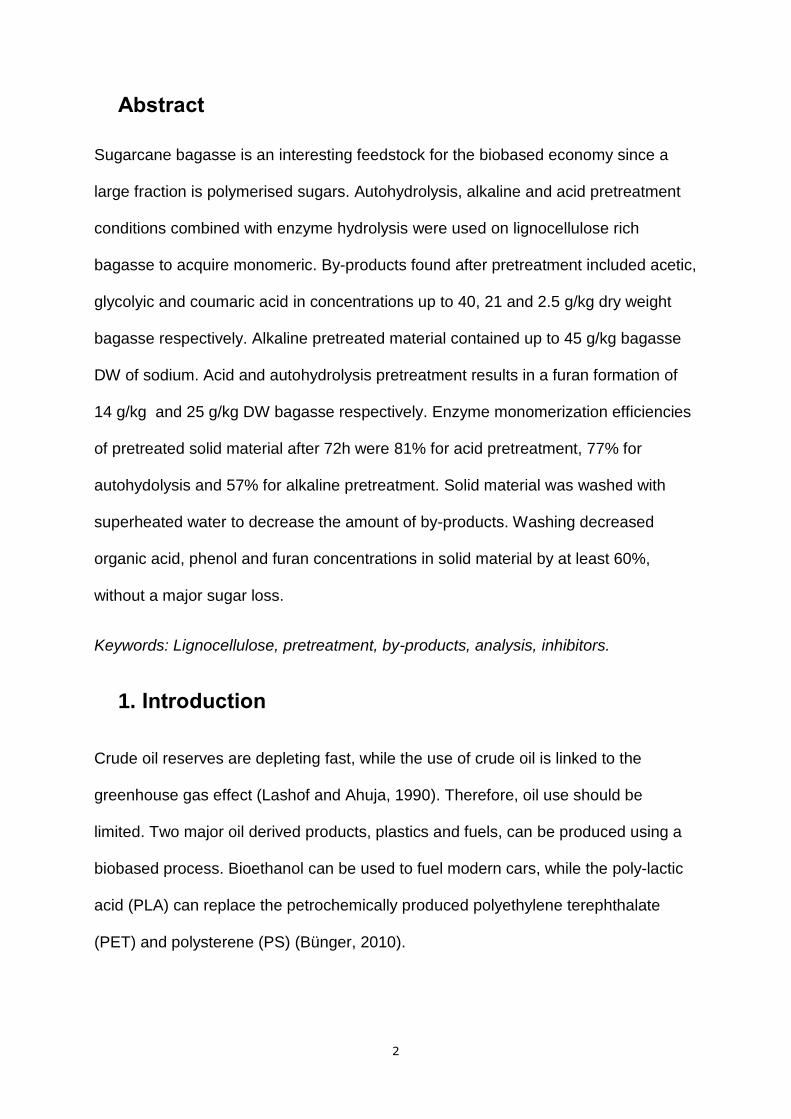
Abstract
Sugarcane bagasse is an interesting feedstock for the biobased economy since a
large fraction is polymerised sugars. Autohydrolysis, alkaline and acid pretreatment
conditions combined with enzyme hydrolysis were used on lignocellulose rich
bagasse to acquire monomeric. By-products found after pretreatment included acetic,
glycolyic and coumaric acid in concentrations up to 40, 21 and 2.5 g/kg dry weight
bagasse respectively. Alkaline pretreated material contained up to 45 g/kg bagasse
DW of sodium. Acid and autohydrolysis pretreatment results in a furan formation of
14 g/kg and 25 g/kg DW bagasse respectively. Enzyme monomerization efficiencies
of pretreated solid material after 72h were 81% for acid pretreatment, 77% for
autohydolysis and 57% for alkaline pretreatment. Solid material was washed with
superheated water to decrease the amount of by-products. Washing decreased
organic acid, phenol and furan concentrations in solid material by at least 60%,
without a major sugar loss.
Keywords: Lignocellulose, pretreatment, by-products, analysis, inhibitors.
1. Introduction
Crude oil reserves are depleting fast, while the use of crude oil is linked to the
greenhouse gas effect (Lashof and Ahuja, 1990). Therefore, oil use should be
limited. Two major oil derived products, plastics and fuels, can be produced using a
biobased process. Bioethanol can be used to fuel modern cars, while the poly-lactic
acid (PLA) can replace the petrochemically produced polyethylene terephthalate
(PET) and polysterene (PS) (Bünger, 2010).

3
The most abundant biopolymer on earth is lignocellulose, making it an interesting
feedstock for the biobased economy (Klemm et al., 2005; Teeri, 1997).
Lignocellulose is a polymer consisting of three substructures; cellulose, hemicellulose
and lignin. Cellulose consists solely of β-linked glucose molecules. Hemicellulose
composition can vary significantly. Hemicellulose can contain many different sugars,
including glucose, galactose, mannose, arabinose and xylose, while it can also
contain different acids, and has phenolic interlinks with lignin (Hatfield & Grabber,
1999). Lignin is a non-sugar containing polymer mainly build up from phenolic
compounds. (Fengel and Wegener, 1984)
An interesting source of lignocellulose is sugarcane bagasse. Bagasse is the leftover
of sugarcane stalks after sugar extraction. Bagasse has the following composition:
35-45% cellulose, 20-27% hemicellulose, 17-25% lignin and 10-15% other
compounds (Kurakake et al., 2001; Neureiter et al., 2002; Martín et al., 2007). The
amount of polymerised sugars in bagasse is between 60% and 70% on a dry weight
basis.
Sugars present in lignocellulose can be used in fermentation processes towards
bioethanol and lactic acid, the building block of PLA. To make the sugars available
for fermentation, a pretreatment is required. A commonly used method for
pretreatment requires the lignocellulose material to be milled and soaked in water.
The mixture is heated to 160-180ºC for 15-45 minutes, in which the lignocellulose is
partially decomposed and/or degraded. A low pH can enhance the monomerization
of hemicellulose (acid pretreatment), while a high pH can enhance the deacetylation
of hemicellulose, while the lignin can also be (partially) solibulized (alkaline
pretreatment). The pretreated bagasse can be converted to monomeric sugars using
enzymatic hydrolysis.

4
Acid and Alkaline pretreatment are well studied and common methods to decompose
lignocellulose, which have been shown to be cost efficient and applicable on a large
scale (Mcmillan et al., 2006; Humbird et al., 2011). Autohydrolysis is very interesting
as an alternative method due to the absence of chemical addition, saving on
operating costs.
Many studies have been performed on the hydrolysis of bagasse using acid and
alkaline pretreatment. However, no extensive study has been performed on the
formation of by-products during the pretreatment of sugarcane bagasse. Knowledge
of the formation of by-products from lignocellulosic material is very beneficial when
the decomposed lignocellulose is used in a fermentation process. The by-products
can result in problems further downstream, since they can inhibit the growth and
production of micro-organisms during fermentation (van der Pol et al, 2014).
Knowledge on the inhibitory compounds can provide strategies towards efficient
fermentation processes.
In this paper, by-product formation will be analysed in a process which uses a
chemical pretreatment, steam explosion and enzyme treatment. By-products are also
measured in the solid fraction after chemical pretreatment, a fraction which is often
overlooked with regard to by-products. Sugar monomerization was taken into
account to compare the efficiencies of the methods, showing that the pretreatment
was performed at industrial relevant conditions. The experiments were performed on
a pilot plant scale, using equipment which is comparable to large scale pretreatment
facilities. A washing step was introduced as a cheap method to remove part of the
by-products in the solid phase.

5
2. Material and methods
2.1 Chemicals and feedstock
All chemicals used during analysis were ordered at Sigma Aldrich (Missouri, USA)
and had a purity of at least 98%, with the exception of formic acid (purity of 95%).
The enzyme Accellerase 1500 was obtained from Genencor (Denmark). Sugarcane
grown in the Queensland area in Australia was harvested, milled and sugars were
extracted. The bagasse material was stored dry outside until used.
2.2 Chemical pretreatment and Washing
Pretreatment took place in the Mackay Renewable Biocommodities Pilot Plant which
is owned and operated by Queensland University, and which has been previously
described (Wong et al, 2011). The pilot plant facility consist of a first stage horizontal
pre-hydrolysis reactor capable of handling up to 22kg of biomass feedstock, solid
liquid separation via piston pressing, and a second stage vertical reactor capable of
performing steam explosion at a maximum of 26 bars.
In this research, 20 kg of bagasse with a dry weight of ~50% was loaded in the
horizontal reactor, which was pre-heated to 5ºC above reaction temperature for 20
min with 50 kg of demineralized water (Table 1 and figure 1). After the addition of
bagasse and water, chemicals were added. In case of acid pretreatment, sulphuric
acid (H2SO4) was added to a final concentration of 0.76% w/w acid/DW bagasse. In
case of alkaline pretreatment, sodium hydroxide (NaOH) was added to a
concentration of 10% w/w alkali/DW bagasse. Autohydrolysis did not involve the
addition of chemicals. For acid pretreatment, the reaction took place at 170ºC for 15
minutes. For alkaline pretreatment, the reaction took place at 160 ºC for 45 minutes.

6
Autohydrolysis was performed at 170ºC for 45 minutes. The reaction was performed
in triplicate. After pretreatment, a solid liquid separation took place by pressing the
solids with a large piston press. The liquid fraction was stored at -20ºC. The solid
fraction from one of the three runs performed using acid pretreatment(Run 3), the
solid fraction from two of the three runs performed using autohydrolysis (Run 5 and
6) and all solid alkaline fractions (Run 7,8 and 9) were washed with 10 liter
superheated water at a temperature of 150ºC for 5 minutes. A washing step was
always combined with a new solid liquid separation, where the liquid fraction, mainly
consisting of wash water, was discarded.
2.3 Steam explosion
A vertical pressure reactor was pre-heated for 5 minutes at 200ºC. The 9 different
solid fractions, acquired after chemical pretreatment or washing, with an estimated
dry weight of 20-30%, were placed without any additions in the reactor and heated
for 5 minutes at 200ºC. After 5 minutes, the blow valve was immediately opened,
which expelled the material with explosive force into the solid residue blow tank. Solid
samples were stored at 4ºC (acid and autohydrolysis) or at -20ºC (alkaline).
2.4 Enzyme treatment at laboratory scale
Solid-derived material of all 9 runs acquired after steam explosion were brought to
room temperature prior to use. 50 ml greiner tubes were filled with 10% w/w solids
and 90% w/w water. For alkaline pretreated solid samples, 7.5% w/w DW solids was
used due to swelling of the material. 1 ml of Accellerase 1500 (Genencor, Denmark)
was added to each tube. Samples were kept at a temperature of 55ºC for 72 hours.
After 24 and 48 hours, the pH was re-adjusted to pH 5, and 0.5 ml of Accellerase was

7
added to ensure a maximal sugar yield was reached. The enzyme treated solid-
derived fraction was stored at -20ºC until analysis.
2.5 HPAEC-PAD method for sugar analysis
Samples were brought to room temperature prior to use. Samples were centrifuged
for 10 minutes at 4000 RPM, solids were discarded. The supernatant was diluted 20-
200 times to ensure a measurement within calibration curve. To 4 ml of diluted
sample, 40 µl of fucose was added as an internal standard. 10 µl of
brominephenolblue was used to check whether the pH of the sample was above 4. If
the pH was too low, the pH was adjusted with bariumcarbonate until the solution is
clear-blue. Samples were filtered prior to analysis (0.2 µm Spartan, Whatman GmbH,
Dassel, Germany).
A HPAEC-PAD system was used to measure the samples (Dionex, California, USA).
Eluent A consisted of milliQ water, Eluent B contained MilliQ water with 150 mM
NaOH, Eluent C contained MilliQ water with 600 mM NaAc, and Eluent D contained
MilliQ water with 500 mM NaOH. The flow of the eluent was set at 1 ml/min. Over
time, the following eluent mixtures were used in gradient: t=0 min: 83% A 17% B ->
t= 2-30 min: 100% A -> T=33-42 min: 30% A 35% B 35% C -> T=45-50 min: 100% B.
Eluent D was used as a postcolumn flow. The column used was a Dionex CarboPac
PA1 (length 250 mm – I.D. 4 mm) with precolumn. Column oven temperature was set
at 35 º C. Measurements were compared to standard runs, and corrected based on
internal standard. Duplo measurements showed a standard deviation of less than 5
percent for all samples. Results were verified using a different sugar analysis
machine and method (Eylen et al, 2011), no major irregularities were seen with an
average deviation between methods of 6%.

8
2.6 HPLC method to determine organic acids and furans
Samples were brought to room temperature prior to use. Samples were centrifuged
for 7 minutes at 10.000 RPM. The supernatant was diluted 5 times to ensure
measurements within the calibration curve. To 400 µl diluted sample, 400 µl internal
standard consisting of 0.5 g/l Ftalic acid was added. Samples were measured using
HPLC equipment. The HPLC set-up consisted of a Waters 717plus autosampler, a
Waters 1515 isocratic pump and column oven, a Waters 486 UV detector, and a
waters 996 PDA (Milford, USA). Two columns were used to acquire sufficient
separation. The first column was a Grace Preveal organic acid 5µm column (Length
250 mm – I.D. 4.6 mm), which was followed by a Shodex RSpak KC-811 ion
exchange column (Length 300 mm – I.D. 8 mm). Acids and furans were determined
via spectrometry at a wavelength of 210 nm. As eluent, milliQ water supplemented
with 250 µl/l 85% phosphoric acid (H3PO4) (3.7 mM) was used. The oven
temperature was set at 60ºC, the flowrate was set at 1 ml/min. Samples were
compared to standards to determine the concentration. Sample standard deviation in
duplo measurements seen with this method did not exceed 7%.
Values for Acetic acid were crosschecked using a different column in the same
system. Using a Biorad aminex HPX-87H column (Length 300 mm – I.D. 7.8 mm),
eluent 0.004M H2SO4 in milli-Q water, flowrate 0.6 ml/min, average differences in
measurements between this method and double column method were less than 4%.
Values for furfural and HMF were cross checked with the same Biorad aminex
column on a different wavelength (280 nm), as well as on a different system (UPLC
Dionex-3000) with an Acquity UPLC BEH C18 RP column (length 50 mm – I.D. 2.1
mm) using milliQ with 2 ml/liter formic acid and Acetonitrile as eluent. The maximal
difference observed between these three methods was 8%.

9
2.7 Enzymatic formic acid determination
Due to the inability of the HPLC method to separate formic acid and pyruvic acid
using HPLC, a formic acid determination enzyme kit manufactured by R-biopharm
using UV( Roche, Switzerland) was used to determine the concentration of formic
acid present in the different samples. Samples were diluted 10 times to ensure a
measurement within the calibration curve.
2.8 ULC/MS method to determine phenolics
Prior to use, samples were brought to room temperature, centrifuged for 10 minutes
at 4000 RPM, and solids were discarded. To determine the concentration of phenolic
compounds, 100 µl of 10x diluted filtered sample was added to 900 µl milliQ water
and 100 µl internal standard. ULC/MS analysis where performed on a Dionex RSLC
system with an UltiMate 3000 Rapid Separation pump and auto-sampler. The
phenolic rich lignin hydrolysates were detected at 280 nm with a Dionex Ultimate
3000 RS Diode Array Detector in combination with a Thermo ScientificTM LCQ Fleet
Ion Trap Mass spectrometer. Phenolic compounds were separated using an Waters
Acquity UPLC BEH C18 reversed phase column (length 150 mm – I.D. 2.1 mm, 1.7
μm particle size) with a sample loop of 100 μL. The guard column was a Waters
VanGuard Acquity UPLC BEH C18 guard column (Length 5 mm – I.D. 2.1 mm, 1,7
μm particle size). The column temperature was maintained at 40 °C. Elution was
performed at a flow rate of 0.35 mL/min, using the following gradient (expressed as
solvent B): initial composition: 4.0 % B, 0.0–1.0 min: 4.0 % B; 1.0–17.0 min: 56.0 %
B; 17.0–18.0 min: 70.0 % B; 18.0–20.0 min: 70.0 % B; 20.0–21.0 min: 100 % B;
21.0–24.0 min: 100 % B; 24.0–25.0 min: 4.0 % B; 25.0–30.0 min: 4.0 % B. Eluent A
consisted of Biosolve ULC/MS grade water with 2 mL/L acetic acid (MS positive
modus) or Biosolve ULC/MS grade water with 50 mM ammonium acetate buffer (MS

10
negative modus). Eluent B consisted of Biosolve ULC/MS grade acetonitrile. Heated
electrospray ionization (HESI) mass spectrometry was performed in both positive and
negative modes. The LCQ mass spectrometer was operated with the HESI set on
100°C and the capillary temperature at 130°C, sheath gas at 70 (arbitrary units), the
auxiliary gas at 15 (arbitrary units) and the sweep gas at 2 (arbitrary units). The
electrospray voltage was set to 3.5 kV. In the positive modus the capillary voltage
was set at -22 V, and the tube lens offset at −89.89 V. In the negative modus the
capillary voltage was set at 19 V, and the tube lens offset at 75 V. The injection time
was 200 ms. Mass spectra were recorded from m/z 80–500 at unit mass resolution
without in-source fragmentation. For sequential MS/MS experiments, the normalized
collision energy was 35%, with wideband activation turned off. Several representative
chromatograms are shown in the supplementary data. Concentrations were
calculated based on standards with known concentrations.
2.9 Element analysis
30 different elements, including AL, Ca, Fe, K, Mg, Na, P, S and Si, were analysed
using ICP( Varian vista PRO, Palo Alto, California, USA). Prior to analysis, the
samples were centrifuged for 5 minutes at 8000 RPM. 1 gram supernatant was
dissolved in 2 ml 70% nitric acid and 97 ml milliQ water. Concentrations were
calculated based on standards with a known concentration.

11
3. Results and discussion
Bagasse has been pretreated to monomerize lignocellulosic sugars. The first step of
this pretreatment is a chemical pretreatment. This chemical pretreatment is
performed either with the addition of acid, alkali, or without the addition of any
chemicals. After this first chemical pretreatment, the whole reactor was piston-
pressed to acquire a solid liquid separation. 3 types of liquid fractions can be
distinguished (figure 1): liquid samples acquired after acid pretreatment (Hence
called Acid liquid fraction), liquid samples acquired after alkaline pretreatment
(Alkaline liquid fraction), and liquid samples acquired after autohydrolysis
(Autohydrolysis liquid fraction).
The solid fraction, acquired after the solid liquid separation, underwent several more
processing steps. First, an (optional) washing stage was performed. Second, the
solids were steam exploded. Afterwards, on a smaller scale, the solids were treated
with enzymes to monomerize all sugars. The whole process acquired 5 different
samples after enzyme treatment (Figure 1): solid-derived samples which were initially
pretreated with acid, and were washed (Hence called Washed solid-derived acid
fraction) or unwashed (solid-derived acid fraction), solid derived samples which were
initially pretreated without chemicals, and were washed (Washed solid-derived
autohydrolysed fraction) or unwashed (solid-derived autohydrolysed fraction), and
solid-derived samples which were initially pretreated with alkali and washed (Washed
solid-derived alkaline fraction). Both the solid-derived and liquid fraction can be
added up to form one total value of the amount of by-product formed (Hence called
total fraction).

12
Analysis are performed to determine the concentration of abundant acids, furans,
phenolics and ions, in combination with the amounts of sugars present in each type
of sample (Table 2). All values were recalculated to grams per kilogram initial dry
weight bagasse, since concentrations are very subjective to the amount of initial
biomass used.
3.1 Quantification of sugars in different streams of pretreated bagasse
Analysis was performed to determine the amount of sugars present both the liquid
and solid-derived fraction (Table 2A). In the liquid fraction, acquired directly after
chemical pretreatment, both monomeric sugars and oligomeric sugar polymers are
present. In all three types of chemical pretreatment, the amount of polymeric sugar
which could be depolymerized by enzymes in the liquid fraction was roughly 25 g/kg
DW bagasse. The monomeric sugar content showed large differences. Very small
amounts of monomeric sugars were found in the in the alkaline liquid fraction. On the
other hand, large monomerization of the hemicellulose occurred in the acid liquid
fraction, with over 125 grams of sugars per kg of DW found after chemical
pretreatment, the majority being xylose. In the autohydrolysed liquid fraction, 56
grams per kg DW of sugars were found.
The most abundant sugar in the solid-derived fraction is glucose. In the solid-derived
alkaline fraction, the xylose fraction is much larger than in the solid-derived
autohydrolysed and acid fraction. The amount of xylose found in the solid-derived
alkaline fraction was 110 g/kg DW bagasse, while the solid-derived autohydrolysis
and acid fraction contained 30-40 g/kg DW bagasse. It can be concluded that were
most hemicellulose in acid and autocatalysis pretreatment is solubilized, the
hemicellulose largely remains part of the solid structure in alkaline pretreatment. All

13
pretreatment methods yielded around 450 gram of monomeric sugar per kg DW in
the solid-derived fraction.
In total, acid pretreated bagasse can yield 600 gram sugars per kg DW bagasse,
where alkaline and autohydrolysis pretreated bagasse yield around 500 gram sugars
per kg DW bagasse (figure 2 and table 3A). According to literature, the sugar fraction
in bagasse is 62-73% on a dry weight basis (Kurakake et al., 2001; Neureiter et al.,
2002; Martín et al., 2007). When using this data, a combination of acid pretreatment,
steam explosion and enzyme treatment results in a sugar monomerization of at least
82%. The main sugar loss in acid pretreated bagasse is in hemicellulose sugars.
Using autohydrolysis and alkaline pretreatment, at least 65% of the sugars are
monomerized during the whole pretreatment process. The main sugar loss in alkaline
pretreatment is both in hemicellulose sugars as well as in glucans, in autohydrolysis
the loss is mainly found in hemicellulose sugars. The addition of a washing step led
to a sugar content reduction of 8% in acid pretreated bagasse, while in
autohydolysed bagasse the sugar content with a washing step was slightly higher,
but not significantly with a difference of 3%.
The solid material acquired after steam explosion was also analysed chemically for
sugar content using compositional analysis (Table 3B). Acid and autohydrolysis solid
fraction contained 48% glucan and 3-4% xylan, while alkaline solid fraction contains
52% glucan and 19% xylan. Overall, the enzyme monomerization efficiency after 72h
of acid pretreated material was 81% taking into account the weight of water required
for hydrolysis, autohydrolysis has an enzyme monomerization efficiency of 77%,
while the enzyme monomerization efficiency of alkaline pretreated material was much
lower with 57%.

14
3.2 Presence of furans in pretreated bagasse
Furans are formed by dehydration of monomeric sugar molecules. The dehydration is
stimulated by process conditions with a lower pH and a higher temperature (Dunlop,
1948). Furans can only be formed when monomeric sugars are released during the
pretreatment.
After alkaline pretreatment of bagasse, only small amounts of furans are observed
due to an absence of monomeric sugars combined with a high pH (Table 2B). In
autocatalysis and acid pretreatment, furans are found in a much larger quantity.
Furfural and 5-Hydroxymethylfurfural (5-HMF), the two main furanic compounds,
have different origins. Where furfural is dehydrolysed pentosesugars, 5-HMF is
degraded hexose sugars. In Bagasse, furfural is more abundant than 5-HMF, mainly
due to the higher presence of monomeric pentoses such as xylose during the initial
pretreatment. In the acid liquid fraction, 10% of the monomeric sugars are hexose,
while 90% of the monomeric sugars are pentose.
In total, autohydrolysis results in a furfural formation of more than 20 gram per kg of
DW bagasse, with most furans being present in the liquid fraction. The presence of
furfural in the acid solid-derived and liquid fraction is lower, but still considerable with
4.3 and 7.7 gram per kg DW bagasse respectively. Alkaline pretreatment did not
result in significant furan formation.
The furfural present in the solid-derived fraction after chemical pretreatment can be
removed relatively easily by a washing step, reducing the amount of furans in solid-
derived fraction by over 95%. Apart from furfural, smaller quantities of 5-HMF are
formed, up to 2 gram per kg DW in acid pretreated and up to 4 gram per kg DW in
autohydrolysis pretreated samples.

15
Furfural can be a main inhibitory by-product during fermentation. 1.6 gram per liter of
furfural has been shown to decrease the growth rate of Z. mobilis by 50%, while 1
gram per liter can severely inhibit some S. cerevisiae strains (Delgenes et al., 1996;
Franden et al., 2009). In fermentations performed at higher sugar concentrations
acquired from acid pretreated or autohydrolysed bagasse, furfural can be a major
inhibiting compound, and can therefore be a major pitfall of acid and autohydrolyis
pretreated material. Alkaline pretreated material did not contain any furfural, which is
a great advantage during fermentation.
3.3 Presence of small organic acids in pretreated bagasse
Small organic acids can originate from several sources. The acids can already be
present in the structure, for instance acetic acid which is linked to the backbone of
hemicellulosic xylans (Sun et al., 2004). The pretreatment process can release these
acids. The acids can also be formed during pretreatment. Examples are levulinic acid
and formic acid, which are formed when furans are further dehydrated. Furthermore,
micro-organisms can contaminate the substrate and produce a range of different
acids, for example lactic acid.
Table 2C shows the presence of small organic acids in pretreated bagasse. The most
abundant organic acid in acid and alkaline pretreated material is acetic acid. Where
up to 23 grams of acetic acid per kg of DW bagasse can be present in total after acid
pretreatment, over 40 grams per kg DW of acetic acid can be present in total after
alkaline pretreatment. This equals an amount of up to 10 gram of acetic acid per 100
grams of sugar after alkaline pretreatment, while acid pretreated material contained
around 4 gram of acetic acid per 100 grams of sugar. At low pH fermentations, 3.5
gram per liter of acetic acid can reduce growth rates by 33% in S. cerevisiae, while at

16
higher pH 9 gram per liter of acetic acid has the same effect (Taherzadeh et al.,
1997). It has been reported earlier that alkaline pretreatment enhances the
deacetylation of hemicellulose (Kumar et al., 2009). High acetic acid concentrations
can be a potential pitfall of alkaline pretreated material during fermentation.
In autohydrolysis pretreated bagasse and to a lesser extent in acid pretreated
bagasse, large amounts of furans are present, as shown in table 2B. In an
environment with a low pH and high temperature, 5-HMF can easily dehydrate to
levulinic acid and formic acid. Autohydrolysis results in total in more than 55 grams of
levulinic acid per kg DW bagasse. Acid pretreatment, which was slightly less severe,
yielded 21 grams of levulinic acid per kg DW bagasse in total. In alkaline pretreated
material, where no furans were formed, levulinic acid was found in an amount of 6
grams per kg DW bagasse.
Another small organic acid formed in large quantities is glycolic acid. It was found in
concentrations up to 20 grams per kg DW after autohydrolysis. In acid and alkaline
pretreated material, the formation was slightly lower at 12 and 15 gram per kg DW
respectively. The presence of glycolic acid in substantial concentrations is typical for
sugar-rich plants like sugarcane or sugar beets.
Lactic acid was not present in high concentrations. The presence of lactic acid was
below the detection limit of 0.5 gram per kg DW bagasse.
In total, more 12% of the initial dry weight ended up as small organic acids in the
case of autohydrolysis pretreatment. In alkaline pretreatment, 7% of the initial dry
weight ended up as small organic acids, however it should be noted that this already
included a washing step. The amount without a washing step is estimated at just
under 10%, using the washing efficiency in acid and autocatalysis pretreated
17
bagasse. Due to the high amount of sodium hydroxide added, a washing stage is
always required. Acid pretreated material yielded the lowest small acidic compound
formation, only 6% of the initial dry weight ended up as small organic acidic
compounds.
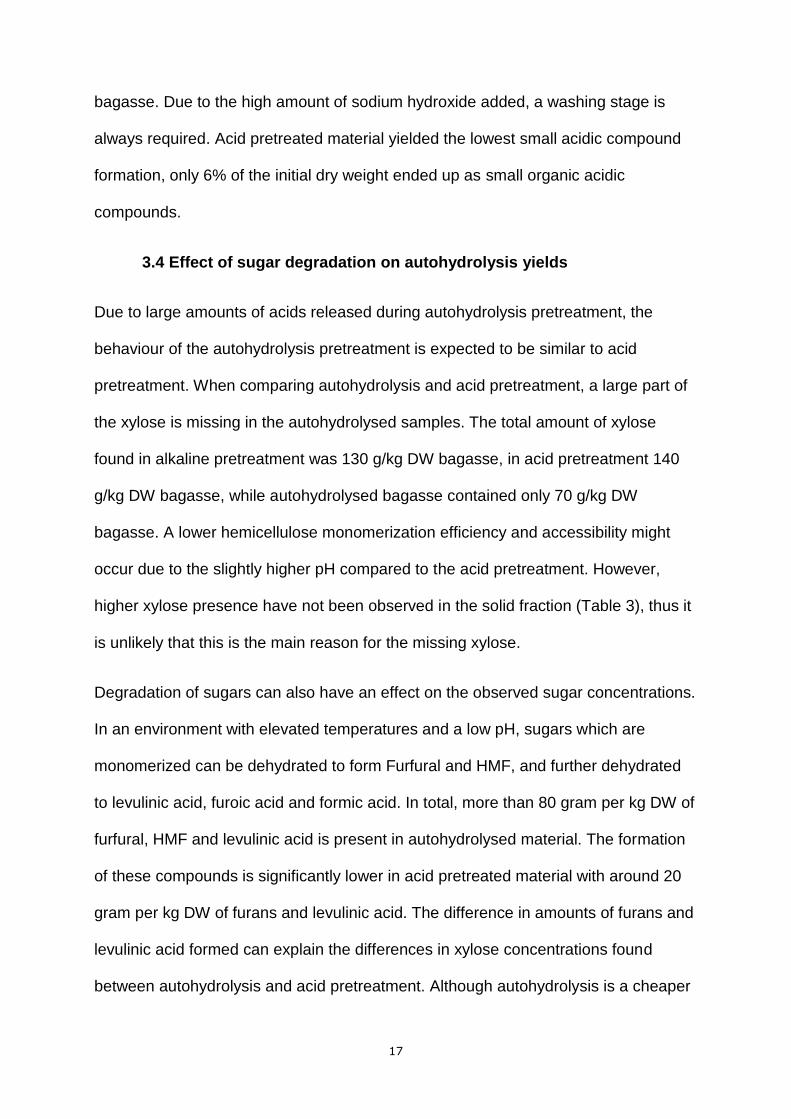
3.4 Effect of sugar degradation on autohydrolysis yields
Due to large amounts of acids released during autohydrolysis pretreatment, the
behaviour of the autohydrolysis pretreatment is expected to be similar to acid
pretreatment. When comparing autohydrolysis and acid pretreatment, a large part of
the xylose is missing in the autohydrolysed samples. The total amount of xylose
found in alkaline pretreatment was 130 g/kg DW bagasse, in acid pretreatment 140
g/kg DW bagasse, while autohydrolysed bagasse contained only 70 g/kg DW
bagasse. A lower hemicellulose monomerization efficiency and accessibility might
occur due to the slightly higher pH compared to the acid pretreatment. However,
higher xylose presence have not been observed in the solid fraction (Table 3), thus it
is unlikely that this is the main reason for the missing xylose.
Degradation of sugars can also have an effect on the observed sugar concentrations.
In an environment with elevated temperatures and a low pH, sugars which are
monomerized can be dehydrated to form Furfural and HMF, and further dehydrated
to levulinic acid, furoic acid and formic acid. In total, more than 80 gram per kg DW of
furfural, HMF and levulinic acid is present in autohydrolysed material. The formation
of these compounds is significantly lower in acid pretreated material with around 20
gram per kg DW of furans and levulinic acid. The difference in amounts of furans and
levulinic acid formed can explain the differences in xylose concentrations found
between autohydrolysis and acid pretreatment. Although autohydrolysis is a cheaper

18
method to perform due to absence of chemical addition, the degradation of
hemicellulose sugars, and the formation of large amounts of potential inhibiting by-
products make this method less interesting to use as pretreatment method for
lignocellulose on a large scale.
3.5 Quantification and qualification of phenols in pretreated bagasse
Phenols are in quantity the smallest fraction of by-products formed during the
pretreatment. However, they are in most cases more toxic for micro-organisms than
for instance small organic acids (Klinke et al., 2003), and are therefore still important
by-products of which the formation should be limited.
Among the abundant phenols found after pretreatment are coumaric acid and ferulic
acid in total amounts up to 2.5 and 0.3 gram per kg DW bagasse respectively (Table
2D). In monocot-type lignocellulose such as sugarcane bagasse, both coumaric acid
and ferulic acid have important structural properties in maintaining bonds between
lignin and hemicellulose (Hatfield and Grabber, 1999). The release of coumaric and
ferulic acid is therefore an indication of the degradation of the lignocellulosic
structure. Besides pure ferulic acid and coumaric acid, dimers and oligomers are
formed which contain one or more ferulate and/or coumarin subunit (Table 4). In acid
pretreated samples, coumarin-malic and ferulate-malic esters are observed, in line
with earlier reports (Harbaum et al., 2007). Furthermore, coumarin-pentose sugar
esters and ferulate-pentose sugar esters are observed. The pentose sugars are most
likely arabinose (Hatfield and Grabber, 1999). In alkali pretreated material, two non-
defined diferulic acids were found. One diferulic acid is likely to be 8-O-4 diferulic
acid, based on earlier MS work (Appeldoorn et al., 2010; Vismeh et al., 2013). Also,

19
two unkown esters of coumarin and ferulate were found with mass 342 and 372.
Combined with the amounts of coumaric and ferulic acids formed, these observations
indicates a loss of structure in the lignin-hemicellulose interaction, thus increasing the
accessibility of the cellulose.
Other phenols which were found are 4-hydroxybenzaldehyde, vanillin, 4-
hydroxybenzoic acid and syringaldehyde. 4-hydroxybenzaldehyde and
syringaldehyde are building blocks of the lignin. Although Concentrations of phenolic
compounds were relatively small, 4-hydroxybenzaldehyde was found in much higher
concentrations in alkaline pretreated bagasse with 0.5 gram per kg DW bagasse,
compared to 0.2 gram per kg DW bagasse in acid pretreated bagasse. Since
bagasse contains around 17-25% w/w lignin compounds (Kurakake et al., 2001;
Neureiter et al., 2002; Martín et al., 2007), and the measured amounts of 4-
hydroxybenzaldehyde and syringaldehyde are less than 0.1% w/w, it can be
concluded that lignin degradation towards monomers is relatively small.
Where acid and autohydrolysis pretreatment resulted in the formation of phenolic
acids and aldehydes , a large amount of phenolic ketones was observed in alkaline
pretreated lignocellulose. The effect of a different pretreatment has a large influence
on syringates. Where syringates were mainly observed as syringic acid in
autohydrolysis and acid pretreatment, they were found as acetosyringone in alkali
pretreated material. Furthermore a larger syringate based structure was found in
alkali pretreated material (table 4).
Overall, autohydrolysis yielded the lowest amount of phenols, with a total of 2.7
grams phenolics per kg DW. Acid pretreated yielded in total around 4.5 gram per kg
DW of phenols. Alkaline pretreatment yielded the most phenols in the liquid fraction

20
nearly twice as much as the liquid autohydrolysed fraction, and had a similar phenol
concentration in the washed solid-derived fraction.
3.6 Metal and Ion analysis in pretreated bagasse
Metals and ions are often overlooked as potential inhibitor of fermentation processes.
Plant material can contain large amounts of metals, especially when grown in an area
with metal rich soil. The chemical pretreatment also adds to the amounts of sulphur
and sodium present in the bagasse after pretreatment.
In autohydrolysed material, a total of 15 gram of metals and ions per kg DW bagasse
was found (Table 2E). The main compound observed is sodium. Part of this sodium
is added to ensure an optimal pH during enzyme treatment. Other metals and ions
found in significant concentrations are sulphur, silicon and potassium.
Sulphuric acid is added in acid pretreatment. Therefore, enhanced concentrations of
2.4 gram sulphur per kg DW bagasse are found in the liquid acid fraction. However,
even without washing the concentration sulphuric acid in the solid-derived acid
fraction is not elevated.
In alkaline pretreatment sodium hydroxide is added in the chemical pretreatment
stage of the procress. The presence of sodium in the liquid alkaline fraction is more
than 30 gram per kg DW bagasse, which is much higher than the 0.2 gram per kg
DW bagasse observed in the other two pretreatment methods. Even with a washing
step, the amount of sodium is almost twice as high in the solid-derived alkaline
fraction compared to the autohydrolysis and acid pretreatment, while much less
sodium was added during the enzymatic hydrolysis for pH control.
21
3.7 Effect of washing step on autohydrolysis and acid pretreated solid-
derived fraction
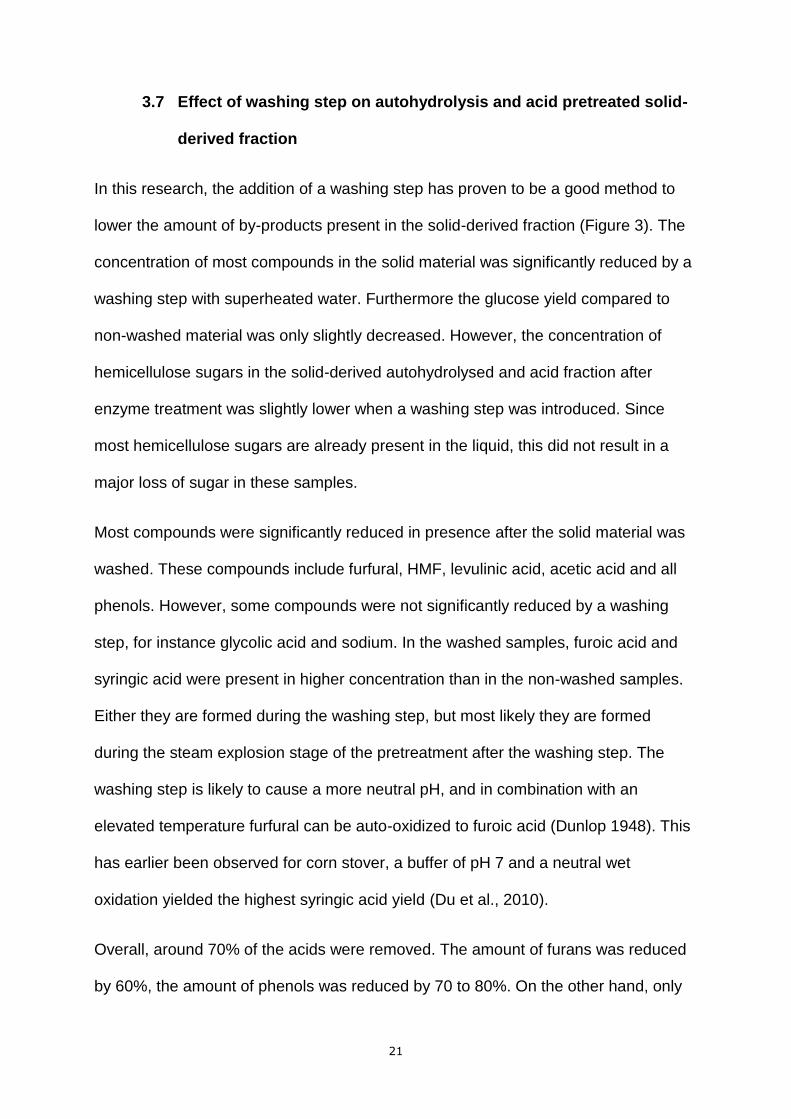
In this research, the addition of a washing step has proven to be a good method to
lower the amount of by-products present in the solid-derived fraction (Figure 3). The
concentration of most compounds in the solid material was significantly reduced by a
washing step with superheated water. Furthermore the glucose yield compared to
non-washed material was only slightly decreased. However, the concentration of
hemicellulose sugars in the solid-derived autohydrolysed and acid fraction after
enzyme treatment was slightly lower when a washing step was introduced. Since
most hemicellulose sugars are already present in the liquid, this did not result in a
major loss of sugar in these samples.
Most compounds were significantly reduced in presence after the solid material was
washed. These compounds include furfural, HMF, levulinic acid, acetic acid and all
phenols. However, some compounds were not significantly reduced by a washing
step, for instance glycolic acid and sodium. In the washed samples, furoic acid and
syringic acid were present in higher concentration than in the non-washed samples.
Either they are formed during the washing step, but most likely they are formed
during the steam explosion stage of the pretreatment after the washing step. The
washing step is likely to cause a more neutral pH, and in combination with an
elevated temperature furfural can be auto-oxidized to furoic acid (Dunlop 1948). This
has earlier been observed for corn stover, a buffer of pH 7 and a neutral wet
oxidation yielded the highest syringic acid yield (Du et al., 2010).
Overall, around 70% of the acids were removed. The amount of furans was reduced
by 60%, the amount of phenols was reduced by 70 to 80%. On the other hand, only

22
20% of the ions were removed. In solid-derived acid fraction, washing resulted in a
sugar loss of 8%, which was mainly xylose. In the autohydrolysis pretreated samples,
a large fraction of the xylose was also removed, but the glucose yield was enhanced
slightly.
4 Conclusions
This paper has given an overview of the strengths of different pretreatment methods.
When looking at sugar monomerization efficiencies, acid pretreatment is the best
choice. Acid pretreatment also shows the lowest formation of small organic acids.
Where autohydrolysis and acid pretreatment have a high furan formation, alkaline
pretreatment does not result in furan formation. Autohydrolysis has the highest acid
and furan formation, but the lowest phenol and ion formation. A washing step is
beneficial. It can lower the presence of organic acids, furans and phenols by 60-80%,
while the loss of sugar is relatively small.
5 Acknowledgement
The authors of this paper would like to thank the whole BE-Basic consortium for
funding this project, with special thanks for Corbion and DSM. Furthermore, the
authors would like to acknowledge the laboratory of Food chemistry, Wageningen
UR, for performing several analysis performed on the pretreated bagasse.
6 Supplementary data
Several representative chromatograms have been included as electronic
supplementary data to this article.

23
1 Appeldoorn, M.M., Kabel, M.A., Van Eylen, D., Gruppen, H., Schols, H.A. 2010. Characterization of Oligomeric Xylan Structures from Corn Fiber Resistant to Pretreatment and Simultaneous Saccharification and Fermentation. J. Agric. Food Chem. 58, 11294-11301.
2 Chen S-F., Mowery R.A., Castleberry V.A., van Walsum G.P., Chambliss C.K. 2006. High-performance liquid chromatography method for simultaneous determination of aliphatic acid, aromatic acid and neutral degradation products in biomass pretreatment hydrolysates. J. Chromatogr. A 1104, 54-61.
3 Du, B., Sharma, L.N., Becker, C., Chen, S.-F., Mowery, R.A., van Walsum, G.P., Chambliss, C.K. 2010. Effect of varying feedstock–pretreatment chemistry combinations on the formation and accumulation of potentially inhibitory degradation products in biomass hydrolysates. Biotechnol. Bioeng. 107, 430-440.
4 Dunlop, A.P. 1948. Furfural formation and behavior. Ind. Eng. Chem. 40, 204-209. 5 Eylen, D. van, Dongen, F. van, Kabel, M, Bont, J. de. Corn fiber, cobs and stover:
Enzyme-aided saccharification and co-fermentation after dilute acid pretreatment. Bioresource Technol. 102, 5995-6004.
6 Fengel, D., Wegener, G. 1984. Wood: Chemistry, ultrastructure, reactions, first ed. De Gruyter, Berlin.
7 Franden M.A., Pienkos P.T., Zhang M. 2009. Development of a high-throughput method to evaluate the impact of inhibitory compounds from lignocellulosic hydrolysates on the growth of Zymomonas mobilis. J. Biotechnol. 144, 259-267.
8 Harbaum, B., Hubbermann, E.M., Wolff, C., Herges, R., Zhu, Z., Schwarz, K. 2007. Identification of Flavonoids and Hydroxycinnamic Acids in Pak Choi Varieties ( Brassica campestris L. ssp. chinensis var. communis) by HPLC–ESI-MS n and NMR and Their Quantification by HPLC–DAD. J. Agric. Food Chem. 55, 8251-8260.
9 Hatfield, R.D.R., John., Grabber, J.H. 1999. Cell wall cross-linking by ferulates and diferulates in grasses. J. Sci. Food Agr. 79, 403-407.
10 Humbird D., Davis R., Tao L., Kinchin C., Hsu D., Aden A., Schoen P., Lukas J., Olthof B., Worley M., Sexton D., Dudgeon D. 2011. Process design and economics for biochemical conversion of lignocellulosic biomass to ethanol. NREL http://www.researchgate.net/publication/229843699_Process_Design_and_Economics_for_Biochemical_Conversion_of_Lignocellulosic_Biomass_to_Ethanol_Dilute-Acid_Pretreatment_and_Enzymatic_Hydrolysis_of_Corn_Stover/file/9fcfd5011638d5a2af.pdf Accessed 12 Dec 2014.
11 Klemm, D., Heublein, B., Fink, H.-P., Bohn, A. 2005. Cellulose: Fascinating Biopolymer and Sustainable Raw Material. Angew. Chem. Int. Ed. 44, 3358-3393.
12 Klinke H.B., Ahring B.K., Schmidt A.S., Thomsen A.B. 2002. Characterization of degradation products from alkaline wet oxidation of wheat straw. Bioresource Technol. 82, 15-26.
13 Klinke, H.B., Olsson, L., Thomsen, A.B., Ahring, B.K. 2003. Potential inhibitors from wet oxidation of wheat straw and their effect on ethanol production of Saccharomyces cerevisiae: Wet oxidation and fermentation by yeast. Biotechnol. Bioeng. 81, 738-747.

24
14 Kumar, P., Barrett, D.M., Delwiche, M.J., Stroeve, P. 2009. Methods for Pretreatment of Lignocellulosic Biomass for Efficient Hydrolysis and Biofuel Production. Ind. Eng. Chem. Res. 48, 3713-3729.
15 Kurakake, M., Kisaka, W., Ouchi, K., Komaki, T. 2001. Pretreatment with ammonia water for enzymatic hydrolysis of corn husk, bagasse, and switchgrass. Appl. Biochem. Biotechnol. 90, 251-259.
16 Lashof, D.A., Ahuja, D.R. 1990. Relative contributions of greenhouse gas emissions to global warming. Nature 344, 529-531.
17 Martín, C., Klinke, H.B., Thomsen, A.B. 2007. Wet oxidation as a pretreatment method for enhancing the enzymatic convertibility of sugarcane bagasse. Enzyme Microb. Technol. 40, 426-432.
18 McMillan J., Adney W.S., Mielenz J.R., Klasson K.T., Thomsen M.H., Thygesen A., Jørgensen H., Larsen J., Christensen B.H., Thomsen A.B. 2006. Preliminary Results on Optimization of Pilot Scale Pretreatment of Wheat Straw Used in Coproduction of Bioethanol and Electricity. Appl. Biochem. Biotech. 130, 448-460. doi:10.1385/ABAB:130:1:448.
19 Negro, M.J., Manzanares, P., Oliva, J.M., Ballesteros, I., Ballesteros, M. 2003. Changes in various physical/chemical parameters of Pinus pinaster wood after steam explosion pretreatment. Biomass Bioenergy. 25, 301-308.
20 Neureiter, M., Danner, H., Thomasser, C., Saidi, B., Braun, R. 2002. Dilute-acid hydrolysis of sugarcane bagasse at varying conditions. Appl Biochem Biotechnol. 98-100, 49-58.
21 Sun, J.X., Sun, X.F., Sun, R.C., Su, Y.Q. 2004. Fractional extraction and structural characterization of sugarcane bagasse hemicelluloses. Carbohydr. Polym. 56, 195-204.
22 Taherzadeh M.J., Niklasson C., Lidén G. 1997. Acetic acid—friend or foe in anaerobic batch conversion of glucose to ethanol by Saccharomyces cerevisiae? Chem. Eng. Sci. 52, 2653-2659.
23 Teeri, T.T. 1997. Crystalline cellulose degradation: new insight into the function of cellobiohydrolases. Trends Biotechnol. 15, 160-167.
24 Van der Pol E.C., Bakker R.R., Baets P., Eggink G. 2014. By-products resulting from lignocellulose pretreatment and their inhibitory effect on fermentations for (bio)chemicals and fuels. Appl. Microbiol. Biotechnol. 98, 9579-9593.
25 Vismeh, R., Lu, F., Chundawat, S.P.S., Humpula, J.F., Azarpira, A., Balan, V., Dale, B.E., Ralph, J., Jones, A.D. 2013. Profiling of diferulates (plant cell wall cross-linkers) using ultrahigh-performance liquid chromatography-tandem mass spectrometry. Analyst, 138, 6683-6692.
26 Wong H.H., Albertson P., O’Hara I.M. 2011. An update on the Mackay renewable biocommodities pilot plant: Preliminary trial results.Proc Aust Soc Sugar Cane Technol 1-11. http://eprints.qut.edu.au/56547/ Accessed: 15-12-2014
27 Wu, C-S, 2009. Renewable resource-based composites of recycled natural fibers and maleated polylactide bioplastic: Characterization and biodegradability. Polym. Degrad. Stabil. 94, 1076-1084.

25
Acid treatment0.76% W/DW H2SO4
15 min, 170ºc (1)
Solid liquid separation
Piston Press (1)
Washing stage+ Piston Press
10 L water150ºC, 5 min
(1)
Acid Liquid FractionRun 1, 2 and 3
Solids
Enzyme treatmentAccellerase 1500
2% V/V, 72h, 50ºC (2)
LiquidsDiscarded
Steam explosion200ºC, 5 min (1)
Enzyme treatmentAccellerase 1500
2% V/V, 72h, 50ºC (2)
Acid Solid-DerivedFraction, Run 1 and 2
Acid Solid-DerivedFraction, Run 3
20 kg bagasse (DW 50%)50L demi water
Autohydrolysis,No chemicals added
45 min, 170ºC (1)
Solid liquid separation
Piston Press (1)
Washing stage+ Piston Press
10 L water150ºC, 5 min
(1)
Autohydrolysis Liquid FractionRun 4, 5 and 6
Solids
Enzyme treatmentAccellerase 1500
2% V/V, 72h, 50ºC (2)
LiquidsDiscarded
Enzyme treatmentAccellerase 1500
2% V/V, 72h, 50ºC (2)
Autohydrolysis Solid-Derived
Fraction, Run 4
Autohydrolysis Solid-Derived
Fraction, Run 5 and 6
Steam explosion200ºC, 5 min (1)
Steam explosion200ºC, 5 min (1)
Steam explosion200ºC, 5 min (1)
Alkaline treatment10% W/DW NaOH45 min, 160ºC (1)
Solid liquid separation
Piston Press (1)
Washing stage+ Piston Press
10 L water150ºC, 5 min
(1)
Alkaline Liquid Fraction
Run 7,8 and 9
Enzyme treatmentAccellerase 1500
2% V/V, 72h, 50ºC (2)
Alkaline Solid-DerivedFraction, Run 7,8 and 9
Steam explosion200ºC, 5 min (1)
LiquidsDiscarded
Solids
Figure 1: Process scheme for the pretreatment of bagasse. The pretreatment
consists of a primary chemical pretreatment, an optional washing step, steam
explosion and a enzymatic hydrolysis (table 1). (1): pretreatment on 60 liter scale. (2):
pretreatment on a 50 ml scale.

26
Table 1: Overview of the conditions used for the pretreatment of bagasse. In total, 9
runs were performed (see figure 1)
Acid Acid + Wash Autohydrolysis
Autohydrolysis + Wash
Alkaline + Wash
Run 1,2 3 4 5,6 7,8,9
Bagasse used (kg DW) 10 10 10 10 10 DW in reactor (% w/w) 16.7 16.7 16.7 16.7 16.7
Chemical used H2SO4 H2SO4 none none NaOH Chemical used (% w/DW) 0.76 0.76 - - 10
Temperature (°C) 170 170 170 170 160 Pretreatment time (min) 15 15 45 45 45
Wash water (L) none 10 none 10 10
Washing time (min) - 5 - 5 5 temperature washing (°C) - 150 - 150 150

27
Table 2: Presence of different compounds after pretreatment, expressed in gram of
compound per kilogram dry weight bagasse. Liquid fraction is acquired after the initial
chemical pretreatment, Solid-derived fraction is acquired after enzyme treatment.
N.D.: Not determined. 1) sugar monomers are sugars present as monomers before
enzymatic treatment, depolymerized sugars are sugars depolymerized during
enzymatic treatment
Average of run(s) 1,2,3 1,2 3 4,5,6 4 5,6 7,8,9 7,8,9
Acid pretreated Autohydrolysed Alkaline pretreated
A: Sugar monomers1) Liquid
Fraction
Solid derived fraction
Washed solid
derived fraction
Liquid Fraction
Solid derived fraction
Washed solid
derived fraction
Liquid Fraction
Washed solid
derived fraction
Galactose 2.82 N.D. N.D. 1.12 N.D. N.D. 0.00 N.D.
Glucose 7.27 N.D. N.D. 3.36 N.D. N.D. 0.00 N.D.
Xylose 79.38 N.D. N.D. 19.87 N.D. N.D. 0.16 N.D.
Mannose 0.52 N.D. N.D. 0.00 N.D. N.D. 0.00 N.D.
Arabinose 9.70 N.D. N.D. 2.63 N.D. N.D. 0.00 N.D.
Depolymerized sugars1)
Galactose 0.00 1.18 0.66 0.32 0.63 0.55 0.04 0.70
Glucose 6.98 438.09 417.41 6.23 401.26 435.35 4.46 337.09
Xylose 18.33 41.90 25.74 22.60 30.07 13.36 18.41 111.23
Mannose 0.90 0.58 1.12 0.74 0.82 0.90 0.35 0.17
Arabinose 0.00 2.48 1.45 0.00 1.25 1.05 0.00 1.62
Total sugars 125.90 484.22 446.37 56.85 434.02 451.21 23.42 450.82
B: Furans
Furfural 7.73 4.33 0.18 18.87 2.79 0.09 0.07 0.00
HMF 0.98 1.30 0.00 2.61 1.41 0.00 0.00 0.17
Furoic acid 0.05 0.06 1.90 0.22 0.13 1.63 0.02 0.02
Total furans 8.76 5.69 2.08 21.70 4.34 1.72 0.08 0.19
C: Acids
Acetic acid 13.93 10.17 3.01 20.17 13.98 3.57 33.01 7.12
Glutaric acid 0.52 0.60 0.15 0.30 0.38 0.13 0.11 0.79
Glycolic acid 4.54 8.28 6.47 12.42 9.94 8.39 7.53 7.31
Levulinic acid 8.37 13.02 0.69 38.82 18.24 1.16 4.97 1.65
Oxalic acid 0.75 0.29 0.13 0.66 0.28 0.16 1.27 0.24
Formic acid 1.22 2.08 0.21 3.08 1.69 0.11 7.12 0.19
Total acids 29.33 34.45 10.66 75.44 44.51 13.52 54.00 17.31
D: Phenols
Coumaric acid 1.579 1.059 0.051 0.810 0.490 0.069 2.108 0.022

28
ferulic acid 0.189 0.152 0.024 0.107 0.067 0.018 0.106 0.005
4-hydroxybenzaldehyde 0.203 0.157 0.010 0.322 0.115 0.011 0.479 0.006
vanillin 0.386 0.135 0.020 0.212 0.088 0.015 0.094 0.002
4-hydroxyacetophenone 0.038 0.019 0.004 0.034 0.020 0.007 0.062 0.016
isovanillin 0.011 0.003 0.002 0.009 0.001 0.000 0.017 0.004
acetovanillone 0.000 0.000 0.000 0.000 0.000 0.000 0.052 0.012
acetosyringone 0.000 0.000 0.000 0.021 0.000 0.000 0.269 0.057
4-HB-Acid 0.100 0.045 0.000 0.054 0.036 0.012 0.050 0.113
Syringic Acid 0.063 0.074 0.160 0.065 0.054 0.123 0.096 0.060
Syringaldehyde 0.183 0.147 0.052 0.147 0.114 0.048 0.035 0.014
Total phenols 2.753 1.792 0.322 1.782 0.986 0.302 3.367 0.310
E: Ions
Aluminium (Al) 0.06 0.04 0.03 0.03 0.05 0.03 0.00 0.17
Calcium (Ca) 0.54 0.18 0.23 0.34 0.18 0.19 0.09 1.00
Iron (Fe) 0.41 0.08 0.03 0.33 0.09 0.05 0.03 0.37
Potassium (K) 1.20 1.60 0.92 1.10 1.00 1.02 1.64 1.30
Magnesium (Mg) 0.42 0.15 0.10 0.36 0.18 0.15 0.03 0.69
Sodium (Na) 0.20 9.08 7.11 0.18 7.47 5.41 30.76 13.45
Phosphor (P) 0.20 0.73 0.70 0.19 0.69 0.68 0.13 0.89
Sulfur (S) 2.37 1.93 1.50 0.14 1.26 1.28 0.16 1.62
Silicon (Si) 0.53 0.28 0.24 1.00 0.29 0.27 0.21 0.60
Total ions 5.93 14.04 10.86 3.68 11.21 9.08 33.05 20.11

29
Figure 2: The amount of sugars found in solid-derived fraction and liquid fraction in
grams of sugar per kg DW bagasse, using a combination of chemical pretreatment,
steam explosion and enzyme treatment. Standard deviations are based on multiple
runs as shown in table 1.

30
Table 3: Sugar monomerization efficiencies of acid, autohydrolysis and alkaline
pretreated material. A) monomeric sugars measured based on initial bagasse dry
weight, including estimated monomerization efficiency based on estimated
polymerized sugars initially present in bagasse. B) Amount of sugars present in solid
fraction based on chemical analysis, and enzymatic hydrolysis efficiency of these
polymerized sugars.
Table 3A acid pretreatment Autohydrolysis Alkaline pretreatment
total sugars (g/kg initial DW) 597 502 474
Liquid fraction (g/kg initial DW) 126 57 23
Solid fraction (g/kg initial DW) 471 445 451 monomerized sugars (% initial polymerized sugars) 82-96 69-81 65-76
Table 3B acid pretreatment Autohydrolysis Alkaline pretreatment
Glucans present (g/kg DW) 480 480 520 % glucans monomerized 81 79 59
Xylans present (g/kg DW) 40 30 190 % Xylans monomerized 80 66 52
Total sugars (g/kg DW) 520 510 710 % total sugars monomerized 81 77 56

31
Table 4: Qualitative analysis of important phenolic compounds found after
pretreatment in the liquid fraction mass spectrometry (MS) combined with liquid
chromatography (UHPLC).
MS modus
Retention time Mass fractionation pattern (MS/MS) present in Compound
Positive 8.5 279 165;147;119 Acid-auto Coumarin-malic ester
8.65 95 N.D. Acid-auto Phenol
9.11 309 195;177;145;117 Acid-auto Ferulate-malic ester
9.58 255 237;155;140;123 alkali unknown syringate
10.78 373 249;217;173;145;117 alkali unknown ferulate
10.81 179 161;147;133;119 Acid-auto methoxycinnamic acid
10.99 209 191;177;145 Acid-auto dimethoxycinnamic acid
11.01 343 219;147 alkali unknown coumarin
12.85 387 368;351,325;263;219;193 alkali Diferulic acid
Negative 5.75 385 313;193 alkali Diferulic acid
9.11 325 265;235;217;193;175;149;134 Acid-auto ferulate-mono pentose ester

32
Figure 3: Effect of a washing stage on the amount of by-products present in the solid-
derived fractions after enzyme treatment.
Copyright © 2022 FDOKUMEN