analisis tekno-ekonomi proses pretreatment air sumur dalam ...
Upload
independentCategory
view
0download
0
Kinetics of Lime Pretreatment of Sugarcane Bagasseto Enhance Enzymatic Hydrolysis
Laura L. G. Fuentes & Sarita C. Rabelo &
Rubens Maciel Filho & Aline C. Costa
Received: 3 May 2010 /Accepted: 12 August 2010 /Published online: 29 August 2010# Springer Science+Business Media, LLC 2010
Abstract The objective of this work was to determine the optimum conditions of sugarcanebagasse pretreatment with lime to increase the enzymatic hydrolysis of the polysaccharidecomponent and to study the delignification kinetics. The first stage was an evaluation of theinfluence of temperature, reaction time, and lime concentration in the pretreatment performancemeasured as glucose release after hydrolysis using a 23 central composite design and responsesurface methodology. The maximum glucose yield was 228.45 mg/g raw biomass,corresponding to 409.9 mg/g raw biomass of total reducing sugars, with the pretreatmentperformed at 90°C, for 90 h, and with a lime loading of 0.4 g/g dry biomass. The enzymesloading was 5.0 FPU/dry pretreated biomass of cellulase and 1.0 CBU/dry pretreated biomassof β-glucosidase. Kinetic data of the pretreatment were evaluated at different temperatures(60°C, 70°C, 80°C, and 90°C), and a kinetic model for bagasse delignification with lime as afunction of temperature was determined. Bagasse composition (cellulose, hemicellulose, andlignin) was measured, and the study has shown that 50% of the original material wassolubilized, lignin and hemicellulose were selectively removed, but cellulose was not affectedby lime pretreatment in mild temperatures (60–90°C). The delignification was highlydependent on temperature and duration of pretreatment.
Keywords Pretreatment of lignocellulosic biomass . Sugarcane bagasse .
Kinetics of pretreatment . Lime pretreatment
Introduction
Bagasse is a product of sugar cane processing and an important potential energy source that can beused as rawmaterial for cellulosic ethanol production. In Brazil, there are 300 sugar industries that
Appl Biochem Biotechnol (2011) 163:612–625DOI 10.1007/s12010-010-9067-0
L. L. G. Fuentes : S. C. Rabelo : R. M. Filho :A. C. Costa (*)Faculdade de Engenharia Química, Universidade Estadual de Campinas (UNICAMP),Caixa Postal 6066, 13083-970 Campinas, São Paulo, Brazile-mail: [email protected]
Present Address:S. C. Rabelo (*)Laboratório Nacional de Ciência e Tecnologia do Bioetanol (CTBE), Caixa Postal 6170,13083-970 Campinas, São Paulo, Brazile-mail: [email protected]

produced approximately 163 million tons of bagasse in 2010/2011 [1]. Approximately 90% ofthis bagasse is used as fuel for boilers, to generate heat for steam production, or for mechanicaland electrical power generation. The remaining corresponds to 9 million tons of bagasse [2].
Lignocellulosic materials are resistant to enzymatic hydrolysis. There are major limitations forefficient ethanol production from lignocellulosic biomass [3], among them the presence of ligninsurrounding the cellulose, as a physical barrier reducing the available sites for enzymatic attacks[4]. Pretreatment is an important tool for lignocelluloses conversion processes and is required toalter the biomass structure to make cellulose more accessible to the enzymatic complex [5].
Alkaline pretreatment with lime has received a lot of attention in the last years because itremoves lignin from biomass, thus improving the reactivity of the remaining polysaccharides, andremoves acetyl groups and the various uronic acid substitutions on hemicellulose [6]. In addition,lime pretreatment uses lower temperatures and pressures compared with other pretreatments,uses safe reactives, is inexpensive, and can be recovered by carbonating with CO2 [7].
The aim of the present study was to evaluate the performance of sugarcane bagassepretreatment with lime to enhance enzymatic hydrolysis and posterior ethanol productionand to determine a kinetic model for bagasse delignification with lime as a function of thetemperature. The influence of different pretreatment conditions (temperature, residencetime, and lime loading) on sugar yield and the effect of delignification during thepretreatment were assessed. The ranges considered for pretreatment conditions weredetermined based on results of a previous work [8] that assessed the pretreatment ofbagasse manually harvested after burning. The sugarcane bagasse considered in the presentwork was mechanically harvested without burning. As bagasse is a complex raw materialand its handling previous to pretreatment is expected to influence not only its compositionbut also its recalcitrance, in the present work another experimental design was performed toevaluate the optimal values of the variables affecting pretreatment.
Materials and Methods
Substrate
Fresh sugarcane bagasse was supplied from the sugar plant “Usina da Pedra” (São Paulo, Brazil).It was dried for 3 days at normal environment temperature and ground in knife mill (Wileymodel3) and hammer mill (General Electronic) for 10 min at each mill. It was subsequently sievedusing Tyler 35 sieve (around 0.5 mm) and stored in the freezer in sealed plastic bags.
Lime Pretreatment
Four grams of dry bagasse was added in 500mLErlenmeyer flasks with 100mL of distilledwaterand stirred in shaker at 150 rpm. Time and temperature of pretreatment, as well as lime loading foreach assay, were determined by the experimental design. After completion of the shaker cycle, thereaction was stopped with cold water, and the pretreated biomass was neutralized withhydrochloric acid 5.0 mol/L to pH 7.0, washed with distilled water, and oven-dried at 40°C for48 h. The dry weight obtained was used to determine mass loss during pretreatment.
Enzymatic Hydrolysis
One gram of pretreated bagasse was added to 300 mL of distilled water in Erlenmeyerflasks, and the pH was adjusted to 4.8 [9]. The enzyme loadings were 1.0 CBU/g dry
Appl Biochem Biotechnol (2011) 163:612–625 613
biomass of β-glucosidase and 5.0 FPU/g dry biomass of cellulase. The flasks were sealedand stirred in shaker at 100 rpm at a temperature of 50°C. During hydrolysis, samples of2.0 mL were collected at times of 1, 3, 6, 12, 24, 36, 48, 60, and 72 h and inactivated byincreasing the temperature to 80°C for 15 min. Finally, the concentration of glucose andtotal reducing sugars (TRS) were determined using a kit based on the glucose oxidasereaction (reagent GOD PAD) and the dinitrosalicylic acid method (DNS) [10], respectively.Cellulase activity (Trichoderma reesei, Sigma) was measured by the filter paper method asdescribed by Ghose [11] and was of 64.106 FPU/mL. β-Glucosidase activity (Novozyme188) was measured as described by Wood and Bhat [12] and was of 309.92 CBU/mL.
After the enzymatic hydrolysis experiments, the residues were washed and dried at 105°Cto constant weight for quantification of the hydrolyzed mass.
Chemical Characterization
Four grams of a milled sample of bagasse was extracted with 99% ethanol in a Soxhletapparatus until the liquid around the cartridge remained colorless [13]. Ash content wasdetermined after burning of the samples in a muffle at 550°C for 6 h [14]; 0.3 g of extractedbagasse was hydrolyzed with 72% (w/w) sulfuric acid at 30°C for 1 h. The acid was dilutedto a final concentration of 4% (with the addition of 84 mL of water), and the mixture washeated at 121°C for 1 h in autoclave. The residual material was cooled and filtered throughpaper filter [15]. The solids were dried to constant weight at 105°C and determined asinsoluble lignin. The soluble lignin concentration in the filtrate was determined bymeasuring the absorbance at 205 nm and using the value of 105 Lg−1cm−1 as theabsorptivity of soluble lignin [16]. The concentrations of monomeric sugars in the solublefraction were determined by high-performance liquid chromatography using a SUGAR-PAK (Waters) column at 70°C and eluted with deionized water at 0.5 mL/min using atemperature-controlled refractive index detector (Model 410 waters, pump model 515) at40°C. Before injection, samples were neutralized with calcium carbonate and filtered usingcellulose ester membranes with 0.22 μm pores (Millipore). Under these conditions, glucose,xylose, and arabinose were quantified. No corrections were performed due to sugardegradation reactions during acid hydrolysis. The factors used to convert sugar monomersto anhydromonomers were 0.90 for glucose and 0.88 for xylose and arabinose. Theseconcentrations were used to determine the contents of cellulose, hemicellulose, holocellu-lose, glucan, and xylan.
Experimental Design
A central composite design with three replicas at the central point (17 runs) wasperformed for the optimization of the pretreatment with lime. The variables were codedaccording to Eq. 1. The real and coded values of the three factors considered are shownin Table 1.
xi ¼ Xi � X0ð ÞΔXi
i ¼ 1; 2; :::::; k ð1Þ
where xi and Xi are the dimensionless and the actual values of the independent variable i,X0 is the actual value of the independent variable at the center point, and ΔXi is the stepchange of Xi corresponding to a unit variation of the dimensionless value.
614 Appl Biochem Biotechnol (2011) 163:612–625
Delignification Parameters
Kinetic data were collected around the optimum point of pretreatment; 4.0 g of dried andmilled bagasse was treated with 0.4 g of lime/g raw bagasse in different conditions oftemperature: 60°C, 70°C, 80°C, and 90°C. For each of these isothermals, the compositionof pretreated bagasse was determined at the reaction times of 24, 48, 60, 72, 84, 90, and108 h. The pretreated biomass was neutralized with hydrochloric acid 5 mol/L to pH 7.0,washed with distilled water, oven-dried at 40°C for 48 h, and weighed to determined massloss. The contents of lignin and carbohydrates were determinate by National RenewableEnergy Laboratory procedures [15,16]. The calculation of the holocellulose mass loss andKlason lignin removed were performed using Eq. 2:
Mp ¼ Mo �Mt ð2Þ
where Mp is the mass loss of holocellulose or Klason lignin removed (grams per 100 g ofpretreated biomass), Mo is the initial mass of holocellulose or Klason lignin at t=0 (gramsper 100 g pretreated biomass), and Mt is the mass of holocellulose or Klason lignin at timet (grams per 100 g pretreated biomass).
The removal of lignin was calculated by Eq. 3, reported by Kim and Lee [4].
Lc ¼ LTo � LTLTo
ð3Þ
where Lc is the removal of total lignin at time t (grams of lignin removed at time t per gramsof initial lignin t=0), LTo is the total lignin content at time t=0 (grams of total lignin at timet=0 per grams of pretreated biomass), and LT is total lignin content at time t (grams of totallignin at time t per grams of pretreated biomass).
Results and Discussion
Optimization of the Reaction Conditions
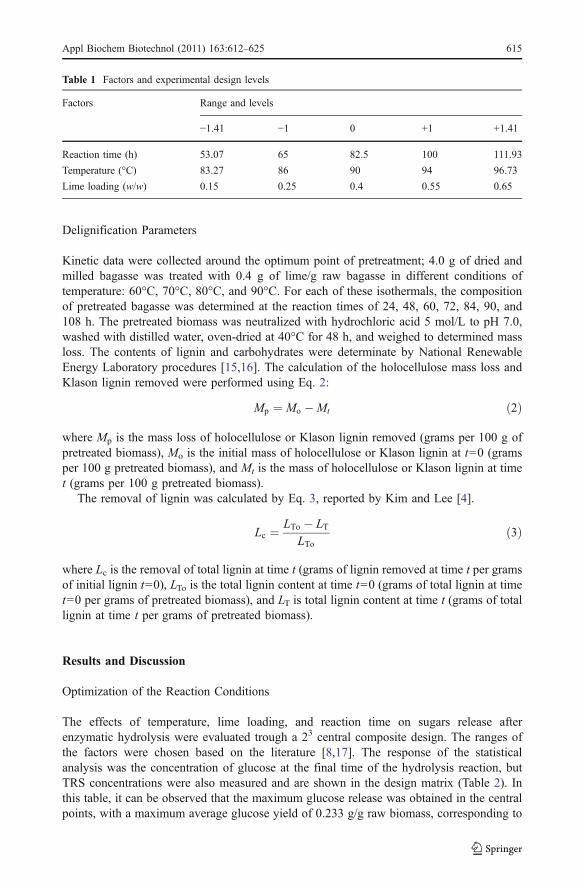
The effects of temperature, lime loading, and reaction time on sugars release afterenzymatic hydrolysis were evaluated trough a 23 central composite design. The ranges ofthe factors were chosen based on the literature [8,17]. The response of the statisticalanalysis was the concentration of glucose at the final time of the hydrolysis reaction, butTRS concentrations were also measured and are shown in the design matrix (Table 2). Inthis table, it can be observed that the maximum glucose release was obtained in the centralpoints, with a maximum average glucose yield of 0.233 g/g raw biomass, corresponding to
Table 1 Factors and experimental design levels
Factors Range and levels
−1.41 −1 0 +1 +1.41
Reaction time (h) 53.07 65 82.5 100 111.93
Temperature (°C) 83.27 86 90 94 96.73
Lime loading (w/w) 0.15 0.25 0.4 0.55 0.65
Appl Biochem Biotechnol (2011) 163:612–625 615

0.366 g/g raw biomass of TRS. The experiments performed in the lower conditions of timeand temperature showed lower production of sugars.
The statistical significance of the effects of temperature, reaction time, and lime loadingon enzymatic hydrolysis yield was determined using the software Statistic 7.0 andconsidering a 90% confidence interval. The results can be seen in the standardized Paretochart (Fig. 1). The significant effects were the quadratic effects of lime loading, time, andtemperature, as well as the linear effect of time.
A quadratic model was proposed to describe the experimental data, as expressed byEq. 4. This model was used to plot the response surfaces and to determine the optimalvalues of the factors.
Glucose g=gð Þ ¼ 0:2321þ 0:00704t � 0:01252t2 � 0:00095T � 0:01153T2
� 0:00038m� 0:01524m2 � 0:00063Tt þ 0:00224tm� 0:00257Tm ð4Þwhere t, T, and m are the codified values of pretreatment time, temperature, and limeloading, respectively.
Table 3 shows the analysis of variance (ANOVA) for the full quadratic model (Eq. 4).The F value for the regression was calculated as MSR/MSr and compared to the listedF value (F9, 7) [18]. The F value for lack of fit was calculated as MSLf/MSPe and comparedto the listed F value (F5, 2). As the calculated F value for the regression is higher than thelisted value and the calculated F value for lack of fit is lower than the listed value, the modelis statistically significant and can be used to predict the glucose yields of the enzymatichydrolysis and to plot the response surfaces.
The response surfaces plotted using Eq. 4 can be seen in Fig. 2a–c. It can be observedthat the highest yields were obtained for intermediate temperature, lime loading, and
Table 2 Design matrix presenting TRS and glucose concentration after hydrolysis of pretreated bagasse withlime
Assay Time (h) Temperature (°C) Lime loading (g/g) Glucose (g/g) TRS (g/g)
1 65 86 0.25 0.192 0.336
2 65 86 0.55 0.177 0.333
3 65 94 0.25 0.190 0.344
4 65 94 0.55 0.175 0.349
5 100 86 0.25 0.203 0.379
6 100 86 0.55 0.207 0.367
7 100 94 0.25 0.209 0.385
8 100 94 0.55 0.192 0.348
9 53.07 90 0.4 0.191 0.326
10 111.93 90 0.4 0.202 0.354
11 82.5 83.27 0.4 0.199 0.381
12 82.5 96.73 0.4 0.199 0.337
13 82.5 90 0.15 0.178 0.360
14 82.5 90 0.65 0.200 0.350
15 (1) 82.5 90 0.4 0.239 0.366
15 (2) 82.5 90 0.4 0.230 0.367
15 (3) 82.5 90 0.4 0.228 0.365
616 Appl Biochem Biotechnol (2011) 163:612–625

reaction time, with higher and lower values of the factors resulting in a decrease of yield.Optimization performed using the model equation points to a maximum glucose yield of0.22 (grams per gram of raw bagasse) when bagasse is pretreated with a lime loading of0.4 g/g raw biomass for 90 h at 90°C.
Figure 3 shows the experimental hydrolysis profiles for bagasse pretreated with lime inthe optimal conditions (90°C, 90 h and 0.4 g lime/g raw bagasse) and the hydrolysis profilefor bagasse without pretreatment. The maximum glucose yield was 228.45 mg/g rawbiomass, corresponding to 409.9 mg/g raw biomass of TRS. The importance of the stage ofpretreatment in the process can be observed, as glucose release after hydrolysis of untreatedbagasse is very low.
Table 4 shows the compositions of raw bagasse and bagasse pretreated in the optimalconditions. For the raw bagasse, carbohydrates account for 61% of the dry weight, whichmakes this biomass an adequate substrate for ethanol production. The hemicellulosefraction comprises 23.66% of the raw material, xylose being the main sugar (80%).Cellulose and lignin contents are 37.35% and 25.10%, respectively. After the pretreatmentstage, approximately 4% of the cellulose, 27% of hemicellulose, and 39% of lignin weresolubilized. These data demonstrate that the cellulose portion of the biomass is virtuallyunaffected by the pretreatment, which is desirable in an effective pretreatment. The
Pareto Chart of Standardized Effects; Variable: ART(g/g)
3 factors, 1 Blocks, 17 Runs; MSPure Error=0.0000012
-4.42029
-5.44578
-8.93762
-11.9115
-16.0453
-16.3246
-16.6847
-25.8992
41.2734
p=0.1
Standardized Effect Estimate (Absolute Value)
Temperature(˚C)(Q)
2Lby3L
Lime Loading(g/g)(Q)
1Lby2L
(2)Temperature(˚C)(L)
(3)Lime Loading(g/g)(L)
1Lby3L
Time(h)(Q)
(1)Time(h)(L)
Fig. 1 Pareto chart of standard-ized effects for the glucoseyield (grams per gram of rawbagasse)
Table 3 ANOVA of the model described by Eq. 4
Source of variation Sum ofsquares
Degrees offreedom
Meansquare
F calc F listed (90%)
Regression (R) 4.55×10⁻³ 9 5.06×10⁻⁴ 4.72 2.74 (F9, 7)
Residual (r) 7.51×10⁻³ 7 1.07×10⁻⁴
Lack of fit (Lf) 6.89×10⁻³ 5 1.38×10⁻⁴ 4.40 9.29 (F5, 2)
Pure error (Pe) 6.30×10⁻³ 2 3.10×10⁻⁵
Total (T) 5.31×10⁻³ 16
R2 85.85
Maximum accountable variation (%) 98.82
Appl Biochem Biotechnol (2011) 163:612–625 617

pretreatment with lime has a major effect in delignification and in increasing the accessiblesurface area, but its effect in removing hemicellulose is lower than in removing lignin [6].
Other authors have evaluated the pretreatment of lignocellulosic biomass with lime.Rabelo [9] results have shown that the highest glucose yields were for pretreatmentperformed for 65.6 h, at 70°C, and with 0.4 g lime/g biomass. The highest glucose yieldswere obtained in the extremities of the operational range studied, so in the present workthe ranges of pretreatment time and temperature were increased. The optimal conditions
0,22 0,2 0,18 0,16 0,14
0,22 0,2 0,18 0,16
a b
0,22 0,2 0,18 0,16 0,14
c
Fig. 2 Response surface of glucose yield a temperature versus time, b lime loading versus time, and c limeloading versus temperature. The factors not shown in each figure were maintained in the center point value
0.0
0.1
0.2
0.3
0.4
0 20 40 60 80
Glu
cose
an
d T
RS
co
nce
ntr
atio
n(g
/g ra
w b
agas
se)
Time(h)
Glucose - pretreated bagasse TRS - pretreated bagasse
Glucose - untreated bagasse TRS - untreated bagasse
Fig. 3 Comparison of thehydrolysis profile of untreatedbagasse and pretreated in optimalconditions
618 Appl Biochem Biotechnol (2011) 163:612–625

were obtained for higher temperature and pretreatment time and the same lime loading.Chang et al. [7] determined optimal conditions for lime pretreatment of switchgrass,which were 2 h of pretreatment at 100°C and 120°C and a lime loading of 0.1 g/gbiomass. After pretreatment, approximately 10% of the cellulose, 26% of hemicellulose,and 29% of lignin were solubilized. The conditions determined in the present work forbagasse are of lower temperature, higher pretreatment time, and lime loading and lead toless cellulose and more lignin removal, which is a desired characteristic. Chang et al. [19]performed a systematic study of pretreatment conditions to enhance the enzymaticdigestibility of bagasse and wheat straw. They concluded that for short pretreatmenttimes (1–3 h), high temperatures (85–135°C) were required, whereas for long pretreatmenttimes (e.g., 24 h), low temperatures (50–65°C) were effective. They recommended a limeloading of 0.1 g lime/g biomass. They have shown that after pretreatment of bagasse for 1 hat 120°C and 0.1 g lime/g biomass, no glucan or xylan was removed, whereas 14% of ligninwas solubilized. The results obtained in the present work show higher hemicellulose andlignin removal with higher pretreatment times and lime loading.
Delignification of Sugarcane Bagasse with Lime Pretreatment
Figure 4a, b shows the contents of glucan and xylan in the bagasse during delignificationwith lime at different temperatures. The highest glucan loss occurred at 90°C and thehighest solubilization of xylan occurred for temperatures higher than 70°C, both at themaximum time of pretreatment considered. On the other hand, the lowest sugar lossoccurred at 60°C and for pretreatment times lower than 48 h in both cases. Nonetheless,these were the conditions where there was less lignin degradation, as can be observed inFig. 5a, b, which shows the Klason and soluble lignin contents in the bagasse. It can beobserved from these figures that lignin solubilization is enhanced significantly withincreased time and temperature. The tendency of reduction in the content of acid-solublelignin was similar to that of Klason lignin. The lignin content in the bagasse pretreated at90°C for 108 h decreased from 25.10 down to 9.10 g Klason lignin/100 g pretreatedbiomass and from 1.72 g down to 0.66 g soluble lignin/100 g pretreated biomass.
Equation 3 was used to calculate the removal of lignin during the stage of delignificationfor each isotherm. Figure 6 shows the profiles of total removal of lignin as a function of time.The highest removals obtained were 52% and 62% for temperatures of 80°C and 90°C,respectively. The lower lignin removal attained was 30% for the delignification performed at60°C. In this figure, it can also be observed that the highest delignification occurred at themaximum considered pretreatment time in all isotherms.
The holocellulose-to-lignin selectivity (grams of holocellulose lost per grams of ligninremoved) is a parameter of vital importance because it describes the effectiveness of the
Table 4 Composition of raw material and pretreated bagasse
Composition Raw bagasse 100 (g) Pretreated bagasse 58.73 (g)
Ash 1.79±0.48 –
Cellulose 37.35±0.51 35.50±0.52
Hemicellulose 23.66±0.88 12.53±0.34
Lignin 25.10±0.48 9.16±0.14
Extractives 3.25±0.20 –
Appl Biochem Biotechnol (2011) 163:612–625 619

process. Ideally, a good delignification process should remove lignin without a significantloss of holocellulose; therefore, small values are desired for this parameter [20].
Figure 7a–d shows the holocellulose loss versus lignin removed during delignification atthe different temperatures studied. These correlations do not include the initial point for theholocellulose loss and lignin removal at time 0 (0 g holocellulose lost or lignin removed pergrams of pretreated bagasse) [20]. Linear regression was employed to obtain the slope ofthe curve, which is the selectivity. The best holocellulose-to-lignin selectivity was obtainedfor the temperature of 90°C, where more lignin solubilization occurs for lowerholocellulose loss.
Kinetics of Delignification
Lignin degradation is known to occur in three separate phases: initial (rapid) phase, bulk(dominant) phase, and the final residual (slow) phase [21–23]. From the kinetic viewpoint,lignin can be classified into three different classes according to the phase where it degrades(Eq. 5):
LkLko
¼ ai exp �ki � tð Þ þ ab exp �kb � tð Þ þ ar exp �kr � tð Þ ð5Þ
30
32
34
36
38
40
0 30 60 90 120
Glu
can
(g/1
00g
pret
reat
ed b
agas
se)
Time(h)
60˚C 70˚C 80˚C 90˚C Untreated
5
10
15
20
25
30
0 30 60 90 120
Xyl
an(g
/100
g p
retr
eate
d b
iom
ass)
Time(h)
60˚C 70˚C 80˚C 90˚C untreated
a
b
Fig. 4 Glucan (a) and xylan (b)content as a function of time inlime-treated bagasse at 60°C,70°C, 80°C, and 90°C
620 Appl Biochem Biotechnol (2011) 163:612–625

where t is the time period during which data were collected; Lk is the mass of Klasonlignin at time t; Lko is the initial mass of Klason lignin at t=0; a1 is the maximum fractionof lignin fragments released in the initial stage; a2 is the maximum fraction of ligninfragments released in the bulk stage; a3 is the maximum fraction of lignin fragmentsreleased in the residual stage; and ki, kb, kr are the reaction rate constants for the initial,bulk, and residual delignification stages, respectively. This equation is subjected to theconstraint that ai þ ab þ ar ¼ 1 when Lk=Lko ¼ 1 at t=0.
In the selectivity and removal of lignin results, it was observed that bagassedelignification in short times (≤108 h) only presented one phase (dominant or bulk). Themain feature of the residual stage is that lignin removal proceeds very slowly, while thecarbohydrates are degraded [24]. This fact was not observed for the pretreatment conditionsconsidered in this work; in all the cases, the degradation of lignin is significant during allthe pretreatment duration. So it was concluded that, under these conditions, thedelignification of sugarcane bagasse pretreated with lime lacks the residual phase for low
Fig. 5 Klason (a) and soluble (b)lignin content as a function oftime in lime-treated bagasseat 60°C, 70°C, 80°C, and 90°C
Appl Biochem Biotechnol (2011) 163:612–625 621

pretreatment times, which is in accordance to the results obtained by Cotlear [20], whichshowed that this stage came only after the first week of pretreatment.
As for the initial phase, De Groot et al. [25] have shown that in the case of the sodapulping of bagasse the delignification lacks an initial phase. They support their claim byshowing that the alkaline delignification of bagasse proceeds from the very beginning with
a b
c d
y = 1,138x - 2,1788R² = 0,9591
0
2
3
5
6
8
9
0
Ho
loce
llulo
se lo
ss(g
/100
g tr
eate
d b
agas
se)
Klason lignin removed(g/100g treated bagasse)
y = 1,9126x - 5,0039R² = 0,975
0
2
4
6
8
10
12
14
16
0 11
Ho
loce
llulo
se lo
ss(g
/100
g tr
eate
d b
agas
se)
Klason lignin removed(g/100g treated bagasse)
y = 1,3093x - 3,9602R² = 0,9777
0
2
4
6
8
10
12
14
0 10 12 14
Ho
loce
llulo
se lo
ss(g
/100
g tr
eate
d b
agas
se)
Klason lignin removed(g/100g treated bagasse)
y = 1,0704x - 3,2766R² = 0,9807
0
2
4
6
8
10
12
14
16
0 10 12 14 16 18
Ho
loce
llulo
se lo
ss(g
/100
g tr
eate
d b
agas
se)
Klason lignin removed(g/100g treated bagasse)
2 4 6 8 2 4 6 8
2 3 5 6 8 9 2 3 5 6 8 9
Fig. 7 Holocellulose loss as a function of lignin removal in lime pretreatment of bagasse at a 60°C, b 70°C,c 80°C, and d 90°C
Fig. 6 Lignin removal of lime-treated bagasse as a function oftime at 60°C, 70°C, 80°C,and 90°C
622 Appl Biochem Biotechnol (2011) 163:612–625

a high degree of lignin removal compared to carbohydrate removal, which is not acharacteristic of the initial phase but of the bulk phase [20]. The same occurs in the limedelignification of sugarcane bagasse in the conditions studied in this work, and weconsidered that there is no initial phase, although there is a possibility that this phase is sosmall that it would not be detected by simple visual inspection [25].
Considering only the bulk phase, the model presented in the Eq. 5 is reduced to Eq. 6:
ln Lkð Þ ¼ �kb � t þ ln Lok ð6Þ
a b
c d
y = -0,0039x + 3,1974R² = 0,9768
2.7
2.8
2.9
3.0
3.1
3.2
3.3
0 30 60 90 120
Ln
(LK
)
Time(h)
y = -0,0045x + 3,1742R² = 0,9884
2.6
2.8
3.0
3.2
3.4
0 20 40 60 80 100 120
Ln
(LK
)
Time(h)
y = -0,0074x + 3,1751R² = 0,9902
0.0
0.5
1.0
1.5
2.0
2.5
3.0
3.5
0 20 40 60 80 100 120
Ln
(LK
)
Time(h)
y = -0,0094x + 3,1439R² = 0,9827
0.0
0.8
1.6
2.4
3.2
0 20 40 60 80 100 120
Ln
(LK
)
Time(h)
Fig. 8 Graph of natural logarithmic of Klason lignin versus time at a 60°C, b 70°C, c 80°C, and d 90°C
Fig. 9 Kinetic model for Klasonlignin prediction
Appl Biochem Biotechnol (2011) 163:612–625 623

Plotting ln(Lk) versus time (Fig. 8), it was possible to calculate the kinetic constants at60°C, 70°C, 80°C, and 90°C as kb1=0.0039 h−1, kb2=0.0045 h−1, kb3=0.0074 h−1, andkb4=0.0094 h−1, respectively. These results show that the kinetic constant increased astemperature increased. The curves fitted to predict Lk (continuous line) as a function oftime (Eq. 6) compared to the experimental data (points) are shown in Fig. 9 for thetemperatures considered. It can be seen that the model represented the experimental dataaccurately.
Although the model of Eq. 5 is semi-empirical, one of its important characteristics is thatthe resulting rate constants for each phase can be fitted to the well-known Arrheniusequation [23,26]:
ln kbð Þ ¼ lnðAÞ þ � Ea
RT
� �ð7Þ
where kb is the rate constant for the bulk phase (1/h), A is the Arrhenius constant orfrequency factor (1/h), Ea is the activation energy (joules per mole), R is the universal gasconstant (8.314 J/molK), and T is the absolute temperature (kelvin).
The determination of the activation energy was made by plotting the Ln(kb) versus 1/T,and the value obtained was 31.47 kJ/mol. This value is much smaller than the activationenergy for wood and corn stover (approximately 120–139 and 50 kJ/mol, respectively) [26]in the dominant phase, when these are pretreated with lime in oxidative conditions. Forlignin removal in alkaline conditions, sugarcane bagasse has a more favorable structure thanwood and corn stover in the conditions studied, as it has lower delignification activationenergy.
Conclusions
This study has shown that lime pretreatment is an efficient method to increase theenzymatic accessibility of the water-insoluble, cellulose-rich component in sugarcanebagasse. After pretreatment, the enzymatic conversion from cellulose to glucose increasednearly four times compared to the untreated bagasse. The best pretreatment conditions toobtain high cellulose conversions to glucose were at 90°C for 90 h with lime loading of0.4 g/g raw bagasse. The holocellulose-to-lignin selectivity (grams of holocellulose lost pergram of lignin removed) was low for the temperature of 90°C, which is desirable in anefficient pretreatment.
The kinetic model of delignification of sugarcane bagasse with lime was empiricallyestablished as a first-order reaction corresponding to the bulk phase for pretreatment timeup to 108 h. The activation energy for the delignification reaction was estimated as31.47 kJ/mol, which is much lower than the activation energy of delignification for woodand corn stover.
Acknowledgments The authors acknowledge CNPq and Fapesp for financial support.
References
1. UNICA—Brazilian Sugarcane Industry Association (2010). Produção de açúcar do Brasil. Availablefrom: http://www.unica.com.br/downloads/estatisticas/processcanabrasil.xls. Accessed 22 April 2010.
624 Appl Biochem Biotechnol (2011) 163:612–625

2. Schlittler, S. F. A. L. (2006). Ph.D. thesis, Universidade Federal do Rio Janeiro, Rio de Janeiro, Brazil.3. Krishna, S. H., & Chowdary, G. V. (2000). Journal of Agricultural and Food Chemistry, 48, 1971–1976.4. Kim, T. H., & Lee, Y. Y. (2006). Bioresource Technology, 97, 224–232.5. Mosier, N., Wyman, C. E., Dale, B., Elander, R., Lee, Y. Y., Holtzapple, M. T., et al. (2005). Bioresource
Technology, 96(6), 673–686.6. Chang, V. S., & Holtzapple, M. T. (2000). Applied Biochemistry and Biotechnology, 84–86, 5–37.7. Chang, V. S., Burr, B., & Holtzapple, M. T. (1997). Applied Biochemistry and Biotechnology, 63–65, 3–
19.8. Rabelo, S. C., Maciel Filho, R., & Costa, A. C. (2009). Applied Biochemistry and Biotechnology, 153,
139–150.9. Rabelo, S. C. (2007). M.S. thesis, Universidade de Campinas, Campinas, Brazil.10. Miller, G. L. (1959). Analytical Chemistry, 31(3), 426–428.11. Ghose, T. K. (1987). Pure and Applied Chemistry, 59(2), 257–268.12. Wood, T. M., & Bhat, K. M. (1988). Methods for measuring cellulase activities. In W. A. Wood & S. T.
Kellog (Eds.), Methods in enzymology (pp. 87–116). San Diego: Academic.13. Sluiter, A., Ruiz, R., Scarlata, J., Sluiter, J., Templeton, D. (2008). National Renewable Energy
Laboratory. Available from: http://www.nrel.gov/biomass/pdfs/42619.pdf. Accessed 1 July 2009.14. Sluiter, A., Hames, B., Ruiz, R., Sluiter, J., Templeton, D. (2008). National Renewable Energy
Laboratory. Available from: http://www.nrel.gov/biomass/pdfs/42622.pdf. Accessed 1 July 2009.15. Sluiter, A., Hames, B., Ruiz, R., Scarlata, J., Sluiter, J., Templeton, Crocker, D. (2010). National
Renewable Energy Laboratory. Available from: http://www.nrel.gov/biomass/pdfs/42618.pdf. Accessed1 January 2010.
16. Hyman, D., Sluiter, D., Crocker, D., Johnson, J., Sluiter, J., Black, S., Scarlata, C. (1996). NationalRenewable Energy Laboratory. Available from: http://www.nrel.gov/biomass/pdfs/42617.pdf. Accessed1 December 2009.
17. Rabelo, S. C., Maciel Filho, R., & Costa, A. C. (2008). Applied Biochemistry and Biotechnology, 148,45–58.
18. Barros Neto, B., Scarmin, I. S., & Bruns, R. E. (2003). Como Fazer Experimentos (2nd ed.). Campinas:UNICAMP.
19. Chang, V. S., Nagwani, M., & Holtzapple, M. T. (1998). Applied Biochemistry and Biotechnology, 74,135–159.
20. Cotlear, C. (2004). Ph.D. thesis, Texas A&M University, Texas, US.21. Sabatier, J., Peniche, C., & Fernández, N. (1993). Holzforschung, 47(4), 313–317.22. Dolk, M., Yan, J. F., & McCarthy, J. L. (1989). Holzforschung, 43(2), 91–98.23. Chiang, V. L., & YU, J. (1990). Journal of Wood Chemistry and Technology, 10(3), 293–310.24. Lindgren, C. T., & Lindström, M. E. (1996). Journal of Pulp and Paper Science, 22(8), 290–295.25. De Groot, B., Van Dam, J. E. G., & Riet, K. (1995). Holzforschung, 49(4), 332–342.26. Kim, S., & Holtzapple, M. T. (2006). Bioresource Technology, 97, 778–785.
Appl Biochem Biotechnol (2011) 163:612–625 625
Copyright © 2022 FDOKUMEN