Simulation of Lime Calcination in Normal Shaft and Parallel ...
Upload
independentCategory
view
0download
0
A Comparison Between Lime and Alkaline HydrogenPeroxide Pretreatments of Sugarcane Bagassefor Ethanol Production
Sarita C. Rabelo & Rubens Maciel Filho & Aline C. Costa
Received: 8 May 2007 /Accepted: 16 October 2007# Humana Press Inc. 2007
Abstract Pretreatment procedures of sugarcane bagasse with lime (calcium hydroxide) oralkaline hydrogen peroxide were evaluated and compared. Analyses were performed using23 factorial designs, with pretreatment time, temperature, and lime loading and hydrogenperoxide concentration as factors. The responses evaluated were the yield of total reducingsugars (TRS) and glucose released from pretreated bagasse after enzymatic hydrolysis.Experiments were performed using the bagasse, as it comes from an alcohol/sugar factoryand bagasse, in the size, range from 0.248 to 1.397 mm (12–60 mesh). The results showthat, when hexoses and pentoses are of interest, lime should be the pretreatment agentchosen, as high TRS yields are obtained for non-screened bagasse using 0.40 g lime/g drybiomass at 70 °C for 36 h. When the product of interest is glucose, the best results wereobtained with lime pretreatment of screened bagasse. However, the results for alkalineperoxide and lime pretreatments of non-screened bagasse are not very different.
Keywords Lignocellulosic materials . Sugarcane bagasse . Pretreatment . Lime . Hydrogenperoxide . Enzymatic hydrolysis . Statistical analysis
Introduction
In recent years, the worldwide trends toward scientific and technological advances in thefield of new fuels point to the importance of more efficient utilization of agro-industrialresidues as raw material in the ethanol production process. In Brazil, sugarcane bagasse, themajor by-product of the sugarcane industry, seems to be economically viable for theproduction of environmentally friendly fuels.
In general, lignocellulosic materials are resistant to bioconversion and requirepretreatment to increase their biodigestibility and make cellulose more accessible to the
Appl Biochem BiotechnolDOI 10.1007/s12010-007-8086-y
S. C. Rabelo : R. M. Filho : A. C. Costa (*)Department of Chemical Process, School of Chemical Engineering, State University of Campinas,UNICAMP, Campinas, Brazile-mail: [email protected]
cellulolytic enzymes. Pretreatment methods can be classified into four categories: physical,chemical, biological, and combined. Chemical pretreatments have received more attentionbecause the physical pretreatments are relatively inefficient [1], and the combinedpretreatments rarely have improved digestibility when compared with simple treatments[2]; thus, chemical pretreatments have been chosen as the subject in this work.
Lynd et al. [3] has summarized the desirable properties for an ideal lignocellulosicmaterial after chemical pretreatment, i.e., it should (a) produce reactive fibers, (b) yieldpentoses in non-degraded form, (c) not release the compounds that significantly inhibitfermentation, (d) work in reactors of reasonable size with moderate cost, (f) produce nosolid residues, (g) have a high degree of simplicity, and (h) be effective at low moisturecontents.
Pretreatment is one of the most expensive and least technologically mature steps in theprocess for converting biomass to fermentable sugars [4]. Costs are because of the use ofsteam and chemical products and the need for expensive corrosion-resistant reactors;however, pretreatment also has great potential for efficiency improvement and lowering ofcosts through research and development [5–8].
Enzymatic hydrolysis of cellulosic material by cellulase enzymes is the most promisingapproach for getting high product yields vital to economic success [3, 9]. The cellulasesbreak down cellulose to cellobiose, which is subsequently cleaved to glucose byβ-glucosidase. Enzymatic hydrolysis leads to higher yields of monosaccharides thandilute-acid hydrolysis because cellulase enzymes catalyze only cellulose or hemicellulosehydrolysis reactions and not sugar degradation reactions [10]. Enzymes are naturallyoccurring compounds that are biodegradable and, therefore, environmentally friendly.
In this work, two promising pretreatment technologies are compared. They were chosenfor occurring in mild conditions (temperature, pressure, and absence of acids). Both arealkaline processes that are expected to cause less sugar degradation than acid processes[11]. The first is the pretreatment with alkaline hydrogen peroxide [12–17], which is a well-known reagent in the paper and cellulose industry, being used as a bleach agent. It has alsothe great advantage of not leaving residues in the biomass, as it degrades into oxygen andwater. Also, the formation of secondary products is practically inexistent.
The other pretreatment agent considered is lime (calcium hydroxide) [18–27], which isan inexpensive reagent and can be easily recovered as calcium carbonate by neutralizationwith carbon dioxide. The calcium hydroxide can be subsequently regenerated usingestablished lime kiln technology [26].
Analyses were performed using 23 factorial designs. The factors considered werepretreatment time, temperature, and lime loading or hydrogen peroxide concentration. Theresponses evaluated were the total reducing sugar (TRS) and glucose yield from the pretreatedbagasse after enzymatic hydrolysis. Experiments were performed using the bagasse, as itcomes from an alcohol/sugar factory, and bagasse screened size 0.248 to 1.397 mm (12–60mesh) to evaluate the possibility of using the bagasse as it comes from the mills.
Materials and Methods
Substrate
Fresh sugarcane bagasse was obtained from the sugar plant Usina São Luiz–Dedini S/A,(Pirassununga/SP, Brazil). It was dried at 45 °C for 48 h, left for 48 h at room temperature,put into plastic bags, and kept in a freezer until used. The dry matter content of the bagasse
Appl Biochem Biotechnol

after dried was 95%. The bagasse used in the tests was divided into two parts. One part wasused as it came from the mill without prior screening and presented highly heterogeneousparticle sizes. This part will be called non-screened bagasse throughout this article. Theother part was screened in the size range of 0.248 to 1.397 mm (12–60 mesh). Smallerparticles were discarded because they corresponded mainly to sand. Figure 1 showssamples of the screened and non-screened bagasse.
Chemical Analysis of Bagasse Samples
Samples of the screened and non-screened bagasse were milled to pass through a 0.75 mmscreen. Approximately 3 g of milled sample was extracted with 95% ethanol for 6 h in aSoxhlet apparatus. Ash content was determined after burning of the samples in a muffle600 °C for 4 h [28]. Extracted bagasse samples were hydrolyzed with 72% sulfuric acid at30 °C for 1 h (300 mg of sample and 3 ml of sulfuric acid). The acid was diluted to a finalconcentration of 3% (addition of 79 ml of water) and the mixture heated at 125 °C/1 atm for1 h. The residual material was cooled and filtered through porous glass filter number 3. Thesolids were dried to constant weight at 105 °C and determined as insoluble lignin. Thesoluble lignin concentration in the filtrate was determined by measuring absorbance at205 nm and using the value of 105 l g−1 cm−1 as the absorptivity of soluble lignin [29]. Theconcentrations of monomeric sugars in the soluble fraction were determined by high-performance liquid chromatography (HPLC) using a Biorad HPX87H column at 45 °C,eluted at 0.6 ml/min with 0.005 mol/l sulfuric acid. Sugars were detected in a 30 °Ctemperature-controlled RI detector (Knauer HPLC pump and detector). In these conditions,xylose, mannose, and galactose eluted at the same retention time were integrated as a singlepeak. Glucose, xylose, arabinose, and acetic acid were used as external calibrationstandards. No corrections were performed because of sugar degradation reactions duringacid hydrolysis. The factors used to convert sugar monomers to anhydromonomers were0.90 for glucose and 0.88 for xylose and arabinose. Acetyl content was calculated as theacetic acid content multiplied by 0.7. These factors were calculated based on water additionto polysaccharides during acid hydrolysis [30–33]. Table 1 shows the composition of thescreened and non-screened bagasse.
Pretreatment
The pretreatment agents evaluated were alkaline hydrogen peroxide and lime (calciumhydroxide). Pretreatment time, temperature, and lime loading or hydrogen peroxide
Fig. 1 a Non-screened bagasseand b screened bagasse (12–60mesh)
Appl Biochem Biotechnol

concentration were evaluated during the experiments. The pretreatment solution of alkalineperoxide was prepared by dissolving H2O2 in distilled water and adjusting the pH to 11.5with sodium hydroxide, and the lime pretreatment solution was prepared by dissolvingCa(OH)2 in distilled water. In the lime pretreatment, in all the assays, a certain amount of limeremained insoluble, although this continued dissolving during pretreatment. Non-screenedbagasse (4 g) and screened bagasse (4 g) were treated with 100 ml of the pretreatmentsolution in 500 ml flasks in an orbital shaker (Marconi MA-832) agitated at 150 rpm.
Enzymatic Hydrolysis
After pretreatment, the substrate was washed to remove insoluble matter, dried, andweighted to measure mass loss. The present market offers many cellulase preparations(including those obtained from Trichoderma reesei) containing low levels of β-glucosidase,which leads to an increased accumulation of cellobiose in the enzymatic hydrolyzates of thecellulose. The inability of industrial glucose-fermenting yeasts to ferment cellobiose resultsin incomplete conversion of cellulose hydrolyzate to ethanol, significantly diminishing itsfinal yield. These drawbacks may be overcome by supplementation of the cellulasecomplex with a β-glucosidase from other sources [34]. One gram of the pretreated bagassewas hydrolyzed with 300 ml of solution containing cellulase and β-glucosidase with pHadjusted to 4.8. Cellulases from T. reesei (Sigma) loading was 3.42 FPU/g dry pretreatedbiomass. β-glucosidase from Aspergillus niger (Sigma) was added to completely convertcellobiose to glucose, loading 1.00 IU/g dry pretreated biomass. Cellulase activity wasdetermined as filter paper units per milliliter, as recommended by International Union ofPure and Applied Chemistry [35, 36]. β-Glucosidase activity was determined through asolution of cellobiose 15 mmol/l and express in units per milliliter (IU/ml) [37]. Enzymeactivity was 47.44 FPU/ml for cellulases and 343.63 IU/ml for β-glucosidase.
Hydrolysis experiments were carried out in 500-ml flasks in orbital shaker (MarconiMA-832) agitated at 100 rpm at 50°C. Aliquots were taken periodically, boiled todeactivate the enzymes, and analyzed for glucose and reducing sugars. The values ofglucose and reducing sugar yields used for the statistical analysis were picked at thereaction time, after which, no significant changes in these variables were detected.
Analytical Methods
Glucose yield was measured using a kit based on the glucose oxidase reaction (GOD–PAP,Laborlab) and TRS yield was determined by the dinitrosalicylic acid (DNS) method [38].
Table 1 Composition of the non-screened and screened sugarcane bagasse.
Non-screened bagasse (%) Screened bagasse (%)
Glucan 39.6±0.9 34.1±0.9Xylan 19.7±0.5 17.7±0.5Arabinan groups 1.7±0.1 2.0±0.1Acetyl groups 2.5±0.1 2.4±0.1Lignin 25.8±1.6 29.3±1.6Extractives 2.3±0.1 2.3±0.1Ash 3.8±0.1 5.3±0.1
Appl Biochem Biotechnol

For glucose quantification, 10 μl of the sample and 1.0 ml of the mono-reagent glucoseoxidase were added in assay pipes and put in a thermostatic bath (Marconi MA-184) at 37 °Cper 10 min. At the end of the reaction, the absorbance was read in spectrophotometer (Femto600S) at 540 nm.
For the TRS quantification, 0.5 ml of the samples and 1.5 ml of DNS were added inassay pipes and put in a thermostatic bath (Marconi MA-184) at 95 °C per 5 min. After, thesamples were cooled immediately by immersion in an ice bath. The absorbance was read inspectrophotometer (Femto 600S) at 540 nm. In both methods, the standard glucose (Merck)was used for the preparation of standard curve.
Results and Discussion
A 23 full factorial design with three replicates in the central point was performed for eachpretreatment considered. The objective was to evaluate the influence of pretreatment time,temperature, and pretreatment agent concentration on the subsequent enzymatic hydrolysisperformance.
Table 2 shows the design matrix and glucose and TRS yields after hydrolysis ofpretreated bagasse for the screened (S) and non-screened (NS) samples for the pretreatmentwith alkaline hydrogen peroxide. Table 3 shows the design matrix for the pretreatment withlime. In both tables, the glucose and TRS yields were expressed as milligram per gram ofdry raw bagasse (not pretreated). The maximum TRS and glucose yield obtained aremarked in bold, and the mean TRS and glucose yield obtained for the screened and non-screened bagasse samples in all the assays are also shown. The ranges of the factors for thetwo pretreatments were chosen based on literature [12–27].
It can be seen from Tables 2 and 3 that, in the operational conditions used in this work,maximum TRS yield was obtained with lime pretreatment of non-screened bagasse(554.2 mg/g dry non-screened bagasse). Lime pretreatment of screened bagasse alsoresulted in high TRS yield (550.6 mg/g dry screened bagasse); thus, when all the reducing
Table 2 Design matrix presenting TRS and glucose yields after hydrolysis of pretreated bagasse [screened(S) and non-screened (NS)].
Assay Time(h)
Temperature(°C)
[H2O2](%)
TRS(NS;mg/g)
Glucose(NS;mg/g)
Glucose(NS)yield (%)
TRS(S; mg/g)
Glucose(S; mg/g)
Glucose(S) yield(%)
1 6 20 1 206.2 64.6 14.5 259.0 103.3 26.92 24 20 1 211.5 79.7 17.9 253.5 98.1 25.63 6 60 1 433.0 215.3 48.3 342.4 166.7 43.54 24 60 1 280.7 121.4 27.3 340.3 181.9 47.45 6 20 5 347.0 241.9 54.3 368.0 239.3 62.46 24 20 5 494.7 309.3 69.4 452.1 228.1 59.57 6 60 5 364.9 252.5 56.7 288.9 188.8 49.28 24 60 5 407.0 287.7 64.6 285.5 163.4 42.69 15 40 3 359.0 229.6 51.5 309.4 167.6 43.710 15 40 3 323.5 209.2 47.0 346.5 195.2 50.911 15 40 3 323.9 204.6 45.9 307.1 164.9 43.0
Mean 341.0 201.4 45.2 323.0 172.5 45.0
Alkaline hydrogen peroxide
Appl Biochem Biotechnol

sugars (hexoses and pentoses) are of interest, lime pretreatment is a better choice ofpretreatment agent than alkaline peroxide pretreatment. In addition, bagasse screening is notnecessary, which reduces substantially the costs of the process.
Table 4 shows the effects of pretreatment time, temperature, and lime loading on TRSyield after hydrolysis for lime pretreatment of non-screened bagasse. The statistical analysiswas performed using the software Statistica (Statsoft, v. 7.0), and the confidence levelconsidered was 90%. Significant effects are marked in bold. A statistical model is notpresented because a linear model is not able to represent experimental behavior in this case.
It can be seen from Table 4 that the major effect is that of pretreatment time, followed bythe three-way interaction. The interaction between pretreatment time/temperature (12) andthe main effect of temperature are also significant. The main effect of lime loading has noinfluence on TRS yield, but its two-way interaction with temperature (23) is significant. Itcan be observed that all the significant effects are positive, which means that maximumTRS yield for the non-screened bagasse is for high pretreatment time, temperature, and limeloading (see assay 8 in Table 3).
Table 3 Design matrix presenting TRS and glucose yields after hydrolysis of pretreated bagasse [screened(S) and non-screened (NS)].
Assay Time(h)
Temperature(°C)
Limeloading.(g/g)
TRS(NS;mg/g)
Glucose(NS;mg/g)
Glucose(NS) yield(%)
TRS(S;mg/g)
Glucose(S;mg/g)
Glucose(S) yield(%)
1 12 60 0.10 306.3 128.2 28.8 422.7 208.4 54.32 36 60 0.10 433.9 232.2 52.1 481.8 235.6 61.43 12 70 0.10 351.5 161.0 36.1 474.8 329.0 85.84 36 70 0.10 427.7 228.1 51.2 549.3 335.5 87.55 12 60 0.40 379.6 108.2 24.3 516.3 212.3 55.46 36 60 0.40 307.1 106.1 23.8 550.6 331.5 86.47 12 70 0.40 268.6 110.0 24.7 456.3 177.6 46.38 36 70 0.40 554.2 296.9 66.7 528.4 171.9 44.89 24 65 0.25 535.0 224.9 50.5 484.0 265.9 69.310 24 65 0.25 530.0 213.4 47.9 490.1 265.6 69.211 24 65 0.25 531.2 223.2 50.1 502.4 260.9 68.0
Mean 420.5 184.7 41.5 496.1 254.0 66.2
Lime
Factor TRS (NS)
Effect p Value
Mean 420.46 3.4377.10–6
Pretreatment time (1) 104.23 0.0003Temperature (2) 43.78 0.0017Ca(OH)2 loading (3) −2.48 0.311912 76.68 0.000613 2.33 0.334923 24.28 0.0057123 102.38 0.0003
Table 4 Effects on TRS yieldafter hydrolysis of non-screenedbagasse pretreated with lime.
Significant effects marked in bold
Appl Biochem Biotechnol

As the industrial fermenting microorganisms used nowadays for industrial ethanolproduction do not ferment pentoses, in many practical applications, the product of interestmay be glucose. From Tables 2 and 3, it can be noticed that the maximum glucose yield inthe range of operational conditions used in this work is for lime pretreatment of screenedbagasse (335.5 mg/g dry screened bagasse). For non-screened bagasse, alkaline hydrogenperoxide seems to be the pretreatment agent of choice, although lime pretreatment leads toglucose yield just a little lower (309.3 mg/g dry non-screened bagasse with alkalineperoxide versus 296.9 mg/g dry non-screened bagasse when the pretreatment agent is lime).This not a statically significant difference; however, the process based on the alkalinehydrogen peroxide requires lower temperature and process time. Overall, it seems to be themore suitable one.
As screening is an expensive unit operation, we investigated not only the best result(lime pretreatment of screened bagasse) but also the two options for pretreatment with non-screened bagasse: alkaline peroxide and lime pretreatments.
Table 5 shows the scaled regression coefficients of the regression model of glucose yieldafter hydrolysis for alkaline hydrogen peroxide pretreatment of non-screened bagasse. Itcan be seen that, at the 90% confidence level, pretreatment time is not significant forglucose yield. However, the interactions between pretreatment time/temperature (12) andbetween pretreatment time/H2O2 concentration (13) are significant. Concentration of H2O2
is the most important factor affecting this response, temperature is significant, and theinteraction between temperature/peroxide concentration (23) also influences significantlyglucose yield.
Table 6 depicts the scaled regression coefficients of the regression models of glucoseyield after hydrolysis for lime pretreatment of non-screened and screened bagasse. Forscreened bagasse, only the interaction between pretreatment time/lime loading (13) is notsignificant. All the other main effects and interactions are significant, and the main effect ofpretreatment time is the most important. For screened bagasse, all the factors consideredand all their interactions are significant. The major effect is the interaction betweentemperature/lime loading (23), followed by the main effect of lime loading.
Table 7 depicts the analysis of variance (ANOVA) for the model of glucose yield afterhydrolysis for alkaline peroxide pretreatment of non-screened bagasse when only thesignificant coefficients are taken into account. It can be seen that the model presents highcorrelation coefficient and can be considered statistically significant with 90% ofconfidence according to the F test, as it presented a calculated value greater than the listedone [39]. Also, it does not present evidence of lack of fit, as the calculated value for theF test for lack of fit is much smaller than the listed value.
Factor Glu (NS)
Coefficient p Value
Mean 201.42 3.964.10−4
Pretreatment time (1) 5.96 0.5918Temperature (2) 45.36 0.0405H2O2 concentration (3) 152.58 0.003812 −35.29 0.064313 45.30 0.040523 −50.86 0.0326123 19.18 0.1781
Table 5 Scaled regressioncoefficients of the regressionmodel of glucose yield.
Non-screened bagasse pretreatedwith alkaline hydrogen peroxide.Significant effects marked inbold.
Appl Biochem Biotechnol

Table 8 shows the ANOVA for the models of glucose yield after hydrolysis for limepretreatment of non-screened and screened bagasse when only the significant coefficientsare taken into account. Both models present high correlation coefficients, and the F valuefor statistical significance of the regression are higher than the listed ones. Nevertheless,both models presented evidence of lack of fit, as they presented high lack of fit calculatedF values. A model with evidence of lack of fit cannot be used for prediction or optimizationpurposes. However, it can be used to plot qualitative response surfaces that can aid indetermining the best experimental region.
The response surface for glucose yield from non-screened bagasse pretreated withalkaline hydrogen peroxide is depicted in Fig. 2. Figure 2a shows glucose yield versusperoxide concentration and temperature when pretreatment time is 6 h, and Fig. 2b showsthe same response surface when pretreatment time is 24 h. From these figures, it can beseen that high glucose yields can be obtained with both high and low pretreatment time.When pretreatment time is low, the highest glucose yields are in the region of high peroxideconcentration and high temperature. For high pretreatment time, temperature has low
Table 7 ANOVA for the model describing glucose yield for non-screened bagasse (NS) pretreated withalkaline peroxide.
Source of variation Sum ofsquares (SQ)
Degrees offreedom (df)
Mean square(MS)
F Value
Glu Glu Glu Glu
Regression (R) 62,444.2 5 12,488.8 33.5*Residual (r) 1,861.7 5 372.3Lack of fit (Lf) 1,508.2 3 502.7 2.8**Pure error (Pe) 353.5 2 176.8Total (T) 64,305.9 10R2 0.971F listed values (90% of confidence) *F5,5=3.45
**F3,2=9.16
*F test for statistical significance of the regression=MSR/MSr
**F test for lack of fit=MSLf/MSPe
Table 6 Scaled regression coefficients of the regression models of glucose yield.
Factor Glu (NS) Factor Glu (S)
Coefficient p Value Coefficient p Value
Mean 184.75 0.0001 Mean 254.02 1.100.10–5
Pretreatment time (1) 88.98 0.0024 Pretreatment time (1) 36.80 0.0029Temperature (2) 55.33 0.0062 Temperature (2) 6.55 0.0799Lime loading (3) −32.08 0.0182 Lime loading (3) −53.80 0.001312 38.03 0.0131 12 −36.40 0.002913 3.43 0.5169 13 19.95 0.009723 40.98 0.0113 23 −103.70 0.0004123 56.48 0.0060 123 −26.05 0.0057
Non-screened and screened bagasse pretreated with lime.
Appl Biochem Biotechnol

influence and the highest glucose yields are in the region of high peroxide concentrationand low temperature. As the influence of temperature is low, pretreatment with alkalineperoxide can be performed at ambient temperature for high pretreatment time.
Figure 3 shows the response surface for glucose yield from non-screened bagassepretreated with lime. Figure 3a shows glucose yield versus lime loading and temperaturewhen pretreatment time is 12 h, and Fig. 3b shows the same response surface whenpretreatment time is 36 h. It can be seen that for non-screened bagasse pretreated withlime, pretreatment time has a strong influence on glucose yield after hydrolysis, with highpretreatment time resulting in higher glucose yields. For high pretreatment time, limeloading had a weak influence and temperature a strong influence, with high temperatureleading to high glucose yield. The maximum glucose yield was for high lime loadingsand high temperature, but high yields are obtained even for low/moderate loadings iftemperature is high.
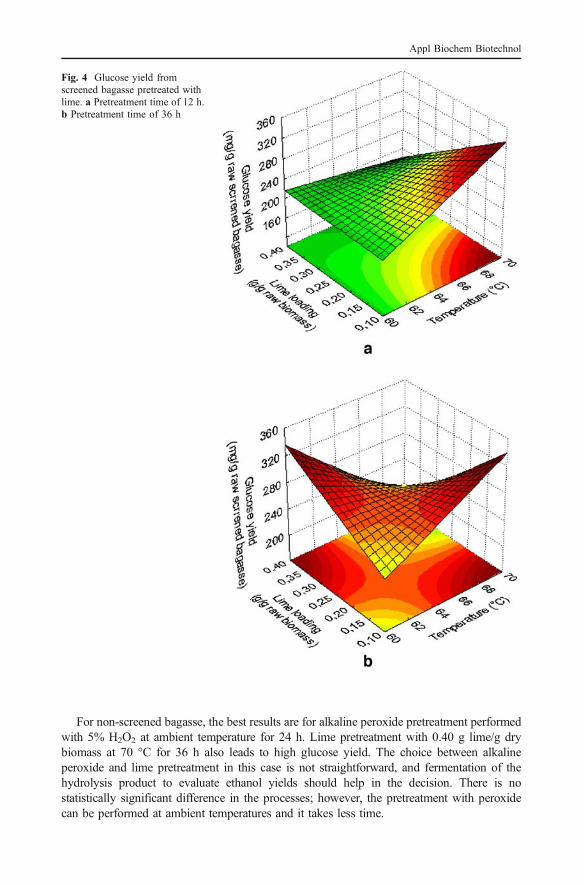
The response surface for glucose yield from screened bagasse pretreated with lime isshown in Fig. 4. Figure 4a shows glucose yield versus lime loading and temperature whenpretreatment time is 12 h, and Fig. 4b shows the same response surface when pretreatmenttime is 36 h. For low pretreatment time, maximum glucose yield was obtained for hightemperature and low lime loading. For long pretreatment time, there was high glucose yieldin two regions: low temperature and high lime loading or high temperature and low limeloading.
Conclusions
The effectiveness of alkaline hydrogen peroxide and lime pretreatment in improvingsugarcane bagasse susceptibility to enzymatic hydrolysis was evaluated. Two complete 23
factorial designs were carried out to determine the influence of pretreatment time,temperature, and H2O2 concentration or lime loading on the performance of enzymatic
Table 8 ANOVA for the models describing glucose yield for lime pretreatment of non-screened (NS) andscreened (S) bagasse.
Source of variation Sum of squares (SQ) Degrees offreedom (df)
Mean square(MS)
F value
Glu(NS)
Glu (S) Glu(NS)
Glu(S)
Glu(NS)
Glu (S) Glu (NS) Glu (S)
Regression (R) 36,647.8 34,907.4 6 7 6,108.0 4,986.8 4.55* 34.32*Residual (r) 5,371.0 435.9 4 3 1,342.8 145.3Lack of fit (Lf) 5,293.2 420.3 2 1 2,646.6 420.3 67.93** 53.85**Pure error (Pe) 77.9 15.6 2 2 39.0 7.8Total (T) 42,018.9 35,343.3 10 10R2 0.872 0.988F listed values(90% of confidence)
*F6,4=4.01 *F7,3=5.27
**F2,2=9.00 **F1,2=8.53
*F test for statistical significance of the regression=MSR/MSr
**F test for lack of fit=MSLf/MSPe
Appl Biochem Biotechnol

hydrolysis. The performance was evaluated by glucose and TRS yield after hydrolysis ofthe pretreated bagasse.
The influence of screening the bagasse before pretreatment in hydrolysis performancewas assessed. All the tests were performed using bagasse, as it comes from a sugar/alcoholfactory, and bagasse screened size 0.248 to 1.397 mm (12–60 mesh).
The results show that, when hexoses and pentoses are of interest, lime should be thepretreatment agent chosen, as high TRS yields are obtained for non-screened bagasse using0.40 g lime/g dry biomass at 70 °C for 36 h.
Fig. 2 Glucose yield from non-screened bagasse pretreated withalkaline hydrogen peroxide. aPretreatment time of 6 h. bPretreatment time of 24 h
Appl Biochem Biotechnol

When the product of interest is glucose, the best results were obtained with limepretreatment of screened bagasse. However, the results for alkaline peroxide and limepretreatments of non-screened bagasse are not very different. As screening is an expensiveunit operation, the use of non-screened bagasse is preferred.
For screened bagasse, lime pretreatment can be performed in three conditions for highglucose yields: 0.10 g lime/g dry biomass at 70 °C for 12 h, 0.10 g lime/g dry biomass at70 °C for 36 h or 0.40 g lime/g dry biomass at 60 °C for 36 h.
Fig. 3 Glucose yield from non-screened bagasse pretreated withlime. a Pretreatment time of 12 h.b Pretreatment time of 36 h
Appl Biochem Biotechnol
For non-screened bagasse, the best results are for alkaline peroxide pretreatment performedwith 5% H2O2 at ambient temperature for 24 h. Lime pretreatment with 0.40 g lime/g drybiomass at 70 °C for 36 h also leads to high glucose yield. The choice between alkalineperoxide and lime pretreatment in this case is not straightforward, and fermentation of thehydrolysis product to evaluate ethanol yields should help in the decision. There is nostatistically significant difference in the processes; however, the pretreatment with peroxidecan be performed at ambient temperatures and it takes less time.
Fig. 4 Glucose yield fromscreened bagasse pretreated withlime. a Pretreatment time of 12 h.b Pretreatment time of 36 h
Appl Biochem Biotechnol

As the maximum TRS and glucose yields were always found at the extremes of thestudied intervals, in future work, we will investigate if it is possible to improve glucose and/or TRS yield by redefining the factor levels to cover a bigger area around the optimalconditions determined in this work.
Acknowledgment The authors acknowledge Capes for the financial support.
References
1. Fan, L. T., Lee, Y. H., & Gharpuray, M. M. (1982). Advances in Biochemical Engineering, 23, 157–187.2. Gharpuray, M. M., Lee, Y. H., & Fan, L. T. (1983). Biotechnology and Bioengineering, 26, 426–433.3. Lynd, L. R., Elander, R. T., & Wyman, C. E. (1996). Applied Biochemistry and Biotechnology, 57/58,
741–761.4. Laser, M., Schulman, D., Allen, S. G., Lichwa, J., Antal Jr., M. J., & Lynd, L. R. (2002). Bioresource
Technology, 81, 33–44.5. Mosier, N., Wyman, C., Dale, B., Elander, R., Lee, Y. Y., Holtzapple, M., et al. (2005). Bioresource
Technology, 96, 673–686.6. Lee, J. (1997). Journal of Biotechnology, 56, 1–24.7. Wyman, C. E., Dale, B. E., Elander, R. T., Holtzapple, M., Ladisch, M. R., & Lee, Y. Y. (2005a).
Bioresource Technology, 96, 1959–1966.8. Wyman, C. E., Dale, B. E., Elander, R. T., Holtzapple, M., Ladisch, M. R., & Lee, Y. Y. (2005b).
Bioresource Technology, 96, 2026–2032.9. Hinman, N. D., Schell, D. J., Riley, C. J., Bergeron, P. W., & Walter, P. J. (1992). Applied Biochemistry
and Biotechnology, 34/35, 639–649.10. Parisi, F. (1982). Advances in Biochemical Engineering, 38, 53–87.11. Kaar, W. E., & Holtzapple, M. T. (2000). Biomass Bioengineering, 18, 189–199.12. Gould, J. M. (1984). Biotechnology and Bioengineering, 26, 46–52.13. Gould, J. M. (1985). Biotechnology and Bioengineering, 27, 225–231.14. Gould, J. M. (1987). Int. CI. C 13K1/02. US, PI 4 649,113.15. Azzam, A. M. (1989). Journal of Environmental Science and Health B, 24(4), 421–433.16. Amjed, M., Jung, H. G., & Donker, J. D. (1992). Journal of Animal Science, 70, 2877–2884.17. Krishna, S. H., Prasanthi, K., Chowdary, G. V., et al. (1998). Process Biochemistry, 33, 825–830.18. Lesoing, G., Klopfenstein, T., Rush, I., & Ward, J. (1981). Journal of Animal Science, 51, 263.19. Verma, M. L. (1983). In G. R. Pearce (Ed.), Canberra, ACT, Australia : Australian Government
Publishing Service, pp 85–99.20. Playne, M. J. (1984). Biotechnology and Bioengineering, 26, 426–433.21. Nagwani, M. (1992). M.S. thesis, Texas A&M University.22. NREL (National Renewable Energy Laboratory–EUA). (1996)23. Chang, V. S., Burr, B., & Holtzapple, M. T. (1997). Applied Biochemistry and Biotechnology, 63–65,
3–19.24. Chang, V. S., Nagwani, M., & Holtzapple, M. T. (1998). Applied Biochemistry and Biotechnology, 74,
135–159.25. Holtzapple, M. T., & Davison, R. R. (1999). Int. CI. C 13K1/02. US, PI 5,865,898.26. Kaar, W. E., & Holtzapple, M. T. (2000). Biomass Bioengineering, 18, 189–199.27. Kim, S., & Holtzapple, M. T. (2005). Bioresource Technology, 96(18), 1994–2006.28. Ferraz, A., Baeza, J., Rodriguez, J., & Freer, J. (2000). Bioresource Technology, 74(3), 201–212.29. Lin, Y. L., & Dence, C. W. (1992). Methods in lignin chemistry pp. 33–62. Berlin: Springer.30. Irick, T. J., West, K., Brownell, H. H., Schiwald, W., & Saddler, J. N. (1988). Applied Biochemistry and
Biotechnology, 17, 137–149.31. Kaar, W. E., & Brink, D. L. (1991). Journal of Wood Chemistry and Technology, 11, 479–494.32. Kaar, W. E., Gool, L. G., Merriman, M. M., & Brink, D. L. (1991). Journal of Wood Chemistry and
Technology, 11, 447–463.33. Laver, M. L., & Wilson, K. P. (1993). Tappi Journal, 76/6, 155–159.34. Szczodrak, J., & Fiedurek, J. (1996). Biomass and Bioenergy, 10(5/6), 367–375.
Appl Biochem Biotechnol

35. Ghose, T. K. (1987). Pure and Applied Chemistry, 59(2), 257–268.36. Adney, B., Baker, J. (1996). Chemical analysis and testing task—laboratory analytical procedure.
LAP-006.37. Wood, T. M., & Bhat, K. M. (1988). Methods in enzymology pp. 160, 87–116. San Diego: Academic.38. Miller, G. L. (1959). Analytical Chemistry, 31(3), 426–428.39. Barros Neto, B., Scarmin, I. S, & Bruns, R. E. (2003), 2 ed. Campinas, SP: Editora da UNICAMP.
Appl Biochem Biotechnol
Copyright © 2022 FDOKUMEN