Lime Pretreatment of Sugarcane Bagasse for Bioethanol Production
Upload
independentCategory
view
0download
0
PLEASE SCROLL DOWN FOR ARTICLE
This article was downloaded by: [Chintala, Rajesh][South Dakota State University]On: 12 July 2010Access details: Access Details: [subscription number 919556249]Publisher Taylor & FrancisInforma Ltd Registered in England and Wales Registered Number: 1072954 Registered office: Mortimer House, 37-41 Mortimer Street, London W1T 3JH, UK
Communications in Soil Science and Plant AnalysisPublication details, including instructions for authors and subscription information:http://www.informaworld.com/smpp/title~content=t713597241
Grouping Soils by Taxonomic Order to Improve Lime RecommendationsRajesh Chintalaa; Louis M. McDonaldb; William B. Bryanb
a North Central SunGrant Center, South Dakota State University, Brookings, South Dakota, USA b
Plant and Soil Sciences Division, West Virginia University, Morgantown, West Virginia, USA
Online publication date: 05 July 2010
To cite this Article Chintala, Rajesh , McDonald, Louis M. and Bryan, William B.(2010) 'Grouping Soils by TaxonomicOrder to Improve Lime Recommendations', Communications in Soil Science and Plant Analysis, 41: 13, 1594 — 1603To link to this Article: DOI: 10.1080/00103624.2010.485239URL: http://dx.doi.org/10.1080/00103624.2010.485239
Full terms and conditions of use: http://www.informaworld.com/terms-and-conditions-of-access.pdf
This article may be used for research, teaching and private study purposes. Any substantial orsystematic reproduction, re-distribution, re-selling, loan or sub-licensing, systematic supply ordistribution in any form to anyone is expressly forbidden.
The publisher does not give any warranty express or implied or make any representation that the contentswill be complete or accurate or up to date. The accuracy of any instructions, formulae and drug dosesshould be independently verified with primary sources. The publisher shall not be liable for any loss,actions, claims, proceedings, demand or costs or damages whatsoever or howsoever caused arising directlyor indirectly in connection with or arising out of the use of this material.

Communications in Soil Science and Plant Analysis, 41:1594–1603, 2010Copyright © Taylor & Francis Group, LLCISSN: 0010-3624 print / 1532-2416 onlineDOI: 10.1080/00103624.2010.485239
Grouping Soils by Taxonomic Order to ImproveLime Recommendations
RAJESH CHINTALA,1 LOUIS M. MCDONALD,2
AND WILLIAM B. BRYAN2
1North Central SunGrant Center, South Dakota State University, Brookings,South Dakota, USA2Plant and Soil Sciences Division, West Virginia University, Morgantown, WestVirginia, USA
The success of a liming program is dependent upon the accuracy of the lime rec-ommendation, which in turn depends on the quality of the underlying correlationsand calibrations. Because of the expense, large-scale field calibration experiments arerarely conducted. The relatively low economic returns from pastures make it even moreunlikely that a calibration experiment would be conducted, especially in West Virginia.Therefore, any improvements in lime recommendations have to be made from lime cor-relations. Moreover, it is unlikely that a single lime correlation can accurately identifyappropriate lime rates for all soils. Hence, the objectives of this study were to improvethe accuracy of lime recommendations by using quick tests that account for soil orderand to develop lime correlations for acidic pasture soils of West Virginia. Twenty-fivesurface soil samples (0–7.5 cm) from the three major soil orders in the state (Alfisols,Inceptisols, Ultisols) were collected, most in cooperation with state soil scientists.Standard procedures for the determination of lime requirements by the Adams–Evansbuffer (AEB), Mehlich single buffer (MB), and Shoemaker–McLean–Pratt single buffermethods (SMPB) were used. Statistically significant improvements in lime recommen-dations for target pH values of 6.5 and 5.5 were achieved by accounting for soil order.Mehlich single buffer recommendations were better for Alfisols and Ultisols than forEntisols to achieve pH 6.5. Lime correlations were developed for all three chemicalbuffers by multiple regression where the independent variables were target pH andsoil-buffer pH. The AEB predicted lime rates better for target pH 5.5.
Keywords Acidic pasture soils, alfisols, Appalachian grasslands, chemical buffers,inceptisols, lime correlations, lime recommendations, lime requirement, ultisols, WestVirginia acidic soils
Introduction
The dominant soil orders for grasslands in West Virginia are Alfisols, Ultisols, andInceptisols. These soils tend to be acidic because of high precipitation and undulatingtopography. Because of these factors, the removal rate of base cations exceeds the rateof their liberation from nonexchangeable forms (DeWalle et al. 1985), resulting in soilsdominated by variable-charge minerals (Ritchey and Snuffer 2002). Although lime is an
Received 2 February 2009; accepted 28 August 2009.Address correspondence to Rajesh Chintala, North Central Sun Grant Center, South Dakota
State University, 815 Medary Avenue, Suite 201, Brookings, SD 57006. E-mail: [email protected]
1594
Downloaded By: [Chintala, Rajesh][South Dakota State University] At: 14:51 12 July 2010

Improving Lime Recommendations 1595
inexpensive soil amendment, because economic returns to pasture are relatively low andlime applications can be difficult on the steep soils of the region, it is important that limeapplication accurately reflect correct soil acidity.
Pasture soil samples for lime-requirement (LR) determination are typically collectedfrom the uppermost portion of the A-horizon, typically less than 7.5 cm. The propertiesused to distinguish between soil orders occur in subsurface horizons (e.g., base saturationat 125 cm below the top of argillic horizon to distinguish Alfisols from Ultisols), and sosoil order would not be expected to influence epipedon LR (Buol et al. 2003). However, inWest Virginia, Aflisols are found over basic parent material and Ultisols over acidic (felsic)crystalline rock and acidic sediments. Therefore, we are hypothesizing that accounting forsoil order may improve LR correlations.
Various quick tests to estimate LR based on the pH change of a buffer solution havebeen proposed. The choice of a buffer method depends on the physicochemical prop-erties of the soils to be tested and so tend to be common to a region of the country.Single-buffer methods were found to be as accurate as the more complicated double-buffermethods to determine LRs after appropriate calibration (Tran and Van Lierop 1981). Themost common chemical buffers used are the Adams–Evans buffer (AEB), Mehlich singlebuffer (MB), and Shoemaker–McLean–Pratt single buffer (SMPB). The SMPB methodwas designed to determine LRs for soils with high amounts of extractable Al (aluminum)and high buffer capacity (Shoemaker, McLean, and Pratt 1961). The AEB was developedfor soils (Ultisols) with low cation exchange capacity (Adams and Evans 1962). BothSMPB (McLean et al. 1978) and AEB (Fox 1980) were observed to underestimate theLR of low-buffer-capacity soils and to overestimate the LR in soils with intermediate tohigh buffer capacity. The MB was designed to predict the amount of lime needed to neu-tralize extractable acidity (Tran and Van Lierop 1982). Average lime doses determinedby the MB method were 59% of lime predictions by incubations (Mehlich 1976). WestVirginia is the only state in the northeast region (NEC-67 1995) and one of only two statesin the Appalachian region (Sims 1996) to use the MB method for LR determinations (NorthCarolina is the other state).
Comparative studies of different methods for determining the LR have been carriedout all over the world to determine the most appropriate buffer method. Nevertheless, dis-agreements still exist about the most accurate assessment of the LR for a specific soil–plantsystem. Soil-test lime correlations are strictly valid only for the soils used in making thedetermination. There are approximately 177 soil series mapped in West Virginia belong-ing to six orders (59 Alfisols, 50 Ultisols, 41 Inceptisols, 19 Entisols, 6 Mollisols, and2 Spodosols) in four major land resource areas (MLRAs). Given this range of soils, asingle correlation is unlikely to identify the appropriate lime rate for each soil. Possibly,LRs by quick tests can be improved by developing correlations with reference methodssuch as lime incubations and direct Ca(OH)2 (calcium hydroxide) titrations.
The objectives of this study were (1) to test the suitability of AEB, MB, and SMPB formaking lime recommendations in West Virginia; (2) to test the hypothesis that accountingfor soil order will improve lime recommendations; and (3) to determine lime correlationsfor the AEB, MB, and SMPB methods.
Materials and Methods
Samples from 25 soil series were collected in West Virginia, most in cooperation with statesoil scientists. Samples were collected from the upper 7.5 cm of soil, air dried, sieved topass a 2-mm sieve, and stored in plastic containers until use. When necessary, soils were
Downloaded By: [Chintala, Rajesh][South Dakota State University] At: 14:51 12 July 2010

1596 R. Chintala, L. M. McDonald, and W. B. Bryan
incubated with aluminum sulfate [Al2(SO4)3] to reduce initial pH to a common startingpoint of approximately 5.0. Many of these samples, collected as part of ongoing soil surveywork in the state, were point samples from control pedons.
Standard methods were used to determine the chemical and physical properties knownto influence the LR of each soil sample. Texture was determined by the pipette method(Gee and Bauder 1986); organic matter content was tested by dry combustion using aLECO CNS 2000 instrument (Leco, St. Joseph, Mich.) (Nelson and Sommers 1996); sec-ondary nutrients [calcium (Ca), magnesium (Mg), potassium (K), and phosphorus (P)]were found by Mehlich I extraction (NEC-67 1995); micronutrients were determined bydiethylenetriaminepentaacetic acid (DTPA) extraction (NEC-67 1995); exchangeable Al(aluminum) and exchangeable acidity were measured by 1 M potassium chloride (KCl)extraction (Sims 1996); and cation exchange capacity (Chapman 1965) and noncrys-talline oxides were found by ammonium oxalate extraction in the dark (Jackson, Lim,and Zelazny 1986). All elemental concentrations were determined by inductively coupledplasma–atomic emission spectroscopy (ICP-AES) (Perkin Elmer P400, Norwalk, Conn.).
The “true” value of the LR was assumed to be equal to that determined by directcalcium hydroxide [Ca(OH)2] titration (Dun 1943). This approach has been used in manyother LR determination studies (e.g., Follett and Follett 1980; McConnell et al. 1990).Soil buffer pH was determined by the MB, AEB, and SMPB methods (Sims 1996). Alldeterminations were performed in triplicate. Estimated LRs were obtained using measuredbuffer pH and the appropriate calibration table (Van Lierop 1990; Adams and Evans 1962).
Lime correlations were determined by multiple regressions where the independentvariables were target pH and soil-buffer pH. Estimated LR values were compared to trueLR values using Dunnett’s t-test (α = 0.05), before and after grouping by order.
Results and Discussion
As collected, the mean pH of soil samples varied from 4.78 to 5.04, clay content variedfrom 22.7 to 25%, organic-matter content varied from 4.68 to 5.53%, and cation exchangecapacity (CEC) (cmolc kg–1) varied from 13.33 to 15.6 (Table 1).
Determination of Lime Requirement with Chemical Buffers
The “true” LR increased as target pH increased, as expected (Table 2). The rate of increasewas approximately 1.2 Mg ha–1 per unit increase in target pH. The SMPB estimatedLRs were consistently greater than either AEB or MB for all target pH levels. The meanoverprediction was greater for SMPB and AEB than for MB.
Except for AEB and a target pH of 5.5, all buffer methods overestimated LR at alltarget pH values (Table 3) compared to true LR values by direct calcium hydroxide titra-tion method. The overprediction for SMPB was consistently larger than for the other twomethods. Shoemaker, McLean, and Pratt (1961) found that predicted lime values usingSMPB were significantly greater than the amount required by CaCO3 (calcium carbonate)incubation to attain pH 6.5.
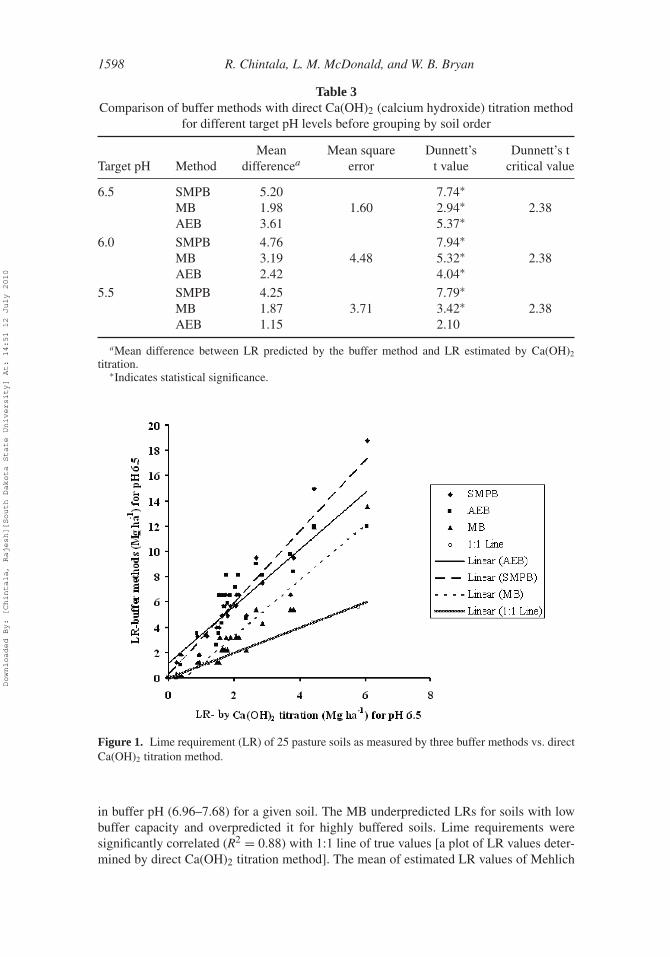
The estimated LR by chemical buffers was plotted against the true LR by directCa(OH)2 titration to target pH 6.5 (Figure 1). The SMPB LR for target pH 6.5 rangedfrom 1.2 to 18.8 Mg ha–1. The SMPB exhibited greater change in buffer pH, ranging from4.92 to 7.07. The buffering capacity of the SMPB solution seemed to be lowest. Van Lierop(1983) also observed that SMPB has a greater sensitivity to change in pH for a given soilLR. The greater sensitivity of SMPB resulted in a significant correlation (R2 = 0.89) with
Downloaded By: [Chintala, Rajesh][South Dakota State University] At: 14:51 12 July 2010

Improving Lime Recommendations 1597
Table 1Mean, range, and standard deviation of soil pH, silt, clay, and organic-matter contents
and cation exchange capacity (CEC) grouped by soil order
Soil order
Parameter Statistic Alfisol Ultisol Inceptisol
pH Mean 4.92 4.78 5.04Range 4.8–5.17 4.44–5.08 4.8–5.17St. Dev. 0.17 0.30 0.13
Silt (%) Mean 39.14 45.41 42.9Range 9.36–61.16 21.74–55.63 30.4–51.3St. Dev. 17.82 13.6 7.09
Clay (%) Mean 23.57 22.7 25Range 17.9–31.9 18.1–27.3 17–38.2St. Dev. 3.82 3.49 6.85
OM (%) Mean 5.53 4.68 5.01Range 3.8–9.2 3.5–7.9 2.9–7.5St. Dev. 1.72 1.84 1.67
CEC (cmolc kg) Mean 14.7 13.3 15.6Range 8.2–24.7 8.5–16.1 8.3–22.8St. Dev. 5.16 3.47 6.43
Table 2Mean lime requirement (LR) values (Mg ha–1) for different target pH levels
Target pH
Order Method 5.5 6.0 6.5
Alfisols SMPB 6.11 7.83 9.24AEB 2.76 5.23 8.15MB 3.23 5.73 6.05Titration 1.53 2.89 4.25
Ultisols SMPB 5.60 7.51 8.68AEB 3.04 5.51 8.28MB 3.51 6.15 6.52Titration 1.54 2.54 3.71
Inceptisols SMPB 4.74 6.46 7.41AEB 1.73 4.20 7.4MB 3.8 5.53 5.82Titration 0.97 2.02 3.10
actual values determined by direct Ca(OH)2 titration. The mean difference between AEBand true LR values were significantly different (3.63 Mg ha–1) for target pH 6.5 (Table 3).The AEB overestimated the LR despite a significant correlation (R2 = 0.81) with titra-tion method (Figure 1). The AEB solution showed relatively high resistance to a change
Downloaded By: [Chintala, Rajesh][South Dakota State University] At: 14:51 12 July 2010
1598 R. Chintala, L. M. McDonald, and W. B. Bryan
Table 3Comparison of buffer methods with direct Ca(OH)2 (calcium hydroxide) titration method
for different target pH levels before grouping by soil order
Target pH MethodMean
differenceaMean square
errorDunnett’s
t valueDunnett’s t
critical value
6.5 SMPB 5.20 7.74∗MB 1.98 1.60 2.94∗ 2.38AEB 3.61 5.37∗
6.0 SMPB 4.76 7.94∗MB 3.19 4.48 5.32∗ 2.38AEB 2.42 4.04∗
5.5 SMPB 4.25 7.79∗MB 1.87 3.71 3.42∗ 2.38AEB 1.15 2.10
aMean difference between LR predicted by the buffer method and LR estimated by Ca(OH)2
titration.∗Indicates statistical significance.
Figure 1. Lime requirement (LR) of 25 pasture soils as measured by three buffer methods vs. directCa(OH)2 titration method.
in buffer pH (6.96–7.68) for a given soil. The MB underpredicted LRs for soils with lowbuffer capacity and overpredicted it for highly buffered soils. Lime requirements weresignificantly correlated (R2 = 0.88) with 1:1 line of true values [a plot of LR values deter-mined by direct Ca(OH)2 titration method]. The mean of estimated LR values of Mehlich
Downloaded By: [Chintala, Rajesh][South Dakota State University] At: 14:51 12 July 2010

Improving Lime Recommendations 1599
buffer (MB) was significantly greater (1.98 Mg ha–1) than values of direct Ca(OH)2 titra-tion at target pH 6.5. The change in buffer pH of MB with soils ranged from 5.30 to 6.56,which indicated a relatively better sensitivity in predicting LRs than AEB. In this study,few lime values of highly buffered soils had enough influence on the regression line of MBto deviate significantly from 1:1 line of true LR values.
Effect of Soil Order on Chemical Buffer Lime Requirement Predictions
The SMPB method predictions did not improve after grouping by soil order at any targetpH. For a target pH of 5.5, grouping improved predictions for Alfisols and Ultisols withAEB and MB (Table 4). For a target pH of 6.0, grouping improved predictions for Ultisolswith AEB and MB. For target pH of 6.5, grouping improved predictions for Alfisols andUltisols with MB (Figures 2a–c).
Table 4Soil grouping effect on lime requirement (LR) by quick tests for different target pH levels
Order Target pH MethodMean
differenceMean square
errorDunnett’s
t valueDunnett’s t
critical value
Alfisols 5.5 SMPB 4.50 5.07∗AEB 1.16 5.12 1.30 2.42MB 1.63 1.83
6.0 SMPB 5.03 5.18∗AEB 2.44 6.11 2.51∗ 2.42MB 2.94 3.03∗
6.5 SMPB 4.62 4.49∗AEB 2.80 6.86 2.72∗ 2.42MB 1.14 1.10
Inceptisols 5.5 SMPB 3.81 7.16∗AEB 0.79 0.99 1.48 2.50MB 2.15 4.04∗
6.0 SMPB 4.17 6.61∗AEB 2.22 1.39 3.52∗ 2.50MB 3.55 5.63∗
6.5 SMPB 5.28 8.56∗AEB 3.78 1.33 6.13∗ 2.50MB 2.94 4.76∗
Ultisols 5.5 SMPB 4.05 3.14∗AEB 1.49 4.14 1.15 2.59MB 1.97 1.53
6.0 SMPB 4.97 3.38∗AEB 2.97 5.39 2.02 2.59MB 3.60 2.45
6.5 SMPB 5.43 3.55∗AEB 4.38 5.84 2.86∗ 2.59MB 2.92 1.91
∗Indicates statistical significance.
Downloaded By: [Chintala, Rajesh][South Dakota State University] At: 14:51 12 July 2010

1600 R. Chintala, L. M. McDonald, and W. B. Bryan
Figure 2a. Lime requirement (LR) of Alfisols as measured by three buffer methods vs. directCa(OH)2 titration method.
Figure 2b. Lime requirement (LR) of Inceptisols as measured by three buffer methods vs. directCa(OH)2 titration method.
Improved Lime Recommendation Correlations
There are two reasons why the buffer method LR predictions may differ from the trueLR as determined by Ca(OH)2 titration. First, the titration results may not represent theresults obtained by CaCO3 incubation. Second, the underlying lime correlation equationmay be in error. Because Ca(OH)2 titration has been shown to accurately predict CaCO3incubation results (Alabi et al. 1986), and because accounting for soil order significantly
Downloaded By: [Chintala, Rajesh][South Dakota State University] At: 14:51 12 July 2010

Improving Lime Recommendations 1601
Figure 2c. Lime requirement (LR) of Ultisols as measured by three buffer methods vs. directCa(OH)2 titration method.
Table 5Regression equations to predict lime requirements (LR) for target pH 5.5
Buffer Type Order Equations for LR (Mg ha–1) to target pH 5.5
MBLinear Alfisols LR = 15.0 – 2.28 × BpHQuadratic Inceptisols LR = 10.96 – 1.70 × BpH + 4.80 × (BpH – 5.94)2
Ultisols LR = 23.15 – 3.62 × BpH – 5.84 × (BpH – 5.86)2
AEBQuadratic Alfisols LR = 10.96 – 1.31 × BpH + 0.67 × (BpH – 7.18)2
Inceptisol LR = 4.21 – 0.46 × BpH + 6.81 × (BpH – 7.25)2
Ultisols LR = 22.79 – 2.94 × BpH – 3.29 × (BpH – 7.18)2
SMPBQuadratic Alfisols LR = 6.89 – 0.91 × BpH + 0.50 × (BpH – 5.85)2
Inceptisols LR = 5.73 – 0.80 × BpH + 3.62 × (BpH – 6.0)2
Ultisols LR = 14.03 – 2.10∗BpH – 1.87∗(BpH – 5.84)2
improved predictions for Alfisols and Ultisols for AEB and MB, we assumed that the errorwas with the lime correlation. The new correlation equations, some of which were notlinear, are given in Tables 5–7. Additional data will be needed to test the validity of thesenew correlation equations.
In conclusion, in this study it was hypothesized that the accuracy of LR could beimproved by accounting for soil order. However, an improvement in accuracy was seenonly in the cases of MB and AEB predictions, and new lime correlation equations weredeveloped. There appears to be an opportunity to improve lime predictions by accountingfor soil order. However, these findings should be confirmed by extensive testing with largernumber of samples.
Downloaded By: [Chintala, Rajesh][South Dakota State University] At: 14:51 12 July 2010

1602 R. Chintala, L. M. McDonald, and W. B. Bryan
Table 6Regression equations to predict lime requirements (LR) for target pH 6.0
Buffer Type Order Equations for LR (Mg ha–1) to target pH 6.0
MBQuadratic Alfisols LR = 37.06 – 5.77 × BpH – 4.12 × (BpH – 5.90)2
Inceptisols LR = 32.90 – 5.20 × BpH – 12.55 × (BpH – 5.91)2
Ultisols LR = 26.64 – 4.04 × BpH – 6.42 × (BpH – 5.86)2
AEBLinear Alfisols LR = 22.91 – 2.80 × BpHQuadratic Inceptisol LR = 5.20 – 0.51 × BpH + 17.28 × (BpH – 7.25)2
Ultisols LR = 24.09 – 2.98 × BpH – 3.25 × (BpH – 7.18)2
SMPBLinear Alfisols LR = 17.09 – 2.44 × BpHQuadratic Inceptisols LR = 51.19 – 8.1 × BpH – 20.06 × (BpH – 6.02)2
Ultisols LR = 16.00 – 2.27 × BpH – 1.84 × (BpH–5.84)2
Table 7Regression equations to predict lime requirements (LR) for target pH 6.5
Buffer Type Order Equations for LR (Mg ha–1) to target pH 6.5
MBQuadratic Alfisols LR= 52.45 – 8.02 × BpH – 4.28 × (BpH – 5.90)2
Inceptisols LR = 19.82 – 2.87 × BpH + 6.28 × (BpH – 5.91)2
Ultisols LR = 14.03 – 2.10 × BpH – 1.87 × (BpH – 5.84)2
AEBLinear Alfisols LR = 34.98 – 4.18 × BpHQuadratic Inceptisol LR = 4.84 – 0.32 × BpH + 13.75 × (BpH – 7.25)2
Linear Ultisols LR = 26.17 – 3.14 × BpHSMPB
Linear Alfisols LR = 25.43 – 3.50 × BpHQuadratic Inceptisols LR = 13.84 – 1.83 × BpH + 3.25 × (BpH – 6.01)2
Ultisols LR = 18.38 – 2.50 × BpH – 1.41 × (BpH – 5.84)2
Acknowledgments
Scientific contribution number 3048 from the West Virginia Agricultural and ForestryExperiment Station, Morgantown, WV. Funding for this research was provided from thePasture-Based Beef Production for Appalachia project, a multi-institutional collaborationamong West Virginia University, USDA-ARS, Virginia Tech, and University of Georgiaand from funds appropriated under the Hatch Act.
References
Adams, F., and C. E. Evans. 1962. A rapid method for measuring lime requirement of red-yellowPodzolic soils. Soil Science Society of America Proceedings 26:355–357.
Downloaded By: [Chintala, Rajesh][South Dakota State University] At: 14:51 12 July 2010

Improving Lime Recommendations 1603
Alabi, K. E., R. C. Sorensen, D. Knudsen, and O. H. Rehm. 1986. Comparison of several limerequirement methods on coarse-textured soils of northeastern Nebraska. Soil Science Society ofAmerica Journal 50:937–941.
Buol, S. W., R. J. Southard, R. C. Graham, and P. A. McDaniel. 2003. Soil genesis and classification,5th ed. Ames, Iowa: Blackwell Publishing.
Chapman, H. D. 1965. Cation exchange capacity. In Method of soil analysis, part 2: Chemical andmicrobiological properties, ed. C. A. Black, 891–900. Madison, Wisc.: ASA.
DeWalle, D. R., G. C. Ribblett, J. D. Helvey, and J. Kochenderfer. 1985. Laboratory investigationof leachate chemistry from six Appalachian forest floor types subjected to simulated acid rain.Journal of Environmental Quality 14:234–240.
Dun, L. E. 1943. Lime requirement determination of soils by means of titration curves. Soil Science56:341–351.
Follett, R. H., and R. F. Follett. 1980. Strengths and weaknesses of soil testing in determining limerequirements for soils. In Proceedings of the National Conference on Agricultural Limestone,40–51. Muscle Shoals, Ala.: TVA National Fertilizer Development Center.
Fox, R. H. 1980. Comparison of several lime requirement methods for agricultural soils inPennsylvania. Communications in Soil Science and Plant Analysis 11:57–69.
Gee, G. W., and J. W. Bauder. 1986. Particle-size analysis. In Methods of soil analysis, part 2:Physical and mineralogical methods, 2nd ed., ed. A. Klute. Madison, Wisc.: American Societyof Agronomy.
Jackson, M. L., C. H. Lim, and L. W. Zelazny. 1986. Oxides, hydroxides, and aluminosilicates. InMethods of soil analysis, part 1: Physical and mineralogical methods, 2nd ed., ed. A. Klute.Madison, Wisc.: American Society of Agronomy.
McConnell, J. S., J. T. Gilmour, R. E. Baser, and B. S. Frizzell. 1990. Lime requirement of acidsoils of Arkansas (Arkansas Experiment Station Special Report 150). Fayetteville, Ark.: ArkansasAgricultural Experiment Station.
McLean, E. O., D. J. Eckert, G. Y. Reddy, and J. F. Trierweiller. 1978. An improved SMP soil limerequirement method incorporating double buffer and quick test features. Soil Science Society ofAmerica Journal 4:311–316.
Mehlich, A. 1976. New buffer pH method for rapid estimation of exchangeable acidity and limerequirement of soils. Communications of Soil Science and Plant Analysis 7:253–263.
NEC-67 (Northeast Coordinating Committee on Soil Testing). 1995. Recommended soil testingprocedures for the northeastern United States (Northeastern Regional Publication No. 493).Agricultural Experiment Station, University of Delaware, Newark, Delaware.
Nelson, D. W., and L. E. Sommers. 1996. Total carbon, organic carbon, and organic matter. InMethods of soils analysis, part 3: Chemical methods, ed. D. L. Sparks. Madison, Wisc.: AmericanSociety of Agronomy.
Ritchey, K. D., and J. D. Snuffer. 2002. Limestone, gypsum, and magnesium oxide influence therestoration of an abandoned Appalachian pasture. Agronomy Journal 94:830–839.
Shoemaker, H. E., E. O. McLean, and P. F. Pratt. 1961. Buffer methods for determining lime require-ment of soils with appreciable amounts of extractable aluminum. Soil Science Society of AmericaProceedings 25:274–277.
Sims, J. T. 1996. Lime requirement. In Methods of soil analysis, part 3: Chemical methods, ed.D. L. Sparks. Madison, Wisc.: American Society of Agronomy.
Tran, T. S., and W. Van Lierop. 1981. Evaluation and improvement of buffer-pH lime requirementmethods. Soil Science 131:178–188.
Tran, T. S., and W. Van Lierop. 1982. Lime requirement determination for attaining pH 5.5 and6.0 of coarse textured soils using buffer pH methods. Soil Science Society of America Journal46:1008–1014.
Van Lierop, W. 1983. Lime requirement determination of acid organic soils using buffer-pH methods.Canadian Journal of Soil Science 63:411–423.
Van Lierop, W. 1990. Soil pH and lime requirement. In Soil testing and plant analysis, 2nd ed., ed.R. L. Westerman, 73–126. Madison, Wisc.: SSSA.
Downloaded By: [Chintala, Rajesh][South Dakota State University] At: 14:51 12 July 2010
Copyright © 2022 FDOKUMEN