Bioethanol Production from Sugarcane Molasses by ...
23
Page 1/23 Bioethanol Production from Sugarcane Molasses by Engineered Strain Lactobacillus Casei E1 Song Wang ( [email protected] ) Northeast Agricultural University https://orcid.org/0000-0002-3710-8213 Ran Tian Northeast Agricultural University Buwei Liu Northeast Agricultural University Hongcai Wang Northeast Agricultural University Jun Liu Northeast Agricultural University Chenghui Li Northeast Agricultural University Mingyue Li Northeast Agricultural University Smith Etareri Evivie University of Benin Faculty of Agriculture Bailiang Li Northeast Agricultural University Research Article Keywords: Sugarcane molasses, Lactobacillus casei , Bioethanol, Fermentation Posted Date: February 18th, 2021 DOI: https://doi.org/10.21203/rs.3.rs-207976/v1 License: This work is licensed under a Creative Commons Attribution 4.0 International License. Read Full License
-
Upload
khangminh22 -
Category
Documents
-
view
0 -
download
0
Transcript of Bioethanol Production from Sugarcane Molasses by ...

Page 1/23
Bioethanol Production from Sugarcane Molasses byEngineered Strain Lactobacillus Casei E1Song Wang ( [email protected] )
Northeast Agricultural University https://orcid.org/0000-0002-3710-8213Ran Tian
Northeast Agricultural UniversityBuwei Liu
Northeast Agricultural UniversityHongcai Wang
Northeast Agricultural UniversityJun Liu
Northeast Agricultural UniversityChenghui Li
Northeast Agricultural UniversityMingyue Li
Northeast Agricultural UniversitySmith Etareri Evivie
University of Benin Faculty of AgricultureBailiang Li
Northeast Agricultural University
Research Article
Keywords: Sugarcane molasses, Lactobacillus casei , Bioethanol, Fermentation
Posted Date: February 18th, 2021
DOI: https://doi.org/10.21203/rs.3.rs-207976/v1
License: This work is licensed under a Creative Commons Attribution 4.0 International License. Read Full License

Page 2/23
AbstractSugarcane molasses are considered a potential source for bioethanol's commercial production becauseof its availability and low market price. It contains high concentrations of fermentable sugars that can bedirectly metabolized by microbial Fermentation. Lactic acid bacteria, especially Lactobacillus casei, havea high potential to be a biocatalyst in ethanol production that they are characterized by strong abilities ofcarbohydrate metabolism, ethanol synthesis, and high alcohol tolerance. This study aimed to evaluatethe feasibility of producing ethanol from sugarcane molasses by Lactobacillus casei used engineeringstrain L. casei E1 as a starter culture. The effects of environmental factors on the metabolism of L. caseiE1 were analyzed by high-performance liquid chromatography (HPLC) system, and the gene expressionof key enzymes in carbon source metabolism was detected using quantitative real-time PCR (RT-qPCR).Results showed that the strain could grow well, ferment sugar quickly and produce high yielded ethanol incane molasses. By fermenting this bacterium anaerobically at 37°C for 36 h incubation in 5 °BXmolasses when the fermenter's pH was controlled at 6.0, ethanol yield reached 13.77 g/L, andcarbohydrate utilization percentage was 78.60%. RT-qPCR results veri�ed the strain preferentially fermentglucose and fructose of molasses to ethanol at the molecular level. In addition, the metabolism of sugars,especially fructose, would be inhibited by elevating acidity. Our �ndings support the theoretical basis forexploring Lactic acid bacteria as a starter culture for converting sugarcane molasses into ethanol.
Key Points1. Veri�cating the ability of engineering strain L. casei E1 to produce bioethanol.
2. The possibility of lactic acid bacteria as a starter culture for ethanol production.
3. Carbohydrate metabolic characteristics of the strain in sugarcane molasses.
IntroductionThere has been a global increase in the demand for alternate renewable energy. Bioethanol, which canserve as a gasoline additive to increase octane and improve vehicle emissions in its pure form (Baki et al.2020), is an alcohol made by microorganisms through the Fermentation of carbohydrates. At present,bioethanol can be derived from cellulosic biomass such as trees and grasses, which are non-foodsources. However, cellulose and hemicellulose of �brous biomass are di�cult to convert into fermentablesugars for direct use by microorganisms to produce ethanol. Moreover, the sugar produced by thehydrolysis of raw materials cannot be fermented directly, which affects the yield of alcohol. Also, phenols,aldehydes, acids, and other organic substances produced during pretreatment and hydrolysis may inhibitFermentation and have toxic effects on the biocatalytic host (Tanawut et al. 2020). This results in lowe�ciency and the need to integrate additional removal and recovery processes during Fermentation.

Page 3/23
Sugarcane molasses is a subsidiary product of the sugar industry, containing high concentrations offermentable sugars (sucrose, glucose, and fructose), protein, vitamins, and trace elements that can bedirectly metabolized by microbial Fermentation. Thus, it doesn't require additional operations thatsigni�cantly increase the cost of biosyntheses such as chemical hydrolysis or enzymatic hydrolysis(Dziugan et al. 2013). Saccharomycetes is the biocatalyst of ethanol produced by sugarcane molasses.However, Yeast's optimum fermentative pH is 4.0–4.5 while sugarcane molasses are about 6.2(Wu et al.2020). Therefore, a large amount of sulfuric acid should be added to reduce the acidity when diluting.After the acidi�cation and clari�cation treatment, the fermentation speed will be slower withoutclari�cation. Moreover, the addition of a large amount of sulfuric acid also increases the production costof molasses ethanol.
Lactic acid bacteria (LAB) are facultative anaerobic gram-positive bacterium that produces lactic acid asthe primary end-product of carbohydrate fermentation. It can tolerate high acidity and highconcentrations of alcohol (Davis et al. 1988; Britz and Tracey 1990; Edwards and Jensen, 1992; Gold etal. 1992; G-Alegría et al. 2004; Takashi et al. 2016). Some lactic acid bacteria strains, such asLactobacillus mucosae, Lactobacillus amylovorus, Pedioccus parvulus, Lactobacillus crispatus, andWeissella, which can survive and grow in 3 to 4% butanol, were found (Liu et al. 2012). Leuconostocmesenteroides was added to wine fermentation agents to enhance the �avor of alcohol. The strain wasobserved to be growing well under a condition of 12% alcohol content and pH 3.4 (Yao et al. 2011). Theseresults indicated that LAB could adapt well to the alcohol environment and resist higher alcohol content.Among LAB, lactobacilli display the highest alcohol tolerance.
Lactobacillus casei, one species of lactobacilli that has been widely used in the food industry overdecades, grows well in carbohydrate-rich environments and converts diverse substrates to organic acidsethanol. It is characterized by strong abilities of carbohydrate metabolism (Koryszewska-Bagińska et al.2019) and a wide range of substrate utilization such as monosaccharides, disaccharides, variousoligosaccharides, and polysaccharides. It has been proved that Lactobacillus casei isolated from plantmaterials and the human gastrointestinal tract can utilize pentose and some penta- and hexasaccharides(Cai et al. 2007; Suzuki et al. 2020). Lactobacillus casei can metabolize and synthesize ethanol throughthe Embden Meyerhof Parnas (EMP) pathway, and some strains can also produce ethanol throughheterogeneous fermentation Entner-Doudoroff (ED) pathways. The study by London et al. con�rmed thatL. casei could produce carbonose-5-phosphate through the intermediate product ribonose-5-phosphate inthe pentose phosphate pathway. The acetophosphate, formed by pyruvate kinase catalysis of carbonose-5-phosphate and pyruvate, is converted to ethanol by acetyl-transacetylation and dehydrogenation(London and Chace 1979). More importantly, L. casei boasts of several relatively simple metabolismpathways (Xin et al. 2018) and genetic advantages, including the availability of genome sequences,genome-scale metabolic models and methods for integration of foreign DNA (Blanco-Míguez et al. 2019;Welker et al. 2015; McAuliffe et al. 2019). These attributes suggest that Lactobacillus casei has a highpotential to be a biocatalyst in ethanol production.

Page 4/23
The growth and metabolism of strains are affected by many factors such as carbon, nitrogen,temperature, pH, and oxygen (Meng et al. 2019). The dilution of the natural substrate is directly related tothe concentration of each component of the medium. Excessive concentration of the natural substrateleads to high concentrations of carbohydrates, which will increase osmotic pressure that changes ordestroys the abilities of strains to transport and metabolic each component (Bubnová et al. 2014). Inenvironments with different oxygen content, since the metabolic pathways of strains change, aerobic andanaerobic Fermentation will affect types and yields of products (Dittrich et al. 2005; Wushke et al. 2017;Matsuoka and Kurata 2017). L. casei synthesizes various organic acids such as pyruvate, lactic acid,acetic acid, and succinic acid to metabolize carbohydrates to produce ethanol (Vinay-Lara et al. 2016).Fermentation progresses, organic acids that can increase the acidity of fermentation liquid graduallyaccumulate. The dramatic change in pH will affect the carbohydrate metabolism of strains because highacidity will cause metabolic-related components on the cell membrane, such as channel proteins,transport proteins, and signal pathway proteins, to lose their normal function (Virgilio et al. 2017).
According to the preliminary results, L. casei is an aerotolerant strain that can grow under aerobic andanaerobic conditions. Its optimum fermentation temperature is 37°C. The optimum pH values in all-purpose tween (APT) medium (Difco™ BD), de Man, Rogosa, and Sharpe (MRS) medium, and strawhydrolysate were 6.0 (Vinay-Lara et al. 2016). According to the comparative genomics analysis ofmetabolic pathways of L. casei 12A, it was found that L. casei 12A has a strong ability to metabolizecarbohydrates as well as convert them into bioethanol (Wang et al. 2015). L. casei EI was engineered toproduce ethanol instead of lactate as its major end-product from carbohydrates (Vinay-Lara et al. 2016).
To explore the effects of environmental factors on the metabolism of L. casei EI, the impact of differentconcentrations of sugarcane molasses solution on the living cell number, and the carbohydratesutilization and product synthesis abilities of the strain under different conditions were analyzed throughthe determination of the types and yields of carbohydrates in sugarcane molasses fermentation liquidusing the high-performance liquid chromatography (HPLC) system. Quantitative real-time PCR (RT-qPCR)was used to analyze the expression level of the key enzyme genes of carbohydrate metabolism andinvestigate the effect of pH change on the strain's carbohydrate metabolism. This paper aims to lendtheoretical and technical support for the industrial production of molasses ethanol.
Materials And Methods
Preparation of sugarcane molasses solutionThe fresh sugarcane molasses, whose initial liquid concentration is 80 °Bx, was diluted to 40 °Bx, 30 °Bx,20 °Bx, 10 °Bx, 7.5 °Bx, and 5 °Bx, respectively, using deionized water. To ensure su�cient nitrogensources in the fermentation solution, 5 g/L of yeast extract, 5 g/L of peptone, and 10 g/L of beef extractwere added to various molasses concentrations according to the MRS basic medium formula. Then thepH value was adjusted to 6.0.
Page 5/23
Construction of L. casei E1The engineered L. casei E1, a derivative of wild strain L. casei 12A (GenBank: CP006690.1) lacking ldh1,was constructed using the procedure described by Broadbent et al. (2003). Brie�y, a synthetic productionof ethanol (PET) cassette encoding the Zymomonas mobilis pyruvate decarboxylase (PDC) and alcoholdehydrogenase (ADHII) genes under the control of the native L. casei 12A phosphoglycerate mutase(pgm) promoter (L. casei 12A Δldh1::Ppgm-PET) was assembled and codon-optimized using Java CodonAdaptation Tool and inserted into the 12A ldh1 locus (Vinay-Lara et al. 2016).
Detection of carbohydrate metabolic characteristicsThe utilization of carbohydrates and production of metabolic end-products were detected by the HPLCsystem, including Waters Alliance 2695 Spectrometer, Waters 2414 Refractive Index Detector (RID), andAminex HPX-87H (300mm × 7.8 mm ID, 9μm, Bio-Rad Labors) chromatographic separation column under5-mmol/L sulfuric acid solution of the mobile phase, 30°C of column temperature, and 0.6 mL/min of�ow rate.
Culture of L. casei E1The working culture of L. casei E1 was prepared from a frozen stock using two sequential transfers (0.1%inoculum) that the strain incubated in MRS medium statically at 37°C for 24 h and cultured in 10 °Bx ofsugarcane molasses solution at 37°C for 30 h. Then the bacterial liquid was transferred into differentconcentrations of sugarcane molasses solutions, respectively, with the initial concentration of 107
CFU/mL. The strain's living cell number was determined at 0, 8, 12, 24, 30, 36, 48, and 60 h on MRS solidmedium.
Effects of oxygen on ethanol productionThe strain was cultured in two bioreactors with the same molasses solution under anaerobic (20 psi,CO2/N2) and aerobic conditions, respectively, at 33°C for 72 h. The liquid fermentation samples weredetermined at 0, 4, 8, 12, 16, 24, 30, 36, 48, and 72 h by High-Performance Liquid Chromatography(HPLC).
Effects of pH on growth and metabolismOne of the fermenters' pH value was controlled by the Bioreactor control system pumping in 6 mol/L ofNaOH and 6 mol/L of HCl. The pH electrode recorded the acidity of the unregulated fermentation broth.The fermentation broth was collected at 0, 4, 8, 12, 16, 24, 30, 36, 48, and 60 h for further analysis.
Page 6/23
Effects of pH on expression of key enzyme genes of carbon source metabolism during transformation
The absolute gene expressions of glucokinase (GK, EC 2.7.1.2), invertase (INV, EC 3.2.1.26), andphosphofructokinase (PFK, EC 2.7.1.56) were detected through the real-time �uorescence quantitativePCR (RT-PCR) during Fermentation. The primers utilized in this study have been described in Table 1.Working cultures were prepared from the frozen storage of liquid nitrogen. DNA was extracted using theEzup column, a bacterial genomic DNA extraction kit (SK8255). Purpose genes were recovered using acolumnar DNA adhesive recovery kit (SK8131 Sangon). Connected products were transformed using theone-step rapid receptor cell preparation kit (SK9307 Sangon). The plasmid DNA was extracted using theSanPrep column plasmid DNA small amount extraction kit (SK8191 Sangon), and the RT-PCR detectionwas operated using ABI SybrGreen PCR Master Mix (2 ×) kit.
Operational formula
Statistical analysesAll experiments were performed at least three independent times and values are expressed as mean ±standard deviation (SD). In order to compute the relative fold changes in gene expression of the studiedgenes, datas were analysed using the comparative 2−ΔΔCt method was used (Livak andSchmittgen 2001).
Results
Effects of molasses concentration on the growth of thestrainAs shown in Fig 1, the growth curves of L. casei E1 in different concentrations of cane molasses are verysimilar among the four low concentrations of 5 °Bx, 7.5 °Bx, 10 °Bx, and 20 °Bx. After about 30 h of

Page 7/23
Fermentation, the colony number reached the maximum value of 1011 CFU/mL, and the growth rate wassigni�cantly higher than those in the other two high concentration mediums (30 °Bx and 40 °Bx).Although the maximum number of living cells in 30 °Bx is 1011 CFU/mL, the strain's slow growth resultedin needing 48 h to achieve this. Meanwhile, the strain did not grow until 48 h at 40 °Bx.
Effects of molasses concentration on the metabolism ofstrainIt can be seen from Fig 2 that strain E1 �rst metabolized glucose and fructose and then sucrose; thehigher the concentration of molasses, the later the sucrose metabolism started. As shown in Fig 2 (a, b),at concentrations of 5 °Bx and 7.5 °Bx, the strain consumed glucose and fructose in about 16 h whilesucrose metabolism began at 12 h. Comparing the two concentrations, the sucrose consumption of thestrain was faster at 5 °Bx, which accelerated at 16 h and slowed down after 36 h. The total sugars'utilization rate was 75.2% in 5 °Bx molasses fermented for 72 h (Tab 1). While in 7.5 °Bx, sucroseconsumption slowed down from 16 h to 28 h and accelerated after 28 h (Fig 2a, b). In 10 °Bx molasses,sucrose consumption was very low at 48 h. In 20 °Bx, only partial glucose and fructose were consumed,and little sucrose was metabolized (Fig 2c, d).
The ethanol production of the strain started earlier in 5 °Bx and 7.5 °Bx of low concentrated molasses. Asshown in Fig 3 (a, b), the strain began producing ethanol from 4 h in 5 °Bx and 7.5 °Bx molasses whileethanol was produced at 12 h and 16 h in 10 °Bx and 20 °Bx molasses, respectively. The ethanolproduction rate and yield in 5 °Bx and 7.5 °Bx mediums were similar in that the ethanol concentrationcould reach about 13 g/L after 72 h; it was higher than 20 °Bx molasses in which the yield just reached 7g/L (Tab 2). The highest ethanol yield was up to 38% (w/w%) in 7.5 °Bx medium (Tab 1).
With the increase of molasses concentration, the ratio of ethanol to lactic acid production decreasedgradually. The ratio of ethanol to lactic acid in the 5 °Bx fermentation broth was 2.0 (mmol/L: mmol/L)(Tab 1), the maximum of the four concentrations. In the 20 °Bx molasses, the ratio was less than 1.0 (Tab1), and a considerable number of carbohydrates were converted into lactic acid by the strain (Tab 1 andFig 3d).
Effects of oxygen on the ethanol productionAs shown in Fig 4, strain E1 could not synthesize ethanol under aerobic conditions; instead, a smallamount of lactic acid was produced. Most of the carbohydrates were used to support the growth of cells.In the anaerobic environment, the strain was in a good growth state, and high ethanol content wasobtained in the end product of carbon source metabolism.
Effects of pH on the ethanol production
Page 8/23
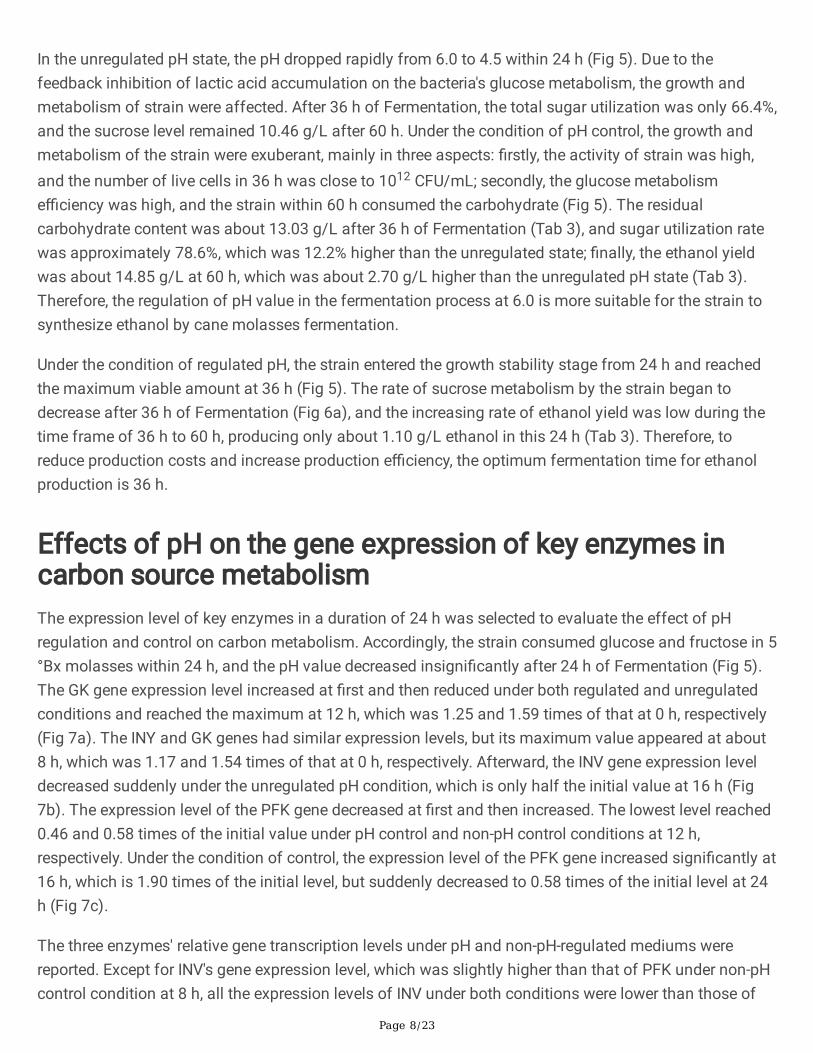
In the unregulated pH state, the pH dropped rapidly from 6.0 to 4.5 within 24 h (Fig 5). Due to thefeedback inhibition of lactic acid accumulation on the bacteria's glucose metabolism, the growth andmetabolism of strain were affected. After 36 h of Fermentation, the total sugar utilization was only 66.4%,and the sucrose level remained 10.46 g/L after 60 h. Under the condition of pH control, the growth andmetabolism of the strain were exuberant, mainly in three aspects: �rstly, the activity of strain was high,and the number of live cells in 36 h was close to 1012 CFU/mL; secondly, the glucose metabolisme�ciency was high, and the strain within 60 h consumed the carbohydrate (Fig 5). The residualcarbohydrate content was about 13.03 g/L after 36 h of Fermentation (Tab 3), and sugar utilization ratewas approximately 78.6%, which was 12.2% higher than the unregulated state; �nally, the ethanol yieldwas about 14.85 g/L at 60 h, which was about 2.70 g/L higher than the unregulated pH state (Tab 3).Therefore, the regulation of pH value in the fermentation process at 6.0 is more suitable for the strain tosynthesize ethanol by cane molasses fermentation.
Under the condition of regulated pH, the strain entered the growth stability stage from 24 h and reachedthe maximum viable amount at 36 h (Fig 5). The rate of sucrose metabolism by the strain began todecrease after 36 h of Fermentation (Fig 6a), and the increasing rate of ethanol yield was low during thetime frame of 36 h to 60 h, producing only about 1.10 g/L ethanol in this 24 h (Tab 3). Therefore, toreduce production costs and increase production e�ciency, the optimum fermentation time for ethanolproduction is 36 h.
Effects of pH on the gene expression of key enzymes incarbon source metabolismThe expression level of key enzymes in a duration of 24 h was selected to evaluate the effect of pHregulation and control on carbon metabolism. Accordingly, the strain consumed glucose and fructose in 5°Bx molasses within 24 h, and the pH value decreased insigni�cantly after 24 h of Fermentation (Fig 5).The GK gene expression level increased at �rst and then reduced under both regulated and unregulatedconditions and reached the maximum at 12 h, which was 1.25 and 1.59 times of that at 0 h, respectively(Fig 7a). The INY and GK genes had similar expression levels, but its maximum value appeared at about8 h, which was 1.17 and 1.54 times of that at 0 h, respectively. Afterward, the INV gene expression leveldecreased suddenly under the unregulated pH condition, which is only half the initial value at 16 h (Fig7b). The expression level of the PFK gene decreased at �rst and then increased. The lowest level reached0.46 and 0.58 times of the initial value under pH control and non-pH control conditions at 12 h,respectively. Under the condition of control, the expression level of the PFK gene increased signi�cantly at16 h, which is 1.90 times of the initial level, but suddenly decreased to 0.58 times of the initial level at 24h (Fig 7c).
The three enzymes' relative gene transcription levels under pH and non-pH-regulated mediums werereported. Except for INV's gene expression level, which was slightly higher than that of PFK under non-pHcontrol condition at 8 h, all the expression levels of INV under both conditions were lower than those of
Page 9/23
GK and PFK within 24 h (Fig 8). This veri�es that the strain has a metabolism sequence of the threesugars at the molecular level, which is the preferential use of glucose and fructose. All the GK geneexpression levels were higher than those of INV and PFK under the condition of non-pH control (Fig 8).Though the expression levels of GK at 12 h and 24 h of non-pH control fermentation were higher thanthose regulated by pH, the difference between the two fold lines in Fig 7a is small, indicating that theeffect of the pH change on the GK expression is not signi�cant. The expression levels of the PFK geneunder pH control was signi�cantly higher than those of non-pH control at 4 h, 8 h, 12 h, and 16 h, whichwere 1.69, 1.84, 1.32, and 3.37 times of non-pH control, respectively, indicating a signi�cant drop in pHinhibited the PFK gene expression.
Discussion
Effects of molasses concentration on the growth andmetabolism of the strainAs the main component of molasses was sugar, molasses' concentration is directly related to the contentof carbohydrates in the medium, the higher its concentration, the higher the osmotic pressure of theextracellular environment to cells. The increase in osmotic pressure would lead to the deterioration of theintracellular microenvironment. It can affect the growth and metabolism of the strain, causing thedehydration and inactivation of protein, which hinder cell cycle and inhibit cell growth (Radmaneshfar etal. 2013). Some studies have found that, with the increase of osmotic stress, the cell will actively regulateosmosis that causes intracellular water out�ow, shrinking of cells, and even death (Djelal et al. 2017).Microorganisms would increase energy for maintaining the stability of the intracellular microenvironment(enhancing intracellular stress response and tolerance pathway). These change the metabolic networkand regulatory pathways of cells, inhibit the fermentation rate, and change product accumulation (Xu2010). It was found that the cell growth and pyruvate accumulation rate were inhibited by the increase inosmotic pressure in the pyruvate production (Kamzolova and Morgunov 2016). In arabitol production,when the osmotic pressure was increased, the product's yield would signi�cantly decrease (Koganti et al.2011). Therefore, combined with the results of growth and metabolism, four low concentrations ofmolasses, 5 °Bx, 7.5 °Bx, 10 °Bx, and 20 °Bx, were chosen to investigate the metabolism characteristics ofthe strain in molasses.
The utilization rate of carbohydrates in different molasses concentrations is also used as an index toselect the optimal concentration medium. The results showed that there are enough carbohydrates in the5 °Bx medium to ferment the strain. Moreover, the lower the concentration of substrate residual sugar, thehigher the fermentation e�ciency.
In conclusion, it is feasible to use the engineered strain L. casei E1 to produce ethanol with molasses assubstrate conclusion of comparative genomics is veri�ed (Wang et al. 2015). As the carbohydratesutilization rate and the ethanol production yield in 5 °Bx molasses are the highest, 5 °Bx is the optimumconcentration of molasses for ethanol fermentation.

Page 10/23
The sequence of carbohydrate metabolism of the strainThe metabolization of carbohydrates by strain E1 is in sequence by inference. This characteristic ofstrain was showed in all the four low concentrations molasses fermentation (Fig 2), and con�rmed by thegene expression results (Fig 7). Agbogbo et al. (2006) used Pichia pastoris (P. stipitis CBS6054) toferment a mixed medium of glucose and xylose. It was found that the consumption rate of glucose washigher than that of xylose. This indicated that there is a priority order in carbohydrate metabolism ofmicroorganisms.
Effects of oxygen on the ethanol productionLactobacillus casei is an aerobic anaerobe like other lactic acid bacteria. Under aerobic conditions, cellsproliferated in large amounts and produced lactic acid (Maresca et al. 2019). Reactive Oxygen Species(ROS), present in the environment or metabolized by the strain, can seriously threaten the strain's survival.Some LAB can be subjected to aerobic growth, with a consequent change in the LAB's physiologicalmetabolism, including the reduction of biomass and the change of fermentation product types. ROS candestroy cellular proteins, lipids, and nucleic acids, causing cell aging and death. Therefore, anaerobicculture is the optimum culture condition for ethanol production by the strain.
Effects of pH on the ethanol productionBased on the results of acidity control of fermentation broth, it was found that a change in pH has asigni�cant effect on the growth and metabolism of the strain. This is mainly because fermentation'sorganic acid will enter the cytoplasm in the form of diffusion and release proton H+ after dissociation,subsequently reducing the intracellular environment's pH value. The continuous acidi�cation of theintracellular environment destroys DNA structures, the denaturation of proteins, and enzymes'inactivation. Moreover, changes in pH cause the channel proteins, transporters, and signaling pathwayproteins on the membrane to lose their normal function that maintains cell-selective permeability,disturbing the balance of sodium-potassium ions inside and outside cells. Ultimately, the physiologicalactivities being affected results in low production e�ciency and poor product quality. In the study ofsuccinic acid production by E. coli, with the accumulation of succinic acid, the biomass was graduallyreduced, and the vitality of the somatic cells was steadily decreased. If the succinic acid is removed intime, the yield of succinic acid can be increased by more than 60% (Andersson et al. 2010). Roa et al.(2011) found that the lower the pH value, the lesser the yield of fumaric acid in the Fermentation ofRhizopus oryzae (Roa Engel et al. 2011).
Effects of pH on the gene expression of key enzymes incarbon source metabolism

Page 11/23
Multiple metabolic pathways and enzymes regulate the growth and metabolism of bacterial cells. Underdifferent pH conditions, the strain's ability to metabolize a speci�c sugar is affected by the activity of keyenzymes and the strain's growth. The amount of enzyme gene expression indicates the demand for thisenzyme by the metabolism of the strain. Therefore, the expression level of key enzyme genes inmetabolism can re�ect the metabolic level of bacteria to a certain extent.
The metabolism of carbohydrates by the strain mainly depends on the catalysis of metabolic-relatedenzymes. Comparative genomic analysis results revealed that the wild-type strain L. casei 12A coulddegrade nine sugars in cells (Wang et al. 2015). The strain �rst used glucokinase (GK, EC 2.7.1.2) todegrade glucose to 6-phosphate glucose, which is the common intermediate product and intersection ofvarious metabolic pathways, including glycolysis (EMP pathway), pentose phosphate pathway, andglycogen synthesis and decomposition pathway. Therefore, GK is one of the key enzymes for glucosemetabolism. Second, the strain could use phosphofructokinase (PFK, EC 2.7.1.56) to convert fructose to1, 6-fructose diphosphate (FDP) and then facilitate its entrance into the glycolysis pathway. PFK is one ofthe key enzymes in fructose metabolism. Third, the strain hydrolyzed sucrose to glucose and fructoseusing invertase (INV, EC 3.2.1.26). INV is one of the key enzymes for the metabolism of sucrose. Twoconditions of pH control and non-pH control were designed to detect three key enzymes' expressionlevels. This enabled us to investigate the effect of pH control on carbon source metabolism.
An in-depth analysis of the three enzymes' gene expression characteristics under two conditions showedthat, on the one hand, the expression levels of three enzyme genes in the fermentation broth withregulated pH were almost more signi�cant than those under the non-pH control state. The amountindicates that the increase in acidity inhibits the synthesis of critical metabolic enzymes (Fig 7). Thegenes' high expression levels suggested that the number of sugar molecules transported into the cell islarge, which is bene�cial to cells' rapid activation of metabolic function. Therefore, Fermentation in themedium with a constant pH of 6.0 is more conducive to the metabolism of the three sugars by the strain;on the other hand, the trend of the gene expression in the two conditions is very similar, indicating that thechange in pH does not change the trend of enzyme gene expression.
In conclusion, this present study proves that L. casei, as a potential tool, can be used for bio-ethanolproduction due to its good tolerance of lower alcohols (Elena, 2015). Through the characteristic analysisof cell growth and metabolism, L. casei EI can metabolize sucrose, glucose, and fructose of molassesand synthesize ethanol. In practice, the engineered L. casei E1 was grown in different fermentationconditions subjected to the effects of cane molasses concentrations, oxygen, and pH on ethanolproduction. The genetic strain E1 showed good growth and quick sugar fermentation and yielded highethanol in cane molasses. By fermenting this bacterium anaerobically at 37°C for 36 h incubation in 5°BX molasses when the fermenter's pH was controlled at 6.0, ethanol yield reached 13.77 g/L, andcarbohydrate utilization percentage was 78.60%.
The expression differences from the GK, INV, and PFK genes between pH-control and non-pH controlconditions were detected using RT-qPCR. It could be seen that the genetic strain E1 under pH control
Page 12/23
preferentially fermented glucose and fructose of molasses to ethanol. The non-pH control did not affectthe three enzymes' gene expression trends, but an elevated acidity would signi�cantly inhibit thegenetically modi�ed strain E1 from metabolizing fructose to ethanol.
Declarations
Author ContributionSW, and BL conceived the study and designed the project. RT and BL conducted experiments. HW, JL andCL analyzed the data and drafted the manuscript. ML and SEE helped to revise the manuscript. Allauthors contributed to the article and approved the submitted version.
FundingThis study was funded by the National Natural Science Youth Foundation of China (No. 31801518), the“Young Talents” Project of Northeast Agricultural University (18QC52), the Natural Science Foundation ofHeilongjiang Province (YQ2020C013) and the Academic Backbone Plan of Northeast AgriculturalUniversity (No. 19YJXG10).
AcknowledgmentWe thank James Steele’s Lab, Department of Food Science, University of Wisconsin-
Madison (Madison, WI, USA) for providing L. casei E1 used for this study. And we also thank ourindustrial partner, Shandong Yuwang Ecological Food Industry Co., Ltd. (Dezhou, Shandong, China), forsupply of the sugarcane malasses.
Con�ict of InterestThe authors declare that they have no con�ict of interest.
Ethical approvalThis article does not contain any studies with animals performed by any of the authors.
Informed consentInformed consent was obtained from all individual participants included in the study.
Page 13/23
Data Availability StatementsThe authors declare that all the data supporting the �ndings of this study are available within the article.
References1. Agbogbo KF, Coward-Kelly G, Torry-Smith M, Wenger KS (2006) Fermentation of glucose/xylose
mixtures using Pichia stipitis. Process Biochem 41:2333-2336. doi: 10.1016/j.procbio.2006.05.004
2. Andersson C, Petrova E, Berglund K, Rova U (2010) Maintaining high anaerobic succinic acidproductivity by product removal. Bioproc Biosyst Eng 33:711-718. doi: 10.1007/s00449-009-0393-y
3. Baki AS, Bande YM, Bello A (2020) Comparative Studies on Bioethanol Production from CassavaPeels using Saccromyces Cerevisae and Zymomonas Mobilis. Open Access J Biomed Eng Biosci3:373-378. doi: 10.32474/OAJBEB.2020.03.000174
4. Blanco-Míguez A, Fdez-Riverola F, Sánchez B, Lourenço A (2019) Resources and tools for the high-throughput, multi-omic study of intestinal microbiota. Brief Bioinform 20:1032-1056. doi:10.1093/bib/bbx156
5. Britz TJ, Tracey RP (1990) The combination effect of pH, SO2, ethanol and temperature on the growthof Leuconostoc oenos. J Bacteriol 68:23-31. doi: 10.1111/j.1365-2672.1990.tb02544.x
�. Bubnová M, Zemančíková J, Sychrová H (2014) Osmotolerant yeast species differ in basicphysiological parameters and in tolerance of non-osmotic stresses. Yeast 31:309-21. doi:10.1002/yea.3024
7. Cai H, Rodríguez BT, Zhang W, Broadbent JR, Steele JL (2007) Genotypic and phenotypiccharacterization of Lactobacillus casei strains isolated from different ecological niches suggestsfrequent recombination and niche speci�city. Microbiology 153:2655-2665. doi:10.1099/mic.0.2007/006452-0
�. Davis CR, Wibowo D, Fleet GH, Lee TH (1988) Properties of wine lactic acid bacteria: their potentialenological signi�cance. Am J Enol Viticult 39(2):137-142. doi: 10.1007/BF01042707
9. Dittrich CR, Vadali RV, Bennett GN, San KY (2005) Redistribution of metabolic �uxes in the centralaerobic metabolic pathway of E. coli mutant strains with deletion of the ackA-pta and poxBpathways for the synthesis of isoamyl acetate. Biotechnol Prog 21:627-31. doi: 10.1021/bp049730r
10. Djelal H, Chniti S, Jemni M, Weill A, Sayed W, Amrane A (2017) Identi�cation of strain isolated fromdates (Phœnix dactylifera L.) for enhancing very high gravity ethanol production. Environ Sci Pollut R24:9886–9894. doi: 10.1007/s11356-016-8018-x
11. Dziugan P, Balcerek M, Pielech-Przybylska K, Patelski P (2013) Evaluation of the fermentation of highgravity thick sugar beet juice worts for e�cient bioethanol production. Biotechnol Biofuels 6:158. doi: 10.1186/1754-6834-6-158
12. Edwards CG, Jensen KA (1992) Occurrence and characterization of lactic acid bacteria fromWashington State wines: Pediococcus spp.. Am J Enol Viticult 43:233-238. doi: 10.1097/00008390-
Page 14/23
199205000-00010
13. G-Alegría E, López I, Ruiz JI, Sáenz J, Fernández E, Zarazagaet M, Dizyal M, Torres C, Ruiz-Larrea F(2004) High tolerance of wild Lactobacillus plantarum and Oenococcus oeni strains to lyophilisationand stress environmental conditions of acid pH and ethanol. FEMS Microbiol Lett 230:53-61. doi:10.1016/S0378-1097(03)00854-1
14. Gold RS, Meagher MM, Hutkins R, Conway T (1992) Ethanol tolerance and carbohydrate metabolismin Lactobacilli. J Ind Microbiol Biot 10:45-54. doi: 10.1007/BF01583633
15. Kamzolova SV, Morgunov IG (2016) Biosynthesis of pyruvic acid from glucose by Blastobotrysadeninivorans. Appl Microbiol Biot 100:7689–7697. doi: 10.1007/s00253-016-7618-1
1�. Koganti S, Kuo TM, Kurtzman CP, Smith N, Ju L (2011) Production of arabitol from glycerol: strainscreening and study of factors affecting production yield. Appl Microbiol Biot 90:257-267. doi:10.1007/s00253-010-3015-3
17. Koryszewska-Bagińska A, Gawor J, Nowak A, Grynberg M, Aleksandrzak-Piekarczyk T (2019)Comparative genomics and functional analysis of a highly adhesive dairy Lactobacillusparacasei subsp. paracasei IBB3423 strain. Appl Microbiol Biotechnol 103:7617–7634. doi:10.1007/s00253-019-10010-1
1�. Liu S, Bischoff KM, Leathers TD, Qureshi N, Rich JO, Hughes SR (2012) Adaptation of lactic acidbacteria to butanol. Biocatal Agric Biotechnol 1:57-61. doi: 10.1016/j.bcab.2011.08.008
19. Livak KJ, Schmittgen TD (2001) Analysis of relative gene expression data using real-timequantitative PCR and the 2−ΔΔCt method. Methods 25:402–408. doi: 10.1006/meth.2001.1262
20. London J, Chace NM (1979) Pentitol metabolism in Lactobacillus casei. J Bacteriol 140:949-954.doi: 10.1128/JB.140.3.949-954.1979
21. Maresca D, Filippis FD, Robertiello A, Mauriello G (2019) Metabolic Pro�ling and Cold-StarvationStress Response of Oxygen-Tolerant Lactobacillus gasseri Strains Cultured in Batch Bioreactor.Microorganisms 7:200. doi: 10.3390/microorganisms7070200
22. Matsuoka Y, Kurata H (2017) Modeling and simulation of the redox regulation of the metabolismin Escherichia coli at different oxygen concentrations. Biotechnol Biofuels 10:183. doi:10.1186/s13068-017-0867-0
23. McAuliffe O, Kilcawley K, Stefanovic E (2019) Symposium review: Genomic investigations of �avorformation by dairy microbiota. J Dairy Sci 102:909-922. doi: 10.3168/jds.2018-15385
24. Meng Q, Yang W, Men M, Bello A, Xu X, Xu B, Deng L, Jiang X, Sheng S, Wu X, Han Y, Zhu H (2019)Microbial Community Succession and Response to Environmental Variables During Cow Manure andCorn Straw Composting. Front Microbiol 10:529. doi: 10.3389/fmicb.2019.00529
25. Radmaneshfar E, Kaloriti D, Gustin CM, Gow NAR, Brown AJP, Grebogi C, Romano MC, Thiel M (2013)From START to FINISH: The in�uence of osmotic stress on the cell Cycle. Plos One 8:e68067. doi:10.1371/journal.pone.0068067

Page 15/23
2�. Roa Engel CA, van Gulik WM, Marang L, van der Wielen, Straathof AJJ (2011) Development of a lowpH fermentation strategy for fumaric acid production by Rhizopusoryzae. Enzyme Microb Tech48:39-47 doi: 10.1016/j.enzmictec.2010.09.001
27. Suzuki S, Fujita K, Maeno S, Shiwa Y, Kajikawa A (2020) PCR-based screening, isolation, and partialcharacterization of motile lactobacilli from various animal feces. BMC Microbiol 20:142. doi:10.1186/s12866-020-01830-7
2�. Takashi K, Sarengaole, Hajime T, Bon K (2016) Alcohol-brewing properties of acid- and bile-tolerantyeasts co-cultured with lactic acid bacteria isolated from traditional handmade domestic dairyproducts from Inner Mongolia. LWT-Food Sci Technol 65(1):62-69. doi: 10.1016/j.lwt.2015.07.065
29. Tanawut N, Poonsuk P, Chonticha L, Supalak S, Pongsak N (2020) Bioconversion of oil palm trunkresidues hydrolyzed by rnzymes from newly isolated fungi and use for ethanol and acetic acidproduction under two-stage and simultaneous fermentation. Waste and Biomass Valori 11:1333–1347. doi: 10.1007/s12649-019-00678-x
30. Vinay‐Lara E, Wang S, Bai L, Phrommao E, Broadbent JR, Steele JL (2016) Lactobacillus casei as abiocatalyst for biofuel production. J Ind Microbiol Biotechnol 43:1205-1213. doi: 10.1007/s10295-016-1797-8
31. Virgilio S, Cupertino FB, Ambrosio DL, Bertolini MC (2017) Regulation of the reserve carbohydratemetabolism by alkaline pH and calcium in Neurospora crassa reveals a possible crossregulation ofboth signaling pathways. BMC Genomics 18:457. doi: 10.1186/s12864-017-3832-1
32. Wang S, LiangG HZ, Jia CF, Zhang BL (2015) Comparative genomics analysis of carbon metabolismof Lactobacillus casei 12A. Microbiol China 42: 315-324. doi: 10.13344/j.microbiol.china.140756
33. Welker DL, Hughes JoE, Steele JL, Broadbent JR (2015) High e�ciency electrotransformation ofLactobacillus casei. FEMS Microbiol Lett 362(2):1-6. doi: 10.1093/femsle/fnu033
34. Wu R, Chen D, Cao S, Lu Z, Huang J, Lu Q, Chen Y, Chen X, Guan N, Wei Y and Huang R (2020)Enhanced ethanol production from sugarcane molasses by industrially engineered Saccharomycescerevisiaevia replacement of the PHO4 gene. RSC Adv 10:2267-2276. doi: 10.1039/C9RA08673K
35. Wushke S, Spicer V, Zhang XL, Fristensky B, Krokhin OV, Levin DB, Cicek N, Sparling R (2017)Understanding aerobic/anaerobic metabolism in Caldibacillus debilis through a comparison withmodel organisms. Syst Appl Microbiol 40:245-253. doi: 10.1016/j.syapm.2017.03.004
3�. Xu S (2010) Analysis of the Physiological Mechanisms of Osmotic Stress Tolerance in TorulopsisGlabrata. Doctoral dissertation of Jiangnan University.
37. Xin Y, Guo T, Mu Y, Kong J (2018) Coupling the recombineering to Cre-lox system enables simpli�edlarge-scale genome deletion in Lactobacillus casei. Microb Cell Fact 17:21. doi: 10.1186/s12934-018-0872-4
3�. Yao Y, Lv Z, Lin X, Ren M, Zhang B (2011) Application of Leuconostoc mesenteroides subsp.dextranicum in the production of cider. China Brew 227:48-51. doi: 10.3969/j.issn.0254-5071.2011.02.014

Page 16/23
TablesTable 1
Carbohydrate utilization ratio and ethanol production ratio in low concentrations of molasses for 72 hConcentrations Carbohydrate utilization ratio (w/w%) Ethanol production
ratio (w/w%)
Ethanol: Lactate
(mmol/L:mmol/L)
5°BX 75.2 35.8 2.0
7.5°BX 56.5 38.0 1.8
10°BX 38.6 35.7 1.7
20°BX 25.6 24.6 0.6
Table 2Carbohydrate metabolism in four low concentrations of cane molasses
Concentrations of fermentation broth
5°BX 7.5°BX 10°BX 20°BX
0h 72h 0h 72h 0h 72h 0h 72h
34.52 ±0.26
11.03 ±0.41
42.41 ±1.35
24.68 ±0.33
56.79 ±1.04
47.92 ±0.48
74.18 ±0.89
71.85 ±1.13
3.57 ±0.04
0.02 ±0.01
4.67 ±0.07
0.34 ±0.12
6.50 ±0.32
0.74 ±0.05
19.26 ±0.22
7.16 ±0.08
9.37 ±0.51
0.73 ±0.02
12.64 ±0.03
0.93 ±0.05
17.69 ±0.62
1.10 ±0.04
31.58 ±0.09
13.99 ±0.21
0.57 ±0.03
1.59 ±0.11
0.69 ±0.03
0.70 ±0.04
0.94 ±0.41
0.99 ±0.02
17.86 ±0.15
12.73 ±0.17
0.47 ±0.02
10.04 ±0.19
0.55 ±0.01
11.30 ±0.11
0.13 ±0.03
9.96 ±0.10
11.70 ±0.01
21.63 ±0.07
0.00 12.76 ±0.27
0.00 12.83 ±0.30
0.00 11.13 ±0.06
0.00 7.87 ±0.01

Page 17/23
Table 3Effect of pH on carbohydrate metabolism
Time (h) Residual carbohydrate content (g/L) Ethanol yield (g/L)
pH control non-pH control pH control non-pH control
0 60.83±0.79 61.42±0.29 0 0
36 13.03±0.52 20.63±0.06 13.77±0.24 10.62±0.17
60 0 10.46±0.15 14.85±0.08 12.15±0.35
Figures
Figure 1
See the Supplemental Files section for the complete �gure caption

Page 18/23
Figure 2
See the Supplemental Files section for the complete �gure caption

Page 19/23
Figure 3
See the Supplemental Files section for the complete �gure caption
Figure 4
See the Supplemental Files section for the complete �gure caption

Page 20/23
Figure 5
See the Supplemental Files section for the complete �gure caption
Figure 6
See the Supplemental Files section for the complete �gure caption

Page 21/23
Figure 7
See the Supplemental Files section for the complete �gure caption

Page 22/23
Figure 8
See the Supplemental Files section for the complete �gure caption
Supplementary Files
This is a list of supplementary �les associated with this preprint. Click to download.

Page 23/23
GraphicalAbstracts.tif
FigureCaptions.docx