Energy intake and productivity of Guatemalan sugarcane cutters
21
Jouma! of Development Economics 9 (1981) 251 271. North-Holland Publishing Company ENERGY INTAKE AND PRODUCTIVITY OF GUATEMALIIV SUGARCANE CUTTERS An Empirical Test of the Effkiency Wage Hypothesis Part I Maarten D.C. IMMINK Cornell i?‘niwrsily, Ithaca. N Y 14853. US.4 Fernando E. VITERI lnstirute OJ ~Vutririon of Tentral Amerir’o and Panumu, G~tu/emala Received April 1980, final version received November 1980 This study represents an empirical test of the productivity consumption relation of the eflicienq uage hypothesis. which is briefly discussed here. The research setting and design of the study :lre described. An energy supplementation program was generally egeetive in raising the daily energy intake and energy expenditure levels of Guatemalan sugarcane workers who were moderately energy deticient. Increased energy availabihty did not result in increased energy expenditure at work. or in an increased supply of work units. The results do not provide evidence of a strcq productive-energy intake relationship among thtse workers. 1. The effkiency wage hypothesis This paper is organized in two parts, and reports on the results of an empirical test of the productivity-consumption relatron which constitute&. a crucial part of the elliciency wage hypothesis. The elficiency wage hypothesis was first formulated by Leibenstein (15 58. 1957a. 1957b) as part of his theory of underemployment in rural areas of developing countries. Rodgers (1975) used the efficiency wage argument to explain why there may exist a long-run constant real wage, which is above the minimum subsistence wage, in rural labor markets with pools of uremployed workers. In their extensive theoretical discussions of the efftciency wage theory, Sriglitz (1976) and Mirrlees (1976) reached the snme conclusion as Rodgers, and the first two authors went on to discuss the ramnifications of the theory m terms c-f rural distribution of income, the effect of increases in rural population on agricultural output, shadow prices of rural and urban labor, and the allocation of resources in the rural sector. A thorough review of the theory as it now star& may be found in Bliss and Stern (1978b). These authors concentrated 1~. *>f their discussion on the 0304-3878/81/0~/$02,75 a 1981 North-Holland
-
Upload
independent -
Category
Documents
-
view
3 -
download
0
Transcript of Energy intake and productivity of Guatemalan sugarcane cutters
Jouma! of Development Economics 9 (1981) 251 271. North-Holland Publishing Company
ENERGY INTAKE AND PRODUCTIVITY OF GUATEMALIIV SUGARCANE CUTTERS
An Empirical Test of the Effkiency Wage Hypothesis
Part I
Maarten D.C. IMMINK
Cornell i?‘niwrsily, Ithaca. N Y 14853. US.4
Fernando E. VITERI
lnstirute OJ ~Vutririon of Tentral Amerir’o and Panumu, G~tu/emala
Received April 1980, final version received November 1980
This study represents an empirical test of the productivity consumption relation of the eflicienq uage hypothesis. which is briefly discussed here. The research setting and design of the study :lre described. An energy supplementation program was generally egeetive in raising the daily energy intake and energy expenditure levels of Guatemalan sugarcane workers who were moderately energy deticient. Increased energy availabihty did not result in increased energy expenditure at work. or in an increased supply of work units. The results do not provide evidence of a strcq productive-energy intake relationship among thtse workers.
1. The effkiency wage hypothesis
This paper is organized in two parts, and reports on the results of an empirical test of the productivity-consumption relatron which constitute&. a crucial part of the elliciency wage hypothesis.
The elficiency wage hypothesis was first formulated by Leibenstein (15 58. 1957a. 1957b) as part of his theory of underemployment in rural areas of developing countries. Rodgers (1975) used the efficiency wage argument to explain why there may exist a long-run constant real wage, which is above the minimum subsistence wage, in rural labor markets with pools of uremployed workers. In their extensive theoretical discussions of the efftciency wage theory, Sriglitz (1976) and Mirrlees (1976) reached the snme conclusion as Rodgers, and the first two authors went on to discuss the ramnifications of the theory m terms c-f rural distribution of income, the effect of increases in rural population on agricultural output, shadow prices of rural and urban labor, and the allocation of resources in the rural sector. A thorough review of the theory as it now star& may be found in Bliss and Stern (1978b). These authors concentrated 1~. *>f their discussion on the
0304-3878/81/0~/$02,75 a 1981 North-Holland
productivity-consumption relation which 5 th\: more relsvailt part of the
theory for our purposes. The postuIa.ted productivity-consumption relation s:a!cs that the
productive services a worker supplies per unit of time is a function of his level of food intake. The sup& of productive services (p) is expressed in terms of work units (or ‘efficiency hours’), which are quantifiable and standardized work tasks. Wages are assumed to be the only source of income, and all income is assumed to be spent on focd for the worker. For our purposes, we k:.:mslate food intake into energy intake as Leibenstein (1957b) originally did. Thus; the productivity-consumption relation may be expressed as p-f(e), where e stands for energy intake. A certz.in level of daily energy inta::e (eb) is required to cover basal metabolic energy equirements, i.:., to maintain basic life functions. A daily energy intake level which exceeds eb provides energy to be spent in activity. In terms of a simple energy balance equation: energy expenditure in activity (activity energy) equals total energy intake minus basal metabol.ic energy requirements, assuming zero changes in body energy stores. Basal energy requirements in adults will vary with age, state of health, and body size aud composition, as well as with environmental conditions.
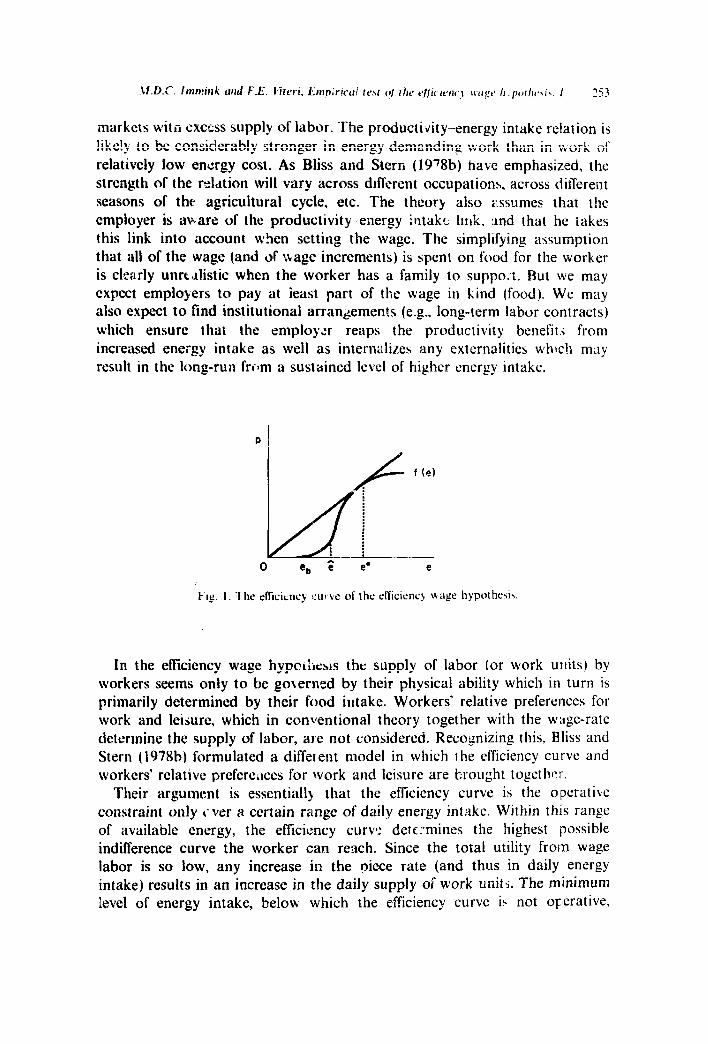
The function f(e), or ‘etficiency curve’ [Stiglitz (1976)], is postulated to start in the origin with a horizontal segment equal to 0- eb (fig. 1). Increasing productivity ieturns are assumed over a certain range of energy intake cc-cr and 3 Sr ve e b.l At some point (2) diminishing productivity returns will set in with flIrther increases in energy intake.
Employers of rural workers are assumed to maximize net revenues [or rer.; in the two factor model for the plantation farm discussed by Stiglitz (1976)-J. Net revenues are maximized when the average wage cost per unit of work equals the marginal cost of a work unit. The employer will offer a time wage which minimizes the average wage cost per work unit. At this real wage (e*), called ‘efficiency wage’, *he ‘level of output and the required number of manhours are known. In a competitive labor market with excess supply af labor, the real wage rate will not fall below the efficiency wage, since a lower time wage would raise the average wage cost per work unit and thus reduce the employers’ net revenues. A real wage rate above the efficiency wage would prevail in a competitive labor market with excess demand for labor.
The productivity-consumption relation is crucial to the efficiency wage theory. If the relation is pen-existent or very weak, then there is no reasou why employers would offer to pay the ci’ficiency wage whenever the supply price of labor is below the efficiercy wag{;. In other words, the theory would fail as an explanation of why we would tibserve a constant real wage in rural labor
‘In Leibenstein’s formulation of the model, the wage el::.sticity of productivity wus postulated to exceed unity. Stiglitz (1976) acknowledges that some of his theoretical results critically depend on the existence of an initial region of increasing returns.
markets wit,: excess supply of labor. The productivity-energy intake relation is likely to be considerably stronger in energy-demandinp work than in work of relatively low energy cost. As Bliss and Stern (1978b) have emphasized, the strength of the reMon will vary across dlfferent occupations, across diiferent seasons of the agricultural cycle. etc. The theory also assumes that the employer is aware of the productivity-energy intak% Imk. :md that he takes this link into account wfien setting the wage. The simplifying assumption that all of the wage (and of vVage increments) is spent on food for the worker is clearly unrcdistic when the worker has a family to support. But we may expect employers to pay at ieast part of the wage in kind (food). We may also expect to find institutional arrangements (e.g., long-term labor contracts) which ensure that the employa reaps the productivity benefit.< from increased energy intake as well as internalizes any externalities which may result in the &g-run from a sustained level of higher energy intake.
f (et
0 eb 5 e’ e
In the efficiency wage hypolhcbls tht: supply of labor (or work units) by workers seems only to be gokerned by their physical ability which in turn is primarily determined by their food intake. Workers’ relative preferences for work and leisure, which in conventional theory together with the wxg-rate determine the supply of labor, are not considered. Recognizing this, B’liss and Stern (197Sb) formulated a different model in which the efficiency curve and workers’ relative prefereirces for work and ieisure are brought togethl-:r.
Their argument is esscntiaH> that the efficiency curve is the operative constraint only over a certain range of daily energy intake. Within this range of available energy, the efEciency curv!: determines the highest possible indifference curve the worker can reach. Since the total utility from wage labor is so low, any increase in the oicce rate (and thus in daily energy intake) results in an increase in the daily supply of work units. The minimum Bevel of energy intake, below which the efficiency curve is not oprative,
t:xceeds nevertheless the basal metabolic energy requirement (e,).’ At some relatively high level of daily energy intake, the daily supply curve of work units becomes u priori indeterminate. At this point the worker’s map of leisure versus wage labor and the piece-rate determine his supply of work units, without the availability of energy placing any further constraint on the maximization of utility by the worker. We can thus expect private employers to provide productive wage increases, up to the point where daily energy intake has reached the level where the efficiency curve stops being operative. This point will presumbly increase with the energy cost of the work tasks.
Another issue which has been raised in the literature on the efficiency wage hypothesis specifically deals with the time pattern of the productivity effect o’ increased energy intake. Leibenstein (1958) .,tated that the fu;l impact of :I productive wage increase (i.e., an increase in daily energy intake) on productivity may not be observed until after some ‘conditioning period’. During this period the additional energy and nutrient intake go towards improving the nutritional ,tatus of the workers. Within the context of the present study, this may mean that part or all of the increase in energy intake is stored in the body tissue. The workers maintain energy balance once energy stores have reached ‘normal’ levels, and the higher energy intake results in ;Ln increase in the daily supply of work units. A different pattern of a delayed productivity effect has also been suggested, whereby workers rely 0.1 accumulated energy stores to maintain or increase their daily productivity. Oshima (1967) postulated that during the slack periods of the I 2ricul:ural cycle rural workers in Asia are in positive energy balance [i.e., accumulate energy stores) in preparation for the peak seasons when their daily energy expenditure levels are likely to exceed their energy intake levels.
In order to test empirically the productivity--consum?tion relation of the efficiency wage hypothesis, we undertook a longitudinal study in Guatemala with sugarcane workers, residents of a large p1antation.j One group of wr,rkers received a high energy supplement for an extended period of time, while a second group received an identical supplement, but with a negligible caloric content. Deficient energy intake has been identified as a serious nuTritiona problem in rural areas of Guatemala [Viteri and Torun (1975). IhCAP!‘CDC ( 1972)].
The study setting and design are described in the following section. The impact of the energy supplementation program on the daily energy intake
“t-or energy intake levels between eb am the point at which the efficiency curve bxomes operative, the utility from wage luh~r is so iow that the worker chooses not to enter the labor mar cct.
“A review of previously reported empirical results relevant to the efficiency wage hypothesis may be found in Bliss and Stern (1978al and in Immink (1978). The evidence appears rather inconclusive. and the designs of those studies do not usually lend themselve? to a rigorous test 05 ,he hypothesis.
and energy expenditure levels of the workers is examined next. The first part of the paper finishes with a simple analysis of the impact of increased energy availability on various indicators of productivity. Additional tests of the productivity-consumption relaclon are provided in the second part of the paper, by cross-sectionall;.~ estimating ths efficiency curve and testmg time- series models. The issue of delayed prodlictivity efftcts from increased energy intake is also briefly explored.
2.
(malts) constituted the subjects of the study. These workers permanently resided in two small. $mtation communities located in the coastal Iowlarlds or Guatemala. A po,3ulation ct:nsus which we undertook in August 197.5 provided an estimate of the rota! population of both communities of 1.338 persons. There were 227 households and the median household size was 5 persons. Nearly half of the population \r;as under 15 years of age. Of the persons 15 years and older, 62.6 I’,, repor!ed to be illiterate and 71.7”,, had no formal s&Doling. The population was predominantly classified as ‘Idim (or westernized). By means oi‘ household income and expenditure surveys we estimated the median household income in 1.974 to be U.S. S550;year (range: $297?$2.336), and the median per capita income at i1.S. $126/year (range: $X)-$549). These estimates do not include certain incomz in kind. Wage earnings Cram emplo>!ment at the plantation typically consti:uted 90 percent of total household monetary incomc. None of the resident households ounncd or leased laqd for food pr oducrion. Data obtained by means of dietary surveys showed that 43 percent of the households met less than 90 percent of their total daily energy requirement.
The principal work activity of the adult males in both communities was sugarcane harvesting. The sugarcane harvesting season normally starts in the middle of November and continues until June--July of the following year. For sugarcane harvesting the workers organized themselves in teams of 4 (‘cucrdrilltr’). The workers cut the cane and loaded it on a cart. Once the cart was filled, it was hauled away by a tractor to be weighed :it a central weighing station. The total weight ol’ the cane thus delivered by each group was recorded. and a quartel of the total weight credited in the ampany payrolls to each team member.’
‘There existed a natural tendency for workers of equal capacity to team up. Our own observations and measurements confirmed that there virtually existed no intra-team differences in daily output. inter-team differences in daily output did exist. Wur#crs were free to form their teams as they wished at the bcginnin, m of each pa:! period (eteq two weeks). We 13und B high

256 M.D.C. Immink rrnd F.E. Weri. Errlpiricrrl test qj f/w yfliciertcy wtge hypotltesis. I.
Workers were free to start and stop work at any time. Normally, they began working in the field around 6:OOa.m. and would finish between 12:00 noon and 4:OOp.m. The norma! work week consisted of six days; however. during peak periods the wlorkers worked on Sundays as well. During the off- harvest season the workers were assigned such tasks as weeding with a machete, cane planting, soil fertilization, fumigation, and road repair work. Work availability was usually restricted during this period. The workers worked in the field under the direction of field supervisors (‘~qora!‘), who each supervised 25-30 wol:kers.
The workers were paid a piece-rate during the harvest season per ton of cane delivered (cut and loaded). Cane delivered on Sundays and on paid holidays was remrrneratcd at twice the regular piece-rate. Workers earned a seventh day pay if the\; had worked at least six days during the week. In addition. the workers received part of their wages in kind. For each day worked the workers rej;eived a food ration (2 pounds of maize and half a pound of black beans). Other non-monetary wage components included rent- free housing on the pipntation, free medical care at the plantation’s clinic, free primary education for school-age children, and interest-free loans. Workers could also purc’lase certain staple foods and milk from the company at below market prices.
Employment conditions closely approximated those assumed by the efficiency wage hypothesis. Workers were engaged in energy-demanding tasks, and were paid a v’age per unit of work. Further wage incentives existed to reduce absenteeism. Though not legally enforceable, de ,fbcto a long-term labor contract existed because of the high proportion of the total wage paid in kind. According to Guatemalan law, permanent workers who are laid off must be paid a cash lump sum which increases with years of service. .This prclvides a disincentive to employers to lay off long-term employees.5
The experimental design of the study called for a treatment (=high energy supplement) grIdup and a control (=low energy supplement) group. Because of strong withr.n-community interaction among workers, both at work and in af’ier-work acrivities, it was decided riot to assign the workers at random to e:ther group. Workers from one cQm:nunity were designated the high energy
degree of stability in the composition of tear IS @f highly prodllcti le workers, whereas teams of Icss productive workers tended to change thr.r composition much more frequently.
‘Fifty-nine percent of the workers were born in the plantation community where they :vcre living at the time of the study.
supplement (or HES) group and the workers from the second commur,ity the low energy supplement (or LES) group. The non-random assignment of the workers to either group admittedly weakened the Internal validit!/ of the research design. The most serious confounding &ect, for which the experimental design may not have provided an adequate control, uas due to the fact that both groups may not equally have been affected by specific events over time.’ This confounding effect may prove to be a powerful rival hypothesis.
After the initial data collection, an energy supplementation program wa; started in April 1974. The same data measurements obtained during the pre- supplementation period were performed during the supplementation period. The supplementation program ran continuously for 26 months. The results reported here cover the first i5 months.
The program provided two supplements at no charge to the worker>. Both supplements consisted of a bottled. orange-flavored, soft drink. The high energy supplement contained approximately 350kcals~bc~ttle. exclusively supplied from sucrose. The low energy supplement was identical in appearance, contained a low caloric synthetic sweetener and provided approximately 15kcalsibottle.’ The supplementation experiment was conducted in a double blind manner. The supplements were normally distributed twice a day, Monday through Friday, and once on Saturday, or eleven Limes a week. Averaged over a 7-day period, the high energy supplement supplied approximately 550kcals. a day when the supplement was consistently consumed.
Both supplements enjoyed from the beginning a high degree of acceptability by the qvorkers. who at all times consumed the supplements under the direct supervision of the project staff. A daily control register of supplement consumption by individual workers was cdrt;fully mair.tained.
“This confounding eikct is due (0 an interaction between sekwiotl and history, where the former refers (0 a diITerenGa1 recruitment of workers makirag v p the two groups, and the Ialter to specific extraneous ercnts whsh occl r over time [Campbell and Stanley (1966)]. Other
confounding c&c& may also be due lo reprccssion. rjturururion, and interactions bettieen sclecrior~
and ntarurcrtion, and sr/ecfion and trstbg. 4 regresswl e!Tect may be present when groups are initially chown based 01; extreme values on one or more attributes, so that over time on repeated measurements cl12 sample mean(s) will regress towards the population mean(s). The
nraruration efizc?_r&rs to certain intra-indi Glual processes which are a natural function of time, such as glowing older. A resting effect is present when the outcome of a second mea~uremrnt IS influenced by virtue of having made the first measurement. The pre-supplement;~tion &la suggest that the selection. regression and IIIUIIWO~~O~I effects were absent in the present study JS
any differences in group means of daily productivlly and of dally intake. as well as I:I mean age and the age disrributlon, were statistically not significant (WC lablc 2). We also cstim;lt< that under the conditions of the study any interaction et%% belwccn \t.lf,(,liott and ~~UI~IYU~W ;md between s&cricm and testing e*en if they were present, did not ~.ou~ly confound the interpretation of the results.
‘Both supplements also contained 3.7 mg of vitamin A (equivalent as br-carotene) and 16 m&z of vitamin C. The only distinguishable feature was the color of the bottle car.

The purpose of the program was explained to the workers as a means of determining whether the supplements would reduce their tiredness at the end oi the day, and would generally make them feel better. The workers participated in the program on a voluntary basis, and without remuneration of any kind. They were continuously encouraged to express doubts and misgivings.
7 3 Dutu collection procedures _._ .
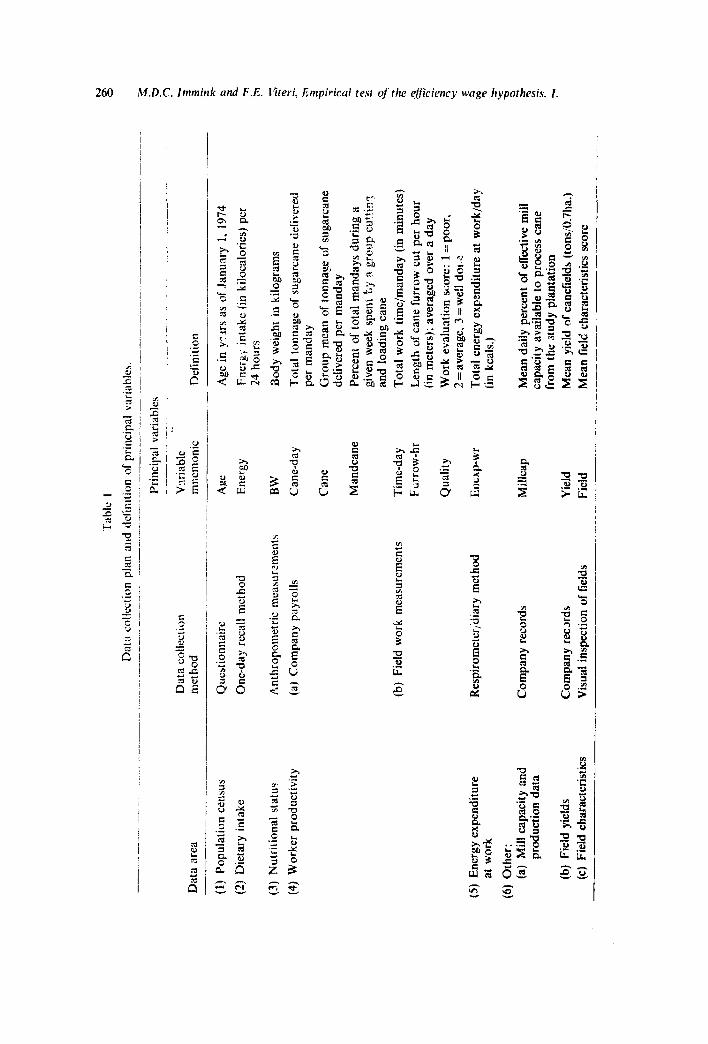
A population census was taken once a year in each community. The one- dd). recall method was used to obtain the dietary intake of the workers as well as of their households. Quantities of each food consumed were estimated by weighing equivalent quantities during the interview. With the use of a food composition tab16 [INCAP (1960)] estimates of total daily energy intake were obtained. Of the anthropotnetric measurements which were pelriodically taken of the workers. body weight is of greatest interest here.
Company payrolls were relied upon for data on daily work output and type of work performed. Payroll data were retrospectively available to the start of the 1?72/1973 harvest season (November 1972). No attempt was made to validate the dasa contained in the Company payrolls. Daily records of total time spent in different activities at work were obtained for small subsamples of workers by specially trained assistants, who also took measurements of the length of cane furrow cut at different intervals of the work period. The work performance of the workers was also evaluated by lhese assistants, as being eilher ‘well done’, ‘average’ of ‘poorly done’. This was admittedly a subjective rating system, but these assistants, who had previously been employed as sugarcane cutters, used specific criteria to rate the quality of work performed.” The energy cost of different work activities (including resting) was estimated by measuring directly oxygen uptake with a Kofranyi-Michaelis respirometer in subsamples of workers. This technique has been described in detail in Viteri et al. (1971). Multiplying time spent in different activities at work by their corresponding mean energy costs rendered estimates of total energy expenditure at work.
Company records provided data on: (a) the sugar mill’s daily operating capacity. (b) producLon time lost due to mechanical failures, maintenance and repairs, and (c) total tonnage clt‘ cane delivered by independent growers and from the company’s own fields. Average yields of each one of the company’s 63 canefield sections were also obtained from company records
‘These criteria wve: (a) how close to the groand cane stalks had been cut (the closer. the better!. ib) how well the cane sta!ks had been de-lcavcd. and (c) how closely the cut stalks had been heaped together (for easier !oading. and to reduce the number of stalk< that would remain antered in the field)
after each harvest season. The different canefield sections were by no means uniform as regards their physical conditions, and each section was visually surveyed to obtain dala on selected physical features.’
The principal variables to be used in the anaiysis which follows are listed in table 1. For some indicators (daily energy intake, energy expenditure at work, body composition) point estimates were obtained during selected months of the supplementation period. Fclr other indicators (daily work output. supplement intake) time series data were obtamed. These were converted into point estimates by calculating mean values over defined time intervals. For most data. the pre-supplementation phase effectively covered :I three-month period.
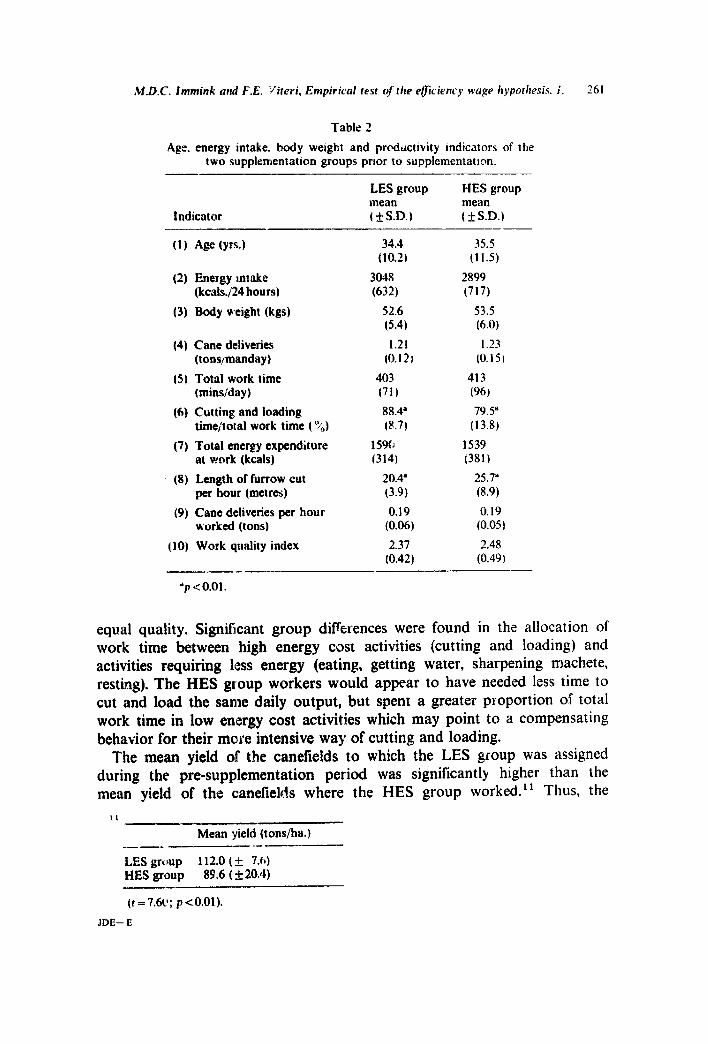
The two groups were g;nerally well matched prior to supplementation, as can be seen in table 2 where we present some key variables as matching attributes. There was no significant difference between the two groups in mean age. mean daily energy intake and mean body weight. The HES group exhibited a wider range in age. and also tended to be somewhrtt more energy deficient.”
The workers generally had a lean appearance and reduced energy stores: 45 percent of the LES group workers. and 32 percent of the HES group workers weighed in at 8.5 percent or less of their reference weight. using standards for healthy adult males found in Jelliffe (1966). The absence of energy reserves meant that the level of energy expenditure heavily depended
on the cu-rent level of energy intake, and that sudden increases in energy demand could not be sustained for any length of time.
The group of sugarcane cutters of this study demon:,trated a low level of daily productivity in comparison with productivity levels reported for sugarcane cutters in such developing countries as Jamaica [Heymood (197413, Colombia [Spurr et al. (1977)], Tanzania [Davies (1973)] and Rhodesia [Morrison and Blake (1974)].
Prior to supplementation the two p “roups performed the same number of work units per manday. worked the same number of hours ti day. expended the same amount of energy at work. and were rated to perform work of
“A field char;cteristss XO~C wab c~:abli\hcd Lir c:& cancliold hard upon the folli>uing
physical fe;~tures: (a) elevation, (h) terrain gradient and topography. IC) soil type. ;snd (do cane variety planted. By means of a regresslon analysis ditTerent weights were t.-tablished To-* each physical feature in such a way that the lower the field characteristics score. the more conJucivtz
the conditions in the canefield were to high productivity. Elevation and cane variety rlanted turned out to have the highest weights. For more details on the construction of this index. me lmmink (197X).
“Tile range in age distribution was 17 73 yeais for th,- HES group. and 21 55 years for the LES group (median 32 years in both group%). Fifiy-two percent of the I-ES group vmrkcrs. and 09 percent of the HES group workers did not meet their p<timated daily energy requircmcnl.
Tab
le
1 !z
Dat
a co
llect
ion
plan
an
d de
fini
tion
of p
rinc
ipal
va
riab
les.
--
~~
___.
-_.-
____
^-.
-. _
--.-
--
_... -
_-
..-. -
.-..-
.. --
- .
-.--
.___
_--.
____
_ ._
_-._
__--
.._
-.-.
--.
----
---_
_~.
_~__
__.
*a
Dat
a co
llcc~
ion
Dat
a ar
ea
met
hod
.-
-~--
--~
-___
_~_.
__
__.._
_.__
__..
(1)
Popu
latio
n ce
nsus
Q
uest
ionn
aire
(2)
Die
tary
in
take
O
ne-d
ay
reca
ll m
etho
d
(3)
Nut
riiio
nal
stat
u?
Ant
hrop
omet
ric
mea
sure
men
ts
(4)
Wor
ker
prod
uctiv
ity
(a)
Com
pany
pa
yrol
ls
(b)
Fiel
d w
ork
mea
sure
men
ts
(5)
Ene
rgy
expe
nditu
re
at w
ork
Res
piro
met
crl’
diar
y m
etho
d
(6)
Oth
er:
(a)
Mill
cap
acity
an
d pr
oduc
tion
data
C
ompa
ny
reco
rds
(b)
Fiel
d yi
elds
(c)
Fiel
d ch
arac
teri
stic
s C
ompa
ny
reco
rds
Vis
ual
insp
ectio
n of
tie
lds
----
--
Prin
cil~
al
vari
able
s
V:tr
iabl
e m
nem
onic
D
efin
ition
-..
- _.
- _
-._
Ape
A
ge i
n yn
.irs
as o
f Ja
nuar
y 1,
197
4
Ene
rgy
Fner
g,;
inta
ke
(in k
iloca
lori
es)
per
23 h
ours
BW
Can
e-da
y
Can
e
Man
dcan
e
Tim
e-da
y
Fl;r
row
-hr
Qua
lity
Enl
;xp-
wr
2ody
w
eigh
t in
kilo
gram
s
Tot
al
tonn
age
of s
ugar
cane
de
liver
ed
per
man
day
Gro
up
mea
n of
ton
nage
of
sug
arca
ne
deliv
ered
pe
r m
anda
y
Perc
ent
of t
otal
m
anda
ys
duri
ng
a gi
ven
wee
k sp
ent
ty
3 gr
oup
cutti
n=
and
load
ing
cane
Tot
al
wor
k tim
e/m
anda
y (in
min
utes
)
Len
gth
of c
ane
furr
ow
cut
per
hour
(in
met
ers)
; av
erag
ed
over
a
day
Wor
k ev
alua
tion
scor
e:
1 =
poo
r,
2 =
aver
age,
3
= w
e!l
doi
2
Tot
al
ener
gy
expe
nditu
re
at w
ork/
day
(in k
cals
.)
Mill
cap
Yie
ld
Fiel
d -
Mea
n da
ily
perc
ent
of e
ffec
tive
mill
ca
paci
ty
avai
labl
e to
pro
cess
ca
ne
from
th
e st
udy
plan
tatio
n
Mea
n yi
eld
of c
anef
ield
s (t
ons0
.7ha
.)
Mea
n lie
lti c
hara
cter
istic
s sc
ore
M.D.C. Immink and F.E. Viteri. Empirical lest of he efficiency wage Ityporhesis. i. 261
Table 2
Age. energy intake. body weight and prodtictivity indicators of the two supplementation groups prior to supplementation.
Indicator
LES group mean l +S.D.I
HES group mean ( _+ S.D.)
--
(1)
(2)
(3)
(4)
(5)
(6)
(7)
(8)
(9)
(10)
Age (yrs.1
Energy rntake (kc&J24 hours)
Body weight (kgs)
Cane deliveries (tons!manday)
Total work time (mins/day)
Cutting and loading time/total work time (7;)
Total energy expenditure at work (kcals)
Length of furrow cut per hour (metros)
Cane deliveries per hour worked (tons)
Work quality index
34.4 (10.2)
3048 (632)
52.6 (5.4)
1.21 (0.12J
403 (71)
88.4= (8.7)
35.5 (11.5)
2899 (717)
53.5 (6.0)
1.23 (0.151
413 (96)
79.5” (13.8)
159c; 1539 (314) (381)
20.4’ 25.P (3.9) (8.9)
0.19 0.19 (0.06) (0.05 )
2.37 2.48 (0.42) (0.49)
“p-cO.01.
equal quality. Significant group differences were found in the allocation of work time between high energy cost activities (cutting and loading) and activities requiring less energy (eating, getting water, sharpening machete, resting). The HES group workers would appear to have needed less time to cut and load the same daily output, but spent a greater proportion of total work time in low energy cost activities which may point to a compensating behavior for their more intensive way of cutting and loading.
The mean yield of the canefields to which the LES group was assigned during the pre-supplementation period was significantly higher than the mean yield of the canefields where the HES group worked.” Thus, the
II Mean yield (tons/ha.)
-- --
LES grrbup 112.0 (+ 7.b) HES group 89.6 ( f 20.4)
(t=7.6ca; p-zO.01).
IDE-E
262 M.D C. lrnrnink und F.E. Weri, En@ricul test I$ the clfl;iciency wqr hypofhesix I.
difference in mean length I;f furrow cut per hour may merely reflect compensating behavior in response to tht: yield of the c;mefields, and not a difference in intrinsic ability of the two groups.
Based alpon the key indicators presented here, we may conclude that the two groups were generally well-matched prior to supplementation.
3. The impact of energy supplementation on daily energy intake and energy expenditure levels
Both groups of workers generally tended to be energy deficient before the supplementation program was initiated. Fifty-two percent of the LES grollp workers and 69 percent of the HES group workers did not meet 100 percent or more ,3f their estimated daily energy requirement. We would expect ~1 pr-iori the mean daily energq mtake of the HES group to increase with energy suppiementation.
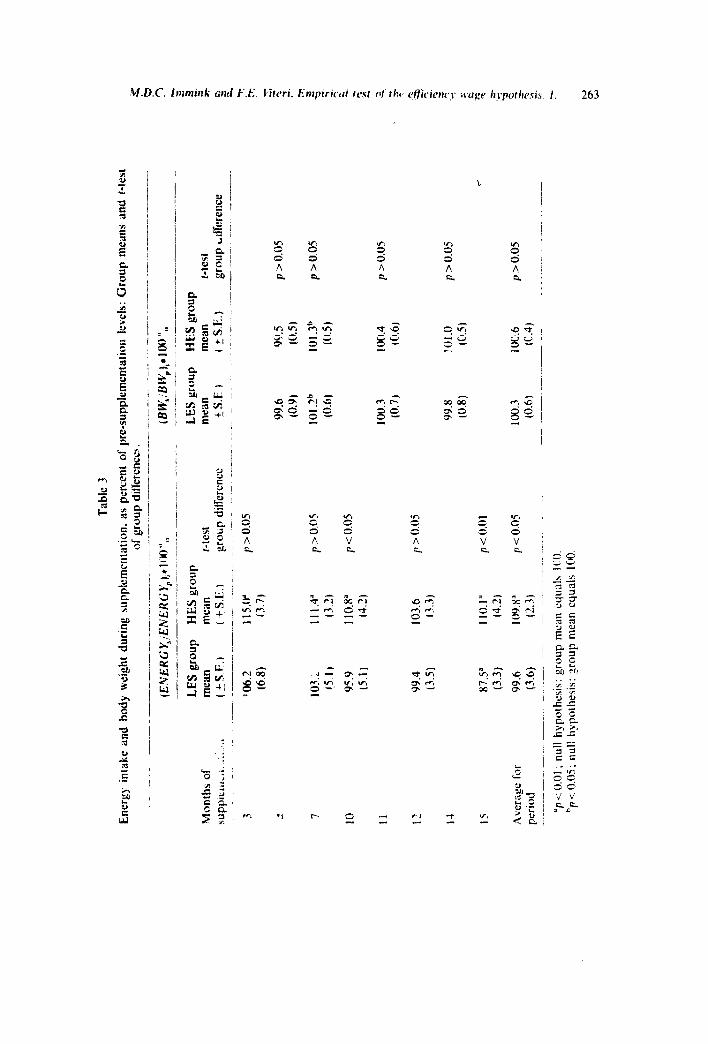
The d,aily energy irrake of each worker during supplementation (ENERGK) was expressed as al percent of his prehsupplementation energy intake (ENERG Y,).’ 2 In this way, each worker served as his own control. The group means of this index during selected supplementatiun months. and for the supplementation period as a whole, are presented in table 3. We performed a t-test oi the difference in group means, and the significance levels are also presented
The HES group demonstrated a significantly higher level of daily entrgy intake during suppletnentation when compared to the pre-supplementation level. This was not true for the LES group. The mean daily energy intake of the LES group during the 1974/1975 harvest season (supplementation months 10, 12 and 15) showed a downward trend suggesting a negative effect of extraneous factors on the dai!? energy intake of the workers. One such factor may have been rising food prices.13 In addition, the supplements themselves may have produced a temporary feeling of fuilness resulting in
“The daily energy intake from the high energy supplement was estimated as follows. The total supplement intake/month was multiplied by 3SOkcals., the caloric content of the supplement. This total was averaged over the number of days of the month. The average daily supplement energy intake was then added. to the daily energy intake at home as estimnted from the dietary survey data. The home energy intakes of’ the LES group wo. kers was taken as the total daily energy intake because of the negligible caloric content of thch supplement. The pre- supplement dietary data did not cover the full sample of workers. In this particular an8’vsis only subsampEes are involved which together cc ever two-thirds of the full sampB:, however.
13We found that on the average 83 percent of total energy intake by the households of the workers was obtained from the consump.ion of maize (56 percent). black berms (16 percent) and sugar (11 percent). Other important sources of energy intake were cooking oil and lard. Between May 1974 and May 1975, the market prices for these food-items paid by these households increased as follows: maize: 6 percent, black beans: 5 percent, sugar: 0 percent (domestic price co,ntrolled). cooking oil: I5 percent, and lard: 32 percent. Ic addition, there are significant seasonal variations in market prices, particularly of maize and black beans.
I j \.
s
E c’ A c.
x V E:
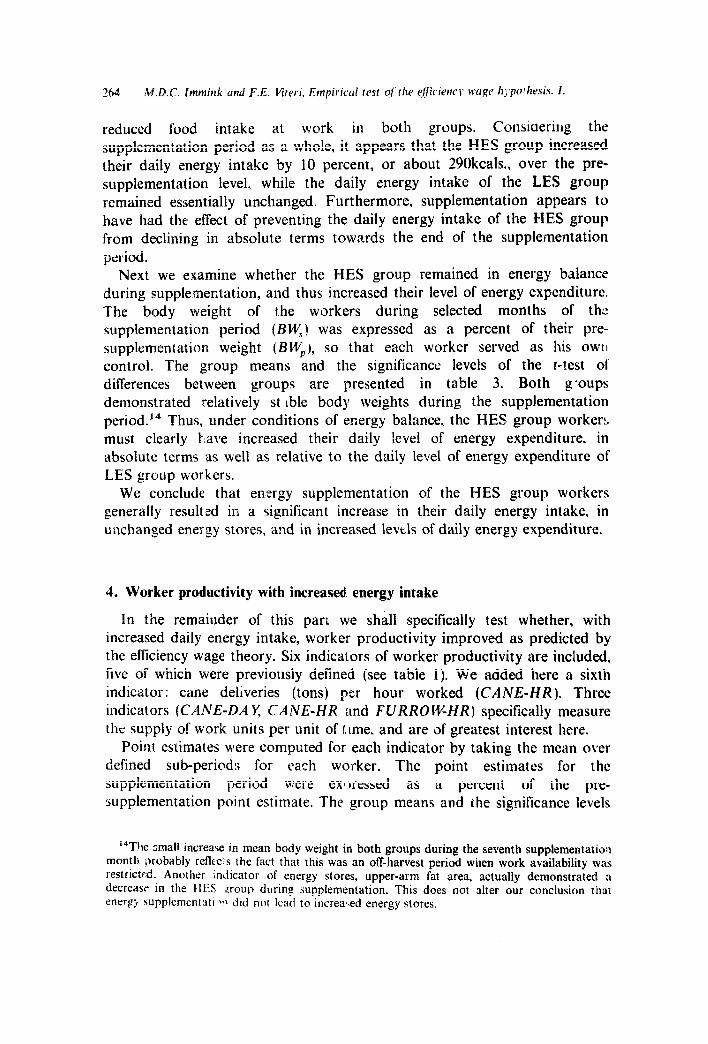
reduced food intake at work in both groups. Consiaering the supplementation period as a whole, it appears that the HES group increased their daily energy intake by 10 percent, or about 29Okcals., over the pre- supplementation level, while the daily energy intake of the LES group remained essentially unchanged. Furthermore, supplementation appears to have had the effect of preventing the daily energy intake of the HES group from declining in absolute terms towards the end of the suppleinentation period.
Next we examine whether the HES group remained in energy balance during supplementation, and thus increased their level of energy expenditure. The body weight of the workers during selected months of th:: supplementation period (BW,) was expressed as a percent of their pre- supplementation weight (BW,), so that each worker served as his OWII control. The group means and the significance levels of the r-test 01 differences between groups are presented in table 3. Both g*oups demonstrated relatively st lble body weights during the supplementation period.14 Thus, under conditions of energy balance, the HES group workers must clearly k.ave increased their daily !evel of energy expenditure, in absolute terms as well as relative to the daily level of energy expenditure of LES group workers.
We conclude that en,:rgy supplementation of the HES group workers generally resulted in a significant increase in their daily energy intake. in unchanged energy stores, and in increased levels of daily energy expenditure.
4. Worker productivity with increased energy intake
In the remainder of this parL we shall specifically test whether, with increased daily energy intake, worker productivity improved as predicted by the elTiciency wage theory. Six indicators of worker productivity are included. five of which were previously defined (see table 1). We added here a sixth indicator: cane deliveries (tons) per hour worked (CANE-HH). Three indicators (CANE-DAY CANE-HR and FURROWHR) specifically measure thu supply of work units per unit of rune, and are of greatest interest here.
Point estimates were computed for each indicator by taking the mean over defined sub-periods for each worker. The point estimates for the supplementation period were exljressed as a percent of the pre- supplementation point estimate. The group means and the significance levels
“The small increase in mean body weight in both groups during the seventh supplementatiotl month probably refkc s the fact that this was an off-harvest period when work availability was restricted. Another indicator of energy stores, upper-arm fat area, actually demonstrated a decrease in the HI3 group during supplementation. This does not alter our conclusion that enerpg supplementxtl,>!l did not lead to increas,ed energy stores.
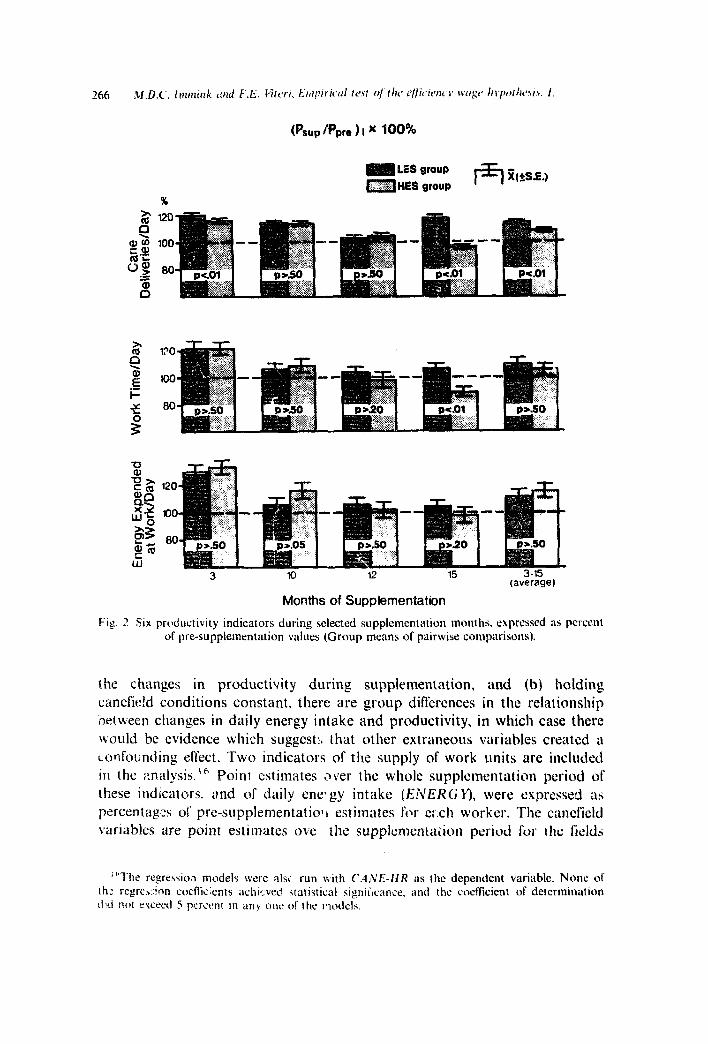
of the t-tests of group differences are presented in fig. 2.” The results may be summarized as foIlows.
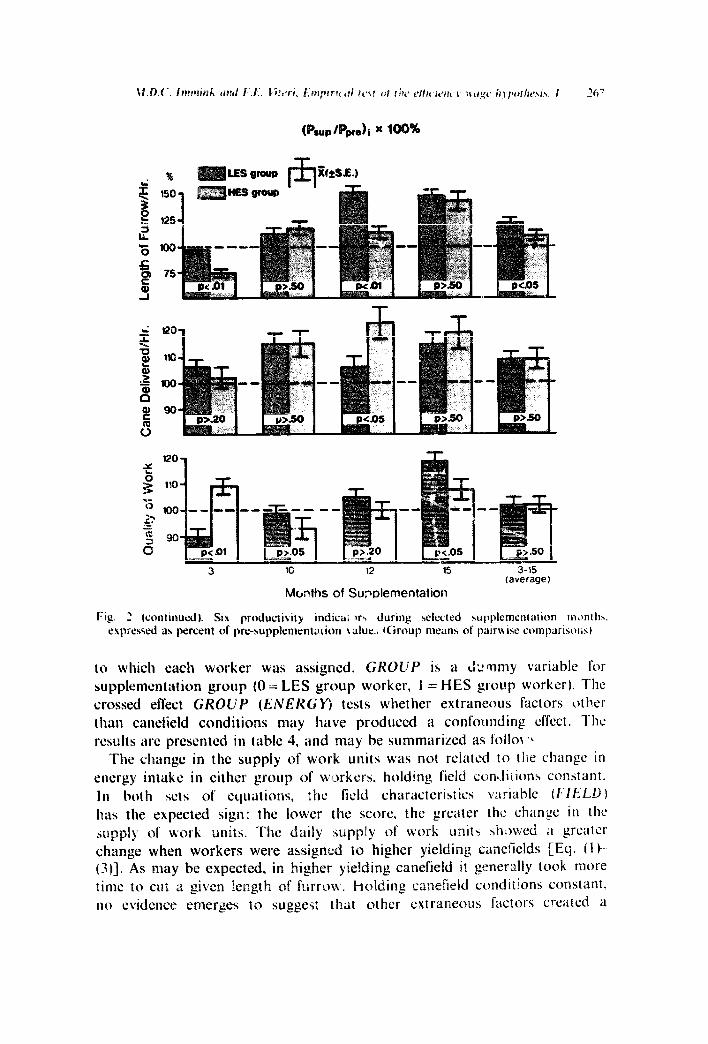
The HES group, when compared to the LES group performance, did not significantly increase their daily supply of work units (CANE-DAY) during supplementation. In fact, for the first and last sub-period. as well as for the supplementation period as a whole, the percent increase was comparatively less for the HES group. There was a positive change in both groups in car;e deliveries per manhour (CANE-HR) dll throughout the supplementation period. But the percent increase in this indicator for the HES group was comparatively higher only during the third supplementation sub-period, showing no consistent and positive effect. The time pattern of the percent change in the length of furrow cut per manhour (FURROW-HR) was qlrite inconsistent with that of the previous two indicators. This suggests that difference extraneous factors affected +hese indicators. The percent change in FURROW-HR was significantly less for the HES group during the first and third sub-period and for the supplementation period as a whole.
Total daily work time (?lME-DA I’) and total energy expenditure at work (ENEXP-WR) increased significantly in both groups after the start of the supplementation program. possibly as a result of psychological (‘HawthornI?‘! effects. Both indicators declined again in both groups to approximate pre- supplementation levels, except for a significant decline in the daily supply labor
help to explain interwc.rkcr mriation in
“The supplementation months indicated in fig. 2 correspond to 1i-x mid-point> ol’ rbc sub-
periods over which point estimates were computed. The third supplementation month refers 10 tl~e second half of the 1973/1974 harvest season, and the remaining months IO mid-point\ (1: xtlb-
pl:riods of the 1974.‘1975 harvest seaion.
IYES $roup
=HES g,oup r-3 FQ~SSP.)
3-15 (average)
Months of Supplementation
Fig. Z Six prclductivity indicators during selected supplementation months. expressed as percent
of pre-supplementation values (Group means of pairwise comparisons).
the changes in productivity during supplementation, and (b) holding canefXd conditions constant, there are group differences in the relationship iktvt.een changes in daily energy intake and productivity, in which case there livould bc evidence which suggest:, [hat other extraneous variables created a corlfounding effect. Two indicators of the supply of work units are included ill the ;:nalysis.” Point estimates aver the whole supplementation period of these indicators. and of daily enelgy intake (ENERGY), were expressed as percentages of pre-supplementatiol1 estimates I’CV ei..ch worker. The canefield variables are point estimates ove the supplcnicntulion period for Ihe fields
“‘The regression models were :~lsc run with CA~VE-HR as tbc dependent variable. None of
th: rcgrekon coefk~ents achi*..vcd statistical sipniilcarxe, ;Ind the coefkient of dctcrmination
dxi not cvcecd 5 pcrctbnt m any one of the nndels.
(Pwp/Ppre)i x 10fMk
3 10 12 15
Months of Su?r3lementation
3-15 (average)
Fig. 2 lcontimwl). Six productivity indica; w+ during selected wpplementation mkmths.
cnprcswd a+. percent of pre-supplementation ~alue.~ rGroup means of pahise compurisous~
to which each worker was assigned. GROUP is a dzqrny variable for
supplementation group (O= LES group worker. I = HES _g~~otrp worker). The crossed effect GROUP (ENERGY) tests whether extraneous factors otl~ than canefield conditions may have produced a confounding effect. The results are presented in table 4. and may he summarized as toHo\ ‘c
The change in the supply of work units was not related to tile change in energy intake in tither group of wcjrkers;, holding field conJitions constant.
In both sets of equations, the field chnractcristics variable (F1EL.U I
has the expected sign: the lower the score, the greater tht: chimzc in the .qJpIy of work units. The daily supply of work units shl,wed .I greater change when workers were assigned to higher yielding cansGelds [Eq. (1 t
(311. As may be expected, in bigher yielding canefield it generally took more time to cut a given length of furrow. holding canefiel conditions constant. no evidence emerges to suggest that other extraneous factors created a
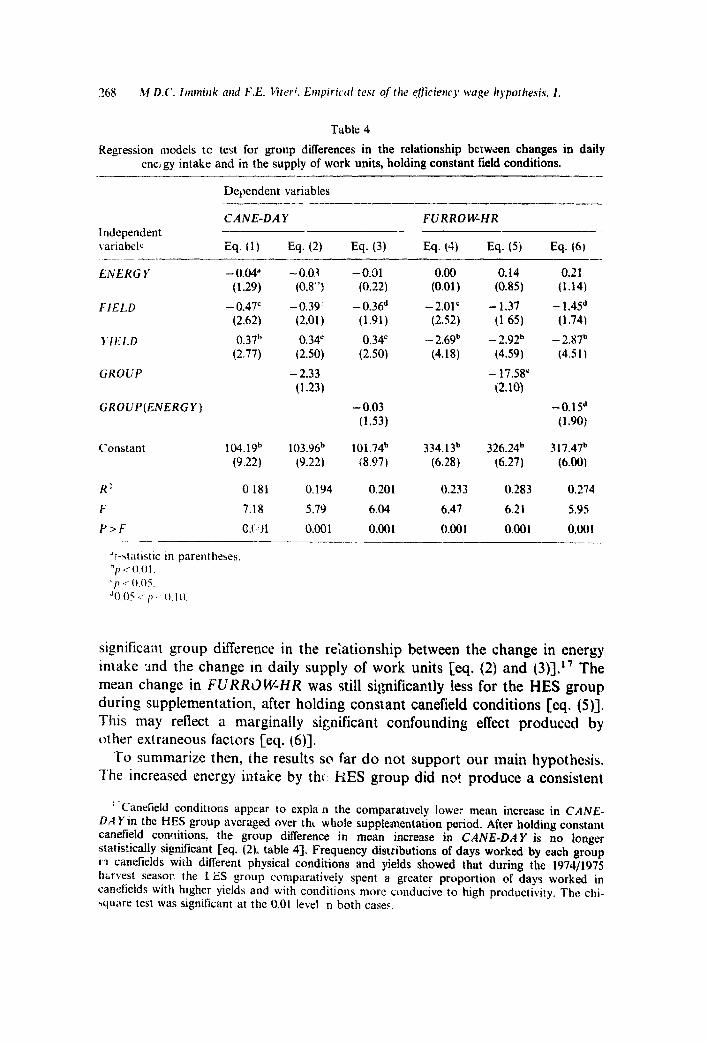
Table 4
Regression models tc test for gronp differences in the relationship between changes in daily ene,gy intake and in the supply of work units, holding constant field conditions.
- ---
Dependent variables - --
CANE-DAY FURROW-HR Independent - _
variabelc %q. (1) Eq. (2) Eq. (3) Eq. 14) Eq. (5) Eq. (6)
ENERGY
FIELD
GROUP
GROUP(ENERGY)
Conslant
R?
F
P>F
- 0.04 (1.29)
- 0.47’ (2.62)
0.37b (2.77)
104.19b 103.96b 101.74b 334.13b 326.24b (9.22) (9.22) (8.97) (6.28) (6.27)
0 181 0.194 0.201 0.233 0.283
7.18 5.79 6.04 6.47 6.21
0.t Jl 0.001 0.001 0.001 0.001
-0.03 (0.8’.‘)
-0.39: (2.01)
0.34’ (2.50)
- 2.33 (1.23)
-0.01 (0.22)
- 0.36d (1.91)
0.34’ (2.50)
- 0.03 (1.53)
-2.01’ (2.52)
- 2.69b (4.18)
0.14 (0.85)
- 1.37 (165)
- 2.92b (4.59)
- 17.58’ (2.10)
0.21 (1.14)
- 1.45d (1.74)
- 2.87b (4.5 1 I
-0.15d (1.90)
317.47b (6.001
0.274
5.95
0.001
“r-statistic in parentheses. h/J ~*-o.(II ‘p < 0.05. ‘10.05~‘,‘. rr.ill.
significaint group difference in the relationship between the change in energy imake and the change m daily supply of work units [eq. (2) and (3)].” The mean change in FURRd WHR was still significantly less for the HES group during supplementation, after holding constant canefield conditions [eq. (S)]. This may reflect a marginally significant confounding effect produced by other extraneous factors [eq. (6)].
To summarize then, the results so far do not support our main hypothesis. The increased energy intake by the HES group did not produce a consistent
‘-Canefield conditions appear to expla n the comparatively lowe: mean increase in CANE- DA Yin the HES group averaged over thl whole supplementation period. After holding constant canefield comlitions, the group difference in mean increase in CANE-DAY is no longer statis:ically significant [eq. (2). table 4). Frequency distributions of days worked by each group i,? canefields with different physical conditions and yields showed that during the 1974/1975 h&r-vest seasor. the L ES group comparatively spent a greater proportion of days worked in cancfields with higher yields and with conditions more conducive to high productivity. The chi- \quare test was significant at the 0.01 level n both case:.
and positive effect on energy expenditure at worh. or on the supply of work units per unit of time.
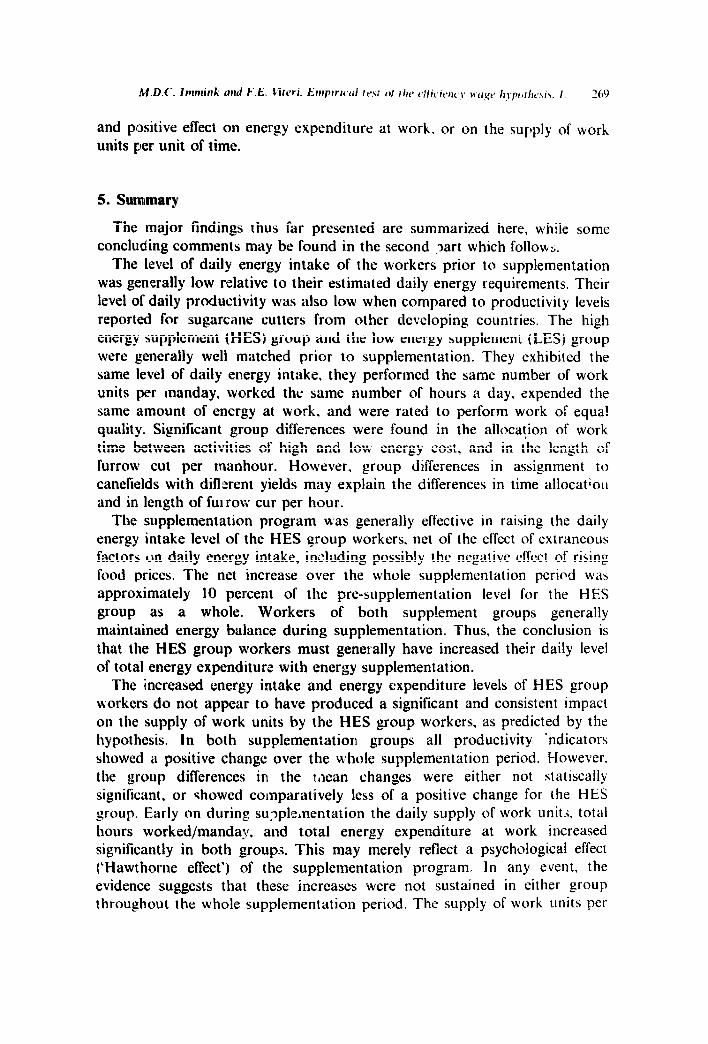
5. Summary
The major findings thus far presented are summarized here, while some concluding comments may be found in the second 3art which follows.
The level of daily energy intake of the workers prior to supplementation was generally low relative to their estimated daily energy requirements. Their level of daily productivity was also low when compared to productivity levels reported for sugarcane cutters from other developing countries. The high energy supplement (PIES) group and the low energy supplement (LB) group were generally well matched prior to supplementation. They exhibited the same level of daily energy intake, they performed the same number of work units per manday, worked the same number of hours a day, expended the same amount of energy at work, and were rated to perform work of equa! quality. Significant group differences were found in the alloca!ion of work time between activities of high and low energy cost, and in the length of furrow cut per manhour. However, group differences in assignment to canefields with diflzrent yields may explain the differences in time allocation and in length of furrow cur per hour.
The supplementation program was generally effective in raising the daily energy intake level of the HES group workers, net of the effect of extraneous factors on daily energy intake, including possibly the negative effect of rising food prices. The net increase over the whole supplementation period was approximately 10 percent of the pre-supplementation level for the HES group as a whole. Workers of both supplement groups generally maintained energy balance during supplementation. Thus, the conclusion is that the HES group workers must generally have increased their daily level of total energy expenditure with energy supplementation.
The increased energy intake and energy expenditure levels of HES group workers do not appear to have produced a significant and consistent impact on the supply of work units by the HES group workers, as predicted by the hypothesis. In both supplementation groups all productivity ‘ndicators showed a positive change over the whole supplementation period. However. the group differences in the l&lean changes were either not statiscally significant, or showed comparatively less of a positive change for the HES group. Early on during su?ple,nentation the daily supply of work unit.<, total hours worked/manday. and total energy expenditure at work increased significantly in both groups. This may merely refiect a psychological effect (‘Hawthorne effect’) of the supplementation program. In any event, the evidence suggests that these increases were not sustained in either group throughout the whole supplementation period. The supply of work units per
270 M.D.C. Imrnink and FL Viteri, Enapirical lest qj’rhr #cienc’~ M’u~:L’ hypwhesis. 1.
manhour and length of furrow cut per manhour did not show a consistent pattern in either group. Canefield characteristics and yields explained some of the inter-worker variation in the change in the daily supply of work units and in length of furrows cut/manhour during supplernzntation. Molding constant these canefield factors, changes in energy intake during supplementation were not significantly related to changes in productivity iu either group.
These results generally point to a weak relationship between energy availability and worker productivity. In the second part of this paper, the analysis is expanded, and in some concluding comments we speculate as to the reason(s) for the lack of evidence in support of the productitity- consumption relation of the efficiency wage hypothesis.
References
Bliss, C. and N. Stern, 1978a, Productivity, wages and nutrition, Part II, Some observations, Journal of Development ‘Economics 5, 363-398.
Bliss, C. and N. Sterll, 1978b, Productivity, wages, and nutrition, Part 1, The theory. Journal of Development Economics 5, 331-362.
Campbell, D.T. and J.C. Stanley, 1966, Experimental and quasi-experimental designs for research (Rand McNally College, Chicago. IL).
Davies. C.T.M.. 1973, Relzctionship of maximum aerobic power output to productivity and absenteeism of East African sugar cane workers, British Journal of Industrial Medicine 30. 146154.
Heywood, P.F, 1474, Malnutrition and productivity in Jamaican sugar cane cutters. Ph.D. dissertation (Cornell University, Ithaca, NY).
Immink, M.D.C., 1978, Human energy supplementation and worker productivity: A case study of sugarcane cutters in Guatemala, Ph.D. dissertation (University of Hawaii, Honolulu. HI).
INCAP/CDC, 1972, Nutritional evaluation of the population of Central America and Panama. Regional Summary, IIS DHEW Publication (HSM) no. 72.-8130 (Washington, DC).
Institute of Nutritional of Central America and Panama (INCAP), 1960, Food composi!ion table of Central America and Panama (Tabla de composition de alimentos de Centro America y Panama), Fourth ed.. INCAP Publication E-246 (Guatemala).
Jelliffe, D.B., 1966, The assessment of the nutritional status of the community, WHO Monograph Series no. 53 (World Health Organization, Geneva).
Leibenstein, H., 1957a, The theory of underemployment in backward economies, Journal of Political Fxonomy 65, 91-103.
Leibenstein, H., 1957b, Economic backwardness and economic growth. Studies in the theory of economic development (Wiley, New York).
Leibensrein, H., 1958, Underemployment in backward economics: Some additional notes. Journal of Political Economy 66. 2X-258.
Mirrlees. J.A., 1976, A pure theory of underdeveloped economics, in: L.G. Reynolds, cd.. Agriculture in development theory (Yale University Press. New Haven. CT) 84-106.
Morrison, J.F. and G.T.W. Blake, 1974. Physiological obse*vations on cnnc cutters, European Journal of Applied Physiology 33, 2 17-254.
i)shima, H.T.. 196’7, Food consumI tion, nutrition, and economic development in Asian countries, Economic Deveic,pment md Cultural Change 15, 385-397.
Rodgers, G.B., 1975, Nutritionally bpjed wage determination in the low-income lubour market, Oxford Economic Papers (New Series) 27,61-81.
Spurr, G.B., M. Barac-Nieto and M.G. Maksud, 1977, Productivity and maximal oxygen consumption in sugar cane cutters, American Journal of Clinical Nutrition 30, 316-321.
Stiglitz, J.E., 1976. The efficiency wage hypothesis, surplus labour, and the distribution of income in L.D.C.‘s, Oxford Economic Papers (New Series) 28, 185--207.

M.D.C. lmmink und F.E. C’ireri. Empiricul test 01 the effic?rta~~ wage hpporlwsis. I. 271
Viteri, F.E. and B. Torun, 1975. Ingestion calorica y trabajo fisico de obrero; agricolas cn
Guatemala, Ekcto de la suplemcntacion alimentaria y su lugar en 10s programas de salud, Bolctim Ofiina Sanitaria Panameric~na 78. 58-74.
Viteri, FE. B. Torun, J.C. Galicia and E. Herrera, 1371. Determining energy costs of agricultural activities by respirometet and energy balance techniques, American Journal of Clinical Nutrition 24, 141% 1430.