Membrane assisted reactive distillation for bioethanol ...
25
Membrane assisted reactive distillation for bioethanol purification Massimiliano Errico, 1,* Claudio Madeddu, 1 Mathilde Flemming Bindseil, 1 Signe Dall Madsen, 1 Sylvie Braekevelt, 2 Maria Salud Camilleri-Rumbau 2 1 Department of Chemical Engineering, Biotechnology and Environmental Technology, University of Southern Denmark, 5230 Odense M, Denmark 2 Aquaporin A/S, Nymøllevej 78, DK-2800 Kongens Lyngby * M.E. E-mail: [email protected]. Telephone: +45 65507482 Abstract Reactive distillation and membrane assisted reactive distillation have been considered as possible alternatives to extractive distillation for the concentration of ethanol from diluted streams. Aquaporin-based biomimetic forward osmosis membranes have been tested for ethanol tolerance and ethanol rejection. The experimental results were used to construct the process simulations developed by Aspen Plus. Different alternatives were proposed where the pre-concentration step was performed by membrane stand alone or a combination of membrane and ordinary distillation. In all the configurations reactive distillation using ethylene oxide was considered to reach the ethanol final concentration of 99.9 wt%. Ethanol recovery, the energy consumed per kg of ethanol produced, the total annual cost and economic analysis were used to compare the alternatives. It was obtained that ordinary distillation coupled with reactive distillation is at the moment the only alternative competing with extractive distillation. However, the sequence of membrane, ordinary distillation and reactive distillation has clear potentials to compete with the distillation stand-alone processes once that solutions for draw recovery and minimization of ethanol lost will be available. Keywords: Reactive distillation, forward osmosis, membrane separation, bioethanol
-
Upload
khangminh22 -
Category
Documents
-
view
1 -
download
0
Transcript of Membrane assisted reactive distillation for bioethanol ...
Membrane assisted reactive distillation for bioethanol purification
Massimiliano Errico,1,* Claudio Madeddu,1 Mathilde Flemming Bindseil,1 Signe Dall Madsen,1
Sylvie Braekevelt,2 Maria Salud Camilleri-Rumbau2
1 Department of Chemical Engineering, Biotechnology and Environmental Technology, University
of Southern Denmark, 5230 Odense M, Denmark 2 Aquaporin A/S, Nymøllevej 78, DK-2800 Kongens Lyngby
* M.E. E-mail: [email protected]. Telephone: +45 65507482
Abstract
Reactive distillation and membrane assisted reactive distillation have been considered as possible
alternatives to extractive distillation for the concentration of ethanol from diluted streams.
Aquaporin-based biomimetic forward osmosis membranes have been tested for ethanol tolerance
and ethanol rejection. The experimental results were used to construct the process simulations
developed by Aspen Plus. Different alternatives were proposed where the pre-concentration step
was performed by membrane stand alone or a combination of membrane and ordinary distillation.
In all the configurations reactive distillation using ethylene oxide was considered to reach the
ethanol final concentration of 99.9 wt%. Ethanol recovery, the energy consumed per kg of ethanol
produced, the total annual cost and economic analysis were used to compare the alternatives. It was
obtained that ordinary distillation coupled with reactive distillation is at the moment the only
alternative competing with extractive distillation. However, the sequence of membrane, ordinary
distillation and reactive distillation has clear potentials to compete with the distillation stand-alone
processes once that solutions for draw recovery and minimization of ethanol lost will be available.
Keywords: Reactive distillation, forward osmosis, membrane separation, bioethanol
1. Introduction
The Sustainable Development Scenario (SDS) was introduced in the World Energy Outlook 2017 to
offer “an integrated way to achieve a range of energy-related goals crucial for sustainable economic
development: climate stabilization, cleaner air and universal access to modern energy, while also
reducing energy security risks”.1 The SDS defines a set of desired outcomes and the actions
required to deliver them. In particular, in 2040 low-carbon sources are expected to contribute by
40% in the energy mix. Nevertheless, the global biofuel production is not increasing quickly enough
to meet the SDS demands. Biofuel production grew 7% year-on-year in 2018 to reach 152 billion
litres, but average production growth of 3% per year is anticipated over the next five years. This is
below the sustained annual growth of 10% until 2030 required to comply with the SDS.2 Research
efforts are still required to reduce biofuels production costs along all the process line, from
feedstock selection and treatment to product recovery and separation.
According to Renewable Fuels Association,3 the world production of bioethanol was 108 million
cubic meters in 2018, bringing bioethanol to the highest step of the podium as the main biofuel used
in the world.4 Bioethanol has a long history, from the late 1800s when Henry Ford and Nicholas
Otto build engines that could run on ethanol, an outstanding research effort allowed bioethanol
production to overcome ethical issues, create new jobs and displace imported crude oil.
Research on new raw materials for bioethanol conversion represents undoubtedly the more
discussed topic in the literature. Additionally, also the bioethanol purification step keeps attracting
the interest of the scientific community in order to reduce its energy demand. Two main challenges
can be highlighted in the optimization of the separation process. The first is related to the feed
composition which is a diluted aqueous solution of ethanol coming from the fermentation step. The
second is related to the presence of a minimum azeotrope between water and ethanol that limits the
purity achievable in unit operations based on liquid-vapor equilibria.
Different separation techniques have been proposed and evaluated during the years:
1. Extractive distillation. In extractive distillation a solvent is added to cause an increase of the
relative volatility of the key components to the extent that separation becomes feasible and
economical.5 This technology was extensively studied for the separation of ethanol-water
water mixtures in order to define new configurations6,7 or testing alternative solvents.8
2. Heterogeneous distillation. In heterogeneous distillation an entrainer that forms a
heterogeneous azeotrope with one or more components in the feed is used. The entrainer is
concentrated in the overhead vapor and when condensed forms a second liquid phase that is
recirculated as reflux. The other liquid phase and the bottom streams are the products.9
Together with extractive distillation these are the preferred options for large scale bioethanol
production. Different works focused in the optimization of the process or in defining
intensified alternatives.10,11
3. Pressure-swing distillation. Pressure-swing could be advantageous when the binary
azeotrope disappears or changes composition by 5% or more over a moderate range of
pressure. In this case the separation can be performed in two ordinary distillation columns
operating at different pressures.5 Differently from the previous cases, pressure swing
distillation does not require a mass separation agent. Furthermore, the difference in pressure
between the columns opens different possibilities for heat integration.12,13
4. Reactive distillation (RD). The azeotrope can be circumvented in systems where the
distillation is combined with a reaction. The simultaneous reaction and separation allow
overcoming of azeotropic concentrations and distillation boundaries facilitating the products
purification.14 When applied to ethanol-water separation, different alternatives have been
proposed. Among all, Lu et al.15 proposed a reactive distillation process where water is
eliminated by reaction with isobutene, while Guzman-Martinez et al.16 considered propylene
oxide and ethylene oxide. An et al.17 choose the hydration reaction of ethylene oxide to
overstep the azeotrope. This reaction alternative was recently reconsidered by Kaymak.18
RD for separation of ethanol from aqueous solutions should not be confused with RD used
for the synthesis of ethanol. This case can be revised in the study of Cardenas-Guerra et al.19
where ethanol was produced by reaction of ethylene and water.
5. Adsorption. For azeotropic separations, adsorption is used to selectively adsorb one
component in a fix-bed adsorbent. Different works have been published for the ethanol-
water separation testing different adsorbent materials to bring this separation to a potential
industrial application.20 A review of different adsorbents, process parameters, kinetic and
mathematical models have been discussed by Karimi et al.21
6. Membrane separation. Membranes can be defined as a thin interface that moderates the
permeation of chemical species in contact with it.22 Because the separation is not limited by
the relative volatility, separation by membrane, is claimed to be economically more
convenient compared to distillation when azeotropic mixtures are considered.23,24 In
bioethanol production, membranes can be integrated in different sections of the process as
reviewed by Wei et al.25 and Lipnizki.26
7. Hybrid systems. Hybrid flowsheets are obtained combining different unit operations to
overcome their individual limitations.27 Fuel grade ethanol was obtained by liquid-liquid
assisted extractive distillation in a study of Aviles Martinez et al.28 The liquid-liquid
extraction was performed with n-dodecane to remove most of the water, then the ethanol
purity required was reached in an extractive distillation column using glycerol as entrainer.
The combination of membranes and ordinary distillation was considered by Skiborowski et
al.29 In their work they consider a distillation column to approach the ethanol-water
azeotropic composition and a pervaporation step to further purify the ethanol. Different
hybrid systems for ethanol dehydration were reviewed by Roth et al.30
Since membranes and reactive distillation are emerging as the most promising techniques to achieve
savings in both energy and capital costs, in the present study a hybrid process that combines these
unit operations is considered. Ethanol is a molecule that can easily permeate through polyamide-
based membranes such as reverse osmosis31 leading to the de-alcoholization of feeds. 32
Additionally, it has previously reported that ethanol can cause swelling in polymeric membranes,33
potentially provoking changes in the membrane structure that could ultimately affect the global
process performances negatively. For this reason, in this study aquaporin-based biomimetic forward
osmosis membranes were chosen to preconcentrate the diluted ethanol-water stream before being
fed to the reactive distillation column where the reaction between water and ethylene oxide is
carried out.
Aquaporins are water channels that allow the pass of water rejecting all other impurities.34
Aquaporin-based forward osmosis membranes have previously proved to be suitable for the
dewatering of fermentation broths.35 Therefore, pre-concentration of ethanol using aquaporin-based
forward osmosis membranes before reactive distillation could enhance the overall process
performance. Different process configurations have been compared to the classic extractive
distillation process using the total annual cost, the ethanol recovery and the energy index as
confront criteria.
This study:
- Reports novel experimental data of aquaporin-based forward osmosis membranes stability
and rejection data for concentration of ethanol model solutions
- Studies the performance of the reactive distillation column including the by-products
purification
- Presents an economic analysis of the alternatives considered.

2. Materials and methods
Forward osmosis (FO) was chosen as a technique for the ethanol-water separation. Hollow fibers
membrane modules (HFFO2) have been used for the experiments. The module consists of a
biomimetic hollow fiber element comprising a layer of polyamide thin film composite. The active
layer is coated with aquaporin proteins on the lumen side of the fibers. The fibers have an inner
diameter of 0.195 mm and a length of 300 mm. The module has a diameter of 70 mm and the
overall membrane area is 2.3 m2.
All the experiments and the modeling of the different alternatives were done considering a
hypothetical fermentation broth containing 5 wt% ethanol. This value is aligned with different
works where actual fermentation broths were considered.36-38 Ethanol with a minimum purity of
99.9 wt% is the production requirement.
2.1 Ethanol exposure tests
In order to verify the membrane stability to a progressively more concentrated ethanol solution,
quality control (QC) tests were performed before and after the ethanol exposure. To be within the
QC-standards, aquaporin membranes must meet the following requirement:
1. Water flux (Jw) from the feed to the draw side, higher than 15 L m-2 h-1
2. Reverse salt flux (Js) from the draw solution to the feed lower than 2.5-3 g m-2 h-1
3. Specific reverse salt flux (Js/ Jw), the ratio between the reverse salt flux and the water flux
lower than 0.2 g L-1
The exposure experiments were run in batch mode for 24 hours. Aquaporin membranes were
exposed to ethanol solutions of 5, 10 and 25 wt% in the feed side keeping the draw side empty and
open. These pre-selected ethanol concentrations simulate the increasing ethanol concentration
during the forward osmosis concentrating process. After the exposure the membranes were rinsed
with water and the QC-tests performed. Ethanol 99.5 vol% (VWR, USA) was used.
The experimental setup used for the exposure tests can be seen in the supporting material.
2.2. Ethanol rejection tests
Once the membrane stability was confirmed through during the ethanol exposure tests previously
described, the ethanol rejection tests were performed. The single-pass set-up used for the
experiments is reported in Figure 1. The trans-membrane pressure was adjusted by the valve and
kept at 0.2 bar. Samples of feed inlet and feed concentrate are taken from the dedicated sample

valves, and samples of the draw outlet are taken from the outlet stream. The process recovery,
defined as the amount of feed removed in the draw, was calculated from the feed (Qf) and the
permeate flowrate (Qp) according to Equation 1:
𝑃𝑃𝑟𝑟𝑜𝑜𝑜𝑜𝑜𝑜𝑜𝑜𝑜𝑜 𝑟𝑟𝑜𝑜𝑜𝑜𝑜𝑜𝑟𝑟𝑜𝑜𝑟𝑟𝑟𝑟 = �1 − 𝑄𝑄𝑝𝑝𝑄𝑄𝑓𝑓�% (1)
During the experiments the recovery was kept constant adjusting the feed and draw flow rated.
Tests were performed at 30, 50 and 80% recovery.
Figure 1. Flow sheet of the single-pass set-up.
The experiments were run for 60 minutes and samples were collected at 15, 30, 45 and 60 minutes.
In order to evaluate the separation performances, the rejection percentage (R) was introduced. The
rejection indicates the amount of ethanol retained by the membrane and it is defined according to
Equation 2.
𝑅𝑅 = �1 − 𝐶𝐶𝑝𝑝𝐶𝐶𝑎𝑎𝑎𝑎� (2)
where Cp is the ethanol concentration in the permeate and Cav is the arithmetic average between the
concentration of ethanol in the feed inlet and in the feed concentrate.
The draw solution was a 4.17 M solution of NaCl.
2.3 Process modeling
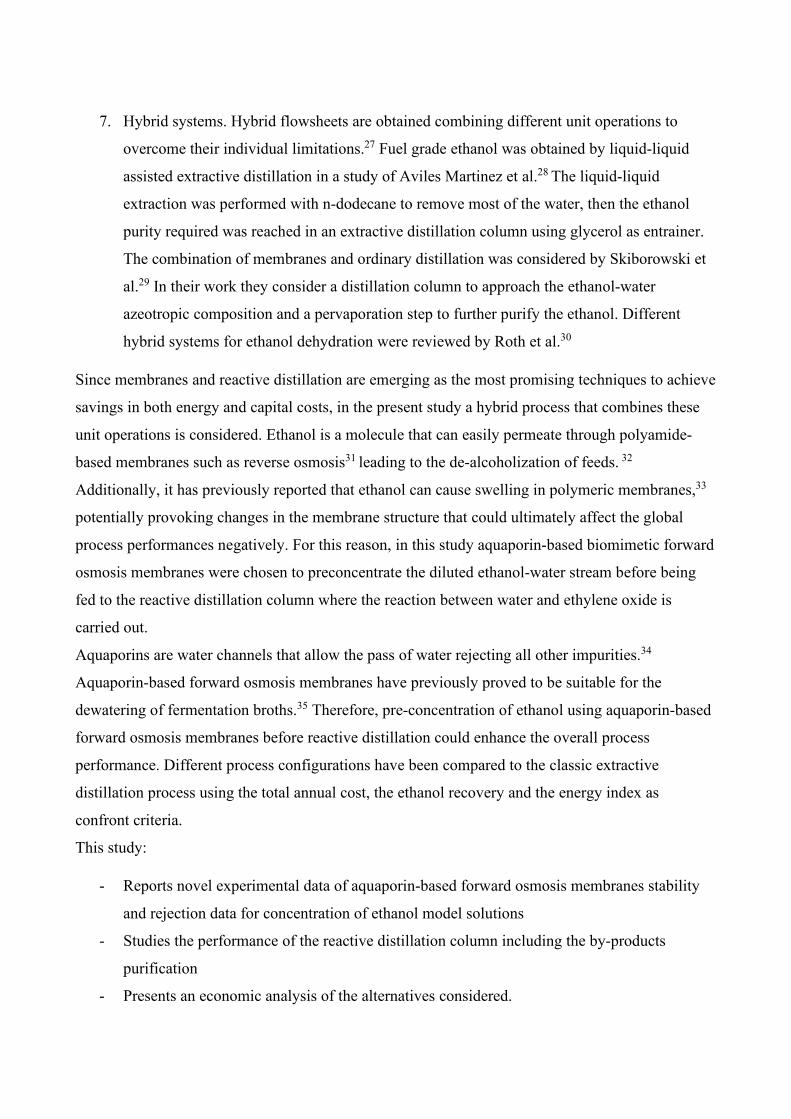
The process alternatives considered are summarized in Figure 2. The base case, used as benchmark
to evaluate the performances of the alternatives proposed, is the extractive distillation sequence
reported in Figure 2(a). This configuration was proposed by Errico et al.6 after screening different
configurations with different number of columns and different recycle set-ups. It is composed by
three columns; in the first one called pre-concentrator (PC), the fermentation broth is upgraded to a
concentration near the azeotropic one, in the second column, pure ethanol is recovered as distillate
by using ethylene glycol (EG) as entrainer. The third column is used for solvent recovery and the
distillate, composed by water and traces of ethanol, is recycled to the PC. Figure 2(b) reports the
first alternative obtained as a combination of an ordinary distillation (PC) and RD. The design of
the reactive distillation column is based on the hydration reaction between ethylene oxide (EO) and
water to produce ethylene glycol (EG). The water is consumed by the reaction and pure ethanol can
be recovered as distillate. In Figure 2(c) the PC was substituted by aquaporin forward osmosis (FO)
membranes. In the last option, reported in Figure 2(d) the pre-concentration step was distributed
between FO and PC.
(a)
Broth
Solvent recycle
Distillate recycle
Ethanol
Water
Az. feed
Water
BrothAz. feed
EO Ethanol
EG By-products
(b)
(c) (d)
Draw out
Concentrate
EO Ethanol
EG By-products
Draw in
Broth
Draw out Ethanol
EG By-products
Concentrate
Draw in
Water
EO
Az. feedBroth
Figure 2. Base case, extractive distillation (a), PC plus RD sequence (b), FO plus RD (c). FO plus PC plus
RD (d)
All the flowsheets considered were modeled by means of the process simulator Aspen Plus V11.
For the distillation columns, the rigorous method RadFrac was used. The NRTL thermodynamic
method was chosen to describe the system deviations from the ideality. Pressure drops and stage
efficiencies were not considered in the design. All the columns were considered equipped with
sieve trays 0.6 m spaced. A bottom liquid sump and a top vapor disengagement of 2.5 and 1.25 m
respectively were also considered. To each column is associated a floating head kettle reboiler and a
fixed tube condenser. The membrane unit was not simulated in Aspen Plus since what is relevant
for the calculation is the composition of the concentrate stream that was experimentally evaluated.
The process performances were evaluated through the evaluation of three indexes: the total annual
cost (TAC), the ethanol recovery (ER) and the energy index (EI).
The total annual cost (TAC) is obtained as the sum of the annualized capital costs and the operative
costs due to the steam used in the columns reboilers, the cooling water in the condensers and the
solvents or reactants. Aspen Economic Analyzer was used to evaluate the TAC considering an
operational time of 10 years and 8000 hr yr-1. The capital cost of the membranes was considered
equal to 110 $ m-2 with an average volume discount of 15% based on information provided by the
vendor. Maintenance was not included in the economic evaluation.
The ethanol recovery is defined as the ration of the molar flow rate of the component in the stream
where it is recovered and in the fermentation broth.
The energy index is obtained as the ratio between the total reboiler duty of the configuration and the
total flow rate of ethanol produced.
The ER and EI are evaluated based on the solution of the material and energy balances provided by
Aspen Plus.
3. Process alternatives results
3.1 Case 1: Base case process – extractive distillation
According to Errico et al.6 32,907 kg/h of a mixture of 5 wt% ethanol was fed to the first column at
1 atm as saturated liquid. All the columns operate at atmospheric pressure. The TAC was evaluated
equal to 332 k$ yr-1. Of this cost, 140 k$ yr-1 are due to the annualized capital costs.
The ER and the EI for the base case extractive distillation are equal to 98.6 % and 6.86 MJ kg-1
respectively.
Details of the energy and mass balances for the base case configuration are available in the
supporting material.
3.2 Case 2: Ordinary distillation preconcentration plus reactive distillation
In the design of this alternative reported in Figure 2 (b), the parameters for the PC where obtained
from the previous case and it is discussed here the design procedure followed for the RD.
As first step it is necessary to define the kinetic scheme.

The reaction scheme chosen is this work is based on the two reactions reported in Equations 3 and
4.
𝐶𝐶2𝐻𝐻4𝑂𝑂 (𝐸𝐸𝑂𝑂) + 𝐻𝐻2𝑂𝑂 → 𝐶𝐶2𝐻𝐻6𝑂𝑂2(𝐸𝐸𝐸𝐸) (3)
𝐶𝐶2𝐻𝐻4𝑂𝑂 (𝐸𝐸𝑂𝑂) + 𝐶𝐶2𝐻𝐻6𝑂𝑂2(𝐸𝐸𝐸𝐸) → 𝐶𝐶4𝐻𝐻10𝑂𝑂3(𝐷𝐷𝐸𝐸𝐸𝐸) (4)
The same reaction scheme was used by Ciric and Gu,39 and Al-Arfaj and Luyben40 using the kinetic
parameters reported by Altiokka and Akyalcin.41
This scheme represents an improvement with respect to the works of Tavan and Hosseini42 and
Keymak18 where only the main reaction (Equation 3) had been considered. However, the presence
of side products can affect the purity of the EG produced and consequently the process layout to
achieve a purity that matches the market requirements. The reaction parameters used are
summarized in Table 1. Table 1. Rate constants for the reactions reported in Equations 3-4
Reaction Reaction rate [𝑘𝑘𝑘𝑘𝑜𝑜𝑘𝑘 𝑘𝑘−3𝑜𝑜−1]
3 3.15 ∙ 1012𝑜𝑜𝑒𝑒𝑒𝑒(− 9547 𝑇𝑇⁄ )𝑒𝑒𝐸𝐸𝐸𝐸𝑒𝑒𝐻𝐻2𝐸𝐸
4 6.30 ∙ 1012𝑜𝑜𝑒𝑒𝑒𝑒(− 9547 𝑇𝑇⁄ )𝑒𝑒𝐸𝐸𝐸𝐸𝑒𝑒𝐸𝐸𝐸𝐸
In order to design the reactive distillation, different parameters need to be defined and optimized.
The column pressure, the reactant and distillate flow rate, the reflux ratio, the location of the feeds,
the stage hold up, and the extend of the reactive zone, are going to be discussed independently in
the following subsections.
3.2.1 Column pressure
The operative pressure is one of the most important parameters for the reactive distillation column.
The change in the pressure affects the temperature profile, the corresponding reaction rates, and
relative volatilities impacting both the kinetics and the separation. For the system considered,
different values of the pressure have been reported in the literature. Tavan and Hosseini42 select
101.3 kPa as operative pressure without exploring its variation on the column performances. A
more complete analysis was done by An et al.17 where the water conversion, the EO conversion, the
ethanol recovery and the EG selectivity were explored in the pressure range 200-1000 kPa. They
select 600 kPa as optimal value based on the conversion of water and EO and the high EG
selectivity. Kaymak18 explored the range 101.3-607.9 kPa and the value of 456 kPa was chosen as
optimal based on the reactant conversion. The highest value was considered by Okasinski and
Doherty.43 They defined 1520 kPa as the pressure necessary to assure a temperature of 200˚C in the
reactive zone of the column.
All the cited works based the optimization of the pressure on indexes related to the reaction
conversion and the amount of product obtainable. However, the decomposition temperature of EG
is also a constrain for the selection of its optimal value. According to Beach44 EG degrades very
slowly at temperature lower than 163˚C. This temperature was widely exceeded in the design
reported by Kaymak18 since the EG recovered as bottom stream in the reactive column had a
temperature of 254.78˚C. The same consideration applies for the design reported by Al-Arfaj and
Luyben40 where the bottom temperature was 300˚C. Nevertheless, depending on the pressure and
the flow rate of EO, the bottom stream could be more or less concentrated in DEG. The DEG has a
decomposition temperature above 200˚C45 allowing an extension of the pressure range admissible.
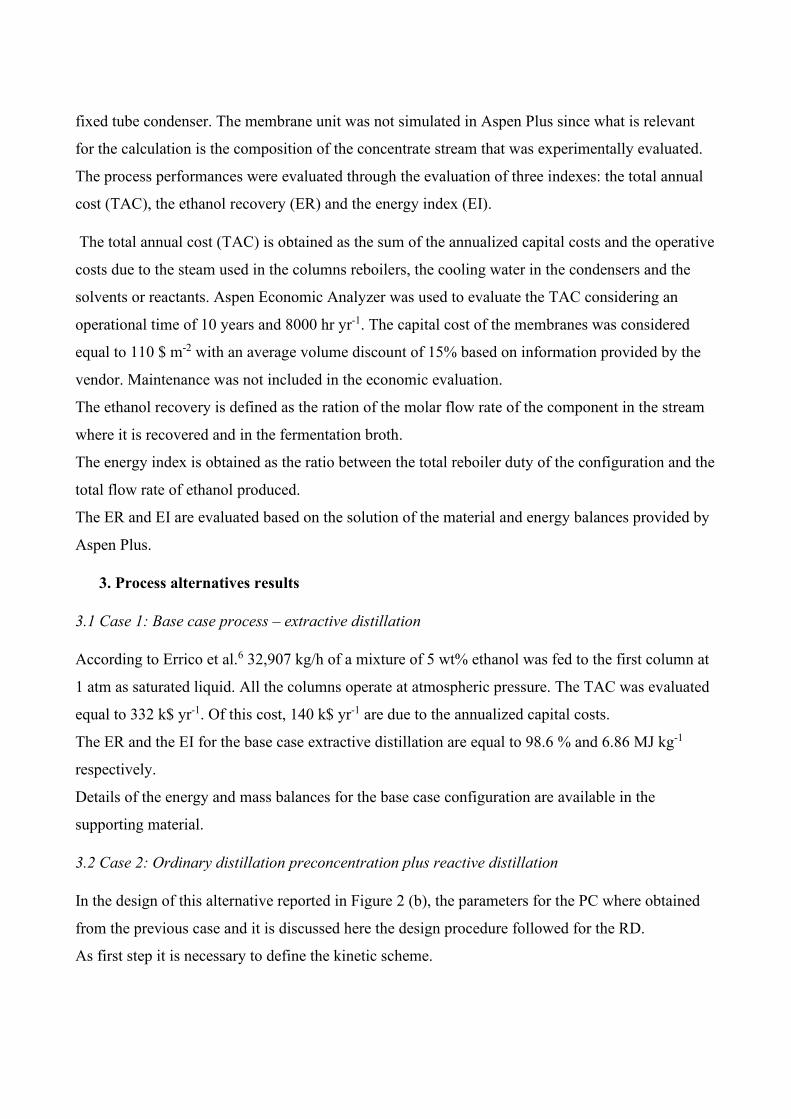
Using the initial design parameters reported in the supplementary material, the effect of the column
pressure was explored in the range of 100-1500 kPa. To these extremes correspond a bottom
temperature of 91 and 224˚C, respectively. The influence of the pressure on the ethanol purity, the
ethanol recovery and the reboiler duty are reported in Figure 3.
Figure 3. Variation of the ethanol purity, recovery, and reboiler duty with column pressure.
3.2.2 Effect of the EO/water ratio
Based on the reaction reported in Equation 3, on molar basis, the ratio between EO and water
should be at least 1. A higher amount benefits the purity and recovery of ethanol to the detriment of
the EG production. Considering the main production goal is the ethanol separation, the purity of the
bottom stream becomes of secondary importance.
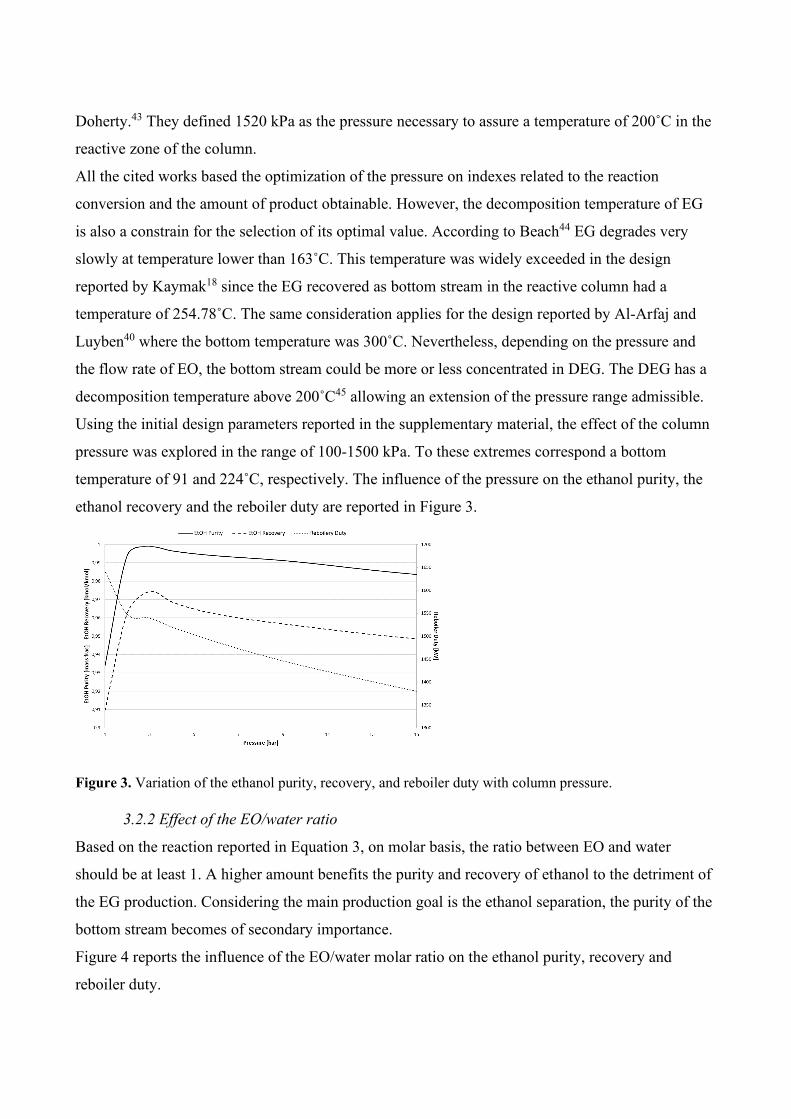
Figure 4 reports the influence of the EO/water molar ratio on the ethanol purity, recovery and
reboiler duty.
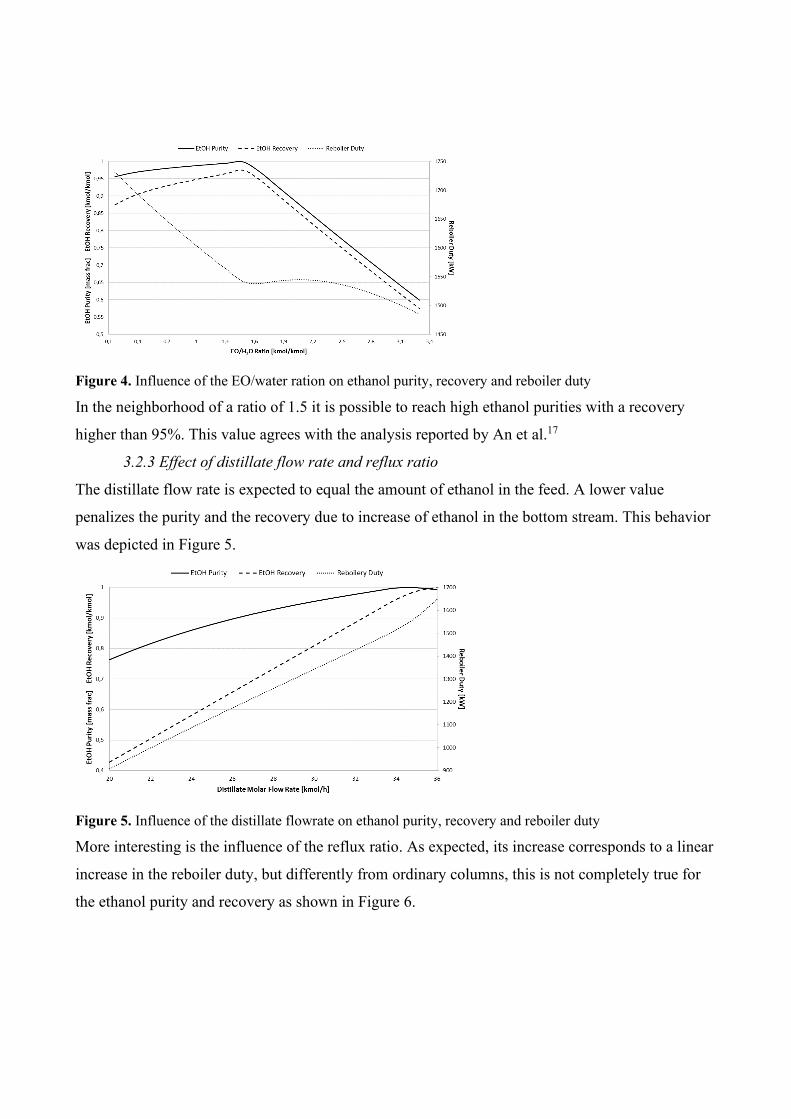
Figure 4. Influence of the EO/water ration on ethanol purity, recovery and reboiler duty
In the neighborhood of a ratio of 1.5 it is possible to reach high ethanol purities with a recovery
higher than 95%. This value agrees with the analysis reported by An et al.17
3.2.3 Effect of distillate flow rate and reflux ratio
The distillate flow rate is expected to equal the amount of ethanol in the feed. A lower value
penalizes the purity and the recovery due to increase of ethanol in the bottom stream. This behavior
was depicted in Figure 5.
Figure 5. Influence of the distillate flowrate on ethanol purity, recovery and reboiler duty
More interesting is the influence of the reflux ratio. As expected, its increase corresponds to a linear
increase in the reboiler duty, but differently from ordinary columns, this is not completely true for
the ethanol purity and recovery as shown in Figure 6.

Figure 6. Influence of reflux ratio on ethanol purity, recovery and reboiler duty
This behavior may due to the presence of multiple steady states.46,47
3.2.4 Effect of feed locations
The effect of the EO and azeotropic feed location have been reported in Figure 7.
Figure 7. Effect of feed stage location EO (left), azeotropic feed (right), on ethanol purity, recovery and
reboiler duty
Differently from An et al.17 it was chosen to keep the feed separated. From Figure 7 (left) it is
possible to notice that after the 6th stage the location of EO does not influence the column
performance. This was expected since if the EO is the lightest compound, if fed too close to the top
it could easily reach the condenser. The azeotropic feed from the preconcentration column has its
optimal location after the 25th stage, where the maximum ethanol purity and recovery is observed.
3.2.5 Effect of the liquid hold-up
The hold-up affects directly the net reaction rate. As it can be seen from Figure 8, its increase
corresponds to an improvement of the purity and a decrease of the reboiler duty. It should be kept in
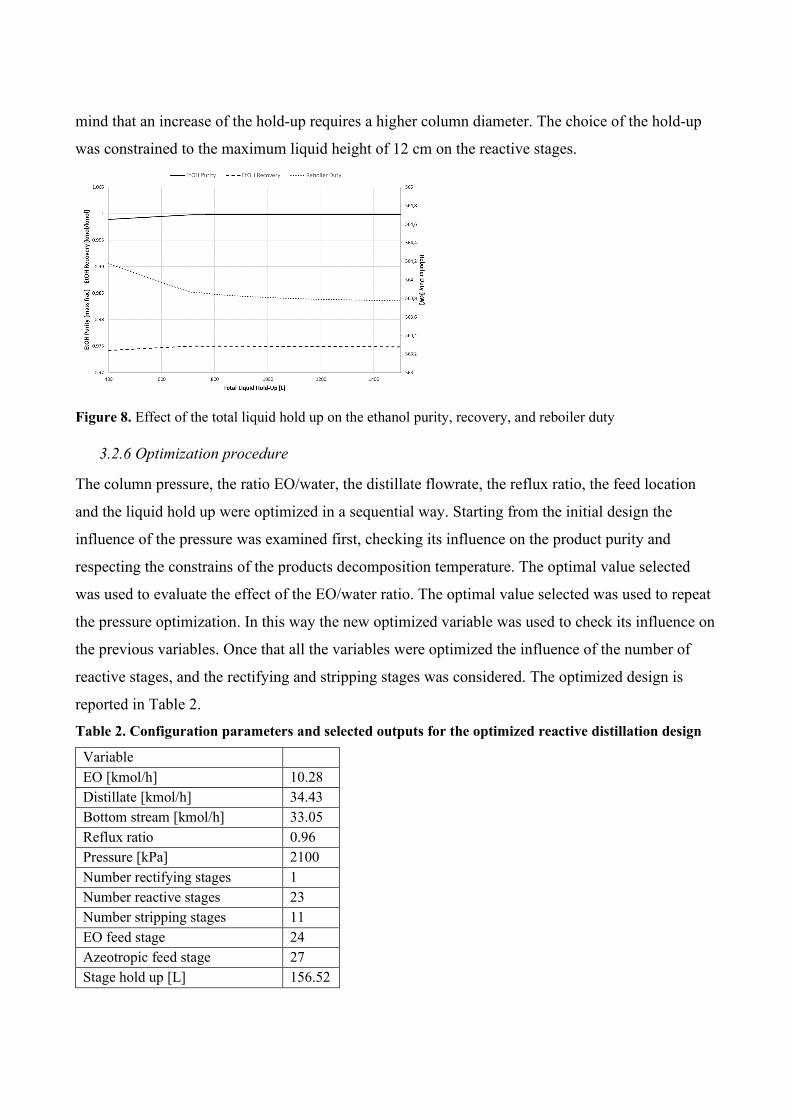
mind that an increase of the hold-up requires a higher column diameter. The choice of the hold-up
was constrained to the maximum liquid height of 12 cm on the reactive stages.
Figure 8. Effect of the total liquid hold up on the ethanol purity, recovery, and reboiler duty
3.2.6 Optimization procedure
The column pressure, the ratio EO/water, the distillate flowrate, the reflux ratio, the feed location
and the liquid hold up were optimized in a sequential way. Starting from the initial design the
influence of the pressure was examined first, checking its influence on the product purity and
respecting the constrains of the products decomposition temperature. The optimal value selected
was used to evaluate the effect of the EO/water ratio. The optimal value selected was used to repeat
the pressure optimization. In this way the new optimized variable was used to check its influence on
the previous variables. Once that all the variables were optimized the influence of the number of
reactive stages, and the rectifying and stripping stages was considered. The optimized design is
reported in Table 2.
Table 2. Configuration parameters and selected outputs for the optimized reactive distillation design
Variable EO [kmol/h] 10.28 Distillate [kmol/h] 34.43 Bottom stream [kmol/h] 33.05 Reflux ratio 0.96 Pressure [kPa] 2100 Number rectifying stages 1 Number reactive stages 23 Number stripping stages 11 EO feed stage 24 Azeotropic feed stage 27 Stage hold up [L] 156.52

Based on the optimization results, the bottom stream of the reactive distillation column is composed
mainly of DEG (85 mol%), a minor part of EG (0.30 mol%) and the rest equally distributed
between water and ethanol. In order to valorize this stream producing pure DEG with a market
value, a new configuration was proposed according to Figure 9. A new ordinary distillation column
was added to purify the DEG obtained from the RD, at the same time the ethanol and water
recovered as distillate are sent back to the pre-fractionator to increase the ethanol recovery.
This configuration achieved a TAC of 371 k$ yr-1, 165 of those are due to the annualized capital
costs. Moreover, an ER of 98.6 % and an EI of 7.10 MJ kg-1 was evaluated.
Water
BrothAz. feed
EO Ethanol
DEG Water, Ethanol
DEG
Water, Ethanol
Figure 9. Modified PC plus RD configuration for DEG purification
The stream summary for this configuration is reported in the supplementary material.
3.3 Case 3: Membrane assisted reactive distillation
The membrane is now considered in a hybrid configuration to substitute the ordinary distillation
preconcentration step according to the flowsheet reported in Figure 2(c).
Distillate ethanol mass fraction 0.9999 Column diameter [m] 1.41 Reboiler duty [kW] 511.46 Reboiler temperature [˚C] 150.30 Condensed duty [kW] 705.21
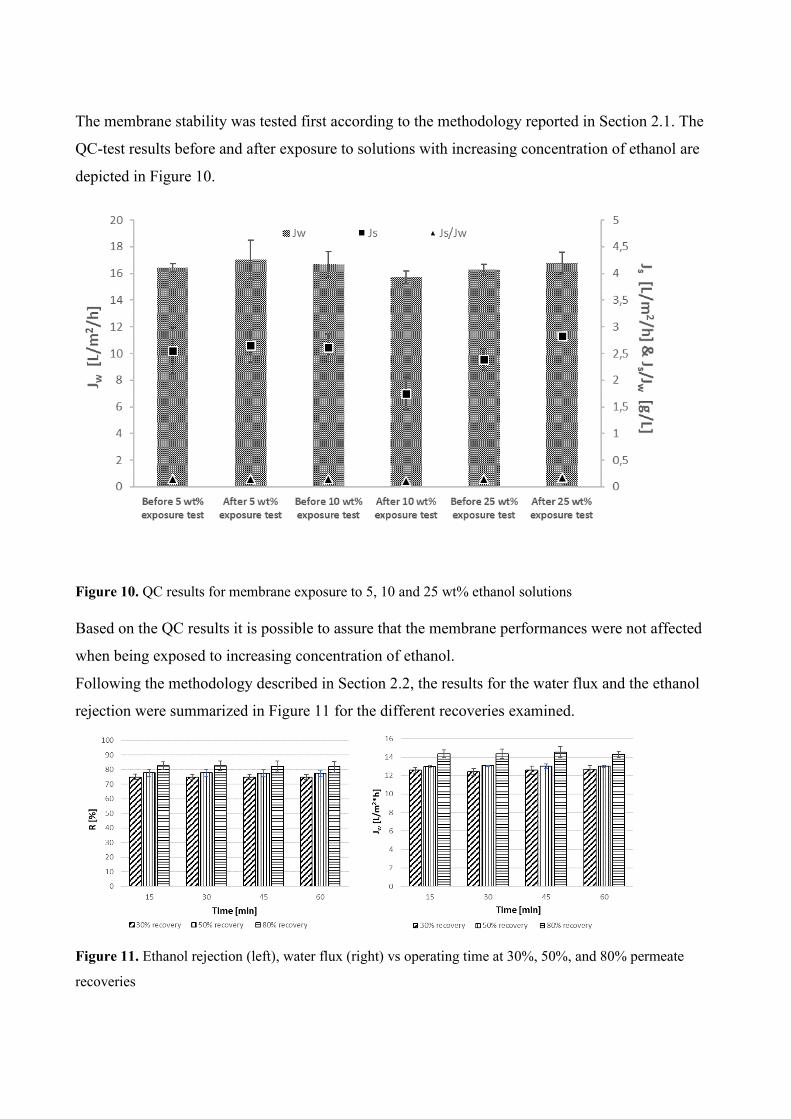
The membrane stability was tested first according to the methodology reported in Section 2.1. The
QC-test results before and after exposure to solutions with increasing concentration of ethanol are
depicted in Figure 10.
Figure 10. QC results for membrane exposure to 5, 10 and 25 wt% ethanol solutions
Based on the QC results it is possible to assure that the membrane performances were not affected
when being exposed to increasing concentration of ethanol.
Following the methodology described in Section 2.2, the results for the water flux and the ethanol
rejection were summarized in Figure 11 for the different recoveries examined.
Figure 11. Ethanol rejection (left), water flux (right) vs operating time at 30%, 50%, and 80% permeate
recoveries
From Figure 11 it is evident that the highest ethanol rejection and water flux are obtained for 80%
recovery. Moreover, their values are constant over the time. The flowrates of feed inlet, concentrate,
draw inlet and outlet corresponding to each recovery examined are provided as supplementary
material.
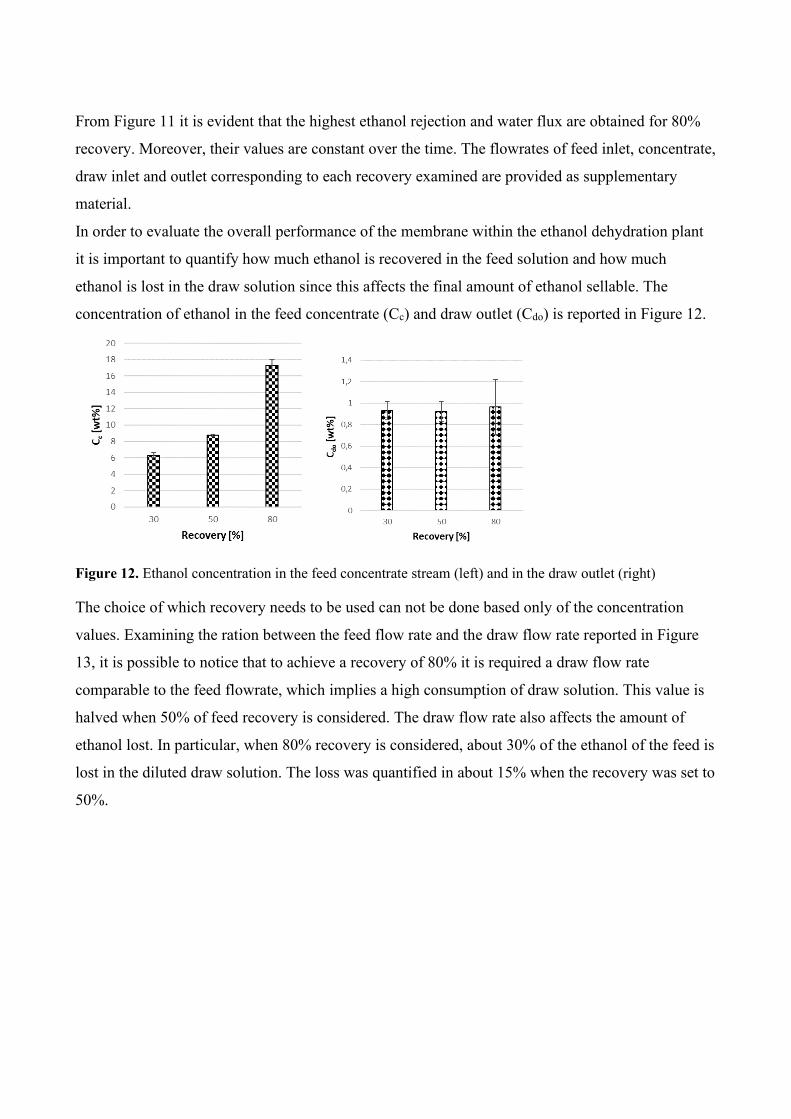
In order to evaluate the overall performance of the membrane within the ethanol dehydration plant
it is important to quantify how much ethanol is recovered in the feed solution and how much
ethanol is lost in the draw solution since this affects the final amount of ethanol sellable. The
concentration of ethanol in the feed concentrate (Cc) and draw outlet (Cdo) is reported in Figure 12.
Figure 12. Ethanol concentration in the feed concentrate stream (left) and in the draw outlet (right)
The choice of which recovery needs to be used can not be done based only of the concentration
values. Examining the ration between the feed flow rate and the draw flow rate reported in Figure
13, it is possible to notice that to achieve a recovery of 80% it is required a draw flow rate
comparable to the feed flowrate, which implies a high consumption of draw solution. This value is
halved when 50% of feed recovery is considered. The draw flow rate also affects the amount of
ethanol lost. In particular, when 80% recovery is considered, about 30% of the ethanol of the feed is
lost in the diluted draw solution. The loss was quantified in about 15% when the recovery was set to
50%.
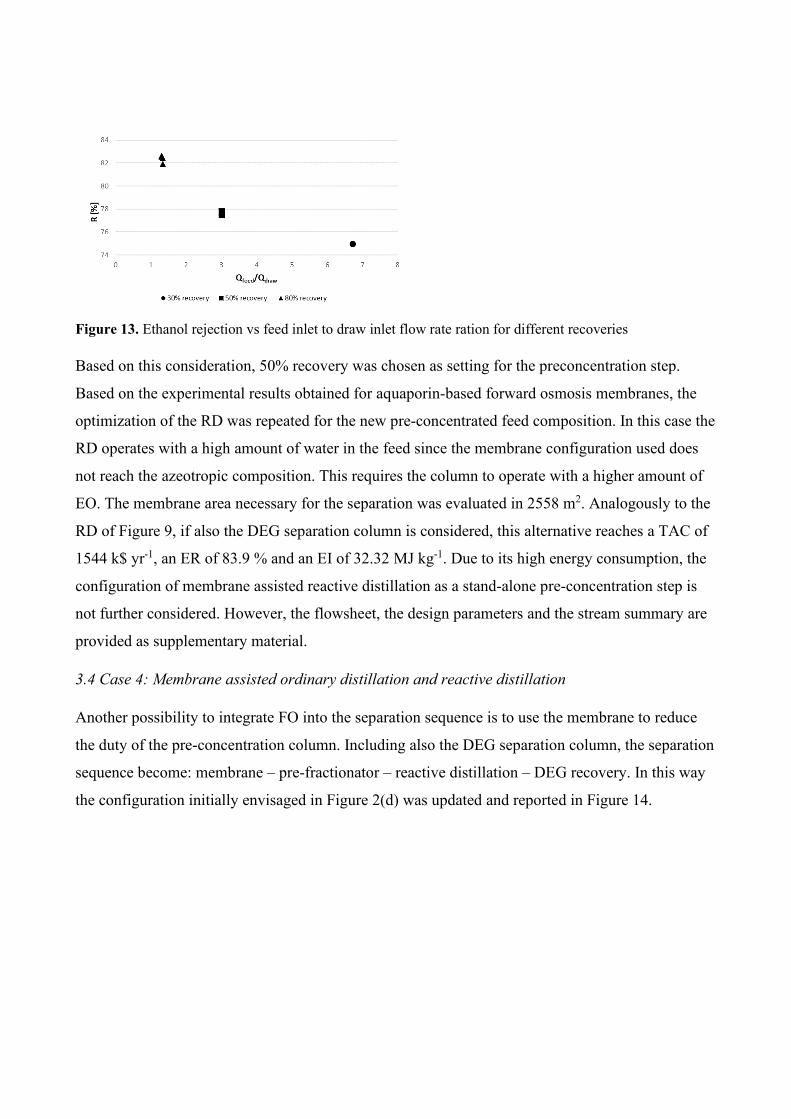
Figure 13. Ethanol rejection vs feed inlet to draw inlet flow rate ration for different recoveries
Based on this consideration, 50% recovery was chosen as setting for the preconcentration step.
Based on the experimental results obtained for aquaporin-based forward osmosis membranes, the
optimization of the RD was repeated for the new pre-concentrated feed composition. In this case the
RD operates with a high amount of water in the feed since the membrane configuration used does
not reach the azeotropic composition. This requires the column to operate with a higher amount of
EO. The membrane area necessary for the separation was evaluated in 2558 m2. Analogously to the
RD of Figure 9, if also the DEG separation column is considered, this alternative reaches a TAC of
1544 k$ yr-1, an ER of 83.9 % and an EI of 32.32 MJ kg-1. Due to its high energy consumption, the
configuration of membrane assisted reactive distillation as a stand-alone pre-concentration step is
not further considered. However, the flowsheet, the design parameters and the stream summary are
provided as supplementary material.
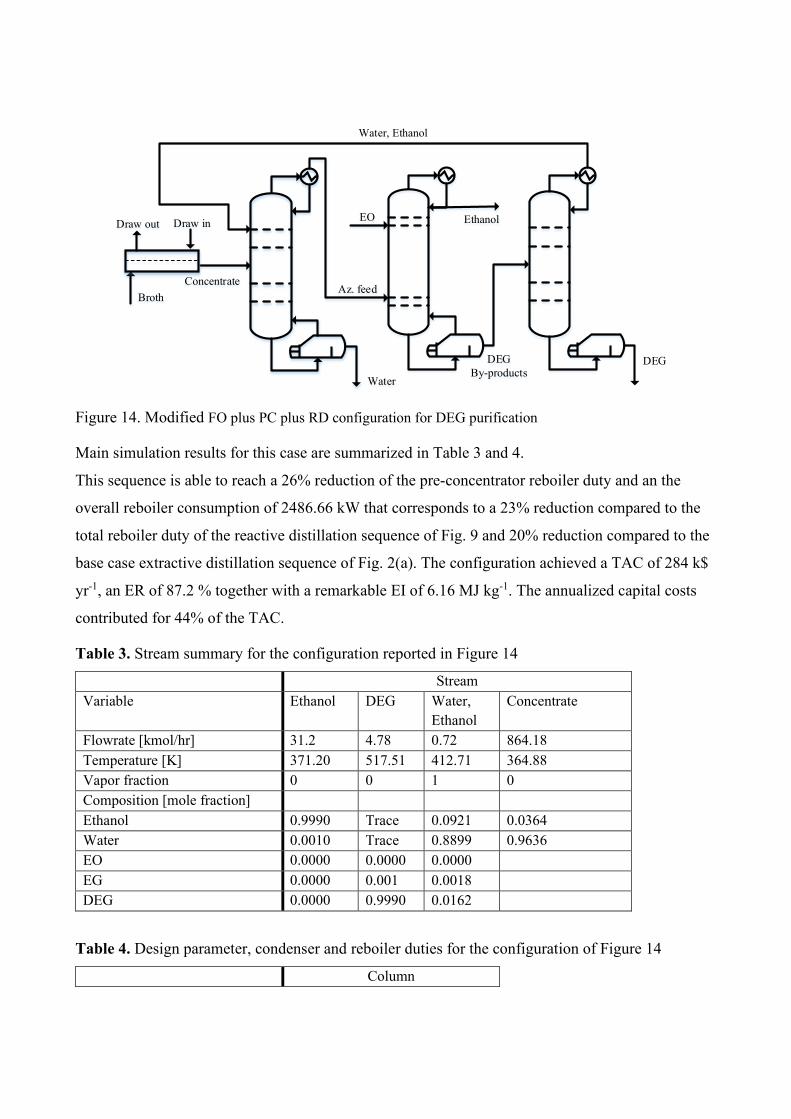
3.4 Case 4: Membrane assisted ordinary distillation and reactive distillation
Another possibility to integrate FO into the separation sequence is to use the membrane to reduce
the duty of the pre-concentration column. Including also the DEG separation column, the separation
sequence become: membrane – pre-fractionator – reactive distillation – DEG recovery. In this way
the configuration initially envisaged in Figure 2(d) was updated and reported in Figure 14.
Draw out Ethanol
DEG By-products
Concentrate
Draw in
Water
EO
Az. feedBroth
DEG
Water, Ethanol
Figure 14. Modified FO plus PC plus RD configuration for DEG purification
Main simulation results for this case are summarized in Table 3 and 4.
This sequence is able to reach a 26% reduction of the pre-concentrator reboiler duty and an the
overall reboiler consumption of 2486.66 kW that corresponds to a 23% reduction compared to the
total reboiler duty of the reactive distillation sequence of Fig. 9 and 20% reduction compared to the
base case extractive distillation sequence of Fig. 2(a). The configuration achieved a TAC of 284 k$
yr-1, an ER of 87.2 % together with a remarkable EI of 6.16 MJ kg-1. The annualized capital costs
contributed for 44% of the TAC.
Table 3. Stream summary for the configuration reported in Figure 14
Stream Variable Ethanol DEG Water,
Ethanol Concentrate
Flowrate [kmol/hr] 31.2 4.78 0.72 864.18 Temperature [K] 371.20 517.51 412.71 364.88 Vapor fraction 0 0 1 0 Composition [mole fraction] Ethanol 0.9990 Trace 0.0921 0.0364 Water 0.0010 Trace 0.8899 0.9636 EO 0.0000 0.0000 0.0000 EG 0.0000 0.001 0.0018 DEG 0.0000 0.9990 0.0162
Table 4. Design parameter, condenser and reboiler duties for the configuration of Figure 14
Column
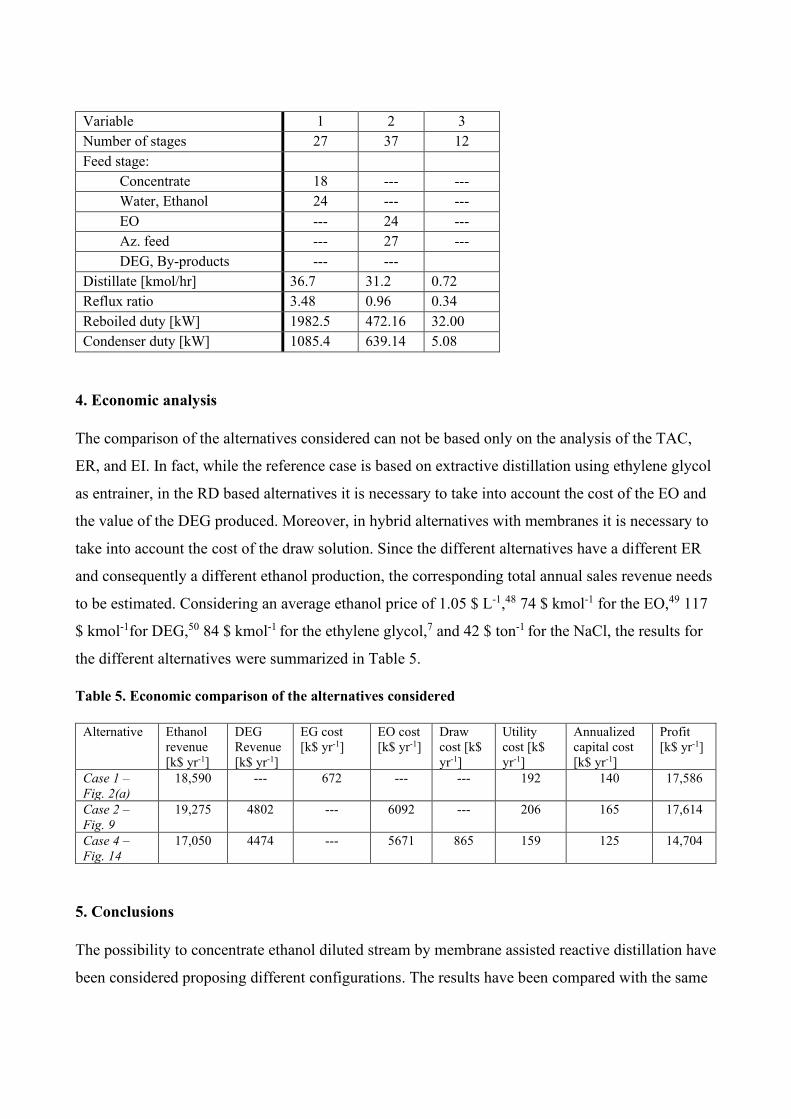
Variable 1 2 3 Number of stages 27 37 12 Feed stage: Concentrate 18 --- --- Water, Ethanol 24 --- --- EO --- 24 --- Az. feed --- 27 --- DEG, By-products --- --- Distillate [kmol/hr] 36.7 31.2 0.72 Reflux ratio 3.48 0.96 0.34 Reboiled duty [kW] 1982.5 472.16 32.00 Condenser duty [kW] 1085.4 639.14 5.08
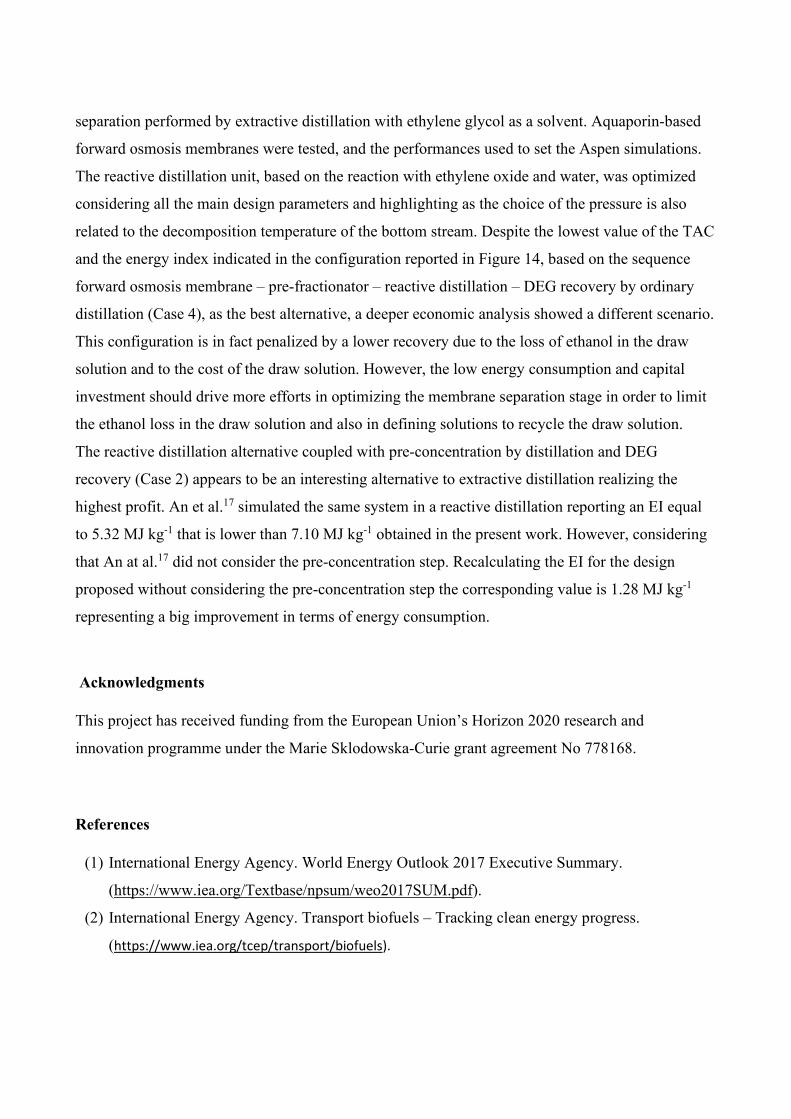
4. Economic analysis
The comparison of the alternatives considered can not be based only on the analysis of the TAC,
ER, and EI. In fact, while the reference case is based on extractive distillation using ethylene glycol
as entrainer, in the RD based alternatives it is necessary to take into account the cost of the EO and
the value of the DEG produced. Moreover, in hybrid alternatives with membranes it is necessary to
take into account the cost of the draw solution. Since the different alternatives have a different ER
and consequently a different ethanol production, the corresponding total annual sales revenue needs
to be estimated. Considering an average ethanol price of 1.05 $ L-1,48 74 $ kmol-1 for the EO,49 117
$ kmol-1for DEG,50 84 $ kmol-1 for the ethylene glycol,7 and 42 $ ton-1 for the NaCl, the results for
the different alternatives were summarized in Table 5.
Table 5. Economic comparison of the alternatives considered
Alternative Ethanol revenue [k$ yr-1]
DEG Revenue [k$ yr-1]
EG cost [k$ yr-1]
EO cost [k$ yr-1]
Draw cost [k$ yr-1]
Utility cost [k$ yr-1]
Annualized capital cost [k$ yr-1]
Profit [k$ yr-1]
Case 1 – Fig. 2(a)
18,590 --- 672 --- --- 192 140 17,586
Case 2 – Fig. 9
19,275 4802 --- 6092 --- 206 165 17,614
Case 4 – Fig. 14
17,050 4474 --- 5671 865 159 125 14,704
5. Conclusions
The possibility to concentrate ethanol diluted stream by membrane assisted reactive distillation have
been considered proposing different configurations. The results have been compared with the same
separation performed by extractive distillation with ethylene glycol as a solvent. Aquaporin-based
forward osmosis membranes were tested, and the performances used to set the Aspen simulations.
The reactive distillation unit, based on the reaction with ethylene oxide and water, was optimized
considering all the main design parameters and highlighting as the choice of the pressure is also
related to the decomposition temperature of the bottom stream. Despite the lowest value of the TAC
and the energy index indicated in the configuration reported in Figure 14, based on the sequence
forward osmosis membrane – pre-fractionator – reactive distillation – DEG recovery by ordinary
distillation (Case 4), as the best alternative, a deeper economic analysis showed a different scenario.
This configuration is in fact penalized by a lower recovery due to the loss of ethanol in the draw
solution and to the cost of the draw solution. However, the low energy consumption and capital
investment should drive more efforts in optimizing the membrane separation stage in order to limit
the ethanol loss in the draw solution and also in defining solutions to recycle the draw solution.
The reactive distillation alternative coupled with pre-concentration by distillation and DEG
recovery (Case 2) appears to be an interesting alternative to extractive distillation realizing the
highest profit. An et al.17 simulated the same system in a reactive distillation reporting an EI equal
to 5.32 MJ kg-1 that is lower than 7.10 MJ kg-1 obtained in the present work. However, considering
that An at al.17 did not consider the pre-concentration step. Recalculating the EI for the design
proposed without considering the pre-concentration step the corresponding value is 1.28 MJ kg-1
representing a big improvement in terms of energy consumption.
Acknowledgments
This project has received funding from the European Union’s Horizon 2020 research and
innovation programme under the Marie Sklodowska-Curie grant agreement No 778168.
References
(1) International Energy Agency. World Energy Outlook 2017 Executive Summary.
(https://www.iea.org/Textbase/npsum/weo2017SUM.pdf).
(2) International Energy Agency. Transport biofuels – Tracking clean energy progress.
(https://www.iea.org/tcep/transport/biofuels).

(3) Renewable Fuels Association. Annual Fuel Ethanol Production. U.S. and World Ethanol
Production. (https://ethanolrfa.org/statistics/annual-ethanol-production/).
(4) Mussarro, S. I.; Dragone, G.; Guimaraes, P. M. R.; Silva, P. A.; Carneiro, L. M.; Roberto, I.
C.; Vicente, A,; Domingues, L.; Teixeira, J. A. Technological trends, global market, and
challenges of bio-ethanol production. Biotechnology Advances 2010, 28 (6), 817-30.
(5) Seader, J. D.; Henley, E. J.; Roper, D. K. Separation Process Principles. Chemical and
Biochemical Operations; Wiley, 2011; 3rd Edition.
(6) Errico, M.; Rong, B.-G.; Tola, G.; Spano, M. Optimal synthesis of distillation systems for
bioethanol separation. Part 1: Extractive distillation with simple columns. Industrial &
Engineering Chemistry Research 2013, 52, 1612-9.
(7) Errico, M.; Rong, B.-G.; Tola, G.; Spano, M. Optimal synthesis of distillation systems for
bioethanol separation. Part 2: Extractive distillation with complex columns. Industrial &
Engineering Chemistry Research 2013, 52, 1620-6.
(8) Medina-Herrera, N.; Grossmann, I. E.; Mannan, M. S.; Jimenez-Gutierrez, A. An approach for
solvent selection in extractive distillation systems including safety considerations. Industrial &
Engineering Chemistry Research 2014, 53, 12023-31.
(9) Seider, W. D.; Seader, J. D.; Lewin, D. R.; Widagdo S. Product and Process Design
Principles. Synthesis, Analysis, and Evaluation; John Wiley & Sons, Inc., 2010; 3rd Edition.
(10) Kiss, A. A.; Suszwalak J.P. C. Enhanced bioethanol dehydration by etractive and azeotropic
distillation in dividing-wall columns. Separation and purification Technology 2012, 86, 70-8.
(11) Luyben, W. L. Economic optimum design of the heterogeneous azeotropic dehydration of
ethanol. Industrial & Engineering Chemistry Research 2012, 51, 16427-32.
(12) Kiran, B.; Jan, A. K. A hybrid heat integration scheme for bioethanol separation through
pressure-swing distillation route. Separation and Purification Technology 2015, 142, 307-15.
(13) Mulia-Soto, J. F.; Flores-Tlacuahuac, A. F. Modeling, simulation and control of an
internally heat integrated pressure-swing distillation process for bioethanol separation.
Computers & Chemical Engineering 2011, 35, 1532-46.
(14) Tavan, Y.; Hosseini, S. H. A novel integrated process to break the ethanol/water azeotrope
using reactive distillation – Part I: Parametric study. Separation and Purification Technology
2013, 118, 455-62.

(15) Lu, S.; Lei, Z.; Wu, J.; Yang, B. Dynamic control analysis for manufacturing ethanol via
reactive distillation. Chemical Engineering and Processing: Process Intensification 2011, 50,
1128-36.
(16) Guzman-Martinex, C. E.; Castro-Montoya, A. J.; Napoles-Rivera, F. Economic and
environmental comparison of bioethanol dehydration process via simulation: reactive
distillation, reactor-separator process and azeotropic distillation. Clean Technologies and
Environmental Policy 2019, 21, 2061-71.
(17) An, W.; Lin, W.; Chen, J.; Zhu, J. Simulation and analysis of a reactive distillation for
removal of water from ethanol-water mixtures. Industrial & Engineering Chemistry
Research 2014, 53, 6056-64.
(18) Kaymak, D. B. Design and control of an alternative bioethanol purification process via
reactive distillation from fermentation broth. Industrial & Engineering Chemistry Research
2019, 58, 1675-85.
(19) Cardenas-Guerra, J. C.; Figueroa-Gerstenmaier, S.; Reyes-Aguilera, J. A.; Hernandez, S.
Simulation study of a reactive distillation process for the ethanol production. Chemical
Engineering Transaction 2018, 69, 613-8.
(20) Wang, Y.; Gong, C.; Sun, J.; Gao. H.; Zheng, S.; Xu, S. Separation of ethanol/water
azeotrope using compound starch-based adsorbents. Bioresource Technology 2010, 101,
6170-6.
(21) Karimi, S.; Yaraki, M. T.; Karri, R. R. A comprehensive review of the adsorption
mechanisms ad factors influencing the adsorption process from the perspective of bioethanol
dehydration. Renewable and Sustainable Energy Reviews 2019, 107, 535-53.
(22) Baker, R. W. Membrane Technology and Applications. John Wiley & Sons Ltd, 2004; 2nd
Edition.
(23) Khalid, A.; Aslam, M.; Qyyum, M. A.; Faisal, A.; Khan, A. L.; Ahmed, F.; Lee, M.; Kim, J.;
Jang, N.; Chang, I. S.; Bazmi, A. A.; Yasin, M. Membrane separation processes for
dehydration of bioethanol from fermentation broths: Recent developments, challenges, and
prospects. Renewable and Sustainable Energy Reviews 2019, 105, 427-43.
(24) Triana, C. F.; Fraga, E. S.; Sorensen, E. Energy assessment of different configurations for
the ethanol production from lignocellulosic biomass. Computer Aided Chemical
Engineering 2015, 37, 2285-90.

(25) Wei, P.; Cheng, L.-H.; Zhang, L.; Xu, X.-H.; Chen, H.-l.; Gao, C.-j. A review on membrane
technology for bioethanol production. Renewable and Sustainable Energy Reviews 2014,
30, 388-400.
(26) Lipnizki, F. Membrane process opportunities and challenges in the bioethanol industry.
Desalination 2010, 250(3), 1067-9.
(27) Errico, M. Process synthesis and intensification of hybrid separations. In: Process Synthesis
and Process Intensification. Methodological Approaches. Walter de Gruyter GmbH, 2017
(28) Aviles Martinez, A.; Saucedo-Luna, J.; Segovia-Hernandez, J. G.; Hernandez, S.; Gomez-
Castro F. I.; Castro-Montoya, A. J. Dehydration of bioethanol by hybrid process liquid-
liquid/extractive distillation. Industrial & Engineering Chemistry Research 2011, 52, 5847-
55.
(29) Skiborowski, M.; Wessel, J.; Marquardt, W. Efficient optimization-based design of
membrane-assisted distillation processes. Industrial & Engineering Chemistry Research
2014, 53, 15698-717.
(30) Roth, T.; Kreis, P.; Gorak, A. Process analysis and optimization of hybrid processes for the
dehydration of ethanol. Chemical Engineering Research and Design 2013, 91, 1171-85.
(31) Shen, M.; Keten, S.; Lueptow, R.M. Rejection mechanisms for contaminants in polyamide
reverse osmosis membranes. Journal of Membrane Science 2016, 509, 36–47.
(32) Ambrosi, A.; Al-Furaiji, M.; McCutcheon, J.R.; Cardozo, N. S. M.; Tessaro, I. C. Transport
of Components in the Separation of Ethanol from Aqueous Dilute Solutions by Forward
Osmosis. Ind. Eng. Chem. Res. 2018, 57, 2967−2975.
(33) Rezzadori, K; Penha, F.M.; Proner, M.C.; Zin, V; Petrus, J.C.C.; Di Luccio, M. Impact of
Organic Solvents on Physicochemical Properties of nanofiltration and reverse osmosis
membranes. Chem. Eng. Technol. 2019, 42(12), 2700–2708.
(34) Tang, C.Y.; Zhao, Y.; Wang, R.; Hélix-Nielsen, C.; Fane, A.G. Desalination by biomimetic
aquaporin membranes: review of status and prospects, Desalination 2013, 308, 34–40.
(35) Kalafatakis, S.; Braekevelt, S.; Carlsen, V.; Lange, L.; Skiadas, I.V.; Gavala, H.N. On a
novel strategy for water recovery and recirculation in biorefineries through application of
forward osmosis membranes. Chemical Engineering Journal 2017, 311 209–216.
(36) Torres-Ortega, C. E.; Rong, B.-G. Synthesis, design, and rigorous simulation of the
bioethanol recovery and dehydration from an actual lignocellulosic fermentation broth.
Industrial & Engineering Chemistry Research 2016, 55, 210-25.

(37) Vane, L. M.; Alvarez, F. R.; Rosenblum, L.; Govindaswamy, S. Efficient ethanol recovery
from yeast fermentation broth with integrated distillation-membrane process. Industrial &
Engineering Chemistry Research 2013, 52(3), 1033-41.
(38) Huang, H.-J.; Ramaswamy, S.; Tschirner, U. W.; Ramarao, B. V. A review of separation
technologies in current and future biorefineries. Separation and Purification Technology
2008, 62, 1-21.
(39) Ciric, A. R.; Gu, D. Synthesis of nonequilibrium reactive distillation processes by MINLP
optimization. AIChE Journal 1994, 40(9), 1479-87.
(40) Al-Arfaj, M. A.; Luyben, W. L. Control of ethylene glycol reactive distillation column.
AIChE Journal 2002, 48(4), 905-8.
(41) Altiokka, M. R.; Akyalcin, S. Kinetics of Hydration of ethylene oxide in the presence of
heterogeneous catalyst. Industrial & Engineering Chemistry Research, 48(24), 10840-4.
(42) Tavan, Y.; Hosseini, S. H. A novel integrated process to break the ethanol/water azeotrope
using reactive distillation – Part 1: Parametric study. Separation and Purification
Technology 2013, 118, 455-462.
(43) Okasinski, M. J.; Doherty, M. F. Design method for kinetically controlled, staged reactive
distillation columns. Industrial & Engineering Chemistry Research 1998, 37, 2821-34.
(44) Beach, R. K. The use of ethylene glycol solutions in heating systems. National Research
Council of Canada, Technical note No. 388 (https://doi.org/10.4224/20358957).
(45) U.S. National Library of Medicine, TOXNET Toxicology Data Network
(https://toxnet.nlm.nih.gov/)
(46) Jaime-Leal, J. E.; Bonilla-Petriciolet A., Segovia-Hernandez, J. G.; Hernandez, S.;
Hernandez-Escoto, H. On the multiple solutions of the reactive distillation column for
production of fuel ethers. Chemical Engineering and Processing: Process Intensification
2013, 72, 31-41.
(47) Tronci, S.; Grosso, M.; Alvarez, J.; Baratti, R. On the global nonlinear stochastic dynamical
behavior of a class of exothermic CSTRs 2011, 21, 1250-1264.
(48) Global Petrol Prices (https://www.globalpetrolprices.com/ethanol_prices)
(49) Seider, W.D.; Lewin, D.R.; Seader, J.D.; Widagdo, S.; Gani, R.; Ng, K.M. Product and
Process Design Principles. Synthesis, Analysis, and Evaluation. 4th Ed. 2017, Wiley.
(50) Intratec (https://www.intratec.us/chemical-markets/diethylene-glycol-price)