Deep Contextual Clinical Prediction with Reverse Distillation
Upload
khangminh22Category
view
3download
0
Vapor-liquid equilibrium and distillation of mixtures
containing formaldehdye and poly(oxymethylene)
dimethyl ethers
Niklas Schmitza,c, Christian F. Breitkreuza,c, Eckhard Strofera,c,Jakob Burgerb,c,∗, Hans Hassea,c
aUniversity of Kaiserslautern, Laboratory of Engineering Thermodynamics (LTD),Erwin-Schrodinger-Strasse 44, 67663 Kaiserslautern, Germany
bTechnical University of Munich, Chair of Chemical Process Engineering, Schulgasse 22,94315 Straubing, Germany
cOME Technologies GmbH, Kaiserslautern, Germany
Abstract
Poly(oxymethylene) dimethyl ethers (OME, H3C−O−(CH2O)n−CH3) are
promising synthetic diesel fuels. For designing OME production processes,
a model for describing the vapor-liquid equilibrium (VLE) in mixtures of
(formaldehyde + water + methanol + methylal + OME + trioxane) is
needed. Building on previous work of our group, a phyisco-chemical model
for the VLE in these mixtures is developed in the present work. For the
development and the testing of the model, experiments of different types
were carried out: VLE measurements in a thin film evaporator, batch evap-
oration experiments in an open still, and continuous distillation experiments
in a laboratory column. The model predicts the results of the distillation
experiments well. It is shown that OME with n ≥ 3 can be separated as
bottom product from mixtures of formaldehyde, water, methanol, methylal,
∗Corresponding author:Email address: [email protected] (Jakob Burger)
Preprint submitted to Chem. Eng. Process. June 21, 2018
and OME with n ≥ 2. This separation is a critical step in a novel OME
production process that increases the sustainability of OME production.
Highlights:
• A model for describing the vapor-liquid equilibrium (VLE) in mixtures of
(formaldehyde + water + methanol + methylal + OME + trioxane) is
presented.
• The VLE model is successfully used for describing batch evaporation and
continuous distillation experiments.
• OME with n ≥ 3 are separated from a complex reactive multicomponent
mixture by distillation.
Keywords: Poly(oxymethylene) dimethyl ethers (OME), Formaldehyde,
Vapor-liquid equilibrium, Distillation
1. Introduction
Poly(oxymethylene) dimethyl ethers (OME) are oxygenates of the struc-
ture H3C−O−(CH2O)n−CH3 with n ≥ 2. OME of chain lengths n = 3 − 5
are environmentally-benign diesel fuels, which reduce the soot and indirectly
also the NOx formation in engines [1–4]. OME can also be used as fuels in
fuel cells [5, 6], as green solvents for producing hydrogen peroxide [7], and as
physical solvents for the absorption of CO2 from natural gas [8, 9].
Recent studies suggest to produce OME (n = 3 − 5) directly from
formaldehyde and methanol in an aqueous environment [10–15]. This route
avoids the production of further intermediates, such as trioxane and methylal.
In these processes, the reactor outlet is a complex multicomponent mixture
2
containing the overall components formaldehyde, water, methanol, methylal,
and OME of various chain lengths. Small amounts of trioxane are found as
by-product [14]. In these mixtures, formaldehyde (FA, CH2O) reacts with
water (H2O) to poly(oxymethylene) glycols (MGn , HO−(CH2O)n−H) and
with methanol (MeOH, H3C−OH) to poly(oxymethylene) hemiformals (HFn ,
HO−(CH2O)n−CH3) [16, 17], c.f. reactions (1) to (4).
FA + H2O −−⇀↽−− MG1 (1)
FA +MGn−1−−⇀↽−− MGn ; n ≥ 2 (2)
FA +MeOH −−⇀↽−− HF1 (3)
FA + HFn−1−−⇀↽−− HFn ; n ≥ 2 (4)
The chemical equilibrium of reactions (1) and (3) in the liquid phase is
far on the side of the products, i.e. the amount of monomeric formaldehyde
in these solutions is very small. For the design of OME production processes,
a model for describing the vapor-liquid-equilibrium (VLE) in these mixtures
is needed. Such a model is developed here. Wherever no acidic catalysts are
present, e.g. in the distillation columns, methylal, OME and trioxane are
considered to be chemically inert [14, 18, 19]. However, reactions (1) to (4)
are taken into account explicitly following the pioneering work of Maurer [20].
Whereas, experimental data on the liquid-liquid equilibrium (LLE) in
various OME-containing systems are available [14], only few experimental
data are available on the VLE in systems containing OME. Schappals et
al. [9] measured the gas solubility of CO2 in OME2, OME3, and OME4,
respectively. Song et al. [21] measured the VLE in the systems (methy-
lal + OME2) and (methanol + OME2) at atmospheric pressure. Burger et
3

al. [22] measured the VLE in the system (OME2 + trioxane) at 696 mbar and
889 mbar. This work extends the experimental data by VLE measurements
in the systems (formaldehyde + water + OME2) and (formaldehyde + wa-
ter + methanol + OME2) at 950 mbar. The latter system is studied at low
water concentrations.
Furthermore, batch evaporation and continuous distillation experiments
were carried out in the present work. Two batch evaporation experiments
with mixtures of (formaldehyde + water + me-thanol + OME + triox-
ane) were carried out in an open still. The continuous distillation experi-
ments were carried out in a DN50 distillation column in mixtures of (wa-
ter + methanol + methylal + OME2 + trioxane) and (formaldehyde + wa-
ter + methanol + OME2 + OME3 + trioxane). For each system, two contin-
uous distillation experiments were carried out at varying reflux ratios. The
batch evaporation and distillation experiments were carried out at atmo-
spheric pressure.
Recently, a new process for producing OME has been described, in which
OME with n ≥ 3 are separated from mixtures of formaldehyde, water,
methanol, methylal, and OME with n ≥ 2 by distillation [23]. The two
batch evaporation experiments and the continuous distillation experiments
in the system that were carried in the present work, prove the feasibility of
this separation.
Starting with the work of Maurer [20], a physico-chemical model for de-
scribing the VLE and the LLE in formaldehyde-containing mixtures has been
developed and tested in our group [16–20, 24–32]. In the model, the non-
ideality in the liquid phase is described using a UNIFAC-based activity co-
4
efficient model. The chemical reactions (1) to (4) are explicitly considered.
Ott et al. [33] showed that this is necessary to obtain reliable simulations of
distillation of formaldehyde-containing mixtures.
Of particular relevance for the present work is the model of Kuhnert et
al. [19] It was tested using experimental data for VLE and LLE in the sys-
tem (formaldehyde + water + methanol + methylal) [19] and was successfully
used for describing distillation in a methylal production process [34]. That
model was recently extended to include also OME with n ≥ 2 [32]. The
extension was, however, parametrized and validated using only LLE and not
VLE in OME-containing systems. This gap is closed in the present work.
Both, the experimental VLE data obtained in the present work and the lit-
erature data are used and a new model version is reported. Furthermore,
trioxane is added to the model by adopting further interaction parameters
from the work of Albert [18], who described the system (formaldehyde + wa-
ter + methanol + trioxane). As a result, the system (formaldehyde + wa-
ter + methanol + methylal + OME + trioxane) is described by the model,
which is developed in the present work.
It is shown that the new physico-chemical model gives a good description
of the VLE experiments, as well as that it can be used for describing the
batch evaporation and continuous distillation experiments. For the batch
evaporation experiments, the experimental composition and the tempera-
ture of the liquid residue are compared to calculations of the residue curve
using Rayleigh’s equation [35], where it is assumed that the emerging va-
por is in equilibrium with the liquid residue. For the continuous distillation
experiments, the experimental concentration and temperature profiles are
5
compared to simulations combining the new physico-chemical model with
the equilibrium-stage model of a distillation column.
2. Experiments
2.1. Chemicals
Paraformaldehyde (≥ 0.95 g/g) was obtained from Carl Roth. Ultra-
pure Milli-Q water was produced with a purification system from Merck.
Aqueous and methanolic formaldehyde solutions were prepared by dissolving
paraformaldehyde in water and methanol, respectively, at elevated tempera-
tures. The procedure is described elsewhere [14]. Methanolic formaldehyde
solutions were dried over Zeolite 3A obtained from Carl Roth. As the solu-
tions could not be dried completely, instead of studying the VLE in the sys-
tem (formaldehyde + methanol + OME2), the system (formaldehyde + wa-
ter + methanol + OME2) was studied at low water concentrations. OME2
(≥ 0.985 g/g) and OME3 (0.83 g/g, containing 0.17 g/g trioxane) were pro-
vided by OME Technologies GmbH. OME3 with trioxane as impurity was
only used in the evaporation and distillation experiments. Trioxane was con-
sidered in the analysis. For safety reasons, all mixtures were checked to be
free of peroxides using a colorimetric peroxide test from Merck before used
in the experiments.
2.2. Vapor-liquid equilibrium
The VLE was measured in a thin-film evaporator. The experimental
set-up and procedure are described in the work of Hasse [36] and Albert et
al. [26] and are not repeated here. The temperature was measured with a
6
Pt100 resistance thermometer with an accuracy of ± 0.1 K. All experiments
were carried out at a pressure of 950 ± 0.5 mbar. The pressure was measured
with a pressure sensor with a relative accuracy of ± 0.4 %.
2.3. Batch evaporation
Batch evaporation experiments were carried out in a three-neck round
bottom flask (volume 500 mL), which was heated with an electrical heating
jacket. About 300 mL of liquid were filled in the round bottom flask. The
mixture in the flask was heated slowly and evaporated over a period of about
3 hours. The temperature of the liquid residue was measured with a Pt100
resistance thermometer (introduced through a seal in one of the necks) with
an accuracy of± 0.1 K. Samples of the liquid residue were withdrawn through
a septum that was connected to another neck of the flask. The third neck of
the flask was connected to a Liebig condenser, where the emerging vapor was
condensed and then collected in a flask. The batch evaporation experiments
were carried out at ambient pressure, which was determined with a mercury
pressure meter with an accuracy of about ± 10 mbar.
2.4. Continuous distillation
Distillation experiments were carried out in a continuously-operated lab-
oratory glass distillation column with 50 mm inner diameter from Iludest.
Details on the set up of the column are given in the work of Drunsel [37] and
Weidert et al. [34] The column consists of six sections, each containing 0.48 m
structured packing Sulzer CY. The temperatures were measured in the re-
boiler, after each section, and at the top of the column using Pt100 resistance
thermometers with an accuracy of ± 0.3 K. The pressure was measured at
7
the top of the column using a pressure sensor. The accuracy is ± 0.5 mbar.
The pressure drop along the column was measured with a membrane differ-
ential pressure sensor. The column is equipped with an electrically heated
thermosyphon reboiler. An inert atmosphere was established by through-flow
of gaseous nitrogen. The feed was preheated and the feed temperature was
controlled. The mass flows of the feed and the reflux were also controlled.
They were both measured by coriolis flow meters from Rheonik. The relative
accuracy of the flow meters is ± 0.5 %. The mass flows of the distillate and
the bottom product were measured with scales: the change of mass with time
was linearly regressed to obtain the mass flows. In preliminary experiments,
the relative accuracy of this method was determined to be ± 5 % by com-
paring with mass flows measured with the flow meters. The heat duty of the
reboiler, which is the remaining degree of freedom for steady-state operation,
was set to a constant value.
For the start-up, the reboiler of the column was filled with the feed mix-
ture and heated and the column was operated at infinite reflux. Then the
feed mass flow, the reflux mass flow, and the heat-duty of the reboiler were
set. Steady-state was achieved after several hours of operation, typically 7 - 8
hours were needed. This was checked by monitoring the temperature profiles
and, in addition, by consecutive sampling at selected sections of the column.
After steady-state was achieved, the column was operated for at least one
more hour until a set of samples from the liquid phase was drawn from all
sections of the column, from the feed, and from the distillate and the bottom
product, respectively.
8
2.5. Analysis
In reactive mixtures of formaldehyde, water, methanol, and inert compo-
nents, as they are studied here, the composition can be described in two dif-
ferent ways. The true concentrations account for the poly(oxymethylene) gly-
cols and poly(oxymethylene) hemiformals. In the present work, only overall
concentrations were measured. Thereby the formation of poly(oxymethylene)
glycols and poly(oxymethylene) hemiformals is disregarded, i.e. these species
are treated as if they were split into formaldehyde, water, and methanol.
The overall mass fractions of methanol, methylal, all OME, and trioxane
were measured by gas chromatography using 1,4-dioxane as internal stan-
dard and a flame ionization detector for signal detection. The details of
the chromatographic method were published previously [14]. The relative
accuracy is 5 % for the overall mass fraction of methanol and 2 % for the
overall mass fractions of all other components [14] The overall mass fraction
of formaldehyde was measured with the sodium sulfite titration method with
a relative accuracy of 2 % [14]. The overall mass fraction of water was mea-
sured by Karl Fischer titration with a relative accuracy of 2 % [14]. All vapor
phase samples of the VLE measurements in the system (formaldehyde + wa-
ter + OME2) separated into two liquid phases upon condensation. Methanol
was added to those samples prior to the analysis, such that a monophasic
system was obtained. Methanol has a very strong solubilizing effect on the
miscibility gap of OME and water [32].
9
3. Physico-chemical model
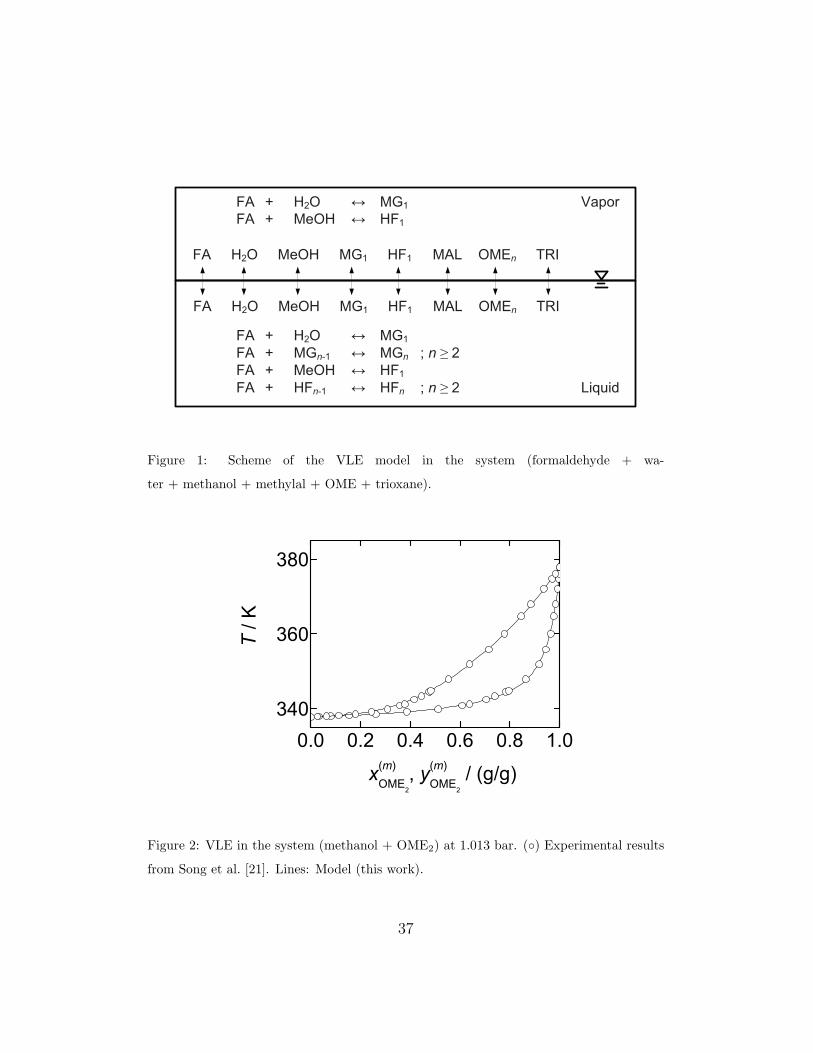
A scheme of the VLE in the system (formaldehyde + water + methanol +
methylal + OME + trioxane) is shown in Figure 1. The chemical equilibrium
of reactions (1) to (4) in the liquid phase is described by activity-based
chemical equilibrium constants, as given in Eqs. (5) to (8),
Ka,MG1(T ) =aMG1
aFA · aH2O
(5)
Ka,MGn(T ) =aMGn
aFA · aMGn−1
; n ≥ 2 (6)
Ka,HF1(T ) =aHF1
aFA · aMeOH
(7)
Ka,HFn(T ) =aHFn
aFA · aHFn−1
; n ≥ 2 (8)
where ai = xi ·γi are the activities and γi are the activity coefficients of com-
ponent i. Temperature-dependent correlations for describing the chemical
equilibrium constants were taken from Drunsel et al. [38] and are given in
Table 1. For all calculations, the maximal chain length of poly(oxymethylene)
glycols and poly(oxymethylene) hemiformals in the liquid phase is limited to
n = 10. The VLE is calculated from the extended Raoult’s law. The vapor
phase is assumed to be a mixture of ideal gases. Poly(oxymethylene) gly-
cols and poly(oxymethylene) hemiformals with n ≥ 2 are not considered in
the vapor phase. The chemical equilibrium of reactions (1) and (3) in the
vapor phase is modeled indirectly by combining the chemical equilibrium in
the liquid phase and the phase equilibrium. Vapor-pressure correlations for
all components were adopted from the literature and are given in the Sup-
plementary Information. The non-ideality of the liquid phase is described
using a UNIFAC-based activity coefficient model of the system. The struc-
10
tural groups in the system (formaldehyde + water + methanol + methy-
lal + OME + trioxane) are given in Table 2, which also contains the size and
surface parameters R and Q of the groups. The UNIFAC group assignment is
given in Table 3. Monomeric formaldehyde, water, methanol, methylal, and
trioxane are modeled as individual groups. An OME of chain length n con-
sists of one H3C−O−CH2O−CH3 group (methylal) and (n− 1) (CH2O)OME
groups [32].
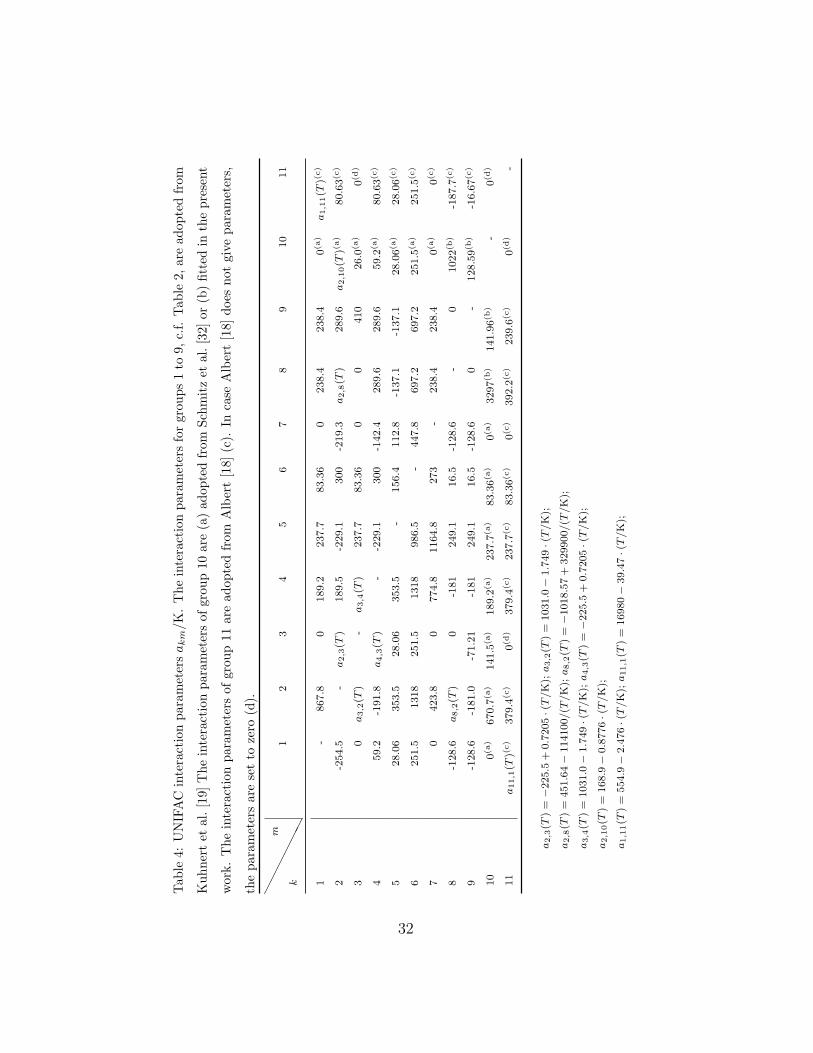
The UNIFAC group interaction parameters are given in Table 4. Interac-
tion parameters between groups 1 - 9 were adopted from Kuhnert et al. [19]
without modification. They were originally fitted to VLE and LLE data
in the system (formaldehyde + water + methanol + methylal). Schmitz
et al. [32] suggested to add one more UNIFAC group, namely the group
(CH2O)OME to consider OME, and report interaction parameters of that
group with groups 1 - 9. However, it turns out that the parametrization,
which was established using LLE data, does yield a good description of VLE
in the system (formaldehyde + water + methanol + OME). Therefore, the
interaction parameters between groups (CH2O)OME and CH3OH, as well as
those between groups (CH2O)OME and CH2OH were fitted to experimen-
tal VLE data in the present work, as described in more detail below. The
remaining parameters of group (CH2O)OME were adopted from Schmitz et
al. [32] without any changes.
The interaction parameters between group (CH2O)OME and group CH3OH
(parameters a9,10 and a10,9, c.f. Table 4) were fitted in the present work to the
binary VLE of the system (methanol + OME2) measured by Song et al. [21]
In the parameter fit, the temperature and the pressure were set and the devi-
11
ation between the experimental and calculated mass fractions of methanol in
the vapor and the liquid phase were minimized using a maximum-likelihood
method. The uncertainty of the mass fraction of methanol in both phases
from the measurements of Song et al. [21] was assumed to be 2 %.
The interaction parameters between group (CH2O)OME and group CH2OH
(parameters a8,10 and a10,8, c.f. Table 4) were fitted in the present work to
the VLE data in the system (formaldehyde + water + methanol + OME2),
which were measured in the present work. Group CH2OH is part of hemi-
formal and poly(oxymethylene) hemiformals, c.f. Table 3. In the parameter
fit, the overall composition of the liquid phase and the pressure were set and
the deviation between the experimental and calculated overall mass fractions
of all components in the vapor phase were minimized. Adding the deviation
between the experimental and calculated temperature as an additional ob-
jective did not improve the fit. Again, a maximum-likelihood method was
used for the parameter fit. The uncertainty of the overall mass fractions of
all components in the vapor phase was considered as discussed in Section
2.5. All parameter fits were carried out using the software gProms Model
Builder V. 3.7.1 (Process Systems Enterprise).
All interaction parameters of group (CH2O)3 (trioxane) were adopted
from Albert [18], who describes a VLE model of the system (formalde-
hyde + water + methanol + trioxane). The work of Albert [18] contains
no information on parameters for the interactions of group (CH2O)3 with
groups H3C−O−CH2O−CH3 and (CH2O)OME. These two groups are used
here to model methyal and OME, c.f. Table 3. To describe the system
(formaldehyde + water + methanol + methylal + OME + trioxane) in the
12

present work, these parameters are set to zero. This is motivated by mea-
surements of Burger et al. [22], who report that the binary VLE in the system
(OME2 + trioxane) is almost ideal.
The fit of the UNIFAC interaction parameters in the present work ex-
clusively affects the activity coefficients in OME-containing systems with
formaldehyde and/or methanol. In our previous work, we have investigated
the LLE in the system (water + methanol + OME) [32] and distillation
boundaries in the system (formaldehyde + methanol + OME) [23] using
the previous model that was established using only LLE data. It is shown
in the Supplementary Information that the new model of the present work
still provides a good description of the LLE and that the calculation of the
distillation boundaries is not significantly influenced. In addition, in previ-
ous work, we have determined activity-based chemical equilibrium constants
of the acid-catalyzed OME formation form formaldehyde and methanol in
aqueous solutions [14]. When used together with the new activity coeffi-
cient model, the numbers for these chemical equilibrium constants should be
modified as described in the Supplementary Information.
4. Results and discussion
4.1. Vapor-liquid equilibrium
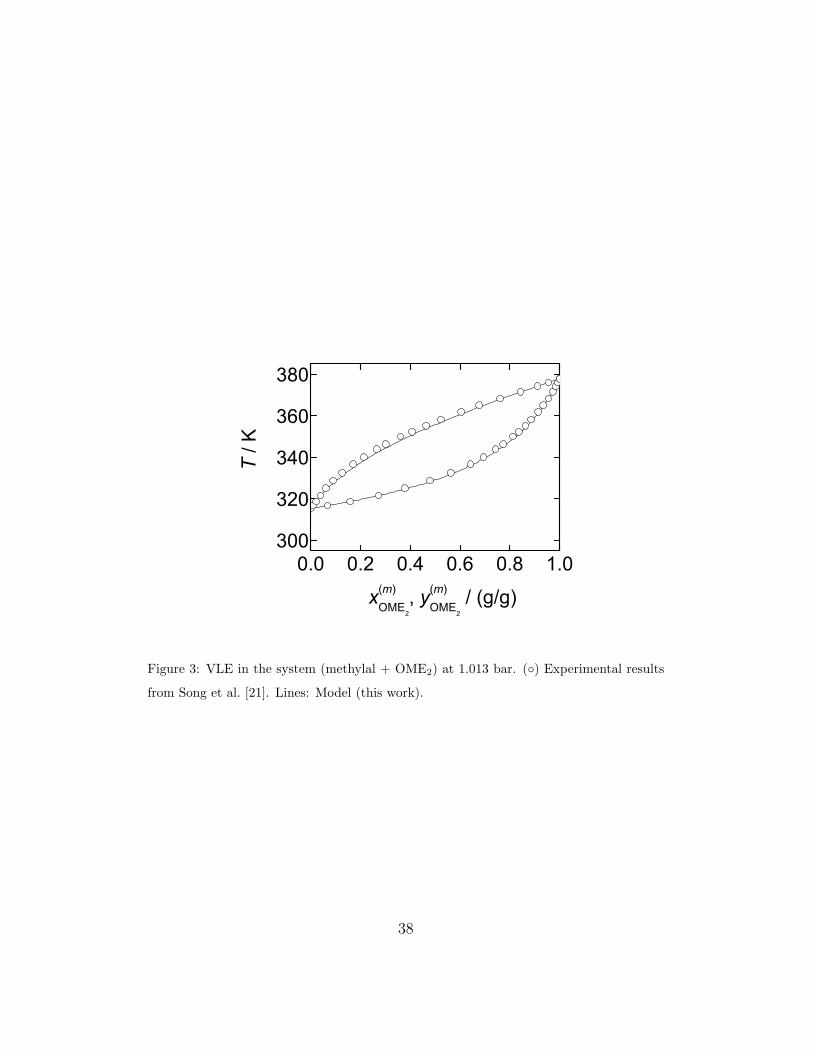
Figure 2 shows the VLE in the system (methanol + OME2) and Figure 3
shows the VLE in the system (methylal + OME2). Both systems are studied
at 1.013 bar. The model of the present work describes the experimental
VLE data from Song et al. [21] well. For the system (methanol + OME2),
two interaction parameters were fitted to the experimental VLE data (see
13

above), whereas for the system (methylal + OME2), the model results are
predictions. At the experimental pressure and temperature, the arithmetic
mean of the absolute deviations between the mass fraction of OME2 in both
phases is 0.008 g/g for the system (methanol + OME2) and 0.012 g/g for the
system (methylal + OME2).
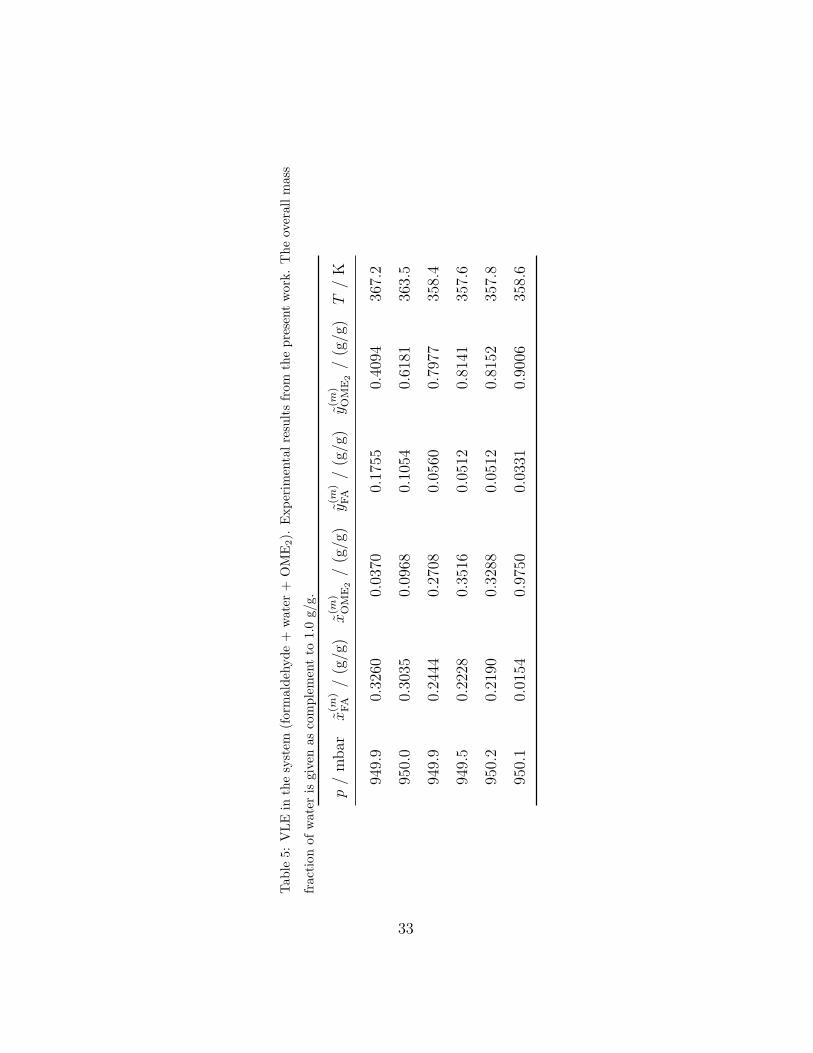
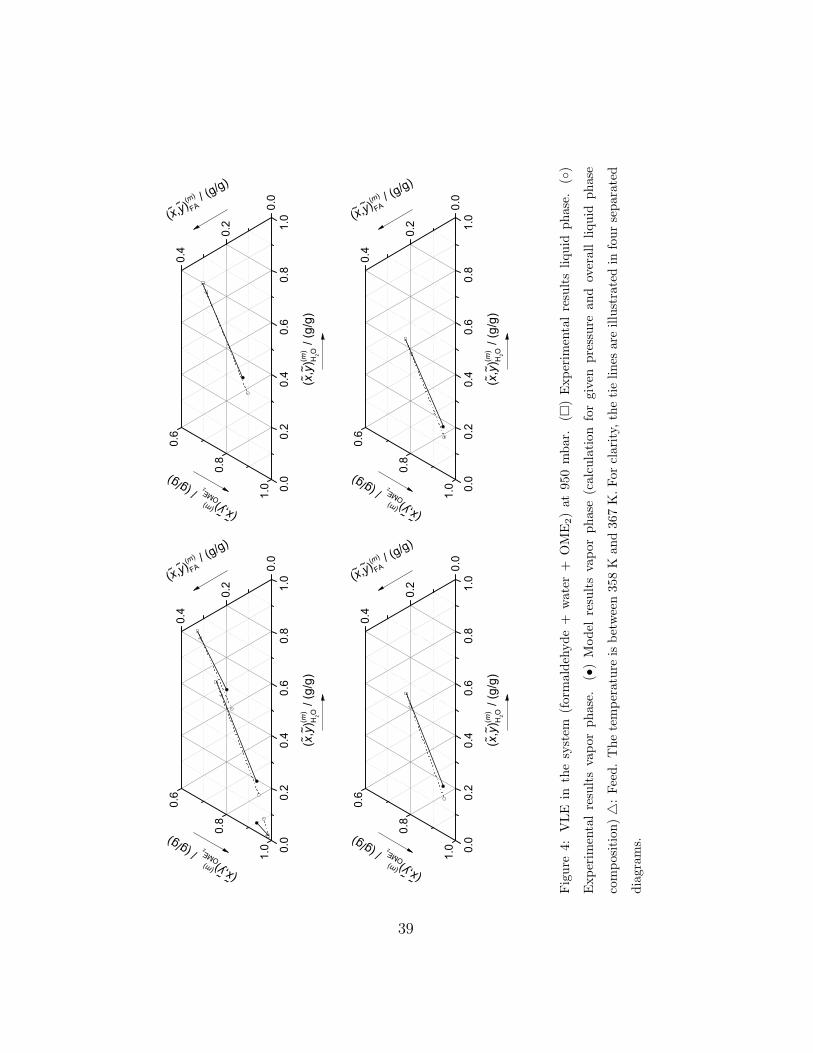
Numerical results of the VLE measurements carried out in the present
work for the system (formaldehyde + water + OME2) are given in Table 5.
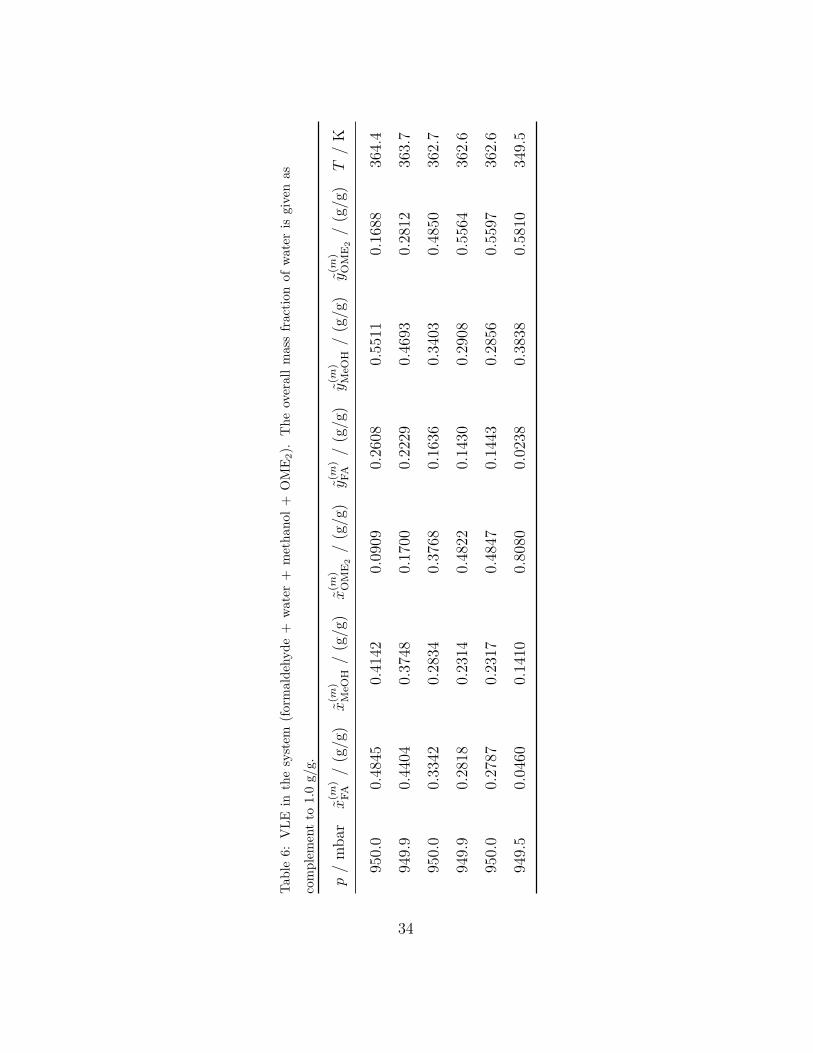
The corresponding results for the system (formaldehyde + water + me-
thanol + OME2) are given in Table 6. The experimental and the calcu-
lated tie lines in the system (formaldehyde + water + OME2) are shown in
Figure 4. The experimental feed points coincide with the experimental tie
lines indicating reliable sampling and analysis. As no parameters were fitted
to the experimental VLE data in this system, the model results are predic-
tions. It can be seen that there is generally a good agreement between the
experimental tie lines and the model results. Except for the tie line with the
highest overall mass fractions of OME2, the slope of the calculated tie lines
is in good agreement with the experiments. In most cases, OME2 is enriched
in the vapor phase. The overall mass fractions of OME2 in the vapor phase
are, however, predicted too low. The tie line with the highest overall mass
fraction of OME2 shows a qualitatively different behavior. Here, OME2 is
depleted in the vapor phase indicating a ternary azeotrope and a distillation
boundary. At the experimental composition of the liquid phase and the ex-
perimental pressure, the arithmetic mean of the absolute deviations between
the overall mass fraction in the vapor phase is 0.016 g/g for formaldehyde,
0.046 g/g for water, and 0.051 g/g for OME2. The measured temperature is
14
between 358 K and 367 K, c.f. Table 5. The arithmetic mean of the absolute
deviations for the temperature is 2.5 K.
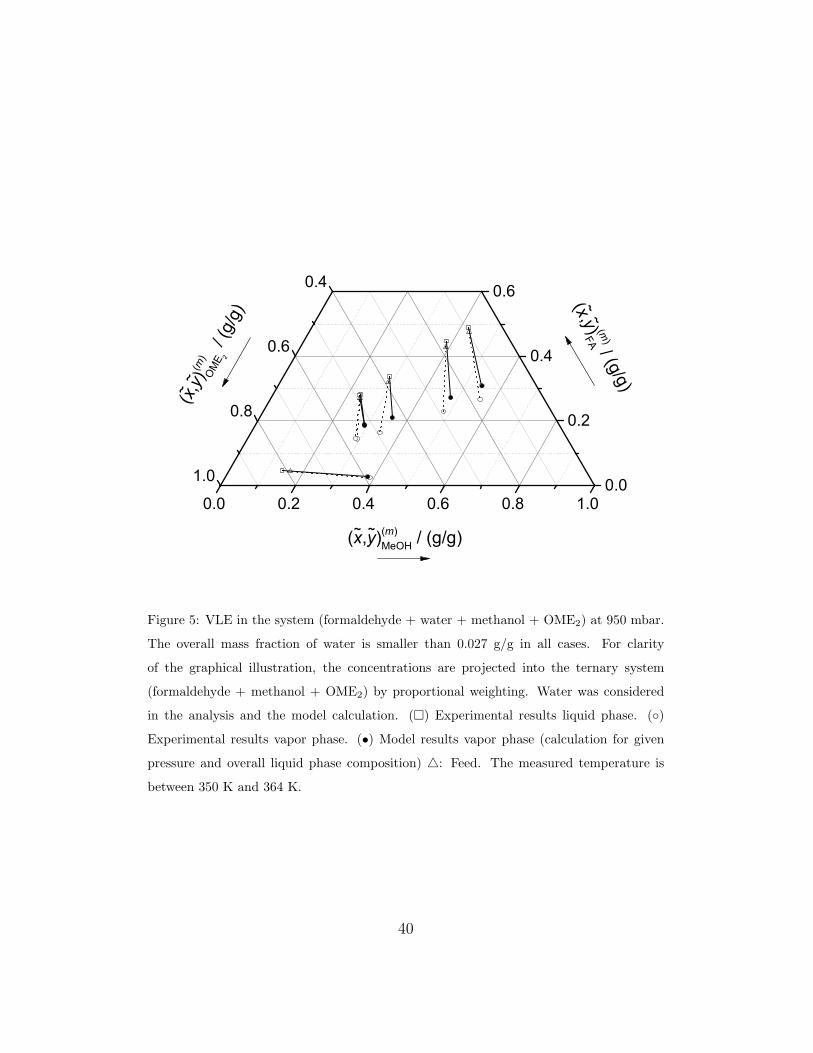
Figure 5 shows the experimental and the calculated tie lines in the sys-
tem (formaldehyde + water + methanol + OME2). The system is studied
at low water concentrations. The largest overall mass fraction of water is
0.027 g/g and found in the vapor phase. For the graphical illustration in
Figure 5, the concentrations are projected into the ternary system (formalde-
hyde + methanol + OME2) by proportional weighting. Water was, however,
considered in the analysis and the model calculation. Again, the experimen-
tal feed points coincide with the experimental tie lines. It can be seen that
there is a good agreement between the experimental tie lines and the model
results. For the tie line with the lowest overall mass fractions of formalde-
hyde, the agreement is excellent, whereas for all other tie lines the overall
mass fractions of formaldehyde in the vapor phase are calculated too low.
The tie line with the lowest overall mass fractions of formaldehyde shows a
different direction than the other tie lines. Here, OME2 is depleted in the
vapor phase, whereas for all other tie lines, OME2 is enriched in the vapor
phase. The arithmetic mean of the absolute deviations between the overall
mass fraction in the vapor phase is 0.037 g/g for formaldehyde, 0.002 g/g
for water, 0.007 g/g for methanol, and 0.034 g/g for OME2. The measured
temperature is between 350 K and 364 K, c.f. Table 6. The arithmetic mean
of the absolute deviations for the temperature is 1.4 K.
4.2. Batch evaporation
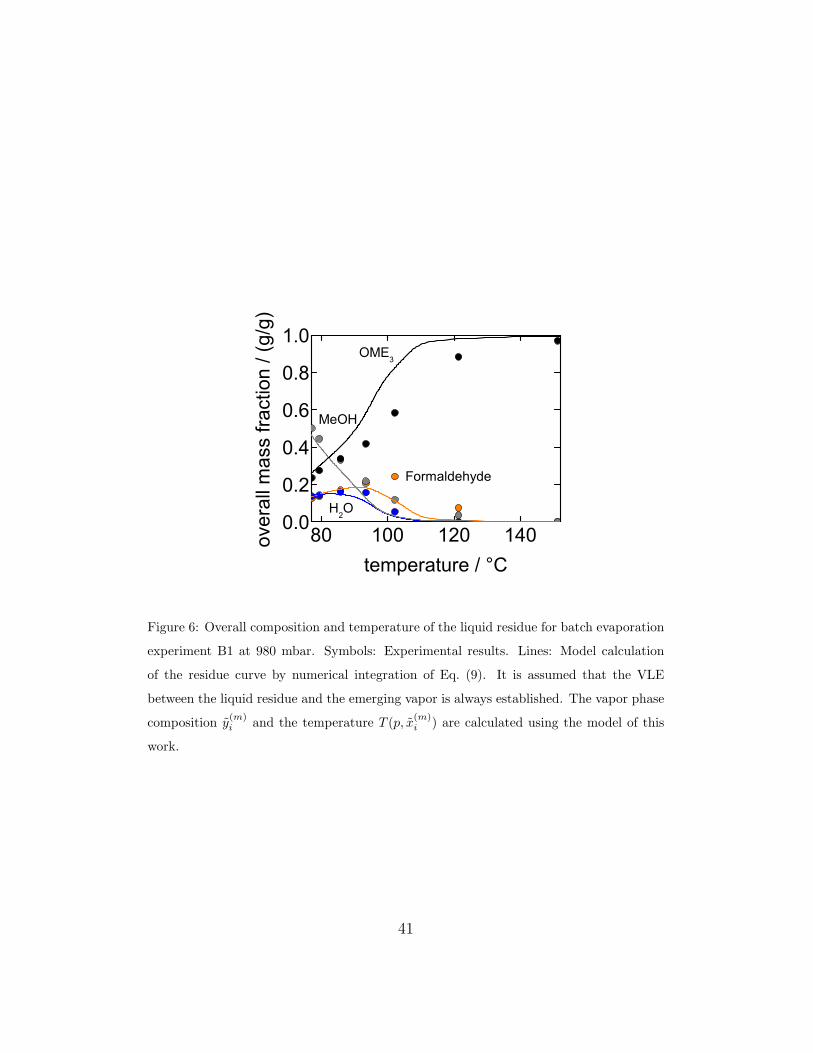
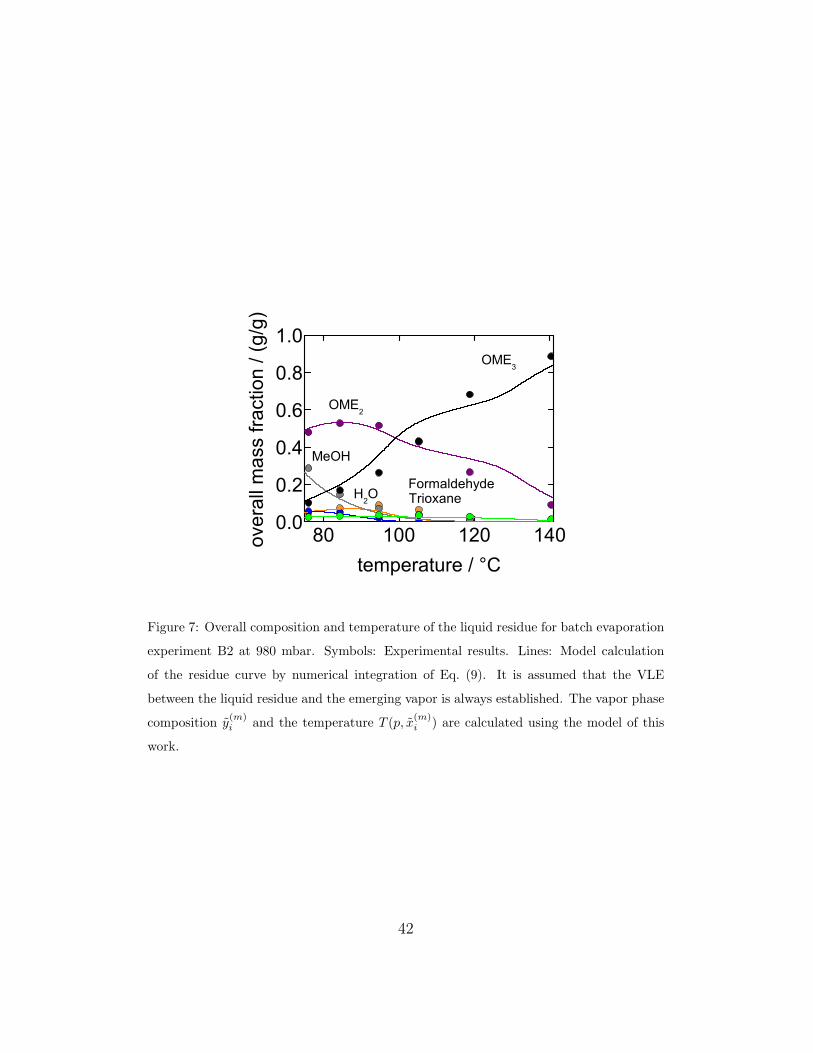
Two batch evaporation experiments with different feed compositions were
carried out in the system (formaldehyde + water + methanol + OME + tri-
15
oxane). Numerical results of the two batch evaporation experiments (overall
composition and temperature of the liquid residue) are given in the Supple-
mentary Information. The results are illustrated in Figure 6 for experiment
B1 and in Figure 7 for experiment B2. For both experiments, the composi-
tion in the liquid residue approaches pure OME3 showing that OME3 (and
therefore also OME with n ≥ 4) can be separated from the residual compo-
nents of the system. In Figure 6 and Figure 7, the experimental results are
additionally compared to calculations of the residue curve using Rayleigh’s
equation [35],
dx(m)i
dτ= −(y
(m)i − x
(m)i ) (9)
where x(m)i , y
(m)i are the overall mass fractions of the liquid residue, and the
emerging vapor, respectively, and τ is a dimensionless time parameter. It is
assumed that the VLE between the liquid residue and the emerging vapor is
always established. For the calculation of the VLE, the chemical reactions
were explicitly considered, see the description of the physico-chemical model.
The initial composition of the liquid mixture was used as initial condition for
the numerical integration of Eq. (9). The temperature T (p, x(m)i ) is obtained
from the VLE model. Figure 6 and Figure 7 show that there is generally a
good agreement between the experimental data and the calculations for both
batch evaporation experiments. However, increasing deviations are observed
for increasing overall mass fractions of formaldehyde in the liquid residue,
see the results at about 100 ◦C in Figure 6. Here, the highest overall mass
fraction of formaldehyde in the liquid residue is observed. At this point of the
experiment also solid precipitation of formaldehyde in the Liebig condenser
was observed, which is caused by high concentrations of formaldehyde in the
16
emerging vapor and low temperatures in the condenser.
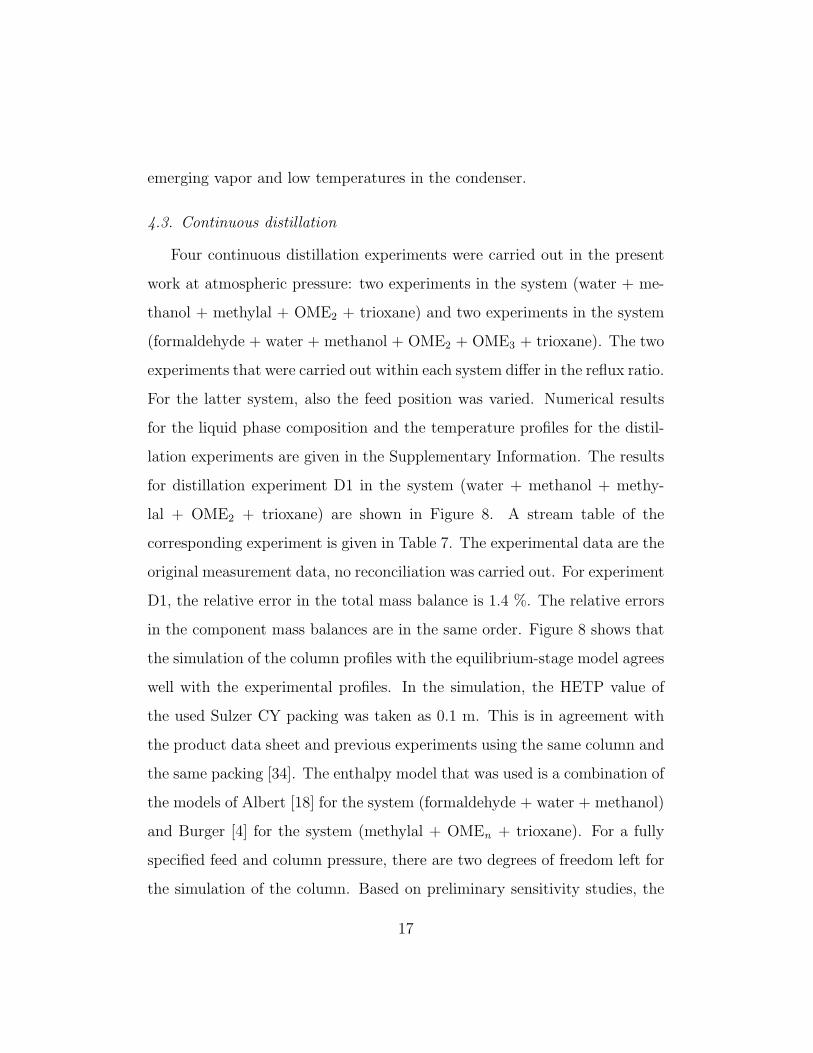
4.3. Continuous distillation
Four continuous distillation experiments were carried out in the present
work at atmospheric pressure: two experiments in the system (water + me-
thanol + methylal + OME2 + trioxane) and two experiments in the system
(formaldehyde + water + methanol + OME2 + OME3 + trioxane). The two
experiments that were carried out within each system differ in the reflux ratio.
For the latter system, also the feed position was varied. Numerical results
for the liquid phase composition and the temperature profiles for the distil-
lation experiments are given in the Supplementary Information. The results
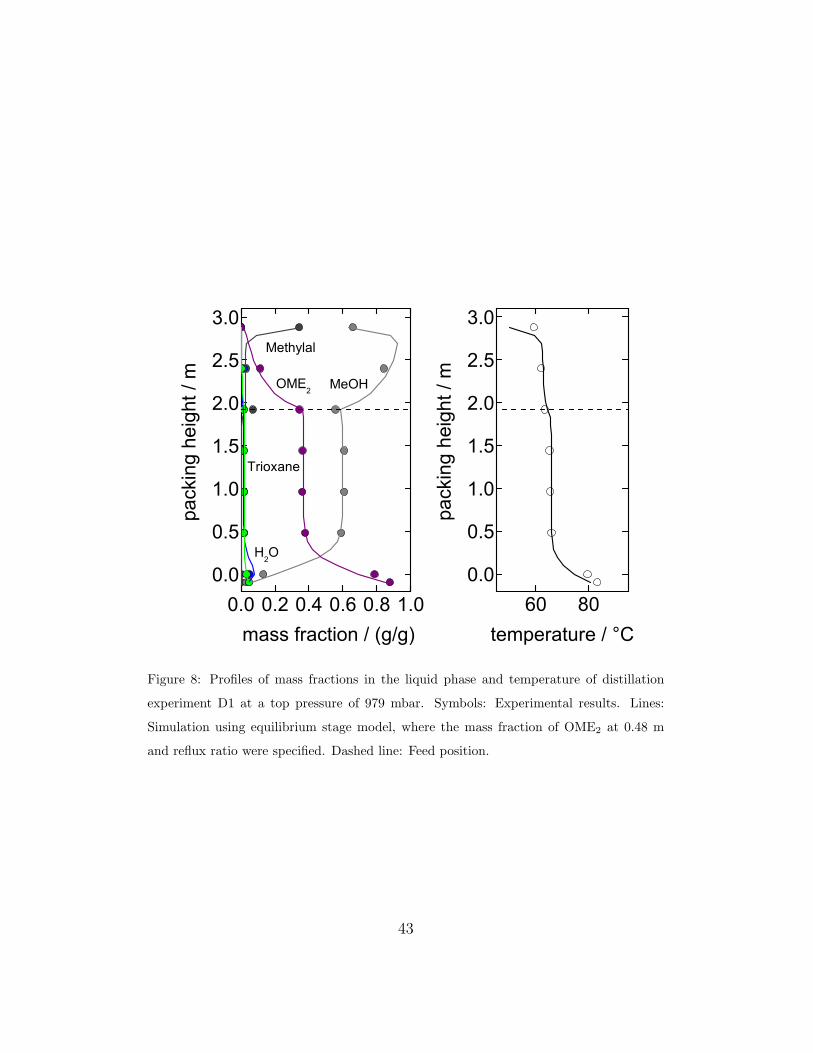
for distillation experiment D1 in the system (water + methanol + methy-
lal + OME2 + trioxane) are shown in Figure 8. A stream table of the
corresponding experiment is given in Table 7. The experimental data are the
original measurement data, no reconciliation was carried out. For experiment
D1, the relative error in the total mass balance is 1.4 %. The relative errors
in the component mass balances are in the same order. Figure 8 shows that
the simulation of the column profiles with the equilibrium-stage model agrees
well with the experimental profiles. In the simulation, the HETP value of
the used Sulzer CY packing was taken as 0.1 m. This is in agreement with
the product data sheet and previous experiments using the same column and
the same packing [34]. The enthalpy model that was used is a combination of
the models of Albert [18] for the system (formaldehyde + water + methanol)
and Burger [4] for the system (methylal + OMEn + trioxane). For a fully
specified feed and column pressure, there are two degrees of freedom left for
the simulation of the column. Based on preliminary sensitivity studies, the
17
mass fraction of OME2 at 0.48 m and the reflux ratio were specified here.
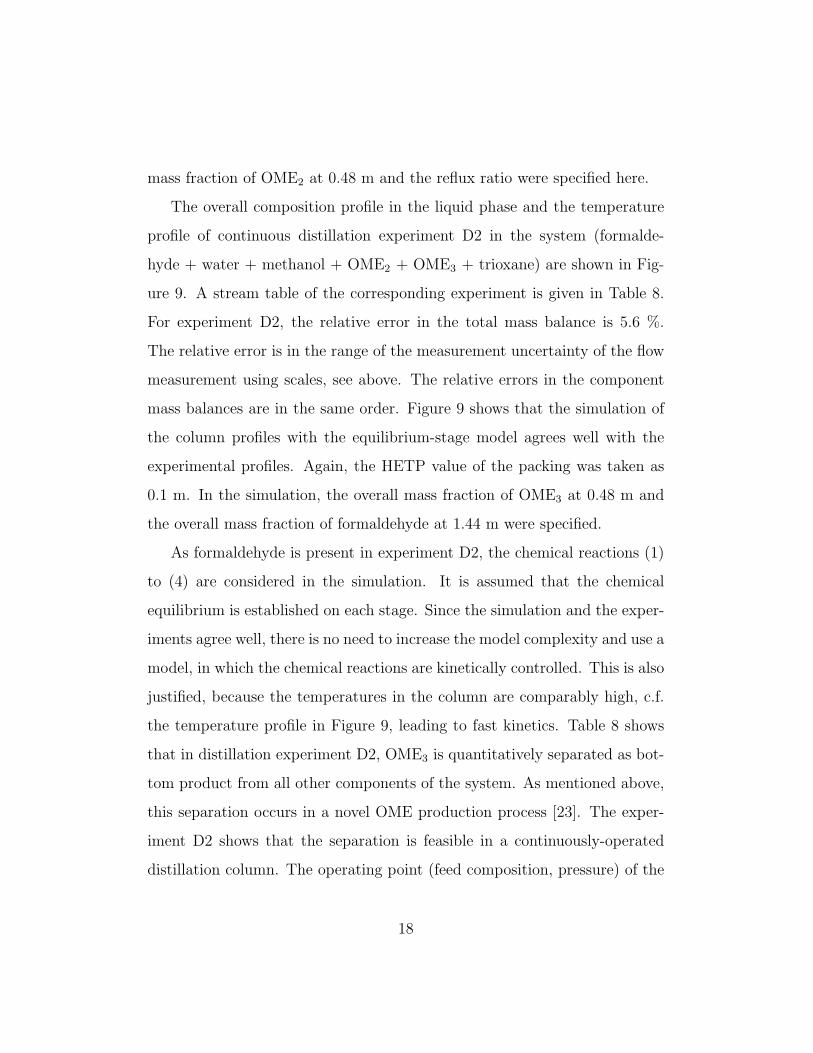
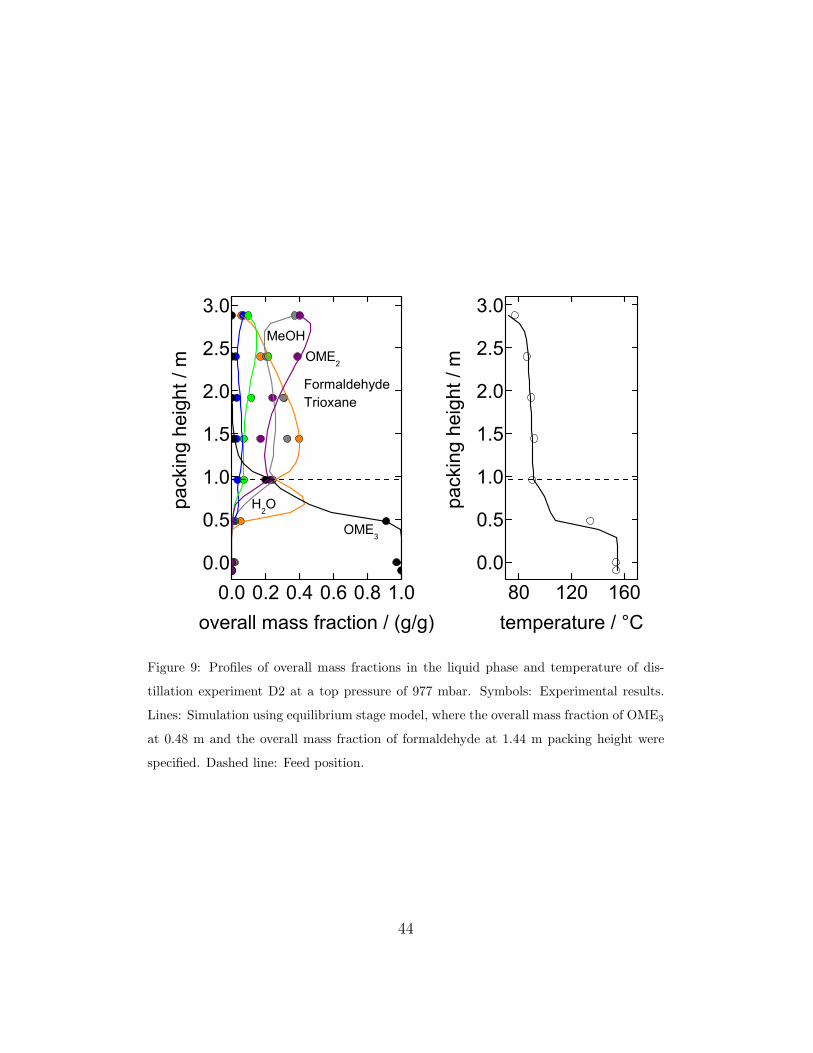
The overall composition profile in the liquid phase and the temperature
profile of continuous distillation experiment D2 in the system (formalde-
hyde + water + methanol + OME2 + OME3 + trioxane) are shown in Fig-
ure 9. A stream table of the corresponding experiment is given in Table 8.
For experiment D2, the relative error in the total mass balance is 5.6 %.
The relative error is in the range of the measurement uncertainty of the flow
measurement using scales, see above. The relative errors in the component
mass balances are in the same order. Figure 9 shows that the simulation of
the column profiles with the equilibrium-stage model agrees well with the
experimental profiles. Again, the HETP value of the packing was taken as
0.1 m. In the simulation, the overall mass fraction of OME3 at 0.48 m and
the overall mass fraction of formaldehyde at 1.44 m were specified.
As formaldehyde is present in experiment D2, the chemical reactions (1)
to (4) are considered in the simulation. It is assumed that the chemical
equilibrium is established on each stage. Since the simulation and the exper-
iments agree well, there is no need to increase the model complexity and use a
model, in which the chemical reactions are kinetically controlled. This is also
justified, because the temperatures in the column are comparably high, c.f.
the temperature profile in Figure 9, leading to fast kinetics. Table 8 shows
that in distillation experiment D2, OME3 is quantitatively separated as bot-
tom product from all other components of the system. As mentioned above,
this separation occurs in a novel OME production process [23]. The exper-
iment D2 shows that the separation is feasible in a continuously-operated
distillation column. The operating point (feed composition, pressure) of the
18
column in the OME production process [23] is, however, different from the
operating point in experiment D2 in the present work. This gap should be
closed in future work.
Information on the two continuous distillation experiments D3 and D4,
which do not yield additional qualitative insights, is given in the Supplemen-
tary Information. Again, good agreement between the experimental column
profiles and simulations using the equilibrium-stage model is observed.
5. Conclusion
In the present work, a physico-chemical model for describing the vapor-
liquid equilibrium (VLE) in the system (formaldehyde + water + methanol +
methylal + OME + trioxane) is described. For developing and testing of
the model, different experiments were carried out: VLE measurements in
the systems (formaldehyde + water + OME2) and (formaldehyde + wa-
ter + methanol + OME2) at 950 mbar, as well as batch evaporation ex-
periments and continuous distillation experiments at atmospheric pressure.
Despite the high phyisco-chemical complexity of the studied mixtures, the
model is successful in describing all experiments. The continuous distillation
experiments show that OME with n ≥ 3 can be separated as bottom product
from mixtures of formaldehyde, water, methanol, methylal, and OME with
n ≥ 2. This is the critical separation in a newly developed OME produc-
tion process [23]. It is, hence, shown to be feasible. The physico-chemical
model can be used for detailed simulations of this separation and other OME
production processes.
19
6. Nomenclature
Abbreviations
FA = Formaldehyde
HETP = Height equivalent to a theoretical plate
HF = Poly(oxymethylene) hemiformal
LLE = Liquid-liquid equilibrium
MeOH = Methanol
MG = Poly(oxymethylene) glycol
OME = Poly(oxymethylene) dimethyl ether
UNIFAC = Universal Quasichemical Functional Group Activity
= Coefficients
VLE = Vapor-liquid equilibrium
Symbols and indices
ai = Activity of component i
γi = Acitivity coefficient of component i
Ka = Activity-based chemical equilibrium constant
n = Oligomer chain length
p = Pressure
Q = UNIFAC surface parameter
R = UNIFAC size parameter
T = Temperature
τ = Dimensionless time
20
xi = True mole fraction of component i in the liquid phase
x(m)i = Mass fraction of component i in the liquid phase
x(m)i = Overall mass fraction of component i in the liquid phase
y(m)i = Mass fraction of component i in the vapor phase
y(m)i = Overall mass fraction of component i in the vapor phase
Acknowledgement
This work was funded by the German Federal Ministry of Food and Agri-
culture (BMEL) through grant 22403914.
21
References
[1] B. Lumpp, D. Rothe, C. Pastotter, R. Lammermann, E. Jacob,
Oxymethylene ethers as diesel fuel additives of the future, MTZ 72 (3)
(2011) 34–38. doi:10.1365/s38313-011-0027-z.
[2] M. Hartl, P. Seidenspinner, E. Jacob, G. Wachtmeister, Oxygenate
screening on a heavy-duty diesel engine and emission characteristics of
highly oxygenated oxymethylene ether fuel, Fuel 153 (2015) 328–335.
doi:10.1016/j.fuel.2015.03.012.
[3] J. Burger, M. Siegert, E. Strofer, H. Hasse, Poly(oxymethylene)
dimethyl ethers as components of tailored diesel fuel: Properties,
synthesis and purification concepts, Fuel 89 (11) (2010) 3315–3319.
doi:10.1016/j.fuel.2010.05.014.
[4] J. Burger, A novel process for the production of diesel fuel additives
by hierarchical design, Ph.D. thesis, TU Kaiserslautern, Kaiserslautern
(2012).
[5] S. Baranton, H. Uchida, D. A. Tryk, J. L. Dubois, M. Watan-
abe, Hydrolyzed polyoxymethylenedimethylethers as liquid fuels for
direct oxidation fuel cells, Electrochim. Acta 108 (2013) 350–355.
doi:10.1016/j.electacta.2013.06.138.
[6] D. Devaux, H. Yano, H. Uchida, J.-L. Dubois, M. Watanabe, Electro-
oxidation of hydrolysed poly-oxymethylene-dimethylether on PtRu
supported catalysts, Electrochim. Acta 56 (3) (2011) 1460–1465.
doi:10.1016/j.electacta.2010.10.088.
22
[7] Q. Liu, X. Zhang, B. Ma, Solubility of 2-ethylanthraquinone in binary
mixtures of oligooxymethylene dimethyl ethers with different number of
CH2O groups of n = 2, 3, and 4 from 293.15 to 343.15 K, J. Chem. Eng.
Data 61 (9) (2016) 3254–3265. doi:10.1021/acs.jced.6b00334.
[8] J. Burger, V. Papaioannou, S. Gopinath, G. Jackson, A. Galindo, C. S.
Adjiman, A hierarchical method to integrated solvent and process design
of physical CO2 absorption using the SAFT-γ mie approach, AIChE J.
61 (10) (2015) 3249–3269. doi:10.1002/aic.14838.
[9] M. Schappals, T. Breug-Nissen, K. Langenbach, J. Burger,
H. Hasse, Solubility of carbon dioxide in poly(oxymethylene)
dimethyl ethers, J. Chem. Eng. Data 62 (11) (2017) 4027–4031.
doi:10.1021/acs.jced.7b00718.
[10] J. Zhang, D. Fang, D. Liu, Evaluation of zr-alumina in production of
polyoxymethylene dimethyl ethers from methanol and formaldehyde:
Performance tests and kinetic investigations, Ind. Eng. Chem. Res.
53 (35) (2014) 13589–13597. doi:10.1021/ie501231a.
[11] J. Zhang, M. Shi, D. Fang, D. Liu, Reaction kinetics of the production
of polyoxymethylene dimethyl ethers from methanol and formaldehyde
with acid cation exchange resin catalyst, React. Kinet. Mech. Cat. 11 (2)
(2014) 459–470. doi:10.1007/s11144-014-0771-6.
[12] D. Oestreich, L. Lautenschutz, U. Arnold, J. Sauer, Reaction kinet-
ics and equilibrium parameters for the production of oxymethylene
23
dimethyl ethers (ome) from methanol and formaldehyde, Chem. Eng.
Sci. 163 (2017) 92–104. doi:10.1016/j.ces.2016.12.037.
[13] D. Oestreich, L. Lautenschutz, U. Arnold, J. Sauer, Production
of oxymethylene dimethyl ether (OME)-hydrocarbon fuel blends in
a one-step synthesis/extraction procedure, Fuel 214 (2018) 39–44.
doi:10.1016/j.fuel.2017.10.116.
[14] N. Schmitz, F. Homberg, J. Berje, J. Burger, H. Hasse, Chemical equi-
librium of the synthesis of poly(oxymethylene) dimethyl ethers from
formaldehyde and methanol in aqueous solutions, Ind. Eng. Chem. Res.
54 (25) (2015) 6409–6417. doi:10.1021/acs.iecr.5b01148.
[15] N. Schmitz, J. Burger, H. Hasse, Reaction kinetics of the formation of
poly(oxymethylene) dimethyl ethers from formaldehyde and methanol
in aqueous solutions, Ind. Eng. Chem. Res. 54 (50) (2015) 12553–12560.
doi:10.1021/acs.iecr.5b04046.
[16] I. Hahnenstein, H. Hasse, C. G. Kreiter, G. Maurer, 1H- and 13C-NMR-
spectroscopic study of chemical equilibria in solutions of formaldehyde
in water, deuterium oxide, and methanol, Ind. Eng. Chem. Res. 33 (4)
(1994) 1022–1029. doi:10.1021/ie00028a033.
[17] I. Hahnenstein, M. Albert, H. Hasse, C. G. Kreiter, G. Maurer, NMR
spectroscopic and densimetric study of reaction kinetics of formaldehyde
polymer formation in water, deuterium oxide, and methanol, Ind. Eng.
Chem. Res. 34 (2) (1995) 440–450. doi:10.1021/ie00041a003.
24
[18] M. Albert, Thermodynamische eigenschaften formaldehydhaltiger mis-
chungen, Ph.D. Thesis, TU Kaiserslautern, Kaiserslautern (1998).
[19] C. Kuhnert, M. Albert, S. Breyer, I. Hahnenstein, H. Hasse, G. Mau-
rer, Phase equilibrium in formaldehyde containing multicomponent mix-
tures: Experimental results for fluid phase equilibria of (formalde-
hyde + (water or methanol) + methylal)) and (formaldehyde + water
+ methanol + methylal) and comparison with predictions, Ind. Eng.
Chem. Res. 45 (14) (2006) 5155–5164. doi:10.1021/ie060131u.
[20] G. Maurer, Vapor-liquid equilibrium of formaldehyde-and water-
containing multicomponent mixtures, AIChE J. 32 (6) (1986) 932–948.
doi:10.1002/aic.690320604.
[21] Y. Song, Q. Li, D. Jianfei, Z. Haipeng, L. Xuefeng, S. Xiang, Vapor-
liquid equilibrium for methanol-methylal-poly methoxy methylal (n = 2)
system, Chemical Engineering (China) 43 (2).
[22] J. Burger, E. Strofer, H. Hasse, Production process for diesel fuel compo-
nents poly(oxymethylene) dimethyl ethers from methane-based products
by hierarchical optimization with varying model depth, Chem. Eng. Res.
Des. 91 (12) (2013) 2648–2662. doi:10.1016/j.cherd.2013.05.023.
[23] N. Schmitz, E. Strofer, J. Burger, H. Hasse, Conceptual design of a
novel process for the production of poly(oxymethylene) dimethyl ethers
from formaldehyde and methanol, Ind. Eng. Chem. Res. 56 (40) (2017)
11519–11530. doi:10.1021/acs.iecr.7b02314.
25
[24] H. Hasse, I. Hahnenstein, G. Maurer, Revised vapor-liquid equilibrium
model for multicomponent formaldehyde mixtures, AIChE J. 36 (12)
(1990) 1807–1814. doi:10.1002/aic.690361204.
[25] H. Hasse, G. Maurer, Vapor-liquid equilibrium of formaldehyde-
containing mixtures at temperatures below 320 K, Fluid Phase Equilib.
64 (1991) 185–199. doi:10.1016/0378-3812(91)90013-W.
[26] M. Albert, I. Hahnenstein, H. Hasse, G. Maurer, Vapor–liquid equilib-
rium of formaldehyde mixtures: New data and model revision, AIChE
J. 42 (6) (1996) 1741–1752. doi:10.1002/aic.690420625.
[27] M. Albert, B. Coto Garcia, C. Kreiter, G. Maurer, Vapor-liquid and
chemical equilibria of formaldehyde-water mixtures, AIChE J. 45 (9)
(1999) 2024–2033. doi:10.1002/aic.690450919.
[28] M. Albert, B. Coto Garcia, C. Kuhnert, R. Peschla, G. Maurer, Vapor–
liquid equilibrium of aqueous solutions of formaldehyde and methanol,
AIChE J. 46 (8) (2000) 1676–1687. doi:10.1002/aic.690460818.
[29] M. Albert, I. Hahnenstein, H. Hasse, G. Maurer, Vapor-liquid and
liquid-liquid equilibria in binary and ternary mixtures of water,
methanol, and methylal, J. Chem. Eng. Data 46 (4) (2001) 897–903.
doi:10.1021/je000352l.
[30] M. Maiwald, H. H. Fischer, M. Ott, R. Peschla, C. Kuhnert, C. G.
Kreiter, G. Maurer, H. Hasse, Quantitative NMR spectroscopy of com-
plex liquid mixtures: methods and results for chemical equilibria in
26
formaldehyde−water−methanol at temperatures up to 383 K, Ind. Eng.
Chem. Res. 42 (2) (2003) 259–266. doi:10.1021/ie0203072.
[31] M. Albert, H. Hasse, C. Kuhnert, G. Maurer, New experimental results
for the vapor−liquid equilibrium of the binary system (trioxane + water)
and the ternary system (formaldehyde + trioxane + water), J. Chem.
Eng. Data 50 (4) (2005) 1218–1223. doi:10.1021/je050015i.
[32] N. Schmitz, A. Friebel, E. von Harbou, J. Burger, H. Hasse,
Liquid-liquid equilibrium in binary and ternary mixtures containing
formaldehyde, water, methanol, methylal, and poly(oxymethylene)
dimethyl ethers, Fluid Phase Equilib. 425 (2016) 127–135.
doi:10.1016/j.fluid.2016.05.017.
[33] M. Ott, H. Schoenmakers, H. Hasse, Distillation of formaldehyde
containing mixtures: laboratory experiments, equilibrium stage mod-
eling and simulation, Chem. Eng. Process 44 (6) (2005) 687–694.
doi:10.1016/j.cep.2003.09.011.
[34] J.-O. Weidert, J. Burger, M. Renner, S. Blagov, H. Hasse, De-
velopment of an integrated reaction–distillation process for the pro-
duction of methylal, Ind. Eng. Chem. Res. 56 (2) (2017) 575–582.
doi:10.1021/acs.iecr.6b03847.
[35] Rayleigh, Lix. on the distillation of binary mixtures, Phil Mag S 4 (23)
(1902) 521–537. doi:10.1080/14786440209462876.
[36] H. Hasse, Dampf-Flussigkeits-Gleichgewichte, Enthalpien und Reaktion-
27
skinetik in formaldehydhaltigen Mischungen, Ph.D. thesis, TU Kaiser-
slautern, Kaiserslautern (1990).
[37] J.-O. Drunsel, Entwicklung von Verfahren zur Herstellung von Methylal
und Ethylal, Ph.D. Thesis, TU Kaiserslautern, Kaiserslautern (2012).
[38] J.-O. Drunsel, M. Renner, H. Hasse, Experimental study and
model of reaction kinetics of heterogeneously catalyzed methy-
lal synthesis, Chem. Eng. Res. Des. 90 (5) (2012) 696–703.
doi:10.1016/j.cherd.2011.09.014.
28
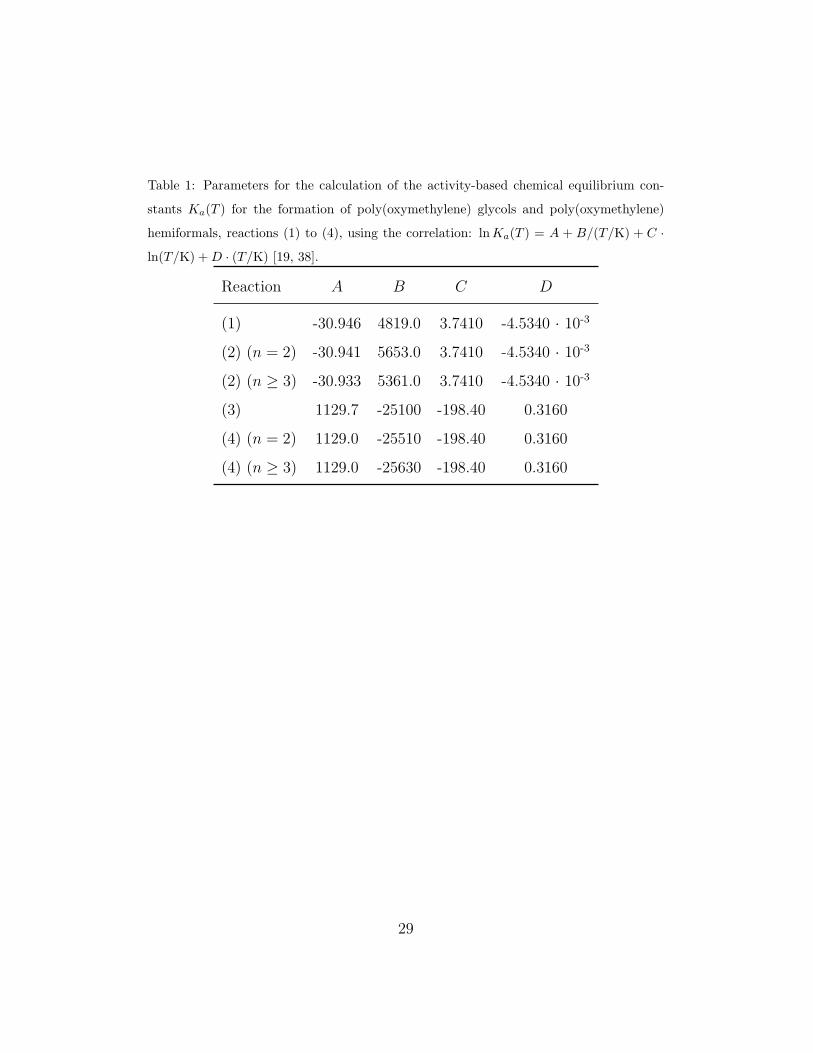
Table 1: Parameters for the calculation of the activity-based chemical equilibrium con-
stants Ka(T ) for the formation of poly(oxymethylene) glycols and poly(oxymethylene)
hemiformals, reactions (1) to (4), using the correlation: lnKa(T ) = A + B/(T/K) + C ·
ln(T/K) +D · (T/K) [19, 38].
Reaction A B C D
(1) -30.946 4819.0 3.7410 -4.5340 · 10-3
(2) (n = 2) -30.941 5653.0 3.7410 -4.5340 · 10-3
(2) (n ≥ 3) -30.933 5361.0 3.7410 -4.5340 · 10-3
(3) 1129.7 -25100 -198.40 0.3160
(4) (n = 2) 1129.0 -25510 -198.40 0.3160
(4) (n ≥ 3) 1129.0 -25630 -198.40 0.3160
29
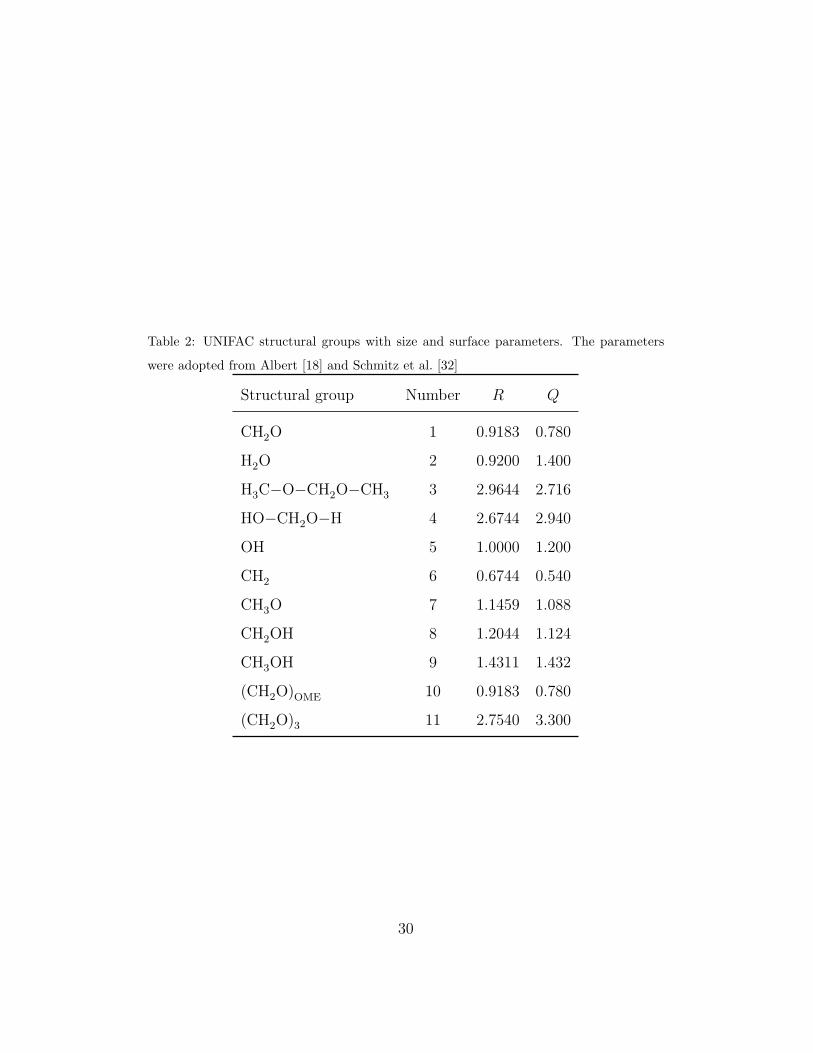
Table 2: UNIFAC structural groups with size and surface parameters. The parameters
were adopted from Albert [18] and Schmitz et al. [32]
Structural group Number R Q
CH2O 1 0.9183 0.780
H2O 2 0.9200 1.400
H3C−O−CH2O−CH3 3 2.9644 2.716
HO−CH2O−H 4 2.6744 2.940
OH 5 1.0000 1.200
CH2 6 0.6744 0.540
CH3O 7 1.1459 1.088
CH2OH 8 1.2044 1.124
CH3OH 9 1.4311 1.432
(CH2O)OME 10 0.9183 0.780
(CH2O)3 11 2.7540 3.300
30
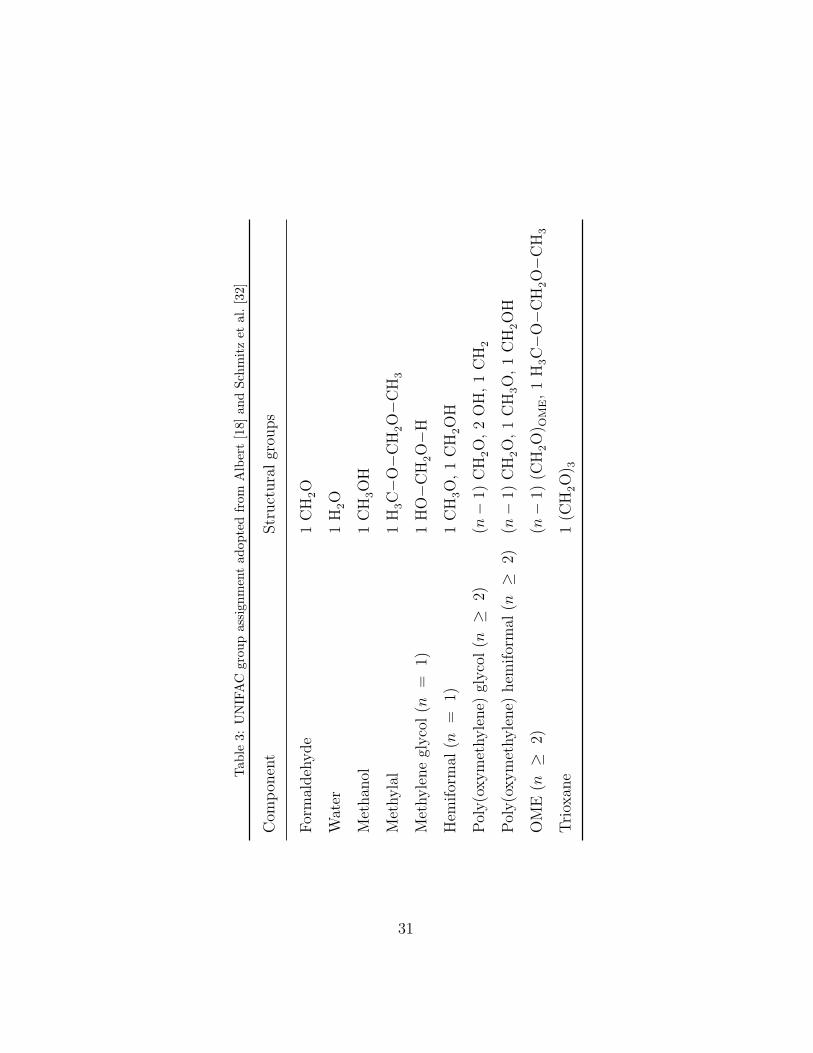
Table
3:UNIFAC
grou
passign
mentad
optedfrom
Albert[18]
andSchmitzet
al.[32]
Com
pon
ent
Structuralgrou
ps
Formaldehyde
1CH
2O
Water
1H
2O
Methan
ol1CH
3OH
Methylal
1H
3C−O−CH
2O−CH
3
Methyleneglycol(n
=1)
1HO−CH
2O−H
Hem
iformal
(n=
1)1CH
3O,1CH
2OH
Poly(oxymethylene)
glycol(n
≥2)
(n−
1)CH
2O,2OH,1CH
2
Poly(oxymethylene)
hem
iformal
(n≥
2)(n
−1)
CH
2O,1CH
3O,1CH
2OH
OME(n
≥2)
(n−
1)(C
H2O) O
ME,1H
3C−O−CH
2O−CH
3
Trioxan
e1(C
H2O) 3
31
Tab
le4:
UNIFAC
interactionparametersakm/K.Theinteractionparam
etersforgrou
ps1to
9,c.f.
Tab
le2,
aread
optedfrom
Kuhnertet
al.[ 19]Theinteractionparam
etersof
grou
p10
are(a)ad
optedfrom
Schmitzet
al.[32]or
(b)fitted
inthepresent
work.Theinteractionparametersofgrou
p11
aread
optedfrom
Albert[18]
(c).
Incase
Albert[18]
does
not
giveparam
eters,
theparam
etersaresetto
zero
(d).
HHHH
HH
k
m1
23
45
67
89
10
11
1-
867.8
0189.2
237.7
83.36
0238.4
238.4
0(a
)a1,11(T
)(c)
2-254.5
-a2,3(T
)189.5
-229.1
300
-219.3
a2,8(T
)289.6
a2,10(T
)(a)
80.63(c
)
30
a3,2(T
)-
a3,4(T
)237.7
83.36
00
410
26.0
(a)
0(d
)
459.2
-191.8
a4,3(T
)-
-229.1
300
-142.4
289.6
289.6
59.2
(a)
80.63(c
)
528.06
353.5
28.06
353.5
-156.4
112.8
-137.1
-137.1
28.06(a
)28.06(c
)
6251.5
1318
251.5
1318
986.5
-447.8
697.2
697.2
251.5
(a)
251.5
(c)
70
423.8
0774.8
1164.8
273
-238.4
238.4
0(a
)0(c
)
8-128.6
a8,2(T
)0
-181
249.1
16.5
-128.6
-0
1022(b
)-187.7
(c)
9-128.6
-181.0
-71.21
-181
249.1
16.5
-128.6
0-
128.59(b
)-16.67(c
)
10
0(a
)670.7
(a)
141.5
(a)
189.2
(a)
237.7
(a)
83.36(a
)0(a
)3297(b
)141.96(b
)-
0(d
)
11
a11,1(T
)(c)
379.4
(c)
0(d
)379.4
(c)
237.7
(c)
83.36(c
)0(c
)392.2
(c)
239.6
(c)
0(d
)-
a2,3(T
)=
−225.5
+0.7205·(T/K);
a3,2(T
)=
1031.0
−1.749·(T/K);
a2,8(T
)=
451.64−
114100/(T
/K);
a8,2(T
)=
−1018.57+
329900/(T
/K);
a3,4(T
)=
1031.0
−1.749·(T/K);
a4,3(T
)=
−225.5
+0.7205·(T/K);
a2,10(T
)=
168.9
−0.8776·(T/K);
a1,11(T
)=
554.9
−2.476·(T/K);
a11,1(T
)=
16980−
39.47·(T/K);
32
Tab
le5:VLEin
thesystem
(formaldehyde+
water
+OME2).
Experim
entalresultsfrom
thepresentwork.Theoverallmass
fraction
ofwater
isgiven
ascomplementto
1.0g/
g.
p/mbar
x(m
)FA
/(g/g)
x(m
)OME2/(g/g)
y(m
)FA
/(g/g)
y(m
)OME2/(g/g)
T/K
949.9
0.3260
0.0370
0.1755
0.4094
367.2
950.0
0.3035
0.0968
0.1054
0.6181
363.5
949.9
0.2444
0.2708
0.0560
0.7977
358.4
949.5
0.2228
0.3516
0.0512
0.8141
357.6
950.2
0.2190
0.3288
0.0512
0.8152
357.8
950.1
0.0154
0.9750
0.0331
0.9006
358.6
33
Tab
le6:
VLE
inthesystem
(formaldehyde+
water
+methan
ol+
OME2).
Theoverallmassfraction
ofwater
isgiven
as
complementto
1.0g/
g.
p/mbar
x(m
)FA
/(g/g)
x(m
)MeO
H/(g/g)
x(m
)OME2/(g/g)
y(m
)FA
/(g/g)
y(m
)MeO
H/(g/g)
y(m
)OME2/(g/g)
T/K
950.0
0.4845
0.4142
0.0909
0.2608
0.5511
0.1688
364.4
949.9
0.4404
0.3748
0.1700
0.2229
0.4693
0.2812
363.7
950.0
0.3342
0.2834
0.3768
0.1636
0.3403
0.4850
362.7
949.9
0.2818
0.2314
0.4822
0.1430
0.2908
0.5564
362.6
950.0
0.2787
0.2317
0.4847
0.1443
0.2856
0.5597
362.6
949.5
0.0460
0.1410
0.8080
0.0238
0.3838
0.5810
349.5
34
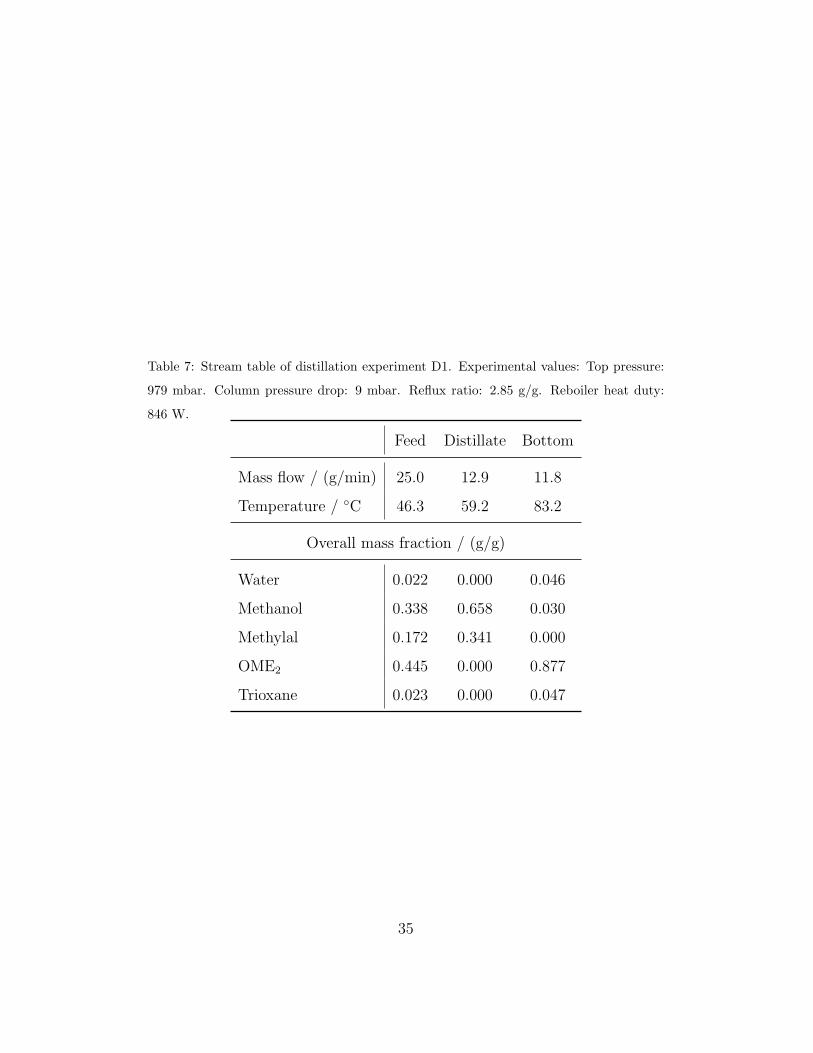
Table 7: Stream table of distillation experiment D1. Experimental values: Top pressure:
979 mbar. Column pressure drop: 9 mbar. Reflux ratio: 2.85 g/g. Reboiler heat duty:
846 W.
Feed Distillate Bottom
Mass flow / (g/min) 25.0 12.9 11.8
Temperature / ◦C 46.3 59.2 83.2
Overall mass fraction / (g/g)
Water 0.022 0.000 0.046
Methanol 0.338 0.658 0.030
Methylal 0.172 0.341 0.000
OME2 0.445 0.000 0.877
Trioxane 0.023 0.000 0.047
35
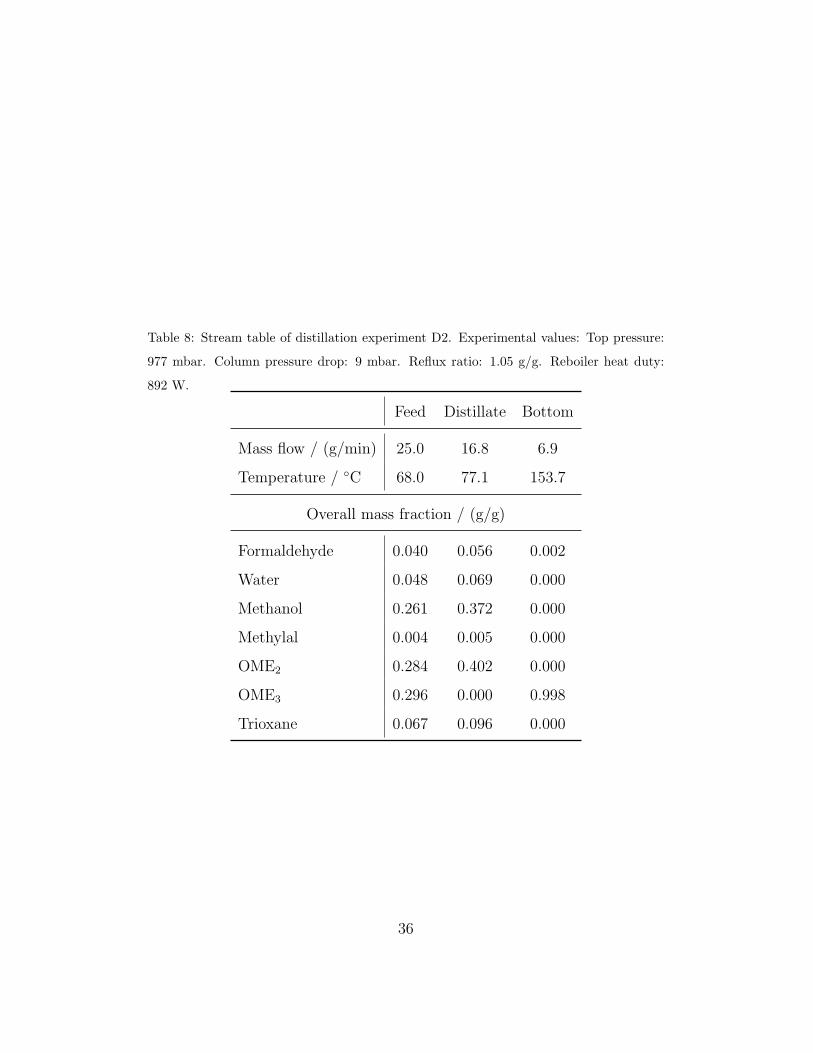
Table 8: Stream table of distillation experiment D2. Experimental values: Top pressure:
977 mbar. Column pressure drop: 9 mbar. Reflux ratio: 1.05 g/g. Reboiler heat duty:
892 W.
Feed Distillate Bottom
Mass flow / (g/min) 25.0 16.8 6.9
Temperature / ◦C 68.0 77.1 153.7
Overall mass fraction / (g/g)
Formaldehyde 0.040 0.056 0.002
Water 0.048 0.069 0.000
Methanol 0.261 0.372 0.000
Methylal 0.004 0.005 0.000
OME2 0.284 0.402 0.000
OME3 0.296 0.000 0.998
Trioxane 0.067 0.096 0.000
36
FA H2O MeOH MG1 HF1 MAL OMEn TRI
FA + H2O MG1
FA + MGn-1 MGn ; n 2
FA + MeOH HF1
FA + HFn-1 HFn ; n 2 Liquid
FA + H2O MG1 Vapor
FA + MeOH HF1
FA H2O MeOH MG1 HF1 MAL OMEn TRI
Figure 1: Scheme of the VLE model in the system (formaldehyde + wa-
ter + methanol + methylal + OME + trioxane).
0.0 0.2 0.4 0.6 0.8 1.0340
360
380
T / K
x(m)OME
2
, y(m)OME
2
/ (g/g)
Figure 2: VLE in the system (methanol + OME2) at 1.013 bar. (◦) Experimental results
from Song et al. [21]. Lines: Model (this work).
37
0.0 0.2 0.4 0.6 0.8 1.0300
320
340
360
380
T / K
x(m)OME
2
, y(m)OME
2
/ (g/g)
Figure 3: VLE in the system (methylal + OME2) at 1.013 bar. (◦) Experimental results
from Song et al. [21]. Lines: Model (this work).
38
0.0
0.2
0.4
0.6
0.8
1.0
0.6
0.8
1.0
0.0
0.2
0.4
(x,y)(m)
FA / (g
/g)
(x,y)(m) OME2 / (g
/g)
(x,y
)(m)
H2O
/ (g
/g)
0.0
0.2
0.4
0.6
0.8
1.0
0.6
0.8
1.0
0.0
0.2
0.4
(x,y)(m)
FA / (g
/g)
(x,y)(m) OME2 / (g
/g)
(x,y
)(m)
H2O
/ (g
/g)
0.0
0.2
0.4
0.6
0.8
1.0
0.6
0.8
1.0
0.0
0.2
0.4
(x,y)(m)
FA / (g
/g)
(x,y)(m) OME2 / (g
/g)
(x,y
)(m)
H2O
/ (g
/g)
0.0
0.2
0.4
0.6
0.8
1.0
0.6
0.8
1.0
0.0
0.2
0.4
(x,y)(m)
FA / (g
/g)
(x,y)(m) OME2 / (g
/g)
(x,y
)(m)
H2O
/ (g
/g)
Figure
4:VLE
inthesystem
(formaldehyde+
water
+OME2)at
950mbar.(�
)Experim
entalresultsliquid
phase.
(◦)
Experim
entalresultsvapor
phase.
(•)Model
resultsvapor
phase(calcu
lation
forgiven
pressure
and
overallliquid
phase
composition)△:Feed.Thetemperature
isbetween35
8K
and36
7K.For
clarity,
thetielines
areillustratedin
fourseparated
diagram
s.
39
0.0 0.2 0.4 0.6 0.8 1.0
0.4
0.6
0.8
1.0 0.0
0.2
0.4
0.6 (x,y) (m)FA / (g/g)
(x,y
)(m
)O
ME 2
/ (g
/g)
(x,y)(m)MeOH / (g/g)
Figure 5: VLE in the system (formaldehyde + water + methanol + OME2) at 950 mbar.
The overall mass fraction of water is smaller than 0.027 g/g in all cases. For clarity
of the graphical illustration, the concentrations are projected into the ternary system
(formaldehyde + methanol + OME2) by proportional weighting. Water was considered
in the analysis and the model calculation. (�) Experimental results liquid phase. (◦)
Experimental results vapor phase. (•) Model results vapor phase (calculation for given
pressure and overall liquid phase composition) △: Feed. The measured temperature is
between 350 K and 364 K.
40
80 100 120 1400.0
0.2
0.4
0.6
0.8
1.0
H2O
OME3
MeOH
Formaldehyde
over
all m
ass
fract
ion
/ (g/
g)
temperature / °C
Figure 6: Overall composition and temperature of the liquid residue for batch evaporation
experiment B1 at 980 mbar. Symbols: Experimental results. Lines: Model calculation
of the residue curve by numerical integration of Eq. (9). It is assumed that the VLE
between the liquid residue and the emerging vapor is always established. The vapor phase
composition y(m)i and the temperature T (p, x
(m)i ) are calculated using the model of this
work.
41
80 100 120 1400.0
0.2
0.4
0.6
0.8
1.0
OME2
Trioxane
MeOH
H2O
Formaldehyde
OME3
over
all m
ass
fract
ion
/ (g/
g)
temperature / °C
Figure 7: Overall composition and temperature of the liquid residue for batch evaporation
experiment B2 at 980 mbar. Symbols: Experimental results. Lines: Model calculation
of the residue curve by numerical integration of Eq. (9). It is assumed that the VLE
between the liquid residue and the emerging vapor is always established. The vapor phase
composition y(m)i and the temperature T (p, x
(m)i ) are calculated using the model of this
work.
42
0.0 0.2 0.4 0.6 0.8 1.00.0
0.5
1.0
1.5
2.0
2.5
3.0Methylal
Trioxane
MeOH
H2O
OME2
mass fraction / (g/g)
pack
ing
heig
ht /
m
60 800.0
0.5
1.0
1.5
2.0
2.5
3.0
temperature / °C
pack
ing
heig
ht /
m
Figure 8: Profiles of mass fractions in the liquid phase and temperature of distillation
experiment D1 at a top pressure of 979 mbar. Symbols: Experimental results. Lines:
Simulation using equilibrium stage model, where the mass fraction of OME2 at 0.48 m
and reflux ratio were specified. Dashed line: Feed position.
43
0.0 0.2 0.4 0.6 0.8 1.00.0
0.5
1.0
1.5
2.0
2.5
3.0
Trioxane
MeOH
H2O
OME3
OME2
overall mass fraction / (g/g)
pack
ing
heig
ht /
m
Formaldehyde
80 120 1600.0
0.5
1.0
1.5
2.0
2.5
3.0
temperature / °C
pack
ing
heig
ht /
m
Figure 9: Profiles of overall mass fractions in the liquid phase and temperature of dis-
tillation experiment D2 at a top pressure of 977 mbar. Symbols: Experimental results.
Lines: Simulation using equilibrium stage model, where the overall mass fraction of OME3
at 0.48 m and the overall mass fraction of formaldehyde at 1.44 m packing height were
specified. Dashed line: Feed position.
44
Copyright © 2022 FDOKUMEN