Characterization of membranes for membrane distillation by atomic force microscopy and estimation of...
13
Journal of Membrane Science 238 (2004) 199–211 Characterization of membranes for membrane distillation by atomic force microscopy and estimation of their water vapor transfer coefficients in vacuum membrane distillation process M. Khayet a,∗ , K.C. Khulbe b , T. Matsuura b a Department of Applied Physics I, Faculty of Physics, University Complutense of Madrid, Av. Complutense s/n, 28040 Madrid, Spain b Department of Chemical Engineering, Industrial Membrane Research Institute, University of Ottawa, 161 Louis Pasteur, P.O. Box 450, Stn. A, Ottawa, Ont., Canada K1N 6N5 Received 3 July 2003; received in revised form 25 March 2004; accepted 25 March 2004 Abstract Flat-sheet membranes for membrane distillation (MD) were prepared from solutions of polyvinylidene fluoride (PVDF) in dimethylac- etamide by the phase inversion technique. Various amounts of water were added to the solutions as a non-solvent additive. The surface of the membranes were investigated by tapping mode atomic force microscopy (TM-AFM), to obtain mean pore size, pore size distribution, nodule size, pore density, surface porosity and roughness parameters. Pore sizes fitted well to the log-normal distribution function for all membranes studied. The pore sizes, surface porosity, nodule sizes and roughness parameters were found to be higher for membranes prepared with higher water content in the casting solution. The mean pore sizes obtained with TM-AFM were 1.2 to 2.1 times larger than those determined from gas permeation test. To study the effect of pore size distribution on the water vapor transfer coefficient of MD membranes, a theoretical transport model that considers the membrane pore size distribution was developed for vacuum membrane distillation (VMD). The predicted water vapor transfer coefficients were compared to those determined from measured VMD water vapor flux. The pure water vapor flux of the prepared MD membranes increased exponentially with the water content in the casting solution. Calculations considering the TM-AFM pore size distribution resulted in 1.2–2.0 times larger water vapor transfer coefficients than those obtained with mean pore sizes. The predictions with mean pore size obtained with TM-AFM were closer to the measured values, while those obtained from gas permeation test gave the best predictions. TM-AFM technique is not suitable for prediction of the MD membrane water vapor transfer coefficients. © 2004 Elsevier B.V. All rights reserved. Keywords: Polyvinylidene fluoride membranes; Membrane distillation; Atomic force microscopy; Mass transfer model; Pore size distribution 1. Introduction The potential applications of membrane distillation (MD) process for production of high-purity water, concentration of ionic, colloid or other non-volatile aqueous solutions and removal of trace volatile organic compounds (VOCs) from waste water are well recognized [1,2]. This process refers to a thermally driven transport of vapor through the pores of hydrophobic membranes. When a heated aqueous feed solu- tion is brought into contact with one side of the membrane (i.e. feed side), the hydrophobic nature of the membrane ∗ Corresponding author. Tel.: +34-91-3945191; fax: +34-91-3945191. E-mail address: [email protected] (M. Khayet). prevents penetration of the liquid aqueous solution into the pores, resulting in the formation of a vapor–liquid interface at each pore entrance. The driving force in MD is the vapor pressure difference across the membrane and may be applied by a variety of methods, giving rise to various MD configu- rations. The permeate side of the membrane may consist of (1) a condensing liquid at low temperature in direct contact with the membrane (i.e. direct contact membrane distilla- tion, DCMD), (2) a condensing surface separated from the membrane by an air gap (i.e. air gap membrane distillation, AGMD), (3) a cold sweeping gas (i.e. sweeping gas mem- brane distillation, SGMD), or (4) a vacuum (i.e. vacuum membrane distillation, VMD). Details of each MD embodi- ment may be found in a recent review article [2]. When the transmembrane vapor pressure is applied, evaporation takes 0376-7388/$ – see front matter © 2004 Elsevier B.V. All rights reserved. doi:10.1016/j.memsci.2004.03.036
-
Upload
essat-gabes -
Category
Documents
-
view
0 -
download
0
Transcript of Characterization of membranes for membrane distillation by atomic force microscopy and estimation of...

Journal of Membrane Science 238 (2004) 199–211
Characterization of membranes for membrane distillation by atomicforce microscopy and estimation of their water vapor transfer
coefficients in vacuum membrane distillation process
M. Khayeta,∗, K.C. Khulbeb, T. Matsuurab
a Department of Applied Physics I, Faculty of Physics, University Complutense of Madrid, Av. Complutense s/n, 28040 Madrid, Spainb Department of Chemical Engineering, Industrial Membrane Research Institute, University of Ottawa,
161 Louis Pasteur, P.O. Box 450, Stn. A, Ottawa, Ont., Canada K1N 6N5
Received 3 July 2003; received in revised form 25 March 2004; accepted 25 March 2004
Abstract
Flat-sheet membranes for membrane distillation (MD) were prepared from solutions of polyvinylidene fluoride (PVDF) in dimethylac-etamide by the phase inversion technique. Various amounts of water were added to the solutions as a non-solvent additive. The surface of themembranes were investigated by tapping mode atomic force microscopy (TM-AFM), to obtain mean pore size, pore size distribution, nodulesize, pore density, surface porosity and roughness parameters. Pore sizes fitted well to the log-normal distribution function for all membranesstudied. The pore sizes, surface porosity, nodule sizes and roughness parameters were found to be higher for membranes prepared with higherwater content in the casting solution. The mean pore sizes obtained with TM-AFM were 1.2 to 2.1 times larger than those determined fromgas permeation test. To study the effect of pore size distribution on the water vapor transfer coefficient of MD membranes, a theoreticaltransport model that considers the membrane pore size distribution was developed for vacuum membrane distillation (VMD). The predictedwater vapor transfer coefficients were compared to those determined from measured VMD water vapor flux. The pure water vapor flux of theprepared MD membranes increased exponentially with the water content in the casting solution. Calculations considering the TM-AFM poresize distribution resulted in 1.2–2.0 times larger water vapor transfer coefficients than those obtained with mean pore sizes. The predictionswith mean pore size obtained with TM-AFM were closer to the measured values, while those obtained from gas permeation test gave the bestpredictions. TM-AFM technique is not suitable for prediction of the MD membrane water vapor transfer coefficients.© 2004 Elsevier B.V. All rights reserved.
Keywords:Polyvinylidene fluoride membranes; Membrane distillation; Atomic force microscopy; Mass transfer model; Pore size distribution
1. Introduction
The potential applications of membrane distillation (MD)process for production of high-purity water, concentrationof ionic, colloid or other non-volatile aqueous solutions andremoval of trace volatile organic compounds (VOCs) fromwaste water are well recognized[1,2]. This process refers toa thermally driven transport of vapor through the pores ofhydrophobic membranes. When a heated aqueous feed solu-tion is brought into contact with one side of the membrane(i.e. feed side), the hydrophobic nature of the membrane
∗ Corresponding author. Tel.:+34-91-3945191; fax:+34-91-3945191.E-mail address:[email protected] (M. Khayet).
prevents penetration of the liquid aqueous solution into thepores, resulting in the formation of a vapor–liquid interfaceat each pore entrance. The driving force in MD is the vaporpressure difference across the membrane and may be appliedby a variety of methods, giving rise to various MD configu-rations. The permeate side of the membrane may consist of(1) a condensing liquid at low temperature in direct contactwith the membrane (i.e. direct contact membrane distilla-tion, DCMD), (2) a condensing surface separated from themembrane by an air gap (i.e. air gap membrane distillation,AGMD), (3) a cold sweeping gas (i.e. sweeping gas mem-brane distillation, SGMD), or (4) a vacuum (i.e. vacuummembrane distillation, VMD). Details of each MD embodi-ment may be found in a recent review article[2]. When thetransmembrane vapor pressure is applied, evaporation takes
0376-7388/$ – see front matter © 2004 Elsevier B.V. All rights reserved.doi:10.1016/j.memsci.2004.03.036

200 M. Khayet et al. / Journal of Membrane Science 238 (2004) 199–211
place at the hot feed interface and, after vapor is transportedthrough the membrane pores, condensation may take placeeither inside the membrane module (i.e. DCMD, AGMD)or outside the membrane module (i.e. SGMD, VMD). In allMD configurations, the membrane plays a minimal role inthe separation mechanism acting merely as a physical sup-port for the vapor–liquid interface. In fact, the MD mem-branes must be hydrophobic with high porosity, low masstransfer resistance as well as low thermal conductivity, goodthermal stability and excellent chemical resistance to feedstreams.
While much effort has been devoted, in recent years, totheoretical transport models for the separation processesbased on membrane distillation (MD), less attention hasbeen paid to the preparation and characterization of MDmembranes[2–12]. In fact, the membranes often used in MDare microporous and hydrophobic membranes prepared es-pecially for microfiltration purposes. Those membranes arecommercially available in capillaries or flat-sheets and aretypically fabricated from polytetrafluoroethylene (PTFE),polypropylene (PP) or polyvinylidene fluoride (PVDF)materials. Their pore size ranges from 100 Å (0.01�m)to 1�m. As occurred in other membrane processes, thesuccessful application of MD may be aided by a goodknowledge of the properties of the MD membranes used.Actually, the available structural characterization techniquesof membranes cover a broad range of physical methods,which can be divided in two main groups, i.e. the onewhich is related to membrane permeation (i.e. liquid andgas flow tests, solute transport method, liquid displacementmethod, permporometry, etc.), and the other which per-mits to obtain directly the morphological properties of themembranes (i.e. scanning electron microscopy, SEM; trans-mission electron microscopy, TEM; field emission scanningelectron microscopy, FESEM; atomic force microscopy,AFM; electron spin resonance, ESR; Raman spectroscopy,RS; nuclear magnetic resonance, NMR; etc.). Most of thecited techniques were described in detail in review arti-cles [13,14] and could be considered as complementarytechniques rather than competitive to better understand themorphology of the MD membranes. In this article, atomicforce microscopy (AFM) is used to comply with the mainobjective of studying the MD membrane surface.
AFM is a newly developed high-resolution technique tostudy the surface morphology of the separation membranes[14–17]. It is used to obtain directly three-dimensional to-pographical images of the membrane surface up to atomiclevel resolution in air or in liquid by scanning a sharp tip,situated at the end of a microscopic cantilever, over a sur-face. Excellent advantage of this technique, other than thehigh resolution achieved, is that no special sample prepa-ration is needed. On the contrary, heavy metal coatingrequired in SEM and TEM might give some artefacts andtend to damage the membranes. In other words, a moretrue surface morphology of a polymeric membrane couldbe observed by AFM. In addition, the AFM may be used
in a number of different modes: contact mode, non-contactmode and tapping or intermittent mode.
In fact, AFM was first applied to polymer membranesurface by Albrecht and Quate[15] in 1988 soon after itwas invented by Binning et al.[16]. The technique hasbeen applied, since then, extensively for studying varioustypes of membranes and materials[14,17], including mi-crofiltration membranes[18,19], ultrafiltration membranes[20–22], nanofiltration membranes[23,24], reverse osmosismembranes[25,26] and gas separation membranes[27,28]giving useful information about surface morphology, poresize, nodule size, pore density, porosity and roughness. Asit was mentioned earlier, Khulbe and Matsuura have given areview of characterization of synthetic membranes by AFM[14]. To our knowledge, AFM study of membranes used inMD process has not been reported yet.
The preparation and characterization of MD membraneswere the objective of our previous paper[11]. Polyvinyli-dene fluoride (PVDF) membranes with different pore sizeswere successfully prepared and characterized. Their liq-uid entry pressure of water (LEPw), mean pore size andporosity were determined. The wet/dry flow method andthe gas permeation test were used. In the present work,the same PVDF membranes are analyzed by tapping modeatomic force microscopy (TM-AFM) technique to elucidatethe changes in surface topography and membrane struc-ture with the membrane preparation conditions. Also, twocommercial PVDF membranes used in MD are studied byTM-AFM and compared to the laboratory prepared PVDFmembranes. A general theoretical model that considers thepore size distribution and the gas transport mechanismsthrough the membrane pores is developed for VMD pro-cess. The membrane characteristics obtained by TM-AFMin combination with the transport model are used to predictthe water vapor transfer coefficients of the MD membranes.The theoretical water vapor transfer coefficients of the MDmembranes are compared with the experimental ones cal-culated from the measured VMD flux to check the abilityof AFM technique to characterize MD membranes withoutthe need of MD process measurements.
2. Experimental
2.1. Materials
Two commercial microporous polyvinylidene fluoride(PVDF) flat-sheet membranes, GVHP and HVHP, sup-plied from Millipore with the trade name Durapore; andlaboratory prepared flat-sheet PVDF membranes withdifferent pore sizes were used. The polymer PVDF, Ky-nar grade 740 (Elf Autochem, Philadelphia), the solventN,N-dimethylacetamide (DMAC) (synthesis grade, Merck,>99%) and the non-solvent additive “pure water” wereemployed to prepare the casting solutions. The MD mem-branes were prepared by the phase inversion technique from
M. Khayet et al. / Journal of Membrane Science 238 (2004) 199–211 201
casting solutions containing 15 wt.% of the polymer PVDF,different concentrations of non-solvent additive varyingfrom 0 to 5.95 wt.% and the solvent DMAC. Details con-cerning the preparation of the MD membrane proceduremay be found in earlier publication[11].
2.2. Membrane characterization methods
The procedures and the apparatuses used to determinethe characteristics of the MD membranes given inTable 1were described in details in our previous paper[11]. In thisstudy, laboratory prepared PVDF membranes and two com-mercial PVDF membranes were structurally characterizedby a tapping mode atomic force microscope (TM-AFM) ona Nanoscope III equipped with 1553D scanner from DigitalInstruments, Santa Barbara, CA, USA. The mode of opera-tion to take the AFM pictures was extensively described inprevious works[14,20,21,26–28]. Small pieces of approxi-mately 0.5 cm× 0.5 cm in area were cut from each mem-brane and fixed over a magnetic holder by using doubleside adhesive tape. All the TM-AFM images were made inair at room temperature at different locations of each mem-brane sample. In this study, scans were made on areas of5�m × 5�m and areas of 1�m × 1�m were selected ran-domly on the membrane surface for analysis.
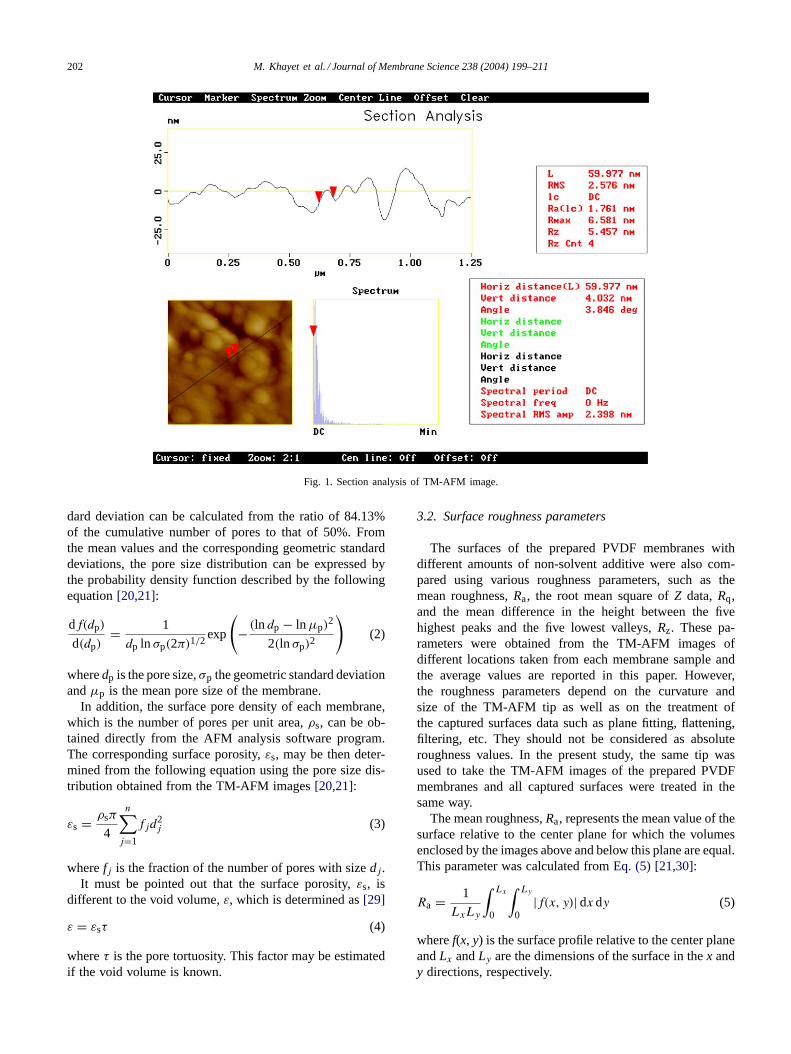
The membrane pore sizes, nodule sizes and roughnessparameters were determined by AFM by the method de-scribed earlier[14]. To obtain the pore sizes and nodule sizes,cross-sectional line profiles were selected to traverse micronscan surface areas of the TM-AFM images. The diameters ofnodules (i.e. high peaks) or pores (i.e. low valleys) were mea-sured by a pair of cursors along the reference line. The hori-zontal distance between each pair of cursors was taken as thediameter of the nodule or pore. An example of the measure-ments is shown inFig. 1. The AFM software program allowsquantitative determination of pores or nodules by use of theimages in conjunction with digitally stored line profiles. The
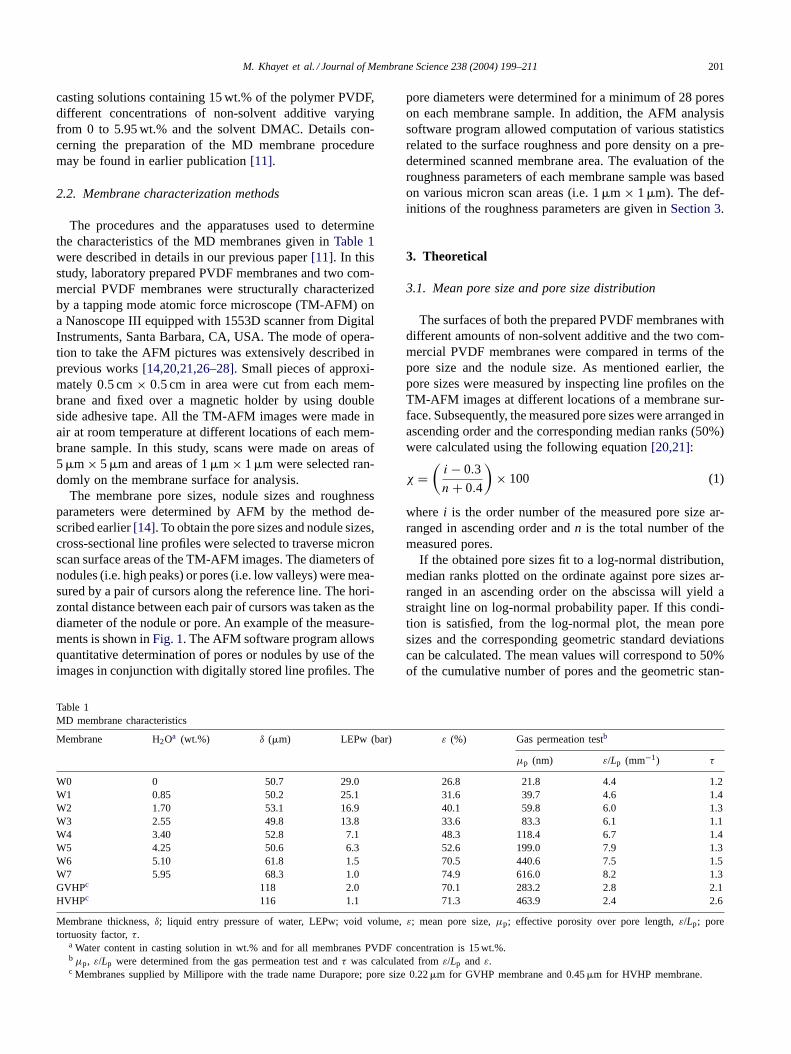
Table 1MD membrane characteristics
Membrane H2Oa (wt.%) δ (�m) LEPw (bar) ε (%) Gas permeation testb
µp (nm) ε/Lp (mm−1) τ
W0 0 50.7 29.0 26.8 21.8 4.4 1.2W1 0.85 50.2 25.1 31.6 39.7 4.6 1.4W2 1.70 53.1 16.9 40.1 59.8 6.0 1.3W3 2.55 49.8 13.8 33.6 83.3 6.1 1.1W4 3.40 52.8 7.1 48.3 118.4 6.7 1.4W5 4.25 50.6 6.3 52.6 199.0 7.9 1.3W6 5.10 61.8 1.5 70.5 440.6 7.5 1.5W7 5.95 68.3 1.0 74.9 616.0 8.2 1.3GVHPc 118 2.0 70.1 283.2 2.8 2.1HVHPc 116 1.1 71.3 463.9 2.4 2.6
Membrane thickness,δ; liquid entry pressure of water, LEPw; void volume,ε; mean pore size,µp; effective porosity over pore length,ε/Lp; poretortuosity factor,τ.
a Water content in casting solution in wt.% and for all membranes PVDF concentration is 15 wt.%.bµp, ε/Lp were determined from the gas permeation test andτ was calculated fromε/Lp and ε.c Membranes supplied by Millipore with the trade name Durapore; pore size 0.22�m for GVHP membrane and 0.45�m for HVHP membrane.
pore diameters were determined for a minimum of 28 poreson each membrane sample. In addition, the AFM analysissoftware program allowed computation of various statisticsrelated to the surface roughness and pore density on a pre-determined scanned membrane area. The evaluation of theroughness parameters of each membrane sample was basedon various micron scan areas (i.e. 1�m × 1�m). The def-initions of the roughness parameters are given inSection 3.
3. Theoretical
3.1. Mean pore size and pore size distribution
The surfaces of both the prepared PVDF membranes withdifferent amounts of non-solvent additive and the two com-mercial PVDF membranes were compared in terms of thepore size and the nodule size. As mentioned earlier, thepore sizes were measured by inspecting line profiles on theTM-AFM images at different locations of a membrane sur-face. Subsequently, the measured pore sizes were arranged inascending order and the corresponding median ranks (50%)were calculated using the following equation[20,21]:
χ =(i− 0.3
n+ 0.4
)× 100 (1)
where i is the order number of the measured pore size ar-ranged in ascending order andn is the total number of themeasured pores.
If the obtained pore sizes fit to a log-normal distribution,median ranks plotted on the ordinate against pore sizes ar-ranged in an ascending order on the abscissa will yield astraight line on log-normal probability paper. If this condi-tion is satisfied, from the log-normal plot, the mean poresizes and the corresponding geometric standard deviationscan be calculated. The mean values will correspond to 50%of the cumulative number of pores and the geometric stan-
202 M. Khayet et al. / Journal of Membrane Science 238 (2004) 199–211
Fig. 1. Section analysis of TM-AFM image.
dard deviation can be calculated from the ratio of 84.13%of the cumulative number of pores to that of 50%. Fromthe mean values and the corresponding geometric standarddeviations, the pore size distribution can be expressed bythe probability density function described by the followingequation[20,21]:
df(dp)
d(dp)= 1
dp ln σp(2π)1/2exp
(− (ln dp − lnµp)
2
2(ln σp)2
)(2)
wheredp is the pore size,σp the geometric standard deviationandµp is the mean pore size of the membrane.
In addition, the surface pore density of each membrane,which is the number of pores per unit area,ρs, can be ob-tained directly from the AFM analysis software program.The corresponding surface porosity,εs, may be then deter-mined from the following equation using the pore size dis-tribution obtained from the TM-AFM images[20,21]:
εs = ρsπ
4
n∑j=1
fjd2j (3)
wherefj is the fraction of the number of pores with sizedj.It must be pointed out that the surface porosity,εs, is
different to the void volume,ε, which is determined as[29]
ε = εsτ (4)
whereτ is the pore tortuosity. This factor may be estimatedif the void volume is known.
3.2. Surface roughness parameters
The surfaces of the prepared PVDF membranes withdifferent amounts of non-solvent additive were also com-pared using various roughness parameters, such as themean roughness,Ra, the root mean square ofZ data,Rq,and the mean difference in the height between the fivehighest peaks and the five lowest valleys,Rz. These pa-rameters were obtained from the TM-AFM images ofdifferent locations taken from each membrane sample andthe average values are reported in this paper. However,the roughness parameters depend on the curvature andsize of the TM-AFM tip as well as on the treatment ofthe captured surfaces data such as plane fitting, flattening,filtering, etc. They should not be considered as absoluteroughness values. In the present study, the same tip wasused to take the TM-AFM images of the prepared PVDFmembranes and all captured surfaces were treated in thesame way.
The mean roughness,Ra, represents the mean value of thesurface relative to the center plane for which the volumesenclosed by the images above and below this plane are equal.This parameter was calculated fromEq. (5) [21,30]:
Ra = 1
LxLy
∫ Lx
0
∫ Ly
0|f(x, y)| dx dy (5)
wheref(x, y) is the surface profile relative to the center planeandLx andLy are the dimensions of the surface in thex andy directions, respectively.

M. Khayet et al. / Journal of Membrane Science 238 (2004) 199–211 203
The root mean square roughness,Rq, is the standard de-viation of theZ values within the specific area and is calcu-lated using the following equation[21,30]:
Rq =√∑
(Zi − Zm)2
Np(6)
whereZi is the currentZ value, Zm the average of theZvalues andNp is the number of points within a given area.
The average difference in height,Rz, between the fivehighest peaks and the five lowest valleys is calculated relativeto the mean plane, which is a plane about which the imagedata has a minimum variance.
All these parameters could be measured by TM-AFMand quantitatively determined by an AFM analysis softwareprogram.
3.3. VMD coefficient of the PVDF membranes
In MD literature, various theoretical models have beendeveloped based on the kinetic theory of gases to determinethe MD flux [2]. In fact, different types of mechanismshave been proposed for the transport of gases or vaporsthrough microporous hydrophobic membranes, namely,Knudsen flow model, viscous flow model, ordinary molec-ular diffusion model and/or the combination thereof oftensummarized by the dusty gas model[2]. As assumed in thispaper, the MD membranes are considered to posses a col-lection of non-interconnected cylindrical pores to use theabove cited models and determine the transport propertiesof the MD membranes. In VMD process considered in thisstudy, the driving force is maintained by applying vacuumat the permeate side to keep the pressure at this side be-low the equilibrium vapor pressure. In this configuration,the ordinary molecular diffusion resistance is neglected be-cause it is proportional to the partial pressure of air in themembrane pores and in VMD only traces of air are presentwithin the membrane pores. Thus, the VMD mass flux wasdescribed by Knudsen flow model[31] or by the combinedKnudsen/viscous flow model[32] depending on the mem-brane pore size and on the mean free molecular path,λ, ofthe transferring species. These last two factors determinewhich mechanism of mass transfer will dominate.
Matsuura[33] stated that Knudsen type flow is dominantwhen the ratio of the pore radius to the mean free path (i.e.rp/λ) is lower than 0.05. In this case, the molecule–pore wallcollisions dominate gas transport mechanism and the VMDcoefficient of componenti through a single membrane poreis expressed as follows:
Bki = 2π
3
1
RT
(8RT
πMi
)1/2 r3k
δ(7)
whererk is the pore radius in Knudsen region,Mi the molec-ular weight of gasi, R the gas constant andδ is the mem-brane thickness.
When(rp/λ) > 50, the molecule–molecule collisions willdominate and viscous flow occurs (i.e. Poisseuille flow). Forthis mechanism, the VMD coefficient of speciei through asingle membrane pore is expressed as
Bvi = πr4v
8ηi
p̄
RT
1
δ(8)
where rv is the pore radius in Poisseuille region,ηi theviscosity of speciei andp̄ is the average partial pressure ofspeciei in the pore.
When the radius,rp, is between 0.05λ and 50λ, bothmolecule–molecule and molecule–wall interactions have tobe considered and the pores contribute to the total masstransport by a mechanism operative in the Knudsen–viscoustransition region. In this case, the VMD coefficient of speciei through a single membrane pore can be described byEq. (9)as reported in[2,32]:
Bti =
π
RTδ
(2
3
(8RT
πMi
)1/2
r3t + r4t
8ηip̄
)(9)
wherert is the pore radius in the transition region.In the case of a membrane with a distribution of pore
size, all the above mechanisms can occur simultaneously, butto different extents, depending on the operating conditionsof pressure, temperature and the gas or vapor under study.Hence, the total VMD coefficient of the membrane can beestimated by considering each pore by applying the relevantVMD coefficient equation through it and then summing theVMD coefficients over the entire system of pores. Therefore,the total VMD coefficient,Bm
i , is given by
Bmi = ρs
δ
m(r=0.05λ)∑
j=1
Gki fjr
3j
+p (r=50λ)∑
j=m(r=0.05λ)
(Gki fjr
3j +Gv
i fjr4j p̄)
+n (r=rmax)∑j=p (r=50λ)
Gvi fjr
4j p̄
(10)
where
Gki =
(32π
9MiRT
)1/2
(11)
Gvi = π
8ηi
1
RT(12)
and fj is the fraction of pores with pore radiusrj, ρs thetotal number of pores per unit area as stated earlier,m thelast class of pores in Knudsen region andp is the last classof pores in the transition region.
It is to be noted that inEq. (10)the upper limit of eachsummation is altered depending on the maximum pore radius(rmax). The following three cases are possible: (1) if(rmax<

204 M. Khayet et al. / Journal of Membrane Science 238 (2004) 199–211
0.05λ), only Knudsen mechanism prevails; (2) if(0.05λ <rmax < 50λ) both Knudsen and transition mechanisms areapplicable; (3) if(rmax> 50λ) all mechanisms are operativesimultaneously.Bmi can be calculated by knowing the pore size distri-
bution, membrane pore density and average pressure in thepore by usingEq. (10)(i.e. mean pressure of the partial pres-sure of ith specie on both the feed and the permeate sidesof the membrane). For single component system, the partialpressure on the permeate side is equal to the total pressureon the permeate side.
On the other hand, the molar flux of componenti, Fi, islinearly related to its partial pressure difference across themembrane pores as stated in previous papers[2,31,32]:
Fi = Bmi (pi,m − pi,p) (13)
wherepi,m andpi,p are the partial pressures of componenti at the upstream and downstream of the membrane surface,respectively.
Moreover, it is well known that in VMD, a simultaneousheat and mass transfer through the membrane occurs andthe temperature at the vapor–liquid interface differs fromthe bulk conditions. The heat required for the interfacialevaporation is supplied by the heat flux through the liquidphase, neglecting the heat transfer through the vacuum side.A simple enthalpy balance usually used in VMD process is[2,31,32]
hf (Tb − Tm) =n∑i=1
Fi&Hv,i (14)
where&Hv,i is the evaporation enthalpy of speciei oftransmembrane fluxFi, n the number of species,hf the heattransfer coefficient in the liquid phase,Tb the feed bulktemperature andTm is the temperature at the liquid–vaporinterface.
For pure component, Antoine’s equation can be used tocalculate the partial pressure at the membrane surface,pi,m[2].
In this work, the heat transfer coefficient is correlatedfor turbulent liquid flow by the following semi-empiricalcorrelation[2,32]:
Nu = 0.023Re0.8 Pr1/3 (15)
whereNu, ReandPr are the Nusselt, Reynolds and Prandtlnumbers, respectively.
Using Eqs. (13)–(15), the VMD coefficient,Bmi , can be
calculated from the molar flux,Fi, obtained by MD ex-periments for a pure componenti. The ReandPr are firstcalculated at the bulk feed temperature andhf is evaluatedusingEq. (15). Subsequently, fromEq. (14)the temperatureof the feed at the membrane surface,Tm, is obtained. Newvalues ofRe and Nu numbers are calculated at the meantemperature,(Tb+Tm)/2. Then, the heat transfer coefficientis calculated again fromEq. (15). The procedure is repeateduntil the difference between two successive calculated tem-peratures at the membrane surface,Tm, is less than 0.01%.
The corresponding vapor pressure,pi,m, is then calculatedusing Antoine’s equation. Finally, the VMD coefficient ofthe membrane,Bm
i , is calculated fromEq. (13)and referredto in this study as the experimental water vapor transfercoefficient as it is calculated from the measured VMD flux.
Going back toEq. (10), this equation can be simplifiedwhen an uniform pore radius〈r〉 is assumed. Namely, when〈r〉 < 0.05λ, Knudsen flow dominates and
Bm,ki = 2
3RT
ε〈r〉τδ
(8RT
πMi
)1/2
(16)
while, when 0.05λ < 〈r〉 < 50λ, the transition flow willdominate and
Bm,ti = 1
RTδ
(2ε〈r〉
3τ
(8RT
πMi
)1/2
+ ε〈r〉2
8τηip̄
)(17)
4. Results and discussion
4.1. Results on morphological characterization of MDmembranes by TM-AFM
Three-dimensional TM-AFM pictures of some MD mem-branes are presented inFig. 2. The membrane surfaces arenot smooth and nodule aggregates are observed. The nodulesare seen as bright high peaks, whereas the pores are seen asdark depressions. The pore sizes and the nodule sizes weremeasured as stated earlier and the TM-AFM image analysiswas done by the built-in computer program. It was observedthat the pores were not necessarily circular and therefore theaverage of their length and width was recorded as pore size.
The median ranks were plotted versus measured pore sizeson a log-normal probability paper. Straight lines have beenfitted to the data with reasonably high correlation coefficient(r2 > 0.95) for all membranes. As an example,Fig. 3showsthe log-normal pore size distribution of some membranes.The mean pore size and the geometric standard deviationwere calculated for each membrane according to the methoddescribed earlier. The results are presented inTable 2. Thecumulative pore size distribution and the probability den-sity function curves were generated fromEq. (2) by usingthe obtained values of the mean pore size and the geometri-cal standard deviation.Fig. 4 shows the probability densityfunction curves of the MD membranes. When compared tothe membrane W0, it can be observed that the pore size dis-tribution curves shift to the right when the concentration ofthe non-solvent is increased in the PVDF casting solutionand the pore size distribution becomes lower and broaderaround the mean pore size. FromTable 1 it can also benoticed that the membranes prepared with higher amountsof non-solvent additive in the polymer casting solution ex-hibit larger pores. In other words, the mean pore sizes de-termined by TM-AFM have the same trend as the pore sizedetermined by the gas permeation test[11]. Nevertheless,the pore sizes determined by TM-AFM were 1.2–2.1 times

M. Khayet et al. / Journal of Membrane Science 238 (2004) 199–211 205
Fig. 2. Three-dimensional TM-AFM images of the PVDF membranes (W0, W3, W5, W7).
Pore radius (nm)
1 10 100 1000
% P
ore
s w
ith s
ize l
ess
than s
tate
d v
alu
e
10
30
50
70
90
W0
W7
HVHP
GVHP
W1
W4
Fig. 3. The log-normal pore size distributions obtained from the TM-AFMimages of the MD membranes W0, W1, W4, W7, GVHP and HVHP.
larger than those calculated from the gas permeation test(seeTable 1). This is probably because the pores measuredby TM-AFM have maximum openings at the surface en-trance and a few small pores could easily be misinterpretedas one large pore when they are amalgamated, resulting inan overestimation of the pore sizes. This fact was observedpreviously for ultrafiltration and nanofiltration membranes[20,21,30,34].
Moreover, Phattaranawik et al.[35], by using thelog-normal distribution function to determine the pore sizedistribution of the GVHP and HVHP membranes by theFESEM analysis, found that the pore size distribution ofGVHP was wider than HVHP around the mean pore size(251 nm for GVHP and 414 nm for HVHP). The mean poresizes of the Millipore membranes determined in the presentstudy by TM-AFM were 1.97 and 1.56 times higher thanthose obtained by Phattaranawik et al.[35] from their FE-SEM study. This may be due to pore contraction duringmetal coating of the membrane sample, which was re-quired to produce the FESEM images. In addition, as canbe seen inTable 2, the values of the geometrical standarddeviation,σp, of the prepared MD membranes were close
206 M. Khayet et al. / Journal of Membrane Science 238 (2004) 199–211
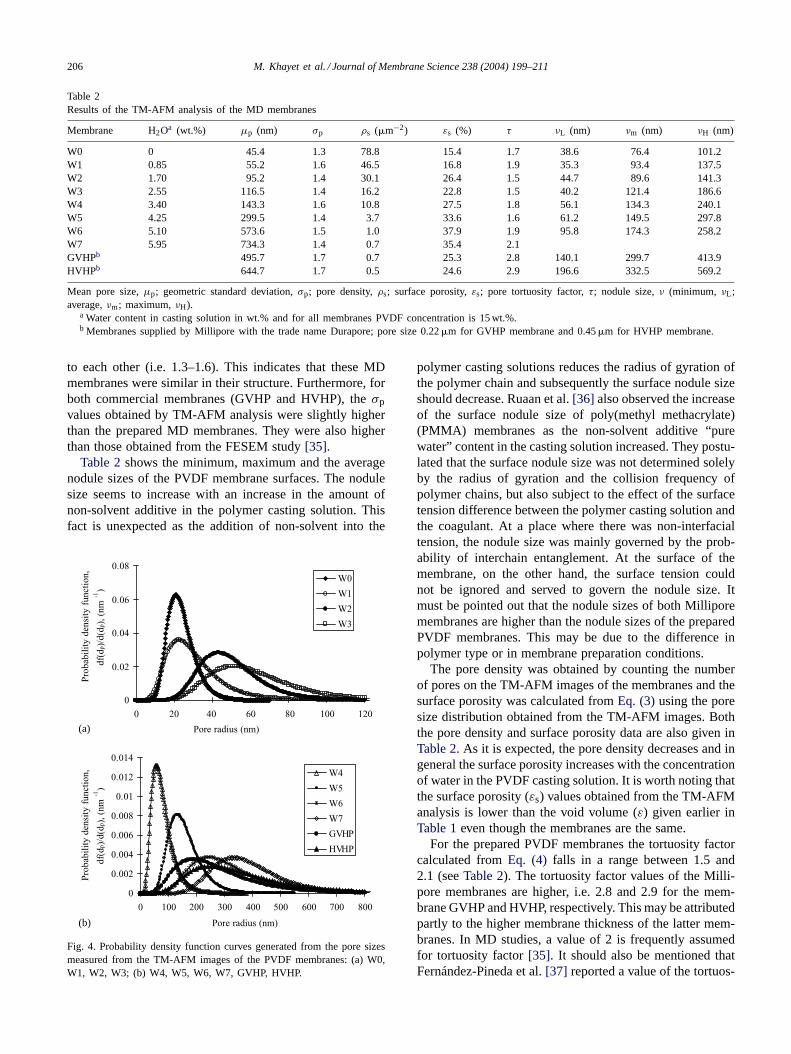
Table 2Results of the TM-AFM analysis of the MD membranes
Membrane H2Oa (wt.%) µp (nm) σp ρs (�m−2) εs (%) τ νL (nm) νm (nm) νH (nm)
W0 0 45.4 1.3 78.8 15.4 1.7 38.6 76.4 101.2W1 0.85 55.2 1.6 46.5 16.8 1.9 35.3 93.4 137.5W2 1.70 95.2 1.4 30.1 26.4 1.5 44.7 89.6 141.3W3 2.55 116.5 1.4 16.2 22.8 1.5 40.2 121.4 186.6W4 3.40 143.3 1.6 10.8 27.5 1.8 56.1 134.3 240.1W5 4.25 299.5 1.4 3.7 33.6 1.6 61.2 149.5 297.8W6 5.10 573.6 1.5 1.0 37.9 1.9 95.8 174.3 258.2W7 5.95 734.3 1.4 0.7 35.4 2.1GVHPb 495.7 1.7 0.7 25.3 2.8 140.1 299.7 413.9HVHPb 644.7 1.7 0.5 24.6 2.9 196.6 332.5 569.2
Mean pore size,µp; geometric standard deviation,σp; pore density,ρs; surface porosity,εs; pore tortuosity factor,τ; nodule size,ν (minimum, νL ;average,νm; maximum,νH).
a Water content in casting solution in wt.% and for all membranes PVDF concentration is 15 wt.%.b Membranes supplied by Millipore with the trade name Durapore; pore size 0.22�m for GVHP membrane and 0.45�m for HVHP membrane.
to each other (i.e. 1.3–1.6). This indicates that these MDmembranes were similar in their structure. Furthermore, forboth commercial membranes (GVHP and HVHP), theσpvalues obtained by TM-AFM analysis were slightly higherthan the prepared MD membranes. They were also higherthan those obtained from the FESEM study[35].
Table 2shows the minimum, maximum and the averagenodule sizes of the PVDF membrane surfaces. The nodulesize seems to increase with an increase in the amount ofnon-solvent additive in the polymer casting solution. Thisfact is unexpected as the addition of non-solvent into the
0
0.02
0.04
0.06
0.08
0 20 40 60 80 100 12
Pore radius (nm)
Pro
babil
ity d
ensi
ty f
uncti
on,
df(
dp)/
d(d
p),
(nm
-1)
W0
W1
W2
W3
0
(a)
(b)
0
0.002
0.004
0.006
0.008
0.01
0.012
0.014
0 100 200 300 400 500 600 700 800
Pore radius (nm)
Pro
babil
ity d
ensi
ty f
uncti
on,
df(
dp)/
d(d
p),
(nm
-1)
W4
W5
W6
W7
GVHP
HVHP
Fig. 4. Probability density function curves generated from the pore sizesmeasured from the TM-AFM images of the PVDF membranes: (a) W0,W1, W2, W3; (b) W4, W5, W6, W7, GVHP, HVHP.
polymer casting solutions reduces the radius of gyration ofthe polymer chain and subsequently the surface nodule sizeshould decrease. Ruaan et al. [36] also observed the increaseof the surface nodule size of poly(methyl methacrylate)(PMMA) membranes as the non-solvent additive “purewater” content in the casting solution increased. They postu-lated that the surface nodule size was not determined solelyby the radius of gyration and the collision frequency ofpolymer chains, but also subject to the effect of the surfacetension difference between the polymer casting solution andthe coagulant. At a place where there was non-interfacialtension, the nodule size was mainly governed by the prob-ability of interchain entanglement. At the surface of themembrane, on the other hand, the surface tension couldnot be ignored and served to govern the nodule size. Itmust be pointed out that the nodule sizes of both Milliporemembranes are higher than the nodule sizes of the preparedPVDF membranes. This may be due to the difference inpolymer type or in membrane preparation conditions.
The pore density was obtained by counting the numberof pores on the TM-AFM images of the membranes and thesurface porosity was calculated from Eq. (3) using the poresize distribution obtained from the TM-AFM images. Boththe pore density and surface porosity data are also given inTable 2. As it is expected, the pore density decreases and ingeneral the surface porosity increases with the concentrationof water in the PVDF casting solution. It is worth noting thatthe surface porosity (εs) values obtained from the TM-AFManalysis is lower than the void volume (ε) given earlier inTable 1 even though the membranes are the same.
For the prepared PVDF membranes the tortuosity factorcalculated from Eq. (4) falls in a range between 1.5 and2.1 (see Table 2). The tortuosity factor values of the Milli-pore membranes are higher, i.e. 2.8 and 2.9 for the mem-brane GVHP and HVHP, respectively. This may be attributedpartly to the higher membrane thickness of the latter mem-branes. In MD studies, a value of 2 is frequently assumedfor tortuosity factor [35]. It should also be mentioned thatFernández-Pineda et al. [37] reported a value of the tortuos-

M. Khayet et al. / Journal of Membrane Science 238 (2004) 199–211 207
Table 3Roughness parameters and pure water VMD flux of the prepared MD membranes
Membrane H2Oa (wt.%) Ra (nm) Rq (nm) Rz (nm) VMD flux (10−3 mol/m2 s)
W0 0 5.3 6.7 46.3 10.5W1 0.85 5.7 7.0 64.4 19.4W2 1.70 7.3 9.6 86.0 35.9W3 2.55 7.8 10.7 99.5 51.5W4 3.40 8.1 10.2 72.9 80.0W5 4.25 9.1 11.4 90.0 143.1W6 5.10 11.7 15.3 104.1 265.4W7 5.95 10.2 14.9 106.9GVHP 100.5
a Water content in casting solution in wt.% and for all membranes PVDF concentration is 15 wt.%.
ity factor as high as 3.9. In contrast, Phattaranawik et al. [35]assumed a value of 2 for the GVHP and HVHP membranes,as an adjustable parameter, to determine the mass transfer ofthese membranes. It must be mentioned here that from theε values and the effective porosity over pore length, ε/Lp,determined by the gas permeation test, the tortuosity fac-tor may be calculated as Lp is the effective pore length thattakes into consideration the tortuosity effect (i.e. Lp = τδ).Tortuosity factors so obtained are given in Table 1. Thesevalues are lower than those given in Table 2 for both theprepared PVDF membranes (i.e. 1.1–1.5) and for Milliporemembranes (i.e. 2.1 and 2.6).
The roughness parameters were evaluated from TM-AFMimages on different parts of the same membrane sample andthe mean values are reported in Table 3 for each parameter.Generally, the roughness parameter of the membranes be-came larger with an increase in pore size and nodule size.This may be explained since the roughness parameters de-pend on the Z values. In fact, when the surface consists ofdeep depressions that characterize pores and high peaks thatcorrespond to nodules, high roughness parameters are ex-pected. In this study, membranes of larger pore sizes andnodule sizes were cast from polymer solutions having largeramounts of the non-solvent additive. The same relationshipbetween roughness parameter and pore size was also ob-served by other researchers [20].
4.2. Experimental and predicted water vapor transfercoefficients of MD membranes: VMD application
In our previous study [11] the effects of the feed tem-perature, the stirring rate and the permeate pressure on theVMD flux were studied. The dependence of the involvedoperating parameters on the mass transfer in VMD appli-cations was well investigated in a number of previously re-ported papers [2,32,33]. It must be pointed out that in VMDthe permeate pressure must be lower than the saturation va-por pressure of the feed solution in order to drive the vaporthrough the membrane pores while preventing condensationinside the pores. In comparison to other MD configurations(i.e. DCMD, AGMD and SGMD) the risk of membrane porewetting in VMD embodiment is higher. The conditions ofthe experiments carried out to determine the water vapor co-
efficient of the PVDF membranes were a downstream pres-sure of 1666.5 Pa, a feed temperature of 25 ◦C and a maxi-mum stirring rate of 53.3 revolutions/s (rps). The feed liquidwas pure water. It should be mentioned here that under theabove experimental conditions VMD experiments could notbe carried out using the membranes W7 and HVHP becauseof the observed wetting of the membrane pores. Similarsets of permeation experiments were conducted for all othermembranes having different pore sizes. Under the abovecited experimental conditions the calculated mean free pathof water vapor, λw, considering the average partial pressurein the pore is 5.524 �m. Therefore, the membranes havingpores with size (i.e. diameter) below 0.5524 �m lend them-selves to the Knudsen region. All pores having sizes be-tween 552.4 �m and the maximum pore size are in viscousflow region, and pores in the intermediate range 0.5524 and552.4 �m are considered in the transition region. The pro-portions of Knudsen and transition regions can be evaluatedby the cumulative pore size distribution. It was found thatall pores of the prepared MD membranes W0, W1, W2 andW3 were in the Knudsen region, while the membranes W4,W5, W6 and GVHP had pore sizes in both the Knudsen andthe transition regions. From Fig. 4(b), the calculated frac-tions of pores in the Knudsen region were 99.8, 96.0, 46.2and 57.0% for the membranes W4, W5, W6 and GVHP, re-spectively.
The measured VMD fluxes are also presented in Table 3[11]. It was observed that the VMD flux increased expo-nentially with the increase of the water concentration in thePVDF casting solution and the VMD flux of the GVHPmembrane was about one third of the W6 membrane (i.e.10.05×10−2 mol/m2 s). This result may be primarily due tohigher tortuosity factor and higher thickness of the GVHPmembrane. The exponential increase of the VMD flux withthe non-solvent content in the PVDF casting solution is prin-cipally caused by the enhancement of both the pore sizeand the effective porosity of the prepared PVDF membranesas shown previously [11]. It must be pointed out that theVMD flux of the PVDF membranes increases with the mem-brane roughness. This may be explained since the mem-brane roughness is higher for membranes having larger poresizes and nodule sizes as well as higher surface porosity.In fact, the increase of the membrane permeation flux with

208 M. Khayet et al. / Journal of Membrane Science 238 (2004) 199–211
0
5
10
15
20
25
30
35
40
45
0 1 2 3 4 5 6
H2O content in the PVDF casting solution ( wt %)
Wate
r v
ap
or
tran
sfer
co
eff
icie
nt
(10
-5 m
ol/
m2.s
.Pa)
Predicted:TM-AFM
Experimental
Fig. 5. Experimental and predicted water vapor transfer coefficients based on the TM-AFM pore size distribution of the prepared MD membranes vs.water content in the casting solution.
the membrane roughness was observed previously by Hi-rose et al. [25] for polyamide composite reverse osmosis(RO) membranes, Stamatialis et al. [26] for dense and in-tegrally skinned cellulose acetate RO membranes, Khulbeand Matsuura [14] for polyphenylene oxide (PPO) gas sep-aration membranes, and Chung et al. [38] for ultrafiltrationhollow-fiber polyethersulfone (PES) membranes.
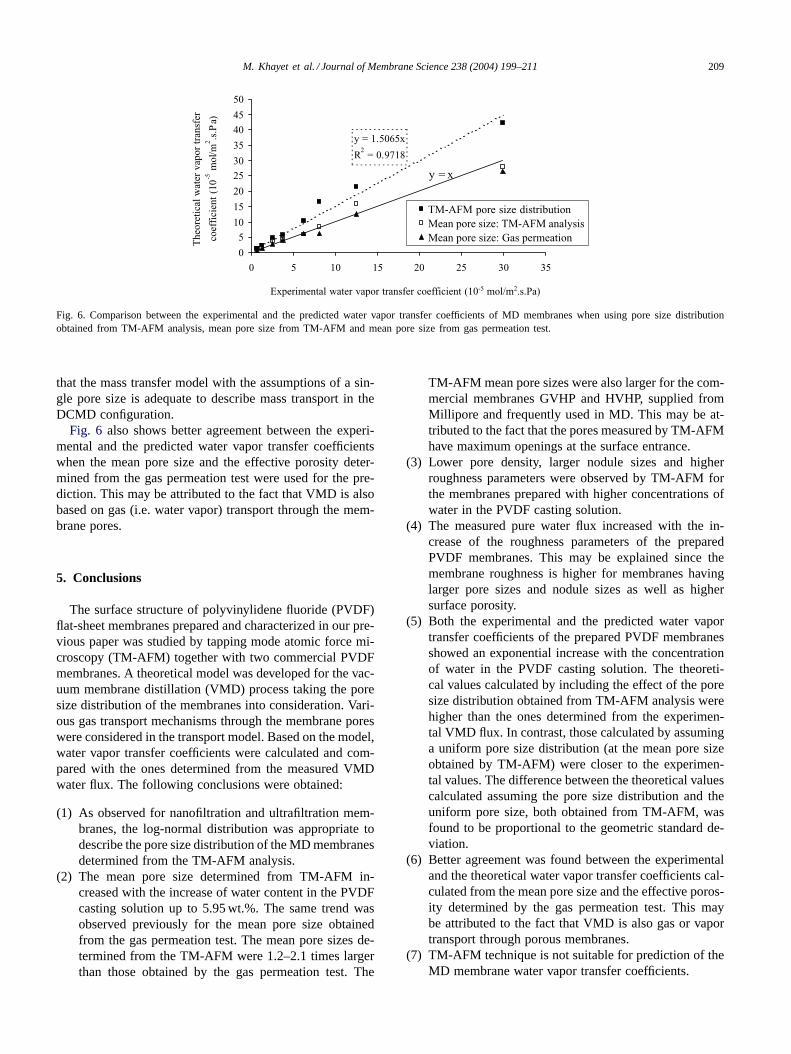
As it was stated earlier, one of the objectives of this workis to calculate the water vapor transfer coefficient of the MDmembranes based on the pore size distribution obtained fromthe TM-AFM analysis (Fig. 4) and to compare the resultwith that determined from the experimental VMD flux. Theresults are plotted in Fig. 5 as a function of the water contentin the PVDF casting solution. It can be observed that boththe experimental and the predicted water vapor transfer co-efficients follow a similar trend but the theoretical values arehigher than the experimental ones. For the membrane GVHP,the predicted water vapor transfer coefficient is 2.1 timeshigher than the experimental one. This may be due, as statedearlier, to the fact that larger pore sizes are obtained fromTM-AFM analysis than those determined from the gas per-meation test. It must be mentioned that for W4, W5, W6 andGVHP membranes the viscous contribution in the transitionregion to the total water vapor transfer coefficient is as lowas less than 0.05%. Therefore, under our experimental con-ditions, Eq. (10) for single gas permeation can be modifiedneglecting the viscous contribution in the transition region.This result corroborates the use of Knudsen mechanism byother researchers [31] when a flat-sheet polytetrafluoroethy-lene (PTFE, TF200) membrane and a polypropylene tubularmembrane (Accurel Q3/2) with a pore size of 0.2 �m andporosities of 60 and 75% were used, respectively. Martı́nezet al. [29] also reported that viscous contributions can beignored for membranes having small pores when they areused at low water vapor pressures.
In addition, the effects of the pore size distribution onthe water vapor transfer coefficient was examined by com-paring the water vapor transfer coefficients calculated fromEq. (10), which takes into account the pore size distribu-
tions with those obtained from Eqs. (16) and (17), in whicha uniform pore size (i.e. mean pore size) is assumed. In thelatter calculation, two different sources of the mean poresizes; i.e. one obtained from gas permeation experiments(Table 1) and the other obtained by TM-AFM (Table 2),were used. While Eq. (16) was applicable for all consid-ered membranes (W1, W2, W3, W4, W5, W6 and GVHP)when the pore sizes were taken from Table 1, since Knudsenflow was applicable, Eq. (16) could be used only for mem-branes W1, W2, W3, W4, W5 and GVHP when the poresizes were taken from Table 2. For W6, the mean pore sizebelonged to the transition region and therefore Eq. (17) wasused. Fig. 6 shows the calculated water vapor transfer coef-ficients with and without considering pore size distribution.Fig. 6 also includes the experimental water vapor transfercoefficient. Comparing the water vapor transfer coefficientscalculated with the pore size distributions (given in Fig. 4)and with the mean pore sizes (given in Table 2), both basedon the TM-AFM experiments, those calculated by includingthe effect of pore size distribution were 1.2–1.7 times higherfor the prepared PVDF membranes and 2 times higher forthe GVHP membrane. Interestingly, it was observed that thedifference was proportional to the geometric standard devi-ation. In other words, the effect of the pore size distributionon the water vapor transfer coefficient becomes more impor-tant as the pore size distribution becomes broader. Martı́nezet al. [39] by using the liquid displacement technique to de-termine the pore size distribution of the GVHP and HVHPmembranes reported that the DCMD water vapor transfercoefficients calculated considering the pore size distributionwere similar to the ones obtained assuming an average poresize model. They attributed this result to the molecular dif-fusion model, which is independent of the membrane poresize, and also to the narrow pore size distributions observedfor these membranes by the liquid displacement technique.Phattaranawik et al. [35] stated that the influence of pore sizedistribution (i.e. log-normal distribution) on water fluxes inDCMD configuration was insignificant because of the largemembrane pore size used (i.e. 0.22, 0.45 �m) and concluded
M. Khayet et al. / Journal of Membrane Science 238 (2004) 199–211 209
y = 1.5065x
R2 = 0.9718
y = x
0
5
10
15
20
25
30
35
40
45
50
0 5 10 15 20 25 30 35
Experimental water vapor transfer coefficient (10-5 mol/m2.s.Pa)
Theore
tical
wate
r vapor
transf
er
co
eff
icie
nt
(10
-5 m
ol/
m2.s
.Pa)
TM-AFM pore size distribution
Mean pore size: TM-AFM analysis
Mean pore size: Gas permeation
Fig. 6. Comparison between the experimental and the predicted water vapor transfer coefficients of MD membranes when using pore size distributionobtained from TM-AFM analysis, mean pore size from TM-AFM and mean pore size from gas permeation test.
that the mass transfer model with the assumptions of a sin-gle pore size is adequate to describe mass transport in theDCMD configuration.
Fig. 6 also shows better agreement between the experi-mental and the predicted water vapor transfer coefficientswhen the mean pore size and the effective porosity deter-mined from the gas permeation test were used for the pre-diction. This may be attributed to the fact that VMD is alsobased on gas (i.e. water vapor) transport through the mem-brane pores.
5. Conclusions
The surface structure of polyvinylidene fluoride (PVDF)flat-sheet membranes prepared and characterized in our pre-vious paper was studied by tapping mode atomic force mi-croscopy (TM-AFM) together with two commercial PVDFmembranes. A theoretical model was developed for the vac-uum membrane distillation (VMD) process taking the poresize distribution of the membranes into consideration. Vari-ous gas transport mechanisms through the membrane poreswere considered in the transport model. Based on the model,water vapor transfer coefficients were calculated and com-pared with the ones determined from the measured VMDwater flux. The following conclusions were obtained:
(1) As observed for nanofiltration and ultrafiltration mem-branes, the log-normal distribution was appropriate todescribe the pore size distribution of the MD membranesdetermined from the TM-AFM analysis.
(2) The mean pore size determined from TM-AFM in-creased with the increase of water content in the PVDFcasting solution up to 5.95 wt.%. The same trend wasobserved previously for the mean pore size obtainedfrom the gas permeation test. The mean pore sizes de-termined from the TM-AFM were 1.2–2.1 times largerthan those obtained by the gas permeation test. The
TM-AFM mean pore sizes were also larger for the com-mercial membranes GVHP and HVHP, supplied fromMillipore and frequently used in MD. This may be at-tributed to the fact that the pores measured by TM-AFMhave maximum openings at the surface entrance.
(3) Lower pore density, larger nodule sizes and higherroughness parameters were observed by TM-AFM forthe membranes prepared with higher concentrations ofwater in the PVDF casting solution.
(4) The measured pure water flux increased with the in-crease of the roughness parameters of the preparedPVDF membranes. This may be explained since themembrane roughness is higher for membranes havinglarger pore sizes and nodule sizes as well as highersurface porosity.
(5) Both the experimental and the predicted water vaportransfer coefficients of the prepared PVDF membranesshowed an exponential increase with the concentrationof water in the PVDF casting solution. The theoreti-cal values calculated by including the effect of the poresize distribution obtained from TM-AFM analysis werehigher than the ones determined from the experimen-tal VMD flux. In contrast, those calculated by assuminga uniform pore size distribution (at the mean pore sizeobtained by TM-AFM) were closer to the experimen-tal values. The difference between the theoretical valuescalculated assuming the pore size distribution and theuniform pore size, both obtained from TM-AFM, wasfound to be proportional to the geometric standard de-viation.
(6) Better agreement was found between the experimentaland the theoretical water vapor transfer coefficients cal-culated from the mean pore size and the effective poros-ity determined by the gas permeation test. This maybe attributed to the fact that VMD is also gas or vaportransport through porous membranes.
(7) TM-AFM technique is not suitable for prediction of theMD membrane water vapor transfer coefficients.

210 M. Khayet et al. / Journal of Membrane Science 238 (2004) 199–211
Acknowledgements
Financial support from the University Complutense ofMadrid (UCM) and the Natural Sciences and EngineeringCouncil of Canada (NSERC) are greatly acknowledged.
Nomenclature
Bki VMD coefficient of specie i for Knudsen flow
in a single pore (mol s m/kg)Bmi VMD coefficient per unit membrane area of
specie i (mol s/kg m)Bti VMD coefficient of specie i for transition flow
in a single pore (mol s m/kg)Bvi VMD coefficient of specie i for viscous flow
in a single pore (mol s m/kg)B
m,ki VMD coefficient of specie i for Knudsen flow
defined in Eq. (16) (mol s/kg m)B
m,ti VMD coefficient of specie i for transition flow
defined in Eq. (17) (mol s/kg m)dp pore size (nm)fi fraction of pores of diameter dihf heat transfer coefficient (W/m2 K)i number of measured pores by TM-AFMLp effective pore length (m)Lx, Ly dimensions of the surface f(x, y) (nm)LEPw liquid entry pressure of water (bar)Mi molecular weight of component i (kg/kmol)n total number of measured pores by TM-AFMNp number of points in a given area defined in
Eq. (6)Nu Nusselt numberp̄ mean pressure (Pa)pi partial pressure of component i (Pa)Pr Prandtl numberr pore radius (nm)R gas constant (J/mol K)Ra mean roughness (nm)Rq root mean square of Z data (nm)Rz mean difference between five highest peaks and
five lowest valleys (nm)Re Reynolds numberT absolute temperature (K)Zi current Z value (nm)Zm average of the Z values (nm)
Greek lettersδ membrane thickness (�m)ε void volumeεs surface porosity defined in Eq. (3)ε/Lp effective porosity over pore length (m−1)ηi viscosity of specie i (N s/m2)µp mean pore size of the membrane (nm)
νH maximum nodule size (nm)νL minimum nodule size (nm)νm average nodule size (nm)ρs membrane pore density (pores/�m2)σp geometric standard deviation determined by
TM-AFM (nm)τ pore tortuosityχ median rank (50%)
References
[1] J.I. Mengual, L. Peña, Membrane distillation, Colloid Interface Sci.1 (1997) 17–29.
[2] K.W. Lawson, D.R. Lloyd, Review: membrane distillation, J. Membr.Sci. 124 (1997) 1–25.
[3] D.Y. Cheng, S.J. Wiersma, Composite membrane for a membranedistillation system, US Patent 4 316 772 (1982); 4 419 242 (1983).
[4] D.Y. Cheng, S.J. Wiersma, Apparatus and method for thermal mem-brane distillation, US Patent 4 419 187 (1983).
[5] Y. Wu, Y. Kong, X. Lin, W. Liu, J. Xu, Surface-modified hydrophilicmembranes in membrane distillation, J. Membr. Sci. 72 (1992) 189–196.
[6] Y. Kong, X. Lin, Y. Wu, J. Chen, J. Xu, Plasma polymerizationof octafluorocyclobutane and hydrophobic microporous compositemembranes for membrane distillation, J. Appl. Polym. Sci. 46 (1992)191–199.
[7] Y. Fujii, S. Kigoshi, H. Iwatani, M. Aoyama, Selectivity and charac-teristics of direct contact membrane distillation type experiments. I.Permeability and selectivity through dried hydrophobic fine porousmembranes, J. Membr. Sci. 72 (1992) 53–72.
[8] Y. Fujii, S. Kigoshi, H. Iwatani, M. Aoyama, Y. Fusaoka, Selectivityand characteristics of direct contact membrane distillation type exper-iments. II. Membrane treatment and selectivity increase, J. Membr.Sci. 72 (1992) 73–89.
[9] J.M. Ortiz de Zárate, L. Peña, J.I. Mengual, Characterization ofmembrane distillation membranes prepared by phase inversion, De-salination 100 (1995) 139–148.
[10] M. Tomaszewska, Preparation and properties of flat-sheet membranesfrom polyvinylidene fluoride for membrane distillation, Desalination104 (1996) 1–11.
[11] M. Khayet, T. Matsuura, Preparation and characterization ofpolyvinylidene fluoride membranes for membrane distillation, Ind.Eng. Chem. Res. 40 (2001) 5710–5718.
[12] M. Khayet, T. Matsuura, Application of surface modifying macro-molecules for the preparation of membranes for membrane distilla-tion, Desalination 158 (2003) 51–56.
[13] S.I. Nakao, Review: determination of pore size and pore size distri-bution. 3. Filtration membranes, J. Membr. Sci. 96 (1994) 131–165.
[14] K.C. Khulbe, T. Matsuura, Characterization of synthetic membranesby Raman spectroscopy, electron spin resonance, and atomic forcemicroscopy: a review, Polymer 41 (2000) 1917–1935.
[15] T.R. Albrecht, C.F. Quate, Atomic resolution with the atomic forcemicroscope on conductors and non-conductors, J. Vac. Sci. Technol.A 6 (1988) 271–275.
[16] G. Binning, C.F. Quate, C. Gerber, Atomic force microscope, Phys.Rev. Lett. 56 (1986) 930–933.
[17] W.R. Bowen, N. Hilal, R.W. Lovitt, P.M. Williams, C.J. Wright,in: T.S. Sorensen (Ed.), Surface Chemistry and Electrochemistry ofMembrane Surfaces, Surfactant Science Series, Marcel Dekker, NewYork, 1999, Chapter 1, pp. 1–37.
[18] P. Dietz, P.K. Hansma, O. Inacker, H.D. Lehmann, K.H. Herrmann,Surface pore structure of micro- and ultrafiltration membranes imaged

M. Khayet et al. / Journal of Membrane Science 238 (2004) 199–211 211
with the atomic force microscope, J. Membr. Sci. 65 (1992) 101–111.
[19] A. Chahboun, R. Coratger, F. Ajustron, J. Beauvillain, A. Aimar, V.Sánchez, Comparative study of micro- and ultrafiltration membranesusing STM, AFM, and SEM techniques, Ultramicroscopy 41 (1992)235–244.
[20] S. Singh, K.C. Khulbe, T. Matsuura, P. Ramamurthy, Membranecharacterization by solute transport and atomic force microscopy, J.Membr. Sci. 142 (1998) 111–127.
[21] M. Khayet, C.Y. Feng, K.C. Khulbe, T. Matsuura, Preparation andcharacterization of polyvinylidene fluoride hollow fiber membranesfor ultrafiltration, Polymer 43 (2002) 3879–3890.
[22] W.R. Bowen, N. Hilal, R.W. Lovitt, P.M. Williams, Visualisationof an ultrafiltration membrane by non-contact atomic force mi-croscopy at single pore resolution, J. Membr. Sci. 110 (1996) 229–232.
[23] W.R. Bowen, A.W. Mohammad, N. Hilal, Characterization of nanofil-tration membrane for predictive purposes—use of salts, unchargedsolutes and atomic force microscopy, J. Membr. Sci. 126 (1997)91–105.
[24] A.W. Mohammad, N. Hilal, M.N. Abu Seman, A study on produc-ing composite nanofiltration membranes with optimized properties,Desalination 158 (2003) 73–78.
[25] M. Hirose, H. Ito, Y. Kamiyama, Effect of skin layer surface struc-tures on the flux behavior of RO membranes, J. Membr. Sci. 121(1996) 209–215.
[26] D.F. Stamatialis, C.R. Dias, M.N. de Pinho, Atomic force microscopyof dense and asymmetric cellulose-based membranes, J. Membr. Sci.160 (1999) 235–242.
[27] K.C. Khulbe, B. Kruczek, G. Chowdhury, S. Gagné, T. Matsuura,S.P. Versma, Characterization of membranes prepared from PPO byRaman scattering and atomic force microscopy, J. Membr. Sci. 111(1996) 57–70.
[28] J.M.A. Tan, T. Matsuura, Effect of nonsolvent additive onthe surface morphology and the gas separation performance ofpoly(2,6-dimethyl-1,4-phenylene)oxide membranes, J. Membr. Sci.160 (1999) 7–16.
[29] L. Martı́nez, F.J. Florido-Dı́az, A. Hernández, P. Prádanos, Char-acterization of three hydrophobic porous membranes used in mem-brane distillation: modelling and evaluation of their water vapourpermeabilities, J. Membr. Sci. 203 (2002) 15–27.
[30] M. Khayet, C.Y. Feng, T. Matsuura, Morphological study of fluori-nated asymmetric polyetherimide ultrafiltration membranes by sur-face modifying macromolecules, J. Membr. Sci. 213 (2003) 159–180.
[31] S. Bandini, A. Saavedra, G.C. Sarti, Vacuum membrane distilla-tion: experiments and modeling, AIChE J. 43 (2) (1997) 398–408.
[32] K.W. Lawson, D.R. Lloyd, Membrane distillation. I. Module designand performance evaluation using vacuum membrane distillation, J.Membr. Sci. 120 (1996) 111–121.
[33] T. Matsuura, Synthetic Membranes and Membrane Separation Pro-cesses, CRC Press, Boca Raton, FL, 1993.
[34] M. Khayet, T. Matsuura, Determination of surface and bulk pore sizesof flat-sheet and hollow-fiber membranes by atomic force microscopy,gas permeation and solute transport methods, Desalination 158 (2003)57–64.
[35] J. Phattaranawik, R. Jiraratananon, A.G. Fane, Effect of pore sizedistribution and air flux on mass transport in direct contact membranedistillation, J. Membr. Sci. 215 (2003) 75–85.
[36] R.C. Ruaan, H.L. Chou, H.A. Tsai, D.M. Wang, J.Y. Lai, Factors af-fecting the nodule size of asymmetric PMMA membranes, J. Membr.Sci. 190 (2001) 135–145.
[37] C. Fernández-Pineda, M.A. Izquierdo-Gil, M.C. Garcı́a-Payo, Gaspermeation and direct contact membrane distillation experiments andtheir analysis using different models, J. Membr. Sci. 198 (2002)33–49.
[38] T.S. Chung, J.J. Qin, A. Huan, K.C. Toh, Visualization of the ef-fect of die shear rate on the outer surface morphology of ultra-filtration membranes by AFM, J. Membr. Sci. 196 (2002) 251–266.
[39] L. Martı́nez, F.J. Florido-Dı́az, A. Hernández, P. Prádanos, Estimationof vapor transfer coefficient of hydrophobic porous membranes forapplications in membrane distillation, Sep. Purif. Technol. 33 (2003)45–55.