Prediction of New Distillation-Membrane Separation ... - MDPI
12
processes Article Prediction of New Distillation-Membrane Separation Integrated Process with Potential in Industrial Application Xin Ding, Xiaohong Wang * , Peng Du, Zenghu Tian and Jingxuan Chen Citation: Ding, X.; Wang, X.; Du, P.; Tian, Z.; Chen, J. Prediction of New Distillation-Membrane Separation Integrated Process with Potential in Industrial Application. Processes 2021, 9, 318. https://doi.org/10.3390/ pr9020318 Academic Editor: Iqbal M. Mujtaba Received: 8 January 2021 Accepted: 5 February 2021 Published: 9 February 2021 Publisher’s Note: MDPI stays neutral with regard to jurisdictional claims in published maps and institutional affil- iations. Copyright: © 2021 by the authors. Licensee MDPI, Basel, Switzerland. This article is an open access article distributed under the terms and conditions of the Creative Commons Attribution (CC BY) license (https:// creativecommons.org/licenses/by/ 4.0/). College of Chemical Engineering, Qingdao University of Science and Technology, Qingdao 266042, China; [email protected] (X.D.); [email protected] (P.D.); [email protected] (Z.T.); [email protected] (J.C.) * Correspondence: [email protected] Abstract: In this paper, a new integrated distillation-membrane separation process solution strategy based on genetic programming (GP) was established for azeotrope separation. Then, a price evalua- tion method based on the theory of unit membrane area was proposed, so that those membranes which are still in the experimental stage and have no actual industrial cost for reference can also be used in the experimental research. For different characteristics and separation requirements of various azeotropic systems, the solution strategy can be matched with difference pervaporation mem- branes, and the optimal distillation-membrane separation integrated process can be solved quickly and accurately. Taking methanol-toluene as an example, the separation operation was optimized by using the algorithm. The effects of different feed flows and compositions on the modification of the chitosan membrane were discussed. These results provide a reliable basis for the prospects for development and modification direction of membrane materials which are still in the experimental research stage. Keywords: azeotrope separation; membrane modification; genetic programming; distillation-membrane separation integration 1. Introduction The separation of the azeotropic system has always been a hot and difficult topic in the field of the chemical industry because the relative volatility is near to 1 at the azeotropic point [1,2]. As the most commonly used separation method in the chemical industry, the traditional distillation operation has its inherent limitations, which makes it difficult to directly separate the azeotrope system into high-purity products [3]. Similarly, other separation methods have their own disadvantages. Higher separation efficiency and lower separation cost are the goals of chemical companies and chemical researchers [4], and a single separation method is gradually difficult to meet the production needs. The integration process of different unit operations has become a research hotspot, and the integration process can maximize the advantages of them and avoid disadvantages. In recent years, great progress has been made in the integration of membrane separa- tion and traditional distillation [5,6]. Compared with the traditional distillation method, membrane separation has wider availability and higher flexibility [7,8]. For the sepa- ration of the system to be separated, using membranes made of different materials can get different optimal processes; and the results will be quite different when the same materials are modified in different directions [9]. This flexibility makes the integrated process of membrane separation and distillation have obvious advantages [10–12]. The integration of distillation and the membrane module is more economical. Khalid A [13] and others compared several schemes with different process structures, and the results showed that the combination of distillation and membrane separation could effectively reduce the production cost of bioethanol. Yu Congli [14] and others proposed an integrated process of distillation and the molecular sieve membrane for the production process of Processes 2021, 9, 318. https://doi.org/10.3390/pr9020318 https://www.mdpi.com/journal/processes
-
Upload
khangminh22 -
Category
Documents
-
view
0 -
download
0
Transcript of Prediction of New Distillation-Membrane Separation ... - MDPI

processes
Article
Prediction of New Distillation-Membrane SeparationIntegrated Process with Potential in Industrial Application
Xin Ding, Xiaohong Wang * , Peng Du, Zenghu Tian and Jingxuan Chen
�����������������
Citation: Ding, X.; Wang, X.; Du, P.;
Tian, Z.; Chen, J. Prediction of New
Distillation-Membrane Separation
Integrated Process with Potential in
Industrial Application. Processes 2021,
9, 318. https://doi.org/10.3390/
pr9020318
Academic Editor: Iqbal M. Mujtaba
Received: 8 January 2021
Accepted: 5 February 2021
Published: 9 February 2021
Publisher’s Note: MDPI stays neutral
with regard to jurisdictional claims in
published maps and institutional affil-
iations.
Copyright: © 2021 by the authors.
Licensee MDPI, Basel, Switzerland.
This article is an open access article
distributed under the terms and
conditions of the Creative Commons
Attribution (CC BY) license (https://
creativecommons.org/licenses/by/
4.0/).
College of Chemical Engineering, Qingdao University of Science and Technology, Qingdao 266042, China;[email protected] (X.D.); [email protected] (P.D.); [email protected] (Z.T.);[email protected] (J.C.)* Correspondence: [email protected]
Abstract: In this paper, a new integrated distillation-membrane separation process solution strategybased on genetic programming (GP) was established for azeotrope separation. Then, a price evalua-tion method based on the theory of unit membrane area was proposed, so that those membraneswhich are still in the experimental stage and have no actual industrial cost for reference can alsobe used in the experimental research. For different characteristics and separation requirements ofvarious azeotropic systems, the solution strategy can be matched with difference pervaporation mem-branes, and the optimal distillation-membrane separation integrated process can be solved quicklyand accurately. Taking methanol-toluene as an example, the separation operation was optimizedby using the algorithm. The effects of different feed flows and compositions on the modification ofthe chitosan membrane were discussed. These results provide a reliable basis for the prospects fordevelopment and modification direction of membrane materials which are still in the experimentalresearch stage.
Keywords: azeotrope separation; membrane modification; genetic programming; distillation-membraneseparation integration
1. Introduction
The separation of the azeotropic system has always been a hot and difficult topicin the field of the chemical industry because the relative volatility is near to 1 at theazeotropic point [1,2]. As the most commonly used separation method in the chemicalindustry, the traditional distillation operation has its inherent limitations, which makes itdifficult to directly separate the azeotrope system into high-purity products [3]. Similarly,other separation methods have their own disadvantages. Higher separation efficiency andlower separation cost are the goals of chemical companies and chemical researchers [4],and a single separation method is gradually difficult to meet the production needs. Theintegration process of different unit operations has become a research hotspot, and theintegration process can maximize the advantages of them and avoid disadvantages.
In recent years, great progress has been made in the integration of membrane separa-tion and traditional distillation [5,6]. Compared with the traditional distillation method,membrane separation has wider availability and higher flexibility [7,8]. For the sepa-ration of the system to be separated, using membranes made of different materials canget different optimal processes; and the results will be quite different when the samematerials are modified in different directions [9]. This flexibility makes the integratedprocess of membrane separation and distillation have obvious advantages [10–12]. Theintegration of distillation and the membrane module is more economical. Khalid A [13]and others compared several schemes with different process structures, and the resultsshowed that the combination of distillation and membrane separation could effectivelyreduce the production cost of bioethanol. Yu Congli [14] and others proposed an integratedprocess of distillation and the molecular sieve membrane for the production process of
Processes 2021, 9, 318. https://doi.org/10.3390/pr9020318 https://www.mdpi.com/journal/processes

Processes 2021, 9, 318 2 of 12
ethanol dehydration, and compared it with the pressure swing distillation process. Theresults showed that the steam cost of the distillation membrane integrated process couldbe saved by 30%. Jin Hao [15] and others proposed an integrated process of the reactivedistillation pervaporation membrane with side line for the acetic esterification process ofethyl acetate production, which could effectively improve the steam transfer efficiency. Theresults show that the energy of the new process can be saved by 26.6% compared with thetraditional process. In addition, the integrated distillation membrane separation method isalso commonly used to treat industrial wastewater. Wang Yun [16] and others found thatthe coupled process of reversible gas membrane and multi-effect membrane distillationcan be applied to treat ammonia nitrogen in wastewater to obtain high purity concentratedammonia water.
Although there have been many stage achievements in the research of the distillationmembrane integration process, there are still two problems that are difficult to solve. Oneis that most experiments mainly focus on an azeotropic system, while the research ongeneral separation methods for the azeotropic system is still blank. On the other hand,due to the different coupling degrees of distillation membrane integration, it is difficultto fully describe the complexity and diversity of the process structure. This complexity isalso reflected in the difficulty of solving multi-objective optimization problems. Therefore,it is urgent to develop a general algorithm for the azeotropic system, and quickly searchand solve the optimization of the distillation membrane separation process according todifferent separation requirements.
The genetic programming algorithm (GP) is an evolutionary algorithm [17], the maindifference between GP and the genetic algorithm is that the former does not need todefine the super structure in advance, and is more suitable for solving complex nonlinearprogramming problems caused by multiple uncertain factors, and the optimization problemof the integration process can also be solved well [18]. In the previous work, the researchgroup has carried out some research on GP [19–21]. On this basis, the GP algorithmis proposed to solve the distillation and membrane separation problem [22]. The nodedefinition, population generation, and genetic algorithm are optimized for the azeotropesystem and membrane material, and the distillation membrane integrated solution strategyis established.
As the requirements for environmental protection, energy saving, and new membraneseparation materials and performance in industrial production continue to increase, it isurgent to conduct a deeper study of these problems. In the integration of distillation andmembrane separation, it is very important to choose the type and material of membrane.Generally, the types are divided into hydrophilic membrane and organic membrane, andmembrane materials include: organic polymer membrane, inorganic molecular sievemembrane, various composite membranes, and so on. In order to make a profound studyof the optimal membrane type, the membrane material and membrane characteristics inthe integrated distillation membrane separation, an improved GP algorithm is proposed inthis paper. The improved GP optimization algorithm is written in C++ language. Takingthe methanol toluene system as an example, the chitosan membrane was integrated withthe distillation column, and optimized by the improved GP algorithm. The influenceof membrane modification on integrated optimization was discussed. The direction ofmembrane modification and future industrialization prospect were accurately predicted,which provided a solid foundation for the development of membrane science.
2. Improved GP Algorithm for Distillation-Membrane Separation Integration Process
In the early stage of the study, most of the pervaporation membranes selected bymembrane separation nodes came from relatively mature commercial membranes withlarge-scale industrial applications, the main cause is that mature commercial membraneshave more mature methods to estimate the cost. However, with the deepening of research,the main research goal of this paper is to study a large number of high-quality membranematerials which have not entered large-scale commercial applications and are still in

Processes 2021, 9, 318 3 of 12
the experimental stage. Due to the diversity and variability of these membranes in themodification process, the GP algorithm has corresponding improvements in this paper.In order to accurately describe the influence of membrane performance on the optimalprocess and explore the direction of membrane modification, it is necessary to estimatethe cost of the membrane. Therefore, an estimation system of membrane cost is proposedin this paper. The improved GP synthesis strategy used in this paper mainly focuses onexpanding the characteristic parameters of membrane separation nodes, so as to describethe characteristics of the membrane more accurately and flexibly.
2.1. The Node Definition of Extended Distillation Column (D)
Firstly, in the new GP solution strategy, the definition of the distillation column nodeneeds to be extended to better describe the optimal process searched and solved by thealgorithm. The definitions are as follows.
(1) The first characteristic parameter is (nD), which represents the different dischargelines of the distillation column. The distillation column model used in the experimentis mainly one inlet and two outlets, so the feed stream is not defined separately. Eachdistillation column node has two outputs, one represents the top stream, the otheris the bottom stream. If nD = 0, it means the top stream; if nD = 1, it means thebottom stream.
(2) The second characteristic parameter is the number of theoretical plates (N). This valueis generated randomly in a given range and used to solve the integrated process ofthe distillation membrane.
(3) The third characteristic parameter is the ratio of reflux ratio to minimum reflux ratio(Rt). Similar to N, Rt is generated randomly in a given range.
(4) The fourth characteristic parameter is the recovery rate of light components at the topof the column (ηD). This parameter is also generated randomly in a reasonable range.
Figure 1 is a schematic diagram of the extended distillation node and the correspond-ing distillation process.
Processes 2021, 9, x FOR PEER REVIEW 3 of 13
membrane materials which have not entered large-scale commercial applications and are still in the experimental stage. Due to the diversity and variability of these membranes in the modification process, the GP algorithm has corresponding improvements in this pa-per. In order to accurately describe the influence of membrane performance on the op-timal process and explore the direction of membrane modification, it is necessary to es-timate the cost of the membrane. Therefore, an estimation system of membrane cost is proposed in this paper. The improved GP synthesis strategy used in this paper mainly focuses on expanding the characteristic parameters of membrane separation nodes, so as to describe the characteristics of the membrane more accurately and flexibly.
2.1. The Node Definition of Extended Distillation Column (D) Firstly, in the new GP solution strategy, the definition of the distillation column
node needs to be extended to better describe the optimal process searched and solved by the algorithm. The definitions are as follows.
(1) The first characteristic parameter is (nD), which represents the different discharge lines of the distillation column. The distillation column model used in the experi-ment is mainly one inlet and two outlets, so the feed stream is not defined sepa-rately. Each distillation column node has two outputs, one represents the top stream, the other is the bottom stream. If nD = 0, it means the top stream; if nD = 1, it means the bottom stream.
(2) The second characteristic parameter is the number of theoretical plates (N). This value is generated randomly in a given range and used to solve the integrated pro-cess of the distillation membrane.
(3) The third characteristic parameter is the ratio of reflux ratio to minimum reflux ratio (Rt). Similar to N, Rt is generated randomly in a given range.
(4) The fourth characteristic parameter is the recovery rate of light components at the top of the column (ηD). This parameter is also generated randomly in a reasonable range.
Figure 1 is a schematic diagram of the extended distillation node and the corre-sponding distillation process.
D
Feed
NRt
ηD
nD=0 nD=1
Feed
D
NRtηD
nD=0
nD=1
(a) Node graph (b) Flow chart
Figure 1. Distillation column node graph (a) and distillation module flow chart (b) obtained by decoding.
Figure 1. Distillation column node graph (a) and distillation module flow chart (b) obtainedby decoding.
2.2. Extended Membrane Separation Node (M)
The main content of this section is the extended definition of the membrane separationnode, including the performance parameters and separation parameters of the membrane,so as to better describe the properties of the membrane. The specific definition is as follows.

Processes 2021, 9, 318 4 of 12
(1) Structure parameter (nM) is performance parameter. The membrane module is definedas a model of one inlet and two outlets. When nM = 0, it represents the output flow ofthe residual side; when nM = 1, it represents the output flow of the permeate side.
(2) Experimental parameter (EM) is also a performance parameter. Because the membraneselected in this paper is still in the experimental stage, it is necessary to add the oper-ating temperature and thickness of the membrane to characterize the experimentalconditions of the membrane.
(3) The separation factor α and the following three parameters are all separation parame-ters. It refers to the ratio of the relative composition of the component in the outletstream of the membrane to that in the feed stream, as defined in Formula (1) [9]. YBand YC represent the mass fractions of the two components on the permeate siderespectively, and YB, F and YC, F represent the mass fractions of the two componentsin feed respectively:
α =YB/YC
XB,F/XC,F. (1)
(4) Flux per unit membrane area J, the unit is kg/(m2·h), as shown in Formula (2) [9], isthe total mass of material per unit membrane area per unit time. m is the total massof material passing through the membrane module in unit time (kg/h); a is the totalmembrane area of the current membrane module (m2):
J =mA
. (2)
(5) The total area of the membrane is AM, and the unit is m2. With the increase of AM,the total flux of the membrane can be increased, and the processing capacity of themembrane module can be improved.
(6) Further, the last one is membrane operating temperature (T), the unit is ◦C. Itschange may cause the performance of membrane materials and affect the separationperformance of the membrane changed.
Figure 2 shows the node properties of membrane separation and the correspondingmembrane separation operation diagram.
Processes 2021, 9, x FOR PEER REVIEW 4 of 13
2.2. Extended Membrane Separation Node (M) The main content of this section is the extended definition of the membrane separa-
tion node, including the performance parameters and separation parameters of the membrane, so as to better describe the properties of the membrane. The specific defini-tion is as follows.
(1) Structure parameter (nM) is performance parameter. The membrane module is de-fined as a model of one inlet and two outlets. When nM = 0, it represents the output flow of the residual side; when nM = 1, it represents the output flow of the permeate side.
(2) Experimental parameter (EM) is also a performance parameter. Because the mem-brane selected in this paper is still in the experimental stage, it is necessary to add the operating temperature and thickness of the membrane to characterize the ex-perimental conditions of the membrane.
(3) The separation factor α and the following three parameters are all separation pa-rameters. It refers to the ratio of the relative composition of the component in the outlet stream of the membrane to that in the feed stream, as defined in Formula (1) [9]. YB and YC represent the mass fractions of the two components on the permeate side respectively, and YB, F and YC, F represent the mass fractions of the two compo-nents in feed respectively:
FCFB
CB
XXYY
,, //=α . (1)
(4) Flux per unit membrane area J, the unit is kg/(m2·h), as shown in Formula (2) [9], is the total mass of material per unit membrane area per unit time. m is the total mass of material passing through the membrane module in unit time (kg/h); a is the total membrane area of the current membrane module (m2):
mJA
= . (2)
(5) The total area of the membrane is AM, and the unit is m2. With the increase of AM, the total flux of the membrane can be increased, and the processing capacity of the membrane module can be improved.
(6) Further, the last one is membrane operating temperature (T), the unit is °C. Its change may cause the performance of membrane materials and affect the separation performance of the membrane changed.
Figure 2 shows the node properties of membrane separation and the corresponding membrane separation operation diagram.
M
Feed
аJT
nM=0 nM=1
EM AM
Feed
M
аJT EM AM
nM=0
nM=1
(a) Node graph (b) Flow chart
Figure 2. Membrane node graph (a) and membrane module flow chart (b) obtained by decoding. Figure 2. Membrane node graph (a) and membrane module flow chart (b) obtained by decoding.
The tree code generation rules, initial population generation, and termination criteriain the GP comprehensive solution strategy are all referred to in the previous work [22].
2.3. Membrane Cost Theory Prediction Method
In the preliminary study of the GP comprehensive strategy proposed in this paper,the pervaporation membrane with mature commercial applications is adopted as the mainresearch object of the comprehensive solution strategy. Based on the above, this paperwill further explore the membrane types and materials which are still in the experimental

Processes 2021, 9, 318 5 of 12
research stage. Because there are many uncertainties in the cost estimation of this materialin the future industry, there is no complete scientific method to predict at present, so it isdifficult to calculate the fitness (defined as the annual total cost, TAC) of GP algorithm.
In view of the above situation, this paper proposed the upper limit price evaluationmethod by the unit membrane area (Pmax, unit: $/(m2·year)). Before the integrated opti-mization of distillation and membrane separation, the optimal value of TAC required bythe traditional special distillation separation method for the separation system should becalculated. Then, in the integrated calculation of distillation and membrane separation,the price of unit membrane area can be predicted by adjusting the integrated system andusing the membrane theory. The TAC value in distillation and membrane separationprocess is approximately equal to that in distillation separation. The price of the membraneobtained by unit membrane area theory predicts the Pmax value of this kind of membrane.This parameter can be used to judge whether the membrane has industrial applicationvalue. The higher the Pmax value is, the higher the feasibility of the membrane in the futureindustrial application is. The Pmax value includes not only the manufacturing cost of themembrane, but also the annual operating cost of the membrane and the corresponding costunit of membrane separation auxiliary equipment. The specific calculation steps of Pmaxare shown in Figure 3. Further, the specific calculation steps are as follows:
(1) The special distillation method was used to establish a process to separate the sepa-rated system, and the process was optimized to obtain the optimal process and thecorresponding TAC.
(2) Set the initial value of the theoretical prediction price of the unit membrane area, andautomatically calculate the fitness of individuals in the group.
(3) The TAC of the optimal integrated process is compared with that of the specialdistillation process. If the difference between the two is less than the maximumallowable range, stop the calculation, then the theoretical predicted price of the unitmembrane area is Pmax; if not, return to step (2), reset the theoretical predicted priceof the unit membrane area and calculate individual fitness until Pmax is obtained. Thedirection of price adjustment is determined by the difference of TAC between the two.If the difference is positive, the price per unit membrane area theoretically predictedwill be reduced; otherwise, the price per unit membrane area theoretically predictedwill be increased.Processes 2021, 9, x FOR PEER REVIEW 6 of 13
Set theoretical prediction cost per unit membrane area (P)
The optimal TAC value required by a special distillation process under the current feed conditions
P was introduced into GP calculation , and the TAC value of the optimal integrated process was obtained
Yes
end
No
Pmax= P
(optimal individual TAC - special distillation TAC) < maximum
allowable range
Figure 3. Flow chart of new genetic programming comprehensive solution strategy.
3. GP Algorithm Objective Function and Cost Model The optimization objective function of the GP algorithm is defined as the total an-
nual cost (TAC), including the equipment cost and operating cost of the distillation column and membrane module.
3.1. Cost Model of Distillation Column The cost of the distillation column includes the cost of equipment and operation. The
equipment cost mainly includes the cost of the column, the cost of the tray equipment, the cost of the condensers and the reboilers. The operating costs mainly include the consumption of cooling water of the condensers and that of the heating steam of the re-boilers [23–24].
3.1.1. The Cost of Column ($/year) The estimation formula of column cost is shown in Formula (3) and (4):
( )1.006 0.802M&Scolumn cost 937.636 2.18280 C cD H F = × × × × +
, (3)
3 0.6 60.75
NH = − × +
(4)
Among them, the M&S index is used to estimate the cost of chemical equipment, and the value is set as 1431.7 according to the data published in 2013; DC is the diameter of the column, the unit is m; H is the height of the column, and the calculation formula is (4), the unit is m; FC = FM×FP, the column is made of stainless steel, so FM is 3.67, and FP is 1 in atmospheric column.
The tray cost is also estimated by M&S index, and the calculation formula is Equation (5):
( )1.55M&Stray cost 97.243 1 1.7280 CD H = × × × × +
. (5)
Figure 3. Flow chart of new genetic programming comprehensive solution strategy.

Processes 2021, 9, 318 6 of 12
3. GP Algorithm Objective Function and Cost Model
The optimization objective function of the GP algorithm is defined as the total annualcost (TAC), including the equipment cost and operating cost of the distillation column andmembrane module.
3.1. Cost Model of Distillation Column
The cost of the distillation column includes the cost of equipment and operation. Theequipment cost mainly includes the cost of the column, the cost of the tray equipment,the cost of the condensers and the reboilers. The operating costs mainly include theconsumption of cooling water of the condensers and that of the heating steam of thereboilers [23,24].
3.1.1. The Cost of Column ($/year)
The estimation formula of column cost is shown in Formula (3) and (4):
column cost =(
M&S280
)× 937.636 × D1.006
C × H0.802 × (2.18 + Fc), (3)
H =
(N
0.75− 3)× 0.6 + 6 (4)
Among them, the M&S index is used to estimate the cost of chemical equipment, andthe value is set as 1431.7 according to the data published in 2013; DC is the diameter of thecolumn, the unit is m; H is the height of the column, and the calculation formula is (4), theunit is m; FC = FM × FP, the column is made of stainless steel, so FM is 3.67, and FP is 1 inatmospheric column.
The tray cost is also estimated by M&S index, and the calculation formula isEquation (5):
tray cost =(
M&S280
)× 97.243 × D1.55
C × H × (1 + 1.7). (5)
The calculation of the cost of heat exchanger equipment is shown in (6)–(9):AH is the heat exchange area, the unit is m2, and the calculation formula is (6):
AH =Q
K × ∆tm(6)
Q =Wh∆Hc
3600 × 1000=
Wc∆Hc
3600 × 1000(7)
∆tm =∆t1 − ∆t2
ln(
∆t1∆t2
) =(T1 − t1)− (T2 − t2)
ln(
T1−t1T2−t2
) (8)
Cost of heat exchanger equipment =13×(
M&S280
)× 474.668 × A0.65
H (2.29 + 3.75 × (1.35 + 0.8)) (9)
AH is the heat exchange area, the unit is m2; Q is the heat load of the heat exchangers,the unit is kW; ∆H is the enthalpy difference of fluid heat exchange, the unit is kJ/kg;subscript c is cold fluid; K is the heat transfer coefficient; ∆tm is the heat transfer temperaturedifference, in this paper, the average logarithmic temperature difference is selected, theunit is ◦C.
3.1.2. The Cost of Operation ($/year)
The operation cost is composed of heating steam cost and cooling water cost, both ofwhich come from utilities. There are three types of steam costs:
(1) Low pressure steam (6 bar, 433 K) = 7.72 $/GJ,(2) Medium pressure steam (11 bar, 457 K) = 8.22 $/GJ,(3) High pressure steam (42 bar, 527 K) = 9.88 $/GJ.

Processes 2021, 9, 318 7 of 12
The calculation formula of cooling water cost in public works is shown inFormula (10):
cooling water cost = Cw
(Q
∆Tw × Cp × 1000
)× 8000 × 3600. (10)
where Cw is the price of cooling water (3 $/gcal); ∆Tw is the cooling water; the temperaturedifference between inlet and outlet is designed as 10 ◦C; Cp is the specific heat of water(4.183 kJ/(kg·K)).
3.2. Cost Model of Membrane Module Separation
The membrane module includes equipment cost and operating cost, the equipmentcost is the cost of membrane material, production cost, and auxiliary equipment cost.The equipment cost of the commercial membrane is given by the manufacturer of themembrane. The operating cost mainly includes the energy consumption and maintenancecost of auxiliary equipment, and the maintenance cost is also given by the manufacturer.
Since the chitosan and polyurethane membranes studied in this paper have not beenused in industry at present, the method proposed in Section 2.2 is used to estimate thetheoretical upper limit price (Pmax value) of all membrane costs.
4. Calculation of Industrial Examples
In this paper, a new GP comprehensive solution strategy for the distillation-membraneintegration process was studied for the separation of the methanol-toluene azeotropicsystem, which was matched with the environmentally friendly chitosan membrane.
4.1. Optimization Calculation of Extraction Distillation Separation Process forMethanol-Toluene System
According to the individual fitness calculation rules of the new GP algorithm, thesystem was separated by special distillation, and the TAC value of the optimal process wascalculated. In this paper, the extractive distillation was adopted, and O-xylene was selectedas the extractant [25]. The purity of the products should be more than 99.5 wt%. Thesequential iterative method [24] was adopted to optimize the extractive distillation process.Table 1 shows the corresponding optimal TAC values under different feed conditions.Figure 4 is one of the processes.
Table 1. Optimized calculation results of extractive distillation for the methanol-tolueneazeotrope system.
Feed Flow/(kg/h) FeedComposition/(methanol/wt %) TAC/(k $/year)
100 10 54.23300 10 116.22500 10 166.56100 30 88.5100 50 108.3
4.2. Optimization Calculation and Analysis of the Distillation-Membrane Separation IntegrationProcess for Chitosan Membrane
Chitosan membrane is a kind of methanol permeable membrane, Tetraethoxysilane(TEOS) can be added as a crosslinking agent to reduce the flux slightly and improve theseparation factor greatly [26]. In this paper, the value of separation factor α and flux J intwo states due to modification of the chitosan membrane were calculated by regressionanalysis of experimental data provided in the literature, the calculation formulas are shownin (11)–(14). In these formulas, xf represents the methanol concentration at the feed pointof the membrane module (kg/kg).

Processes 2021, 9, 318 8 of 12
Processes 2021, 9, x FOR PEER REVIEW 8 of 13
4.1. Optimization Calculation of Extraction Distillation Separation Process for Methanol-Toluene System
According to the individual fitness calculation rules of the new GP algorithm, the system was separated by special distillation, and the TAC value of the optimal process was calculated. In this paper, the extractive distillation was adopted, and O-xylene was selected as the extractant [25]. The purity of the products should be more than 99.5 wt%. The sequential iterative method [24] was adopted to optimize the extractive distillation process. Table 1 shows the corresponding optimal TAC values under different feed con-ditions. Figure 4 is one of the processes.
Table 1. Optimized calculation results of extractive distillation for the methanol-toluene azeotrope system.
Feed Flow/(kg/h) Feed Composi-
tion/(methanol/wt %) TAC/
(k $/year) 100 10 54.23 300 10 116.22 500 10 166.56 100 30 88.5 100 50 108.3
FEED100 kg/h10wt% Methanol90wt% Toluene
r1=0.97NC1=18
NFR = 4NF1=15
C1
84.57 kg/h trace Methanol trace Toluene99.9 wt% O-xylene
NF1=10
C2
r1=0.68NC2=25
make up0.35 kg/h100 wt% O-xylene
90.43 kg/h0.06 wt% Methanol99.5 wt% Toluene0.44 wt% O-xylene
10 kg/h99.5 wt% Methanol0.15 wt% Toluene0.35 wt% O-xylene
175 kg/h 0.03 wt% Methanol 51.4 wt% Toluene 48.6 wt% O-xylene
Figure 4. The optimal process and operation parameters when the feed flow rate is 100 kg/h and the methanol content is 10 wt%.
4.2. Optimization Calculation and Analysis of the Distillation-Membrane Separation Integration Process for Chitosan Membrane
Chitosan membrane is a kind of methanol permeable membrane, Tetraethoxysilane (TEOS) can be added as a crosslinking agent to reduce the flux slightly and improve the separation factor greatly [26]. In this paper, the value of separation factor α and flux J in two states due to modification of the chitosan membrane were calculated by regression analysis of experimental data provided in the literature, the calculation formulas are shown in (11)–(14). In these formulas, xf represents the methanol concentration at the feed point of the membrane module (kg/kg).
The formula of the modified pre-chitosan membrane: 5.481
3.883
229.64 0.5
143.78 0.5
f
f
xf
xf
e x
e xα
−
−
≤= >
,
(11)
Figure 4. The optimal process and operation parameters when the feed flow rate is 100 kg/h and themethanol content is 10 wt%.
The formula of the modified pre-chitosan membrane:
α =
{229.64e−5.481x f x f ≤ 0.5143.78e−3.883x f x f > 0.5
, (11)
J = 0.1227x2f + 0.0043x f + 0.0975. (12)
The formula of the modified chitosan membrane:
α =
{−6596.6x3
f + 9405.5x2f − 4431.3x f + 756.66
320.49e−2.608x f
x f ≤ 0.6x f > 0.6
(13)
J = 0.0523x2f + 0.00437x f + 0.0766. (14)
4.3. Influence of Feed Flow on Chitosan Membrane Modification
In this section, the feed composition was fixed as methanol content of 10 wt%, and thefeed flow rates of 100, 300, and 500 kg/h were studied. Using the chitosan membrane asthe research object, it was found that no matter whether the membrane was modified ornot, the optimal integrated process searched by the GP algorithm under three feed rateswas the C-PV acyclic integrated process (the separation sequence is distillation-membrane),Table 2 shows the optimal integration of process parameters of the three kinds of feed flowrates in the case of unmodified membrane and modified membrane, and Figure 5 showsone of these cases.
Table 2. The optimal integrated process parameters are obtained by using the modified membrane and the modifiedmembrane under three feed flow rates, when the methanol content of the feed is 10 wt%.
MembraneType
FeedFlow
(kg/h)
Pmax($/m2
year)N r APV
(m2)Mcost
(k $/year)Scost
(k $/year)PVcost
(k $/year)Tcost
(k $/year)TAC
(k $/year)
Chitosanmembrane
100 131 6 1.3 259 2.5 17.5 33.9 20.0 53.9300 100 4 1.1 934 2.4 15.2 99.1 17.5 116.6500 84 4 0.7 1781 2.1 15.0 149.6 17.1 166.7
Modifiedchitosan
membrane
100 246 4 0.6 152 2.0 15.0 37.3 16.9 54.2300 218 5 1.3 446 2.5 16.4 97.4 18.9 116.3500 198 6 1.3 741 2.5 17.5 146.7 20.0 166.7

Processes 2021, 9, 318 9 of 12
Processes 2021, 9, x FOR PEER REVIEW 10 of 13
in TAC decreases gradually, which has been explained above. It is worth noting that the higher the feed flow, the less the cost of the distillation column in the optimal integration process by using the unmodified membrane, which is different from the results of the modified membrane. Comparing the two membranes, it can be found that the increase of membrane area of chitosan membrane is larger than that of modified chitosan membrane under any feed flow. In this case, it is not difficult to explain why the former has the phenomenon that the cost of distillation column is lower than that of low flow. At the same time, with the increase of feed flow, the decrease of Pmax values of the modified chitosan membrane was lower than that of the unmodified chitosan membrane, indicat-ing that the modified chitosan membrane can obtain higher income in dealing with higher feed flow.
FEED100 kg/h10wt% Methanol90wt% Toluene
r=1.3N=6
14.03 kg/h68.2wt% Methanol31.8wt% Toluene
85.97 kg/h0.5 wt% Methanol99.5wt% Toluene
APV=259.14m2
TPV=50 ℃
9.61 kg/h99.5wt% Methanol0.5 wt% Toluene
4.42 kg/h0.15 wt% Methanol99.85wt% Toluene
NF=4
C
PV
pump
vacuum pumpcondenserheat exchanger
Figure 5. The optimal process structure and parameters of the chitosan membrane, when the feed flow rate is 100 kg/h and the methanol content is 10 wt%.
4.4. Influence of Feed Composition on Chitosan Membrane Modification In this section, the feed flow rate was fixed at 100 kg/h, and the research objects were
methanol content of 10, 30, and 50 wt%. Compared with Section 4.3, the optimal process is different under different feed compositions, when the feed content of toluene is 30 and 50 wt%, the searched optimal integration processes by using the GP algorithm are all the C-PV-PV structure (the two discharge streams of the distillation column are connected with the membrane module), Figure 6 shows one example.
Figure 5. The optimal process structure and parameters of the chitosan membrane, when the feedflow rate is 100 kg/h and the methanol content is 10 wt%.
Mcost is the total operating cost except membrane module and its auxiliary equipment(the unit is k$/year, the followings are the same), Scost is the total equipment cost calculatedby three-year depreciation period except membrane module and its auxiliary equipment.PVcost is the total cost of membrane module and its auxiliary equipment per unit, and Tcostin the table is the total cost of distillation column and its auxiliary equipment.
The influence of feed flow on the optimal distillation-membrane separation integratedprocess is mainly reflected in the scale effect. The scale effect of distillation column leads tothe increase of feed flow and the increase of the cost, which is also the reason why it plays animportant role in large-scale industrial production. On the contrary, membrane separationhas the advantage of low-flow because of the linear correlation between the treatmentcapacity and membrane area. Extractive distillation is similar to membrane separation,and the treatment capacity is related to the amount of extractant. This phenomenon leadsto the difference of TAC change between extractive distillation column and conventionaldistillation column in integrated process. With the increase of feed flow, the cost ofmembrane separation module increases proportionally, while the cost of distillation columnincreases slightly. In order to make the TAC of integrated process similar to that of specialdistillation, the membrane separation module has to undertake more separation tasks,while the distillation column will undertake less separation tasks, this trend is also thesolution direction of the comprehensive solution strategy.
According to the data in Table 2, the Pmax values of modified membrane are higherunder any feed flows. With the increase of feed flow, the Pmax values of the two membranesdecrease gradually. It can be found that the proportion of distillation column cost in TACdecreases gradually, which has been explained above. It is worth noting that the higherthe feed flow, the less the cost of the distillation column in the optimal integration processby using the unmodified membrane, which is different from the results of the modifiedmembrane. Comparing the two membranes, it can be found that the increase of membranearea of chitosan membrane is larger than that of modified chitosan membrane under anyfeed flow. In this case, it is not difficult to explain why the former has the phenomenonthat the cost of distillation column is lower than that of low flow. At the same time, withthe increase of feed flow, the decrease of Pmax values of the modified chitosan membranewas lower than that of the unmodified chitosan membrane, indicating that the modifiedchitosan membrane can obtain higher income in dealing with higher feed flow.
4.4. Influence of Feed Composition on Chitosan Membrane Modification
In this section, the feed flow rate was fixed at 100 kg/h, and the research objects weremethanol content of 10, 30, and 50 wt%. Compared with Section 4.3, the optimal process
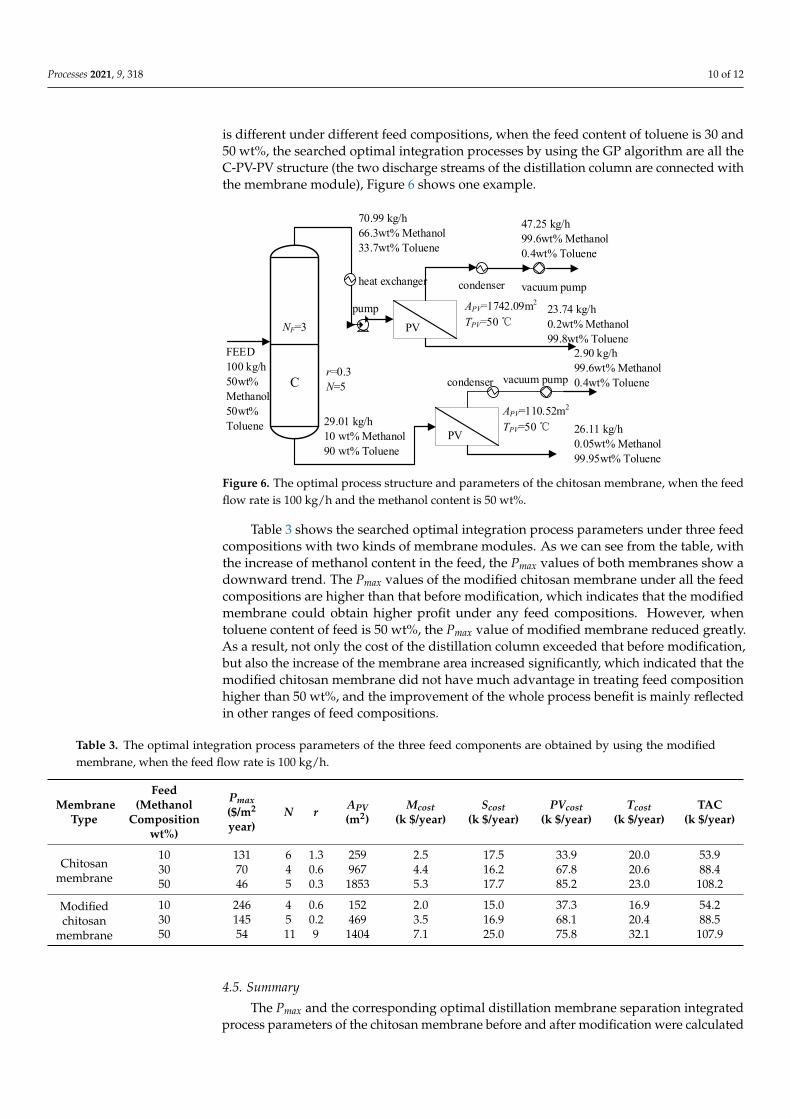
Processes 2021, 9, 318 10 of 12
is different under different feed compositions, when the feed content of toluene is 30 and50 wt%, the searched optimal integration processes by using the GP algorithm are all theC-PV-PV structure (the two discharge streams of the distillation column are connected withthe membrane module), Figure 6 shows one example.Processes 2021, 9, x FOR PEER REVIEW 11 of 13
FEED100 kg/h50wt% Methanol50wt% Toluene
r=0.3N=5
70.99 kg/h66.3wt% Methanol33.7wt% Toluene
29.01 kg/h10 wt% Methanol90 wt% Toluene
APV=1742.09m2
TPV=50 ℃
47.25 kg/h99.6wt% Methanol0.4wt% Toluene
26.11 kg/h0.05wt% Methanol99.95wt% Toluene
NF=3
C
PVpump
vacuum pumpcondenserheat exchanger
PV
2.90 kg/h99.6wt% Methanol0.4wt% Toluene
APV=110.52m2
TPV=50 ℃
condenser vacuum pump
23.74 kg/h0.2wt% Methanol99.8wt% Toluene
Figure 6. The optimal process structure and parameters of the chitosan membrane, when the feed flow rate is 100 kg/h and the methanol content is 50 wt%.
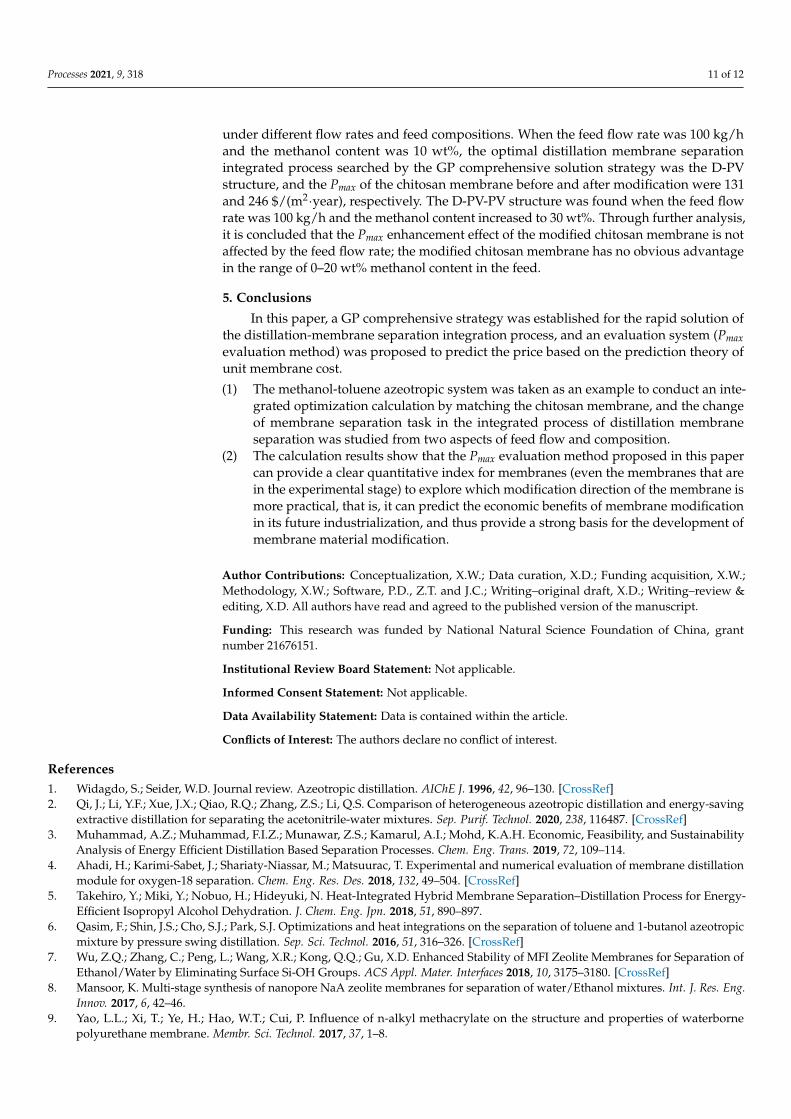
Table 3 shows the searched optimal integration process parameters under three feed compositions with two kinds of membrane modules. As we can see from the table, with the increase of methanol content in the feed, the Pmax values of both membranes show a downward trend. The Pmax values of the modified chitosan membrane under all the feed compositions are higher than that before modification, which indicates that the modified membrane could obtain higher profit under any feed compositions. However, when toluene content of feed is 50 wt%, the Pmax value of modified membrane reduced greatly. As a result, not only the cost of the distillation column exceeded that before modification, but also the increase of the membrane area increased significantly, which indicated that the modified chitosan membrane did not have much advantage in treating feed compo-sition higher than 50 wt%, and the improvement of the whole process benefit is mainly reflected in other ranges of feed compositions.
Table 3. The optimal integration process parameters of the three feed components are obtained by using the modified membrane, when the feed flow rate is 100 kg/h.
Membrane Type
Feed (Methanol
Composition wt%)
Pmax
($/m2 year) N r APV (m2)
Mcost (k $/year)
Scost (k $/year)
PVcost (k $/year)
Tcost (k $/year)
TAC (k $/year)
Chitosan membrane
10 131 6 1.3 259 2.5 17.5 33.9 20.0 53.9 30 70 4 0.6 967 4.4 16.2 67.8 20.6 88.4 50 46 5 0.3 1853 5.3 17.7 85.2 23.0 108.2
Modified chitosan
membrane
10 246 4 0.6 152 2.0 15.0 37.3 16.9 54.2 30 145 5 0.2 469 3.5 16.9 68.1 20.4 88.5 50 54 11 9 1404 7.1 25.0 75.8 32.1 107.9
4.5. Summary The Pmax and the corresponding optimal distillation membrane separation integrated
process parameters of the chitosan membrane before and after modification were calcu-lated under different flow rates and feed compositions. When the feed flow rate was 100 kg/h and the methanol content was 10 wt%, the optimal distillation membrane separation integrated process searched by the GP comprehensive solution strategy was the D-PV structure, and the Pmax of the chitosan membrane before and after modification were 131 and 246 $/(m2·year), respectively. The D-PV-PV structure was found when the feed flow rate was 100 kg/h and the methanol content increased to 30 wt%. Through further analy-sis, it is concluded that the Pmax enhancement effect of the modified chitosan membrane is
Figure 6. The optimal process structure and parameters of the chitosan membrane, when the feedflow rate is 100 kg/h and the methanol content is 50 wt%.
Table 3 shows the searched optimal integration process parameters under three feedcompositions with two kinds of membrane modules. As we can see from the table, withthe increase of methanol content in the feed, the Pmax values of both membranes show adownward trend. The Pmax values of the modified chitosan membrane under all the feedcompositions are higher than that before modification, which indicates that the modifiedmembrane could obtain higher profit under any feed compositions. However, whentoluene content of feed is 50 wt%, the Pmax value of modified membrane reduced greatly.As a result, not only the cost of the distillation column exceeded that before modification,but also the increase of the membrane area increased significantly, which indicated that themodified chitosan membrane did not have much advantage in treating feed compositionhigher than 50 wt%, and the improvement of the whole process benefit is mainly reflectedin other ranges of feed compositions.
Table 3. The optimal integration process parameters of the three feed components are obtained by using the modifiedmembrane, when the feed flow rate is 100 kg/h.
MembraneType
Feed(Methanol
Compositionwt%)
Pmax($/m2
year)N r APV
(m2)Mcost
(k $/year)Scost
(k $/year)PVcost
(k $/year)Tcost
(k $/year)TAC
(k $/year)
Chitosanmembrane
10 131 6 1.3 259 2.5 17.5 33.9 20.0 53.930 70 4 0.6 967 4.4 16.2 67.8 20.6 88.450 46 5 0.3 1853 5.3 17.7 85.2 23.0 108.2
Modifiedchitosan
membrane
10 246 4 0.6 152 2.0 15.0 37.3 16.9 54.230 145 5 0.2 469 3.5 16.9 68.1 20.4 88.550 54 11 9 1404 7.1 25.0 75.8 32.1 107.9
4.5. Summary
The Pmax and the corresponding optimal distillation membrane separation integratedprocess parameters of the chitosan membrane before and after modification were calculated
Processes 2021, 9, 318 11 of 12
under different flow rates and feed compositions. When the feed flow rate was 100 kg/hand the methanol content was 10 wt%, the optimal distillation membrane separationintegrated process searched by the GP comprehensive solution strategy was the D-PVstructure, and the Pmax of the chitosan membrane before and after modification were 131and 246 $/(m2·year), respectively. The D-PV-PV structure was found when the feed flowrate was 100 kg/h and the methanol content increased to 30 wt%. Through further analysis,it is concluded that the Pmax enhancement effect of the modified chitosan membrane is notaffected by the feed flow rate; the modified chitosan membrane has no obvious advantagein the range of 0–20 wt% methanol content in the feed.
5. Conclusions
In this paper, a GP comprehensive strategy was established for the rapid solution ofthe distillation-membrane separation integration process, and an evaluation system (Pmaxevaluation method) was proposed to predict the price based on the prediction theory ofunit membrane cost.
(1) The methanol-toluene azeotropic system was taken as an example to conduct an inte-grated optimization calculation by matching the chitosan membrane, and the changeof membrane separation task in the integrated process of distillation membraneseparation was studied from two aspects of feed flow and composition.
(2) The calculation results show that the Pmax evaluation method proposed in this papercan provide a clear quantitative index for membranes (even the membranes that arein the experimental stage) to explore which modification direction of the membrane ismore practical, that is, it can predict the economic benefits of membrane modificationin its future industrialization, and thus provide a strong basis for the development ofmembrane material modification.
Author Contributions: Conceptualization, X.W.; Data curation, X.D.; Funding acquisition, X.W.;Methodology, X.W.; Software, P.D., Z.T. and J.C.; Writing–original draft, X.D.; Writing–review &editing, X.D. All authors have read and agreed to the published version of the manuscript.
Funding: This research was funded by National Natural Science Foundation of China, grantnumber 21676151.
Institutional Review Board Statement: Not applicable.
Informed Consent Statement: Not applicable.
Data Availability Statement: Data is contained within the article.
Conflicts of Interest: The authors declare no conflict of interest.
References1. Widagdo, S.; Seider, W.D. Journal review. Azeotropic distillation. AIChE J. 1996, 42, 96–130. [CrossRef]2. Qi, J.; Li, Y.F.; Xue, J.X.; Qiao, R.Q.; Zhang, Z.S.; Li, Q.S. Comparison of heterogeneous azeotropic distillation and energy-saving
extractive distillation for separating the acetonitrile-water mixtures. Sep. Purif. Technol. 2020, 238, 116487. [CrossRef]3. Muhammad, A.Z.; Muhammad, F.I.Z.; Munawar, Z.S.; Kamarul, A.I.; Mohd, K.A.H. Economic, Feasibility, and Sustainability
Analysis of Energy Efficient Distillation Based Separation Processes. Chem. Eng. Trans. 2019, 72, 109–114.4. Ahadi, H.; Karimi-Sabet, J.; Shariaty-Niassar, M.; Matsuurac, T. Experimental and numerical evaluation of membrane distillation
module for oxygen-18 separation. Chem. Eng. Res. Des. 2018, 132, 49–504. [CrossRef]5. Takehiro, Y.; Miki, Y.; Nobuo, H.; Hideyuki, N. Heat-Integrated Hybrid Membrane Separation–Distillation Process for Energy-
Efficient Isopropyl Alcohol Dehydration. J. Chem. Eng. Jpn. 2018, 51, 890–897.6. Qasim, F.; Shin, J.S.; Cho, S.J.; Park, S.J. Optimizations and heat integrations on the separation of toluene and 1-butanol azeotropic
mixture by pressure swing distillation. Sep. Sci. Technol. 2016, 51, 316–326. [CrossRef]7. Wu, Z.Q.; Zhang, C.; Peng, L.; Wang, X.R.; Kong, Q.Q.; Gu, X.D. Enhanced Stability of MFI Zeolite Membranes for Separation of
Ethanol/Water by Eliminating Surface Si-OH Groups. ACS Appl. Mater. Interfaces 2018, 10, 3175–3180. [CrossRef]8. Mansoor, K. Multi-stage synthesis of nanopore NaA zeolite membranes for separation of water/Ethanol mixtures. Int. J. Res. Eng.
Innov. 2017, 6, 42–46.9. Yao, L.L.; Xi, T.; Ye, H.; Hao, W.T.; Cui, P. Influence of n-alkyl methacrylate on the structure and properties of waterborne
polyurethane membrane. Membr. Sci. Technol. 2017, 37, 1–8.
Processes 2021, 9, 318 12 of 12
10. Fontalvo, J.; Keurentjes, J.T.F. A hybrid distillation–pervaporation system in a single unit for breaking distillation boundaries inmulticomponent mixtures. Chem. Eng. Res. Des. 2015, 99, 158–164. [CrossRef]
11. Wang, C.; Zhang, Z.S.; Zhang, X.K.; Gao, J.; Stewart, B. Energy-saving hybrid processes combining pressure-swing reactivedistillation and pervaporation membrane for n-propyl acetate production. Sep. Purif. Technol. 2019, 221, 1–11. [CrossRef]
12. Xiong, B.W.; Wu, H.D.; Zhou, Z.H. Research progress of organic-inorganic hybrid membranes for pervaporation. Fine Chem. Eng.2020, 1–8. [CrossRef]
13. Khalid, A.; Aslam, M.; Qyyum, M.A.; Faisal, A. Membrane separation process for dehydration of bioethanol from fermentationbroths: Recent developments, challenges, and prospects. Renew. Sustain. Energy Rev. 2019, 105, 427–443. [CrossRef]
14. Yu, C.L.; Guo, H.C.; Ji, Z.H. Economic feasibility analysis on application of zeolite membrane in bio-based fuel ethanol production.Mod. Chem. Ind. 2019, 39, 192–194.
15. Jin, H.; Lu, J.W.; Tang, J.H.; Zhang, Z.X.; Fei, Z.Y.; Liu, Q.; Chen, X.; Cui, M.F.; Qiao, X. Simulation and analysis of a side streamreactive distillation- pervaporation integrated process for ethyl acetate production. Acta Chem. Sin. 2018, 69, 3469–3478.
16. Wang, Y.; Qin, Y.J.; Hao, X.G.; Li, H.Q.; Cui, D.S.; Liu, L.Q.; Liu, J. Reversible gas membrane process-multiple effect membranedistillati distillation process for removing ammonia from aqueous solution an producing aqueous ammonia. Acta Chem. Sin.2015, 66, 3588–3596.
17. Koza, J.R. Genetic Programming II: Automatic Discovery of Reusable Programs. Artif. Life 2014, 1, 439–441.18. Wang, X.H.; Li, Y.G. Intergration of Multicomponent products separation sequences via stochastic GP method. Ind. Eng. Chem.
Res. 2008, 47, 8815–8822. [CrossRef]19. Wang, X.H.; Hu, Y.D.; Li, Y.G. Synthesis of nonsharp distillation sequences via genetic programming. Korean J. Chem. Eng. 2008,
25, 402–408. [CrossRef]20. Wang, X.H.; Li, Y.G.; Hu, Y.D. Intergration of heat-integrated complex distillation systems via Genetic Programming. Comput.
Chem. Eng. 2008, 32, 1908–1917. [CrossRef]21. Wang, X.H.; Li, Y.G. Stochastic GP intergration of heat integrated nonsharp distillation sequences. Chem. Eng. Res. Des. 2010, 88,
45–54. [CrossRef]22. Wang, X.H.; Li, M.G.; Zhang, Y.P.; Hong, J.; Li, W.K.; Ding, X.; Li, Y.G. Research on the integration process of energy saving
distillation-membrane separation based on genetic programming to achieve clean production. Chem. Eng. Process. Process Intensif.2020, 151, 107885. [CrossRef]
23. Luyben, W.L. Distillation Design and Control Using Aspen Simulation; John Wiley & Sons: Hoboken, NJ, USA, 2013.24. Tian, P. Process Design and Control of Acetonitrile-n-Propanol Azeotropic System by Special Distillation. Master’s Thesis,
Qingdao University of science and technology, Qingdao, China, 2016.25. Zhang, L.; Zhang, J.W.; Zhu, H.J. Separation of methanol toluene azeotrope by extractive distillation. Chem. Ind. Eng. 2013, 30,
71–75.26. Mouilk, S.; Bukke, V.; Satta, S.C. Chitosan-polytetrafluoroethylene composite membranes for separation of methanol and toluene
by pervaporation. Carbohydr. Polym. Sci. Technol. Asp. Ind. Important Polysacch. 2018, 69, 28–38. [CrossRef] [PubMed]