Froth Structure and Mass Transfer on Distillation Trays - ERA
Upload
independentCategory
view
0download
0
G
C
SE
MRa
Mb
c
a
ARR2AA
KPREN
1
ia“pptttrepp
rFppce
0d
ARTICLE IN PRESS Model
ACE-4406; No. of Pages 11
Computers and Chemical Engineering xxx (2012) xxx– xxx
Contents lists available at SciVerse ScienceDirect
Computers and Chemical Engineering
jo u rn al hom epa ge : www.elsev ier .com/ locate /compchemeng
ynthesis of n-propyl propionate in a pilot-plant reactive distillation column:xperimental study and simulation
artin Cruz-Díaza,b, Carstens Buchalyc, Peter Kreisc, Eduardo S. Pérez-Cisnerosa,icardo Lobo-Oehmichena,∗, Andrzej Górakc
Departamento de Ingeniería de Procesos e Hidráulica, Universidad Autónoma Metropolitana-Iztapalapa, Av. San Rafael Atlixco No. 186, Del. Iztapalapa, CP 09340 México, D. F.,exicoDivisión de Química y Bioquímica, Tecnológico de Estudios Superiores de Ecatepec, Av. Tecnológico S/N Esq. Av. Hank González, CP 55120 Ecatepec, Edo. de Mex., MexicoDepartment of Biochemical and Chemical Engineering, TU Dortmund University, Emil-Figge-Str. 70, 44227 Dortmund, Germany
r t i c l e i n f o
rticle history:eceived 22 June 2011eceived in revised form5 December 2011ccepted 3 January 2012
a b s t r a c t
The catalytic esterification of n-propyl propionate using propionic acid and n-propyl alcohol as reac-tants via a conventional pilot plant reactive distillation column was carried-out. The strongly acidicion-exchange resin Amberlyst46TM was used as the solid acid catalyst. The influence of the reflux ratio(from 2.0 to 2.5), the molar feed ratio (from 2.0 to 2.5), and total feed (from 3.0 to 4.0 kg/h) on the purityand conversion of the species and on the composition and temperature profiles along the column was
vailable online xxxeywords:ropyl propionateeactive distillationsterification reactionon-equilibrium model
analyzed. A 23 experimental design with six actual and two simulated experiments was carried-out.With the experimental conditions obtained from the simulation results, the experiments showed thata reflux ratio of 2.0, a molar feed ratio of 2.0 and a total feed of 4 kg/h, yielded the largest propyl pro-pionate production (1.60 kg/h). The simulated experiments were carried out using a non-equilibriummodel implemented into the simulation environment Aspen Custom ModelerTM.
© 2012 Elsevier Ltd. All rights reserved.
. Introduction
The structure of chemical process plants may be significantlymproved by the integration of chemical reaction and species sep-ration in one multifunctional process unit. This concept, namedreactive separation” may lead to a reduction in equipment andlant size, increased energy efficiency and process safety, wasteroducts reduction, and lower capital investment. Reactive dis-illation (RD) is one of the most important technologies of thisype. In RD the reactants are transformed to products with simul-aneous separation of products and recirculation of unreactedeactants to the column. It is also possible to overcome chemical
Please cite this article in press as: Cruz-Díaz, M., et al. Synthesis of n-propyl
study and simulation. Computers and Chemical Engineering (2012), doi:10.1
quilibrium limitations, achieve high selectivity towards desiredroducts, integrate the heat of reaction for in situ distillation, anderform difficult separations like binary o ternary azeotropes o
Abbreviations: ACM, Aspen Custom Modeler; (D/F)mass, distillate-to-feed massatio; EA–EB, simulation experiment; E1–E6, experiment; EQ, equilibrium model;, mass flow; FR, molar feed ratio; NEQ, non-equilibrium stage model; PI,rocess intensification; POH, 1-propanol; ProAc, propionic acid; ProPro, n-propyl-ropionate; Q, composition; RD, reactive distillation; RDC, reactive distillationolumn; RR, reflux ratio; T, temperature; TF, total feed of reagents; VLE, vapor–liquidquilibrium; W, weight; x (mol/mol), mole fraction; X, conversion.∗ Corresponding author. Tel.: +52 55 5804 1161; fax: +52 55 5804 4900.
E-mail address: [email protected] (R. Lobo-Oehmichen).
098-1354/$ – see front matter © 2012 Elsevier Ltd. All rights reserved.oi:10.1016/j.compchemeng.2012.01.004
multicomponent mixtures with near boiling point (Almeida-Rivera,Swinkels, & Grievink, 2004; Keil, 2007; Sundmacher & Kienle,2002).
On the other side, the second half of the 20th century has seen agrowing awareness of the ecological impact of chemicals produc-tion. It is now widely recognized that the development of inherentlyclean synthesis methodologies can offer process safety, waste prod-ucts reduction, and lower capital investment. This search for “greenchemistry” is a huge challenge for fundamental research in chem-ical engineering and their neighboring areas (Anastas & Warner,1998). One important aspect of research towards more sustain-able processes for chemical synthesis is the scientific evaluationof potential replacements for volatile organic compounds (VOCs)as solvents.
In this way, the ester n-propyl propionate (ProPro) is an impor-tant chemical which is used as an alternative solvent in coatings andprinting inks; it is also used in perfumes, fragrances, and as a fla-voring in food industry. This solvent is not listed as Hazardous AirPollutant by the United States Environmental Protection Agency,demonstrating reduced ozone formation potential. The ProPro isnot expected to contribute to lower level smog formation, is readily
propionate in a pilot-plant reactive distillation column: Experimental016/j.compchemeng.2012.01.004
biodegradable, which suggests the chemical will be rapidly andcompletely removed from water and soil environments, includ-ing biological wastewater treatment plants. It can be produced bythe esterification of propionic acid (ProAc) with n-propanol (POH),

ARTICLE ING Model
CACE-4406; No. of Pages 11
2 M. Cruz-Díaz et al. / Computers and Chemi
Nomenclature
Keq equilibrium constantk1 rate constant forward reaction (mol eq−1 kg−1)Ea activation energy (kJ mol−1)mcat,dry mass of dry catalyst (kg)vi stoichiometric coefficient of component i
−1
papas(
knamvatma
iPslwCXistcaahM(lst
i(tiobi(KHMafiptNK
cact concentration of active sites (eq kg )ai activity of component i (mol-mol−1)
roducing water as a side product. Since the reaction is reversiblend limited by equilibrium, RD may improve the process in com-arison with the conventional process, where ProPro is produced in
batch or continuous reactor in a homogeneous or heterogeneousystem catalyzed by acids followed by several distillation columnsDuarte, Buchaly, Kreis, & Loureiro, 2006).
However, for the efficient application of RD concepts reliableinetic and thermodynamic data for the specific reaction system areeeded. Thus, the thermodynamic behavior of the VLE and VLLE forn esterification system could be considered through the solutionodels to represent the non ideality in the liquid phase, while the
apor phase non ideality considering the dimerization of organiccids may be described by an appropriate equation of state. Forhe esterification reaction rate equations a pseudo-homogeneous
odel or a Langmuir–Hinshelwood–Hougen–Watson (LHHW)pproach in terms of activities may be used.
From the experimental point of view, it is well known that ester-fication and etherification reactions are promoted by acid catalysis.articularly, heterogeneous catalysis has the advantage that theolid acid catalyst does not contaminate the process stream. In theast decade, acid ion-exchange resins (Amberlyst 15, 35, and 39)
ere widely used in several systems (Brehelin et al., 2007; Lee,hiu, & Lin, 2002; Liu & Tan, 2001; Steinigeweg & Gmehling, 2003;u & Chuang, 1997). In the case of esterification reactions, acid
on-exchange resins are good catalyst, but they fail on the thermaltability test (Kiss, Dimian, & Rothenberg, 2006); another impor-ant disadvantage of this type of resin is its high affinity for waterausing deceleration of the reaction rate. Recently, new acid cat-lysts have been developed for esterification reactions in order tovoid catalyst deactivation and showing more stability at relativelyigh temperatures, i.e. zeolite BEA (Schildhauer, Hoek1, Kapteijn, &oulijn, 2009) and the noncorrosive Brønsted acidic ionic liquids
BAILs) (Tao et al., 2011). In summary, still one of the main prob-ems for the application of reactive distillation is to find a suitableolid catalysts which should be active, selective, and stable underhe process conditions.
From the modeling and simulation side, commonly the numer-cal simulation of a RDC is carried out using the equilibrium stageEQ), or the non-equilibrium stage (NEQ). The simulations are usedo identify the role of important operating and design factors,.e. reflux ratio, reactant ratio, distillate/feed (D/F) ratio, heightf the reactive section, etc. In this context, a considerable num-er of papers have been published that contain well-documented
nformation on reactive distillation modeling and simulationsDamartzis & Seferlis, 2010; Dimian, Bildea, Omota, & Kiss, 2009;atariya, Kamath, Moudgalya, & Mahajani, 2008; Lee, Yen, Chien, &uang, 2009; Tang, Chen, Huang, & Yu, 2005). Svandová, Labovsky,arkos, and Jelemensky (2009) compared the prediction of the EQ
nd NEQ models during a RDC safety analysis focusing on the identi-cation of hazardous situations operability problems (HAZOP). The
Please cite this article in press as: Cruz-Díaz, M., et al. Synthesis of n-propyl
study and simulation. Computers and Chemical Engineering (2012), doi:10.1
redictive magnitudes of the deviations were different consideringhe EQ or the NEQ model. Górak and Hoffmann (2001), Hoffmann,oeres, and Górak (2004) and Pelkonen, Görak, Ohligschläger, andaesemann (2001) validated the NEQ model with the experimental
PRESScal Engineering xxx (2012) xxx– xxx
composition profiles along the column height in a structured-packed distillation column with several non ideal systems. Klökeret al. (2003, 2004) studied the synthesis of ethyl and hexyl acetatesby RD; the experiments were performed using both laboratory scaleand semi-industrial scale columns; the simulation results wereobtained using the NEQ approach.
Particularly, for the synthesis of the ester n-propyl-propionate,Buchaly, Kreis, and Görak (2007) reported a hybrid process thatcombines a RD column with a membrane module in the distil-late stream in order to selectively remove the produced waterwithout any entrainer. These authors studied the modeling andsimulation of the process, and discussed the key issues for thetheoretical description of the RD column using a NEQ approach.Altman et al. (2010) studied the synthesis of ProPro in a RDC bycoupling a decanter in the distillate stream, in order to recoverthe products and the unreacted starting materials. The decantercan separate the distillate into two major currents without usingany other agents. The aqueous phase is removed from the processand part of the organic phase is used as reflux to the column. Theauthors noted several operational difficulties, especially in the con-text of the liquid–liquid phase separator employed; nearly 40% ofthe experiments failed the data-reconciliation test and thus werenot used for model validation.
Therefore, the objective of the present work is to provide reli-able experimental data for the ProPro synthesis in a conventionalRDC avoiding the operational difficulties found by using a topliquid–liquid decanter. An experimental design based on a facto-rial arrangement of three variables: the reflux ratio (RR), the molarfeed ratio of both reactants (FR), and the reactants total feed (TF) isused to identify the role of these important operating variables onthe steady-state reactants conversion, the production rate, and thepurity of the products at the top and bottom streams. The predic-tive capacity of the NEQ model is used to develop the experimentaldesign and to simulate two experiments to complete it. The experi-mental composition and temperature profiles along the RD columnserve to further validate the NEQ model.
2. The reactive system
2.1. Esterification reaction of n-propyl propionate
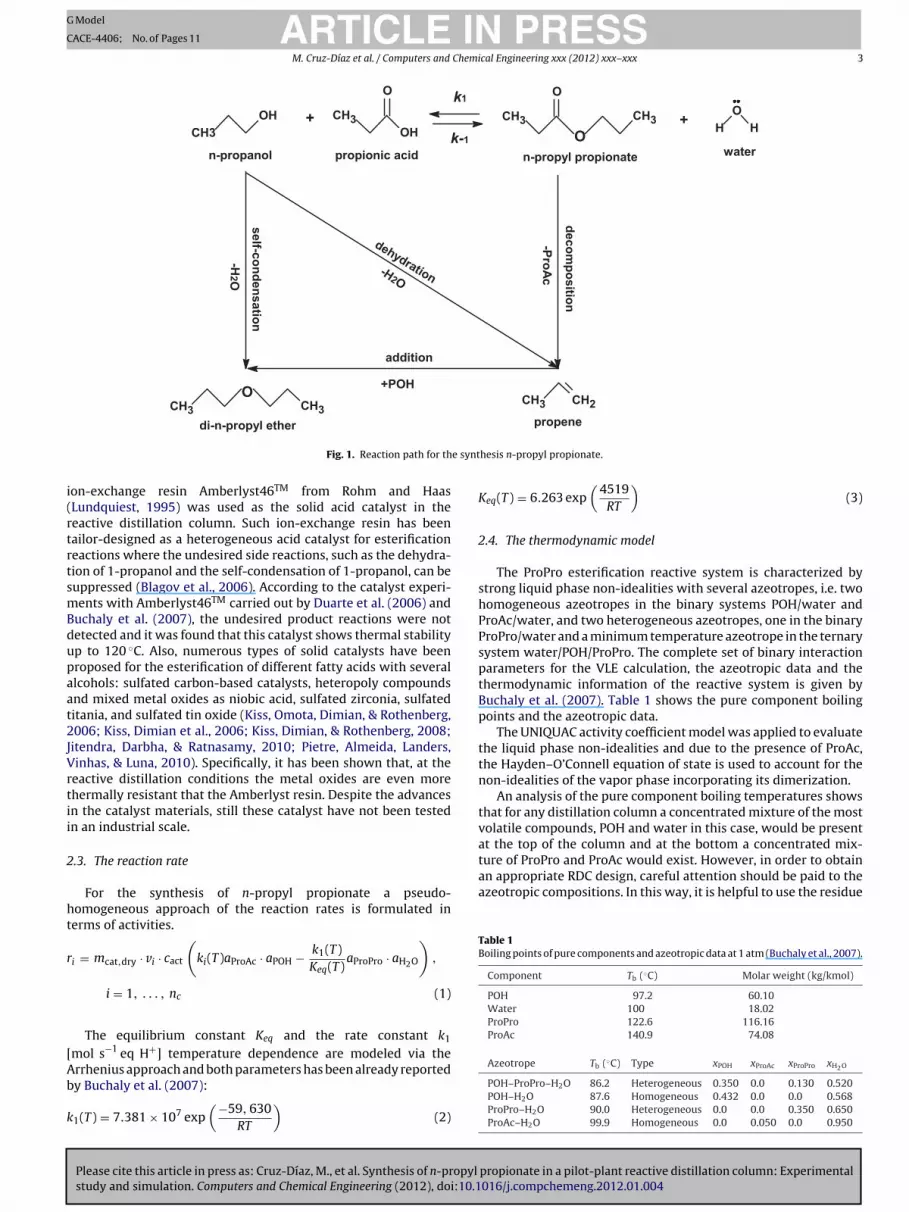
The heterogeneously catalyzed synthesis of n-propyl propionate(ProPro) is formed by the reversible liquid-phase esterification ofn-propanol (POH) and propionic acid (ProAc) with water as an addi-tional by-product according to following reaction scheme.
In the temperature range of 90–130 ◦C, several side reactionslike self-condensation and dehydration are possible under acidicconditions (see Fig. 1). The self-condensation of the alcohol leadsto ethers, whereas the dehydration leads to olefins. In the n-propylpropionate synthesis, these side reactions create di-n-propyl etherand propene, respectively. The di-n-propyl ether is formed fromtwo propanol molecules. Propene can be formed by dehydration of1-propanol as well as by decomposition of n-propyl propionate.Furthermore, the ether can also be synthesized by an additionreaction if propene is present in the reacting mixture in sufficientamounts (Blagov et al., 2006). In the present work, it is assumedthat the RDC operating conditions and the catalyst selected lead toconsider that such side reactions do not occur.
2.2. The solid acid catalyst
propionate in a pilot-plant reactive distillation column: Experimental016/j.compchemeng.2012.01.004
For the reversible esterification reaction on a solid acid catalyst(SAC), the hydrophobicity of the catalyst surface and the densityof the acid sites are highly important, since these aspects deter-mine the catalyst activity and selectivity. The strongly acidic
ARTICLE IN PRESSG Model
CACE-4406; No. of Pages 11
M. Cruz-Díaz et al. / Computers and Chemical Engineering xxx (2012) xxx– xxx 3
+ CH3
O
OH+
H
O
H
propionic acidn-propanol n-propyl pr opio nat e water
k1
k-1
OCH2CH3
OH
CH3
deco
mp
ositio
n
self-c
on
den
sa
tion
dehydration
CH3
O
O
CH3
propene
-Pro
Ac-H
2O
-H2O
additio n
+POH
CH3CH3
e synt
i(rtrtsmBdupaat2JVrtii
2
ht
r
[Ab
k
at the top of the column and at the bottom a concentrated mix-ture of ProPro and ProAc would exist. However, in order to obtainan appropriate RDC design, careful attention should be paid to theazeotropic compositions. In this way, it is helpful to use the residue
Table 1Boiling points of pure components and azeotropic data at 1 atm (Buchaly et al., 2007).
Component Tb (◦C) Molar weight (kg/kmol)
POH 97.2 60.10Water 100 18.02ProPro 122.6 116.16ProAc 140.9 74.08
Azeotrope Tb (◦C) Type xPOH xProAc xProPro xH2O
di-n-propyl ether
Fig. 1. Reaction path for th
on-exchange resin Amberlyst46TM from Rohm and HaasLundquiest, 1995) was used as the solid acid catalyst in theeactive distillation column. Such ion-exchange resin has beenailor-designed as a heterogeneous acid catalyst for esterificationeactions where the undesired side reactions, such as the dehydra-ion of 1-propanol and the self-condensation of 1-propanol, can beuppressed (Blagov et al., 2006). According to the catalyst experi-ents with Amberlyst46TM carried out by Duarte et al. (2006) and
uchaly et al. (2007), the undesired product reactions were notetected and it was found that this catalyst shows thermal stabilityp to 120 ◦C. Also, numerous types of solid catalysts have beenroposed for the esterification of different fatty acids with severallcohols: sulfated carbon-based catalysts, heteropoly compoundsnd mixed metal oxides as niobic acid, sulfated zirconia, sulfateditania, and sulfated tin oxide (Kiss, Omota, Dimian, & Rothenberg,006; Kiss, Dimian et al., 2006; Kiss, Dimian, & Rothenberg, 2008;itendra, Darbha, & Ratnasamy, 2010; Pietre, Almeida, Landers,inhas, & Luna, 2010). Specifically, it has been shown that, at theeactive distillation conditions the metal oxides are even morehermally resistant that the Amberlyst resin. Despite the advancesn the catalyst materials, still these catalyst have not been testedn an industrial scale.
.3. The reaction rate
For the synthesis of n-propyl propionate a pseudo-omogeneous approach of the reaction rates is formulated inerms of activities.
i = mcat,dry · vi · cact
(ki(T)aProAc · aPOH − k1(T)
Keq(T)aProPro · aH2O
),
i = 1, . . . , nc (1)
The equilibrium constant Keq and the rate constant k1
mol s−1 eq H+] temperature dependence are modeled via therrhenius approach and both parameters has been already reported
Please cite this article in press as: Cruz-Díaz, M., et al. Synthesis of n-propyl
study and simulation. Computers and Chemical Engineering (2012), doi:10.1
y Buchaly et al. (2007):
1(T) = 7.381 × 10⁷ exp(−59, 630
RT
)(2)
hesis n-propyl propionate.
Keq(T) = 6.263 exp(
4519RT
)(3)
2.4. The thermodynamic model
The ProPro esterification reactive system is characterized bystrong liquid phase non-idealities with several azeotropes, i.e. twohomogeneous azeotropes in the binary systems POH/water andProAc/water, and two heterogeneous azeotropes, one in the binaryProPro/water and a minimum temperature azeotrope in the ternarysystem water/POH/ProPro. The complete set of binary interactionparameters for the VLE calculation, the azeotropic data and thethermodynamic information of the reactive system is given byBuchaly et al. (2007). Table 1 shows the pure component boilingpoints and the azeotropic data.
The UNIQUAC activity coefficient model was applied to evaluatethe liquid phase non-idealities and due to the presence of ProAc,the Hayden–O’Connell equation of state is used to account for thenon-idealities of the vapor phase incorporating its dimerization.
An analysis of the pure component boiling temperatures showsthat for any distillation column a concentrated mixture of the mostvolatile compounds, POH and water in this case, would be present
propionate in a pilot-plant reactive distillation column: Experimental016/j.compchemeng.2012.01.004
POH–ProPro–H2O 86.2 Heterogeneous 0.350 0.0 0.130 0.520POH–H2O 87.6 Homogeneous 0.432 0.0 0.0 0.568ProPro–H2O 90.0 Heterogeneous 0.0 0.0 0.350 0.650ProAc–H2O 99.9 Homogeneous 0.0 0.050 0.0 0.950

ARTICLE ING Model
CACE-4406; No. of Pages 11
4 M. Cruz-Díaz et al. / Computers and Chemi
Fs
cmFPi
m
had three packed sections, one condenser, one reboiler, and auxil-
FR
ig. 2. Residual curve map (RCM) for ternary system (POH–water–ProPro) at atmo-phere pressure.
urves map of the reactive system in order to preliminary deter-ine the RDC operating regions (temperature and compositions).
ig. 2 shows the ternary residue curves map for POH, water androPro at atmospheric pressure considering the VLLE phase behav-
Please cite this article in press as: Cruz-Díaz, M., et al. Synthesis of n-propyl
study and simulation. Computers and Chemical Engineering (2012), doi:10.1
or.It can be observed in this ternary diagram that a considerable
iscibility gap exists; this is due to the binary water/ProPro and
ig. 3. Reactive distillation process scheme for propyl-propionate synthesis. Controller (DC is located at the Chair of Fluid Separation Processes of the Technical University of Do
PRESScal Engineering xxx (2012) xxx– xxx
the POH/water systems that span a large part of the phase behav-ior triangle. Also, it can be noted that the ternary heterogeneousPOH/water/ProPro azeotrope is an unstable node in the system withthe lowest boiling point (Tb = 85.82 ◦C) and that the homogeneousbinary POH/water azeotrope with a boiling point of Tb = 87.64 ◦Cis a saddle point. Finally, a distillation boundary due to the threeexisting azeotropes divides the phase triangle into two distillationregions, labeled as I and II. For the purpose of obtaining high purityProPro the column should be operated in distillation region I. Noticealso that the distillate stream will always contain small amounts ofProPro, depending on the operating conditions of the RDC. To obtainthe highest product purity, almost total acid conversion shouldoccur, and thus an excess of alcohol must be used.
Also, especial attention should be paid to the reactants initialmolar ratio in order to prevent two liquid phase formation; as itmay be observed in Fig. 2, when most of the acid and POH are con-sumed in the reactive section, the reactive system would end upclose to the binary and ternary azeotropes at the top of the col-umn. In summary, an excess of n-propanol must be used to ensurea homogeneous distillate stream.
3. Materials and methods
3.1. Reactive distillation process description
The experiments were carried out in a 51 mm ID glass reactivedistillation column operating at atmospheric pressure. The column
propionate in a pilot-plant reactive distillation column: Experimental016/j.compchemeng.2012.01.004
iary equipment as shown in Fig. 3. The enriching section consistedof two modules of SulzerTM BX packing with a 2.4 m total height.The reactive section was placed below the enriching section and
C), indicator (I), mass flow (F), composition, (Q), temperature (T), weight (W). Thertmund (TUD).

IN PRESSG Model
C
Chemical Engineering xxx (2012) xxx– xxx 5
hhtpmlttttci
tauwwaP
ccGtiFadi
3
3
uStfeaLmwT
3
Si102grfatETot
3
w
ARTICLEACE-4406; No. of Pages 11
M. Cruz-Díaz et al. / Computers and
ad two modules of the Katapak SP-11 packing with a 2.2 m totaleight, where the catalyst was immobilized in wire-gauze bags;he catalyst mass was 0.205 kg of dry catalyst/m packing. The strip-ing section was located below the reactive section and had twoodules of the SulzerTM BX packing, with a 1.0 m total height. A
iquid distributor was installed below each packing module, wherehe liquid flowing from the module above was collected and redis-ributed to the packing module below. Two different distributorypes with one or six drip points ensured a good liquid distribu-ion on the first packing module of each section. Adiabatic processonditions were achieved by using a heating jacket and a propernsulation of mineral wool.
The column had two feeds. Feed A supplied ProAc at 88.2 ◦C tohe upper part of the reactive section, while feed B delivered POHt 83.9 ◦C 1.2 m below feed A. A water-cooled total condenser wassed at top of the column to collect a vapor mixture of POH and H2Oith a small amount of ProPro. The distillate and the reflux wereithdrawn from a holding drum. The ProPro product was obtained
t the RDC bottom, and consisted of a mixture of ProPro, ProAc, andOH.
In order to store and monitor all the process variables and toontrol the operating variables during the experiments, a processontrol system (MSR-Manager/Labvision, HiTec Zang, Herogenrath,ermany) was installed. The mass flow rates of the feeds, the bot-
om and the distillate streams were determined with Sartorius MC1ndustrial balances via the time derivative of the mass change (inig. 3 the balances are indicated as WIC for feeds and WI for distillatend bottom products). For these accurate balances, the standardeviation of ±0.01 kg/h was used to close the overall mass balance
n the data reconciliation.
.2. Analytical methods
.2.1. ChemicalsThe n-propanol, propionic acid, and n-propyl propionate
sed for the gas chromatography calibration were supplied byigma–Aldrich with a purity of 0.99 g/g and used without furtherreatment. Acetonitrile (used as internal standard) was obtainedrom Merck with the same quality. Since the reactive distillationxperiments required large amount of chemicals, the n-propanolnd propionic acid were delivered in industrial bins by BASF AG,udwigshafen. The purity of these chemicals was always deter-ined before each experiment. Normal boiling points and molareight of the species involved in the RD experiments are given in
able 1.
.2.2. Gas chromatographyThe streams compositions were analyzed off-line using a
himadzu gas chromatograph (GC-14A) equipped with a flame ion-zation detector (FID), an autosampler AOC 20i, and a FS-Innopeg000 capillary column (25 m × 0.25 mm) with a film thickness of.27 �m. Helium was used as carrier gas with a gas velocity of7 cm/s. The split-ratio was set to 1:145; the temperature pro-ram for a fast and sharp separation was 333 K for 4.5 min, heatate of 30 K min−1 to 453 K, and then holding at this temperatureor 2.4 min. The method of the internal standard (acetonitrile) waspplied to obtain the mass fractions directly from the evaluation ofhe chromatogram based on single component calibration curves.ach sample was analyzed three times and its average determined.he water composition can only be indirectly calculated by meansf the summation conditions. For this reason the Karl–Fischer titra-ion was used to determine the water content.
Please cite this article in press as: Cruz-Díaz, M., et al. Synthesis of n-propyl
study and simulation. Computers and Chemical Engineering (2012), doi:10.1
.2.3. Karl–Fischer titrationThis method is useful for the quantitative determination of the
ater content in a mixture. The titration was carried out with a
Fig. 4. Experimental design for the RD experiments. Values given are RR, FR, and TF.
titrator from Mettler Toledo DL 31, which is based on a volumet-ric titration method (reagents: methanol, Hydranal Composite 5,Hydranal-Water Standard 100). The water mass fraction in thesample can be calculated afterwards with high accuracy from thequantity of Hydranal reagent used.
3.3. Reactive distillation experiments
The experimental design was based on a 23 factorial arrange-ment of the three predominant operational variables: the refluxratio (RR), the POH/ProAc molar feed ratio (FR), and mass total feedof reagents (TF). The experimental design based on RR, FR, and TFmay be represented as the vertexes of a cube, as illustrated in Fig. 4.The experiments were carried out with RR values of 2.0 and 2.5; theFR values of 2.0 and 2.5, and TF of 3.0 and 4.0 kg/h. As mentionedbefore, an excess of 1-propanol over ProAc was used in order to pro-mote the acid conversion and to prevent the formation of a secondliquid phase.
The operating conditions of the reactive distillation columnwere chosen according with the following considerations: (a)the RR from 2.0 to 2.5 were chosen according to simulationresults reported by Buchaly et al. (2007) and Altman et al. (2010),where it was studied the influence of the operation conditions(TF = 3.0–4.0 kg/h, RR from 2.0 to 4.0, and heat duty from 400 to1200 W) on product purity and acid conversion; (b) the molar FR ofreagents between 2.0 and 2.5 was chosen to avoid the two phasesin the distillate stream, values less than 2.0 could lead to the for-mation of two phases (Altman et al., 2010); and (c) the TF from 3.0to 4.0 kg/h, to observe its effect on conversion and product purity,as well as how long the column takes to reaches the stable state.Moreover, under these operating conditions it is expected that thecomposition and flow rate of distillate could be further processed toremove water and re-circulate the POH to increase the conversionof reactants and product purity (Buchaly et al., 2007).
The actual experiments carried out were E1–E6, while EA and EBcube vertexes were determined by simulation. Since the model wasused to establish the experimental design and predict two exper-iments (EA and EB) by simulation to cover all the cube vertexes,the model should be validated with reliable experimental data toassure predictability under different operating conditions. Thus,the process data was reconciled at steady state. Two requirementshad to be fulfilled to determine the existence of a stable state inthe RDC: (a) minor change over time in the monitored tempera-ture profile of the column (±0.25 ◦C), and (b) closed mass balance
propionate in a pilot-plant reactive distillation column: Experimental016/j.compchemeng.2012.01.004
of the column streams (maximum ± 4% in weight). Three temper-ature and composition profiles were measured to assure the RDCstable state.

ARTICLE IN PRESSG Model
CACE-4406; No. of Pages 11
6 M. Cruz-Díaz et al. / Computers and Chemical Engineering xxx (2012) xxx– xxx
Table 2Summary of mass flow rates and flow ratios of the reactive distillation column experiments.
Feed ProAc (Kg/h) Feed POH (kg/h) TF (kg/h) FR (mol) RR (mass) Distil. (kg/h) Bottom (kg/h) Reflux (kg/h) D/F (mass) ProPro at bottoms (kg/h)
E1 1.32 2.68 4.00 2.50 2.59 1.71 2.27 4.44 0.43 1.37E2 1.50 2.50 4.00 2.05 2.00 1.90 2.13 3.79 0.47 1.60E3 0.99 2.01 3.00 2.50 2.00 1.67 1.31 3.33 0.55 1.11E4 1.14 1.86 3.00 2.02 2.50 1.47 1.51 3.69 0.49 1.25E5 1.32 2.68 4.00 2.50 2.02 2.03 1.95 4.09 0.51 1.37
1.34 2.64 3.29 0.34 1.611.51 1.49 3.34 0.50 1.271.34 1.66 3.34 0.45 1.11
3
mspoUtm
mcptI2b2
4
Rmimdmeiic
tPuou
Fig. 5. Liquid phase composition profiles for experiments where reflux ratio (RR)
TC
E6 1.53 2.47 4.00 1.94 2.45
EA 1.14 1.86 3.00 2.00 2.00
EB 0.99 2.01 3.00 2.50 2.50
.4. Mathematical modeling
Reliable process models are decisive for RDC design, as theyay reduce the process development time, the operation cost, and
cale-up to industrial applications. The NEQ model for RDC witheripherals, such as reboiler and condenser used here, was devel-ped at the Chair of Fluid Separation Processes of the Technicalniversity of Dortmund, Germany, and it was implemented into
he simulation environment Aspen Custom ModelerTM. Also, theodel was linked to the Aspen physical properties database.The specific correlations and parameters employed in the NEQ
odel for the determination of mass transfer coefficients, specificontact area, liquid hold-up, and pressure drop for the reactiveacking Sulzer KatapakTM-SP 11 used in the reactive section ofhe column were developed under the European research projectNSERT-Integrating Separation and Reaction Technologies (Brunazzi,006). The complete set of equations and the model description cane found elsewhere (Górak and Hoffmann, 2001; Hoffmann et al.,004; Klöker, Kenig, Hoffmann, Kreis, & Górak, 2005).
. Results and discussion
This section presents the experimental results obtained in theDC, as well as those resulting from the simulations with the NEQodel. A summary of the mass flow rates, and flow ratios is given
n Table 2. Notice that the operating variable distillate-to-feedass ratio, (D/F)mass is used as an equivalent to the reboiler heat
uty. This is due to the fact that thermo-oil was used as heatingedium, which itself is heated up electrically in an external heat
xchanger. Since the overall efficiency of the system, �total, splintednto �electricity→oil and �oil→column was unknown, the adjusted heatnput at the evaporator was not equivalent to the heat input in theolumn.
The distillate and bottom product compositions, as well as reac-ants conversions for all experiments are given in Table 3. The
Please cite this article in press as: Cruz-Díaz, M., et al. Synthesis of n-propyl
study and simulation. Computers and Chemical Engineering (2012), doi:10.1
roPro composition and reactants conversions obtained by sim-lation with the model are also included in this table. The statusbtained at the end of run experiments is stated in the last col-mn, where it may be noted that experiment E6 was not completely
able 3omposition of the distillate and bottom streams, and reactants conversions.
Distillatex (mol/mol)
Bottomx (mol/mol)
POH Water ProPro SimProPro
POH ProAc ProPro
E1 0.609 0.357 0.033 0.037 0.353 0.185 0.460
E2 0.574 0.386 0.041 0.045 0.132 0.225 0.643
E3 0.644 0.318 0.039 0.044 0.032 0.192 0.771
E4 0.603 0.364 0.033 0.038 0.000 0.242 0.740
E5 0.635 0.325 0.040 0.045 0.210 0.204 0.573
E6 0.389 0.558 0.052 0.040 0.383 0.156 0.461
EA 0.563 0.395 0.041 0.041 0.001 0.209 0.790
EB 0.574 0.389 0.034 0.034 0.331 0.139 0.529
are different. E2 (RR = 2.0, empty symbols and dashed line) and E6 (RR = 2.5, fullsymbols and solid line). In both experiments the following conditions were fixed at:TF = 4.0 kg/h; FR = 2.0.
reconciled since there were some problems to account for the dis-tillate stream during the experiment. This behavior is observed onFig. 5 at plot’s enrichment section, where the simulation and exper-imental data do not match. For the rest of experiments the statuswas correct. It may be observed that the simulated compositionand conversions are in very good agreement with the experimentaldata.
4.1. Influence of the reflux ratio
propionate in a pilot-plant reactive distillation column: Experimental016/j.compchemeng.2012.01.004
Tables 2 and 3, and Fig. 5 show the effect of changing the RRfrom 2.0 (experiment E2) to 2.5 (experiment E6), at FR = 2.0 andTF = 4 kg/h. The empty symbols represent the experimental data
ConversionX (exp)
ConversionX (sim)
Status
SimProPro
POH ProAc POH ProAc
0.456 29.36 73.44 29.65 73.84 Reconciled0.646 37.16 76.19 37.50 76.45 Reconciled0.772 32.76 81.99 33.22 82.69 Reconciled0.768 38.15 77.02 39.32 79.41 Reconciled0.565 30.53 76.23 30.90 76.64 Reconciled0.480 38.76 76.89 38.34 76.84 No fulfilled0.790 – – 39.80 80.90 –0.529 – – 32.00 80.90 –

ARTICLE ING Model
CACE-4406; No. of Pages 11
M. Cruz-Díaz et al. / Computers and Chemi
Fig. 6. Liquid phase composition profiles for experiments where reflux ratio (RR)are different. EA (RR = 2.0, dashed line represents the simulated experiment) and E4(RR = 2.5, full symbols and solid line). In both experiments the following conditionsw
fflsasttiPtPfIpcsiomefttas
(ebfebalwt(
On the other hand, it may be observed that the molar feed ratio
ere fixed at: TF = 3.0 kg/h; FR = 2.0.
or E2, and the dashed line the corresponding simulation, whileull symbols represent the experimental data for E6, and the solidine the corresponding simulation. It may be seen that the chemicalpecies present in the distillate were POH, ProPro and water, whilet the column bottom the species were POH, ProPro, ProAc, andmall amounts of water. The change in RR from 2.0 to 2.5 causedhe distillate stream to change from 1.90 to 1.34 kg/h and the bot-om stream from 2.13 to 2.64 kg/h. There were important changesn the distillate composition: POH was diluted from 0.574 to 0.389,roPro changed slightly from 0.041 to 0.052, and water was concen-rated from 0.386 to 0.558. On the other hand, in the bottom streamOH was concentrated from 0.132 to 0.383, ProPro was dilutedrom 0.643 to 0.461, and ProAc was diluted from 0.225 to 0.156.t was also observed for both experiments that the species com-ositions were almost similar in the reactive section, which led toonclude that the conversion for both experiments was about theame (see Table 3). All these figures clearly indicate that the changen RR from 2 to 2.5 leads to lower ProPro purity and POH strippingut at the bottom stream, although there is no influence in ProProass production at the bottom stream (∼1.60 kg/h); the opposite
ffect is observed at the distillate stream, the POH is stripped outrom the reactive section at RR = 2.0 causing the water concentra-ion to diminish in the condensate stream. Moreover, at a RR = 2.5he amount of water that is returned to the column is larger thant RR = 2.0 causing higher water concentrations in the enrichmentection.
Fig. 6 shows the effect of changing the reflux ratio (RR) from 2.0experiment EA) to 2.5 (experiment E4), at FR of 2.0; in contrast withxperiments E2 and E6, now the TF value is 3 kg/h. The full sym-ols and solid line represent the experimental data and simulationor E4, respectively, and the dashed line represents the simulatedxperiment EA. It can be observed that in the bottom stream inoth experiments there were only two species present (ProPrond ProAc), this indicates that ProPro purity at bottom stream wasarger at TF = 3.0 kg/h than at TF = 4.0 kg/h, and that the mixture
Please cite this article in press as: Cruz-Díaz, M., et al. Synthesis of n-propyl
study and simulation. Computers and Chemical Engineering (2012), doi:10.1
ould be easier to separate in a second unit. On the other hand,he ProAc conversion in this case was larger than at TF = 4.0 kg/hsee Table 3). Hanika, Kolena, and Smejkal (1999) reported similar
PRESScal Engineering xxx (2012) xxx– xxx 7
results in their study of the synthesis of butyl acetate by RD, whenthey decreased the feed rate.
Simulated EA vertex showed that the bottom stream com-position contains more ProPro and less ProAc (0.790 and 0.209,respectively) in comparison with experiment E4 (0.740 and 0.242,respectively); the production of ProPro at the bottom stream forexperiment EA and E4 were almost equal, 1.27 and 1.25 kg/h,respectively. On the other hand, ProAc conversion was higher inexperiment EA (see Table 3). This behavior followed a similar trendas that obtained at TF = 4 kg/h, i.e. when the RR was changed from2 to 2.5, there was a decrement in the ProPro purity and in thePOH stripping out of the bottom stream, although there was noinfluence in ProPro mass production rate at the bottom stream.Moreover, the chemical species behavior in the enrichment zonein both experiments was practically the same. This is because the(D/F)mass values (Table 2) and the water mass flows in both exper-iments were almost equal (1.319 kg/h in EA and 1.343 kg/h in E4),which means that the heat supplied in the reboiler was almost thesame; this was confirmed by the theoretical values of heat cal-culated with the NEQ model (heat duty was 1291 W for the EAexperiment and 1359 W for E4).
Similar results have been obtained by Buchaly et al. (2007); theyreported the influence of the reboiler heat duty (900–1500 W) onthe ProPro purity and ProAc conversion at different reflux ratios(1.5–3.0) for the hybrid separation process. At reflux ratio of 1.5 andapproximated of 1300 W of heat duty (before reaching the floodingpoint) the purity of ProPro reported was 0.83, and the ProAc conver-sion reached was 86%. In our case, the maximum ProPro purity andProAc conversion were obtained at RR = 2.0 and TF = 3 kg/h, withvalues of 0.79 and 80.90%, respectively, although in experiment E4the heat supplied was higher. Altman et al. (2010) reported that at agiven RR an increase in the heat duty caused an increase of the acidconversion up to a maximum value. With a further increase of theheat duty, the acid conversion decreased slightly. This is a typicalbehavior for RD processes because one of the reactants (in this casePOH) is stripped off the reactive section at high heat duties.
4.2. Influence of the feed ratio
It is convenient to recall that all experiments were carried outwith an excess of POH, in order to promote a larger conversionof ProAc; the POH excess ensured that the reaction was drivenin the direction of ProPro (Duarte et al., 2006; Buchaly et al.,2007). Here we analyze the influence of the feed ratio (FR) of reac-tants on the column behavior. The FR working range was from2.0 to 2.5. It may be recalled that experiment E2 yielded a bet-ter ProPro bottoms composition than experiment E6. Therefore,for experiments with TF = 4 kg/h, the comparison is made betweenexperiments E2 (FR = 2.05) and E5 (FR = 2.5); meanwhile for experi-ment with TF = 3 kg/h the comparison will be between experimentsEA (FR = 2.0) and E3 (FR = 2.5).
Fig. 7 shows the composition profiles of experiments E2 andE5 at RR = 2.0 and TF = 4 kg/h. It may be observed that the molefraction of POH in distillate and bottom streams for experiment E5was larger than in experiment E2. At the bottom stream, the molefraction of ProPro in E2 was larger than in E5 (0.643 and 0.573,respectively) and also was the ProPro mass production rate (1.60and 1.37 kg/h, respectively). It may be seen that FR had an impactin the conversion of POH, while the ProAc conversion was almostthe same (see Table 3). The POH conversion was lower in E5; asa consequence, the distillate water mole fraction was lower in E5than in E2.
propionate in a pilot-plant reactive distillation column: Experimental016/j.compchemeng.2012.01.004
(FR) had a considerable influence on the distillate-to-feed massratio, (D/F)mass, which affected the POH conversion and composi-tion of both the distillate and bottom streams. Table 2 shows that

ARTICLE ING Model
CACE-4406; No. of Pages 11
8 M. Cruz-Díaz et al. / Computers and Chemi
Fig. 7. Liquid phase composition profile for experiments where feed ratios (FR) aredaT
tePwlwtaEfol
Fd(w
ifferent. E2 (FR = 2.0, empty symbols and dashed line) and E5 (FR = 2.5, full symbolsnd solid line). In both experiments the following conditions were fixed at: RR = 2.0;F = 4.0 kg/h.
he value of (D/F)mass was larger in experiment E5 (0.51) than inxperiment E2 (0.47), meaning that the heat supply and thus theOH distillate mass flow in experiment E5 (1.29 kg/h) were greaterith respect to experiment E2 (1.09 kg/h).This is because POH is the
ightest component of the mixture with a high evaporation rate,hich causes the POH in the reactive zone to be stripped out to
he column tope (the POH amount was higher in experiment E5);s a consequence, the distillate water mole fraction was lower in5 than in E2. On the other hand, greater amounts of POH were
Please cite this article in press as: Cruz-Díaz, M., et al. Synthesis of n-propyl
study and simulation. Computers and Chemical Engineering (2012), doi:10.1
ed in experiment E5, the excess of which that was not convertedr stripped out, accumulated in the bottom of the column, thusowering ProPro purity.
ig. 8. Liquid phase composition profile for experiments where feed ratios (FR) areifferent. EA (FR = 2.0, dashed line represents the simulated experiment) and E3FR = 2.5, full symbols and solid line). In both experiments the following conditionsere fixed at: RR = 2.0; TF = 3.0 kg/h.
PRESScal Engineering xxx (2012) xxx– xxx
Fig. 8 shows the composition profiles of experiments EA(FR = 2.0) and experiment E3 (FR = 2.5), at a RR = 2.0 and TF = 3 kg/h.The full symbols and solid lines represent the experimental dataand simulation for E3 respectively, and the dashed lines representsthe experiment EA simulation.
It may be seen that at TF = 3 kg/h, the mole fraction of ProProat bottom stream in EA was slightly higher than in E3 (0.790 and0.771, respectively), as well as the ProPro production rate (1.27and 1.11 kg/h, respectively). The mole fraction of POH in distillatestream in E3 was higher than in EA, while the mole fraction of POHin bottom stream was almost zero in experiment EA; the conversionof POH in experiment E3 (33.22%) was lower than experiment EA(39.80%). The ProAc conversion was slightly higher in experimentE3 (81.99%) than in experiment EA (80.90%); moreover, the massflow of ProAc in EA (1.14 kg/h) was larger than in E3 (0.99 kg/h). Onthe other hand, the value of (D/F)mass was larger in experiment E3(0.55) than experiment E2 (0.50).
Hence, at TF = 3 kg/h the column behavior followed the sametrends as experiments at TF = 4 kg/h; as POH was the lightest of themixture present in the reactive zone, it was stripped out to thecolumn top; as a consequence, the distillate water mole fractionwas lower in E3 than in EA. On the other side, because experimentE3 was fed with a larger amount of POH, the excess that was notconverted or stripped out was accumulated in the bottom of thecolumn and thus diminished the ProPro composition.
Therefore, the column behavior is better at feed ratio of 2.0; itmeans that if POH molar flow is increased more than twice that ofthe ProAc, the conversion of POH will decrease because the excess ofPOH will be stripped-out from reactive zone. At FR = 2, there were alarger ProPro production rate and a higher ProPro concentration atthe bottom stream. The D/F ratio impact on conversion was strong:at high D/F ratio, the POH concentration in the rectifying sectionincreased, and thus decreased the POH concentration in the reactivezone and the conversion. Physically, a high D/F ratio implies smallbottom product flow; when mass flow of ProAc is higher (experi-ment EA), it concentrates at the bottom because it is the heaviestcomponent. Similar results were reported by Kołodziej et al. (2004)in their study of synthesis of TAME by RD with a structured catalyticpacking.
4.3. Influence of the total feed
In the previous discussions, it was found that for a total feed of4 kg/h, experiment E2 yielded better results than E5 and E6. For atotal feed of 3 kg/h, the simulated experiment EA had better resultsthan E3 and E4 experiments. Therefore, the effect of total feed willbe discussed by comparing EA and E2 experiments, at a reflux ratioof 2.0 and feed ratio of 2.0. Fig. 9 shows the composition profiles ofEA and E2 experiments.
It may be seen that the mole fractions at the enrichment sec-tion and the distillate product were similar for both experiments(see also Table 3), but below the ProAc feed point the compositionprofiles of POH and ProPro are substantially different. In experi-ment E2, the bottom stream consisted of a ternary mixture; whilein experiment EA the bottom stream was a binary mixture. ProAcconversion was larger in EA than in E2 because of a larger liquidresidence time in the reactive zone. Total feed seems to influenceproductivity and purity of the products. While ProPro throughputwas larger at TF = 4.0 kg/h (1.6 kg/h vs 1.27 kg/h), the bottom streamwas richer in ProPro at TF = 3 kg/h (0.790 vs 0.643).
In the previous sections differences were observed betweenexperiments at TF = 4 kg/h and TF = 3.0 kg/h; for example, on com-
propionate in a pilot-plant reactive distillation column: Experimental016/j.compchemeng.2012.01.004
paring the effect of RR between (E2 and E6) to (EA and E4), andthe effect of FR between (E2 and E5) to (EA and E3), there were pro-nounced differences. This is because the conversion of the reactantsdecreases with increasing column load, as the residence time in the

ARTICLE IN PRESSG Model
CACE-4406; No. of Pages 11
M. Cruz-Díaz et al. / Computers and Chemical Engineering xxx (2012) xxx– xxx 9
Fig. 9. Liquid phase composition profile for experiments where feed ratios (TF) aredEc
rowosfn
ttflabutto
FR
out at TF = 4.0 kg/h. The solid lines represent the simulation of theexperiments carried out with NEQ model. The distillate and bottom
ifferent. EA (TF = 3.0 kg/h, dashed line represents the simulated experiment) and2 (TF = 4.0 kg/h, full symbols and solid line). In both experiments the followingonditions were fixed at: RR = 2.0; FR = 2.0 kg/h.
eactive section diminishes at the higher TF. Further, the amountf catalyst is held constant in the column for both experimentshile the flow rates are increased. Consequently, the comparison
f TF between EA and E2 experiments showed that POH conver-ion drops from 39.80% to 37.16% while ProAc conversion decreasesrom 80.90% to 73.44%. Therefore, the ProPro purity decreases sig-ificantly from 79.0% to 64.6%.
On the other hand, the total feed also influenced the experimen-ation time, as shown in Figs. 10 and 11. In these figures we showhe behavior of the reflux, distillate, bottom, and condensate massows as a function of time for E3 and E5 experiments (TF = 3 kg/hnd TF = 4 kg/h, respectively). The plots have three zones: from theeginning until the vertical line (a), corresponding to the start-p period; from line (a) to line (b) which is the transition period
Please cite this article in press as: Cruz-Díaz, M., et al. Synthesis of n-propyl
study and simulation. Computers and Chemical Engineering (2012), doi:10.1
owards a stable steady state of the column. In this operation periodhe compositions of the input and output streams to evaluate theverall mass balance (data reconciliation) were determined; when
ig. 10. Experimental behavior of mass flow streams of experiment E3 (TF = 3 kg/h,R = 2.0, and FR = 2.0 kg/h).
Fig. 11. Experimental behavior of mass flow streams of experiment E5 (TF = 4 kg/h,RR = 2.0, and FR = 2.0 kg/h).
the error percentage was less than or equal to ±4%, it was consid-ered the beginning of a stable steady state of the column; the periodof line (b) to line (c) corresponds to the stable steady state columnoperation. During this period three composition and temperatureprofiles were determined to ensure the column steady state oper-ation. Finally, after line (c) the column shut-down is depicted. Bycomparing the RDC running times, it can be observed that at TF of3 kg/h the experiment took 13 h to reach the stable steady state,while at TF of 4 kg/h the experiment took 11 h. Therefore, a greaterProPro purity requires more column operation time, which shouldbe considered to evaluate the operation cost with respect to profits.
4.4. The temperature profiles
Fig. 12 shows the behavior of the vapor phase temperatureprofiles for E2, E5 and E6 experiments, all of which were carried
propionate in a pilot-plant reactive distillation column: Experimental016/j.compchemeng.2012.01.004
streams temperature of each experiment is closely related to thecomposition vector and mass flows. It may be seen that the vapor
Fig. 12. Temperature profile for vapor phase, TF = 4.0 kg/h. Experiments: E5(RR = 2.0, FR = 2.5); E2 (RR = 2.0, FR = 2.0); E6 (RR = 2.5, FR = 2.0).

ARTICLE ING Model
CACE-4406; No. of Pages 11
10 M. Cruz-Díaz et al. / Computers and Chemi
FEF
titwffl0mwb
maotap
aiaevtctP
5
ntiTfasemR(
ig. 13. Temperature profile for vapor phase, TF = 3.0 kg/h. Simulation experimentA (RR = 2.0, FR = 2.0); experiment E3 (RR = 2.0, FR = 2.5); experiment E4 (RR = 2.5,R = 2.0).
emperature maximum value in the distillate stream was for exper-ment E5, followed by E2 and E6. For this situation, Table 3 showshat for the distillate the higher mole fraction correspond to POHhile the lower is the water mole fraction; the POH conversion
ollowed the same trend. Also, Table 2 shows that distillate massow and (D/F)mass values obtained were as follow: E5 (2.03 kg/h;.51), E2 (1.90 kg/h; 0.47) and E6 (1.34 kg/h; 0.34), respectively. Thiseans that as the heat input was increased, the distillate mass rateas higher and it was richer in the lighter components, as it would
e expected.The largest bottom vapor temperature corresponded to experi-
ent E2, followed by E5 and E6. Table 3 shows also that the ProPrond ProAc mole fraction values order was analogous to the orderf the temperature values. This means that bottom vapor tempera-ure increased in the order of larger ProPro and ProAc compositionnd lower POH mole fraction. This is consistent with the boilingoints of the different species.
The vapor phase temperature profiles of experiments E3, E4,nd simulated experiment EA are shown in Fig. 13, correspond-ng to TF = 3.0 kg/h. The solid lines represent the simulation of E3nd E4 experiments, while dashed line represents the simulated EAxperiment, all carried out with the NEQ model. For the distillateapor the order of increasing temperature was E3 > E4 > EA, as washe order of increasing POH concentration and diminishing wateroncentration. This trend is similar to the one shown in Fig. 12. Ashe bottom stream is richer in the heavier compounds (ProPro androAc) the vapor temperature will be higher.
. Conclusions
The esterification of propionic acid with 1-propanol to produce-propyl propionate was studied in a conventional reactive distilla-ion column using the surface-sulfonated catalyst AmberlystTM 46mmobilized in the structured catalytic packing KatapakTM-SP 11.he influence of operating parameters, such as: reflux ratio, molareed ratio of 1-propanol to propionic acid, distillate-to-feed ratio,nd the total feed of reactants was analyzed from the results ofix actual and two simulated experiments. The experiments cov-
Please cite this article in press as: Cruz-Díaz, M., et al. Synthesis of n-propyl
study and simulation. Computers and Chemical Engineering (2012), doi:10.1
red a broad range of these important parameters. These resultsay be of help for the analysis and design of n-propyl propionate
DC with more complex configurations. In contrast to Altman et al.2010), most of the experimental data obtained in the present work
PRESScal Engineering xxx (2012) xxx– xxx
were reconciled and the liquid–liquid phase separation operationaldifficulties at the column top were avoided.
The results show that when the reflux ratio is increased (from2 to 2.5), the n-propanol concentration increases and the purity ofthe propyl propionate product at the column bottom diminishes,although the ester mass production rate is unaffected.
On the other hand, the use lower molar feed ratio (2.0) yieldsgreater n-propyl propionate purity at bottom and higher massproduction rate. With respect to D/F ratio when this operationparameter decreases the purity of the desired component ProProis reduced. Also, at higher total feed values the conversion of thereactants decreases. Finally, it was shown that FR and D/F ratio havea considerable impact in the conversion of POH, but not in the con-version of ProAc. The comparatively low sensitivity of the propionicacid conversion to feed ratio variations is caused by the excess of1-propanol.
The analysis of the experimental and simulated results showedthat, in a conventional RDC, at a reflux ratio of 2.0, total feedof 4 kg/h, and a molar feed ratio of 2.0, the n-propyl propionateproduction rate was highest as was the propyl alcohol recov-ery. However, at the same conditions and total feed of 3.0 kg/h,the bottoms n-propyl propionate purity was highest and only abinary mixture was formed, although the time to achieve a sta-ble steady state is larger than at total feed of 4 kg/h. Finally, it wasshown that through an appropriate thermodynamic analysis andusing a NEQ model of the conventional reactive distillation columnfor the experimental design, similar propionic acid conversionsand n-propyl propionate production rate were achieved withouta liquid–liquid decanter at the top of the column as proposed byAltman et al. (2010). The NEQ model was further validated withthe new experimental data obtained in this work, as the modelwas capable of properly predicting the experimental data under avariety of conditions with minor deviations.
Acknowledgements
Martin Cruz-Diaz and Ricardo Lobo-Oehmichen acknowledgethe Chair of Fluid Separations from the Technical University ofDortmund for the use of its facilities. Martin Cruz-Diaz alsoacknowledges the financial support provided by Consejo Nacionalde Ciencia y Tecnología (CONACyT), México.
References
Almeida-Rivera, C. P., Swinkels, P. L. J., & Grievink, J. (2004). Designing reactive dis-tillation processes: Present and future. Computers & Chemical Engineering, 28,1997–2020.
Altman, E., Kreis, P., Van Gerven, T., Stefanidis, G. D., Stankiewicz, A., & Górak, A.(2010). Pilot plant synthesis of n-propyl propionate via reactive distillation withdecanter separator for reactant recovery. Experimental model validation andsimulation studies. Chemical Engineering and Processing: Process Intensification,49, 965–972.
Anastas, P. T., & Warner, J. C. (1998). Green chemistry: Theory and practice. New York:Oxford University.
Blagov, S., Parada, S., Bailer, O., Moritz, P., Lam, D., Weinand, R., et al. (2006). Influ-ence of ion-exchange resin catalysts on side reactions of the esterification ofn-butanol with acetic acid. Chemical Engineering Science, 61, 753–765.
Brehelin, M., Forner, F., Rouzineau, D., Repke, J. U., Meyer, X., Meyer, M., et al. (2007).Production of n-propyl acetate by reactive distillation. Experimental and theo-retical study. Transactions of the IChemE, Part A, Chemical Engineering Researchand Design, 85(A1), 109–117.
Brunazzi E. (2006). Mass transfer study of Katapak-SP 11 packing: Experimentalsetup, measurement procedures, correlations, internal report in the frame ofthe EU Project INSERT-Integrating Separation and Reaction Technologies.
Buchaly, C., Kreis, P., & Görak, A. (2007). Hybrid separation processes combination
propionate in a pilot-plant reactive distillation column: Experimental016/j.compchemeng.2012.01.004
of reactive distillation with membrane separation. Chemical Engineering andProcessing, 46, 790–799.
Damartzis, T., & Seferlis, P. (2010). Optimal design of staged three-phase reactivedistillation columns using nonequilibrium and orthogonal collocation models.Industrial and Engineering Chemistry Research, 49, 3275–3285.

ING Model
C
Chemi
D
D
G
H
H
J
K
K
K
K
K
K
K
K
ARTICLEACE-4406; No. of Pages 11
M. Cruz-Díaz et al. / Computers and
imian, A. C., Bildea, C. S., Omota, F., & Kiss, A. A. (2009). Innovative process for fattyacid esters by dual reactive distillation. Computers & Chemical Engineering, 33,743–750.
uarte, C., Buchaly, C., Kreis, P., & Loureiro, J. M. (2006). Esterification of propi-onic acid with n-propanol catalytic and noncatalytic kinetic study. InzynieriaChemiczna i Procesowa, 27, 273–286.
órak, A., & Hoffmann, A. (2001). Catalytic distillation in structured packings: Methylacetate synthesis. AIChE Journal, 47, 1067–1076.
anika, J., Kolena, J., & Smejkal, Q. (1999). Butylacetate via reactivedistillation—Modelling and experiment. Chemical Engineering Science, 54, 5205–5209.
offmann, A., Noeres, C., & Górak, A. (2004). Scale-up of reactive distillation columnswith catalytic packings. Chemical Engineering and Processing, 43, 383–395.
itendra, K. S., Darbha, S., & Ratnasamy, P. (2010). Influence of surface hydropho-bicity on the esterification of fatty acids over solid catalysts. Energy & Fuels, 24,2154–2161.
atariya, A. M., Kamath, R. S., Moudgalya, K. M., & Mahajani, S. M. (2008). Non-equilibrium stage modeling and non-linear dynamic effects in the synthesis ofTAME by reactive distillation. Computers & Chemical Engineering, 32, 2243– 2255.
eil, F. J. (2007). Modeling of process intensification. Wiley-VCH Verlag GmbH & Co.KGaA.
iss, A. A., Omota, F., Dimian, A. C., & Rothenberg, G. (2006). The heterogeneousadvantage: Biodiesel by catalytic reactive distillation. Topics in Catalysis, 40,141–150.
iss, A. A., Dimian, A. C., & Rothenberg, G. (2006). Solid acid catalysts for biodieselproduction. Towards sustainable energy. Advanced Synthesis & Catalysis, 348,75–81.
iss, A. A., Dimian, A. C., & Rothenberg, G. (2008). Biodiesel by catalytic reactivedistillation powered by metal oxides. Energy & Fuels, 22, 598–604.
löker, M., Kenig, E. Y., Górak, A., Markusse, A. P., Kwant, G., & Moritz, P. (2004).Investigation of different column configurations for the ethyl acetate synthesisvia reactive distillation. Chemical Engineering and Processing, 43, 791–801.
löker, M., Kenig, E. Y., Hoffmann, A., Kreis, P., & Górak, A. (2005). Rate-basedmodelling and simulation of reactive separations in gas/vapour–liquid systems.
Please cite this article in press as: Cruz-Díaz, M., et al. Synthesis of n-propyl
study and simulation. Computers and Chemical Engineering (2012), doi:10.1
Chemical Engineering and Processing, 44, 617–629.löker, M., Kenig, E. Y., Schmitt, M., Althaus, K., Schoenmakers, H., Markusse, A. P.,
et al. (2003). Influence of operating conditions and column configuration onthe performance of reactive distillation columns with liquid–liquid separators.Canadian Journal of Chemical Engineering, 81, 725–732.
PRESScal Engineering xxx (2012) xxx– xxx 11
Kołodziej, A., Jaroszynski, M., Sałacki, W., Orlikowski, W., Fraczek, K., Kloker, M.,et al. (2004). Catalytic distillation for tame synthesis with structured catalyticpackings. Chemical Engineering Research & Design, 82, 175–184.
Lee, M. J., Chiu, J. Y., & Lin, H. M. (2002). Kinetics of catalytic esterification of propi-onic acid and n-butanol over Amberlyst 35. Industrial and Engineering ChemistryResearch, 41, 2882–2887.
Lee, H. Y., Yen, L. T., Chien, I. L., & Huang, H. P. (2009). Reactive distillation for esterifi-cation of an alcohol mixture containing n-butanol and n-amyl alcohol. Industrialand Engineering Chemistry Research, 48, 7186–7204.
Liu, W. T., & Tan, C. S. (2001). Liquid-phase esterification of propionic acid withn-butanol. Industrial and Engineering Chemistry Research, 40, 3281.
Lundquiest, G. (1995). Catalyzed esterification process. U.S. Patent 5 426 199; toRohm and Haas Company.
Pietre, M. K., Almeida, L. C. P., Landers, R., Vinhas, R. C. G., & Luna, F. J. (2010). H3PO4and H2SO4-treated niobic acid as heterogeneous catalyst for methyl ester pro-duction. Reaction Kinetics Mechanisms & Catalysis, 99, 269–280.
Pelkonen, S., Görak, A., Ohligschläger, A., & Kaesemann, R. (2001). Experimentalstudy on multicomponent distillation in packed columns. Chemical Engineeringand Processing, 40, 235–243.
Schildhauer, T. J., Hoek1, I., Kapteijn, F., & Moulijn, J. A. (2009). Zeolite BEA catalysedesterification of hexanoic acid with 1-octanol: Kinetics, side reactions and therole of water. Applied Catalysis A: General, 358, 141–145.
Steinigeweg, S., & Gmehling, J. (2003). Esterification of a fatty acid by reactive dis-tillation. Industrial and Engineering Chemistry Research, 42, 3612–3619.
Sundmacher, K., & Kienle, A. (2002). Reactive distillation status and future direction.Wiley-VCH Verlag GMBH & Co. KGaA.
Svandová, Z., Labovsky, J., Markos, J., & Jelemensky, L. (2009). Impact of mathe-matical model selection on prediction of steady state and dynamic behaviourof a reactive distillation column. Computers & Chemical Engineering, 33,788–793.
Tang, Y. T., Chen, Y. W., Huang, H. P., & Yu, C. C. (2005). Design of reactive distillationsfor acetic acid esterification. AIChE Journal, 51, 683.
Tao, D. J., Wu, Y. T., Zhou, Z., Geng, J., Hu, X. B., & Zhang, Z. B. (2011). Kinetics for theesterification reaction of n-butanol with acetic acid catalyzed by noncorrosive
propionate in a pilot-plant reactive distillation column: Experimental016/j.compchemeng.2012.01.004
Brønsted acidic ionic liquids. Industrial and Engineering Chemistry Research, 50,1989–1996.
Xu, Z. P., & Chuang, K. T. (1997). Effect of internal diffusion on heterogeneous catalyticesterification of acetic acid. Industrial and Engineering Chemistry Research, 52,3011.
Copyright © 2022 FDOKUMEN