The Impact of Acute Oral Sodium Propionate Supplementation ...
337
1 The Impact of Acute Oral Sodium Propionate Supplementation on Energy Metabolism A thesis submitted for the degree of Doctor of Philosophy, Imperial College London Alia Sukkar Clinical Medicine Research Department of Metabolism, Digestion and Reproduction Imperial College London 2021
-
Upload
khangminh22 -
Category
Documents
-
view
2 -
download
0
Transcript of The Impact of Acute Oral Sodium Propionate Supplementation ...

1
The Impact of Acute Oral
Sodium Propionate
Supplementation on Energy
Metabolism
A thesis submitted for the degree of Doctor of Philosophy, Imperial College London
Alia Sukkar
Clinical Medicine Research
Department of Metabolism, Digestion and Reproduction
Imperial College London
2021

2
For Mom and Dad...

3
Abstract:
Background:
Previous research has demonstrated that acute propionate supplementation in humans can
have favourable effects on energy metabolism by raising energy expenditure and lipid
oxidation. Moreover, acute propionate supplementation in humans has shown to affect
subjective appetite by increasing nausea and triggering the release of the anorectic hormone
glucagon-like peptide 1 (GLP-1). Studies investigating the acute effects of propionate
administration on glucose homeostasis in humans report conflicting outcomes. However,
previous research has generally only investigated the acute impact of propionate
supplementation in the overnight fasted state and for relatively short observation periods
(<180 min).It is, therefore, presently unknown how raised bioavailability of gut-derived
propionate modulates energy metabolism during physical activity and in the postprandial
state. Consequently, the aim of the present trial is to investigate the acute effect of sodium
propionate supplementation on energy expenditure, substrate oxidation, appetite response
and glucose homeostasis in three different energy states (overnight fasted, sub-maximal
exercise and post-prandial) and over longer time-periods. Moreover, NMR (nuclear magnetic
resonance) spectroscopy was used to investigate changes in serum metabolite phenotype
after sodium propionate ingestion.
Methodology:
The thesis is comprised of three separate randomized controlled double-blind cross-over
studies (overnight fasted, submaximal exercise, and postprandial). In each study, following an
overnight fast, tablets containing either sodium propionate or sodium chloride (Control) were
first administered over 180 min.
Overnight Fasted study: 19 volunteers (11 males and 8 females; age: 34.6 ± 4.1 years; BMI
(body mass index): 23.1 ± 0.7 kg/m2) completed the two study visits after an overnight fast.
The study extended over a total period of 360 min while volunteers remained fasted for the
duration of the study.

4
Sub-maximal exercise study: 19 volunteers (14 males and 5 females; age: 42.7 ± 3.5 years;
BMI: 24.5 ± 0.7 kg/m2) completed a maximal exercise test visit and two study visits. The study
extended over a total period of 240 min. At time-point 180 min, participants exercised at 40%
of VO2 max for 60 min.
Post-prandial study: 19 volunteers (12 males and 7 females; age: 45.0 ± 3.5 years; BMI: 24.8
± 0.8 kg/m2) completed two study visits. The study extended over a total period of 300 min.
At time-point 180 min, a mixed calorie liquid meal (Ensure Original Vanilla Nutrition Shake:
72.7 g carbohydrate, 13.6 g fat and 20.5 g protein; 500 kcal) was provided to volunteers.
Energy expenditure and substrate oxidation were measured throughout these visits using
indirect calorimetry. Participants were asked to complete 100mm visual analogue scales
(VAS) that assessed subjective appetite (hunger, thirst and nausea) throughout these visits.
Insulin resistance and insulin sensitivity were assessed via HOMA-IR and Matsuda Index
respectively. The oral disposition index (ODI) was used to assess β-cell function. In the post-
prandial trial, GLP-1 release was measured, and 1H-NMR spectroscopy was used to analyse
serum metabolite profile associated with propionate supplementation.
Results:
Propionate supplementation increased energy expenditure in the overnight fasted state,
which was mainly observed within the first 180 min of ingestion, and in the post-prandial
state. A consistent increase in lipid oxidation was found in the overnight fasted state,
however, these effects were not observed during submaximal exercise or in the post-prandial
state. A decrease in carbohydrate (CHO) oxidation was also found in the overnight fasted
state. Propionate ingestion increased subjective nausea in the overnight fasted and post-
prandial states and increased subjective thirst during submaximal exercise. However, no
effect on subjective hunger was found was found in the three different energy states. GLP-1
secretion was significantly increased in the overnight fasted state, however, insulin sensitivity
and β-cell function were unaffected with propionate ingestion. In the overnight fasted state,

5
low density lipoprotein (LDL)/ very low-density lipoprotein (VLDL), lactate and methanol were
upregulated and 3-hydroxybutyrate and lysine were supressed following propionate
supplementation. LDL/VLDL, lactate and alanine were upregulated following propionate
supplementation in the postprandial state.
Conclusion:
This thesis is the first to demonstrate that acute oral sodium propionate supplementation in
healthy human volunteers can have favourable effects on energy metabolism in different
energy states. Should these effects be replicated over longer time periods would suggest
that increasing systemic levels of gut-derived propionate appears would be a promising
strategy to improve long term energy balance and body weight management.

6
Copyright Declaration
‘The copyright of this thesis rests with the author. Unless otherwise indicated, its contents are licensed under a Creative Commons Attribution-Non Commercial 4.0 International Licence (CC BY-NC).
Under this licence, you may copy and redistribute the material in any medium or format. You may also create and distribute modified versions of the work. This is on the condition that: you credit the author and do not use it, or any derivative works, for a commercial purpose.
When reusing or sharing this work, ensure you make the licence terms clear to others by naming the licence and linking to the licence text. Where a work has been adapted, you should indicate that the work has been changed and describe those changes.
Please seek permission from the copyright holder for uses of this work that are not included in this licence or permitted under UK Copyright Law.’

7
Declaration of Contributors:
The majority of this work has been done by the author. All other collaborations and assistance
are listed below.
Supplements:
Sodium propionate and sodium chloride tablets were prepared by Quay Pharma (UK).
Study Visits:
All study visits were performed with the help of the research nurses and administration staff
at the NIHR/Wellcome Trust Imperial Clinical Research Facility.
Overnight Fasted Study:
Horia Schiopu, Hui Guo and Harry Kingsley-Smith helped with the overnight fasted study
visits.
Sub-maximal Exercise Study:
Delphine Lim, Rita Dos Santos and Chun Cheng and helped with the sub-maximal exercise
study visits.
Post-prandial Study:
Callum Riley and Jess Wang helped with the post-prandial study.
Radioimmunoassay:
Radioimmunoassay was performed with the assistance of Dr. Edward Chambers, Dr. Georgia
Franco Becker, Horia Schiopu, Hui Guo and Harry Kingsley-Smith.

8
NMR Analysis:
Samples were prepared with the assistance of Dr. Edward Chambers, Professor Jonathan R
Swann and Horia Schiopu. Dr. Jose Ivan Serrano Contreras performed the NMR statistics
analysis.

9
Acknowledgements:
Firstly, I would like to thank my parents for giving me the opportunity to achieve this
milestone and their constant support and push to challenge myself and bring out the best in
me. Mom and Dad thank you... this whole work is dedicated to you. You have raised me up
to more than I can be.
I would also like to thank my supervisor Professor Gary Frost for providing me with this
beautiful opportunity to join his team and getting the chance to learn from his unique
expertise. I would also like to give a very special thank you to my second supervisor, Dr.
Edward Chambers, for being the most supportive mentor and for guiding me throughout my
PhD since day one. Honestly, this work could not have been possible without your support ...
thank you!
I would also like to give a very big thank you for my sister Dania, my grandparents, Yara and
Hania for being my biggest supporters and a special one goes to my little sister Nour for
cheering me on every step of the way and tolerating all the ups and downs throughout this
journey.
I would also like to thank my wonderful students Horia Schiopu, Hui Guo, Delphine Lim,
Callum Riley, Chun Cheng, Harry Kingsley-Smith, Rita Dos Santos and Jess Wang for being an
excellent addition to the team. I am grateful for each and every participant and the NIHRF
Imperial CRF staff for making this trial possible. I would also like to thank Katerina for her kind
and eager assistance when needed.
I am very fortunate to have met a unique group of friends Mai, Haya, Souad, Madawi, Shoukri,
Ahamd and Khalifa who became my Imperial family and played a memorable role during my
PhD journey.
Finally, I would like to give a massive thank you for my life-partner, Fares, for always wanting
to play a pivotal role in my becoming a Dr. and indeed doing so by being super patient,
developing an earnest interest in ‘propionate’ and my progress, and giving all the support and
encouragement only an ideal partner would so willingly give. Thank you!

10
Achievements:
Publication:
SUKKAR, A. H., LETT, A. M., FROST, G. & CHAMBERS, E. 2019. Regulation of energy expenditure
and substrate oxidation by short chain fatty acids. J Endocrinol.

11
Abbreviations:
ACC: Acetyl-CoA carboxylase
Acetyl- CoA: Acetyl coenzyme A
AMP: Adenosine monophosphate
AMPK: 5ʹ adenosine monophosphate- activated protein kinase
AgRP: Agouti-related peptide
ARC: Arcuate nucleus
ATP: Adenosine triphosphate
BCAA: Branched chain amino acid
BF%: Body fat percentage
BMI: Body mass index
BMR: Basal metabolic rate
BOLD: Blood oxygen level dependent
BW: Body weight
C-13: Carbon-13
CHO: Carbohydrate
CNS: Central nervous system
CoA: Coenzyme A

12
CPT- 1: Carnitine palmitoyltransferase I
CPT1B: Carnitine palmitoyl transferase 1B
CYC1: Cytochrome c1
CV: Coefficient of variation
DC: Direct calorimetry
DIT: Diet-induced thermogenesis
DF: Dietary fibres
DHA: Docosahexaenoic acid
DVC: Dorsal vagal complex
ECG: Electrocardiogram
EE: Energy expenditure
EPA: Eicosapentaenoic acid
ESI: Electrospray ionization
FABP4: Fatty acid–binding protein 4
FerF: Fermentable Fibre
FFA: Free fatty acid
FFAR-2: Free-fatty acid receptor 2

13
FFAR-3: Free-fatty acid receptor 3
GC: Gas chromatography
GI: Gastrointestinal tract
GLP-1: Glucagon-like peptide 1
G-protein: Guaninenucleotide-binding protein
GLUT-4: Glucose transporter
HDL: High-density lipoprotein
HIEC: Hyperinsulinemic Euglycemic Glucose Clamp
HFD: High fat diet
HOMA: Homeostasis Model Assessment
HPLC: High-performance liquid chromatography
HR: Heart rate
HLD: High lipid diet
IC: Indirect calorimetry
IGN: Intestinal gluconeogenesis
IPE: Inulin Propionate Ester

14
i.p.: intraperitoneal injection
ISIMatsuda: Matsuda Insulin Sensitivity Index
KO: Knock-out
LC: Liquid Chromatography
LCFAs: Long-chain fatty acids
LDL: Low density lipoprotein
M: Glucose disposal rate
MAP: Mean arterial pressure
MALDI: Matrix-assisted laser desorption ionization
MCT: Monocarboxylate transporter
MC4R: Melanocortin 4 receptor
Min: Minutes
MS: Mass spectrometry
MTT: Meal Tolerance Test
m/z: Mass-to-charge ratio
NMR: Nuclear magnetic resonance

15
NPY: Neuropeptide Y
OAT: Organic anion transporter
OGTT: Oral Glucose Tolerance Test
PEE: Physical activity energy expenditure
PME: Pectin methylesterase
POMC: pro-opiomelanocortin
Pparg: Peroxisome proliferator-activated receptor gamma
PYY: Peptide tyrosine tyrosine
QUICKI: Quantitative insulin sensitivity check index
REE: Resting energy expenditure
RER: respiratory exchange ratio
SCD1: Stearoyl-CoA desaturase
SCFA: Short chain fatty acids
SD: Standard deviation
SEM: Standard error of mean
SF: Sweet potato

16
SNS: Sympathetic nervous system
SR: Sweet potato residue
TBA: Total bile acid
TCA: Tricarboxylic acid
TEE: Total energy expenditure
TG: Triglycerides
TNF-a: Tumour necrosis factor-a
ToF: Time of flight
T2D: Type 2 Diabetes
UCP1: Mitochondrial uncoupling protein 1
UCP2: Mitochondrial uncoupling protein 2
uN2: Urinary nitrogen component
WAT: White adipose tissue
VAS: Visual analogue scales
VLDL: Very-low-density lipoprotein
VMH: Ventromedial hypothalamus
VCO2: Carbon dioxide production
VO2: Oxygen consumption

17
WT: Wild-type
w/w: weight by weight
1D-NMR: One-dimensional NMR
2D-NMR: Two-dimensional NMR
3OHB: 3-hydroxybutyrate

18
Table of Contents
Abstract: ....................................................................................................................................................... 3
Copyright Declaration ................................................................................................................................... 6
Declaration of Contributors: .......................................................................................................................... 7
Acknowledgements: ...................................................................................................................................... 9
Achievements: ............................................................................................................................................. 10
Abbreviations: ............................................................................................................................................. 11
Chapter 1: Introduction ................................................................................................................................ 26 1.1 Obesity: ..................................................................................................................................................... 26
1.1.1 Definition: .......................................................................................................................................... 26 1.1.2 Prevalence and economic consequences: ......................................................................................... 26 1.1.3 Causes: .............................................................................................................................................. 27
1.2 Dietary Fibre: ............................................................................................................................................. 29 1.2.1 Definition: .......................................................................................................................................... 29 1.2.2 Effect of dietary fibre on non-communicable diseases and current intakes: .................................... 29
1.3 Fermentable dietary fibre: ......................................................................................................................... 30 1.3.1 Definition: .......................................................................................................................................... 30 1.3.2 Effect of fermentable dietary fibre on body weight: ......................................................................... 30
1.4 Short-Chain Fatty Acids (SCFA): ................................................................................................................. 32 1.4.1 Definition: .......................................................................................................................................... 32 1.4.2 Sources: ............................................................................................................................................. 33 1.4.3 Absorption and transport .................................................................................................................. 37 1.4.4 Metabolism: ...................................................................................................................................... 38 1.4.5 Receptors: ......................................................................................................................................... 40
1.5 The role of propionate on energy metabolism: ......................................................................................... 42 1.6 Thesis purpose and rationale: ................................................................................................................... 48
1.6.1 Chapter 3: .......................................................................................................................................... 48 1.6.2 Chapter 4: .......................................................................................................................................... 48 1.6.3 Chapter 5: .......................................................................................................................................... 49 1.6.4 Chapter 6: .......................................................................................................................................... 49
Chapter 2: Methodology .............................................................................................................................. 51 2.1 Methodology: ............................................................................................................................................ 51 2.2 Recruitment: .............................................................................................................................................. 51
2.2.1 Inclusion Criteria: .............................................................................................................................. 52 2.2.2 Exclusion Criteria: .............................................................................................................................. 52
2.3 Sample Size: ............................................................................................................................................... 53 2.4 Randomization: ......................................................................................................................................... 54 2.5 Supplements: ............................................................................................................................................. 54 2.6 Study Visits Design: ................................................................................................................................... 55
2.6.1 Prior Study Visits Requirements: ....................................................................................................... 55 2.6.2 Study Visit Protocol: .......................................................................................................................... 56
2.7 Energy Expenditure and Substrate Oxidation Measurement: ................................................................... 61

19
2.8 Homeostasis Model Assessment (HOMA): ................................................................................................ 62 2.9 Matsuda Index: ......................................................................................................................................... 62 2.10 Visual Analogue Scales (VAS): ................................................................................................................. 63 2.11 Samples Collection and Analysis: ............................................................................................................ 63
2.11.1 Blood samples: ................................................................................................................................ 63 2.11.2 NMR Analysis: .................................................................................................................................. 66
2.12 Statistics: ................................................................................................................................................. 67 2.12.1 Data analysis: ................................................................................................................................... 67 2.12.2 NMR Spectral data analysis: ............................................................................................................ 68
2.13 Participant’s Characteristics: ................................................................................................................... 69 2.13.1 Overnight Fasted Study: .................................................................................................................. 69 2.13.2 Sub-maximal exercise Study: ........................................................................................................... 71 2.13.3 Post-Prandial Study: ........................................................................................................................ 73
Chapter 3: Energy Expenditure and Substrate Oxidation .............................................................................. 75 3.1 Abstract: .................................................................................................................................................... 75 3.2 Energy Expenditure: Definition and Measurement Tools .......................................................................... 78
3.2.1 Indirect Calorimetry .......................................................................................................................... 80 3.3 Effect of Propionate on EE and Substrate Oxidation: ................................................................................ 83
3.3.1 Effect of Propionate on EE and Substrate in Rodents: ...................................................................... 83 3.3.2 Effect of Propionate on EE and Substrate in Humans: ...................................................................... 83
3.4 Hypothesis: ................................................................................................................................................ 84 3.5 Aims: .......................................................................................................................................................... 84 3.6 Outcome Measures: .................................................................................................................................. 85 3.7 Methods: ................................................................................................................................................... 85 3.8 Results: ...................................................................................................................................................... 85
3.8.1 Overnight fasted Trial: ....................................................................................................................... 85 3.8.2 Sub-maximal Exercise Trial: ............................................................................................................. 100 3.8.3 Post-prandial Trial: .......................................................................................................................... 112
3.9 Key Findings: ........................................................................................................................................... 127 3.9.1 Overnight fasted Trial: ..................................................................................................................... 127 3.9.2 Sub-maximal exercise Trial: ............................................................................................................. 127 3.9.3 Post Prandial Trial: ........................................................................................................................... 127
3.10 Summary: .............................................................................................................................................. 127 3.11 Discussion: ............................................................................................................................................. 128
3.11.1 Impact of propionate supplementation on energy expenditure and substrate oxidation in different energy states: ........................................................................................................................................... 128 3.11.2 Acute impact of propionate supplementation on resting energy expenditure and substrate oxidation in humans: ................................................................................................................................ 129 3.11.3 Acute impact of propionate supplementation on post-prandial energy expenditure and substrate oxidation in humans: ................................................................................................................................ 130 3.11.4 Acute impact of propionate supplementation on energy expenditure and substrate oxidation in humans during sub-maximal exercise: ..................................................................................................... 132 3.11.5 The impact of Propionate on energy metabolism: ........................................................................ 133
3.12 Study Limitations: .................................................................................................................................. 136 3.13 Conclusion: ............................................................................................................................................ 138
Chapter 4: Effect of Sodium Propionate on Appetite Regulation ................................................................. 140

20
4.1 Abstract: .................................................................................................................................................. 140 4.2 Dietary Fibres and Appetite Regulation: ................................................................................................. 142 4.3 Short Chain Fatty Acids and Appetite: ..................................................................................................... 143
4.3.1 SCFA and Central Nervous System: ................................................................................................. 144 4.3.2 SCFA receptors and anorectic gut hormone release: ...................................................................... 145 4.3.3 SCFA and leptin secretion: ............................................................................................................... 147 4.3.4 SCFA and Gastric Tract Motility: ...................................................................................................... 148 4.3.5 Propionate and Hepatic Metabolism: ............................................................................................. 150 4.3.6 Conclusion: ...................................................................................................................................... 151
4.4 Propionate and Appetite: ........................................................................................................................ 152 4.4.1 The impact of Propionate on appetite in non-humans: .................................................................. 152 4.4.2 The impact of Propionate on appetite in humans: .......................................................................... 153
4.5 Hypothesis: .............................................................................................................................................. 156 4.6 Aims: ........................................................................................................................................................ 156 4.7 Outcome Measures: ................................................................................................................................ 156 4.8 Measurement Tools: ................................................................................................................................ 157
4.8.1 Objective Methodologies: ............................................................................................................... 157 4.8.2 Subjective Methodologies: .............................................................................................................. 158 4.8.3 Conclusion: ...................................................................................................................................... 160
4.9 Methods: ................................................................................................................................................. 160 4.10 Results: .................................................................................................................................................. 160
4.10.1 Overnight fasted Trial: ................................................................................................................... 160 4.10.2 Sub-maximal exercise Trial: ........................................................................................................... 168 4.10.3 Post-prandial Trial: ........................................................................................................................ 174
4.11 Key Findings: ......................................................................................................................................... 183 4.11.1 Overnight fasted Trial: ................................................................................................................... 183 4.11.2 Sub-maximal exercise Trial: ........................................................................................................... 183 4.11.3 Post-prandial Trial: ........................................................................................................................ 184
4.12 Summary: .............................................................................................................................................. 184 4.13 Discussion: ............................................................................................................................................. 184 4.14 Study Strengths: .................................................................................................................................... 186 4.15 Study Limitations: .................................................................................................................................. 186 4.16 Conclusion: ............................................................................................................................................ 187
Chapter 5: Effect of Sodium Propionate on Glucose Homeostasis ............................................................... 189 5.1 Abstract: .................................................................................................................................................. 189 5.2 Glucose Regulation: ................................................................................................................................. 191 5.3 Indices: .................................................................................................................................................... 192
5.3.1 Direct Measures: ............................................................................................................................. 192 5.3.2 Indirect Measures: ........................................................................................................................... 194
5.4 Simple surrogate indexes: ....................................................................................................................... 196 5.4.1 Indices obtained from fasting blood sample: .................................................................................. 196 5.4.2 Indices obtained after dynamic testing such as OGTT/MTT (Muniyappa and Madan, 2018): ........ 199
5.5 Methods of Choice: .................................................................................................................................. 202 5.6 Dietary Fibres and Type 2 Diabetes: ........................................................................................................ 202 5.7 Propionate and Glucose Homeostasis: .................................................................................................... 203
21
5.7.1 The impact of Propionate on glucose homeostasis in non-ruminants: ........................................... 204 5.7.2 The impact of Propionate on glucose homeostasis in humans: ...................................................... 207
5.8 Propionate’s mechanism of action on glucose ........................................................................................ 210 5.8.1 The Impact of Propionate on enzymatic activity: ............................................................................ 210 5.8.2 The Impact of Propionate on Free-fatty acid receptors and Gut hormones: .................................. 210 5.8.3 The Impact of Propionate on gut microbiota, systemic inflammation and plasma metabolome: .. 214 5.8.4 The Impact of Propionate on hepatic tissue: .................................................................................. 215 5.8.5 The Impact of Propionate on adipose tissue: .................................................................................. 215 5.8.6 The Impact of Propionate on β-cell: ................................................................................................ 216 5.8.7 Conclusion: ...................................................................................................................................... 217
5.9 Hypothesis: .............................................................................................................................................. 217 5.10 Aims: ...................................................................................................................................................... 217 5.11 Outcome Measures: .............................................................................................................................. 218 5.12 Methods of Choice: ................................................................................................................................ 218 5.13 Methods: ............................................................................................................................................... 218 5.14 Results: .................................................................................................................................................. 218
5.14.1 Overnight fasted Trial: ................................................................................................................... 218 5.14.2 Sub-maximal exercise Trial: ........................................................................................................... 224 5.14.3 Post-prandial Trial: ........................................................................................................................ 228
5.15 Key Findings: ......................................................................................................................................... 236 5.15.1 Overnight fasted Trial: ................................................................................................................... 236 5.15.2 Sub-maximal exercise Trial: ........................................................................................................... 236 5.15.3 Post-prandial Trial: ........................................................................................................................ 237
5.16 Summary: .............................................................................................................................................. 237 5.17 Discussion: ............................................................................................................................................. 237
5.17.1 Impact of Propionate on glucose profile: ...................................................................................... 237 5.17.2 Impact of Propionate on GLP-1 levels: .......................................................................................... 241 5.17.3 Impact of Propionate on Insulin Resistance and β-cell function: .................................................. 241
5.18 Study Strengths: .................................................................................................................................... 242 5.19 Study Limitations: .................................................................................................................................. 242 5.20 Conclusion: ............................................................................................................................................ 243
Chapter 6: Effect of Sodium Propionate on Serum Metabolic Phenotypes .................................................. 244 6.1 Abstract: .................................................................................................................................................. 244 6.2 Metabolomics: ........................................................................................................................................ 245
6.2.1 Definition: ........................................................................................................................................ 245 6.2.2 Design: ............................................................................................................................................. 245 6.2.3 Analytical Tools: .............................................................................................................................. 246
6.3 Fermentable Fibre and Metabolite Profiling: .......................................................................................... 251 6.4 Propionate and Metabolic Profiling: ....................................................................................................... 254 6.5 Hypothesis: .............................................................................................................................................. 255 6.6 Aims: ........................................................................................................................................................ 256 6.7 Outcome Measures: ................................................................................................................................ 256 6.8 Methods: ................................................................................................................................................. 256 6.9 Results: .................................................................................................................................................... 256
6.9.1 Post-Prandial Trial: .......................................................................................................................... 256

22
6.10 Discussion: ............................................................................................................................................. 263 6.10.1 3-hydroxybutyrate: ........................................................................................................................ 263 6.10.2 Lysine: ............................................................................................................................................ 264 6.10.3 Methanol: ...................................................................................................................................... 264 6.10.4 Lactate: .......................................................................................................................................... 265 6.10.5 Alanine: ......................................................................................................................................... 268 6.10.6 VLDL/LDL: ...................................................................................................................................... 270
6.11 Study Limitations: .................................................................................................................................. 271 6.12 Conclusion: ............................................................................................................................................ 272
Chapter 7: General Discussion .................................................................................................................... 274 7.1 Thesis aims: ............................................................................................................................................. 274
Chapter 3: ................................................................................................................................................. 274 Chapter 4 .................................................................................................................................................. 274 Chapter 5 .................................................................................................................................................. 275 Chapter 6 .................................................................................................................................................. 275
7.2 Summary of results: ................................................................................................................................ 275 7.3 Conclusion, Limitations and Future Work: .............................................................................................. 276
References: ................................................................................................................................................ 280
Appendices ................................................................................................................................................ 304 Appendix 1: ................................................................................................................................................... 304 Appendix 2: ................................................................................................................................................... 312 Appendix 3: ................................................................................................................................................... 321 Appendix 4: ................................................................................................................................................... 330 Appendix 5: ................................................................................................................................................... 331 Appendix 6: ................................................................................................................................................... 333 Appendix 7: ................................................................................................................................................... 335
List of Figures
Figure 1-1 Major SCFA ........................................................................................................... 33
Figure 1-2: Gut derived SCFA metabolic pathways ................................................................ 37
Figure 1-3 Peripheral propionate levels ................................................................................. 45
Figure 2-1: Peripheral propionate levels ................................................................................ 54
Figure 2-2: Overnight fasted Study Protocol .......................................................................... 57
Figure 2-3: Sub-maximal Exercise Study Protocol ................................................................. 59
Figure 2-4: Post-prandial Study Protocol ............................................................................... 60
Figure 3-1: Overnight Fasted Study: Effect of oral sodium propionate supplementation on
EE ............................................................................................................................................. 87

23
Figure 3-2 Overnight Fasted Study: Effect of oral sodium propionate supplementation on
RER .......................................................................................................................................... 90
Figure 3-3: Overnight Fasted Study: Effect of oral sodium propionate supplementation on
lipid oxidation .......................................................................................................................... 92
Figure 3-4: Overnight Fasted Study: Effect of oral sodium propionate supplementation on
CHO oxidation: ........................................................................................................................ 95
Figure 3-5: Overnight Fasted Study: Effect of oral sodium propionate supplementation on
HR ............................................................................................................................................ 97
Figure 3-6: Overnight Fasted Study: Effect of oral sodium propionate supplementation on
MAP ....................................................................................................................................... 100
Figure 3-7: Sub-maximal Exercise Study: Effect of oral sodium propionate supplementation
on EE ...................................................................................................................................... 102
Figure 3-8: Sub-maximal Exercise Study: Effect of oral sodium propionate supplementation
on RER ................................................................................................................................... 104
Figure 3-9: Sub-maximal Exercise Study: Effect of oral sodium propionate supplementation
on lipid oxidation ................................................................................................................... 106
Figure 3-10: Sub-maximal Exercise Study: Effect of oral sodium propionate supplementation
on carbohydrate oxidation ..................................................................................................... 108
Figure 3-11: Sub-maximal Exercise Study: Effect of oral sodium propionate supplementation
on HR ..................................................................................................................................... 110
Figure 3-12: Sub-maximal Exercise Study: Effect of oral sodium propionate supplementation
on MAP .................................................................................................................................. 112
Figure 3-13: Post-prandial Study: Effect of oral sodium propionate supplementation on EE
................................................................................................................................................ 114
Figure 3-14: Post-prandial Study: Effect of oral sodium propionate supplementation on RER
................................................................................................................................................ 117
Figure 3-15: Post-prandial Study: Effect of oral sodium propionate supplementation on lipid
oxidation ................................................................................................................................ 119
Figure 3-16: Post-prandial Study: Effect of oral sodium propionate supplementation on
carbohydrate oxidation ........................................................................................................... 122
Figure 3-17: Post-prandial Study: Effect of oral sodium propionate supplementation on HR
................................................................................................................................................ 124
Figure 3-18: Post-prandial Study: Effect of oral sodium propionate supplementation on MAP
................................................................................................................................................ 126

24
Figure 4-1: Mechanisms of how SCFA suppress appetite and energy intake: ...................... 151
Figure 4-2: Overnight Fasted Study: Effect of oral sodium propionate supplementation on
hunger: ................................................................................................................................... 162
Figure 4-3: Overnight Fasted Study: Effect of oral sodium propionate supplementation on
thirst: ...................................................................................................................................... 165
Figure 4-4: Overnight Fasted Study: Effect of oral sodium propionate supplementation on
nausea: .................................................................................................................................... 167
Figure 4-5: Sub-maximal Exercise Study: Effect of oral sodium propionate supplementation
on hunger: .............................................................................................................................. 169
Figure 4-6: Sub-maximal Exercise Study: Effect of oral sodium propionate supplementation
on thirst .................................................................................................................................. 171
Figure 4-7: Sub-maximal Exercise Study: Effect of oral sodium propionate supplementation
on nausea: ............................................................................................................................... 173
Figure 4-8: Post-prandial Study: Effect of oral sodium propionate supplementation on
hunger: ................................................................................................................................... 176
Figure 4-9: Post-prandial Study: Effect of oral sodium propionate supplementation on thirst:
................................................................................................................................................ 178
Figure 4-10: Post-prandial Study: Effect of oral sodium propionate supplementation on
nausea: .................................................................................................................................... 180
Figure 4-11: Post-prandial Study: Effect of oral sodium propionate supplementation on GLP-
1 levels: .................................................................................................................................. 183
Figure 5-1: Overnight Fasted Study: Effect of oral sodium propionate supplementation on
glucose levels: ........................................................................................................................ 220
Figure 5-2: Overnight Fasted Study: Effect of oral sodium propionate supplementation on
insulin levels: ......................................................................................................................... 223
Figure 5-3: Overnight Fasted Study: Effect of oral sodium propionate supplementation on
HOMA-IR levels .................................................................................................................... 223
Figure 5-4: Sub-maximal Exercise Study: Effect of oral sodium propionate supplementation
on glucose levels: ................................................................................................................... 225
Figure 5-5: Sub-maximal Exercise Study: Effect of oral sodium propionate supplementation
on insulin levels: .................................................................................................................... 227
Figure 5-6: Sub-maximal Exercise Study: Effect of oral sodium propionate supplementation
on HOMA-IR ......................................................................................................................... 228

25
Figure 5-7: Post-prandial Study: Effect of oral sodium propionate supplementation on
glucose levels: ........................................................................................................................ 230
Figure 5-8: Post-prandial Study: Effect of oral sodium propionate supplementation on insulin
levels: ..................................................................................................................................... 232
Figure 5-9:Post-prandial Study: Effect of oral sodium propionate supplementation on GLP-1
levels ...................................................................................................................................... 235
Figure 5-10:Post-prandial Study: Effect of oral sodium propionate supplementation on
Matsuda Index ........................................................................................................................ 235
Figure 5-11: Post-prandial Study: Effect of oral sodium propionate supplementation on Oral
Disposition Index ................................................................................................................... 236
Figure 6-1: RM-MCCV‐PLS‐DA score plot at baseline ....................................................... 257
Figure 6-2: RM-MCCV‐PLS‐DA score plot at 180 min ....................................................... 258
Figure 6-3: RM-MCCV‐PLS‐DA score plot at 240 min ....................................................... 260
List of Tables
Table 1-1: SCFA concentrations in human blood .................................................................... 39
Table 2-1: Sodium and Propionate Tablets Composition ........................................................ 55
Table 2-2: Overnight Fasted Study Participant Characteristics ............................................... 69
Table 2-3: Overnight Fasted Study Participant Baseline Values ............................................. 70
Table 2-4: Sub-maximal Study Participant Characteristics ..................................................... 71
Table 2-5: Sub-maximal Study Participant Baseline Values ................................................... 71
Table 2-6: Post-prandial Study Participant Characteristics ..................................................... 73
Table 2-7: Post-prandial Study Participant Baseline Values ................................................... 73
Table 6-1: Serum Metabolite Changes: ................................................................................. 261
Table 6-2: List of 1H NMR peak assignments ...................................................................... 262

26
Chapter 1: Introduction
1.1 Obesity:
1.1.1 Definition:
Obesity is a complex, chronic disease that has reached pandemic levels globally. According to
the World Health Organization, obesity can be defined as an abnormal or excess accumulation
of fat that may impair health (Organization, 1 April 2020). The most common method of
assessing obesity and overall weight status is by calculating body mass index (BMI) which can
be determined by dividing body weight in kilograms by the square of height in meters. For
adults, a BMI <18.5 kg/m2 is considered underweight, a BMI between 18.5 to 24.9 kg/m2 is
classified as normal, while a BMI ≥ 25 kg/m2 is considered to be overweight, and a BMI ≥ 30
kg/m2 or a BMI ≥ 40 kg/m2 are defined as obese and severely obese respectively. Although
BMI may not always reflect body fat percentage (BF%) in varying individuals, it is still the most
useful diagnostic method for assessing obesity at the population level given its simplicity and
equal use for both genders and all adult ages (Organization, 1 April 2020). Moreover, it has a
positive relationship with BF%, measured by accurate methods such as dual x-ray
absorptiometry (Flegal et al., 2009) and bioelectrical impedance (Romero-Corral et al., 2008).
Nevertheless, other simple anthropometric measures exist that could be used to assess
obesity and associated metabolic risks such as waist circumference and waist-to-hip-ratio
(Valsamakis et al., 2004, Mokha et al., 2010).
1.1.2 Prevalence and economic consequences:
Recent data suggests that nearly a third of the global population is overweight and around
13% is considered obese (Organization, 1 April 2020). Given the current rise in obesity rates,
projections show a steady increase in obesity levels for at least the next decade (OECD, 2017).
In 2017, the Health Survey for England reported a 64.3% prevalence of either overweight
(35.6%) or obesity (28.7%) i.e. more than half of the population has a surplus amount of body

27
fat (Baker, 2019). Indeed, today, the majority of the global population reside in countries
where obesity tends to kill more people than underweight thus rendering this as a global
problem rather than one related to high income countries as was previously thought
(Organization, 1 April 2020).
The economic burden of obesity is substantial. In 2014, research put forth by the McKinsey
Global Institute estimated that the global impact of obesity is around 3% of the global GDP ,
equivalent to $2 trillion (Institute, 2014). This perhaps is not surprising since obesity is
associated with a multitude of diseases such as cardiovascular disease, renal diseases,
hypertension, type 2 diabetes and overall mortality (Whitlock et al., 2009). In the UK alone,
the NHS spends an estimated £6.1 billion each year on obesity and obesity related costs and
this is projected to increase by one and a half times by 2050 (England, 2017).
1.1.3 Causes:
Obesity is a multifactorial disease with a number of factors contributing to the growing
obesity pandemic, shifting mainly between biological, environmental and societal factors.
The study of twins, especially those reared apart, is an excellent study design that can
distinguish between environmental and genetic influences on BMI. Stunkard et al.
demonstrated in 93 pairs of monozygotic twins who naturally share 100% of their genes, a
high intrapair correlation of BMI heritability of ~70% (0.70 for men and 0.66 for women) that
was also supported by similar estimates from maximum-likelihood model fitting analysis of
0.74 and 0.69 for men and women respectively (Stunkard et al., 1990). Indeed, mutations in
certain genes such as melanocortin 4 receptor (MC4R) gene, can induce hyperphagia and
obesity in human subjects (Farooqi et al., 2000). Although genetic conditions could play a role
in the aetiology of obesity, these conditions are quite rare (Hebebrand et al., 2010, Savona-
Ventura and Savona-Ventura, 2015) and cannot explain the rising prevalence of obesity seen
in the last 50 years at the population level. The rise in obesity has coincided with substantial
environmental changes that promote an obese lifestyle such as reductions in home cooking,
reduced physical activity, greater reliance on convenience food and an increase in sedentary
or desk-job work and an overall ‘westernized’ lifestyle (Caballero, 2007, Blüher, 2019, Lee et
al., 2019). Moreover, socioeconomic differences and societal influences also play an
important role in the development of obesity. For instance, food insecurity has been

28
suggested to be associated with reduced resting metabolic rate, increased energy intake and
increased fat storage as a defence mechanism against food scarcity (Dhurandhar, 2016). Also,
ethnic differences can explain the heterogenicity in obesity observed between different
countries where obesity prevalence is as little as ~5% in countries such as Japan and Korea
with levels rising to 30-40% in others such as the United States and Canada (OECD, 2017).
Thus, given all these factors, it appears that an individual’s susceptibility to obesity is mainly
determined from societal interrelationships, local environment and genetic inheritance.
Indeed, intergenerational BMI transmission or adiposity shaped by family environment and
parental genetic inheritance can account for 35-40% of a child’s BMI (Dolton and Xiao, 2017).
Nevertheless, although the pathogenesis of obesity is complex and multifactorial, the root
cause of obesity stems from a chronic imbalance between energy intake and energy
expenditure, where daily energy intake exceeds energy expenditure (Jebb and Prentice, 1995,
Caballero, 2007, Sharma and Padwal, 2010, Blüher, 2019). In a longitudinal study on 5119
perimenopausal Scottish women aged 45-54 years that commenced between 1990 and 1994,
with follow-up visits at 1997–1999 and 2009– 2011, indicated an average yearly weight gain
of 0.27 kg/year (Yang et al., 2017). Also, data from the National Health and Nutrition
Examination Survey (NHANES) that is a national representation of adults in the United States,
demonstrated that average weight gain between 1999–2000 through 2015–2016 in adults
over 20 years of age, was 0.78 kg/year and 0.62 kg/year men and women respectively (Fryar
et al., 2018). Thus, considering the average weight gain of 0.3-1 kg/year observed in middle-
aged adults, which can become substantial over the course of decades, equates to a
surprisingly minor positive energy balance of 50-100 kcal/day (Hill et al., 2003, Zhai et al.,
2008). Therefore, interventions targeted to halt this gradual increase in annual weight gain
and subsequent development of obesity need only to promote a minimal reduction in daily
energy intake and/or increase in energy expenditure.

29
1.2 Dietary Fibre:
1.2.1 Definition:
The definition of dietary fibre may differ between organizations and depends on both
analytical and nutritional perceptions. However, it is generally accepted that dietary fibre are
carbohydrates polymers with three or more monomeric units, which are neither digested nor
absorbed in the human intestine while also conferring physiological health benefits upon
consumption. Dietary fibre can also be further classified according to varying physiochemical
properties such as viscosity in either a solution or in the digestive tract, fermentability in the
colon as assessed by rate of fermentation or production of short-chain fatty acids (SCFA) or
by its bulking effects in the colon (Stephen et al., 2017). Therefore, it is not surprising that
different subtypes of fibre will not confer the same physiological benefits on intestinal
functions such as constipation relief or contribution to the SCFA pool. For instance, an
insoluble fibre such as cellulose is poorly fermented by gut microbiota but can increase faecal
weight which can in turn help in relieving chronic constipation (Danjo et al., 2008, Nagano et
al., 2018). On the other hand, intake of a soluble and fermentable fibre such as pectin can
enhance the gastrointestinal immune barrier by preventing the adhesion of pathogens to
epithelial cells and strengthening epithelial integrity while also favouring the production of
beneficial gut microbes (Bang et al., 2018, Beukema et al., 2020).
1.2.2 Effect of dietary fibre on non-communicable diseases and current intakes:
Numerous studies have shown that increased intake of dietary fibre is associated with
reduced body weight and sustained weight loss (Liu et al., 2003, Du et al., 2010, Bozzetto et
al., 2018).For instance, the Finnish Diabetes prevention study, which included overweight
men and women (n=522) with impaired glucose tolerance, showed that individuals with high
fibre and low fat intake lost around 2 kg more after 3 years than subjects consuming a high
fat and low fibre intake. Moreover, fibre density was independently associated with sustained
weight reduction (>5%) even after accounting for potential cofounders (Lindström et al.,
2006). In addition, evidence from prospective cohort studies and randomized controlled trials
demonstrate a decrease in incidence of several non-communicable disease such as coronary

30
heart disease, stroke incidence and mortality, type 2 diabetes and colorectal cancer as well
as lower body weight with high intakes of dietary fibre. The greatest risk reduction was
associated with dietary fibre intakes between 25-29g/d (Reynolds et al., 2019). Nonetheless,
it must be noted that the effects of dietary fibres on obesity and overall body weight are not
always consistent and may depend on a number of factors including the type of dietary fibre,
the amounts used, diet composition and the metabolic phenotype of individuals (Blaak,
2016). However, despite the multiple benefits associated with high fibre consumption, intake
of dietary fibres has dropped drastically since the ‘hunter gatherers’ era when >100g of
dietary fibre was estimated to be consumed per day (Eaton, 2006). Most countries today
including the United States, United Kingdom and other European countries recommend an
average dietary fibre intake of 25–35 g for adults (25–32 g/d for adult women and 30–35 g/d
for adult men). However, the majority of adults fail to achieve the recommended dietary fibre
due to increased adoption of a ‘Westernized diet’, where estimated daily intakes in adult
females range from 14 to 21g/d and between 15 to 25 g/d in adult males, which fall well
below recommended intakes (McGill and Devareddy, 2015, Stephen et al., 2017).
1.3 Fermentable dietary fibre:
1.3.1 Definition:
Fermentable fibres are those that resist digestion in the small intestine but are readily
fermented in the large intestine by gut microbiota. Fermentation here refers to the anaerobic
metabolic process in which microorganisms extract energy for bacterial growth and
development. Examples of fermentable fibres include pectin, gums and inulin-type fructans
(Lattimer and Haub, 2010).
1.3.2 Effect of fermentable dietary fibre on body weight:
Increasing evidence suggests that the fermentable component of dietary fibre may be
responsible for the benifitial effects of dietary fibre on body weight regulation and decreased
adiposity (Wanders et al., 2011, Adam et al., 2014, Adam et al., 2015b). Indeed, rodents fed
a high fat diet supplemented with fermentable fibre were shown to be protected against high
fat diet associated weight gain and related morbidities (Adam et al., 2015a, Bray et al., 2018).

31
This may be since animal studies shows a clear indication that increasing the fermentable
fibre content in food is related to increased production of satiety gut hormones such as PYY
and GLP-1 levels that may lead to long term improvements in body weight and composition
(Massimino et al., 1998, Delzenne et al., 2005, Parnell and Reimer, 2012, Adam et al., 2016,
Singh et al., 2018). Moreover, fermentable fibres have also shown to reduce appetite by
acting on central appetite mechanisms (So et al., 2007, Arora et al., 2012).
Similarly, human trials also show that long term supplementation of fermentable fibre can
induce weight loss and fat accumulation whilst enhancing metabolic parameters (Parnell and
Reimer, 2009, Guess et al., 2015) which may be related to changes in appetite hormone
secretion. In a double-blind randomized placebo- controlled trial, Parnell et al. reported in
overweight/obese adults that supplementation of 21 g of oligofructose vs. placebo
(maltodextrin) for 21 days results in weight loss of 1.03 ±0.43 kg versus a weight gain of 0.45
± 0.31 kg (P = 0.01) in the placebo group. Moreover, the oligofructose group had higher
circulating levels of PYY and reduced levels of ghrelin (hunger signalling hormone) and energy
intake than the control group, although GLP-1 levels remained similar across both groups
(Parnell and Reimer, 2009). Similarly, Cani et al. showed that gut fermentation of prebiotics
(a mixture of glucosyl-(fructosyl)n- fructose and (fructosyl)m-fructose extracted from chicory
roots) can influence appetite hormones in healthy adults. Prebiotics refer to dietary fibres
that can selectively stimulate the growth of certain bacteria that have a favourable role on
host’s health. Supplementation of 16g of prebiotics per day in comparison to 16g of non-
fermentable dextrin-maltose control for two weeks, resulted in decreased hunger ratings as
reported by volunteers and increases in plasma PYY and GLP-1 levels (Cani et al., 2009). Also,
Whelan et al. showed in a cross-over trial involving 11 healthy adults, who consumed enteral
formulas as a sole source of nutrition for two weeks that when receiving a standard formula
supplemented with either pea fibre (10g/l) or fructooligosaccharide (5g/l) volunteers had
higher subjective scores of fullness and satiety in comparison to when fed a standard formula
alone (Whelan et al., 2006). Comparably, in hyperinsulinemic subjects, Freeland et al.
demonstrated that supplementation of a high-wheat fibre cereal (24g fibre/d) that increases
colonic fermentability, versus a low-fibre cereal intake resulted in increased GLP-1 levels after
1 year of supplementation (Freeland et al., 2010).

32
It must be noted that animal studies that have demonstrated favourable effects of
fermentable fibre supplementation on overall body composition/weight and gut hormone
secretion utilize large amounts of fibre that are considerably larger than habitual fibre intake
in humans (>7% of the total weight of food consumed in animals versus <1% in human studies)
(Chambers et al., 2011). Moreover, as encouraging as human trials are on fermentable fibre
benefits, common side effects of increased fibre intake include bloating, flatulence, cramps
and soft stools. Therefore, identifying the mechanism of how fermentable dietary fibres can
reduce adiposity and promote weight loss, may prove a more effective strategy at weight
regulation than the use of unsustainable high fibre diets.
1.4 Short-Chain Fatty Acids (SCFA):
Increasing evidence suggests that the the benifitial effects of fermentable dietary fibre on
body weight and energy homeostasis may be due to the major metabolites generated from
microbial fermentation in the gut, the short chain fatty acids (SCFA): acetate, propionate and
butyrate that are shown to modulate metabolic pathways and receptor-mediated
mechanisms at diverse organ sites (Sukkar et al., 2019).
1.4.1 Definition:
SCFA are small organic monocarboxylic acids with varying chain lengths, ranging from two to
six carbon atoms. They can be found in low quantities in food sources but are predominantly
produced by gut microbiota as end-products of fermentation of indigestable carbohydrates
or protein. The major SCFA (90-95%) found in the human gastrointestinal tract are the
straight chain organic fatty acids: acetic acid (C2H4O2), propionic acid (C3H6O2) and butyric acid
(C4H8O2) produced via carbohydrate fermentation (Figure 1-1). Protein fermentation, on the
other hand, can produce brached chain SCFA such as isobutyrate, valerate and hexanoate
accounting for £ 5% of total SCFA production (Cook and Sellin, 1998, Ríos-Covián et al., 2016).
These branched chain SCFA often have unfavorable outcomes on host’s health by negatively
affecting epitheilial barrier and function (Corpet et al., 1995, Canfora et al., 2015) In this text,
the term SCFA will be used to represent the predominant three SCFA: acetate, propionate
and butyrate.

33
Figure 1-1 Major SCFA Acetic Acid, Propionic acid and Butyric acid respectively.
1.4.2 Sources:
1.4.2.1.1 Dietary Sources:
SCFA are naturally present in dietary sources such as milk, cheese and yogurt and can also be
used as food additives and preservatives. Fermentation increases the concentration of SCFA
in foods and levels of SCFA are shown to be considerably higher in fermented versus
unfermented food products due to the greater abundance of SCFA generating
microorganisms (Annunziata et al., 2020).Indeed, SCFA levels can progressively increase with
fermentation days. For instance, Utoiu et al. showed that fermentation of Kombucha
beverage and a symbiotic culture of bacteria and yeast (SCOBY) with pollen can lead to a
steady increase in SCFA concentrations with the highest levels found at the end of the study
period at 17 days of fermentation (Day 0-17 respectively: acetate: 0.415 ± 0.005 g/L to 3.51 ±
0.11 g/L, propionate from 0.095 ± 0.012 g/L to 0.56 ± 0.041 g/L, butyrate from 0.12 ± 0.038
g/L to 1.78 ± 0.054 g/L ) (Uțoiu et al., 2018).
According to the Codex General Standard for Food Additives, acetate can be used safely as an
acidity regulator, preservative or sequestrant and can thus be found in commonly consumed
food products such as fresh and dried pastas, fermented vegetables as well as in dairy
products (Additives, 2019a). Similarly, propionate can be used as a food preservative due to
its antimicrobial properties (P.M. Davidson, 2005) and can commonly be found in ripened and
unripen cheese, fat spreads and ready-prepared meals (Additives, 2019b). Butyrate too has

34
antibacterial properties (Levison, 1973) and can be used as a food flavouring (Nations, 2010)
or added to animal feed to improve meat quality (Lan et al., 2020) or even as an alternative
to antibiotic use in animal feed (Bedford and Gong, 2018).
SCFA concentrations in food are quite tightly regulated during quality control processes in the
food and beverage industry mainly due their odorous characteristics (Gill et al., 2018) as well
as for safe consumption issues. Thus, their concentrations in food products is minimal. For
instance, a maximum safe level of 5000 mg of sodium propionate can be added to 1 kg meat
and fish products (Additives and Food, 2016). Similarly, up to 6000 mg of sodium acetate can
be found in fresh pastas and noodles (Additives, 2019a). Therefore, the major source of
dietary SCFA in humans stems from the fermentation of dietary fibres by colonic microbiota,
rather than oral intake in foods.
1.4.2.1.2 Microbial-derived SCFA:
The human gastrointestinal tract is host to a huge array of micro-organisms (1013 –1014) which
can ferment dietary fibres, or unabsorbed carbohydrates providing a minor energy
contribution (1.2-6%) to our daily energy needs (Popovich et al., 1997, Byrne et al., 2015).
Microbial density and even bacterial diversity increase steadily along the gastrointestinal tract
with concentrations of only 101 bacteria per gram content in the stomach and reaching
1012 bacteria per gram in the colon (Dieterich et al., 2018). In fact, bacteria residing in the
human colon account for 70% of all bacteria present in the body and is considered the main
site of bacterial fermentation of indigestible food components (Hillman et al., 2017). Human
microbiota are mostly strictly anaerobic with the vast majority belonging to three main phyla:
Bacteroidetes, Firmicutes, and Proteobacteria (Dieterich et al., 2018). Short-chain fatty acids
(SCFA), acetate, propionate and butyrate are the principal metabolic end products of gut
microbial saccharolytic fermentation of dietary fibre and are present in an approximate molar
ratio of 60:20:20. Data from suddenly deceased humans demonstrated that the
concentration of SCFA could reach around 200 mmol/kg in the colon with the greatest
amounts present in the cecum (Cummings et al., 1987). However, the total amount, ratio and
rate of SCFA production in the gut depends on several factors such as microbiome diversity,
gut transit time and type and amount of dietary fibre ingested (Byrne et al., 2015). Intake of
inulin, for example, has shown to increase total SCFA concentrations in both the cecum and

35
portal vein in comparison to cellulose intake (Weitkunat et al., 2015). Pectin fermentation, on
the other hand, can promote the growth of bacterial species that lead to increased production
of both acetate and butyrate (Bang et al., 2018).
Carbohydrate fermentation ultimately results in pyruvate production. However, very little
pyruvate is found in the gut as the majority is metabolised to SCFA, CO2, H2, methane and
water (Cummings, 1981). Acetate (C2H3O2) formation by intestinal microbiota is widely
distributed among bacterial groups and is mainly produced via pyruvate decarboxylation to
acetyl-coA or reductive methylation of CO2, also known as Wood-Ljungdahl pathway
(Cummings, 1981, Schönfeld and Wojtczak, 2016). Some homoacetogenic bacteria or
acetogens include Akkermansia Muciniphila (A. muciniphila) and Bifidobacteria which
generate acetate from CO2 and H2 (González Hernández et al., 2019). Moreover, acetate can
be synthesized in the liver after a prolonged fast or alcohol consumption (Scheppach et al.,
1991). Daily acetate production in humans is estimated to be 9g/d (~150 mmol/d) (Wolever
et al., 1995) of which 35% is estimated to be produced via colonic acetate production
(Pouteau et al., 1998).
Propionate (C3H6O2), on the other hand, is produced from pyruvate via three mechanisms:
Succinate decarboxylation pathway, the acrylate pathway and the propanodiol pathway
depending on the type of propionic bacteria. In the former pathway, CO2 is fixed to pyruvate
and forms succinate, which is ultimately decarboxylated to produce propionate. In the
acrylate pathway, propionate is produced from acrylate using lactate as a precursor (Sa'ad et
al., 2010). Finally, the propanodiol pathway present in phylogenetically distant bacteria
involves the conversion of deoxy-sugars to propionate. Propiogenic bacteria include
Lactobacillus plantarum, Bacteroides thetaiotaomicron and Akkermansia muciniphila (Ríos-
Covián et al., 2016, El Hage et al., 2019). Daily propionate production is estimated to be 2.5
g/d (~33.7 mmol/d) (Morrison and Preston, 2016).
Butyrate (C4H8O2) is produced by the condensation of two acetyl-CoA molecules that generate
acetoacetyl-CoA which subsequently, by the reductive conversion of acetoacetyl-CoA, is
converted to butyryl-CoA (Schönfeld and Wojtczak, 2016). Another less common route of
metabolism involves the butyrate kinase pathway which butyryl-CoA into butyrate via
phosphotransbutyrylase and butyrate kinase enzymes (Ríos-Covián et al., 2016).

36
Faecalibacterium prausnitzii and Roseburia are some butyrate generating microorganisms
which also demonstrate cross-feeding between acetate-producing and butyrate-producing
bacteria (Duncan et al., 2004). Indeed, a stable isotope study in humans confirmed that
interconversion of acetate to butyrate (24%) was a result of bacterial rather than human
metabolism since when 13C-labelled acetate capsules that ensured absorption of acetate in
the proximal gastrointestinal tract (before it reaches substantial bacterial sites) were used, 13C-labelled butyrate was no longer detectable in plasma (Boets et al., 2017). Average
butyrate production in healthy individuals is estimated to be 5.5–7.5 g/d (62.4 – 85.1 mmol)
(Banasiewicz et al., 2020).
All in all, it appears that between bacterial species, there is high interconversion from acetate
to butyrate (24%), a low interconversion from butyrate to acetate (10%) and from propionate
to acetate (8%) and almost no interconversion between propionate and butyrate (5%) and
between acetate to propionate (3%) and between butyrate and propionate (1%) (Boets et al.,
2017).
A summary of the major gut derived SCFA metabolic pathways is below: adopted from
(Frampton et al., 2020):

37
Figure 1-2: Gut derived SCFA metabolic pathways
Dietary fibres or non-digestible carbohydrate enter the colon to be fermented by the resident microbiota into
monosaccharides. These monosaccharides are then metabolised via various metabolic pathways to produce
the primary SCFA: acetate, propionate and butyrate.
1.4.3 Absorption and transport
A number of mechanisms have been proposed for SCFA absorption across the colonic
epithelium. Apical uptake of SCFA involves either passive diffusion of undissociated SCFA
across cellular membranes or active transport which is facilitated by various transporters.
However, passive diffusion appears to play a minor role in the uptake of SCFA since the
average luminal pH (5.5–6.5) entails that only a small amount of SCFA (~1%) are present in
the protonated form. Thus, active transport appears to play the major role in SCFA absorption
via three main transporters: 1) an unidentified transporter that catalyses SCFA uptake with
HCO3 secretion 2) members of monocarboxylate transporters (MCT) family that cotransport
SCFA with cations such as H+ or with lactate or pyruvate 3) sodium-dependent
monocarboxylate transporter (SMCT)1 that couples SCFA uptake with Na+ transport and Cl
and water absorption due to a rise in luminal pH with SCFA uptake (Cook and Sellin, 1998,
den Besten et al., 2013b). The remaining SCFA not absorbed and metabolised by colonocytes

38
are then transported across the basolateral membrane into the portal vein via SCFA HCO3
antiport,MCT4 and possibly via MCT5 (den Besten et al., 2013b). Although little is known
about the transporters required to transfer SCFA from blood into peripheral tissues,
transporters organic anion transporter 2 (OAT2) found in the kidneys and liver, and OAT7
expressed in the liver ,were identified as transporters of propionate and butyrate respectively
across the sinusoidal membrane of hepatocytes (Islam et al., 2008, Shin et al., 2007).
1.4.4 Metabolism:
Once SCFA enter the portal vein, they are available for uptake and metabolism by the liver.
The SCFA not extracted by the liver are then released into peripheral circulation via the
hepatic vein. Substantial differences in SCFA concentrations is seen between initial
concentrations in the lumen and peripheral blood, which indicate varying metabolism of
these metabolites across different organ sites. Butyrate appears to be the preferred fuel for
colonocytes as approximate molar fractions of acetate, propionate and butyrate fluctuate
between 60:20:20 in the colonic lumen to 70:20:10 in the portal vein (Cummings et al., 1987).
The majority of propionate (~90%) and remaining butyrate are then extracted by the liver
which leaves acetate as the only SCFA present in substantial amounts (>50 μmol/) in
peripheral circulation (Cummings et al., 1987, Bloemen et al., 2009, Boets et al., 2017). It must
be noted that varying levels of SCFA can be found in circulation due to the health or nutritional
status of volunteers during trials or even due to the difference in rate in colonic fermentation
due to the varying timing of exposure to food (Wolever et al., 1997). Moreover, plasma SCFA
can be derived from both exogenous sources i.e. microbial fermentation, and endogenous
sources. Acetate and butyrate for instance can arise from fatty acid oxidation (Schönfeld and
Wojtczak, 2016) while propionate can be produced from amino acid catabolism (Walter et al.,
1989). The following table (Table 1-1)adopted from findings of (Cummings et al., 1987,
Bloemen et al., 2009) represents estimated SCFA concentrations in human portal and hepatic
veins and periphery:

39
Table 1-1: SCFA concentrations in human blood
Average SCFA concentrations in human blood μmol/l:
In mammals, SCFA can be used as substrates for lipid or carbohydrate synthesis and can also
be oxidized in the TCA (tricarboxylic acid) cycle. Acetate and butyrate can enter the TCA cycle
as acetyl-coA and can be used as precursors for de novo lipogenesis where they can be
incorporated into various long chain fatty acids such as palmitate and stearic acid as well as
cholesterol and ketone bodies. Propionate, on the other hand, can act as a precursor for
hepatic gluconeogenesis where it enters the TCA cycle at the level of succinyl-CoA which can
be converted to oxaloacetate and ultimately converted into glucose. Although acetate and
butyrate can also contribute to glucose metabolism, this is mainly reflected in the enrichment
of the triose phosphate precursor pool and with no net glucose production (den Besten et al.,
2013a, Boets et al., 2017). Complete oxidation of acetate, propionate and butyrate yields a
maximum ATP (adenosine triphosphate) of 10, 18 and 27 ATP/M , equivalent to 73, 131.4 and
197.1 kcal/M, respectively (Baldwin, 1995).
Around 90-95% of SCFA are absorbed in the gastrointestinal tract with only ~5% excreted in
the faeces (Cummings, 1981). However, overweight and obese individuals seem to have
higher total faecal SCFA concentrations than lean individuals (Duncan et al., 2008, Schwiertz
et al., 2010, Kim et al., 2019) which may indicate more colonic SCFA production and increased
energy harvest in overweight and obese individuals. However, Rozenbloom et al. has shown
in obese subjects that despite having higher faecal content of SCFA in comparison to lean
volunteers, this was not due increases in SCFA absorption or differences in diet (Rahat-
Rozenbloom et al., 2014) . An increase in SCFA faecal content could be due for instance to
reduced colonic transit time (El Oufir et al., 2000) or in fact reduced absorption of colonic
SCFA (Vogt and Wolever, 2003). Also, the differing microbial profile seen with obese
individuals vs lean subjects such as a higher Firmicutes abundance (Rahat-Rozenbloom et al.,
2014) or sometimes a higher Bacteroidetes presence (Schwiertz et al., 2010) can indicate
Portal Hepatic Periphery
Acetate 258 - 262.8 115 - 219.5 70 - 172.9
Propionate 30.3 - 88 6.9 - 21 3.6 - 5
Butyrate 29 - 30.1 12 4 - 7.5

40
greater efficiency in fermenting available substrates and a resulting higher faecal SCFA
content. However, a recent meta-analysis has shown that faecal gut microbial richness at the
phylum level is in fact lower in obese versus non-obese subjects (Kim et al., 2019). In any case,
it appears that gut production of acetate, propionate and butyrate (Bloemen et al., 2009) as
well as plasma SCFA levels (Sowah et al., 2020) seem to be quite similar across individuals
with varying BMIs. Also, since SCFA are readily absorbed by the host, faecal concentrations
may rarely reflect intestinal SCFA metabolism or any additional energy harvest (den Besten
et al., 2013a). It must be noted that no research so far has investigated or corrected for energy
or fibre intake in obese versus lean individuals, thus it may be that the raised faecal SCFA
levels reported in obese subjects may be a simple reflection of greater energy intake whereby
more dietary substrate is being fermented by the colonic microbiota. However, a recent
meta-analysis has found inconsistent results with the effects of weight loss achieved through
dietary, physical activity–based, and surgical weight-loss interventions in overweight and
obese subjects on faecal SCFA levels with some studies reporting a decrease in SCFA
concentrations while others observing no significant effect (Sowah et al., 2019). Since studies
included in this review were of small sample size, further studies are needed to accurately
assess the effect of lower energy intake on faecal SCFA concentrations or to compare SCFA
production in lean versus obese subjects given the same diet. Noteworthy, however, plasma
SCFA have been shown to remain remarkably stable in obese subjects even after weight loss
and thus lower energy intake (Sowah et al., 2020).
1.4.5 Receptors:
SCFA have been identified as ligands for two previously orphaned G-protein-coupled
receptors, GPR43 and GPR41 now termed FFAR-2 (free fatty acid receptor 2) and FFAR-3 (free
fatty acid receptor 3) respectively. FFARs are seven-transmembrane receptors that activate
heterotrimeric G protein (guaninenucleotide-binding protein) and can act as therapeutic
targets for various diseases (Hara et al., 2013). Although both FFAR-2/3 have similar
endogenous ligands, their G-protein activating mechanisms can differ. The pertussis toxin-
sensitive Gi/o pathway is activated by both FFA2 and FFA3, whereas Gq/11 is mainly activated
via FFAR-2 (Le Poul et al., 2003). Propionate appears to have the highest affinity to both FFAR-
2 and FFAR-3 while acetate and butyrate are more selective to FFAR-2 and FFAR-3 respectively

41
(Le Poul et al., 2003). However, these results differ depending on species and thus, must be
interpreted with caution. The receptors are widespread throughout different tissues. FFA3 is
mainly found in adipose tissue, pancreas, spleen, lymph nodes, bone marrow, and peripheral
blood mononuclear cells including monocytes whereas FFA2 is greatly present in the distal
ileum, colon, and adipose tissue, with the highest expression found in immune cells such as
monocytes and neutrophils. Nevertheless, both receptors are mostly expressed in the colon
epithelial and enteroendocrine cells such as L-cells (Xiong et al., 2004, Tolhurst et al., 2012,
Byrne et al., 2015, Tang et al., 2015). As ligands of such widespread receptors, SCFAs have
been shown to affect host metabolism at different organ sites. It is noteworthy however that
SCFA have a low potency (EC50 of around 0.5 mM) in activating these receptors in comparison
to other ligands and hence may limit the activation of these receptors to certain areas in the
human body such as the gut lumen where SCFA are relatively abundant (Ang and Ding, 2016).
Tolhurst et al. have shown that SCFA can stimulate GLP-1 (glucagon-like peptide 1) secretion
from intestinal L-cells via FFA2 and can therefore enhance glucose tolerance (Tolhurst et al.,
2012). Indeed, GLP-1 as a potent incretin hormone can lower glucose levels and improve
insulin sensitivity while inducing proliferation of pancreatic b-cells (Vilsbøll, 2009). Through
FFA2 as well, SCFA can, independent of GLP-1 activation, enhance insulin secretion while
inhibiting b-cell apoptosis (Pingitore et al., 2017). Other studies have shown that SCFA can
increase PYY (peptide tyrosine tyrosine) secretion, an anorexigenic hormone and regulator of
gut motility, via FFA3 (Samuel et al., 2008). Moreover, SCFA, especially propionate, can
substantially increase leptin secretion from white adipose tissue through FFA3 even at
physiologically attained levels (Xiong et al., 2004). These SCFA also seem to regulate energy
expenditure and induce adipogenesis and can thus protect from ectopic fat accumulation and
the subsequent improvement in insulin sensitivity through these receptors (Hong et al., 2005,
Kimura et al., 2011, Kimura et al., 2013, Lu et al., 2016).Nevertheless, contradictory studies
have found that these metabolic changes could occur independent of FFA2/3 activation and
thus other mechanistic pathways may be accountable (Lin et al., 2012, Bjursell et al., 2011,
Frost et al., 2014a, den Besten et al., 2015).

42
1.5 The role of propionate on energy metabolism:
In rodent models, propionate has been shown to stimulate the secretion of anorectic gut
hormones such as PYY and GLP-1 from enteroendocrine L-cells via FFAR-2 (Tolhurst et al.,
2012, Psichas et al., 2015). These hormones have been shown to regulate appetite and food
intake via central appetite regulating mechanisms (Perry and Wang, 2012). Indeed, effects of
PYY and GLP-1 on food intake seem to be abolished with disruption of the vagal-brainstem-
hypothalamic pathway (Abbott et al., 2005). Among the SCFA, propionate seems to have the
highest affinity to FFAR-2 (Le Poul et al., 2003). Moreover, propionate is an end-product of
bacterial metabolism and does not undergo substantial bacterial interconversions like other
SCFA such as acetate (den Besten et al., 2013a). Interestingly, gut microbial transplantation
from human twins discordant for obesity to germ free mice show that mice who received
microbiota from the lean twin had higher cecal levels of propionate in comparison to mice
who received the obese transplant. Moreover, phenotypic and body composition differences
to resemble that of their transplant donors were apparent therefore suggesting positive
effects of raised colonic propionate on energy balance (Ridaura et al., 2013). In line with this,
our research group investigated the effects of targeted delivery of propionate to the colon on
appetite and body weight regulation in human subjects (Chambers et al., 2015).
However, since oral propionate is rapidly absorbed and in order to avoid the unpalatability of
orally administered propionate and ensure that propionate is directly delivered to the colon
where L-cells are abundant, a novel delivery system was designed in the form of an inulin
propionate ester (IPE) that targets the release of propionate in the proximal colon in gram
quantities. This carrier involves a molecule where propionate is chemically bound via an ester
linkage to inulin and the majority (>80%) of propionate is released once the IPE is fermented
by colonic microbiota, thereby targeting colonic delivery of propionate with very little
dissociated in the upper gastrointestinal tract. 10g of inulin alone is estimated to produce
15.0 mmol of propionate from microbial fermentation whereas fermentation of 10g of IPE is
estimated to deliver an additional 36.2 mmol from bound propionate. Isotope labelling
studies, using a 13C-propionate variant of the IPE, ensured the stability of propionate along
the gastrointestinal tract till it reaches the colon (Chambers et al., 2015).

43
In an acute study, which was a double-blind randomized cross-over study involving 20
overweight (BMI: 25.4 ± 0.8 kg/m2) but otherwise healthy adults, showed that acute
supplementation of 10 g of IPE in a mixed calorie breakfast in comparison to 10g inulin control
did not alter subjective markers of appetite or glucose homeostasis but significantly
decreased food intake by 13.8% in the IPE group that was coupled with a significant increase
in post-prandial PYY and GLP-1 levels.
Subsequently, a chronic study was initiated where overweight subjects were supplemented
with 10g of IPE (n=25) or an inulin control (n=24) for 24 weeks in a randomised parallel design.
It was hypothesised that the raised PYY and GLP-1 following IPE intake would translate into
long-term reductions in energy intake and produce improvements in body weight. At the end
of the supplementation period, marked differences in weight gain were observed between
the two groups. In the IPE group, none of the participants experienced significant weight gain
(>5% of baseline weight) in contrast to 17% in the inulin control. Moreover, body composition
was significantly altered in the IPE group in comparison to control whereby intraabdominal
adipose tissue was significantly reduced and a trend (p=0.061) for decreased
intrahepatocellular content was observed in the IPE group that was significant in participants
that met the diagnostic criteria for non-alcoholic fatty liver disease. This was also coupled
with prevention of the deterioration of postprandial glucose response. Intriguingly, food
intake was surprisingly similar between the two groups as no apparent effect on food intake
was observed after an ad libitum meal at the end of the supplementation period. Moreover,
no effect on appetite regulating hormones (PYY and GLP-1) levels was apparent. Thus, it
appears that over time, a desensitisation of FFAR-2/3 response may occur, and propionate
hence seems to regulate energy balance independent of appetite hormone secretion. It is
highly possible since no effect on energy intake was observed, that propionate may regulate
body weight by increasing energy expenditure. Indeed, animal studies do suggest that
increasing propionate bioavailability can increase energy expenditure and substrate oxidation
by acting on various tissues and organ sites (Sukkar et al., 2019). For instance, propionate has
been shown to stimulate sympathetic nervous system activity and oxygen consumption in
mice when given at high doses (1g/kg) intraperitoneally thereby increasing energy
expenditure (Kimura et al., 2011). Moreover, propionate has been shown to upregulate

44
metabolic pathways in both the liver and adipose tissue that favour an increase in energy
expenditure and lipid oxidation (den Besten et al., 2015).
Thus, in order to investigate the effects of increased systemic propionate concentrations on
energy expenditure in humans, a follow up pilot study was conducted that examined the
effect of acute propionate supplementation on resting energy expenditure (REE) in healthy
human volunteers (Chambers et al., 2018). Eighteen healthy volunteers (BMI: 24.1 ± 1.2
kg/m2) were recruited who completed two study visits. In a randomized, cross-over design,
participants received tablets at multiple timepoints throughout the 180 min of the trial,
containing either 1369mg sodium propionate (Propionate) or 833mg sodium chloride
(sodium matched control) whereby the total amount of sodium propionate ingested at the
intervention visit was 6845mg (71mmol). REE and substrate oxidation were also measured
during visits using indirect calorimetry. Findings were encouraging since a small but a
significant increase in REE was observed with propionate supplementation (mean difference:
0.045±0.020 kcal/min; p=0.036) that coincided with a significant increase in lipid oxidation
(mean difference:0.012 ± 0.006 g/min; p=0.048).
The positive effects of raising gut-derived propionate on energy expenditure were only
demonstrated in the overnight fasted state. It would be of great interest to investigate the
acute effect of propionate supplementation on energy expenditure in other physiological
states such as post-prandially and during physical activity. Moreover, in this study (Chambers
et al., 2018), peripheral propionate concentrations only became significantly raised at the end
of the 180 min trial Figure 1-3 therefore the complete absorption or bioavailability of oral
propionate may not have been fully measured. Therefore, examining if these positive effects
on energy expenditure can be replicated in different energy states as well as determining how
long the acute metabolic effects of propionate can persist beyond the 180 min would fulfil
this gap in the literature and would be of interest for future research studies. Consequently,
the first aim of this thesis is to explore the acute effect of increased propionate bioavailability
on energy expenditure and substrate oxidation in different energy states (overnight fasted,
submaximal exercise and post-prandial). It will also examine how long the metabolic effect of
propionate can persist in these states and if sympathetic nervous system activity, measured

45
through heart rate and mean arterial pressure, is stimulated following propionate
supplementation. This will be addressed in (Chapter 3:)
Figure 1-3 Peripheral propionate levels The acute effect of oral sodium propionate supplementation on propionate levels in peripheral blood. A.
Propionate (Time×Trial: P= 0.043) and B. Propionate iAUC (P=0.021) (Chambers et al., 2018).
Findings of Chambers et al. also highlight a promising effect of gut derived propionate on
appetite regulation in healthy volunteers (Chambers et al., 2015). Food intake and meal size
were significantly reduced with acute 10 g IPE supplementation to a mixed calorie breakfast
in comparison to inulin control that coincided with a greater post-prandial anorectic gut
hormone PYY and GLP-1 release. However, surprisingly, this did not coincide with any
significant decrease in subjective hunger ratings. In the follow up pilot study of Chambers et
al. that acutely supplemented healthy individuals in the overnight, fasted state with
propionate tablets (71 mmol) similarly confirmed that propionate seems to have no effect on
subjective hunger although energy intake was not assessed in that study (Chambers et al.,
2018). Intriguingly, however, propionate supplementation did elicit a significant increase in
subjective nausea response over the 180 min of the trial. Therefore, it is possible that the
effect of propionate on appetite may partially be driven by the higher nauseating effect

46
induced by propionate that can result in reduced energy intake and a larger satiation response
without influencing subjective feelings of hunger. It would thus be quite interesting to
determine whether acutely raising propionate bioavailability can maintain a nauseating effect
or suppress subjective appetite over a longer time-period and whether this effect persists in
different energy states. Therefore, the second aim of this thesis is to fulfil this gap in the
literature and will be discussed in (Chapter 4:).
Propionate has previously been shown to stimulate GLP-1 release from enteroendocrine L-
cells via FFAR-2 which subsequently increases insulin secretion from β-cells (Tolhurst et al.,
2012). GLP-1, as an incretin hormone secreted from intestinal L-cells, has shown to have a
distinct impact on β-cell function and glucose homeostasis. For instance, in β-cells, GLP-1 has
shown to stimulate insulin gene expression and biosynthesis and also to enhance glucose
stimulated insulin secretion and to restore glucose competence in glucose resistant β-cells.
Moreover, it can act as a growth factor and can thus increase β-cell mass (Buteau, 2008).
Furthermore, GLP-1 has been shown to delay gastric emptying and can slow down the
absorption of nutrients which can in turn reduce post-prandial glucose response (Van
Bloemendaal et al., 2014). In addition, independent of GLP-1 secretion, propionate has also
shown to modulate glucose homeostasis and insulin sensitivity via FFAR-2 in rodent in vitro
models (Han et al., 2014). Thus, increasing propionate bioavailability seems to be an attractive
therapeutic target in regulating glucose homeostasis.
Indeed, our research group investigated the effects of long-term colonic delivery of
propionate in the form IPE on glucose homeostasis in healthy overweight individuals
(Chambers et al., 2015). Participants received 10g of IPE every day for 24 weeks. At the end
of the supplementation period, subjects taking the IPE in comparison to inulin control had
significant improvements in β-cell function as assessed by the oral disposition index that was
independent of GLP-1 release (Pingitore et al., 2017). The acute increase in insulin secretion
observed in the intervention group and the lack of effect on insulin sensitivity was suggestive
of propionate acting directly on pancreatic β-cells. Certainly, a follow up in vitro trial on
human islets demonstrated that propionate can directly potentiate glucose stimulated insulin
secretion and maintain β-cell mass by inhibiting apoptosis.

47
Our research group then investigated the effects of acute sodium propionate
supplementation (71 mmol) on glucose homeostasis in healthy individuals in the overnight,
fasted state (Chambers et al., 2018). Glucose and insulin levels were unchanged with
propionate supplementation in comparison to sodium chloride control. However, in that
study, propionate levels only became significantly increased at the end of the trial at 180 min
which may not have been a sufficient timeframe to assess the impact on glucose and insulin
profile. Moreover, this was only assessed in the fasted state and thus whether propionate can
favourably effect glucose homeostasis in other energy states such as during submaximal
exercise or post-prandial remains to be determined. Therefore, the third aim of this thesis is
to build on this previous work and examine the acute effect of oral sodium propionate
supplementation on glucose homeostasis in all three energy states and over an extended
timeframe as detailed in (Chapter 5:).
Recent advances in metabolomics has provided key opportunities in various research settings.
Metabolomics can be defined as the study of metabolites that serve as direct representatives
of biological activity and allow reflection of an organism’s phenotypic state (Patti et al., 2012).
Thus, metabolomics can be used to identify objective biomarkers that could be changed as a
result of an intervention in research trials. The main analytical tools applied in metabolomics
include nuclear magnetic resonance (NMR) and mass spectrometry (MS) (González-Peña and
Brennan, 2019). Hence, employing metabolomic techniques in the present thesis seemed to
be an attractive tool in order to objectively assess the metabolite changes that could be
induced with acute sodium propionate supplementation. This seems to be a necessary step
in this direction since no human trial up to date has employed metabolomic techniques to
identify biomarkers influenced by propionate administration and relate those changes with
the observed phenotype. Moreover, it can allow a base for future studies to build on to
determine why those changes occurred and how can that be related to improved metabolic
profile and body homeostasis that is observed with propionate administration.

48
1.6 Thesis purpose and rationale:
In summary, the overall purpose of this research is to examine the acute effect of oral sodium
propionate supplementation on energy expenditure and substrate oxidation in different
energy states and to investigate how long the metabolic effects of propionate can persist in
these states.
1.6.1 Chapter 3:
1.6.1.1.1 Aims: The first aim of this thesis is to explore the acute effect of increased propionate bioavailability
on energy expenditure and substrate oxidation in different energy states (overnight fasted,
sub-maximal exercise and post-prandial). It will also examine how long the metabolic effect
of propionate can persist in these states and if sympathetic nervous system activity, measured
through heart rate and mean arterial pressure, is stimulated following propionate
supplementation. This will be discussed in Chapter 3.
1.6.1.1.2 Hypothesis:
I hypothesised that acute oral intake of sodium propionate would increase energy
expenditure and rates of lipid oxidation in different physiological states (overnight fasted,
sub-maximal exercise and post-prandial) and would modulate energy production pathways
to support increases in energy expenditure and lipid oxidation via increases in heart rate and
blood pressure.
1.6.2 Chapter 4:
1.6.2.1.1 Aims:
The second aim of this thesis is to determine the acute effect of increased propionate
bioavailability on appetite in different energy states (overnight fasted, sub-maximal exercise

49
and post-prandial) by means of visual analogue scales and GLP-1 measurements. This will be
discussed Chapter 4.
1.6.2.1.2 Hypothesis:
I hypothesised that acute oral intake of sodium propionate would reduce subjective appetite
during overnight fasted, sub-maximal exercise and post-prandial states that is mainly related
to an increase in subjective nausea and would also increase circulating GLP-1 levels that was
measured in the post-prandial state.
1.6.3 Chapter 5:
1.6.3.1.1 Aims:
The third aim of this thesis is to explore the acute effect of increased propionate
bioavailability on glucose homeostasis in different energy states (overnight fasted, sub-
maximal exercise and post-prandial). This will be discussed in Chapter 5.
1.6.3.1.2 Hypothesis:
I hypothesised that acute oral intake of sodium propionate would improve insulin resistance
during overnight fasted and sub-maximal exercise states and would improve β-cell function
and increase insulin sensitivity and GLP-1 secretion in the post-prandial state.
1.6.4 Chapter 6:
1.6.4.1.1 Aims:
The fourth aim of this thesis is to examine the acute effect of increased propionate
bioavailability on serum metabolite profile related to gluconeogenesis. This will be explored
in Chapter 6.

50
1.6.4.1.2 Hypothesis:
I hypothesised that acute oral intake of sodium propionate would modulate metabolic
pathways to support suppression of gluconeogenesis from gluconeogenic substrates and
therefore an increase in gluconeogenic substrates would be observed in serum.

51
Chapter 2: Methodology
2.1 Methodology:
This clinical trial (Registration No: NCT04093453) was approved by the London-Bloomsbury
Research Ethics Committee (18/LO/0433) and carried out in accordance with the Declaration
of Helsinki. The trial consisted of three separate studies:
1. Overnight fasted study
2. Sub-maximal exercise study
3. Post-prandial study
Each of these studies was a randomized controlled double-blind cross-over study. The fasting,
exercise and postprandial studies consisted of two, three and two study visits respectively.
2.2 Recruitment:
Subjects were recruited via e-mail using the Healthy Volunteer Database NIHR Imperial
Clinical Research Facility and via posters spread around Imperial College Campuses.
Responders to posters were sent an e-mail which contained a pre-screening questionnaire
and the participant information sheets (Appendices). Potential candidates were then invited
to a screening visit at the NIHR Imperial Clinical Research Facility to assess full eligibility.
During screening, the participants were assessed via an interview which discusses medical
and drug history. All subjects then provided written informed consent (Appendices).
Afterwards, a blood test (fasting blood glucose and full blood count), an electrocardiogram
(ECG), blood pressure and weight and height and body composition measurements were
recorded, and all women of child-bearing age underwent a urinary pregnancy test. Results
were then assessed as per the following criteria and approved by the study clinician before
the participants were formally enrolled in the study.

52
The inclusion and exclusion criteria were set up to identify and recruit healthy adult
participants which is defined as below:
2.2.1 Inclusion Criteria:
• Men and women aged 18-65 years (inclusive)
• Body mass index (BMI) of 18-35 kg/m2.
2.2.2 Exclusion Criteria:
• Weight change of ≥ 3kg in the preceding 2 months
• Current smokers
• Substance abuse
• Excess alcohol intake
• Pregnancy/Breastfeeding
• Diabetes
• Cardiovascular disease
• Cancer
• Gastrointestinal disease e.g. inflammatory bowel disease or irritable bowel syndrome
• Kidney disease
• Liver disease
• Pancreatitis
• Started new medication within the last 3 months likely to interfere with energy
metabolism, appetite regulation and hormonal balance including: anti-inflammatory
drugs or steroids, antibiotics, androgens, phenytoin, erythromycin or thyroid
hormones.
• Involved in current research or have recently been involved in any research or donated
blood prior to recruitment in the past 12 weeks.

53
2.3 Sample Size:
Chapter 3:
The total sample size for the three separate studies was estimated using data from (Chambers
et al., 2018). This preliminary study identified that resting energy expenditure was raised by
0.045 ± 0.068 kcal/min (mean ± SD) over 180 min following sodium propionate
supplementation. A power calculation confirmed that 20 participants would be adequate to
detect the same difference (α=0.05, power=0.80).
Chapter 4:
The total sample size for the three separate studies was estimated using data
from (Chambers et al., 2018). This preliminary study identified that mean Nausea VAS was
raised from 5 ± 9 mm (mean ± SD) to 9 ± 9 mm over 180 min following sodium propionate
supplementation. A power calculation confirmed that 17 participants would be adequate to
detect the same difference (effect size= 0.75, α=0.05, power=0.80).
Chapter 5:
Data from (Chambers et al., 2015) identified a HOMA-IR of 2.0 ± 0.3 (mean ± SD) in 25
healthy adults. A power calculation confirmed that 20 participants would be adequate to
detect a 10% change in HOMA-IR (1.8 ± 0.3) following sodium propionate
supplementation (effect size= 0.67, α=0.05, power=0.80).
Based on the above information from the separate power calculations 20 volunteers would
be needed. 25 participants were recruited to each study to allow a drop-out rate of 20%.

54
2.4 Randomization:
Randomization was done via an internet- based randomization service (sealedenvelope.com).
Both the participants and the researchers were blinded to the type of tablets ingested on
each study visit.
2.5 Supplements:
Sodium propionate tablets (6845 mg) were used as the intervention product whereas sodium
chloride tablets (4164 mg) were used as a sodium control. This dose was chosen since it was
previously shown that peripheral concentrations of propionate can significantly be increased
after 180 minutes using this strategy (Figure 2-1) (Chambers et al., 2018). The tablets were
prepared by Quay Pharma (UK) and have passed the Ph Eur disintegration for gastro-resistant
tablets (less than 10% of the tablet dissociates in 0.1 M HCl after 120 minutes and completely
disintegrates in a pH 6.8 phosphate buffer solution within 60 minutes). The tablet’s enteric
coating (Acryl-EZE, Colorcon, UK) contributed 11% of the overall tablet weight (ColorCon,
2019). Components of the tablets can be found in Table 2-1.
Figure 2-1: Peripheral propionate levels

55
The acute effect of oral sodium propionate supplementation on propionate levels in peripheral blood. A.
Propionate (Time×Trial: P= 0.043) and B. Propionate iAUC (P=0.021) (Chambers et al., 2018).
Table 2-1: Sodium and Propionate Tablets Composition
Amount (mg)
Component Control Propionate
Sodium Propionate 684.5
Sodium Chloride 416.4
Kollidon K90 6.9
Avicel pH 102 523.6 248.6
Magnesium Stearate 10 10
Kollidon VA64 50 50
Total 1000 1000
2.6 Study Visits Design:
2.6.1 Prior Study Visits Requirements:
On the day before each study visit, participants were asked to avoid alcohol and strenuous
exercise and to consume a standardized evening meal (ready-prepared or shop-prepared
meal) of their choice before an overnight fast for ³ 6 hours (water was allowed). These
measures were taken to promote consistency between visits. Female participants were asked
to complete the two study visits <7 days apart during the early phase of the menstrual cycle

56
days (1-7 days) to avoid any possible effect of the menstrual cycle on energy metabolism
(Solomon et al., 1982).
2.6.2 Study Visit Protocol:
For the first 180 min of the study visit, all three separate trials (fasting, exercise and post-
prandial) commenced as follows.
Participants were asked to arrive to the NIHR Imperial CRF at 9:00 a.m. Compliance of the
prior study visit requirements was first assessed via participants’ oral confirmation and by the
nutritional packaging and receipt of purchase of the evening meal. The volunteers were then
asked to void their bladder and urine was afterwards collected for the remainder of the visit
to provide an estimate of protein oxidation from urea concentration (Frayn, 1983). Body
weight (to the nearest 0.1 kg) and composition as well as resting energy expenditure were
measured using the bioelectrical impedance analysis (BC-418 Segmental Body Composition
Analyzer, Tanita UK Ltd, Middlesex,UK).
A cannula was then inserted into the volunteers’ antecubital vein and two fasting baseline
blood samples (8 ml each) ³ 5 minutes apart were collected. Further 8 ml blood samples were
taken at 60, 120 and 180 minutes. Of note, to ensure the cannula remains functional for the
duration of the study, a saline flush was used after each cannula use. Thus, prior to each blood
sample collection, a 2 ml blood sample was taken and discarded to ensure a fresh blood
sample was collected each time. Participants were given 1369 mg sodium propionate or 833
mg sodium chloride tablets every 30 minutes for the first 120 minutes of the study at 0, 30,
60, 90 and 120 minutes. The total amount of sodium propionate ingested over the study visit
was 6845mg (71mmol). Mean arterial pressure (MAP) and heart rate (HR) measurements
were also collected at baseline and at 60, 120 and 180 min (SureSigns VM4, Phillips, USA).
Participants also completed visual analogue scales (VAS) at baseline, 30, 60, 90, 120, 150 and
180 min that asked the following three questions: “How hungry do you feel right now?” and
“How thirsty do you feel right now?” and “How sick do you feel right now?”.

57
2.6.2.1.1 Overnight Fasted Study Protocol:
The Fasting study visit protocol is depicted in Figure 2-2: Overnight fasted Study Protocol.
Each study visit extended over 360 minutes. All participants completed the two study visits ³
2 days apart. The mean ± SD (range) period between these study visits was 5±3 (3-14) days.
Figure 2-2: Overnight fasted Study Protocol Sodium propionate or sodium chloride tablets were administered every 30 min for the first 120 min of the study.
Energy expenditure and substrate oxidation measurements were assessed in the last 15 min of every hour of
the study using indirect calorimetry. Blood samples, HR and MAP were assessed hourly. VAS were filled every
30 min of the study.
Energy expenditure and substrate oxidation were measured using an indirect calorimeter
(Gas Exchange Monitor, GEM, GEMNutrition, Daresbury,UK) for 15 minutes at baseline (-15-
0 min) and in the last 15 minutes of every hour of the study (45-60 min; 105-120 min; 165-
180 min; 225-240 min; 285-300; 345-360 min). The calorimeter was calibrated with “zero”
(0.00% O2 and 0.00% CO2) and “span” (20.00% O2, 1.00% CO2) gases (BOC Gases, U.K.) upon
participant’s arrival. During measurements, the participants lay fully supine under the
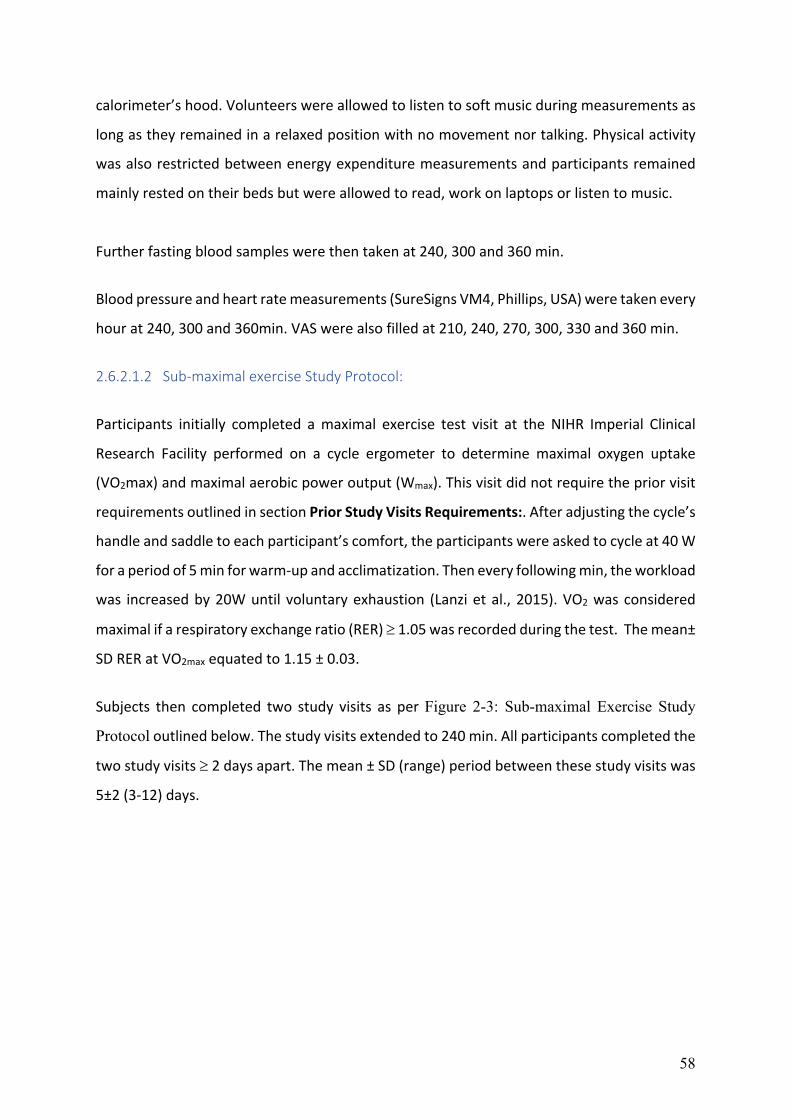
58
calorimeter’s hood. Volunteers were allowed to listen to soft music during measurements as
long as they remained in a relaxed position with no movement nor talking. Physical activity
was also restricted between energy expenditure measurements and participants remained
mainly rested on their beds but were allowed to read, work on laptops or listen to music.
Further fasting blood samples were then taken at 240, 300 and 360 min.
Blood pressure and heart rate measurements (SureSigns VM4, Phillips, USA) were taken every
hour at 240, 300 and 360min. VAS were also filled at 210, 240, 270, 300, 330 and 360 min.
2.6.2.1.2 Sub-maximal exercise Study Protocol:
Participants initially completed a maximal exercise test visit at the NIHR Imperial Clinical
Research Facility performed on a cycle ergometer to determine maximal oxygen uptake
(VO2max) and maximal aerobic power output (Wmax). This visit did not require the prior visit
requirements outlined in section Prior Study Visits Requirements:. After adjusting the cycle’s
handle and saddle to each participant’s comfort, the participants were asked to cycle at 40 W
for a period of 5 min for warm-up and acclimatization. Then every following min, the workload
was increased by 20W until voluntary exhaustion (Lanzi et al., 2015). VO2 was considered
maximal if a respiratory exchange ratio (RER) ³ 1.05 was recorded during the test. The mean±
SD RER at VO2max equated to 1.15 ± 0.03.
Subjects then completed two study visits as per Figure 2-3: Sub-maximal Exercise Study
Protocol outlined below. The study visits extended to 240 min. All participants completed the
two study visits ³ 2 days apart. The mean ± SD (range) period between these study visits was
5±2 (3-12) days.

59
Figure 2-3: Sub-maximal Exercise Study Protocol Sodium propionate or sodium chloride tablets were administered every 60 min for the first 120 min of the study.
Energy expenditure and substrate oxidation measurements were assessed in the last 15 min of every hour of
the study and for 60 min during exercise using indirect calorimetry. MAP was measured hourly. Blood HR and
MAP were assessed hourly for a period of 180 min and every 15 min in the final hour of the study during exercise.
Indirect calorimetry (Quark CPET) was used to measure energy expenditure and substrate
oxidation. The calorimeter was calibrated with Cosmed calibration compressed gas, N.O.S (5%
CO2, 16% O2, BAL. N2) upon participant’s arrival. Flow rate via the bi-directional turbine was
also calibrated using a 3-litre calibration syringe. Resting energy expenditure measurements
were taken at baseline (-15-0 min) and at (45-60 min; 105-120 min; 165-180 min). Energy
expenditure was then measured for a period of one hour at time-point 180 min while
participants were cycling on a cycle ergometer at 30% Wmax (equivalent to~40%VO2max)
(Arts and Kuipers, 1994) determined from their maximal exercise test visit. This low to
moderate level intensity was used in order to confirm that both carbohydrate and lipid were
being oxidized for energy expenditure (Fletcher et al., 2017).

60
Blood samples were collected during exercise at 195, 210,225 and 240 min.
MAP (SureSigns VM4, Phillips, USA) was taken after cycling at 240 min. HR (SureSigns VM4,
Phillips, USA) was recorded at 195-, 210-, 225- and 240-min. VAS were also filled at 210 and
240 min.
2.6.2.1.3 Post-Prandial Study Protocol:
The post-prandial study visit protocol is depicted in the below Figure 2-4: Post-prandial Study
Protocol. Each study visit extended over 300 minutes. All participants completed the two study
visits ³ 2 days apart. The mean ± SD (range) period between these study visits was 6 ±2 (3-7)
days.
Figure 2-4: Post-prandial Study Protocol Sodium propionate or sodium chloride tablets were administered every 30 min for the first 120 min of the study.
Energy expenditure and substrate oxidation measurements were assessed in the last 15 min of every hour of
the study using indirect calorimetry. HR and MAP were assessed hourly. VAS were filled every 30 min of the

61
study. An Ensure drink was administered at time-point 180 min. Blood samples were taken hourly for the first
180 min of trial and were then taken at 195, 210,240 and 300 min.
Energy expenditure and substrate oxidation were measured using GEM as described for the
fasting study. Measurements were taken at baseline (-15-0 min) and in the last 15 minutes of
every hour of the study (45-60 min; 105-120 min; 165-180 min; 225-240 min; 285-300 min).
At timepoint 180 min, a mixed calorie liquid meal (Ensure Original Vanilla Nutrition Shake:
72.7 g carbohydrate, 13.6 g fat and 20.5 g protein; 500 kcal) was provided. Postprandial blood
samples were then taken at 195, 210,240 and 300 min.
MAP and HR measurements (SureSigns VM4, Phillips, USA) were taken every hour at 240- and
300-min. VAS were also filled at 210, 240, 270 and 300 min.
2.7 Energy Expenditure and Substrate Oxidation Measurement:
Energy expenditure and substrate oxidation were estimated based on oxygen consumption
(VO2) and carbon dioxide production (VCO2). Energy expenditure was calculated based on the
modified Weir equation (Weir, 1949):
EE (kcal/day) = ([VO2 × 3.941] + [VCO2 × 1.11]) ×1440
Carbohydrate and lipid oxidation rates were calculated from stochiometric equations of
glucose and triacylglycerol oxidation respectively. As for protein oxidation rates, empirical
values were used and are based on urinary nitrogen excretion (uN2)since most uN2 (>80%) is
in the form of urea (Frayn, 1983). The following equations were thus used:
CHO (g/min) = (4.55* VCO2) -(3.21*VO2) -(2.87* uN2)
Lipid (g/min) = (1.67* VO2) -(1.67* VCO2) -(1.92* uN2)
Protein (g/min) = uN2 * 6.25

62
2.8 Homeostasis Model Assessment (HOMA):
HOMA, a measure for quantifying insulin resistance and β-cell function, was calculated based
on fasting plasma glucose and insulin values according to the following equation (Gutch et al.,
2015):
HOMA= Fasting Insulin (IU/ml) x Fasting Glucose(mmol/l) / 22.5
where 22.5 is a normalizing factor obtained from the product of normal fasting plasma insulin
of 5 IU/ml and normal fasting plasma glucose of 4.5mmol/l of an “ideal and normal”
individual.
2.9 Matsuda Index:
In the postprandial study, the Matsuda Index (ISIMatsuda) for measurement of postprandial
insulin sensitivity was calculated as follows (Patarrão et al., 2014):
ISIMatsuda= !","""
$(&'×)'×&*+,-×)*+,-)
10,000: Simplifying constant to get numbers from 0 to 12;
√ : Correction of the nonlinear values distribution;
G0 – fasting plasma glucose concentration (mg/dl);
I0 – fasting plasma insulin concentration (mIU/l);
Gmean – mean plasma glucose concentration (mg/dl);
Imean – mean plasma insulin concentration (mIU/l);

63
2.10 Oral Disposition Index:
In the postprandial study, the oral disposition index (ODI) for measurement of postprandial
insulin sensitivity was calculated as follows (Utzschneider et al., 2009) :
Oral disposition index = (DI0 –120/D G0 –120) x (1/fasting insulin)
2.11 Visual Analogue Scales (VAS):
Visual Analogue Scales were composed of three questions: “How hungry do you feel right
now?” and “How thirsty do you feel right now?” and “How sick do you feel right now?”.
Subjects were asked to mark their answers for each question with vertical lines on 100 mm
horizontal straight lines that had the following words anchored at each end “Not at all” and
“Extremely”, corresponding to 0 mm and 100 mm respectively. Measurements were then
computed by measuring the distance from the left end of the line up to the mark.
2.12 Samples Collection and Analysis:
2.12.1 Blood samples:
A total of 8 ml of venous blood sample was collected at each time-point. 5 ml were collected
for serum (SST Vacutainer tube); 2 ml for gut hormones (Lithium Heparin tube: 20 μl aprotinin
(Trasylol, Nordic Pharma) per 1 ml blood was added to the tube prior to sample collection.
Aprotinin is a pancreatic trypsin inhibitor that was used to prevent degradation of the gut
hormones) and 1 ml for glucose (Grey Vacutainer). Serum was left to clot for 10 minutes
before processing. All other samples were put on ice immediately upon collection prior to
processing. Samples were then centrifuged at 2,500 relative centrifugal force (RCF) at 4°C for
10 min. The resulting supernatant was then aliquoted into eppendorfs and stored in -20°C
freezers until further processing.
1.1.1.1 Glucose Analysis:
Glucose was analysed using the Randox Glucose (GLUC/PAP) kits supplied by Randox as per
the manufacturer’s instructions at Imperial College London Hammersmith Campus. Samples

64
were done in duplicates to ensure better accuracy. The principle behind this analysis relies on
the oxidation of glucose via glucose oxidase. The resulting hydrogen peroxide reacts with
phenol and 4-aminophenazone to form a red - violet quinoneimine dye that can be detected
via a spectrometer.
Microsoft Excel Version 16.30 was used to calculate the unknown glucose levels in
participants’ samples.
The coefficient of variation (CV), a statistical measure of the dispersion of the data around
the mean, was calculated for all three studies. A CV £ 10% was considered acceptable (Sacks
et al., 2002, Pleus et al., 2019). If the CV of the samples was outside this range, the samples
were either repeated. The mean CV in duplicates for the three trials was £ 10%: Fasting Study:
6.2%; Post-prandial study: 4.6%; and Exercise study: 5.5%. The CV of the trials was calculated
from the average CV of all the assays performed in each study.
1.1.1.2 Radioimmunoassay:
A radioimmunoassay (RIA) is a sensitive and specific in vitro assay that can measure substance
concentrations, often antigens, through the use of antibodies.
In an RIA, a known concentration of antigens are radiolabelled, often via gamma-
radioactive isotopes of iodine, such as 125-I, attached to tyrosine. The radiolabelled antigens
are then incubated with a constant dilution of anti-serum, thereby a specific number of
antigens will be bound to the available antibody sites. When unlabelled antigens are added
to the system, from a human serum sample for instance, they will compete with the labelled
antigens for the antibody sites. Hence, as the concentration of the unlabelled antigen
increases, the amount of bound tracer antigens will accordingly decrease. The amount of
tracer can then be determined via a gamma counter after centrifuging and separating the
antibody bound antigens from the free tracers and counting either one or both fractions. A
standard curve is also set up with increasing concentrations of standard unlabelled antigen
and through interpolation, the amount of antigen in unknown samples can be determined.

65
Thus, the 4 basic requirements for an RIA include an antiserum to the unknown antigen to be
measured; a radioactive form of the antigen; a method to separate the antibody bound tracer
from the unbound tracer; and finally, an available equipment to measure radioactivity.
2.12.1.1.1 Insulin Analysis:
The insulin RIA was carried out at Imperial College London Hammersmith Campus using
Millipore Human Insulin Specific RIA kit (HI-14K) (Millipore Corporation, Billerica, USA). This
assay measures ‘true’ insulin levels since it does not cross-react with Human Proinsulin
(<0.2%). Moreover, it utilizes 125I-labeled Human Insulin and a Human Insulin antiserum to
determine the level of Insulin in serum. The assay was performed according to the
manufacturer’s specifications and guidelines.
Gamma counter (LB2111 Multy Crystal Gamma Counter, Berthhold Technologies, Bad
Wildbad, Germany) was used for counting in this assay. Microsoft Excel Version 16.30 was
used to calculate the unknown insulin levels in participants’ samples.
If the CV% between the duplicate samples was >10%, the samples were either repeated or
great caution was taken in selecting the appropriate value. Indeed, a CV <10% is often
considered an acceptable value for insulin RIA (Besch et al., 1987, Deberg et al., 1998, Rasmi
et al., 2014).
The mean intra assay CV’s for the current three trials was <10%: Fasting Study: 7.9%; Post-
prandial study: 3.9%; and Exercise study: 1.0%.
2.12.1.1.2 GLP-1 Analysis:
GLP-1 was measured using a previously established in house specific and sensitive RIA
(Kreymann et al., 1987). The antibody used does not cross-react with other gut hormones
such as glucagon or GIP or pancreatic peptides.

66
GLP-1 was counted using Gamma counter (LB2111 Multy Crystal Gamma Counter, Berthhold
Technologies, Bad Wildbad, Germany). Microsoft Excel Version 16.30 was used to calculate
the unknown GLP-1 levels in participants’ samples.
If the CV% between the duplicate samples was >10%, the samples were either repeated or
caution was taken in selecting the appropriate value. Indeed, a CV% < 10% is often considered
an acceptable range for GLP-1 RIA (Näslund et al., 1999, Roberts et al., 2011) The mean intra-
assay CV of the post-prandial trial was 6%.
2.12.2 NMR Analysis:
2.12.2.1.1 Sample Preparation:
Serum samples were thawed, vortexed and remained at room temperature for 10 minutes.
Samples were then centrifuged at 18,000 g at 4°C for 10 min. A 300-μL aliquot of the
supernatant was mixed with 300 μL of 75 mM Na2HPO4 buffer (pH 7.4, LC-MS water/D2O
(80:20)), 2 mM sodium azide and 0.08% w/v of TSP (3-trimethylsilyl-[2,2,3,3,-2H4]-propionic
acid sodium salt).
2.12.2.1.2 1H-NMR spectroscopy:
Water-suppressed 1H NMR spectroscopy was performed at 310 K on a Bruker 600 MHz
Avance III HD spectrometer equipped with a 5-mm BBI Z-gradient probe and automated
tuning and matching (Bruker Biospin, Karlsruhe, Germany). The 1D 1H NMR spectra were
acquired using standard one-dimensional (1D) pulse sequence, with saturation of the water
resonance (noesygppr1d, standard Bruker pulse program) during both the relaxation delay
(RD = 4s) and mixing time (tm = 10ms). The two magnetic field z-gradients implemented by
this pulse sequence are applied for 1 ms, and the receiver gain was set to 90.5 and acquisition
time (ACQ) to 2.73s for all experiments. Each 1D 1H NMR spectrum was acquired using 4
dummy scans, 32 scans, 64K time domain points and with a spectral window of 20 ppm.

67
Following the acquisition of the 1D NOESY-presat, 1D CPMG with water suppression was
acquired using the Carr–Purcell–Meiboom–Gill pulse sequence (cpmgpr1d). The acquisition
parameters are set up in the same way as the 1D NOESY-presat, with the addition of the spin-
echo delay (D1/D2) that is set at 0.3 ms and the implementation of 128 loops for T2 filter (L4).
Prior to Fourier transformation of 1D experiments, free induction decays were multiplied by
an exponential function corresponding to a line broadening of 0.3 Hz (Dona et al., 2014).
2.13 Statistics:
2.13.1 Data analysis:
Participants in all three studies were excluded from data analysis if the coefficient of variation
(CV) of their baseline REE from the two study visits was >10%. In healthy adult humans, under
standard conditions following a 12 hour fast and abstinence from exercise, within subject REE
CV is approximately 3-8% (Donahoo et al., 2004). A CV >10%has been shown to be an indicator
of within machine variability or participants’ failure to comply with study protocol such as an
overnight fast and avoidance of strenuous physical activity (Adriaens et al., 2003).
The mean ± SEM (range) within-subject CV of baseline REE for the fasting trial (n=19) was 4.6
± 0.5 (0.8-8.4) %; Post-prandial trial (n=20):3.5 ±3.1 (0.1-11.8) %; Exercise trial (n=19): 3.4 ±
0.6 (0.1-8.6) %.
For energy expenditure and substrate oxidation measurements, the first 5 minutes of every
energy expenditure measurement, were discarded and the remaining 10 minutes were used
to calculate energy expenditure and substrate oxidation rates, in order to allow for subject
habituation to the testing procedure. During the one-hour exercise energy expenditure
measurement, the first 15 minutes were discarded to allow participants to reach a steady-
state. Data was then analysed from 195-210 min, 210-225 min and 225-240 min to compute
changes over time during exercise.

68
The incremental area under the curve (iAUC) and the positive incremental area under the
curve (+iAUC) were calculated using the trapezoid rule while considering the area above
baseline for +iAUC. Normality was checked using the Shapiro-Wilk test and based on the
normality distribution, iAUC and +iAUC were analysed with either parametric t-tests or non-
parametric Wilcoxon signed rank tests. GraphPad Prison Version 8 was used for this analysis.
Repeated measures ANOVA was used to analyse time-course data using time and trial as
within subject variables. Post hoc Fishers LSD tests were then used when a significant
interaction (Trial x Time) was identified. IBM SPSS Statistics version 24 for Windows was
utilized for this statistical analysis. Data is presented as means ± standard error of mean (SEM)
unless stated otherwise and p<0.05 is considered significant. For baseline measures, the
average of the two baseline values was used during analysis. In cases of missing time-points,
the corresponding values from the other trial were used.
Normality for baseline measurements across the propionate and control visits was checked
using the Shapiro-Wilk test and based on the normality distribution, baseline values were
analysed with either parametric t-tests or non-parametric Wilcoxon signed rank tests. P<0.05
is considered significant.
2.13.2 NMR Spectral data analysis:
The multivariate data analysis was performed on the 1D 1H CPMG spectra. Each spectrum
(~21K spectral variables) was automatically phased and baseline corrected and then digitized
over the range δ -0.5 to 11 and imported into MATLAB (2014a, MathWorks, Natick, U.S.A.).
The spectral regions corresponding to the internal standard (δ -0.5 to 0.7), water (δ 4.3 to 5.2)
and noise (δ 8.5 to 11.00) were excluded. The spectra of plasma were referenced to the
doublet of the anomeric proton signal of a-glucose at δ 5.23 ppm. Prior to multivariate data
analysis, the spectra from both data sets were normalized using the probabilistic quotient
method (Dieterle et al., 2006).
The data set was auto-scaled and modelled using Partial Least Squares Discriminant Analysis
(PLS-DA) in a Monte-Carlo Cross-Validation (MCCV) framework using repeated measures (RM)
design. Storey-Tibshirani method was used for correction of multiple testing; variables with q

69
< 0.05 were considered as significant (Posma et al., 2018). The goodness of fit (R2Y) and the
goodness of prediction (Q2Y) were calculated using the training and the test data,
respectively.
2.13.2.1.1 Identification of Metabolites:
Subset optimization by reference matching (STORM) was used to identify metabolites using
the correlation structure of the 1D 1H CPMG data set (Posma et al., 2012). Internal and
external databases such as the Human Metabolome Data Base (HMDB; http://hmdb.ca/) or
the Biological Magnetic Resonance Data Bank (BMRB; http://www.bmrb.wisc.edu) were used
for confirmation of assignments.
2.14 Participant’s Characteristics:
2.14.1 Overnight Fasted Study:
31 participants were screened for eligibility. Of those, 5 were ineligible and 1 dropped out
before the start of the trial. The remaining 25 participants were fully eligible and commenced
with the trial. Three participants failed to attend both study visits. One other participant
dropped out due to failure in cannula insertion after several attempts. 21 participants thus
completed the two study visits. Of those, 2 participants were excluded from analysis since
their CV of their baseline REE from the two study visits was >10%. Thus, data was analysed
from the remaining 19 participants.
The following table represents participants’ (n=19) characteristics at screening:
Table 2-2: Overnight Fasted Study Participant Characteristics
Variable Value
Male n (%) 11 (57.9)
Age (y) 34.6 ± 4.1
Weight (kg) 67.0 ± 3.4

70
BMI (kg/m2) 23.1 ± 0.7
Body Fat (%) 20.6 ± 1.8
*Values are presented as n (%) or means ± SEMs.
The following table represents baseline values of measurements in the Control and
Propionate trials (n=19):
Table 2-3: Overnight Fasted Study Participant Baseline Values
Control Propionate P-value
Body Weight
(kg)
68.0 ± 2.6 67.6 ± 2.7 0.4
REE (kcal/min) 1.012 ± 0.035 1.021 ± 0.039 0.610
RER (VCO2/VO2) 0.882 ± 0.019 0.870 ± 0.018 0.221
Lipid Oxidation
(g/min)
0.024 ± 0.007 0.029 ± 0.006 0.203
Carbohydrate Oxidation
(g/min)
0.145 ± 0.020 0.136 ± 0.019 0.153
Heart Rate
(bpm)
63.8 ± 1.955 65 ± 2.3 0.524
Mean Arterial Pressure
(mmHg)
76.9 ± 2.6 74.3 ± 2.4 0.033*
Glucose
(mmol/L)
4.41 ± 0.12 4.28 ± 0.09 0.062
Insulin
(µU/mL)
10.20 ± 0.86 9.41 ± 1.02 0.182
Hunger VAS
(mm)
31.2 ± 25.1 32 ± 25.0 0.868

71
Thirst VAS
(mm)
27.2 ± 25.8 21.5 ± 25.2 0.148
Nausea VAS
(mm)
4.7 ± 9.1 6 ± 14.2 0.688
All data are expressed as mean ± SEM. Normality was checked using the Shapiro-Wilk test and based
on the normality distribution, baseline values were analysed with either parametric t-tests or non-
parametric Wilcoxon signed rank tests. *p<0.05 was considered significant. Abbreviations: REE:
resting energy expenditure; RER: respiratory exchange ratio.
2.14.2 Sub-maximal exercise Study:
30 participants were screened. Of those, two were ineligible and three withdrew from the
study after completion of visit one. 25 volunteers completed the three study visits. Six
volunteers were excluded during analysis as 4 had a CV>10% of the baseline REE between the
study visits and two had measurement errors during visits.
The following table represents participants’ (n=19) characteristics at screening:
Table 2-4: Sub-maximal Study Participant Characteristics
Variable Value
Male n (%) 14 (73.7)
Age (y) 42.7 ± 3.5
Weight (kg) 73.2 ± 3.3
BMI (kg/m2) 24.5 ± 0.7
Body Fat (%) 21.8 ± 1.5#
*Values are presented as n (%) or means ± SEMs.
#: This was calculated from n=18 since body fat (%) data collection from one volunteer was missed.
Table 2-5: Sub-maximal Study Participant Baseline Values

72
Control Propionate P-value
Body Weight
(kg)
72.5 ± 2.9 72.5 ± 2.9 0.9
REE (kcal/min) 1.224 ± 0.050 1.248 ± 0.047 0.129
RER (VCO2/VO2) 0.824 ± 0.015 0.827 ± 0.012 0.798
Lipid Oxidation
(g/min)
0.054 ± 0.007 0.051 ± 0.006 0.671
Carbohydrate Oxidation
(g/min)
0.103 ± 0.018 0.112 ± 0.017 0.768
Heart Rate
(bpm)
63.1 ± 4.2 63.4 ± 3.9 0.602
Mean Arterial Pressure
(mmHg)
80.9 ± 1.1 78.6 ± 1.1
0.164
Glucose
(mmol/L)
4.5 ± 0.1
4.6 ± 0.1
0.561
Insulin
(µU/mL)
6.1 ± 0.6
6.8 ± 0.8
0.353
Hunger VAS
(mm)
31.2 ± 25.1 43.6 ± 6.4 0.649
Thirst VAS
(mm)
29 ± 5.8 35.8 ± 5.7 0.198
Nausea VAS
(mm)
2.8 ± 1.4 3.4 ± 2.0
0.844
All data are expressed as mean ± SEM. Normality was checked using the Shapiro-Wilk test and based
on the normality distribution, baseline values were analysed with either parametric t-tests or non-
parametric Wilcoxon signed rank tests. *p<0.05 was considered significant. Abbreviations: REE:
resting energy expenditure; RER: respiratory exchange ratio.

73
2.14.3 Post-Prandial Study:
27 volunteers were assessed for eligibility. 26 were deemed eligible. However, one participant
dropped out before the first study visit due to time conflicts. Of the remaining participants,
one volunteer dropped out during second study visit due to illness. Thus, 24 volunteers
completed the two study visits. Data was analysed from 20 volunteers, as one was excluded
from analysis due to having a CV >10% of the baseline REE from the two study visits, three
had technical errors during visits such as calorimeter or cannula failure.
The following table represents participants’ (n=20) characteristics at screening:
Table 2-6: Post-prandial Study Participant Characteristics
Variable Value
Male n (%) 12 (60.0)
Age (y) 45.0 ± 3.5
Weight (kg) 71.7 ± 2.9
BMI (kg/m2) 24.8 ± 0.8
Body Fat (%) 24.2 ± 1.7
*Values are presented as n (%) or means ± SEMs.
Table 2-7: Post-prandial Study Participant Baseline Values
Control Propionate P-value
Body Weight
(kg)
71.6 ± 2.9 70.8 ± 2.9 0.3
REE (kcal/min) 1.019 ± 0.046 1.011 ± 0.046 0.572
RER (VCO2/VO2) 0.867 ± 0.015 0.882 ± 0.015 0.354
Lipid Oxidation
(g/min)
0.030 ± 0.005 0.025 ± 0.006 0.409
Carbohydrate Oxidation
(g/min)
0.132 ± 0.016 0.141 ± 0.015 0.946

74
Heart Rate
(bpm)
64.6 ± 2.6 67.9 ± 2.7 0.006 *
Mean Arterial Pressure
(mmHg)
82.6 ± 2.0 84.3±2.0 0.222
Glucose
(mmol/L)
4.62 ± 0.10 4.72 ± 0.10 0.220
Insulin
(µU/mL)
10.1 ± 1.1 10.5 ± 0.9 0.368
GLP-1 (pmol/L) 65.8 ± 8.4 57.1 ± 6.3 0.177
Hunger VAS
(mm)
36.3 ± 5.6 31.6 ± 6.4 0.475
Thirst VAS
(mm)
18.7 ± 4.4 19.8 ± 4.8 0.558
Nausea VAS
(mm)
3.4 ± 1.4 3.1 ± 2.2 0.171
All data are expressed as mean ± SEM. Normality was checked using the Shapiro-Wilk test and based
on the normality distribution, baseline values were analysed with either parametric t-tests or non-
parametric Wilcoxon signed rank tests. *p<0.05 was considered significant. Abbreviations: GLP-1:
glucagon like peptide 1; REE: resting energy expenditure; RER: respiratory exchange ratio.

75
Chapter 3: Energy Expenditure and Substrate Oxidation
3.1 Abstract:
Background:
Earlier work in humans have demonstrated that acute ingestion of 71 mmol of sodium
propionate can increase energy expenditure and lipid oxidation in healthy human volunteers
over period of 180 min after an overnight fast. However, what is yet unknown is whether
these effects are sustained under different physiological states. Therefore, the aim of the
present trial is to investigate the effect of oral sodium propionate supplementation on energy
expenditure and substrate oxidation in all three energy states (overnight fasted, sub-maximal
exercise and post-prandial) and whether any effect is maintained over longer (>180 min) time
periods.
Methodology:
The trial consisted of three separate studies:
Overnight fasted study: 19 volunteers (11 males and 8 females; age: 34.6 ± 4.1 years; BMI
(body mass index): 23.1 ± 0.7 kg/m2) completed the two study visits after an overnight fast.
Sub-maximal exercise study: 19 volunteers (14 males and 5 females; age: 42.7 ± 3.5 years;
BMI: 24.5 ± 0.7 kg/m2) completed a maximal exercise test visit and two study visits.
Post-prandial study: 19 volunteers (12 males and 7 females; age: 45.0 ± 3.5 years; BMI: 24.8
± 0.8 kg/m2) completed two study visits.
Each of these studies was a randomized controlled double-blind cross-over study. In each
study, following an overnight fast, tablets containing either 6845mg sodium propionate or
4164mg sodium chloride (Control) were first administered over 180 min.

76
Overnight Fasted study: The study extended over a total period of 360 min while volunteers
remained fasted for the duration of the study.
Sub-maximal exercise study: The study extended over a total period of 240 min. At time-
point 180 min, exercise was introduced where participants started cycling on a cycle
ergometer at 40% of VO2 max determined from their maximal exercise test visit for a period of
one hour.
Post-prandial study: The study extended over a total period of 300 min. At time-point 180
min, a mixed calorie liquid meal (Ensure Original Vanilla Nutrition Shake: 72.7 g carbohydrate,
13.6 g fat and 20.5 g protein; 500 kcal) was provided to volunteers.
Energy expenditure and substrate oxidation were measured throughout these visits using
indirect calorimetry. Heart rate (HR) and mean arterial pressure (MAP), as measures of
sympathetic nervous system (SNS) activity, were also recorded.
Results:
Overnight fasted study:
Oral sodium propionate supplementation increased energy expenditure (EE) (Control
=1.013± 0.034kcal/min; Propionate= 1.040 ± 0.039kcal/min; Effect of trial p=0.024) and lipid
oxidation (Control 0.126 ± 0.019 g/min vs 0.110 ± 0.019 g/min respectively; Effect of trial
p=0.039) and decreased carbohydrate (CHO) oxidation (Control= 0.032± 0.007g/min;
Propionate = 0.042 ± 0.007g/min; Effect of trial p=0.009) after an overnight fast over a period
of 360 min. Sodium propionate supplementation increased HR (Control= 62.1± 1.7 bpm;
Propionate= 64.9± 2.0 bpm; Effect of trial: p=0.030) over 360 min. MAP was also increased
with propionate supplementation during the last 180 min of the trial (iAUC180-360 min p=0.041).

77
Sub-maximal exercise study:
Oral sodium propionate supplementation increased lipid oxidation at 180 min (Control= 0.062
± 0.007; Propionate= 0.078 ± 0.007; time x trial p=0.023) and decreased CHO oxidation at 120
min (Control= 0.092 ± 0.022; Propionate= 0.050 ± 0.017; time x trial p=0.041) in the overnight
fasted state with no effect on EE (Effect of trial: p=0.756), HR (Effect of trial: p=0.918)and MAP
(Effect of trial: p= 0.092). During sub-maximal exercise (Control: 48 ± 2 % ; Propionate: 47 ±
2% VO2max), propionate supplementation had no effect on EE (Effect of trial: p= 0.537), lipid
oxidation (Effect of trial: p=0.893), CHO oxidation (Effect of trial: p=0.762) and markers of
sympathetic nervous system activity (HR: Effect of trial: p=0.979; MAP: Effect of trial:
p=0.883).
Post-prandial study:
Oral sodium propionate supplementation increased EE (+iAUC0-300 min p=0.023), lipid oxidation
(+iAUC0-300 p=0.036) and HR (Control: 66.1bpm ± 2.4; Propionate: 68.6± 2.3 bpm; Effect of
trial: p=0.029) over of the 300 min study period. Changes in lipid oxidation were exclusively
observed during the initial 180 min overnight fasted state (+iAUC0-180 p= 0.036), whereas
changes in EE were observed post-prandially (iAUC180-300 min p=0.003 and +iAUC180-300 min
p=0.003).
Conclusion:
This was the first trial in humans to examine the acute ingestion of oral sodium propionate
(71 mmol) in healthy human volunteers in three separate energy states (overnight fasted,
sub-maximal exercise and post-prandial). Findings revealed that in the overnight fasted state,
propionate supplementation can increase energy expenditure and lipid oxidation and
decrease CHO oxidation which was allied to differences in SNS activity. Sodium propionate
also raised EE in the post-prandial state with no preferred use of a substrate. However, acute
oral sodium propionate ingestion had no effect on EE and substrate oxidation during sub-
maximal exercise. Future follow-on studies should use a 24-h respiratory chamber and a
continuous measurement of SNS activity to assess the full effect of oral sodium propionate
supplementation on energy expenditure and substrate oxidation. Furthermore, future studies

78
are warranted to determine whether the acute effects of oral sodium propionate on energy
metabolism are sustained following chronic supplementation.
3.2 Energy Expenditure: Definition and Measurement Tools
Total energy expenditure (TEE) is composed of three main components: basal metabolic rate
(BMR) or resting energy expenditure (REE), diet-induced thermogenesis (DIT) and physical
activity energy expenditure (PEE). BMR/REE comprise the majority of energy needs (60-80%)
and are often used interchangeably in the literature and clinical practice. BMR can be defined
as the minimum amount of energy required to maintain homeostatic processes such as
respiration and body temperature maintenance and must be measured under strict
conditions, such as, in a complete resting posture, post a >12-hour overnight fast, 24 hours
after exercise and with minimal lighting. REE, reflects energy needs at the time of
measurement (~10% higher than BMR).Fewer restrictions apply during REE measurements
where the subject may be in a supine or sitting position and measurements can be recorded
in post-prandial conditions (Gupta et al., 2017, Psota and Chen, 2013). DIT accounts for 8-12%
of TEE and can be defined as the rise in EE associated with meal ingestion and metabolism of
the food and is mainly affected by meal composition and energy content of the ingested food
(Psota and Chen, 2013).Finally, PEE is the energy expended during physical activity and is the
most variable component of TEE ranging from 10-30%, depending on the physical activity
status of the individual (Johnson and McKenzie, 2001, Psota and Chen, 2013).
Several methods exist to measure energy expenditure (EE), and the preferred method of use
relies mainly on the outcome measure, practicality and availability. Direct calorimetry (DC) is,
as the name implies, the direct measurement of heat exchange between the individual and
the environment via a calorimeter. As the heat produced by the body directly correlates with
EE and thus metabolic rate, DC allows the quantification of EE by measuring the simultaneous
measurement of heat produced by an organism. The direct calorimeter, often termed whole-
room calorimeter, involves placing an individual in a confined, insulated chamber that allows
measurement of heat exchange (Kenny et al., 2017). DC, however, has its drawbacks that
limits its use such as technical challenges, high cost of operation and maintenance, and
discomfort for subjects due to the restricted space available during measurements.

79
Moreover, DC cannot convey information on the type of substrate being oxidized for energy
metabolism (Kenny et al., 2017) (Johnson and McKenzie, 2001). EE can also be assessed via
gas exchange measurement, whereby a direct relationship exists between oxygen
consumption and heat liberation by the body that allows an ‘indirect’ yet highly accurate
estimation of EE (Kenny et al., 2017). Indirect calorimetry (IC) is indeed considered the ‘gold
standard’ in measuring EE in clinical research due to its more practical use and lower
equipment cost concomitant with technological advancement (Kenny et al., 2017). Different
equipment is available for measurement; however, the ventilated hood system is most often
used where a clear plastic hood is placed over a subject’s head in an airtight form and then
oxygen consumption (VO2) and carbon dioxide production (VCO2) are quantified. IC can also
provide an index for substrate utilization and can indicate if an individual is in a fasted or post-
prandial state via the ratio of CO2 produced to O2 consumed. This ratio, called the respiratory
exchange ratio (RER), can vary between 0.67 and 1.20 depending on the predominant
substrate metabolized. For instance, during carbohydrate oxidation, RER=1.0 since an equal
amount of CO2 is produced for O2 consumed, whereas during lipid oxidation this ratio drops
to 0.7 since less CO2 is produced for O2 consumed (Johnson and McKenzie, 2001). IC is not
without its limitations where it is vitally important during IC measurements that gas analysers
are appropriately calibrated and that the gases flowing into the analysers are exposed to the
same level of humidity, temperature, pressure and flow rate. Moreover, appropriate
education and training is required for personnel conducting the measurements to obtain
accurate results (Gupta et al., 2017). When comparing DC with IC, it is noteworthy that
discrepancies can occur since these methodologies differ in both experimental design and
since they measure different forms of energy i.e. DC measures heat dissipation while IC
measures mechanical/chemical/heat energy. Moreover, during rapid changes in metabolism
such as during dynamic exercise, DC lags behind IC since initial heat loss in that state is not
paralleled by the rapid increase in heat production. However, after this initial lag and with
exercise continuation, elevation in body temperature is no longer maintained and heat loss
would eventually equate to heat production. Thus, when tested under steady-state
conditions, DC and IC can yield coherent results (Webb et al. 1988) (Kenny et al., 2017).
Finally, predictive equations can also be used to estimate EE. The most commonly used are
Harris–Benedict, Mifflin–St Jeor, Owen and World Health Organization/ Food and Agriculture
Organization/United Nations University (WHO/FAO/UNU) equations. As each equation was

80
derived based on a specific population and most often on normal weight individuals renders
them inappropriate in many clinical settings (Psota and Chen, 2013) . For instance, the Harris
and Benedict equation has been shown to overestimate REE by 5-13% in a population of
normal weight and obese adults in comparison to IC (Garrel et al., 1996). Also, in a diverse
and heterogeneous German population, the WHO equation has been shown to
underestimate EE at low REE and overestimate REE at high level REE (Müller et al., 2004).
Since the purpose of this research relies on the accurate measurement of both energy
expenditure and substrate oxidation in different energy states, indirect calorimetry was the
preferred method of choice and will be discussed in more detail in the next section.
3.2.1 Indirect Calorimetry
Humans extract the chemical energy stored in foods by oxidizing the available nutrients,
namely carbon-based fuels (carbohydrates (CHO), protein and lipid) into CO2 and water.
Therefore, the ultimate pathway for all biochemical reactions occurring in the body is either
combustion or synthesis of CHO, lipid and protein resulting in a specific ratio of VO2 and VCO2
that can be used to calculate REE. The chemical energy liberated from food is either lost as
heat via oxidation or stored in high-energy molecules such as adenosine triphosphate (ATP).
IC measures this energy by taking into account minute ventilation and calculating the
difference in O2 and CO2 content of inspired and expired air. Total EE is then computed using
the modified Weir equation (Mtaweh et al., 2018, Gupta et al., 2017):
EE (kcal/day) = ([VO2 × 3.941] + [VCO2 × 1.11] + [uN2 × 2.17]) ×1440
However, urinary nitrogen component (uN2) which conveys the contribution of protein
oxidation to TEE is often excluded from the equation since protein oxidation is relatively
constant in various physiological states i.e. fasting, post-prandial and during physical activity
(Melzer, 2011) contributing to ~20% of daily metabolic rate (Schutz, 2011) . Hence, the
following equation is more often used:
EE (kcal/day) = ([VO2 × 3.941] + [VCO2 × 1.11]) ×1440

81
Carbohydrate and lipid oxidation rates can be estimated from stochiometric equations of
glucose and triacylglycerol oxidation respectively. As for protein oxidation rates, empirical
values are used and are based on urinary nitrogen excretion since most uN2 (>80%) is in the
form of urea (Frayn, 1983). The following equations are thus commonly used:
CHO = (4.55* VCO2) -(3.21*VO2) -(2.87* uN2)
Lipid = (1.67* VO2) -(1.67* VCO2) -(1.92* uN2)
Protein = uN2 * 6.25
A number of modalities are present for IC and can be summarized into the following
components (Gupta et al., 2017, Westerterp, 2017):
• Confinement Systems: Subjects are held in a sealed chamber and rates of gas
exchange in a fixed volume are monitored. A major limitation of this method is that it
only allows a short period of measurement before O2 depletion occurs.
• Closed-circuit systems: Subjects breathe from a pre-filled container (most often
composed of 100% O2) and the CO2 exhaled is absorbed by CO2 absorbers. The
quantity of O2 consumed is then quantified from the reduction in O2 volume.
Drawbacks include poor portability and possibility of increased work of breathing due
to an increase in compression on the breathing system. Also, RER cannot be
calculated.
• Total collection systems: Expired respiratory gases of subjects are collected and
analysed for volume and composition. The most common example of this system is
the Douglas bag method. However, shortcomings to this method include frequent gas
leaks and technical skills requirements.

82
• Open circuit systems: This method is one of the oldest methods used in IC and is also
the one that is most currently used up to date. Metabolic carts are the standardized
equipment used and involve a gas collection system which can take the form of a
facemask, mouthpiece or a canopy; a flow rate measuring system; O2 and CO2 gas
analysers; calibration gases, environmental assessors for temperature, pressure and
humidity; and finally a central computer that can combine all measurement outcomes
and presents it to the user. Although this method is most commonly used, it is not
without some drawbacks. For instance, the use of a facemask or mouthpiece can elicit
increased work of breathing due to discomfort. Also, the canopy system can cause
claustrophobia and hyperventilation in some subjects which again can affect outcome
measures.
• Other methods: These include whole room calorimeters where EE can be measured
continuously for 24 hours or longer via VO2 and VCO2. Doubly labelled water is also
another method that allows EE measurement by VCO2. These two methods, however,
are often limited to specific research settings due to high cost, technical challenges
and time span. Other novel methods are now introduced which include portable
devices and heat sensors that can be used to assess PEE or REE. However, long term
data validating these methods is still lacking and need further study. A simpler and
more economical method that could be used for estimating EE ,especially in large
population studies, is via HR monitoring where in most circumstance, HR highly
correlates with VO2 and EE (Wicks et al., 2011, Keytel et al., 2005). Similarly, MAP can
be used as an estimate for REE due to the established link or strong association
between blood pressure and resting energy expenditure (Luke et al., 2004, Creber et
al., 2018)
Given the purpose of this research, the open circuit system (face mask in the sub-maximal
exercise trial and the canopy for the overnight fasted and post-prandial trial) was chosen as
detailed previously in the methods section. HR and MAP were also used as a proxy measure
to assess changes in EE related to stimulation in sympathetic nervous system (SNS) activity.

83
3.3 Effect of Propionate on EE and Substrate Oxidation:
As mentioned earlier in Chapter 1:, propionate has been shown to have an effect on EE and
substrate oxidation in both rodent and human studies. For energy expenditure to increase,
there needs to be a parallel elevation in substrate oxidation, namely lipid and/or
carbohydrate oxidation to support the increase in energy metabolism. Indeed, findings have
suggested that propionate can increase energy expenditure while promoting lipid oxidation
(den Besten et al., 2015, Chambers et al., 2018, Canfora et al., 2017).
3.3.1 Effect of Propionate on EE and Substrate in Rodents:
Only one rodent study has examined the direct chronic effect of oral propionate
supplementation on energy expenditure. Den Besten et al., has shown that when propionate
is incorporated to a high lipid diet (HLD) at 5% (w/w) for 12 weeks, mice were protected from
diet-induced obesity via increases in energy expenditure and a switch from carbohydrate
oxidation to lipid oxidation, as verified by a lower RER, in contrast to mice who were on an
HFD only. This change in metabolism was also maintained in both 12 h light and dark phases,
so whether the mice were engaging in physical activity, rested or post-prandial (den Besten
et al., 2015). Another rodent study has investigated the acute effect of propionate on energy
expenditure via intraperitoneal injection at a supraphysiological rate of 1g/kg BW. Oxygen
consumption and thus energy expenditure was significantly higher after propionate
supplementation in WT mice versus FFAR-3 KO mice. Moreover, HR was also significantly
increased in WT mice albeit KOs. Physical activity however was comparable between WT and
KO mice which hence indicates that the observed metabolic changes with propionate
administration were mediated via FFAR-3 dependent SNS activation
3.3.2 Effect of Propionate on EE and Substrate in Humans:
A single human study has investigated the acute effect of propionate on energy expenditure
and substrate oxidation via oral supplementation. In 18 healthy males (n=9) and female (n=9)
subjects, Chambers et al., has shown that acute oral sodium propionate supplementation (71
mmol) over 180 time period can increase resting energy expenditure and resting lipid

84
oxidation in comparison to a sodium chloride control. (Chambers et al., 2018). Peripheral
propionate concentrations, however, only became significantly increased at 180 min and thus
the total impact of propionate on energy metabolism may not have been fully measured in
this study. Meanwhile, Canfora et al. examined the acute effect of propionate administration
on energy expenditure and substrate oxidation via rectal infusion to the gut in 12
normoglycemic adult men (Canfora et al., 2017). Using a high propionate SCFA infusion (18
mmol sodium acetate (45%), 14 mmol sodium propionate (35%), 8 mmol sodium butyrate
(20%) dissolved in 200 mL sterile water)), Canfora et al. have shown an increase in energy
expenditure and lipid oxidation and a decrease in CHO oxidation in the rested fasted state but
not post-prandially after an oral glucose load (75g). However, due to the infusion of all three
principal SCFAs, it is not possible to attribute the changes in energy metabolism specifically
to propionate.
Thus, it appears that increasing propionate bioavailability in both animals and humans can
increase energy expenditure while promoting lipid oxidation. However, a gap remains in the
literature on the acute effect of oral supplementation of propionate on energy expenditure
and substrate oxidation in different energy states and also how long the metabolic effect of
propionate can persist in these states.
3.4 Hypothesis:
I hypothesised that acute oral intake of sodium propionate would increase energy
expenditure and rates of lipid oxidation in different physiological states (overnight fasted,
sub-maximal exercise and post-prandial) and would modulate energy production pathways
to support increases in energy expenditure and lipid oxidation.
3.5 Aims:
This chapter will aim to present and discuss findings related to determining the acute effect
of propionate bioavailability on energy metabolism and substrate oxidation in different
energy states (overnight fasted, sub-maximal exercise and post-prandial). It will also examine

85
how long the metabolic effect of propionate can persist in these states and if SNS activity,
measured through HR and MAP, is raised following propionate supplementation.
3.6 Outcome Measures:
The primary outcome measures of the trial were changes in energy expenditure and rates of
lipid oxidation via indirect calorimetry. Secondary measures included effects on sympathetic
nervous system activity measured through heart rate and mean arterial pressure.
3.7 Methods:
Please refer to Chapter 2:
3.8 Results:
3.8.1 Overnight fasted Trial:
3.8.1.1.1 Energy Expenditure:
Energy expenditure between 0-360 min was significantly higher in the Propionate trial in
comparison to Control (Control =1.013± 0.034kcal/min; Propionate= 1.040 ± 0.039kcal/min;
Effect of trial p=0.024) (Figure 3:1: A). Similarly, in the Propionate trial, iAUC0-360 min and
+iAUC0-360 min was significantly higher in comparison to the Control (p= 0.050; p=0.007) (Figure
3:1: B and C) respectively.
iAUC0-180 min and +iAUC0-180 min in the Propionate trial was significantly higher than in the
Control trial (p= 0.026; p=0.013) respectively (Figure 3:1: D and E). However, there was no
significant difference in iAUC180-360 min and +iAUC180-360 min between trials (Control: p= 0.154;
Propionate: p=0.083) (Figure 3:1: F and G).

86
A
B
C

87
D
E
F
G
Figure 3-1: Overnight Fasted Study: Effect of oral sodium propionate supplementation on EE
The effect of oral sodium propionate supplementation on energy expenditure A. Overnight fasted energy
expenditure (Time×Trial: p= 0.377, Trial: p=0.024, Time: p= 0.248) and B. Overnight fasted energy expenditure
iAUC0-360 min (p= 0.050). C. Overnight fasted energy expenditure +iAUC0-360 min (p= 0.007). D. Overnight fasted
energy expenditure iAUC0-180 min (p= 0.026) E. +iAUC0-180 min (p=0.013). E. iAUC180-360 min (p= 0.154). F. +iAUC180-
360 min (p=0.083). All data expressed as mean ± SEM (n=19).

88
3.8.1.1.2 RER:
RER between 0-360 min was significantly higher in the Control trial (Control= 0.862 ± 0.018;
Propionate= 0.839 ± 0.018; Effect of trial p=0.018) (Figure 3:2: A). RER iAUC0-360 and +iAUC0-
360 ,however, were not significantly different between trials (p= 0.100; p=0.473) (Figure 3:2: B
and C).
Similarly, iAUC0-180 min and +iAUC0-180 min were not significantly different between trials (p=
0.095; p=0.331) respectively (Figure 3:2: D and E). Also, iAUC180-360 min and +iAUC180-360 min were
not significantly different between trials (p= 0.184; p=0.652) (Figure 2: F and G) respectively.
A

89
B
C
D
E

90
F
G
Figure 3-2 Overnight Fasted Study: Effect of oral sodium propionate supplementation on RER The effect of oral sodium propionate supplementation on respiratory exchange ratio A. RER (Time×Trial:
p=0.737; Trial: p=0.018; Time: p= 0.000) and B. RER iAUC0-360min (p=0.100). C. RER +iAUC0-360 (p=0.473). D. RER
iAUC 0-180 min (p=0.095). E. RER +iAUC 0-180 min (p=0.331). F. RER iAUC 180-360 min (p=0.184). G. RER +iAUC 180-360 min
(p=0.652). All data expressed as mean ± SEM (n=19).
3.8.1.1.3 Lipid Oxidation:
Lipid oxidation between 0-360 min was significantly higher in the Propionate trial (Control=
0.032± 0.007g/min; Propionate = 0.042 ± 0.007g/min; Effect of trial p=0.009) (Figure 3:3 A).
Similarly, iAUC0-360 min and +iAUC0-360 min were significantly higher in the Propionate trial (p=
0.035; p=0.046) respectively (Figure 3:3 B and C).
iAUC0-180 min and +iAUC0-180 were significantly higher in the Propionate trial (p= 0.021; p=0.016)
respectively (Figure 3: 3 D and E). iAUC180-360 min and +iAUC180-360min were not significantly
different between trials (p= 0.113; p=0.185) (Figure 3: 3 F and G) respectively.

91
A
B
C

92
Figure 3-3: Overnight Fasted Study: Effect of oral sodium propionate supplementation on lipid oxidation
The effect of oral sodium propionate supplementation on lipid oxidation A. Lipid oxidation (Time×Trial: p=0.506;
Trial: p=0.009 Time: p= 0.000) and B. Lipid oxidation iAUC0-360 min (p= 0.035). C. Lipid oxidation +iAUC0-360 (p=
0.046). D. Lipid oxidation iAUC0-180 min (p= 0.021). E. Lipid oxidation +iAUC0-180 (p= 0.016). F. Lipid oxidation
iAUC180-360 min (p= 0.113). G. Lipid oxidation +iAUC180-360min (p=0.185). All data expressed as mean ± SEM (n=19).
D
E
F
G

93
3.8.1.1.4 Carbohydrate Oxidation:
Carbohydrate oxidation rates between 0-360 min was significantly lower in the Propionate
trial in comparison to the Control (0.126 ± 0.019 g/min vs 0.110 ± 0.019 g/min respectively;
Effect of trial p=0.039) (Figure 3:4 A). iAUC0-360 min and +iAUC0-360 min were not significantly
different between trials (p= 0.679; p=0.275) respectively (Figure 3:4: B and C).
iAUC0-180 min and + iAUC0-180 were not significantly different between groups (p= 0.189; p=
0.266) (Figure 3:4: D and E). Similarly, iAUC180-360 min and + iAUC180-360 min were not significantly
different between Propionate and Control (p= 0.426; p= >0.999) (Figure 3:4: F and G).
A

94
B
C
D
E

95
F
G
Figure 3-4: Overnight Fasted Study: Effect of oral sodium propionate supplementation on CHO oxidation: The effect of oral sodium propionate supplementation on carbohydrate oxidation A.
Carbohydrate oxidation (Time×Trial: p=0.949; Trial: p=0.039; Time: p= 0.000) and B.
Carbohydrate oxidation iAUC 0-360 min (p= 0.679). C. Carbohydrate oxidation +iAUC 0-360 min (p=
0.275) D. Carbohydrate oxidation iAUC 0-180 min (p= 0.189) E. carbohydrate oxidation + iAUC 0-
180min (p= 0.266) F. Carbohydrate oxidation iAUC 180-360 min (p= 0.426) G. Carbohydrate
oxidation + iAUC 180-360 min (p>0.999). All data expressed as mean ± SEM (n=19).
3.8.1.1.5 Protein Oxidation:
Protein oxidation between 0-360 min was similar between trials (Control Trial= 0.053 ± 0.004
g/min; Propionate Trial= 0.053 ± 0.004 g/min; p= 0.744).
3.8.1.1.6 Heart Rate:
HR between 0-360 minutes was significantly higher in the Propionate trial in comparison to
the Control (Control= 62.1± 1.7 bpm; Propionate= 64.9± 2.0 bpm; Effect of trial: p=0.030)
(Figure 3:5: A). iAUC0-360 min and +iAUC 0-360 min, however, were similar between trials (p=0.192;
p=0.057) respectively (Figure 3:5: B and C).

96
iAUC0-180 min was not significantly different between the two trials (p=0.113) respectively
(Figure 3:5: D). +iAUC 0-180 however, was significantly higher in the Propionate trial in
comparison to Control (p=0.038) (Figure 3:5: E). HR iAUC180-360 min and +iAUC 180-360 however
were not significantly different between the two trials (p=0.385; p= 0.504) respectively
(Figure 3:5: F and G).
A
B
C

97
D
E
F
G
Figure 3-5: Overnight Fasted Study: Effect of oral sodium propionate supplementation on HR The effect of oral sodium propionate supplementation on Heart Rate A. HR (Time×Trial: p=0.281; Trial: p=0.030;
Time: p= 0.008) and B. HR iAUC0-360 min (p=0.192). C. HR +iAUC 0-360 min (p=0.057); D. HR iAUC0-180 min (p=0.113) E.
HR +iAUC 0-180 min (p=0.038) F. HR iAUC180-360 min (p=0.385) G. HR +iAUC 180-360 min (p=0.504) All data expressed
as mean ± SEM (n=19).
3.8.1.1.7 Mean Arterial Pressure (MAP):
MAP between 0-360 minutes was not significantly different between trials (Control= 77.1 ±2.1
mmHg; Propionate= 76.1± 2.0 mmHg; p=0.180) (Figure 3:6: A). iAUC0-360 min and +iAUC 0-360 min

98
MAP were not significantly different between the trials (p=0.122; p=0.306) (Figure 3:6: B and
C)
iAUC 0-180 min and +iAUC 0-180 min MAP were not significantly different between the trials
(p=0.501; p=0.548) (Figure 3:6: D and E). iAUC 180-360 min was significantly higher in the
Propionate trial (p=0.041) (Figure 3:6: F). +iAUC 180-360 min, however, was not significantly
different between trials (p=0.248) (Figure 3:6: G).
A

99
B
C
D
E

100
F
G
Figure 3-6: Overnight Fasted Study: Effect of oral sodium propionate supplementation on MAP The effect of oral sodium propionate supplementation on Blood Pressure A. MAP (Time×Trial: p=0.197; Trial:
p=0.180; Time: p= 0.076) and B. MAP iAUC0-360 min (p=0.122). C. MAP +iAUC 0-360 min (p=0.306). D. MAP iAUC0-180
min (p=0.501). E. MAP +iAUC 0-180 (p=0.548). F. MAP iAUC180-360 min (p=0.041). G. MAP +iAUC180-360 min (p=0.248). All
data expressed as mean ± SEM (n=19).
3.8.2 Sub-maximal Exercise Trial:
3.8.2.1.1 Energy Expenditure:
Resting energy expenditure was similar in both trials (Control =1.239 ± 0.048 kcal/min;
Propionate= 1.245 ± 0.050 kcal/min; Effect of trial p=0.756) (Figure 3:7: A). Similarly, iAUC0-
180 min and +iAUC0-180 min showed no significant differences between the two trials (p= 0.535;
p=0.389) respectively (Figure 3:7: B and C).
Volunteers were exercising at 48 ± 2 % and 47 ± 2% of their VO2max in the Control and
Propionate trials, respectively. Energy expenditure throughout exercise was comparable
between trials (Control=5.085 ± 0.330 kcal/min; Propionate= 4.991± 0.328 kcal/min; Effect of
trial p= 0.537) (Figure 3:7: A). iAUC195-240 min and +iAUC195-240 min were also similar (p= 0.311;
p=0.311) (Figure 3:7: D and E).

101
A
B
C

102
D
E
Figure 3-7: Sub-maximal Exercise Study: Effect of oral sodium propionate supplementation on EE The effect of oral sodium propionate supplementation on energy expenditure A. Resting energy expenditure
(Time×Trial: p= 0.281; Trial: p=0.756; Time: p= 0.544) and Energy Expenditure during exercise (Time×Trial: p=
0.537) (Time: p= 0.000) B. Resting energy expenditure iAUC0-180 min (p= 0.535). C. Resting energy expenditure
+iAUC0-180 min (p= 0.389). D. Energy expenditure during exercise iAUC195-240 min (p= 0.311). E. Energy expenditure
during exercise iAUC195-240 min (p= 0.311) All data expressed as mean ± SEM (n=19).
3.8.2.1.2 RER:
Resting RER was comparable between the Control and Propionate trials (Control= 0.814 ±
0.015; Propionate= 0.795 ± 0.012; Effect of trial p=0.186). However, there was a significant
Time x Trial interaction (p=0.015) with post hoc analysis revealing a significant difference at
180 min (Control= 0.807 ± 0.015; Propionate= 0.773 ± 0.015; p=0.040) (Figure 3:8: A). iAUC0-
180 min for the resting period was also significantly lower in the Propionate trial (p= 0.001)
(Figure 3:8: B). However, +iAUC0-180 min was not significantly different between trials
(p=0.233) (Figure 3:8: C).
RER throughout exercise was not significantly different (Effect of trial p=0.593) between the
Control (0.843 ± 0.015) and the Propionate (0.835 ± 0.010) trial. RER iAUC195-240 and +iAUC180-
240 were not significantly different between the trials (p= 0.189; p=0.542) (Figure 3:8: D and
E).

103
A
B
C

104
D
E
Figure 3-8: Sub-maximal Exercise Study: Effect of oral sodium propionate supplementation on RER
The effect of oral sodium propionate supplementation on respiratory exchange ratio A. Resting RER (Time×Trial:
p=0.015; Trial: p=0.186; Time: p= 0.000) and RER during exercise (Time×Trial: p= 0.537) B. Resting RER iAUC0-180
min (p= 0.001). C. Resting RER +iAUC0-180 min (p=0.233). D. RER during exercise iAUC195-240 (p= 0.189). E. RER during
exercise +iAUC195-240 (p= 0.542). All data expressed as mean ± SEM (n=19).
3.8.2.1.3 Lipid Oxidation:
Resting lipid oxidation was not significantly different between the two trials (Control= 0.059
± 0.007 g/min; Propionate= 0.066 ± 0.006 g/min; Effect of trial p=0.288). However, there was
a significant Time x Trial interaction (p=0.023) with post hoc analysis revealing a significant
difference at 180 min (Control= 0.062 ± 0.007; Propionate= 0.078 ± 0.007) (Figure 3:9: A).
iAUC0-180 min and +iAUC0-180 for the resting period was significantly higher in the Propionate
trial in comparison to control (p= 0.001; p= 0.007) respectively (Figure 3:9: B and C).
Lipid oxidation during exercise was not significantly different between the trials (Control=
0.284 ± 0.032 g/min; Propionate = 0.287 ± 0.030 g/min; Effect of trial p=0.893) (Figure 3:9: A)
and iAUC195-240 min and +iAUC180-240 were not significantly different (p= 0.712; p=0.775)
respectively (Figure 3:9: D and E).

105
A
B
C

106
D
E
Figure 3-9: Sub-maximal Exercise Study: Effect of oral sodium propionate supplementation on lipid oxidation
The effect of oral sodium propionate supplementation on lipid oxidation A. Resting lipid oxidation (Time×Trial:
p=0.040; Trial: p=0.288; Time: p= 0.000) and Lipid oxidation during exercise (Time×Trial: p=0.523); (Time: p=
0.000) B. Resting lipid oxidation iAUC0-180 min (p= 0.001). C. Resting lipid oxidation +iAUC0-180 min (p= 0.007). D.
Lipid oxidation during exercise iAUC195-240 min (p= 0.712). E. Lipid oxidation during exercise +iAUC195-240 (p= 0.775).
All data expressed as mean ± SEM (n=19).
3.8.2.1.4 Carbohydrate Oxidation:
Resting carbohydrate oxidation rates were comparable between trials (Control= 0.094 ± 0.018
g/min vs Propionate=0.073 ± 0.017 g/min; Effect of trial p=0.219), but there was a significant
Time x Trial interaction (p=0.032) at timepoint 120 min (Control= 0.092 ± 0.022; Propionate=
0.050 ± 0.017; p=0.041) (Figure 3: 10: A). iAUC0-180 min for the resting period was significantly
lower in the Propionate trial in comparison to Control (p<0.001) (Figure 3:10: B). This
coincides with no significant change in +iAUC0-180 for resting CHO oxidation between trials (p=
0.278) (Figure 3: 10: C).
Carbohydrate oxidation rates during exercise was not significantly different between Control
and the Propionate (0.626 ± 0.062 g/min vs 0.594 ± 0.058 g/min respectively; Effect of trial
p=0.762) (Figure 3: 10: A) and iAUC195-240 min and +iAUC195-240 were not different between trials
(p=0.821; p=0.860) respectively) (Figure 3:10: D and E).

107
A
B
C

108
D
E
Figure 3-10: Sub-maximal Exercise Study: Effect of oral sodium propionate supplementation on carbohydrate oxidation The effect of oral sodium propionate supplementation on carbohydrate oxidation A. Resting carbohydrate
oxidation (Time×Trial: p=0.032); (Time: p= 0.000) and Carbohydrate oxidation during exercise (Time×Trial:
p=0.845; Time: p=0.219; Time: p= 0.479) B. Resting carbohydrate oxidation iAUC0-180 min (p<0.001). C. Resting
carbohydrate oxidation +iAUC0-180 min (p= 0.278) D. Carbohydrate oxidation during exercise iAUC195-240 min (p=
0.821). E. Carbohydrate oxidation during exercise +iAUC195-240 min (p= 0.860). All data expressed as mean ± SEM
(n=19).
3.8.2.1.5 Protein Oxidation:
Protein oxidation between 0-240 min was similar between trials (Control Trial= 0.074 ± 0.007
g/min; Propionate Trial= 0.078 ± 0.009g/min; p= 0.622).
3.8.2.1.6 Heart Rate:
Resting HR was similar between trials (Control: 59.4 bpm ± 2.400; Propionate: 59.6 ± 2.8 bpm;
Effect of trial: p=0.918) (Figure 3:11: A) and resting HR iAUC0-180 min and +iAUC 0-180 were also
not statistically significant between the two trials (p=0.640; p=0.380) (Figure 3:11: B and C),
respectively.

109
HR during exercise was not significantly different between the two trials (Control= 95.7 ±
3.1bpm; Propionate= 95.7 ± 3.4 bpm; Effect of trial= p=0.979) (Figure 3:11: A ).iAUC180-240 and
+iAUC 180-240 were also similar between trials (p=0.890; p=0.963) respectively (Figure 3: 11: D
and E).
A
B
C

110
D
E
Figure 3-11: Sub-maximal Exercise Study: Effect of oral sodium propionate supplementation on HR
The effect of oral sodium propionate supplementation on Heart Rate A. Resting HR (Time×Trial: p=0.428; Trial:
p=0.918; Time: p= 0.061) and HR during exercise (Time×Trial: p=0.159) B. Resting HR iAUC0-180 min (p=0.640). C.
Resting HR +iAUC 0-180 (p=0.380) D. HR concentration during exercise iAUC180-240 (p=0.890). E. HR concentration
during exercise +iAUC180-240 (p=0.963). All data expressed as mean ± SEM (n=19).
3.8.2.1.7 Mean Arterial Pressure:
Resting mean arterial blood pressure (MAP) was not significantly different between the
Control and the Propionate trials (Control= 85.2 ± 2.0 mmHg; Propionate=83.4 ± 1.9 mmHg;
Effect of trial: p= 0.092) (Figure 3:12: A) and iAUC0-180 min and +iAUC 0-180 MAP were not
statistically different between the trials (p=0.840; p=0.734) (Figure 3:12: B and C).
MAP following exercise was not significantly different between trials (Control= 88.7 ± 2.7
mmHg; Propionate= 89.1 ± 2.6 mmHg; p=0.883) (Figure 3:12: A). iAUC180-240 min and +iAUC
180-240 MAP were not statistically different between the trials (p=0.502; p=0.700) (Figure 3:12:
D and E).

111
A
B
C

112
D
E
Figure 3-12: Sub-maximal Exercise Study: Effect of oral sodium propionate supplementation on MAP The effect of oral sodium propionate supplementation on Blood Pressure A. Resting MAP (Time×Trial:
p=0.596; Trial: p= 0.092; Time: p= 0.023) and BP during exercise (p=0.883) B. Resting MAP iAUC 0-180
(p=0.840). C. Resting MAP +iAUC 0-180 (p=0.734). D. BP iAUC180-240 min during exercise (p=0.502). E. MAP
+iAUC180-240 min during exercise (p=0.700). All data expressed as mean ± SEM (n=19).
3.8.3 Post-prandial Trial:
3.8.3.1.1 Energy Expenditure:
Overall energy expenditure between 0-300 min was similar in both trials (Control =1.057 ±
0.044 kcal/min; Propionate= 1.072± 0.046 kcal/min; Effect of trial p=0.289).However, there
was a significant Time x Trial interaction (p=0.010) with post hoc analysis revealing a
significant difference at time-point 300 min (p=0.026). (Figure 3:13: A). iAUC0-300 min was not
significantly different between trials (p=0.063). However, +iAUC0-300 min was significantly
higher in the Propionate trial (p=0.023) (Figure 3:13: B and C).

113
Resting iAUC0-180 min and +iAUC0-180 min showed no significant differences between the two
trials (p= 0.219; p=0.064) respectively (Figure 3:13: D and E). Post-prandial iAUC180-300 min and
+iAUC180-300 min were significantly higher in the Propionate trial (p=0.003; p=0.003) (Figure
3:13: F and G).
A
B
C

114
D
E
F
G
Figure 3-13: Post-prandial Study: Effect of oral sodium propionate supplementation on EE The effect of oral sodium propionate supplementation on energy expenditure A. Energy expenditure
(Time×Trial: p= 0.010; Trial: p=0.289; Time: p= 0.000) and B. Energy expenditure iAUC 0-300 min (p= 0.063). C.
Energy expenditure +iAUC0-300 min (p= 0.023). D. Overnight fasted energy expenditure iAUC0-180 min (p= 0.219) E.
Overnight fasted energy expenditure +iAUC0-180 min (p=0.064). F. Post-prandial iAUC180-300 min (p= 0.003). G. Post-
prandial +iAUC180-300 min (p=0.003). All data expressed as mean ± SEM (n=19).

115
3.8.3.1.2 RER:
RER between 0-300 min was comparable between the Control and Propionate trials
(Control= 0.881± 0.012; Propionate= 0.887± 0.011; Effect of trial p=0.581) (Figure 3:14: A).
RER iAUC0-300min and +iAUC0-300min was not significantly different between trials (p=0.232;
p=0.610) (Figure 3:14: B and C).
iAUC0-180 min and +iAUC0-180 min for the overnight fasted period were not significantly different
between trials (p= 0.202; p=0.946) respectively (Figure 3:14: D and E). RER iAUC180-300 min and
+iAUC180-300 min were not significantly different between the trials (p=0.676; p=0.417) (Figure
3:14: F and G).
A

116
B
C
D
E

117
F
G
Figure 3-14: Post-prandial Study: Effect of oral sodium propionate supplementation on RER The effect of oral sodium propionate supplementation on respiratory exchange ratio A. RER (Time×Trial:
p=0.733; Trial: p=0.581; Time: p= 0.000) and B. RER iAUC0-300 (p=0.232). C. RER +iAUC0-300 (p=0.610). D. Overnight
fasted RER iAUC0-180 min (p=0.202). E. Overnight fasted RER +iAUC0-180 min (p=0.946). F. Overnight fasted RER
iAUC180-300 min (p=0.576). G. Overnight fasted RER +iAUC180-300 min (p=0.417). All data expressed as mean ± SEM
(n=19).
3.8.3.1.3 Lipid Oxidation:
Lipid oxidation between 0-300 min was not significantly different between the two trials
(Control= 0.027 ± 0.005 g/min; Propionate= 0.025 ± 0.005 g/min; Effect of trial p=0.668)
(Figure 3:15: A). Also, iAUC0-300 min was not significantly different between trials (p=0.186)
(Figure 3:15: B). However, +iAUC0-300 was significantly higher in the Propionate trial (p=0.036)
(Figure 3:15: C).
iAUC0-180 min was not significantly higher between groups (p=0.177). However, +iAUC0-180 for
the overnight fasted period was significantly higher in the Propionate trial in comparison to
control (p= 0.036) respectively (Figure 3:15: D and E). Post-prandial iAUC180-300 min and
+iAUC180-300 for lipid oxidation were not significantly different (p= 0.706; p=0.765) respectively
(Figure 3:15: F and G).

118
A
B
C

119
D
E
F
G
Figure 3-15: Post-prandial Study: Effect of oral sodium propionate supplementation on lipid oxidation
The effect of oral sodium propionate supplementation on lipid oxidation A. Lipid oxidation (Time×Trial: p=0 .645;
Trial: p=0.668; Time: p= 0.000) and B. Lipid oxidation iAUC0-300 min (p= 0.186). C. Lipid oxidation +iAUC0-300 (p=
0.036). D. Overnight fasted lipid oxidation iAUC0-180 min (p= 0.177). E. Overnight fasted lipid oxidation +iAUC0-180
(p= 0.036). F. Post-prandial lipid oxidation iAUC180-300 min (p= 0.706). G. Post-prandial lipid oxidation +iAUC180-
300min (p=0.765). All data expressed as mean ± SEM (n=19).

120
3.8.3.1.4 Carbohydrate Oxidation:
Carbohydrate oxidation rates between 0-300 min were comparable between trials (Control=
0.151± 0.013 g/min vs Propionate=0.157± 0.010 g/min; Effect of trial p=0.527) (Figure 3:16:
A). iAUC0-300 min and +iAUC0-300 were not significantly different between trials (p=0.571;
p=0.953) respectively (Figure 3:16: B and C).
iAUC0-180 min and + iAUC0-180 for the overnight fasted were similar between the Propionate and
Control trial (p= 0.294; p>0.999) (Figure 3:16: D and E). Also, iAUC180-300 min and +iAUC180-300
were not significantly different between trials (p=0.612; p=0.734) respectively (Figure 3:16: F
and G).
A

121
B
C
D
E

122
F
G
Figure 3-16: Post-prandial Study: Effect of oral sodium propionate supplementation on carbohydrate oxidation
The effect of oral sodium propionate supplementation on carbohydrate oxidation A. Carbohydrate oxidation
(Time×Trial: p=0.452; Trial: p=0.527; Time: p= 0.000) and B. Carbohydrate oxidation iAUC0-300 min (p= 0.571). C.
Carbohydrate oxidation +iAUC0-300 min (p= 0.953) D. Overnight fasted carbohydrate oxidation iAUC0-180 min (p=
0.294) E. Overnight fasted carbohydrate oxidation + iAUC0-180 (p>0.999) F. Post-prandial carbohydrate oxidation
iAUC180-300 min (p= 0.612) G. Post-prandial carbohydrate oxidation + iAUC180-300 min (p=0.734). All data expressed
as mean ± SEM (n=19).
3.8.3.1.5 Protein Oxidation:
Protein oxidation between 0-300 min was similar between trials (Control Trial= 0.053 ± 0.005
g/min; Propionate Trial= 0.055 ± 0.005 g/min; p=0.425).
3.8.3.1.6 Heart Rate:
HR between 0-300 min was significantly higher in the Propionate trial (Control: 66.1bpm ±
2.4; B: 68.6± 2.3 bpm; Effect of trial: p=0.029) (Figure 3:17: A). However, baseline HR was
significantly different between trials (p= 0.006). Overnigth fasted HR iAUC0-180 min and +iAUC 0-
180 were not statistically significant between the two trials (p=0.735; p=0.946) respectively
(Figure 3:17: B and C).

123
HR iAUC0-300 and +iAUC 0-300 were not significantly different between the two groups
(p=0.502; p=0.200) respectively (Figure 3:17: D and E). Post-prandial HR iAUC180-300 was
similar between trials (p=0.254). However, +iAUC 180-300 was significantly higher in the Control
trial in comparison to the Propionate (p=0.017) (Figure 3:17: F and G).
A
B
C

124
D
E
F
G
Figure 3-17: Post-prandial Study: Effect of oral sodium propionate supplementation on HR
The effect of oral sodium propionate supplementation on Heart Rate A. HR (Time×Trial: p=0 .681; Trial: p=0.029;
Time: p= 0.000) and B. HR iAUC0-300 min (p=0.735). C. HR +iAUC 0-300 min (p=0.946); D. Overnight fasted HR iAUC0-
180 min (p=0.502) E. Overnight fasted HR +iAUC 0-180 (p=0.200) F. Post-prandial HR iAUC180-300 min (p=0.254) G.
Post-prandial HR +iAUC 180-300 (p=0.017). All data expressed as mean ± SEM (n=19).
3.8.3.1.7 MAP:
Mean arterial blood pressure (MAP) between 0-300 min was not significantly different
between the Control and the Propionate trials (Control= 82.9± 2.0 mmHg; Propionate=83.7±

125
1.7 mmHg; Effect of trial: p= 0.320) (Figure 3:18: A). iAUC0-300 min and +iAUC 0-300 were not
significantly different between trials (p=0.411; p=0.800) respectively (Figure 3:18: B and C).
iAUC0-180 min and +iAUC 0-180 MAP were not statistically different between the trials (p=0.412;
p=0.865) (Figure 3;18: D and E). Post-prandial iAUC180-300 min and +iAUC 180-300 were not
significantly different between trials (p= 0.367; p>0.999) (Figure 3:18: F and G) respectively.
A
B
C

126
D
E
F
G
Figure 3-18: Post-prandial Study: Effect of oral sodium propionate supplementation on MAP
The effect of oral sodium propionate supplementation on Blood Pressure A. MAP (Time×Trial: p=0.864; Trial: p=
0.320; Time: p= 0.004) B. MAP iAUC0-300 min (p=0.411). C. MAP +iAUC 0-300 min (p=0.800). BP iAUC0-180 min (p=0.412).
D. Overnight fasted MAP +iAUC 0-180 (p=0.865). E. Post-prandial MAP iAUC180-300 min (p=0.367). F. Post-prandial
MAP +iAUC180-300 min (p>0.999). All data expressed as mean ± SEM (n=19).

127
3.9 Key Findings:
3.9.1 Overnight fasted Trial:
• Overnight fasted state: Propionate increased EE and lipid oxidation and decreased
CHO oxidation over a period of 360 min. Changes in EE and lipid oxidation are mainly
seen within the first 180 min following propionate ingestion. HR can similarly be
stimulated within the first 180 min of propionate ingestion. MAP also increased with
propionate supplementation after a prolonged fast.
3.9.2 Sub-maximal exercise Trial:
• Overnight fasted state: Propionate increased lipid oxidation and decreased CHO
oxidation after an overnight fasted state with no effect on energy expenditure.
• Submaximal exercise state: Propionate had no effect on EE and substrate oxidation
during sub-maximal exercise.
3.9.3 Post Prandial Trial:
• Overnight fasted state: Propionate had no effect on EE and CHO oxidation in the
overnight fasted state. Propionate stimulated lipid oxidation in the fasted state.
• Post-prandial state: Propionate increased EE in the post-prandial state with no
preferential use of a substrate.
3.10 Summary:
Acute ingestion of oral sodium propionate in healthy human volunteers may increase energy
expenditure in the overnight fasted state within the first 180 min of ingestion and in the post-
prandial state. In the fasted state, it can also stimulate HR and MAP. A consistent increase in
lipid oxidation has also been found in the overnight fasted state, however, these effects are

128
not observed during sub-maximal exercise nor in the post-prandial state. A decrease in CHO
oxidation can also found in the overnight fasted state.
3.11 Discussion:
3.11.1 Impact of propionate supplementation on energy expenditure and substrate oxidation
in different energy states:
No human study apart from this trial has examined the effect of acute/chronic propionate
supplementation on energy expenditure and substrate oxidation in the three energy states
(overnight fasted, sub-maximal exercise and post-prandial) typically experienced in a 24 h
period. A single rodent study, however, has examined the effect of chronic oral sodium
propionate supplementation on energy expenditure and substrate oxidation in different
energy states (den Besten et al., 2015). Den Besten et al. demonstrated in mice that
incorporation of sodium propionate chronically to an HFD can increase energy expenditure
and lipid oxidation in different energy states by promoting changes in hepatic and adipose
tissue that support a lipid switch between lipid synthesis to oxidation (den Besten et al.,
2015). This corroborated with some of the present findings where energy expenditure was
significantly increased with propionate supplementation in both the overnight fasted state
and post-prandially, but not during physical activity. Lipid oxidation as well was only found to
be stimulated in the overnight fasted state. This may be since the magnitude of metabolic
processes differ significantly between murine models and humans where, for instance, EE per
unit mass or per gram of body weight as well as rates of substrate utilization (lipid and CHO)
are substantially higher in mice relative to humans despite sharing comparable physiological
and metabolic functions at different bodily organs/tissues (Kummitha et al., 2014). Therefore,
caution is needed when translating these murine model findings directly to humans. Also,
differences may have occurred due to chronic versus acute supplementation strategies.

129
3.11.2 Acute impact of propionate supplementation on resting energy expenditure and
substrate oxidation in humans:
In the present trial, acute ingestion of 71 mmol of sodium propionate over 180 min was able
to consistently increase overnight fasted lipid oxidation (~ 0.01 g/min) which if maintained
over a 24 hour period would equate to an increase in lipid oxidation of 14.4 g/d . Moreover,
a simultaneous decrease in CHO oxidation was found in two out of the three trials. An increase
in energy expenditure after an overnight fasted state, however, was only found in the
overnight fasted trial (9.72 kcal over the course of 6 hours) which is nevertheless greater than
the energy yield of the complete oxidation of 71 mmol of sodium propionate (7.1 kcal) hence
signifying that the increase in EE was above the energy content of the propionate tablet and
is not simply oxidizing an endogenous fuel source. . Of note, in the sub-maximal exercise trial,
due to feasibility purposes, a face mask was used instead of the canopy, and the use of a
facemask can overestimate oxygen consumption and resting energy expenditure by ~ 7%
(p<0.05) and carbon dioxide production by 4.1% (p>0.05) in comparison to the canopy. RER
however can be similar across both methods (Forse, 1993). As for the overnight fasted and
postprandial trials, where the same calorimeter was used in both, the inconsistent effect on
resting energy expenditure cannot be attributed to methodological differences but could be
explained by differences in population characteristics in key variables such as BMI and body
lipid content. However, this is perhaps unlikely since the differences in participant
characteristics between the three trails were small. A more likely reason is that the rise in
REE (4-5%) that is expected with propionate supplementation in humans based on current
evidence (Chambers et al., 2018) falls at the very limits of detection of IC (4-10%) (Mtaweh
et al., 2018) based on day to day variability and error in measurements and can therefore be
left undetected using the current gold-standard technique.
Similar to our findings, Chambers et al. have also shown that in healthy human volunteers, an
acute oral administration of 71 mmol of sodium propionate over a 180 min period can
increase energy expenditure by ~4% in an overnight fasted state while shifting substrate
metabolism to favour an increase in lipid oxidation rates however with no substantial effect
on carbohydrate oxidation (Chambers et al., 2018). The lack of effect on CHO oxidation may
be due to the statistical test used to analyse it. In that study, only the +iAUC was examined

130
(which only calculates the area above baseline i.e a stimulatory effect) and thus any decrease
in CHO oxidation would not have been detected. Canfora et al., on the other hand, have
shown in twelve normoglycemic men that rectally infused SCFA mixture high in propionate
(18 mmol sodium acetate (45%), 14 mmol sodium propionate (35%), 8 mmol sodium butyrate
(20%) dissolved in 200 mL sterile water) which can typically be achieved with high fibre intake,
increased REE and fasting lipid oxidation and can decrease fasting carbohydrate oxidation as
assessed by iAUC tests (Canfora et al., 2017). Results from all these trials seem to be feasible
since for EE to increase, there needs to be a parallel increase in substrate oxidation, which in
this case seems to be fuelled by an elevation in lipid oxidation. It is also possible that the
increase in lipid oxidation is matched by a decrease in carbohydrate oxidation which explains
the lack of change of REE in the first 180 min in the sub-maximal exercise trial after propionate
supplementation. In any case, as human trials are quite scare, further intervention studies are
needed to confirm the impact of acute propionate administration on REE and substrate
oxidation. However, given the current evidence, it appears that propionate supplementation
can consistently increase resting lipid oxidation while its effects on stimulating REE are yet
inconclusive and require further investigation.
3.11.3 Acute impact of propionate supplementation on post-prandial energy expenditure and
substrate oxidation in humans:
In the post-prandial state, the present trial demonstrated that acute ingestion of 71 mmol of
sodium propionate over 180 min can increase post-prandial EE with no substantial effect on
substrate oxidation which coincides with the findings of Canfora et al. who showed in twelve
normoglycemic men that rectally infused SCFA mixture high in propionate (18 mmol sodium
acetate (45%), 14 mmol sodium propionate (35%), 8 mmol sodium butyrate (20%) dissolved
in 200 mL sterile water) has no significant effect on substrate oxidation, however, contrary to
the present findings, they found no significant effect on post-prandial energy expenditure
(Canfora et al., 2017). In addition, a study on overweight women showed that
supplementation of propionate (36.2 mmol) in the form of an inulin propionate ester along
with a moderate exercise program for 4 weeks has no effect on energy expenditure but can
increase post-prandial whole-body lipid oxidation and decrease CHO oxidation (Malkova et
al., 2020). A direct comparison between the studies is challenging since multiple variables

131
including the dosing, supplementation strategy, duration of the post-prandial period
measurement, participants’ characteristics as well as acute versus chronic supplementation
are variable. The former study included only overweight men BMI (30.3 ± 0.8 kg/m2), whilst
the latter study included only overweight women (BMI: 29.0 ± 1.9 kg/m2).The present study
included both normal and overweight individuals (BMI: 24.7 ± 0.8 kg/m2) with the majority
being in the normal range BMI. DIT peak in overweight individuals or people with higher lipid
content tends to be lower and occurs at a later time than normal weight subjects (Melzer,
2011). Thus, too short measurements are likely to give inaccurate DIT differences between
lean and overweight/obese subjects. Indeed, in the Canfora and the present study, the post-
prandial time-frame extended over two hours whereas in the Malkova trial, the post-prandial
period covered 7 hours. Thus, whether the studies would have yielded similar results had the
post-prandial time-frame been extended remains questionable and requires further
investigation. Of note as well, Malkova et al., conducted EE and substrate oxidation
measurements ³ 18 hours post the last inulin-propionate dose (Malkova et al., 2020)
therefore whether this translates to an acute effect remains questionable. Differences
between studies may also occur due to differences in the composition and energy content of
the meal provided. Protein content is the main nutrient that can drive an increase in DIT
where an increase in 1% of protein fraction results in a 0.22 ± 0.42 % elevation in DIT
(Westerterp, 2004) whereas the main substrate oxidized post-prandially depends on glucose
availability (Melzer, 2011). In the present study, as mentioned in the methods section, all
participants received an Ensure drink (72.7 g carbohydrate, 13.6 g lipid and 20.5 g protein;
500 kcal) whereas in the Canfora et al. study, the meal consisted of a 75g oral glucose load
and finally, in the Malkova et al. trial, the meals were tailored per body weight of individuals
and included a mixed meal breakfast (1g lipid, 1.2 g carbohydrate, 0.25 g protein and 15 kcal
/BW) and lunch (0.8 g lipid, 1.1 g carbohydrate, 0.35 g protein, 13 kcal/BW). Also, as the
propionate mode of supplementation was different between studies, where it was it was via
an oral supplementation in the fasted state in the current trial, via food in the Malkova trial
(Malkova et al., 2020) and via rectal infusions in the Canfora experiment (Canfora et al., 2017),
this is likely to impact energy homeostasis differently as various organs trigger varying
hormonal and regulatory processes which would ultimately impact the effects on energy
metabolism differently (Havel, 2004, Kuliczkowska-Plaksej et al., 2012).

132
In summary, the post-prandial trial examined the acute ingestion of 71 mmol of sodium
propionate on energy expenditure and substrate oxidation and found a positive effect on EE
after ingestion of a mixed meal which is physiologically relevant in comparison to an
experimental 75 g oral glucose load. However, since a paucity of data exists in this aspect,
future studies are therefore warranted to investigate and consolidate those findings further.
3.11.4 Acute impact of propionate supplementation on energy expenditure and substrate
oxidation in humans during sub-maximal exercise:
This study appears to be the only human trial that examined the effect of acute oral
propionate supplementation on energy expenditure and substrate oxidation during exercise
and therefore comparing the results with other findings for further confirmation is limited.
The present findings display no effect of acute supplementation of 71 mmol of sodium
propionate on energy expenditure or substrate oxidation during sub-maximal exercise. In this
study, during exercise, energy expenditure and lipid oxidation increased substantially in
comparison to the overnight fasted state by ~4 times. Thus, this may have overridden the
minor increase in REE and lipid oxidation observed with propionate supplementation.
However, the present study only tested a single exercise intensity (~40% of VO2 max) and
whether the same effect holds across a broader range of exercise intensities where substrate
oxidation varies remains to be elucidated and is an area for future research. Fitness level also
is another factor to be considered when assessing substrate oxidation. Trained individuals are
known to reach maximal lipid oxidation at intensities between 59%-64% of VO2 max in contrast
to the general population who reach maximal lipid oxidation at a lower intensity range
between (47-52% VO2 max) (Achten and Jeukendrup, 2004) hence had the cohort solely
included fitter individuals who are more prone to increases in lipid oxidation due to increases
in intramuscular triglycerides and mitochondrial/cellular protein and hormonal regulations,
perhaps propionate supplementation may have increased lipid oxidation in those individuals
(Purdom et al., 2018).
Moreover, gender plays an important role in determining substrate oxidation during exercise.
Indeed, studies consistently show that pre-menopausal women have a significantly greater
ability than men in oxidizing lipids during exercise (Carter et al., 2001, Venables et al., 2005,
Dasilva et al., 2011). For instance, in a cross-sectional study including 300 healthy men (n=157)

133
and pre-menopausal women (n=143), maximal lipid oxidation per kg of fat free mass was
significantly higher in women than in men, and this also occurred at a significantly higher
exercise intensity ( 45.1% versus 52.1% VO2 max;p< 0.01 in women versus men respectively).
In addition, the contribution of lipid oxidation to total energy expenditure at all exercise
intensities ranging from 41-61%, was significantly higher in women (p<0.01) (Venables et al.,
2005). In the sub-maximal exercise trial, the majority of participants were men (73.7%) which
may also explain why a lack of effect on lipid oxidation was seen with propionate
supplementation.
In summary, however, since this was the first in human trial to determine the effects of
propionate supplementation on energy expenditure and substrate oxidation during exercise
and no effect was present, it is currently difficult to draw any conclusions at this point. Future
studies are henceforth needed to confirm these effects bearing as well the above-mentioned
factors.
3.11.5 The impact of Propionate on energy metabolism:
Several propositions exist that can explain the effect of propionate on whole-body energy
expenditure and lipid oxidation identified in the current studies. Available data from animal
research suggests that propionate can increase energy expenditure via increases in lipid
oxidation by acting on several tissues and organ sites (Sukkar et al., 2019) as discussed below.
3.11.5.1.1 The impact of Propionate on hepatic energy metabolism:
At the hepatic level, propionate has been shown to decrease Pparg activity which would
ultimately increase energy expenditure and lipid oxidation by activating the UCP2-AMPK-ACC
pathway. Pparg acts as a potent regulator of UCP2 expression, fatty acid oxidation and overall
lipid metabolism. Increased expression of mitochondrial UCP2 in hepatocytes leads to an
increase in proton leak and a decrease in AMP: ATP ratio which serves as a reflection of the
energy state of the cell as well as a direct activator of AMPK. Activation of AMPK in turn leads
to a downregulation of malonyl-CoA, an endogenous inhibitor of CPT- 1, the first enzyme in
the b-oxidation of lipids thereby acting as a switch from lipid synthesis to oxidation. Indeed,

134
this mechanism was confirmed when using liver specific Pparg-KO mice where the KO mice
no longer exhibited the propionate induced increase in hepatic lipid oxidation, decrease in
hepatic steatosis and any other effect on hepatic Pparg target genes (den Besten et al., 2015).
This proposed mechanism may uphold in humans and in the present findings since previous
investigations in suddenly deceased individuals have shown that the majority of propionate
(~90%) is taken up and metabolised by the liver with very little entering the systemic
circulation (Cummings et al., 1987). Indeed, this may be since long term supplementation of
propionate in the form of inulin propionate ester has been shown to decrease obesity-related
fatty liver disease in rodents (Zhu et al., 2020) Furthermore, this was also seen in humans
where long term supplementation of propionate for 24 weeks in the form of an inulin
propionate ester was shown to decrease intrahepatocellular lipid content in overweight
individuals with non-alcoholic fatty liver disease (Chambers et al., 2015).
3.11.5.1.2 The impact of Propionate on adipose tissue energy metabolism:
Propionate also seems to induce changes in adipose tissue that can promote increases in
energy expenditure and substrate oxidation which can explain the increase in resting and
postprandial energy expenditure and overnight fasted lipid oxidation observed in this trial. In
white adipose tissue, den Besten et al. showed that propionate can elicit a UCP2-AMPK-ACC
cascade similar to that observed in hepatic tissue via downregulation of Pparg, which
ultimately increases both energy expenditure and lipid oxidation. By using adipose specific
Pparg-KO mice, this theory was confirmed since the propionate fed KO mice no longer
exhibited reductions in white adipose tissue mass and body weight in comparison to the wild-
type propionate fed mice. Also, the increased lipid oxidation observed in the wild-type mice,
was abolished in the knock-outs (den Besten et al., 2015). Propionate was also shown to
improve overall lipid homeostasis by enhancing the lipid buffering capacity of WAT. Jocken et
al. showed that treatment of human adipocytes with a high propionate SCFA mixture at (1
μmol/L) and supraphysiological (1 mmol/L) concentrations for 6 hours can attenuate
intracellular lipolysis as assessed via decreased basal glycerol release in comparison to control
cells (Jocken et al., 2018). Since WAT is not typically classified as a metabolically active tissue,
the effects of propionate on EE and substrate oxidation may be driven by more metabolically
active tissue or processes such as ‘beiging of WAT” (Carpentier et al., 2018). Indeed, in a
murine mice model, Lu et al has shown that propionate when supplemented to an HFD can

135
significantly suppress typical metabolic changes associated with an HFD such as diet induced
weight gain, increases in triglyceride and cholesterol concentrations and inflammatory
markers in comparison to an HFD control. This was mainly mediated via FFAR2/3 and the
upregulation expression of rate limiting enzymes involved in lipid oxidation such as cpt1 and
cpt2 in adipose tissue and the expression of genes related to mitochondrial biogenesis namely
(PGC-1a, NRF-1, Tfam, β-F1-ATPase, COX IV and cyt-c) ) as well as promoting beige
adipogenesis as evidenced by emerging beige adipocytes in white lipid depots and increases
in beige adipocyte markers (Tbx1, Tmem26, CD137) which result in increased energy
expenditure and lipid oxidation (Lu et al., 2016).
3.11.5.1.3 The impact of Propionate on skeletal muscle energy metabolism:
The observed increase in energy expenditure and lipid oxidation in this trial can also be
explained by the effects of propionate on skeletal muscle. Murakami et al. showed that
propionate at physiological concentrations (0·1and 0·3mM) typically seen in humans and
rodents can increase mRNA and protein expressions of UCP-1 in C2C12 cells which hence can
increase energy expenditure by uncoupling the oxidation of fuels, especially lipids, from ATP
production to be released as heat (Murakami et al., 2015) .
3.11.5.1.4 The impact of Propionate on SNS activity:
Another likely mechanism that can explain the effects of propionate supplementation on
energy expenditure in this study can be attributed to changes in the SNS activity. Studies have
previously reported that propionate can regulate the vagal system to support increases in
energy expenditure. For instance, in a rodent model, Kimura et al. showed that
intraperitoneal injection of a high dose of propionate (1g/kg) can stimulate SNS via FFAR-3.
This was mainly seen via significant increases in heart rate and oxygen consumption which
reflect increases in energy expenditure in wild type mice in contrast to FFAR-3 (-/-) KO mice
(Kimura et al., 2011). In the present investigation, there was a significant impact of propionate
on SNS activity in the overnight, fasted state as seen with a stimulatory increase in heart rate
and blood pressure. This was however only seen in the overnight fasted state in one of the
trials (Overnight fasted trial), but not in others. This may be since the dose used in the animal
study was much higher than the one used presently where daily propionate production in

136
humans equates to 29.5 mg/kg/d (Overnight fasted trial: 1977 ± 100 mg/d; Post-prandial trial:
2115 ± 86 mg/d; Sub-maximal Exercise trial: 2159 ± 97 mg/d as estimated from participants’
body weight) and may also be due to the difference in mode of supplementation. Another
more likely reason is that HR and MAP measurements were only measured once by the end
of each hour, albeit the sub-maximal exercise study where they were also taken every 15
minutes during the exercise period, and thus a continuous measurement of both factors may
have yielded varying results given the encouraging effect on heart rate and blood pressure in
one of the trials. With respect to the PP trial, HR was decreased with propionate
supplementation in comparison to control. However, since baseline HR measurements were
significantly different between trials, whether propionate can actually decrease HR post-
prandially remains questionable and must be interpreted with caution. Future studies will
hopefully clarify this further perhaps by using more reliable methodologies such as
continuous heart rate variability or microneurography (Zygmunt and Stanczyk, 2010,
Seravalle et al., 2013),
3.11.5.1.5 Other potential mechanisms:
Another proposed mechanism that can explain the positive effects of propionate on energy
homeostasis is via intestinal gluconeogenesis (IGN). De Vadder et al. showed that mice on a
standard diet supplemented with propionate at (5% wt/wt) can reduce body weight and
adiposity when compared with mice on standard diet control despite similar energy intake.
This was mediated via the gut-brain neural circuit and FFAR-3 where propionate as a substrate
of intestinal gluconeogenesis can be converted into glucose before reaching the liver and
sensed by the brain which ultimately promotes the observed metabolic benefits. This was
also later confirmed using IGN KO mice where the KO mice on an HFD rich in propionate were
no longer protected from diet induced obesity in comparison to WT mice (De Vadder et al.,
2014).
3.12 Study Limitations:
This study is not without its limitations. For one, due to feasibility, it was not possible to use
the same mode of indirect calorimetry for all studies. In the EX trial, a face mask was used
instead of the canopy, and the use of a facemask can overestimate oxygen consumption and

137
resting energy expenditure by ~ 7% (p<0.05) and carbon dioxide production by 4.1% (p>0.05)
in comparison to the canopy as mentioned earlier. REE however can be similar across both
methods (Forse, 1993). Further, the present methodology could not provide direct evidence
on whether the perceived increase in lipid oxidation was due to propionate oxidation or due
to oxidation of endogenous sources of lipids. Indeed, RER is a rough index and cannot
distinguish between the oxidation of CHO and lipids mixture and that of SCFA (Caballero et
al., 2003). Also, the current research as well as all previous work involving the effect of
propionate on energy expenditure and substrate oxidation have not included an energy
matched control. Therefore, introducing an energy matched control such as palmitate (4
mmol) can provide a better overview of the predominant source of lipid oxidation. Moreover,
carbon-13 labelled propionate can also be used to assess when propionate is being oxidized
in relation to when the increase in whole body lipid oxidation occurs which again clarifies the
main source of lipid oxidation. Another limitation in the PP trial is that the post-prandial phase
was measured for only two hours which is shorter than the recommended post-prandial 6-
hour measurement. However, if an effect of propionate on energy expenditure and substrate
oxidation were to occur, it ought to be within the early post-prandial phase as the majority of
DIT(~60%) occurs in this phase (Melzer, 2011). Also, in the PP trial, the meal provided via the
Ensure drink was not tailored to participants’ individual energy requirements and thus ranged
from (5.1-9.4 kcal/BW). An additional limitation of the study is that HR and MAP
measurements, as secondary outcomes, were only marginally recorded throughout the trials.
Therefore, future follow up studies, using more reliable methodologies such as continuous
heart rate variability or microneurography (Zygmunt and Stanczyk, 2010, Seravalle et al.,
2013), can better determine the effects of gut absorbed propionate on SNS activity.
Thus, as per the positive present findings, future human studies are warranted to assess the
full effect of propionate supplementation on energy expenditure and substrate oxidation
using a 24-hour respiratory chamber.
Another limitation of the trial is that it only examined acute effects of sodium propionate
supplementation on energy expenditure and substrate oxidation so whether the same effects
can be replicated with long-term propionate supplementation or would the body adapt
chronically is yet to be determined. This could be a very interesting area for future research.

138
Previous work by Chambers et al. that supplemented overweight individuals over a period of
24 weeks with 10g of IPE demonstrated that body weight gain was prevented in the
intervention group in comparison to individuals who received 10g of inulin ester control,
where none of the participants experienced significant weight gain of >5% of baseline weight
in the IPE group in comparison to 17% in the inulin control, despite instructions on
maintaining the same physical activity throughout the supplementation period. Moreover,
energy intake seemed to be unchanged between the two groups as assessed by an ad libitum
meal after 24 weeks. Thus, it could be assumed that energy expenditure was increased with
IPE supplementation that prevented the weight gain observed in the inulin group. Also, body
composition was significantly altered in the IPE group in comparison to control whereby
intraabdominal adipose tissue was significantly reduced and a trend (p=0.061) for decreased
intrahepatocellular content was observed in the IPE group that was significant in participants
that met the diagnostic criteria for non-alcoholic fatty liver disease which indicate that lipid
oxidation was enhanced in the IPE group (Chambers et al., 2015). These findings hence signify
that the effects of propionate supplementation on energy metabolism may uphold even
chronically. However, future long-term studies are needed to determine that whereby direct
measures of energy expenditure and substrate oxidation such as use of indirect calorimetry
at the end of supplementation period as well as energy intake are assessed to determine
changes in energy metabolism.
3.13 Conclusion:
Acute ingestion of oral sodium propionate in healthy human volunteers can increase energy
expenditure and lipid oxidation and decrease CHO oxidation after an overnight fasted state
which seems to be mediated via SNS activity stimulation. It can also increase energy
expenditure post-prandially with no preferred use of a substrate. However, acute oral sodium
propionate ingestion seems to have no effect on energy expenditure and substrate oxidation
during sub-maximal exercise. These findings support my hypothesis in the overnight, fasted
state and post-prandially but not during sub-maximal exercise. As discussed earlier, there are
multiple factors that may have contributed to the discrepancy in findings. Nevertheless, this
study is the first in human study to provide direct evidence that acute oral ingestion of sodium

139
propionate can modulate energy expenditure and substrate metabolism in different energy
states positively and thus, given these findings, future follow up studies can use a 24-hour
respiratory chamber and perhaps a continuous measurement of SNS activity to assess the full
effect of oral sodium propionate supplementation on energy expenditure and substrate
oxidation. Moreover, future interventions can utilize an energy-matched control since all
previous trials, both rodent and human studies including the current study, that have
investigated the effects of propionate on energy metabolism have not employed an energy
matched control which would be very useful in order to clarify whether the effects of
propionate on energy and substrate metabolism are sustained independent of the
propionate’s caloric value.

140
Chapter 4: Effect of Sodium Propionate on Appetite Regulation
4.1 Abstract:
Background:
Previous research in healthy humans has demonstrated that acute oral sodium propionate
supplementation can affect appetite by increasing subjective nausea in an overnight fasted
state. Raised levels of propionate in the gut lumen have also been shown to stimulate release
of the anorectic hormone glucagon-like peptide 1 (GLP-1). However, currently, no human
study has examined if propionate supplementation can affect appetite during physical activity
and in the postprandial state. Therefore, the objective of this chapter was to investigate the
acute effect of oral sodium propionate supplementation (71 mmol) on subjective measures
of appetite, nausea and GLP-1 levels in different energy states (overnight fasted, sub-maximal
exercise and post-prandial) in healthy human volunteers.
Methodology:
The trial consisted of three separate studies:
Overnight fasted study: 19 volunteers (11 males and 8 females; age: 34.6 ± 4.1 years; BMI
(body mass index): 23.1 ± 0.7 kg/m2) completed the two study visits after an overnight fast.
Sub-maximal exercise study: 19 volunteers (14 males and 5 females; age: 42.7 ± 3.5 years;
BMI: 24.5 ± 0.7 kg/m2) completed a maximal exercise test visit and two study visits.
Post-prandial study: 19 volunteers (12 males and 7 females; age: 45.0 ± 3.5 years; BMI: 24.8
± 0.8 kg/m2) completed two study visits.

141
Each of these studies was a randomized controlled double-blind cross-over study. In each
study, following an overnight fast, tablets containing either 6845mg sodium propionate or
4164mg sodium chloride (Control) were first administered over 180 min.
Overnight fasted study: The study extended over a total period of 360 min while volunteers
remained fasted for the duration of the study.
Sub-maximal exercise study: The study extended over a total period of 240 min. At time-
point 180 min, exercise was introduced where participants started cycling on a cycle
ergometer at 40% of VO2 max determined from their maximal exercise test visit for a period of
one hour.
Post-prandial study: The study extended over a total period of 300 min. At time-point 180
min, a mixed calorie liquid meal (Ensure Original Vanilla Nutrition Shake: 72.7 g carbohydrate,
13.6 g fat and 20.5 g protein; 500 kcal) was provided to volunteers.
Participants were asked to complete 100mm visual analogue scales (VAS) that assessed
subjective appetite (hunger, thirst and nausea) throughout these visits. GLP-1 release was
also measured during the post-prandial trial.
Results: Overnight fasted study:
Oral sodium propionate supplementation increased subjective nausea in the overnight fasted
state (Control= 3.5 ± 1.39 mm; Propionate= 8.9 ± 2.70 mm; Effect of trial p= 0.029;+iAUC0-360
min p=0.006) over a period of 360 min with no effect on subjective hunger (Control= 48.0± 4.11
mm; Propionate= 44.8± 5.25 mm; Effect of trial p= 0.417) or thirst (Control= 24.7± 5.43 mm;
Propionate= 23.2± 5.25 mm; Effect of trial p= 0.580).

142
Sub-maximal exercise study:
Oral sodium propionate supplementation increased subjective thirst (Control= 39.8 ± 5.3 mm;
Propionate= 46.8 ± 5.4 mm; Effect of trial; p=0.015) during sub-maximal exercise (Control: 48
± 2 % ; Propionate: 47 ± 2% VO2max) with no effect on subjective hunger (Control= 51.7 ± 5.7
mm; Propionate: 57.2 ± 5.3 mm; Effect of trial: p=0.258) or nausea (Control= 2.9 ± 1.1 mm;
Propionate: 6.7 ± 3.4 mm; Effect of trial: p=0.295).
Post-prandial study:
Oral sodium propionate supplementation increased GLP-1 secretion (iAUC0-180 min p= 0.004;
and +iAUC0-180 p=0.016) in the overnight fasted state, but not during the postprandial period.
Propionate supplementation increased subjective nausea (+iAUC180-300 p=0.049) but had no
effects on subjective hunger or thirst.
Conclusion:
This was the first trial in humans to examine the impact of acute ingestion of oral sodium
propionate (71 mmol) in healthy human volunteers in different energy states (overnight
fasted, sub-maximal exercise and post-prandial). Findings revealed that acute propionate
supplementation stimulated feelings of nausea during fasted and post-prandial states and
increased subjective thirst during sub-maximal exercise. Moreover, oral sodium propionate
can stimulate GLP-1 release in the overnight fasted state.
4.2 Dietary Fibres and Appetite Regulation:
It is estimated that around 40% of the world’s population is either overweight or obese.
Europe has identified to be amongst the top two regions worldwide, along with the Americas,
to have the highest prevalence of overweight and obesity (Chooi et al., 2019). Evidence
suggests that the average weight gain (0.5-1 kg/year) observed in middle-age adults could be
the result of a relatively small surplus of 50 kcal /d, which could be reversed by decreasing
excess energy intake and/or increasing energy expenditure by a 100 kcal/d while assuming a
50% efficiency rate (Hill et al., 2003, Zhai et al., 2008). However, even such a small increase in

143
habitual weight gain is significantly associated with multiple comorbidities such as type 2
diabetes, cardiovascular disease and some types of cancers (Zheng et al., 2017). Therefore,
interventions generally accepted at the population level to suppress appetite and energy
intake are highly attractive and urgently needed.
Epidemiological studies consistently describe an inverse association between dietary fibre
(DF) intake and weight gain (Bozzetto et al., 2018). A prospective, European cohort study
including 89,432 individuals who were followed up for 6.5 years showed that total fibre intake
was inversely associated with weight gain and waist circumference increase. For instance,
every 10g increase in total fibre intake was associated with a 39g/year reduction in body
weight (BW) and 0.08cm/year decrease in waist circumference. Also, every 10g increase in
cereals intake was associated with a 77 g/year and 0.10 cm/year decrease in BW and waist
circumference, respectively (Du et al., 2010). Also, the Nurses’ Health study, which included
74,091 female subjects, showed over a 12-year period, an increase in 12g of dietary fibre
intake, is associated with 3.5 kg less weight gain (Liu et al., 2003). Increased intake of DF is
also shown to have favourable effects on appetite regulation (Slavin and Green, 2007,
Wanders et al., 2011). This is mainly due to the different physiological characteristics of DF
that enable it to have a profound effect on both satiation and satiety. Satiation can be defined
as an intrameal satiety that results in meal termination and therefore controls meal size,
whereas satiety can be defined as inter-meal satiety that develops after an eating episode
and results in inhibition of further eating and increase in fullness thereby influencing the
timings of the next meals (Blundell et al., 2010, Hervik and Svihus, 2019)
4.3 Short Chain Fatty Acids and Appetite:
A growing body of evidence suggests that the effect of DF on appetite regulation may be
related to the fermentability of DF and the production of the short chain fatty acids (SCFA):
acetate, propionate and butyrate (Wanders et al., 2011, Hervik and Svihus, 2019). Various
mechanisms have been proposed to explain how raised production of SCFA in the gut could
supress short-term appetite response and energy intake:

144
4.3.1 SCFA and Central Nervous System:
The Central Nervous System (CNS) plays a pivotal role in the complex interplay between gut
hormones and CNS to influence food intake and appetite regulation. Within the CNS, the
hypothalamus is identified to be the key regulator of appetite. A semipermeable blood–brain
barrier also exists that allows peripheral signals, such as hormones and nutrients, to gain
access to the CNS. The hypothalamic arcuate nucleus (ARC), found at the base of the
hypothalamus, receives long-term and short-term humoral signals which communicate
general health, and meal initiation and termination respectively. Moreover, the ARC contains
gut hormone receptors and two sets of appetite regulating neurons: the pro-
opiomelanocortin (POMC) appetite-inhibiting neurons, and the neuropeptide Y (NPY) and
agouti-related peptide (AgRP) appetite- stimulating co-expressing neurons. Along with the
hypothalamus, the brainstem plays an integral role in appetite regulation where it receives
neural, nutrient and hormonal signals from the gastrointestinal tract (GI) in a manner similar
to the hypothalamus. In particular, the DVC (dorsal vagal complex) in the brainstem relays
signals from the periphery and hypothalamus to control energy intake. Also, the vagus
communicates the transmission of afferent and efferent neural signals between the nucleus
of the tractus solitarus in the DVC and the GI (Perry and Wang, 2012, Hussain and Bloom,
2013). Li et al. showed that acute oral butyrate administration via an intragastric tube in mice
can significantly decrease food intake by inhibiting orexigenic neuron activity in the
hypothalamus such as NPY. To confirm that the gut-brain neural circuit is responsible for the
apparent decrease in energy intake and not increased butyrate concentrations in circulation,
butyrate was administered directly into circulation by intravenous injection. However,
although butyrate concentrations were significantly raised, this did not influence acute
refeeding or food intake within 24 hours which implicates that the main mechanism involved
is via the direct gut-brain neural circuit. Moreover, chronic butyrate supplementation to an
HFD in mice in the form of sodium butyrate for 9 weeks resulted in a significant (22 %)
decrease in energy intake and BW (27%) in comparison to mice on an HFD control, without
influencing physical activity. This was also confirmed via subdiaphragmatic vagotomy where
mice receiving the sham surgery reduced cumulative food intake whereas those receiving the
subdiaphragmatic vagotomy failed to reduce food intake (Li et al., 2018).

145
Frost et. al showed that acetate whether administered via colonic or i.v. infusion in mice
results in acute suppression of energy intake. The authors demonstrated that i.p.
(intraperitoneal injection) of acetate at a rate of 500 mg/kg was associated with a significant
decrease in acute food intake 1- and 2-hours post-injection with no association with aversive
behaviour or changes in gut hormone secretion such as PYY and GLP-1 levels. Moreover,
central administration of acetate (2.5 µmmol of sodium acetate) directly into the third
ventricle also resulted in suppression of food intake primarily 1-2 hours post-injection
although the effect was less potent than i.v. administration. Subsequent investigations
showed that mice given an i.p. injection of acetate resulted in a significant increase in signal
intensity in ARC, a four-fold increase in POMC expression and a strong reduction in AgRP
expression after hypothalamic take up and metabolism of acetate. This was mainly mediated
via acetate induced reduction of hypothalamic AMPK catalytic activity (Frost et al., 2014b).
Moreover, Byrne et. provided the first in human evidence that increased colonic propionate
production via an inulin propionate ester (IPE) (10g) that directly delivers propionate to the
colon, can influence energy intake in healthy non-obese men by attenuating reward-based
eating behaviour by decreasing blood oxygen level dependent (BOLD) signal via central
appetite regulation. Volunteers experienced reduced BOLD signals when evaluating pictures
of food with high energy density in comparison with food of lower energy density when
colonic propionate levels were acutely increased which was associated a significant decrease
in subsequent ad libitum energy intake (~10%) (Byrne et al., 2016).
In summary, it appears that SCFA’s effect on appetite in both humans and animals may be
facilitated by the CNS.
4.3.2 SCFA receptors and anorectic gut hormone release:
The SCFA are ligands of FFAR-2 (free-fatty acid receptor 2) and FFAR-3 (free-fatty acid
receptor 3) present on L cells in the intestine, which are endocrine cells that produce and
secrete the anorexigenic hormones peptide YY (PYY) and glucagon-like peptide-1(GLP-1)
(Byrne et al., 2015). GLP-1 is an anorectic hormone mainly produced in the ileum with levels
rising in parallel to energy intake, particularly after a high carbohydrate meal. GLP-1 is shown
to inhibit energy intake directly via central mechanisms and also indirectly by affecting gut
motility. Indeed, GLP-1 acts as an ‘ileal brake’ whereby stomach and gut motility are

146
synchronised to ensure a stable flow of nutrients into the small intestine thus regulating
appetite (De Graaf et al., 2004, De Silva and Bloom, 2012, Van Bloemendaal et al., 2014).
Similarly, PYY, an anorexigenic hormone, is a peptide produced by L-cells in the gut and is
found in the highest concentrations in the distal small intestine and colon. PYY concentrations
peak post-prandially, the magnitude of which rises in proportion to the energy content
ingested and is mainly stimulated by a high-fat diet. PYY is also thought to affect gut motility
and can act as an ‘ileal brake’ delaying gastric emptying thereby promoting sensations of
fullness and satiety. Moreover, it can affect appetite directly via vagal and central
mechanisms to inhibit energy intake and suppress appetite (Karra et al., 2009, De Silva and
Bloom, 2012). FFAR-2 seems to be mainly activated by acetate and propionate while FFAR-3
is mainly activated by propionate and then by acetate and butyrate to a similar extent.
However, this mainly depends on interspecies variability (Byrne et al., 2015). FFARs initiate
their signalling via coupling with G-proteins. FFAR-3 is mainly coupled with Gi/Go family.
FFAR-2, on the other hand, is mainly coupled with Gq -proteins and possibly with Gi/Go
pathways (Covington et al., 2006). Rodent and human studies have portrayed SCFA’s ability
to induce gut hormone release and subsequent energy intake predominately via these
receptors. Using primary murine colonic cultures, Tolhurst et al. showed that acetate and
propionate are able to stimulate GLP-1 secretion via both receptors, co-expressed on L- cells,
but to a much greater extent via FFAR-2. This was confirmed since the SCFA triggered the
elevation of intracellular Ca2+ in L-cells that is specific to Gq signalling pathway and hence
FFAR-2 activation. Moreover, this was further confirmed in vivo where mice lacking FFAR-2
exhibited diminished basal and glucose-stimulated GLP-1 levels (Tolhurst et al., 2012). Using
physiological concentrations of SCFA (2 mM), Larraufie et al. showed that propionate and
butyrate in particular, are able to stimulate PYY gene expression and secretion in human but
not rodent enteroendocrine cells. This was mediated via two mechanisms: one via stimulation
of FFAR-2 by all the SCFA, and the second and more dominant pathway is via propionate and
butyrate inhibition of histone deacetylases. The increased PYY gene expression resulted in
increased PYY secretion under basal and stimulated conditions since the observed effect was
time and dose dependent, which indicates that SCFA may induce PYY secretion in both the
fasted and fed states (Larraufie et al., 2018). Also, Psichas et al. showed in primary murine
colonic crypts that physiological concentrations of propionate (1–50mmol/L) can significantly
increase PYY and GLP-1 secretion, with higher doses eliciting a greater response (~ 2-fold).

147
This was mediated via FFAR-2 since primary colonic cultures obtained from FFA2- deficient
mice had signfciant attenuation of gut hormone release. Similar observations were also
confirmed in vivo, where an intra-colonic injection of 180 mmol/L of propionate vs saline
control in rats resulted in a significant 1.3- and 1.6-fold increase in portal vein PYY and GLP-1
levels respectively, while no change was observed in FFAR-2 deficient mice (Psichas et al.,
2015).
Independent of FFARs activation, SCFA have also shown to influence appetite and regulate
gut hormone expression. Lin et al. showed that mice on a high fat diet (HFD) supplemented
with butyrate or propionate in the form of sodium salts and 5% wt/wt can lead to a reduction
in food intake. A follow up titration study confirmed that the effective dose for food
suppression is 5% and 4.3% for butyrate and propionate respectively. Moreover, acutely,
sodium butyrate supplementation was shown to significantly increase GLP-1 concentration.
Using FFAR-3 KO mice and comparing them with controls showed that the SCFA induced
suppression of energy intake was independent of FFAR-3 activation since the KO and controls
exhibited similar behaviour. However, the KO mice displayed attenuated GLP-1 secretion with
butyrate supplementation which portrays that butyrate stimulation of gut hormones is
partially mediated via FFAR-3 activation. Interestingly as well, butyrate supplementation was
able to significantly increase ghrelin expression in the KO mice. The authors suggested that in
addition to the influence of the SCFA on gut hormone secretion, it is possible that the impact
of food intake could be related to a decrease in palatability with butyrate and propionate
supplementation, although mice did not exhibit any signs of overt malaise (Lin et al., 2012).
In summary, it is quite evident that SCFA are able to stimulate anorexigenic gut hormone
release, mainly PYY and GLP-1 expression that are known to reduce appetite. However,
intriguingly, whether this is achieved via FFAR-2/3 activation remains to be established and
given the current evidence, it appears SCFA are able to stimulate PYY and GLP-1 expression
by acting on these receptors and also independent of them.
4.3.3 SCFA and leptin secretion:
Apart from the influence of SCFA on gut hormone expression, SCFA have been shown to
stimulate other anorexigenic hormones such as leptin secretion. Leptin is a potent

148
anorexigenic hormone that is released into circulation from adipose tissue as a function of
energy stores and can cross the blood brain barrier and suppress energy intake by acting on
hypothalamic leptin receptors in the central nervous system. Indeed, Satoh et al.
demonstrated that the ventromedial hypothalamus (VMH) plays a vital role in mediating
leptin effects. After acute exogenous leptin infusion via iv (1.0 mg/rat) or
intracerebroventricular (2.0 g/rat) injection, rats exhibited a 57% and 91% decrease in food
intake versus vehicle-treated groups. In contrast, this effect was no longer present in VMH
lesioned rats (Satoh et al., 1997). Leptin has also been shown to regulate the expression of
orexigenic such as neuropeptide Y and agouti-related protein as well as anorexigenic peptides
such as pro-opiomelanocortin (POMC) (Klok et al., 2007).
Xiong et al. showed that SCFA can stimulate leptin secretion from a primary culture of mouse
white adipose tissue and adipocyte cell line through FFAR-3 activation via Gai pathway. Also,
in vivo, oral propionate supplementation (200 µl of 2.5 M sodium propionate solution) was
shown to increase leptin concentrations in mice by ~80%, however, this was not sufficient to
suppress food intake (Xiong et al., 2004). On a contradictory note, Zaibi et al. showed that
FFAR-3 is not expressed in murine adipose tissue although leptin secretion in the presence of
SCFA was decreased in FFAR-3 KO mice. The authors suggested that this might be due to
downregulation of FFAR-2 expression in the adipose tissue of the KO mice. Moreover, they
showed that acetate and propionate are able to stimulate leptin secretion from mesenteric
and epididymal adipose tissue respectively via FFAR-2 Gai signalling (Zaibi et al., 2010).
Similarly, Hong et al. showed that FFAR-3 is not present on mice adipose tissue whereas FFAR-
2 is expressed on 4 different adipose tissue. Moreover, they showed that treating 3T3-L1 cells
with propionic acid can elevate FFAR-2 and leptin mRNA levels (Hong et al., 2005).
In summary, increased leptin secretion associated with SCFA administration may also provide
an explanation of SCFA apparent suppression of appetite.
4.3.4 SCFA and Gastric Tract Motility:
The gut, as the primary organ where food is processed, plays a key role in the regulation of
satiety and satiation via different mechanisms such as meal volume, nutrient composition and
gastric motility. Moreover, the GI tract relays neural signals to the brainstem regarding the

149
chemical, mechanical and nutritive properties of ingested food via afferent vagus nerves
mechanoreceptors and chemoreceptors that are sensitive to intraluminal distention and
chemical stimuli respectively. Gastric motility appears to be the major determinant of satiety
and satiation where delayed gastric emptying has been associated with increased feeling of
satiety and termination of food intake (Janssen et al., 2011, Hussain and Bloom, 2013). SCFA
have been shown to influence gastrointestinal motility throughout the digestive tract. In the
stomach, cecal infusions of a SCFA mixture has shown to delay gastric emptying in humans in
a dose dependent manner by promoting the relaxation of the proximal stomach. This thus
implicates that SCFA can contribute to the ileocolonic brake (the inhibition of gastric emptying
upon nutrient reach to the ileo-colonic junction) (Cherbut et al., 1997). Moreover, in the
terminal ileum, Richardson et al. showed that an ileal infusion of an acetic acid solution (20
mM, 50 mM, and 100 mM) and butyric solution (100 mM) in rats can significantly stimulate
ileal emptying thus protecting ileal mucosa from colonic content reflux. This effect was also
more pronounced at higher concentrations and for shorter chain fatty acids (Richardson et
al., 1991). Yajima et al. also showed that intravenous injection of propionate (1.2 mg/kg) and
butyrate (1.4 mg/kg) can increase ileal motility by stimulating a biphasic contraction
consisting of an initial phase and subsequent tonic contraction (YAJIMA, 1984). As for the
effect on colonic motility, SCFA may have an inhibitory effect. Squires et al. showed that in
vitro that SCFA delivered as a mixture or alone can significantly reduce the contractile activity
across the different ranges of the large bowel of rats. The effect seemed to be dose
dependent where colonic motor activity was prominently reduced at 100 mM in comparison
to 10 mM concentrations. However, sodium salts of the SCFA displayed no effect on colon
contractile activity (Squires et al., 1992). In healthy human volunteers, Jouet et al. showed
that intracolonic infusions of a SCFA mixture has no effect on colonic motility (Jouet et al.,
2013).
The mechanisms of SCFA on gastrointestinal motility is not yet fully understood. However,
one possible mechanism is via neuro-hormonal pathway that involves PYY release (Cherbut,
2003). Indeed, Cherbut et al. showed that intracolonic infusion of SCFA at a rate of 2 mmol/h
in mice can reduce colonic motility and increase transit time while stimulating PYY peripheral
concentrations. The effect on gastric motility seems to be mediated by PYY since PYY anti-
serum suppressed the colonic myoelectrical activity and inhibited the SCFA induced decrease

150
in colonic motility (Cherbut et al., 1998). Similarly, Ropert et al. showed that intracolonic
infusions of SCFA in healthy human volunteers can significantly decrease proximal gastric
tone that coincided with a significant increase in PYY but not GLP-1 concentrations (Ropert et
al., 1996). It is quite plausible that PYY can mediate such effects since PYY has been shown to
act as an ‘ileal brake’ and can thus inhibit gastric emptying (De Silva and Bloom, 2012).
In summary, SCFA may have varying effects on gastrointestinal motility that can hence reduce
appetite. This seems to be mainly mediated by SCFA delay of gastric emptying and colonic
motility possibly via PYY release.
4.3.5 Propionate and Hepatic Metabolism:
In addition to the proposed mechanisms mentioned, propionate in comparison to other SCFA,
has a distinct effect on hepatic metabolism that could in turn influence appetite regulation.
Propionate is a known precursor for hepatic gluconeogenesis where it enters the TCA
(tricarboxylic acid) cycle at the level of succinyl-CoA and is then converted to oxaloacetate
and then ultimately into glucose (den Besten et al., 2013b). Indeed, the liver in both humans
and animals is estimated to take up a substantial amount of propionate (90%-95%) from the
portal vein (Cummings et al., 1987, Bergman, 1990) however the contribution of propionate
to hepatic gluconeogenesis depends on the species. In ruminants, it is estimated that
between 50-75% of the glucose requirements of the animal is met by hepatic gluconeogenesis
from propionate (Bergman, 1990). Evidence from animal studies also suggests that the liver
plays an important role in communicating energy status to the brain and vice versa via hepatic
vagal afferents (Arora et al., 2011, Fam et al., 2012). Sodium propionate infusion in ruminants
have consistently shown to have hypoghagic effects (Farningham and Whyte, 1993, Elliot et
al., 1985, Oba and Allen, 2003) which seems to be mediated via hepatic-brain-axis since
effects on appetite are abolished with vagotomy and vagal nerve blockage (Forbes, 1988,
Allen, 2000, Arora et al., 2011, Sa'ad et al., 2010). As the vast majority of evidence on the role
of the liver and hepatic gluconeogenesis in mediating the hypoghagic effects of propionate
comes from ruminant studies, great caution must be used when translating these results to
humans. In humans, limited data exists on estimating hepatic gluconeogenesis from
propionate. However, a stable isotope study has shown that only a small fraction (6 %) of gut
derived propionate can be utilized for hepatic gluconeogenesis rather than be directly

151
oxidized, although the post-prandial nature of the study may have underestimated the
amount of propionate that could be used for gluconeogenesis after an overnight, fasted state
(Boets et al., 2017). It is noteworthy, however, that the liver is a key anabolic organ in humans
contributing ~20% of resting energy expenditure (Kummitha et al., 2014). Therefore, it is
highly possible that changes in hepatic glucose production and metabolism could be sensed
centrally by the brain which can in turn influence appetite and feeding behaviour.
4.3.6 Conclusion:
A review of available evidence highlights that SCFA can influence appetite by exerting multiple
effects on various organs and tissue sites, as summarized in Figure A. The majority of available
mechanistic evidence comes from animal models and in vitro experiments. Hence, further
human studies are needed in order to strengthen the proposed mechanisms.
Figure 4-1: Mechanisms of how SCFA suppress appetite and energy intake:
Increasing gut-derived SCFA can: (1) stimulate the release of peptide tyrosine tyrosine (PYY) and glucagon-like-
peptide-1 (GLP-1) via the activation of free fatty acid receptor 2 and 3 (FFAR2/3) on colonic L-cells which can
inhibit gastric motility. Increased peripheral PYY and GLP-1 levels can stimulate the activity of the appetite-
suppressing pro-opiomelanocortin (POMC)/ neurons and inhibit appetite-stimulating neuropeptide Y
(NPY)/agouti-related peoptide (AgRP) neurons in the hypothalamus and brainstem (2) increase portal
concentrations of propionate which are taken up by the liver and can stimulate hepatic gluconeogenesis. This

152
can increase hepatic energy state which via vagal nerve afferents can modulate feeding behaviour. (3) increase
acetate concentrations which can cross the blood– brain barrier and increase POMC and reduce AgRP
expression. (4) increase peripheral propionate and acetate concentrations which induce leptin release from
adipocytes via activation of FFAR2. Leptin in turn inhibits NPY neurons and activates POMC neurons.
4.4 Propionate and Appetite:
Studies have highlighted how SCFA can mechanistically affect appetite. Therefore, the aim of
this section is to specifically investigate available evidence on propionate’s actual impact on
subjective appetite and energy intake.
4.4.1 The impact of Propionate on appetite in non-humans:
4.4.1.1.1 Chronic Propionate Supplementation:
4.4.1.1.1.1 Oral:
Several rodent studies have examined the chronic effect of oral propionate supplementation
on appetite, all but one of which have found no significant effect on feed intake. Boillot et al.
showed that rats fed a standard diet supplemented with 74.1 mmol/kg of propionic acid for
3 weeks had no significant effect on feed intake in comparison to mice fed a diet
supplemented with a corresponding amount of poorly fermentable cellulose. Of note, only
after week 1 on the diet, rats on the propionate supplemented diet had decreased feed
intake. The authors explained this may be due to poor palatability of the diet. However, after
adaptation to the diet, feed intake after week 1 was similar between the diets (Boillot et al.,
1995). Similarly, Berggren et al. demonstrated that oral sodium propionate ingestion in mice
fed an HFD supplemented with 26mmol/kg BW/d of sodium propionate for 19 days has no
effect on feed intake in comparison to mice who were on an HFD only (Berggren et al., 1996).
Also, De Vadder et al. showed that mice fed a standard diet supplemented with sodium
propionate (5% wt/wt) for 10 days had no effect on food intake (De Vadder et al., 2014). In
addition, Den Besten et al. showed that mice on an HFD supplemented with sodium
propionate at 5% wt/wt for 12 weeks had no effect on food intake (den Besten et al., 2015).
Moreover, Tirosh et al. showed that supplementing drinking water of mice with sodium
propionate (15 mg/kg) for 6 weeks has no effect on water intake in comparison to an

153
equivalent amount of sodium chloride added to the drinking water of the control group
(Tirosh et al., 2019). However, very recently, Zhu et al. showed that obese mice on an HFD
supplemented with IPE or propionate solutions of various concentrations can significantly
decrease food intake after 4 weeks of supplementation in comparison to mice on an HFD
alone (Zhu et al., 2020).
4.4.1.1.1.2 Infusion:
Only two non-ruminant studies have examined the effect of chronic propionate
supplementation via infusion on appetite and both have found no substantial effect on feed
intake. McBurney et al. showed that pigs receiving a portal infusion of an isomolar propionic
acid solution at a rate of 0.01 kg/BW/min, which is similar to a typical SCFA post-prandial
absorption rate, for seven days had no significant effect on feed intake (McBurney et al.,
1995). Also, Berggren et al. showed in obese hyperinsulinemic rats with a metabolic profile
similar to subjects at risk of developing metabolic disease, that rectal infusion of sodium
propionate at a rate of 4 mmol/kg BW/d for 19 days has no effect on feed intake (Berggren
et al., 1996).
In summary, animal studies demonstrate that propionate supplementation in most cases
does not have a signification impact on appetite regulation when administered orally or via
infusion for a chronic period of time.
4.4.2 The impact of Propionate on appetite in humans:
4.4.2.1.1 Acute Propionate Supplementation:
4.4.2.1.1.1 Oral:
Several human studies have examined the acute effect of propionate supplementation on
appetite and found varying but significant impact of propionate on different appetite
measures. Liljeberg et al. showed that acute ingestion of barely bread baked with a high
concentration of sodium propionate (1.9 mol) can significantly prolong the duration of satiety
in 11 healthy adults, as assessed via subjective satiety ratings in comparison to control bread
(Liljeberg et al., 1995). A subsequent study by Liljeberg et al. also showed that sourdough
bread supplemented with 1.9 mol of sodium propionate in 12 healthy volunteers prolonged

154
subjective satiety in comparison to control bread. The authors suggested this may be due to
delayed gastric emptying observed with propionate supplementation, as evidenced by
lowered blood concentrations of paracetamol, an indirect marker of gastric emptying
(Liljeberg and Björck, 1996). However, Frost et al. showed in 10 healthy volunteers that the
consumption of pasta with tomato sauce supplemented with 30g sunflower oil and 30 mmol
of sodium propionate has no effect on subjective hunger but can significantly increase post-
prandial GLP-1 levels, delay gastric emptying and increase subjective nausea (Frost et al.,
2003). Similarly, in a double blind, cross-over trial, Chambers et al. showed that
supplementing 18 healthy volunteers acutely with 71 mmol of sodium propionate over 180
min significantly raised PYY levels at 180 min in comparison to a sodium chloride control.
Moreover, subjective nausea was significantly raised with propionate supplementation
whereas subjective hunger was unchanged as assessed by the VAS (Chambers et al., 2018).
Also, in a randomized controlled trial, Chambers et al. were able to demonstrate in 20
overweight adults that acute supplementation of propionate in the form of an IPE (36.2
mmol), in comparison to an inulin control, can significantly increase post-prandial PYY and
GLP-1 levels, although subjective ratings of appetite and nausea as measured by VAS and
rates of gastric emptying remained unchanged. Moreover, they found a decrease in food
intake by around 14% in the IPE group (Chambers et al., 2015). In contrast, Ruijschop et al.
demonstrated in 43 healthy, normal-weight women that consumption of 150 ml of a non-
fermented dairy beverage containing 0.6 % of calcium propionate has no effect on ad libitum
energy intake but can significantly increase subjective feelings of fullness and decrease
subjective feelings of hunger and desire to eat (Ruijschop et al., 2008). Furthermore, in a
randomized cross-over trial involving 20 healthy subjects, Darzi et al. showed that acute
ingestion of propionate (6 mmol) in a palatable sourdough in comparison to a control bread
of similar palatability had no effect on energy intake 180 min after the bread breakfast via an
ad libitum meal and 24 hour energy intake. However, VAS (visual analogue scales) displayed
no significant effect on subjective appetite ratings except for the desire to eat something
sweet (Darzi et al., 2012). Also, Byrne et al showed in a randomized cross-over trial involving
20 healthy non-obese men, that acute supplementation of propionate in the form of an IPE
(10g) can reduce anticipatory food hedonic responses and associated BOLD signal changes
that resulted in a significantly reduced ad libitum energy intake ~10% with no effect on gut
hormone secretion (Byrne et al., 2016).

155
In summary, acute human studies demonstrate that oral propionate supplementation can
have a significant impact on various appetite measures.
4.4.2.1.2 Chronic Propionate Supplementation:
4.4.2.1.2.1 Oral:
Two human studies have examined the effect of chronic oral propionate supplementation on
appetite measures and found no significant effect on energy intake. Todesco et al. showed
that incorporation of 9.9 g of sodium propionate to bread has no significant effect on energy
intake in six healthy adults after one week of intervention in comparison to control white
bread (Todesco et al., 1991). Also, in a randomized controlled trial, Chambers et al. were able
to demonstrate in 60 overweight adults that chronic supplementation of propionate in the
form of an IPE (36.2 mmol) has no apparent effect on food intake as assessed by an ad libitum
meal. However, with IPE supplementation, there was a trend towards decreased food intake
by ~ 10%. Subjective ratings of appetite were significantly decreased with IPE with no effect
of subjective ratings of nausea. Also, PYY and GLP-1 levels remained unchanged with IPE
supplementation (Chambers et al., 2015).
In summary, few chronic human studies exist that examine the effect of oral propionate
supplementation on appetite measures, yet current evidence indicates that propionate
administration has no significant impact on appetite or energy intake.
Conclusion:
As can be deduced from rodent and human studies, the effect of propionate on appetite is
still debatable. Animal studies have focused on chronic effects of supplementation and found
no significant effect on feed intake whether propionate was administered orally or via
infusion. Human studies, on the other hand, examined the effect of acute and chronic effect
of oral propionate supplementation on appetite measures. Chronic oral supplementation
appeared to have no significant impact on energy intake although results are deduced from
only two human studies which examined this effect. Acute studies, on the other hand, were
numerous and all human studies found an effect of acute oral supplementation on appetite
however with no consensus with respect to a specific appetite measure. Noteworthy, also,

156
no acute study up to date has examined the effect of sodium propionate supplementation on
appetite in different energy states. Earlier work of Chambers et al. have demonstrated that
acute sodium propionate supplementation can increase subjective nausea in healthy
volunteers as assessed by VAS in the overnight fasted state over 180 min (Chambers et al.,
2018). However, circulating propionate levels only became significantly increased by the end
of the trial at 180 min which hence may not have been a sufficient timeframe to capture the
full effect of propionate on appetite. Moreover, this was only examined after an overnight
fasted state. Thus, the aim of this work would be to build on this previous work by extending
the timeframe and also by assessing the acute effects of sodium propionate on appetite in
healthy volunteers in different physiological states (overnight fasted, sub-maximal exercise
and post-prandial).
4.5 Hypothesis:
I hypothesised that acute oral intake of sodium propionate would reduce subjective appetite
during overnight fasted, sub-maximal exercise and post-prandial states that is mainly related
to an increase in subjective nausea. The impact of oral sodium propionate on subjective
appetite would be related to increased circulating GLP-1 levels.
4.6 Aims:
This chapter will aim to determine the acute effect of propionate bioavailability on appetite
in different energy states (overnight fasted, sub-maximal exercise and post-prandial) by
means of VAS and GLP-1 measurements.
4.7 Outcome Measures:
Measuring the acute effects of sodium propionate on appetite was a secondary outcome of
this trial. This will be assessed via VAS in all three studies: overnight fasted, sub-maximal
exercise and post-prandial. In addition, circulating levels of the anorectic hormone, GLP-1,
will be measured in the post-prandial study.

157
4.8 Measurement Tools:
Numerous methods, both objective and subjective, have been developed in order to assess
appetite, food intake and their underlying mechanism.
4.8.1 Objective Methodologies:
Objective methodologies include ad libitum food intake that evaluates in-laboratory energy
and macronutrient intake and has been shown to be a reliable and reproducible method in
different contexts such as in healthy, normal weight individuals as well as in obese subjects
(Arvaniti et al., 2000, Venti et al., 2010, Thivel et al., 2016). However, the main drawback that
could arise from a buffet -style ad libitum food intake, is overeating due to the presence of a
variety of foods which would not be an accurate representation of daily energy intake
(Arvaniti et al., 2000, Venti et al., 2010, Gibbons et al., 2019). Yet, increasing the variety
present at multi-item ad libitum test meals may not necessarily decrease the sensitivity to
evaluate perception changes in hunger and fullness (Wiessing et al., 2012). Other factors that
must be considered when employing ad libitum meals in experimental settings include
palatability, food texture, hunger state of subjects and also internal factors such as dietary
restraints (De Graaf et al., 2004, Blundell et al., 2010).
Additional objective methods for assessing appetite include measurements of biological
satiety markers such as gastrointestinal gut hormones (PYY, GLP-1 and ghrelin) that give an
indication of short and long term energy balance and other markers such as leptin changes
for longer term negative energy balance (>2-4 days) and decreases in blood glucose levels as
a marker for short-term energy balance (< 5 min). These tools are useful as they can provide
an index for the satiating effect of food as well as the physiological mechanism behind food
intake regulation (De Graaf et al., 2004, Blundell et al., 2010). GLP-1 in particular has shown
to be a reliable peripheral biomarker associated with meal termination and a predictor of
subjective appetite decrease (De Graaf et al., 2004). Gibbons et al. showed in a cross-over
trial involving 16 healthy, overweight and obese adults that GLP-1, and not PYY, is associated
with short term energy intake after an isoenergetic meal consisting of either a high fat/low
carbohydrate meal ( 50% energy from fat) or a high-carbohydrate/low-fat ( 4% energy from
fat). GLP-1 levels were negatively associated with subjective hunger measured via VAS after

158
a high fat meal and was also negatively associated with energy intake as assessed by ad
libitum energy intake after either a high fat or high carbohydrate meal. PYY concentrations,
although significantly increased after either meal, were not associated with feelings of hunger
or with energy intake (Gibbons et al., 2013). A meta-analysis including 115 individuals that
examines the acute effect of GLP-1 concentrations on acute energy intake, however, revealed
a dose dependent reduction in energy intake after an ad libitum meal with a mean of ~12 %
during GLP-1 infusions in comparison to a saline control, although the effect was more
pronounced in lean subjects rather than overweight individuals. Moreover, infusion rates
were correlated with gastric emptying where higher infusion rates resulted in greater
reductions in gastric emptying rates. Increases in plasma GLP-1 levels, however, were only
postively and negatively correlated with subjective feelings of fullness and prospective
consumption respectively, but not to differences in ad libitum energy intake (Verdich et al.,
2001).
Biological satiety markers are not without limitations. For instance, due to the rapid
degradation of the peptides, stringent procedures must be followed when collecting blood
samples such as mixing blood samples immediately with the right dose of protease inhibitors.
Moreover, post-prandial studies evaluating appetite using appetite related hormones are
often expensive and can be quite challenging to carry out. Therefore, it remains debatable as
to whether subjective markers can offer a more robust overview of appetite ratings (Gibbons
et al., 2019).
4.8.2 Subjective Methodologies:
VAS are the most commonly used subjective appetite rating scale in clinical and research
settings and their main advantage relies on their ease of design and data handling, and they
are also shown to be quite useful in monitoring appetite sensations that could be challenging
to assess via alternative methods (Livingstone et al., 2000, Stubbs et al., 2000, Gibbons et al.,
2019). VAS include a variety of appetite related questions that encompass several parameters
such as hunger, fullness, desire to eat and prospective food consumption. In most cases, VAS
are composed of horizontal straight lines 100 mm in length with words or questions at each
end describing extremes such as “I am not hungry at all” or “I am extremely hungry”. Subjects
are then asked to mark across the line their corresponding feelings. Measurement is then

159
calculated by measuring the distance between the left end of the line up to the mark. VAS
have shown to have reliable and valid results in predicting feeding behaviour in subjects
across different age groups (Barkeling et al., 1995, Flint et al., 2000, Stubbs et al., 2000, Parker
et al., 2004). However, when assessing the relationship or validity of VAS as a direct predictor
of energy intake, the correlation between the two is not quite robust. A systemic literature
review including 462 papers that examine the relationship between appetite ratings and
energy intake demonstrated that only half of the relevant papers showed a link between self-
reported appetite scores and energy intake while the other half showed that the subjective
ratings did not reliably predict energy intake (Holt et al., 2017). Moreover, from the included
studies, only a handful (6%) actually undertook statistical analysis to analyse this relationship,
and the majority failed to show a link between them. Noteworthy, however, although the
relationship between appetite scores and energy intake were independent of study factors
such as age, sex and sample size, it was dependent on ‘intervention’ type where most studies,
particularly those involving administration of GLP either subcutaneously or via intravenous
administration, demonstrated that VAS appetite scores can reliably predict energy intake.
Another issue that can arise with use of the VAS approach is reproducibility i.e. variation in
results measured at different time-points and on different test days but under the same
standard conditions. Flint et al. demonstrated that appetite ratings of VAS can be reproduced
after single test meals and are not affected by prior diet standardization when considering
the specific parameters being measured, as well as statistical aspects including sensitivity and
power calculations (Flint et al., 2000). Raben et al., on the other hand, showed that
reproducibility of appetite scores after two different test meals assessed twice on different
occasions preceded by 3 days on a standard diet, is low. The authors, however, did note that
palatability may have had an impact on the appetite ratings since hunger and food
consumption rate decreased and fullness increased when palatability decreased (Raben et
al., 1995). Further factors that may lead to poor reproducibility of VAS include biological day
to day variation in subjective hunger as well as methodological variations in study protocols
such as the order of test meals, or prior meal familiarization which can result in conditioned
satiation and even the overlap between physiological and cognitive factors, all of which must
be considered carefully when drawing conclusions using VAS (Raben et al., 1995, Flint et al.,
2000, Holt et al., 2017, Gibbons et al., 2019). Nevertheless, despite the varying issues that
could arise with the use of VAS, when analysed and interpreted cautiously bearing these

160
factors in mind, they can provide valuable information regarding processes involved in eating
behaviour regardless of their correlation with food intake or not (Blundell et al., 2010,
Livingstone et al., 2000).
4.8.3 Conclusion:
As human appetite is a quite complex process that depends on a wide range of factors, it
seems that both subjective and objective markers of appetite should ideally be combined and
interpreted together in order to give a better overview and understanding of human appetite
control.
Since measuring the acute effects of sodium propionate on appetite was a secondary
outcome of this trial, VAS were chosen as a marker for subjective appetite in all three studies
given their simplicity and minimal invasiveness. Moreover, this trial involves a repeated
measures design where within-subject treatment effects under controlled laboratory
conditions are examined, and VAS have shown to be best employed under those conditions
(Stubbs et al., 2000, Gibbons et al., 2019). GLP-1, a robust objective marker of appetite, will
also be evaluated in combination with the VAS in the post-prandial trial.
4.9 Methods:
Please refer to the Chapter 2:
4.10 Results:
4.10.1 Overnight fasted Trial:
4.10.1.1.1 Hunger:
Mean hunger concentrations between 0-360 min was not significantly different between the
Propionate and Control trials (Control= 48.0± 4.11 mm; Propionate= 44.8± 5.25 mm; Effect of
trial p= 0.417) (Figure 4:2: A). There was also no significant difference in iAUC0-360 min and
+iAUC0-360 min between trials (p= 0.336; p=0.241) respectively (Figure 4:2: B and C).

161
iAUC0-180 min and+iAUC0-180 min were similar between trials (p=0.494; p=0.369) respectively;
(Figure 4:2: D and E). There was also no significant difference in iAUC180-360 min and +iAUC180-
360 min between trials (p=0.260; p= 0.293) (Figure 4:2: F and G).
A
B
C

162
D
E
F
G
Figure 4-2: Overnight Fasted Study: Effect of oral sodium propionate supplementation on hunger:
The effect of oral sodium propionate supplementation on subjective hunger: 0 mm corresponds with “Not at
all” and 100 mm with “Extremely” A. Hunger (Time×Trial: p=0.709; Trial: p=0.417; Time: p= 0.000) B. Hunger
iAUC0-360 (p=0.336). C. Hunger +iAUC0-360 (p=0.241). D. Hunger iAUC0-180 min (p=0.494). E. Hunger +iAUC0-180 min
(p=0.369). F. Hunger iAUC180-360 min (p=0.260). G. Hunger +iAUC180-360 min (p=0.293). All data expressed as mean ±
SEM (n=19).
4.10.1.1.2 Thirst:
Mean thirst concentrations between 0-360 min was not significantly different between the
Propionate and Control trials (Control= 24.7± 5.43 mm; Propionate= 23.2± 5.25 mm; Effect of

163
trial p= 0.580) (Figure 4:3: A). Similarly, iAUC0-360 min and +iAUC0-360 min were not significantly
different between trials (p= 0.257; p=0.413) respectively (Figure 4:3: B and C).
iAUC0-180 min and +iAUC0-180 min in the Control trial was not significantly different between trials
(p= 0.207; p=0.359) respectively (Figure 4:3: D and E). There was also no significant difference
in iAUC180-360 min and +iAUC180-360 min between trials (p=0.372; p= 0.413) respectively (Figure
4:3: F and G).
A

164
B
C
D
E

165
F
G
Figure 4-3: Overnight Fasted Study: Effect of oral sodium propionate supplementation on thirst:
The effect of oral sodium propionate supplementation on subjective thirst: 0 mm corresponds with “Not at all”
and 100 mm with “Extremely” A. Thirst (Time×Trial: p=0.033; Trial: p=0.580; Time: p= 0.346) B. Thirst iAUC0-360
(p=0.257). C. Thirst +iAUC0-360 (p=0.413). D. Thirst iAUC0-180 min (p=0.207). E. Thirst +iAUC0-180 min (p=0.359). F.
Thirst iAUC180-360 min (p=0.372). G. Thirst +iAUC180-360 min (p=0.413). All data expressed as mean ± SEM (n=19).
4.10.1.1.3 Nausea:
Mean nausea concentrations between 0-360 min was significantly higher in the Propionate
trial (Control= 3.5 ± 1.39 mm; Propionate= 8.9 ± 2.70 mm; Effect of trial p= 0.029) (Figure 4:2:
A). iAUC0-360 min was not significantly different between trials (p= 0.159) (Figure 4:3: B).
However, +iAUC0-360 min was significantly higher in the Propionate trial (p=0.006) (Figure 4:4:
C).
iAUC0-180 min and +iAUC0-180 min in the Control trial were not significantly different between trials
(p= 0.210; p=0.084) respectively (Figure 4:4: D and E). There was also no significant difference
in iAUC180-360 min between trials (p=0.159). However, +iAUC180-360 min was significantly higher in
the Propionate trial (p= 0.043) respectively (Figure 4:4: F and G).

166
A
B
C

167
D
E
F
G
Figure 4-4: Overnight Fasted Study: Effect of oral sodium propionate supplementation on nausea:
The effect of oral sodium propionate supplementation on subjective nausea: 0 mm corresponds with “Not at
all” and 100 mm with “Extremely” A. Nausea (Time×Trial: p=0.481; Trial: p=0.029; Time: p= 0.612) B. Nausea
iAUC0-360 (p=0.159). C. Nausea +iAUC0-360 (p=0.006). D. Nausea iAUC0-180 min (p=0.210). E. Nausea +iAUC0-180 min
(p=0.084). F. Nausea iAUC180-360 min (p=0.159). G. Nausea +iAUC180-360 min (p=0.043). All data expressed as mean ±
SEM (n=19).
4.10.1.1.4 Correlation Analysis:

168
There was a significant negative correlation between nausea and hunger between 0-360 min: iAUC 0-360 min. r= -0.21 95% confidence interval (CI: 0.01478 to 0.3842) p= 0.0302. 4.10.2 Sub-maximal exercise Trial:
4.10.2.1.1 Hunger:
Mean hunger concentrations between 0-180 min was not significantly different between
trials (Control: 49.8 ± 6.1 mm; Propionate= 54.5± 5.6 mm; Effect of trial p=0.354) (Figure 4:5:
A). iAUC0-180 min and +iAUC0-180 min were also similar between trials (p=0.252; p=0.144)
respectively (Figure 4:5: B and C).
Volunteers also reported no significant differences in subjective hunger (Control= 51.7 ± 5.7
mm; Propionate: 57.2 ± 5.3 mm; Effect of trial: p=0.258) (Figure 4:5: A). There was also no
significant difference in iAUC180-240 min and +iAUC180-240 min between trials (p=0.184; p= 0.463)
(Figure 4:5: D and E).
A

169
B
C
D
E
Figure 4-5: Sub-maximal Exercise Study: Effect of oral sodium propionate supplementation on hunger:
The effect of oral sodium propionate supplementation on subjective hunger: 0 mm corresponds with “Not at
all” and 100 mm with “Extremely”. A. Hunger (Time×Trial: p=0.783; Trial: p=0.354; Time: p= 0.000) and
subjective hunger during exercise (Time×Trial: p=0.329; Trial: p=0.258; Time: p= 0.004) B. Hunger iAUC0-180
(p=0.252). C. Hunger +iAUC0-180 (p=0.144). D. Hunger iAUC180-240 min (p=0.184). E. Hunger +iAUC180--240 min
(p=0.463). All data expressed as mean ± SEM (n=19).

170
4.10.2.1.2 Thirst:
Mean subjective thirst ratings between 0-180 min was not significantly different between
trials (Control: 26.7 ± 5.3 mm; Propionate= 29.6 ± 5.4 mm; Effect of trial; p=0.268) (Figure 4:6:
A). iAUC0-180 min and +iAUC0-180 min were also similar between trials (p=0.164; p=0.569)
respectively (Figure 4:6: B and C).
Mean subjective ratings of thirst were significantly higher in the Propionate trial than Control
during exercise (Control= 39.8 ± 5.3 mm; Propionate= 46.8 ± 5.4 mm; Effect of trial; p=0.015)
(Figure 4:6: A). However, there was no significant difference in iAUC180-240 min and +iAUC180-240
min between trials (p=0.984; p= 0.403) (Figure 4:6: D and E).
A

171
B
C
D
E
Figure 4-6: Sub-maximal Exercise Study: Effect of oral sodium propionate supplementation on thirst
The effect of oral sodium propionate supplementation on subjective thirst: 0 mm corresponds with “Not at all”
and 100 mm with “Extremely”. A. Thirst (Time×Trial: p=0.248; Trial: p=0.268; Time: p= 0.195) and subjective
thirst during exercise (Time×Trial: p=0.946; Trial: p=0.015; Time: p= 0.000) B. Thirst iAUC0-180 (p=0.164). C. Thirst
+iAUC0-180 (p=0.569). D. Thirst iAUC0-240 min (p=984). E. Thirst +iAUC0-240 min (p=0.403). All data expressed as mean
± SEM (n=19).
:

172
4.10.2.1.3 Nausea:
Mean nausea concentrations between 0-180 min was not significantly different between
trials (Control: 1.9 ± 0.7 mm; Propionate= 5.8 ± 2.3 mm; Effect of trial; p=0.115) (Figure 4:7:
A). iAUC0-180 min and +iAUC0-180 min were also similar between trials (p=0.518; p=0.641)
respectively (Figure 4:7: B and C).
Volunteers also reported no significant differences in subjective nausea (Control= 2.9 ± 1.1
mm; Propionate: 6.7 ± 3.4 mm; Effect of trial: p=0.295) (Figure 4:7: A). There was also no
significant difference in iAUC180-240 min and +iAUC180-240 min between trials (p=0.977; p= 0.938)
(Figure 4:7: D and E).
A

173
B
C
D
E
Figure 4-7: Sub-maximal Exercise Study: Effect of oral sodium propionate supplementation on nausea:
The effect of oral sodium propionate supplementation on subjective nausea: 0 mm corresponds with “Not at
all” and 100 mm with “Extremely”. A. Nausea (Time×Trial: p=0.369; Trial: p=0.115; Time: p= 0.193) and
subjective nausea during exercise (Time×Trial: p=0.365; Trial: p=0.295; Time: p= 0.367) B. Nausea iAUC0-180
(p=0.518). C. Nausea +iAUC0-180 (p=0.641). D. Nausea iAUC0-240 min (p=0.977). E. Nausea +iAUC0-240 min (p=0.938).
All data expressed as mean ± SEM (n=19).
4.10.2.1.4 Correlation Analysis:
There was no significant correlation between nausea and hunger between 0-180 min: iAUC 0-180 min r= -0.07 95% confidence interval (CI: --0.5088 to 0.3959) p= 0.7725.

174
There was also no significant correlation between nausea and hunger between 180-240 min: iAUC 180-240 min: r= 0.06 95% confidence interval (CI: -0.4015 to 0.5039) p= 0.7932. 4.10.3 Post-prandial Trial:
4.10.3.1.1 Hunger:
Hunger between 0-300 min was comparable between the Control and Propionate trials
(Control= 48.8± 5.0mmol/L; Propionate= 43.7± 5.4 mmol/L; Effect of trial p=0.359) (Figure
4:8: A). Hunger iAUC0-300 and +iAUC0-300 was not significantly different between trials
(p=0.840; p=0.768) (Figure 4:8: B and C).
iAUC0-180 min and +iAUC0-180 for the 180 min fasted period were not significantly different
between trials (p= 0.159; p=0.353) respectively (Figure 4:8: D and E). Hunger iAUC180-300 and
+iAUC180-300 were not significantly different between the trials (p= 0.718; p=0.932) (Figure 4:8:
F and G).
A

175
B
C
D
E

176
F
G
Figure 4-8: Post-prandial Study: Effect of oral sodium propionate supplementation on hunger:
The effect of oral sodium propionate supplementation on subjective hunger: 0 mm corresponds with “Not at
all” and 100 mm with “Extremely” A. Hunger (Time×Trial: p=0.389; Trial: p=0.359; Time: p= 0.004) B. Hunger
iAUC0-300 (p=0.840). C. Hunger +iAUC0-300 (p=0.768). D. Hunger iAUC0-180 min (p=0.159). E. Hunger +iAUC0-180 min
(p=0.353). F. Post-prandial hunger iAUC180-300 min (p=0.718). G. Post-prandial hunger +iAUC180-300 min (p=0.932). All
data expressed as mean ± SEM (n=20).
4.10.3.1.2 Thirst:
Thirst between 0-300 min was comparable between the Control and Propionate trials
(Control= 15.7± 4.3 mmol/L; Propionate= 14.5± 4.0 mmol/L; Effect of trial p=0.316) (Figure
4:9: A). Thirst iAUC0-300 and +iAUC0-300 was not significantly different between trials (p=0.325;
p=0.454) (Figure 4:9: B and C).
iAUC0-180 min and +iAUC0-180 for the 180 min fasted period were not significantly different
between trials (p= 0.304; p=0.525) respectively (Figure 4:9: D and E). Thirst iAUC180-300 and
+iAUC180-300 were not significantly different between the trials (p= 0.700; p=0.850) (Figure 4:9:
F and G).

177
A
B
C

178
D
E
F
G
Figure 4-9: Post-prandial Study: Effect of oral sodium propionate supplementation on thirst:
The effect of oral sodium propionate supplementation on subjective thirst: 0 mm corresponds with “Not at all”
and 100 mm with “Extremely” A. Thirst (Time×Trial: p=0.444; Trial: p=0.316; Time: p= 0.186) B. Thirst iAUC0-300
(p=0.325). C. Thirst +iAUC0-300 (p=0.454). D. Thirst iAUC0-180 min (p=0.304). E. Thirst +iAUC0-180 min (p=0.525). F. Post-
prandial thirst iAUC180-300 min (p=0.700). G. Post-prandial thirst +iAUC180-300 min (p=0.850). All data expressed as
mean ± SEM (n=20).
4.10.3.1.3 Nausea:

179
Nausea between 0-300 min was comparable between the Control and Propionate trials
(Control= 4.7± 1.8 mm; Propionate= 5.3± 1.8 mm; Effect of trial p=0.499) (Figure 4:10: A).
Nausea iAUC0-300 and +iAUC0-300 was not significantly different between trials (p=0.194;
p=0.062) (Figure 4:10: B and C).
iAUC0-180 min and +iAUC0-180 for the 180 min fasted period were not significantly different
between trials (p= 0.278; p=0.273) respectively (Figure 4:10: D and E). Nausea iAUC180-300 was
not significantly different between the trials (p= 0.080). However, +iAUC180-300 was
significantly higher in the Propionate trial (p=0.049) (Figure 4:10: F and G).
A

180
B
C
D
E
F
G
Figure 4-10: Post-prandial Study: Effect of oral sodium propionate supplementation on nausea:

181
The effect of oral sodium propionate supplementation on subjective nausea: 0 mm corresponds with “Not at
all” and 100 mm with “Extremely” A. Nausea (Time×Trial: p=0 .116; Trial: p=0.499; Time: p= 0.166) B. Nausea
iAUC0-300 (p=0.194). C. Nausea +iAUC0-300 (p=0.062). D. Nausea iAUC0-180 min (p=0.278). E. Nausea +iAUC0-180 min
(p=0.273). F. Post-prandial nausea iAUC180-300 min (p=0.080). G. Post-prandial nausea +iAUC180-300 min (p=0.049). All
data expressed as mean ± SEM (n=20).
4.10.3.1.4 GLP-1:
For detailed results please refer to 5.14.3.1.3.
In summary, GLP-1 between 0-300 min was comparable between the Control and Propionate
trials (Control= 67.9± 7.1 mmol/L; Propionate= 70.5± 6.2 mmol/L; Effect of trial p=0.626). GLP-
1 iAUC0-300 and +iAUC0-300 was not significantly different between trials (p=0.095; p=0.114).
Similarly, GLP-1 iAUC180-300 and +iAUC180-300 were not significantly different between the trials
(p= 0.081; p=0.312). However, iAUC0-180 min and +iAUC0-180 for the overnight fasted period was
significantly higher in the Propionate trial (p= 0.004; p=0.016) respectively.
A

182
B
C
D
E

183
F
G
Figure 4-11: Post-prandial Study: Effect of oral sodium propionate supplementation on GLP-1 levels:
4.10.3.1.5 Correlation Analysis:
There was a significant negative correlation between nausea and hunger between 0-300 min: iAUC 0-300 min : r= 0.41 95% confidence interval (CI: 0.2333 to 0.5553) p <0.0001. 4.11 Key Findings:
4.11.1 Overnight fasted Trial:
• Overnight fasted state: Acute propionate ingestion can significantly stimulate
subjective nausea over a prolonged fasted period of 360 min. This is mainly driven by
the second half of the fasting period (180-360 min). However, it has no effect on
subjective hunger and thirst.
4.11.2 Sub-maximal exercise Trial:
• Overnight fasted state: Acute propionate ingestion has no effect on subjective
markers of appetite (hunger, thirst and nausea).
• Sub-maximal exercise state: Acute propionate can significantly stimulate subjective
thirst during exercise.

184
4.11.3 Post-prandial Trial:
• Overnight fasted state: Acute propionate ingestion in the fasted state can stimulate
GLP-1 secretion but has no effect on subjective markers of appetite (hunger, thirst and
nausea).
• Post-prandial state: Acute propionate ingestion can significantly stimulate subjective
nausea but has no effect on GLP-1 secretion and subjective hunger and thirst post-
prandially.
4.12 Summary:
Acute ingestion of oral sodium propionate in healthy human volunteers can stimulate GLP-1
secretion in the overnight fasted state. It can also significantly increase subjective thirst
during sub-maximal exercise and subjective nausea in the overnight fasted and post-prandial
states. However, it has no effect on subjective hunger.
4.13 Discussion:
The aim of this work was to build on previous research which demonstrated that acute
sodium propionate supplementation can increase subjective nausea in healthy volunteers as
assessed by VAS in the overnight fasted state over 180 min (Chambers et al., 2018). Thus, the
acute impact of propionate supplementation on appetite in different energy states (overnight
fasted, sub-maximal exercise and post-prandial) were assessed by means of VAS and GLP-1
measurements and over an extended period of time as discussed below.
4.13.1.1.1 Impact of acute propionate supplementation on appetite measures:
This trial has demonstrated that acute ingestion of 71 mmol of sodium propionate in healthy
human volunteers can have an effect on appetite where it can increase subjective nausea and
GLP-1 levels in the overnight fasted state and can also increase subjective thirst and nausea
during sub-maximal exercise and post-prandial states respectively. However, it seems to have
no effect on subjective hunger in different physiological states. This is in agreement with
previous research of Chambers et al. who showed that acute ingested of 71 mmol of sodium

185
propionate over 180 min in the overnight fasted state in healthy volunteers can significantly
increase subjective nausea by means of VAS with no effect on subjective hunger (Chambers
et al., 2018). Similar to this trial, in the post-prandial state, Darzi et al. showed in 20 healthy
volunteers that acute ingestion of propionate (6 mmol) in a palatable sourdough in
comparison to a control bread of similar palatability has no effect on subjective hunger (Darzi
et al., 2012). Also, Chambers et al showed in 20 overweight adults that acute supplementation
of 36.2 mmol of propionate in the form of an IPE has no effect on subjective hunger, however
they also found no effect on subjective nausea. Moreover, in contrast to the present findings,
they found an increase in post-prandial GLP-1 levels (Chambers et al., 2015). Likewise, Frost
et al. showed in 10 healthy volunteers that the consumption of pasta with tomato sauce
supplemented with 30g sunflower oil and 3 mmol of sodium propionate can significantly
increase post-prandial GLP-1 levels and delay gastric emptying. However, comparable with
this trial, they did find an increase in post-prandial subjective nausea and no effect on post-
prandial subjective hunger (Frost et al., 2003). Also, Ruijschop et al. demonstrated in 43
healthy, normal-weight women that consumption of 150 ml of a non-fermented dairy
beverage containing 0.6 % of calcium propionate can significantly decrease subjective feelings
of hunger with no effect on ad libitum energy intake (Ruijschop et al., 2008). Liljeberg et al.,
on the other hand, showed that the addition of 1.9 mol of sodium propionate to bread can
significantly prolong subjective satiety i.e. hunger ratings in comparison to control bread in
12 healthy volunteers (Liljeberg and Björck, 1996, Liljeberg et al., 1995). However, the
unpleasant taste of sodium propionate added to bread was not accounted for and palatability
may have been a cofounder. Henceforth, it can be deduced that the effect of propionate
supplementation on subjective measures of appetite and GLP-1 levels are inconsistent. A
plausible explanation for the discrepancies in findings may be due to dosing varieties as well
as differing mode of administration. For instance, while propionate was administered in the
solid form in most studies, Ruijschop et al. administered propionate in an aqueous solution.
This may have resulted in a varying gastric emptying response and hence appetite effects
since liquids empty from the stomach at a significantly faster rate than solids (Fisher et al.,
1982). Also, where propionate in the gastrointestinal tract is dissociated is also a factor that
must be considered. If, for example, sodium propionate was dissociated in the stomach, the
acidity of the stomach may convert the propionate to its corresponding organic acid
(propionic acid) and organic acids have been shown to delay gastric emptying (Liljeberg and

186
Björck, 1998, Liljeberg and Björck, 1996, Hunt and Knox, 1969, Darwiche et al., 2001).
Whereas, if it remains intact as an organic salt it may or may not have an effect on gastric
emptying (Liljeberg and Björck, 1996). Another factor to be considered is the effect of
propionate dissociation on gut hormone release. That is, if propionate is delivered to distal
parts of the gastrointestinal tract, it is more likely to stimulate gut hormone release since L-
cells are more densely found in the colon. Chambers et al. for instance has shown that delivery
of propionate via an IPE is likely to deliver propionate directly to the colon and can stimulate
GLP-1 release (Chambers et al., 2015). However, most of the studies mentioned including this
trial did not report or have an accurate estimation on where in the gastrointestinal tract the
propionate is expected to be delivered and absorbed, hence a direct comparison between
studies on the effect of propionate on gut hormone release is challenging.
4.14 Study Strengths:
This study is unique in that it examined the effect of sodium propionate on subjective appetite
in healthy human volunteers in the three different physiological states. No study, to the best
of knowledge, has examined the effect of sodium propionate on appetite during exercise
while also considering ‘thirst’ as a marker of subjective appetite, although thirst is more
closely linked to increased drinking than hunger is to eating (Mattes, 2010). Thus, it is difficult
to draw conclusions based on the current literature. However, the present findings
demonstrate that sodium propionate has no effect on subjective markers on appetite during
exercise except thirst. The addition of sodium may have increased osmolarity in the
gastrointestinal tract which can draw water from blood circulation into the tract thus
increasing thirst. However, since the control used was ‘sodium chloride’, the sodium is
controlled for, and hence it is highly unlikely that this may have caused the increased
subjective thirst reported. Future studies are therefore needed to further examine the effect
of sodium propionate on appetite ratings during exercise.
4.15 Study Limitations:
The acute effect of sodium propionate supplementation on appetite was a secondary
outcome of the study. Thus, VAS were chosen as a non-invasive, subjective marker of
appetite. However, subjective markers, given their drawbacks, should ideally be combined

187
with objective markers of appetite such as ad libitum energy intake and biological satiety
makers in order to give a better and more accurate overview of appetite changes and food
intake. Chambers et al. for instance showed in 20 overweight adults that acute
supplementation of 36.2 mmol of propionate in the form of an IPE can significantly reduce
energy intake by ~14% despite no apparent effect on subjective ratings of appetite and
nausea. This suggests that propionate may act as a satiation signal, rather than a satiety
signal.
Another limitation of the study is that GLP-1 levels were also only measured in the post-
prandial trial, however, post-prandial conditions are more likely to induce GLP-1 secretion in
comparison to other physiological conditions. Nevertheless, future studies should examine
satiety markers in all three energy states.
4.16 Conclusion:
Acute ingestion of oral sodium propionate in healthy human volunteers can influence
subjective markers of appetite, mainly by increasing subjective feelings of nausea during
overnight fasted and post-prandial states and increasing subjective thirst during exercise.
Moreover, it can also stimulate biological satiety markers such as GLP-1 concentrations in the
overnight fasted state all of which could have modulated energy intake had it been measured.
Of note as well, several of the human studies (Frost et al., 2003, Chambers et al., 2018)
including this trial have demonstrated an increase in subjective nausea with propionate
supplementation. Thus, future research aimed at developing therapeutic strategies to
increase propionate availability to reduce appetite would need to develop ways in order to
overcome this limitation. Noteworthy too, an increase in subjective feelings of nausea with
propionate supplementation may be an indicator that propionate can influence satiation
rather than satiety. Future studies can hence assess this by employing VAS continually during
an ad libitum test meal and observe if propionate promotes an early termination of meals.
Furthermore, future intervention studies using a combination of subjective and objective
markers of appetite are clearly needed to give a better overview of the effect of sodium
propionate on appetite regulation. It would be quite interesting as well to assess the impact

188
of sodium propionate delivery on appetite in different areas in the gastrointestinal tract. One
way of achieving this is by using tablets similar to the ones used in the present trial but can
disintegrate at varying pH along the tract. For instance, the current tablets are most likely to
disintegrate in the proximal intestine where pH is 6.6 (Evans et al., 1988) since these tablets
were previously shown to completely dissociate at pH 6.8 (Supplements:) whereas other
tablets could be designed that disintegrate at pH 7.5 and 6.4 that would ideally deliver
propionate to the terminal ileum and cecum respectively.
Moreover, very importantly, future studies can quantify both energy intake and energy
expenditure in order to best determine the acute effect of oral sodium propionate
supplementation on overall energy balance.
189
Chapter 5: Effect of Sodium Propionate on Glucose Homeostasis
5.1 Abstract:
Background:
Previous studies investigating the acute effects of oral propionate supplementation on
glucose homeostasis in humans have reported inconsistent outcomes. Moreover, studies
have mainly focused on examining these effects during fasted or post-prandial states.
Therefore, this study aimed to investigate in healthy human volunteers, the acute effect of
oral sodium propionate supplementation (71 mmol) on glucose homeostasis in three
separate energy states (overnight fasted, sub-maximal exercise and postprandial).
Methodology:
The trial consisted of three separate studies:
Overnight Fasted study: 19 volunteers (11 males and 8 females; age: 34.6 ± 4.1 years; BMI
(body mass index): 23.1 ± 0.7 kg/m2) completed the two study visits after an overnight fast.
Sub-maximal exercise study: 19 volunteers (14 males and 5 females; age: 42.7 ± 3.5 years;
BMI: 24.5 ± 0.7 kg/m2) completed a maximal exercise test visit and two study visits.
Post-prandial study: 19 volunteers (12 males and 7 females; age: 45.0 ± 3.5 years; BMI: 24.8
± 0.8 kg/m2) completed two study visits.
Each of these studies was a randomized controlled double-blind cross-over study. In each
study, following an overnight fast, tablets containing either 6845mg sodium propionate or
4164mg sodium chloride (Control) were first administered over 180 min.

190
Overnight Fasted study: The study extended over a total period of 360 min while volunteers
remained fasted for the duration of the study.
Sub-maximal exercise study: The study extended over a total period of 240 min. At time-
point 180 min, exercise was introduced where participants started cycling on a cycle
ergometer at 40% of VO2 max determined from their maximal exercise test visit for a period of
one hour.
Post-prandial study: The study extended over a total period of 300 min. At time-point 180
min, a mixed calorie liquid meal (Ensure Original Vanilla Nutrition Shake: 72.7 g carbohydrate,
13.6 g fat and 20.5 g protein; 500 kcal) was provided to volunteers.
Insulin resistance and insulin sensitivity were assessed via HOMA-IR and Matsuda Index
respectively. The oral disposition index (ODI) was used to assess β-cell function. Glucagon-like
peptide 1 (GLP-1), an incretin hormone, was also measured.
Results:
Overnight Fasted study:
Oral sodium propionate supplementation attenuated the decrease in glucose concentrations
over a prolonged fasted period of 360 min (iAUC0-360 min p= 0.012;). However, propionate
supplementation had no effect on insulin concentrations (Control= 7.70 ± 0.48 μU/mL;
Propionate= 7.87± 0.59 μU/mL; Effect of trial p= 0.759), or insulin resistance (HOMA-IR:
Control: 1.42 ± 0.10; Propionate: 1.46 ± 0.12; p=0.698).
Sub-maximal exercise study:
Oral sodium propionate supplementation had no effects on glucose (Control= 4.40 ± 0.10
mmol/L; Propionate= 4.37 ± 0.09 mmol/L; Effect of trial: p=0.654) or insulin concentrations
(Control= 5.34 ± 0.39 μU/mL; Propionate= 5.63 ± 0.55 μU/mL; Effect of trial: p=0.379) during
sub-maximal exercise (Control: 48 ± 2 % ; Propionate: 47 ± 2% VO2max).

191
Post-prandial study:
Oral sodium propionate supplementation had no effect on glucose concentrations (Control=
5.38± .133 mmol/L; Propionate= 5.40± .141 mmol/L; Effect of trial p=0.823) and insulin levels
(Control= 29.88 ± 2.69 μU/mL; Propionate= 30.27± 2.17 μU/mL; Effect of trial p=0.833) over
a period of 300 min. However, GLP-1 concentrations after the overnight fasted state were
significantly higher with propionate supplementation (iAUC0-180 min p= 0.004 and +iAUC0-180
p=0.016). Post-prandially, propionate supplementation had no effect on insulin sensitivity as
measured by the Matsuda Index (Control: 106.6± 12.0; Propionate: 94.6 ± 5.6; p= 0.388) or β-
cell function as measured by the ODI (Control: 3.15 ± 0.28; Propionate: 4.34 ± 0.78; p= 0.452).
Conclusion:
This was the first in human study to compare the acute effect of propionate supplementation
on glucose homeostasis in three separate energy states. The impact of acute sodium
propionate ingestion on glucose levels in the overnight fasted state was only observed in one
of the three separate studies and thus would demonstrate that acute propionate
supplementation has no effect on markers of insulin sensitivity and glucose tolerance in
healthy humans. However, the present trial only included healthy individuals with normal
glucose tolerance, therefore, well-controlled future studies are needed to determine if similar
effects are observed in individuals with impaired glucose homeostasis.
5.2 Glucose Regulation:
Glucose levels in blood are tightly regulated via a feedback loop between insulin secretion
and insulin action on insulin sensitive tissues such as the liver, muscles and adipose tissue
(Zheng et al., 2018). This relationship can be characterized by a hyperbola with the product
of these two variables, ‘disposition index’, being constant in subjects with similar glucose
tolerance (Faerch et al., 2010). Insulin secretion relies on pancreatic β-cell response to raised
glucose concentrations while glucose levels are mainly regulated via hepatic insulin-
stimulated glucose production and uptake into muscle. Thus, a disruption in β-cell function

192
indicates a suppressed response to glucose stimulated insulin secretion, whereas insulin
resistance develops with diminished hepatic response to insulin action and insulin-stimulated
uptake into muscle (Gutch et al., 2015) . Indeed, peripheral insulin resistance and β-cell failure
are considered the hallmarks in the pathogenesis of T2D (Zheng et al., 2018, Choi et al., 2012)
.
5.3 Indices:
The assessment of insulin resistance/sensitivity and β cell function can be quite challenging
due to the complex interplay between the two measures. However, several methods exist
that can measure each, and the method of choice mainly relies on the validity, reproducibility,
cost and practicality of use. Direct measurements are often more complex to perform in vivo,
whereas indirect and simple surrogate indexes are also available and can be more practical in
some cases. In any case, all methods rely on analysing either steady-states of glucose and
insulin, or on dynamic testing (Patarrão et al., 2014, Choi et al., 2012).
5.3.1 Direct Measures:
5.3.1.1.1 Hyperinsulinemic Euglycemic Glucose Clamp (HIEC) (Muniyappa and Madan, 2018,
Patarrão et al., 2014, Borai et al., 2007):
The Hyperinsulinemic Euglycemic Clamp technique originally developed by Andres and
DeFronzo is considered the ‘gold standard’ for directly measuring insulin sensitivity in
humans. After an overnight fast, insulin is intravenously infused at a constant rate (5 to 120
mU/m2 /min dose per body surface area per minute) to achieve a steady state insulin level
above fasting levels (hyperinsulinemia). Thus, hepatic glucose production is suppressed while
glucose uptake in skeletal muscles and adipose tissue is enhanced. In order to maintain
normal glucose levels (euglycemia), a glucose analyser is used to frequently assess glucose
levels and a 20% dextrose solution is intravenously infused to ‘clamp’ glucose levels. Steady
states of plasma insulin, blood glucose and glucose infusion rate (GIR) are then achieved after
a couple of hours of constant insulin infusion. When no net change in blood glucose levels is
observed, the hyperinsulinemic state is assumed to suppress hepatic glucose production and

193
thus GIR is equal to glucose disposal rate (M). Hence, at any given level of hyperinsulinemia,
whole body glucose disposal can be calculated. After normalizing M for body weight and fat-
free mass, insulin sensitivity can be determined.
Advantages:
The primary advantage of this technique is that under steady state conditions, it can directly
measure glucose disposal rate at any given level of hyperinsulinemia. Thus, this method can
be used in research settings where insulin sensitivity is a primary outcome.
Limitations:
There are a number of limitations with this approach including expense, time-consumption,
intense labour requirement and expert personnel. Moreover, the technique requires steady
state conditions and a fasting state and thus does not portray the dynamic insulin release that
occurs after meals. Moreover, since it is an intravenous measure that bypasses the GI tract,
it does not portray a normal physiological response.
5.3.1.1.2 Hyperglycaemic clamp (Borai et al., 2007):
This method is mainly used to assess β-cell function in response to glucose. Plasma glucose
levels are acutely raised via a priming glucose dose and maintained at 7 mmol/L for 2 hours.
Glucose is then administered at 5 min intervals for maintenance till the end of the test. The
principle behind this method is that hyperglycaemia would stimulate β-cell secretion and
glucose disposal and therefore, the volume of the maintenance dose would reflect insulin
secretion. Once glucose levels become stable, its infusion rate M (mg/kg/min) can be
calculated and can provide an index of glucose metabolism. Moreover, M/I index can be
obtained where I is the average insulin concentration during the study. This index provides a
measure of endogenous insulin secretion sensitivity.

194
Advantages:
This method can provide a quantitative procedure to assess β-cell function and can be used
to study prediabetic states and efficacy of medications.
Limitations:
This method is expensive, time-consuming, laborious and unsuitable for large scale screening
populations. Moreover, as glucose is administrated intravenously, it does not provide a
physiological state as it bypasses the gastrointestinal tract and its effects on glucose
homeostasis.
5.3.1.1.3 Other examples:
Other examples of direct measures of insulin sensitivity/resistance include frequently
sampled intravenous glucose tolerance, insulin suppression test and insulin tolerance test.
5.3.2 Indirect Measures:
5.3.2.1.1 Oral Glucose Tolerance Test (OGTT) (Muniyappa and Madan, 2018, Patarrão et al.,
2014):
This is a simple test that is widely used to assess glucose intolerance and T2D in clinical
settings. An oral glucose load (75g) is given after an overnight fast and blood samples are
taken at 0,30,60 and 120 minutes to determine glucose and insulin concentrations. This test
mainly assesses glucose tolerance i.e. the efficiency of the body to handle glucose after a meal
or glucose load. An individual is diagnosed with diabetes if the two-hour plasma glucose after
an OGTT is ≥ 200 mg/dl (11 mmol/l) while diagnosis of impaired glucose tolerance is identified
if the two hour glucose levels after an OGTT is in the range of 140–199 mg/dl (7.7–11 mmol/l)
(Association, 2014).

195
Advantages:
This test mimics glucose and insulin dynamics of physiological states more explicitly than
other measures such as HIEC. Moreover, this test is simple and easy to perform and is quite
low in cost.
Limitations:
The OGTT gives a crude measure of glucose tolerance but it does not measure insulin
sensitivity/resistance and insulin secretion directly. Glucose tolerance is affected by other
several factors such as insulin secretion, incretin effects and metabolic actions of insulin and
thus is not equivalent to insulin sensitivity/resistance. Moreover, OGTT may elicit poor
reproducibility (Ko et al., 1998) since the rate of gastric emptying can have intraindividual
variability and also cannot give an accurate picture regarding the dynamics of glucose and
insulin. Thus, other indices based on OGTT have been developed to better assess β cell
function and insulin sensitivity/resistance.
5.3.2.1.2 Meal Tolerance Test (MTT) (Patarrão et al., 2014):
This involves a mixed meal of carbohydrates, fat and proteins in order to study blood glucose
profile in a better physiological setting than an OGTT. This test can thus be considered a
variant of OGTT and is also measured after an overnight fast and blood samples for glucose
and insulin are taken over two hours.
Advantages:
The test is simple to perform and more appealing for subjects than the standard OGTT.
Moreover, it mimics a more physiological response to glucoregulation with regards to insulin
sensitivity and secretion. In addition, it can provide a better overview of β cell function since
β cell sensitivity after a meal is higher than after an OGTT despite similar carbohydrate
content, which may be due to the lower glycaemic index of the MTT and the slower rate of
gastric emptying in comparison to the OGTT. A liquid meal test has also been shown to be a

196
practical method to evaluate insulin secretion and sensitivity in clinical and population studies
(Maki et al., 2009).
Limitations:
MTT measures glucose tolerance and thus does not measure insulin sensitivity/resistance per
se and is also not reproducible within the same individual due to variability in glucose
absorption, splanchnic glucose uptake, and additional incretin effects.
5.3.2.1.3 Other examples:
Other examples of indirect measures of insulin sensitivity/resistance include minimal model
analysis of frequently sampled intravenous glucose tolerance test and intravenous and oral
tracer studies.
5.4 Simple surrogate indexes:
Insulin sensitivity indices are divided into two main groups: a. Indices that are measured using
fasting measures of plasma insulin, glucose and triglycerides b. Indices that are measured
using post-prandial plasma concentrations of insulin and glucose during 120 min of an OGTT
or MTT (Gutch et al., 2015).
5.4.1 Indices obtained from fasting blood sample:
These indexes rely on the following principles. In healthy humans, the fasting state represents
the basal steady state where glucose levels are maintained within a normal range via a basal
insulin secretion and a hepatic glucose production rate that is maintained at a constant rate.
Thus, insulin secretion by pancreatic β cells maintains insulin levels that can range from low
to high depending on insulin sensitivity/resistance in order that hepatic glucose production
equates to whole body glucose disposal (Muniyappa and Madan, 2018). Although these
indexes mainly reflect hepatic insulin sensitivity/resistance, these measures can also be used
as a surrogate for skeletal muscle sensitivity/resistance since in most cases hepatic and
skeletal muscle sensitivity are somewhat equivalent in the fasting state (Faerch et al., 2010,

197
Muniyappa and Madan, 2018). However, in T2D and even prior to overt T2D, insulin
resistance can manifest separately or at varying degrees in the liver in comparison to skeletal
muscles (Faerch et al., 2010). Thus, more useful surrogate indexes try to take this into
account. However, universal cut-off points to be used in surrogate indexes have not yet been
determined due to a lack of a standardized insulin assay (Muniyappa and Madan, 2018).
5.4.1.1.1 Homeostasis Model Assessment (HOMA)(Choi et al., 2012, Patarrão et al., 2014,
Gutch et al., 2015):
HOMA was first developed by Matthews et al. in 1985 to quantify insulin resistance and β cell
function from fasting insulin and glucose levels. The model is based on the dynamic
interaction between glucose and insulin and the feedback loop between the liver and
pancreatic β cells i.e. glucose concentrations are determined via hepatic insulin-mediated
glucose production, while insulin levels are regulated via pancreatic β cell response to glucose
concentrations. Thus, the model is able to predict fasting steady state glucose and insulin
concentrations for a wide range of combinations of insulin resistance (HOMA-IR) and
pancreatic β-cell function (HOMA- β-cell).
The model describes the glucose-insulin homeostasis via a set of empirically derived non-
linear equations. Most studies using this model employ a simple approximate equation for
insulin resistance that is derived from the use of fasting plasma insulin-fasting plasma glucose
product which is the index of hepatic insulin resistance divided by a constant. The formula is
as follows:
HOMA= Fasting Insulin (IU/ml) x Fasting Glucose(mmol/l) / 22.5
where 22.5 is a normalizing factor obtained from the product of normal fasting plasma insulin
of 5 IU/ml and normal fasting plasma glucose of 4.5mmol/l of an “ideal and normal”
individual.

198
Advantages:
This model is quite simple to perform and is minimally invasive requiring only a single blood
withdrawal from a fasting individual. Gungor et al. showed that HOMA-IR and HOMA- β-cell
as markers of insulin sensitivity and secretion respectively could have very good correlations
with gold standard techniques such as euglycemic clamp and hyperglycaemic clamp methods
in both healthy children and adolescents (Gungor et al., 2004). It is also low in cost and does
not require extensive expertise rendering it quite practical to use in large scale clinical,
epidemiological and prospective studies where only fasting blood samples are available.
Indeed, Bonora et al., using glucose clamp and glucose tracer dilution technique,
demonstrated in 115 individuals with varying degrees of glucose tolerance and insulin
sensitivity that HOMA-IR had a strong correlation with glucose clamp measures across a wide
range of varying population characteristics, where no substantial differences were found
between these measures in men and women, young and old subjects, obese and non-obese,
diabetic and non-diabetic as well as hypertensive and normotensive individuals (BONERA,
2000).
Limitations:
One of the main disadvantages of this method is that it cannot provide information regarding
stimulated glucose and insulin concentrations as it reflects the homeostatic, fasting state and
hence, provides information on insulin stimulated hepatic glucose production but no
information regarding peripheral glucose uptake. It is also challenging to use on subjects with
poor glycaemic control or those with β cell dysfunction or lean individuals with higher rates
of insulin sensitivity (Kang et al., 2005, Thompson et al., 2014). Also, its use in longitudinal
assessment of insulin sensitivity changes over time may be weak (Xiang et al., 2014).
Moreover, its use in clinical practice may be limited due to lack of reference values for normal
and impaired insulin sensitivity as well as lack of standardization of the insulin assay.

199
5.4.1.1.2 Quantitative insulin sensitivity check index (QUICKI)(Patarrão et al., 2014, Gutch et
al., 2015):
QUICKI can be viewed as a simple variation of HOMA equation except that a log transform of
the insulin glucose product is used instead. Using fasting plasma glucose and insulin
concentrations, QUICKI is able to precisely and consistently predict insulin sensitivity index
with great predictive power as per the following equation:
QUICKI = 1/log (fasting insulin, IU/ml) + log (fasting glucose, mg/dl)
Advantages:
This tool is one of the most thoroughly evaluated and validated surrogate index for insulin
sensitivity. It is also quite simple, inexpensive and minimally invasive method and can be used
in large epidemiological or clinical research trials and where evaluation of insulin sensitivity is
not of primary interest.
Limitations:
Similar to HOMA, QUICKI is unable to provide information on peripheral glucose uptake,
which is an important aspect regarding insulin resistance, and can only provide information
concerning homeostatic measures in the fasting state. Also, each laboratory has its unique
normal range due to significant interlaboratory variations in insulin assay.
5.4.2 Indices obtained after dynamic testing such as OGTT/MTT (Muniyappa and Madan,
2018):
These indices rely on measures obtained from dynamic tests such as OGTT and MTT that
utilize both fasting and post-prandial plasma glucose and insulin levels. After a glucose load,
hepatic glucose production is maximally suppressed for a period of an hour and remains
suppressed at a constant level for the subsequent hour. Thus, the decrease in plasma glucose
concentration from its peak to its lowest range reflects glucose uptake by peripheral tissues.
Hence, these indices reflect both hepatic and peripheral insulin sensitivity which can be
favourable in many instances. However, if insulin sensitivity/resistance information is solely

200
required, then it may be more favourable to use fasting surrogates as they are simpler to
obtain.
5.4.2.1.1 Matsuda Index (Patarrão et al., 2014, Gutch et al., 2015):
A method developed by Matsuda and Defronzo that can assess whole body insulin (ISIMatsuda)
sensitivity and thus reflects both hepatic and peripheral insulin sensitivity. The method is
quite simple to calculate and is obtained from plasma glucose and insulin concentrations in
fasting states and during an OGTT/MTT.
ISIMatsuda= !","""
$(&'×)'×&*+,-×)*+,-)
10,000: Simplifying constant to get numbers from 0 to 12;
√ : Correction of the nonlinear values distribution;
G0 – fasting plasma glucose concentration (mg/dl);
I0 – fasting plasma insulin concentration (mIU/l);
Gmean – mean plasma glucose concentration during OGTT (mg/dl);
Imean – mean plasma insulin concentration during OGTT (mIU/l);
Advantages:
The tool is quite simple to calculate and can provide a measure of both hepatic and peripheral
insulin sensitivity in subjects with a wide range of glucose tolerance ranging from normal
glucose tolerance to overt diabetes (Matsuda and DeFronzo, 1999). Moreover, race and
gender appear to have little impact on the reliability of using this index and can thus prove to
201
be superior to other insulin sensitivity indices such as HOMA-IR and QUICKI in mixed race and
gender populations (Pisprasert et al., 2013).
Limitations:
Its use in longitudinal assessment of changes in insulin sensitivity may be weak (Xiang et al.,
2014).
5.4.2.1.2 Oral Disposition Index (Choi et al., 2012, Utzschneider et al., 2009, Muniyappa and
Madan, 2018):
This is a simple surrogate marker that can be used to estimate β-cell function relative to
insulin sensitivity in subjects with varying levels of glucose tolerance. The principle relies on
the hyperbolic relationship between insulin sensitivity and insulin secretion i.e. the regulation
in glucose homeostasis that occurs through pancreatic β-cell compensation for changes in
whole body insulin sensitivity via changes in insulin secretion and can be calculated as follows:
Oral disposition index = (DI0 –120/D G0 –120) x (1/fasting insulin)
Advantages:
This index can provide an excellent measure of β-cell function adjusted for insulin sensitivity
and can reliably predict the development of diabetes over 2-10 years in subjects with various
degrees of glucose tolerance (Utzschneider et al., 2009, Ram et al., 2015). It can also serve as
a simple surrogate that can be applied to obese adolescents especially when feasibility and
cost of clamp studies are a major challenge (Sjaarda et al., 2012).
Limitations:
As with all dynamic testing surrogates, this measure incorporates both peripheral and hepatic
insulin sensitivity. Moreover, since it is obtained from an OGTT or MTT, differentiating the
direct metabolic effects of insulin following the glucose load can be challenging. Also, oral

202
disposition index can be faulty in a diabetic range rendering its main usefulness in non-
diabetic patients.
5.5 Methods of Choice:
Since measurement of glucose homeostasis is a secondary outcome of this thesis and since
surrogate markers have shown to be inexpensive quantitative tools that can be applied in
many settings, we have chosen to use HOMA-IR in the overnight fasted and sub-maximal
exercise studies to assess insulin resistance, and we have chosen the Matsuda Index and Oral
disposition index in the post-prandial study to assess insulin resistance and β-cell function
respectively.
5.6 Dietary Fibres and Type 2 Diabetes:
Diabetes Mellitus is a global health concern inflicting 1 in 11 adults worldwide with the
majority (90%) suffering from type 2 diabetes mellitus (T2D) (Zheng et al., 2018). A large scale
series of systematic reviews and meta-analysis have identified high intakes of dietary fibres
(DF) to be associated with a decreased incidence and mortality from multiple non-
communicable diseases, amongst which is T2D (Reynolds et al., 2019). Indeed, striking dose
response curves verified a 15% risk reduction in T2D incidence for every 8g/d increase in DF
intake. The optimal daily intake for incurred metabolic health benefits was >25g/d (Reynolds
et al., 2019); however, the majority of the population fails to consume that amount where
the average global DF intake is approximately 20g/d (Stephen et al., 2017). Thus, identifying
the mechanisms behind DF’s reported health benefits on glucose homeostasis may allow us
to prevent or treat associated metabolic diseases.
Human studies have shown that raised intake of DF can improve both insulin resistance and
β-cell function. For example, Suntari et al. reported that supplementing 20 T2D patients with
32g of fibre rich snacks daily for 4 weeks significantly decreased fasting blood glucose and
insulin resistance and significantly increased C-peptide levels (a key marker of endogenous
insulin secretion in diabetic patients) (Sunarti et al., 2019). In a randomized controlled trial,
Weickert et al., showed that supplementing 17 normoglycemic overweight and obese women
with fibre enriched bread (31.2 g fibre/d) versus control white bread (state fibre /d) for 72
hours, can significantly enhance insulin sensitivity as assessed by a significant increase in

203
whole body glucose disposal (Weickert et al., 2006). Additionally, Chen et al., demonstrated
in a randomized double blind trial including 117 diabetic subjects that the fibre supplemented
group (10 or 20g/d) versus the control group (0 g/d) after 4 weeks supplementation, had
significant improvements in fasting and 2 hour glucose concentrations, fasting C-peptide
levels and 2-hour insulin and other metabolic markers in comparison to control. Also, the
higher fibre group (20g/d) had a significantly improved fasting glucose and insulin resistance
index in comparison to the other groups (Chen et al., 2016).
5.7 Propionate and Glucose Homeostasis:
The beneficial effects of dietary fibres on glucose homeostasis may in part be attributed to
DF’s major metabolic end products of gut microbial fermentation, the short-chain fatty acids
(SCFA): acetate, propionate and butyrate (Canfora et al., 2015, Hu et al., 2018). Den Besten
et al. showed that mice on a high fat diet (HFD) supplemented with either of the SCFA (5%
wt/wt) for 12 weeks had enhanced peripheral insulin sensitivity, as seen by lower fasting
insulin levels and similar glucose levels, in comparison to control mice who were on an HFD
alone. Also, the SCFA supplemented mice prevented the HFD-induced insulin resistance
associated with an HFD as verified by similar insulin levels and peripheral insulin sensitivity in
comparison to mice on a normal chow diet. The authors revealed that the SCFA induced
reduction in insulin resistance is mediated via adipose specific Pparg (Peroxisome proliferator-
activated receptor gamma) regulated effect on glucose homeostasis since Pparg adipose
specific knock out (KO) mice no longer exhibited these effects (den Besten et al., 2015). Also,
De Vadder et al. showed that rats fed a SCFA (propionate or butyrate) supplemented diet or
a fermentable carbohydrate diet had significantly improved glucose and insulin tolerance and
a significant decrease in hepatic glucose production in comparison to rats on a standard diet.
These proposed benefits on glucose homeostasis were mainly attributed to the gut brain
neural circuit and intestinal gluconeogenesis (IGN) since KO mice of intestinal glucose-6-
phospahate, a principal enzyme involved in IGN, no longer displayed those positive effects on
glucose homeostasis (De Vadder et al., 2014). Additionally, in 60 overweight adults, Pingitore
et al. showed that chronic supplementation of propionate in the form of an inulin propionate
ester (IPE) for 24 weeks resulted in a significant improvement in β-cell function as measured

204
by the oral disposition index, which the authors concluded that might be via the propionate
acting directly on islet β-cells (Pingitore et al., 2017).
In the liver, propionate acts as a gluconeogenic substrate where it enters the TCA
(tricarboxylic acid) cycle at the level of succinyl-CoA and is then converted to oxaloacetate
and then ultimately into glucose (den Besten et al., 2013b). A stable isotope study in humans
has shown that a small fraction (6 %) of gut derived propionate can be utilized for hepatic
gluconeogenesis rather than be directly oxidized. However, the post-prandial nature of the
study may have underestimated the amount of propionate that could be used for
gluconeogenesis after an overnight, fasted state (Boets et al., 2017). Conversely, daily
propionate production (29.5 mg/kg/d for an average 85 kg man) is unlikely to substantially
contribute to endogenous glucose production, which is estimated to be 2.2 mg/kg/min
andonly half of which is attributed to gluconeogenesis (Morrison and Preston, 2016). In any
case, propionate supplementation has shown to have an impact on glucose homeostasis in
both rodent and human studies via various mechanisms:
5.7.1 The impact of Propionate on glucose homeostasis in non-ruminants:
5.7.1.1.1 Acute Propionate Supplementation:
Oral:
A single study examined the acute effect of oral propionate supplementation on glucose
homeostasis in rodents. Tirosh et al. showed that supplementing mice acutely with
propionate (15 mmol/kg) via an oral gavage can induce hyperglycaemia and increase plasma
insulin concentrations in comparison to pyruvate (Tirosh et al., 2019).
Infusion:
Only one study examined the effect of acute propionate infusion on glucose homeostasis in
rodents. Tirosh et al. showed that mice acutely supplemented with propionate via
intraperitoneal injection at a rate of 15 mmol/kg can dose dependently induce

205
hyperglycaemia and increase plasma insulin concentrations in comparison to the
gluconeogenic substrate pyruvate (Tirosh et al., 2019).
5.7.1.1.2 Chronic Propionate Supplementation:
Oral:
Several animal studies have examined the chronic effect of oral propionate supplementation
on glucose and insulin profile. Cameron-Smith et al. showed that sodium propionate
supplementation to an HFD (0.5% or 5% wt/wt) for 4 weeks has no effect on glucose
metabolism in normal and streptozocin (STZ)-induced diabetic rats since at the end of the
supplementation period, fasting glucose, hepatic glucose production and rate of glucose
disposal were similar to that of rats fed an HFD alone (Cameron-Smith et al., 1994). In
contrast, Boillot et al. showed that rats fed a standard diet supplemented with 74.1 mmol/kg
of propionic acid for 3 weeks had significant decreases in fasting glucose concentrations with
no apparent effect on hepatic glucose production and glucose utilization in comparison to
mice fed a diet supplemented with a corresponding amount of poorly fermentable cellulose
(Boillot et al., 1995). In obese hyperinsulinemic rats with a metabolic profile similar to subjects
at risk of developing metabolic disease, Berggren et al. demonstrated that oral sodium
propionate ingestion can have favourable effects on glucose metabolism. Mice were fed an
HFD supplemented with 26mmol/kg BW/d of sodium propionate for 19 days. At the end of
the supplementation period, fasting plasma glucose and urinary glucose excretion (after 5
days of supplementation) were significantly decreased in the propionate group in comparison
to mice who were on an HFD only (Berggren et al., 1996). More recent studies also displayed
similar findings. De Vadder et al. showed that mice fed a standard diet supplemented with
sodium propionate (5% wt/wt) for 10 days displayed improved glucose and insulin tolerance
with no associated increase in insulin secretion (De Vadder et al., 2014). Also, Den Besten et
al. showed that mice on an HFD supplemented with sodium propionate at 5% wt/wt for 12
weeks had significantly lower fasting insulin than mice on HFD alone. Moreover, the
supplemented mice exhibited similar peripheral insulin sensitivity in comparison to mice on
a normal chow diet (den Besten et al., 2015). Similarly, Zhu et al. showed that supplementing
obese mice on an HFD with IPE or propionate mixtures for 4 weeks can decrease fasting

206
glucose and insulin levels as well as insulin resistance as assed by HOMA-IR, and can also
enhance pancreatic b cell function as assessed by HOMA-b in comparison to obese mice
controls on an HFD only (Zhu et al., 2020).
Infusion:
Other studies have examined the effect chronic propionate supplementation via infusions.
McBurney et al. showed that pigs receiving a portal infusion of an isomolar propionic acid
solution at a rate of 0.01 kg/BW/min, which is similar to a typical SCFA post-prandial
absorption rate, for seven days had no significant effect on glucose and insulin concentrations
as well as on insulin sensitivity and glucose tolerance (McBurney et al., 1995). Similarly,
Berggren et al. showed in obese hyperinsulinemic rats with a metabolic profile similar to
subjects at risk of developing metabolic disease, that rectal infusion of sodium propionate at
a rate of 4 mmol/kg BW/d has no effect on glucose profile. Fasting plasma glucose and urinary
glucose excretion were measured after 19 days of the intervention and compared with mice
an HFD. At the end of the supplementation period, these metabolic factors remained
unaffected (Berggren et al., 1996). On the other hand, Den Besten et al. demonstrated in mice
that the beneficial effects of long-term guar gum consumption on decreasing markers of
metabolic syndrome such as disturbed glucose homeostasis are related to in vivo fluxes of
SCFA including propionate. A phosphate buffered solution including tracer amounts of [2-13C]
propionate (1.5 mM, 99 atom %, Sigma-Aldrich) was infused into mice via a cecum catheter
for a period of 6 hours which allowed the calculation of in vivo flux rate. Propionate flux
uptake resulted in a significant inverse correlation with glucose and insulin levels as well as
with HOMA-IR. Moreover, it significantly correlated with genes involved in glycolysis and
inversely correlated with genes involved in gluconeogenesis (den Besten et al., 2014). Further,
Yu et al. showed that infusing pigs with 2 mol/L of sodium propionate via a cecal fistula twice
per day for 28 days versus 25 ml of saline control, can accelerate hepatic gluconeogenesis and
can decrease glycolysis with no effect on serum insulin and GLP-1 levels. The propionate
infusion was able to upregulate PCK1, a key enzyme involved in hepatic gluconeogenesis, and
can downregulate HKDC1 and GCK and G6PC3 genes which result in reduced glycolysis (Yu et
al., 2019). However, no effect on glucose per se was reported. Thus, it can be assumed that
supplementation had no effect on glucose concentrations.

207
In summary, the majority of evidence in animals highlights that long-term oral propionate
supplementation can lead to improvements in glucose homeostasis while acute studies are
presently scarce, and more studies are needed to confirm any possible effect.
5.7.2 The impact of Propionate on glucose homeostasis in humans:
5.7.2.1.1 Acute Propionate Supplementation:
Oral:
A small number of studies have examined the acute effect of oral propionate
supplementation on glucose homeostasis in humans and these can be divided according to
their effects on glucose profile to positive glucose lowering effects, no effect and impaired
glucose effects as follows.
Glucose Lowering Effects:
Most studies have displayed positive lowering glucose effects with propionate
supplementation. Todesco et al. demonstrated that blood glucose levels can acutely be
decreased by ~50% in six healthy volunteers after consumption of bread supplemented with
31.2 mmol of sodium propionate per 50g of available carbohydrate in comparison to control
white bread (Todesco et al., 1991). Similarly, Liljeberg et al. showed that acute ingestion of
barely bread baked with a high concentration of sodium propionate (1.9 mol) can significantly
decrease postprandial blood glucose and insulin concentrations in 11 healthy adults in
comparison to control bread (Liljeberg et al., 1995). Also, Darwiche et al. showed in 9 healthy
volunteers that acute supplementation of sodium propionate (1.9 mol) in bread can
significantly decrease post-prandial glucose and insulin responses in comparison to control
bread (Darwiche et al., 2001). Frost et al. showed in 10 healthy volunteers that the
consumption of pasta with tomato sauce supplemented with 30 g sunflower oil and 30 mmol
of sodium propionate can significantly increase post-prandial GLP-1 levels, delay gastric
emptying and decrease glucose and insulin concentrations in comparison to psyllium enriched
pasta (Frost et al., 2003). Darzi et al. , too, showed in a randomized cross-over trial involving
20 healthy subjects, that acute ingestion of propionate (6 mmol) in a palatable sourdough,

208
may lower post-prandial insulinemia although this was not significant in comparison to a
control bread (Darzi et al., 2012).
No Effect:
In contrast, in a randomized cross-over trial, Chambers et. al have shown no apparent effect
on post-prandial glucose and insulin profile in overweight individuals supplemented acutely
with 36.2 mmol of IPE (Chambers et al., 2015). Similarly, Chambers et al. showed that acutely
supplementing 18 healthy volunteers with 71 mmol of sodium propionate over 180 min has
no effect on fasting circulating glucose and insulin concentrations (Chambers et al., 2018).
Impaired Effect:
While, Tirosh et al. demonstrated in 14 healthy individuals that supplementing 5.37 mmol of
calcium propionate to a mixed meal can cause a significant decrease in insulin sensitivity and
a compensatory increase in serum insulin concentrations in comparison to a mixed meal
propionate-free control (Tirosh et al., 2019).
Infusion:
Other human studies have examined the effect of acute propionate administration via
infusions on glucose homeostasis and these seem to show no significant impact.
No Effect:
Wolver et al. showed in six healthy subjects that acute rectal infusion of a solution containing
90 mmol acetate plus 30 mmol propionate (90 mM, isotonic) or 180 mmol acetate and 60
mmol propionate (180 mM, hypertonic) per 800 ml has no significant effect on fasting blood
glucose concentrations and serum insulin levels in comparison to a saline control as well as
no effect on insulin secretion as evidenced by lack of rise in serum C-peptide level in all 3
infusions (Wolever et al., 1989). A later study showed somewhat similar findings where in six
healthy individuals, Wolver et al. showed that a rectally infused solution of propionate (180
mmol) relative to a saline control, can significantly increase fasting glucose concentrations

209
with no significant effect on insulin concentrations. However, a rectal infusion mixture of
acetate (180 mmol) and propionate (60 mmol) resulted in a very small but significant lower
insulin increments than the propionate solution alone (Wolever et al., 1991). In addition,
Laurent et al. showed in 6 healthy volunteers that 3 hour gastric infusions of a sodium
propionate solution (4 mmol/h) or sodium acetate and sodium propionate mixture (12
mmol/h and 4 mmol/h respectively) which is an administration rate typical of that of daily
fermentation of 30g of dietary fibre, has no effect on fasting glucose and insulin
concentrations as well as hepatic glucose production (Laurent et al., 1995). Similarly, Canfora
et al showed that acute colonic administration of a high propionate solution (18 mmol sodium
acetate (45%), 14 mmol sodium propionate (35%), 8 mmol sodium butyrate (20%) dissolved
in 200 mL sterile water) in 12 normoglycemic men had no effect on fasting and post-prandial
glucose and insulin concentrations (Canfora et al., 2017).
5.7.2.1.1.1 Chronic Propionate Supplementation:
Oral:
Other human studies have observed the effect of chronic oral propionate supplementation
on glucose and insulin profile and have mostly found favourable results.
Glucose Lowering Effects:
Venter et al. showed that propionate supplementation can decrease fasting glucose
concentrations where in a double-blind paired controlled trial, 78.0 mmol of sodium
propionate was supplemented to the diet of 10 healthy female volunteers (20-22 years) daily
for 7 weeks which resulted in a significant decrease in fasting serum glucose concentrations
during a glucose tolerance test in comparison to the control group who were supplemented
with dibasic calcium phosphate (Venter et al., 1990). Similarly,
Todesco et al. showed that incorporation of 9.9 g of sodium propionate to bread can
significantly decrease blood glucose levels by ~40% and peak rise in blood glucose by ~10% in

210
six healthy adults after one week of intervention in comparison to control white bread
(Todesco et al., 1991). Also, Chambers et al. have shown in 12 overweight and obese non-
diabetic adults that colonic delivery of propionate via IPE (72.4 mmol) for 42 days can improve
insulin resistance and sensitivity in comparison to a low fermentable cellulose control and can
also significantly improved adipose tissue insulin resistance. These changes were mainly
driven by a significant decrease in fasting insulin values in comparison to cellulose control
(Chambers et al., 2019).
No Effect:
In a randomized controlled trial, Chambers et al. were able to demonstrate in 60 overweight
adults that chronic supplementation of propionate in the form of an IPE (36.2 mmol ) has no
apparent effect on post-prandial glucose homeostasis (Chambers et al., 2015).
As can be seen, findings from human trials are not yet conclusive and whether propionate
administered in different methods, or form and over varying time-frames has a
positive/negative/no effect is yet to be determined.
5.8 Propionate’s mechanism of action on glucose
A number of mechanisms have been proposed to explain how propionate administration can
regulate glucose homeostasis:
5.8.1 The Impact of Propionate on enzymatic activity:
Propionate has been shown to decrease amylase activity in vivo and can thus reduce the rate
of starch digestibility which subsequently results in reduced postprandial glucose response
(Todesco et al., 1991).
5.8.2 The Impact of Propionate on Free-fatty acid receptors and Gut hormones:
Propionate is a potent activator of free fatty acid receptor 2 (FFAR-2) and free fatty acid
receptor 3 (FFAR-3) which are expressed throughout the body such as in colonic L-cells and
pancreatic β-cells, and both receptors have been shown to modulate energy metabolism and

211
glucose homeostasis in both rodents and humans (Byrne et al., 2015, Pingitore et al., 2017,
Psichas et al., 2015). Activation of FFAR-2, in particular, via propionate has shown to increase
GLP-1 (glucagon-like peptide 1) release which subsequently increases insulin secretion from
β-cells (Tolhurst et al., 2012). GLP-1 is an incretin hormone secreted from intestinal L-cells in
response to nutrient ingestion and has shown to have a distinct impact on β-cell function. For
instance, in β-cells, GLP-1 has shown to stimulate insulin gene expression and biosynthesis
and also to enhance glucose stimulated insulin secretion and to restore glucose competence
in glucose resistant β-cells. Moreover, it can act as a growth factor and can thus increase β-
cell mass (Buteau, 2008). Also, GLP-1 has been shown to delay gastric emptying and can slow
down the absorption of nutrients which can in turn reduce post-prandial glucose response
(Van Bloemendaal et al., 2014). In addition, independent of GLP-1 secretion, propionate has
also shown to modulate glucose homeostasis and insulin sensitivity via FFAR-2 (Han et al.,
2014).
Rodent Studies:
5.8.2.1.1 In vitro:
Psichas et al. demonstrated in a rodent study that propionate is able to stimulate GLP-1
release in vitro via FFAR-2. Using murine colonic crypt cultures, the authors showed that
propionate was able to stimulate GLP-1 release in a dose response relation where higher
concentrations of propionate stimulated greater gut hormone release. However, propionate
was no longer able to stimulate GLP-1 release in FFAR-2 KO colonic crypts (Psichas et al.,
2015).
5.8.2.1.2 In vivo:
Acute Propionate Supplementation:
Oral:
Darwiche et al. showed in 9 healthy volunteers that acute supplementation of sodium
propionate (1.9 mol) in bread can significantly decrease post-prandial glucose and insulin

212
responses in comparison to control bread due to delayed gastric emptying as evidenced via
ultrasonography (Darwiche et al., 2001). Also, Frost et al. showed in 10 healthy volunteers
that the consumption of pasta with tomato sauce supplemented with 30 g sunflower oil and
30 mmol of sodium propionate can significantly increase post-prandial GLP-1 levels and
decrease post-prandial glucose and insulin concentrations in comparison to psyllium enriched
pasta. The authors suggested this may be due to GLP-1 release and the concomitant delay in
gastric emptying (Frost et al., 2003). Further, De Vadder et al. showed that rats on a standard
diet for 10 days supplemented with sodium propionate (5% wt/wt) had increased glucose
tolerance and insulin sensitivity in comparison to rats on a standard diet alone. The authors
explained that this may be since propionate, as gluconeogenic substrate, was shown to
stimulate IGN, and via FFAR-3 in the portal vein, it can activate a gut-brain neural circuit that
can sense the glucose released by IGN and in turn the brain can favourably modulate glucose
homeostasis (De Vadder et al., 2014). In contrast, however, a single study, however, has
demonstrated that acute propionate supplementation might impair insulin action in mice by
promoting glucagon and fatty acid–binding protein 4 (FABP4) secretion via sympathetic
nervous system activation (SNS) (Tirosh et al., 2019). The mice were acutely supplemented
with propionate via an oral gavage or intraperitoneal administration at a rate of 15 mmol/kg
which resulted in hyperglycaemia in comparison with pyruvate supplementation (Tirosh et
al., 2019).
Infusion:
In a rodent study, Psichas et al. was able to show that a single, acute intra-colonic
administration of propionate of 180 mmol/l vs saline control was able to significantly increase
portal vein plasma GLP-1 concentrations in wild type (WT) rats but failed to do so in FFAR-2
KO rats (Psichas et al., 2015). However, impact on glucose and insulin levels were not
measured.

213
Human Studies:
5.8.2.1.3 In vitro:
Chambers et al has shown that propionate is able to stimulate GLP-1 secretion using human
colonic cells where increasing propionate concentrations (200 mmol/L and 400 mmol/L) was
able to significantly promote GLP-1 release by 1.6-fold and 2.4-fold respectively (Chambers et
al., 2015).
Using human islets in vitro, Pingitore et al. has shown that propionate can potentiate dynamic
glucose-stimulated insulin secretion by activating FFAR-2 that was dependent on protein
kinase C signalling. Moreover, propionate was able to protect human β-cells from apoptosis
induced by sodium palmitate and inflammatory cytokines (Pingitore et al., 2017).
5.8.2.1.4 In vivo:
Oral:
Acute Propionate Supplementation:
In a randomized controlled trial, Chambers et al. were able to demonstrate in 20 overweight
adults that acute supplementation of propionate in the form of an IPE (36.2 mmol), can
significantly increase GLP-1 levels, however, with no apparent effect on glucose homeostasis
(Chambers et al., 2015).
Chronic Propionate Supplementation:
One study in humans has shown that propionate supplementation might impair glucose
homeostasis. This was a randomized, cross-over trial where healthy, non-diabetic and
nonobese subjects after an 8-hour fast, were supplemented with a mixed meal with or
without 5.37 mmol of calcium propionate with one week apart between measurements. The
propionate supplementation resulted in a significant decrease in insulin sensitivity as per the
Matsuda Index and a postprandial increase in both glucagon and FABP4 via SNS activation
(Tirosh et al., 2019).

214
5.8.3 The Impact of Propionate on gut microbiota, systemic inflammation and plasma
metabolome:
Human Studies:
5.8.3.1.1 In vitro:
Chronic Propionate Supplementation:
Chambers et al. has also shown in 12 overweight and obese non-diabetic adults that colonic
delivery of propionate via IPE (72.4 mmol) for 42 days caused a small shift in gut microbial
community at the species level compared with cellulose, that favoured an enhanced glucose
profile. IPE supplementation significantly improved measures of insulin resistance as assessed
by HOMA (1.23 ± 0.17 IPE vs 1.59±0.17 cellulose, p=0.001) and the Matsuda Insulin Sensitivity
Index (4.0±0.6 IPE vs 3.2±0.6 cellulose, p=0.002) in comparison to a low fermentable cellulose
control and also significantly improved adipose tissue insulin resistance (IPE : 6.5±1.0 vs
cellulose: 8.3±1.3 mmol/L×μU/mL, p=0.042). These metabolic benefits were associated with
a significant decrease in the pro-inflammatory marker, interleukin-8, and also a decrease in
plasma glutamine concentration (Chambers et al., 2019). This corroborated with the findings
of El Hage et al. who showed through a supplementation of propionate-producing consortium
using a selection of commensal gut bacteria can decrease pro-inflammatory markers such as
interleukin-8 and have favourable effects on hepatic insulin resistance (El Hage et al., 2020).
Similarly, in in vitro, treating human omental adipose tissue with propionate has shown to
decrease the expression of several inflammatory cytokines and chemokines such as tumour
necrosis factor-a (TNF-a) and CCL5 (Al-Lahham et al., 2012).

215
5.8.4 The Impact of Propionate on hepatic tissue:
Rodent Studies:
5.8.4.1.1 In vitro:
In isolated rat hepatocytes, Anderson et al. showed that propionate can be converted to
glucose to a limited extent, however the net effect is a decrease in glucose production where
glucose production from lactate was reduced by 67% and 76% at propionate concentrations
of 5 mM and 10 mM respectively and can increase net rates of glucose conversion to lactate
by 25% at concentrations of 5 mM. Thus, propionate was shown to significantly increase
hepatic glycolysis and can increase glucose use and decrease glucose production (Anderson
and Bridges, 1984).
Human Studies:
5.8.4.1.2 In vitro:
Chronic Propionate Supplementation:
Chambers et al. showed that long term supplementation of propionate for 24 weeks in the
form of an IPE in 60 overweight adults can significantly reduce intrahepatic triglyceride
concentration and weight gain in comparison to the inulin supplemented control group and
this is likely to explain the prevention in post-prandial deterioration in glucose response
displayed by the IPE group in comparison to the control group (Chambers et al., 2015).
5.8.5 The Impact of Propionate on adipose tissue:
Animal studies:
5.8.5.1.1 In vitro:

216
Chronic Propionate Supplementation:
Den Besten et al. showed that mice on an HFD supplemented with physiological amount of
propionate (5% wt/wt) for 12 weeks were protected from diet-induced obesity and
associated insulin resistance as seen by the similar body weight, white adipose tissue mass,
insulin levels and peripheral insulin sensitivity with mice on a normal chow diet. The
supplemented mice also displayed significant reduction in hepatic steatosis; however, the
authors revealed that the observed beneficial effects on glucose homeostasis, white adipose
tissue mass and body weight gain were due to adipose specific Pparg activity rather than
hepatic Pparg activity since adipose specific Pparg KO out mice no longer displayed these
effects while this was preserved in hepatic specific KOs. Propionate, it appears, was able to
downregulate Pparg activity and activate UCP2-AMPK-ACC activated protein kinase cascade
that ultimately shifts metabolism in adipose tissue to promote lipid oxidation (den Besten et
al., 2015). Indeed, propionate in vitro was also shown to increase the expression of glucose
transporter (GLUT-4) in adipose tissue and thus glucose uptake which in vivo would have
favourable outcomes on glucose profile (Al-Lahham et al., 2012).
5.8.6 The Impact of Propionate on β-cell:
Human Studies:
5.8.6.1.1 In vivo:
Chronic Propionate Supplementation:
In 60 overweight adults, Pingitore et al. showed that chronic supplementation of propionate
in the form of IPE for 24 weeks resulted in a significant improvement in β-cell function as
measured by the oral disposition index, which the authors concluded that might be via the
propionate acting directly on islet β-cells (Pingitore et al., 2017).

217
5.8.7 Conclusion:
It can thus be concluded that the effects of propionate supplementation on glucose
homeostasis are currently inconsistent. Oral chronic supplementation of propionate in both
animals and humans appear to have favourable outcomes, whereas a lot more discrepancy
in the literature exists regarding acute effects. Tirosh et al. (Tirosh et al., 2019) was the only
human study that demonstrated an impairment in insulin profile following acute ingestion of
5.37 mmol of calcium propionate. However, it must be noted that they only examined the
post-prandial effects of supplementation. All other acute human studies demonstrated
positive (Todesco et al., 1991, Liljeberg et al., 1995, Darwiche et al., 2001, Frost et al., 2003,
Darzi et al., 2012) or no effects (Chambers et al., 2015) on post-prandial glucose homeostasis.
Chambers et al (Chambers et al., 2018) on the other hand, measured effects of propionate on
glucose homeostasis in the overnight fasted state and over 180 min. In that study, propionate
levels only became significantly increased at the end of the trial at 180 min which may not
have been a sufficient timeframe to assess the impact on glucose and insulin profile. The aim
of this work thus would be to build on that work and clarify the acute effects of raising gut
derived propionate on glucose homeostasis in healthy volunteers over an extended time
while assessing that in all three different physiological states (overnight fasted, sub-maximal
exercise and post-prandial).
5.9 Hypothesis:
I hypothesised that acute oral intake of sodium propionate would improve insulin resistance
during overnight fasted and sub-maximal exercise states and would improve β-cell function
and increase insulin sensitivity and GLP-1 secretion in the post-prandial state.
5.10 Aims:
This chapter will aim to present and discuss findings related to determining the acute effect
of propionate bioavailability on glucose homeostasis in different energy states (overnight
fasted, sub-maximal exercise and post-prandial).

218
5.11 Outcome Measures:
Measuring the acute effects of sodium propionate on glucose homeostasis was a secondary
outcome of this trial. Measuring insulin resistance will be conducted via HOMA-IR while
measuring insulin sensitivity will be conducted via Matsuda Index. The oral disposition index
will be used to assess β-cell function.
5.12 Methods of Choice:
Since measurement of glucose homeostasis is a secondary outcome of this thesis and since
surrogate markers have shown to be inexpensive quantitative tools that can be applied in
many settings as outlines in the first section of this chapter, HOMA-IR was used in the
overnight fasted and sub-maximal exercise studies to assess insulin resistance, and the
Matsuda Index and Oral disposition index were chosen in the post-prandial study to assess
insulin resistance and β-cell function respectively.
5.13 Methods:
Please refer to Chapter 2:
5.14 Results:
5.14.1 Overnight fasted Trial:
5.14.1.1.1 Glucose:
Mean glucose concentrations between 0-360 min was not significantly different between the
Propionate and Control trials (Control= 4.12± 0.08 mmol/L; Propionate= 4.14± 0.08 mmol/L;
Effect of trial p= 0.712) (Figure 5: 1: A). However, in the Control trial, iAUC0-360 min was

219
significantly lower in comparison to the Propionate trial (p= 0.012) (Figure 5:1: B) yet +iAUC0-
360 min was not significantly different between the two trials (p=0.191) (Figure 5:1: C).
iAUC0-180 min was significantly lower in the Control trial (p=0.011); However, +iAUC0-180 min was
not significantly different between trials (p=0.938) respectively (Figure 5:1: D and E). There
was no significant difference in iAUC180-360 min and +iAUC180-360 min between trials (p=0.11; p=
0.400) (Figure 5:1: F and G).
A
B
C

220
D
E
F
G
Figure 5-1: Overnight Fasted Study: Effect of oral sodium propionate supplementation on glucose levels:
The effect of oral sodium propionate supplementation on glucose concentrations A. Glucose levels (Time×Trial:
p=0.398; Trial: p=0.712; Time: p= 0.000) B. Glucose levels iAUC0-360 (p=0.012). C. Glucose levels +iAUC0-360
(p=0.191). D. Glucose levels iAUC0-180 min (p=0.011). E. Glucose levels +iAUC0-180 min (p=0.938). F. Resting glucose

221
levels iAUC180-360 min (p=0.107). G. Glucose levels +iAUC180-360 min (p=0.400). All data expressed as mean ± SEM
(n=19).
5.14.1.1.2 Insulin:
Mean insulin concentrations between 0-360 min was not significantly different between the
Propionate and Control trials (Control= 7.70 ± 0.48 μU/mL; Propionate= 7.87± 0.59 μU/mL;
Effect of trial p= 0.759) (Figure 5:2: A). Similarly, iAUC0-360 min and +iAUC0-360 min were not
significantly different between trials (p= 0.121; p=0.137) respectively (Figure 5:2: B and C).
iAUC0-180 min and +iAUC0-180 min in the Control trial was not significantly different between trials
(p= 0.208; p=0.196) respectively (Figure 5:2: D and E). There was also no significant difference
in iAUC180-360 min and +iAUC180-360 min between trials (p=0.320; p= 0.096) respectively (Figure
5:2: F and G).
A

222
B
C
D
E

223
F
G
Figure 5-2: Overnight Fasted Study: Effect of oral sodium propionate supplementation on insulin levels:
The effect of oral sodium propionate supplementation on insulin concentrations A. Insulin levels (Time×Trial:
p=0.104; Trial: p=0.759; Time: p= 0.000) B. Insulin levels iAUC0-360 (p=0.121). C. Insulin levels +iAUC0-360 (p=0.137).
D. Insulin levels iAUC0-180 min (p=0.208). E. Resting insulin levels +iAUC0-180 min (p=0.196). F. Insulin levels iAUC180-
360 min (p=0.320). G. Insulin levels +iAUC180-360 min (p=0.096). All data expressed as mean ± SEM (n=19).
5.14.1.1.3 HOMA-IR:
Insulin resistance was comparable between trials as assessed by HOMA-IR (Control: 1.42 ±
0.10; Propionate: 1.46 ± 0.12; p=0.698) (Figure 5:3: A).
Figure 5-3: Overnight Fasted Study: Effect of oral sodium propionate supplementation on HOMA-IR levels

224
5.14.2 Sub-maximal exercise Trial:
5.14.2.1.1 Glucose:
Propionate had no effect on circulating glucose levels (Control= 4.35 ± 0.09 mmol/L;
Propionate= 4.47 ± 0.07 mmol/L; Effect of trial p= 0.214) (Figure 5:4: A). There was also no
significant effect on iAUC0-180 min (p=0.460) and + iAUC0-180 min between trials (p=0.700) (Figure
5:4: B and C).
There was also no significant difference in circulating levels of glucose during exercise
(Control= 4.40 ± 0.10 mmol/L; Propionate= 4.37 ± 0.09 mmol/L; Effect of trial: p=0.654)
(Figure 5:4: A) and no significant effect on iAUC180-240 min (p= 0.367) and +iAUC180-240 min
between trials (p= 0.679) (Figure 5 D) (Figure 5:4: D and E).
A

225
B
C
D
E
Figure 5-4: Sub-maximal Exercise Study: Effect of oral sodium propionate supplementation on glucose levels:
The effect of oral sodium propionate supplementation on glucose concentrations A. Resting glucose levels
(Time×Trial: p=0.548; Trial: p== 0.026; Time: p= 0.214) and glucose levels during exercise (Time×Trial: p=0.647;
Trial: p=0.645; Time: p= 0.002) B. Glucose levels iAUC0-180 (p=0.460). C. Glucose levels +iAUC0-180 (p=0.700). D.
Glucose levels iAUC180-240 min (p=0.367). E. Glucose levels +iAUC180-240 min (p=0.679). All data expressed as mean ±
SEM (n=19).

226
5.14.2.1.2 Insulin:
Propionate had no significant effect on fasting insulin levels (Control= 5.53 ± 0.47 μU/mL;
Propionate= 6.11 ± 0.59 μU/mL; Effect of trial: p=0.255) (Figure 5: 5: A) or iAUC0-180 min (p=
0.714) (Figure 5:5: B)and +iAUC0-180 min (p= 0.978) (Figure 5:5: C).
Propionate similarly had no effect on circulating insulin levels during exercise (Control= 5.34
± 0.39 μU/mL; Propionate= 5.63 ± 0.55 μU/mL; Effect of trial: p=0.379) (Figure 5:5: A). iAUC180-
240min (p=0.451) (Figure 5:5: D) and +iAUC180-240min was also comparable between the two trials
(p=0.679) (Figure 5:5: E).
A

227
B
C
D
E
Figure 5-5: Sub-maximal Exercise Study: Effect of oral sodium propionate supplementation on insulin levels:
The effect of oral sodium propionate supplementation on insulin concentrations A. Resting insulin levels
(Time×Trial: p=0.358; Trial: p=0.255; Time: p= 0.025) and insulin levels during exercise (Time×Trial: p=0.501;
Trial: p=0.379; Time: p= 0.000) B. Insulin levels iAUC0-180 (p=0.714). C. Insulin levels +iAUC0-180 (p=0.639). D. Insulin
levels iAUC180-240 min (p=0.451). E. Insulin levels +iAUC180-240 min (p=0.978). All data expressed as mean ± SEM
(n=19).

228
5.14.2.1.3 HOMA-IR:
Insulin resistance between 0-180 min was comparable between trials, as assessed by HOMA-
IR (Control: 1.05± 0.09; Propionate: 1.13 ± 0.12; p= 0.374) (Figure: 5:6 A).
A
Figure 5-6: Sub-maximal Exercise Study: Effect of oral sodium propionate supplementation on HOMA-IR
5.14.3 Post-prandial Trial:
5.14.3.1.1 Glucose:
Glucose between 0-300 min was comparable between the Control and Propionate trials
(Control= 5.38± .133 mmol/L; Propionate= 5.40± .141 mmol/L; Effect of trial p=0.823) (Figure
5:7: A). Glucose iAUC0-300 and +iAUC0-300 was not significantly different between trials
(p=0.452; p=0.674) (Figure 5:7: B and C).
iAUC0-180 min and +iAUC0-180 for the 180 min fasted period were not significantly different
between trials (p= 0.941; p=0.404) respectively (Figure 5:7: D and E). Glucose iAUC180-300 and
+iAUC180-300 were not significantly different between the trials (p= 0.165; p=0.369) (Figure 5:7:
F and G).

229
A
B
C
D
E

230
F
G
Figure 5-7: Post-prandial Study: Effect of oral sodium propionate supplementation on glucose levels:
The effect of oral sodium propionate supplementation on glucose concentrations A. glucose levels (Time×Trial:
p=0 .086; Trial: p=0.823; Time: p= 0.000) and B. Glucose levels iAUC0-300 (p=0.452). C. Glucose levels +iAUC0-300
(p=0.674). D. Overnight fasted glucose levels iAUC0-180 min (p=0.941). E. Glucose levels +iAUC0-180 min (p=0.404). F.
Post-prandial glucose levels iAUC180-300 min (p=0.165). G. Post-prandial glucose levels +iAUC180-300 min (p=0.369). All
data expressed as mean ± SEM (n=20).
5.14.3.1.2 Insulin:
Insulin between 0-300 min was comparable between the Control and Propionate trials
(Control= 29.88 ± 2.69 μU/mL; Propionate= 30.27± 2.17 μU/mL; Effect of trial p=0.833) (Figure
5:8: A). Insulin iAUC0-300 and +iAUC0-300 was not significantly different between trials (p=0.970;
p=0.998) (Figure 5:8: B and C).
iAUC0-180 min and +iAUC0-180 min for the 180 min fasted period were not significantly different
between trials (p= 0.430; p=0.123) respectively (Figure 5:8: D and E). Insulin iAUC180-300 and
+iAUC180-300 were not significantly different between the trials (p= 0.930; p=0.930) (Figure 5:8:
F and G).

231
A
B
C

232
D
E
F
G
Figure 5-8: Post-prandial Study: Effect of oral sodium propionate supplementation on insulin levels:
The effect of oral sodium propionate supplementation on insulin concentrations A. Insulin levels (Time×Trial:
p=0.320; Trial: p=0.833; Time: p= 0.000) and B. Insulin levels iAUC0-300 (p=0.970). C. Insulin levels +iAUC0-300
(p=0.998). D. Insulin levels iAUC0-180 min (p=0.430). E. insulin levels +iAUC0-180 min (p=0.123). F. Post-prandial insulin
levels iAUC180-300 min (p=0.930). G. Post-prandial insulin levels +iAUC180-300 min (p=0.930). All data expressed as
mean ± SEM (n=20).

233
5.14.3.1.3 GLP-1:
GLP-1 between 0-300 min was comparable between the Control and Propionate trials
(Control= 67.9± 7.1 mmol/L; Propionate= 70.5± 6.2 mmol/L; Effect of trial p=0.626) (Figure 9:
A). GLP-1 iAUC0-300 and +iAUC0-300 was not significantly different between trials (p=0.095;
p=0.114) (Figure 9: B and C).
iAUC0-180 min and +iAUC0-180 for the overnight fasted period was significantly higher in the
Propionate trial (p= 0.004; p=0.016) respectively (Figure 9: D and E). GLP-1 iAUC180-300 and
+iAUC180-300 were not significantly different between the trials (p= 0.081; p=0.312) (Figure 9:
F and G).
A

234
B
C
D
E

235
F
G
Figure 5-9:Post-prandial Study: Effect of oral sodium propionate supplementation on GLP-1 levels
5.14.3.1.4 Insulin Sensitivity:
Matsuda Index:
Insulin sensitivity as per the Matsuda Index was comparable between trials (Control: 106.6±
12.0; Propionate: 94.6 ± 5.6; p= 0.388) (Figure 5:10: A).
A
Figure 5-10:Post-prandial Study: Effect of oral sodium propionate supplementation on Matsuda Index

236
5.14.3.1.5 Oral Disposition Index:
β-cell function was comparable between trials (Control: 3.15 ± 0.28; Propionate: 4.34 ± 0.78;
p= 0.452) (Figure 5:11: A).
A
Figure 5-11: Post-prandial Study: Effect of oral sodium propionate supplementation on Oral Disposition Index
5.15 Key Findings:
5.15.1 Overnight fasted Trial:
Overnight fasted state:
• Overnight fasted state: Acute Propionate ingestion attenuated the decrease in
glucose concentrations over a prolonged fasted period of 360 min. This is mainly
driven by the first half of the fasting period (0-180min). However, insulin resistance,
assessed by HOMA-IR, was unaffected.
5.15.2 Sub-maximal exercise Trial:
• Overnight fasted state: Propionate had no effect on glucose homeostasis in the
overnight fasted state.

237
• Sub-maximal exercise state: Propionate has no effect on glucose homeostasis during
exercise.
5.15.3 Post-prandial Trial:
• Overnight fasted state: Propionate ingestion attenuated the decrease in GLP-1
concentrations over the initial 180 min fasted period. This was not associated with
differences in insulin-resistance.
• Post-prandial state: Propionate had no effect on β-cell function or peripheral insulin
resistance in the post-prandial state.
5.16 Summary:
Acute ingestion of oral sodium propionate in healthy human volunteers can maintain GLP-1
secretion in the overnight fasted state but has no effect on measures of insulin sensitivity or
β-cell function in healthy humans.
5.17 Discussion:
5.17.1 Impact of Propionate on glucose profile:
A single rodent study has examined the acute effect of propionate supplementation on
glucose homeostasis (Tirosh et al., 2019) while the bulk of evidence relies on findings from
human trials. Human studies have mainly focused on the post-prandial acute effects of oral
propionate supplementation on glucose homeostasis (Todesco et al., 1991, Liljeberg et al.,
1995, Darwiche et al., 2001, Frost et al., 2003, Darzi et al., 2012, Chambers et al., 2015, Tirosh
et al., 2019) while only a single study (Chambers et al., 2018) examined the acute effects of
propionate ingestion on fasting glucose and insulin profile. This current study examined the
effect of acute sodium propionate supplementation on glucose homeostasis in all three
energy states. Here, it is shown that acute sodium propionate ingestion (71 mmol) can
attenuate the decrease in glucose concentrations that is normally seen with a prolonged fast
but has no effect on glucose homeostasis during physical activity or in the acute post-prandial

238
period. Todesco et al. demonstrated that post-prandial blood glucose levels can acutely be
decreased by ~50% in six healthy volunteers after consumption of bread supplemented with
31.2 mmol of sodium propionate per 50g of available carbohydrate in comparison to control
white bread (Todesco et al., 1991). Similarly, Liljeberg et al. and Darwiche et al. showed in
healthy volunteers that acute supplementation of 1.9 mmol of sodium propionate in bread
can significantly decrease post-prandial glucose and insulin responses in comparison to
control bread (Liljeberg et al., 1995, Darwiche et al., 2001). Also, Frost et al. showed in 10
healthy volunteers that the consumption of pasta with tomato sauce supplemented with 30
g sunflower oil and 30 mmol of sodium propionate can decrease glucose and insulin
concentrations in comparison to psyllium enriched pasta (Frost et al., 2003). However, Darzi
et al. showed that acute ingestion of propionate (6 mmol) in a palatable sourdough, may
lower post-prandial insulinemia in comparison to control bread although this effect was not
significant (Darzi et al., 2012). In addition, Chambers et. al have shown no apparent effect on
post-prandial glucose and insulin profile in overweight individuals supplemented acutely with
36.2 mmol of IPE (Chambers et al., 2015). A single study, however, has demonstrated that
propionate supplementation might impair post-prandial insulin action in humans by
promoting glucagon and fatty acid–binding protein 4 (FABP4) secretion via sympathetic
nervous system activation (SNS) (Tirosh et al., 2019). In that study, healthy, non-diabetic and
nonobese subjects after an 8-hour fast, were supplemented with a mixed meal with or
without 5.37 mmol of calcium propionate with one week apart between measurements. The
propionate supplementation resulted in a significant decrease in insulin sensitivity as per the
Matsuda Index and a postprandial increase in both glucagon and FABP4 via SNS activation.
Indeed, propionate supplementation has previously been shown to stimulate SNS activity in
rodents (Kimura et al., 2011), however, findings remain inconsistent with respect to the effect
of propionate on glucagon secretion(Wolever et al., 1991, McBurney et al., 1995, Ørgaard et
al., 2019).The present findings do reveal an increase in SNS stimulation following propionate
supplementation, as assessed by heart rate (Chapter 3, Figure 5 E) however with no
detrimental effect on glucose homeostasis, despite the much higher dose used in this study
in comparison to the study of Tirosh et al.. It is quite puzzling when comparing findings of
Tirosh et al. with findings of the current study since the only main difference between studies
is the supplementation of calcium propionate versus sodium propionate. However, altered
calcium serum levels are shown to be significantly correlated with abnormalities in glucose

239
levels ,insulin resistance and β-cell function with high serum calcium concentrations being
associated with the highest concentration of glucose and insulin resistance (Sun et al., 2005)
which may explain the discrepancy in findings. Moreover, one of the limitations in the Tirosh
study, is that the placebo consisted of an empty tablet rather than matched for calcium, in
contrast to the present study where the placebo consisted of a molar matched amount of
sodium so that any effect that occurs in this study could be attributed to the propionate rather
than the sodium. In any case, future human studies are therefore needed to better assess the
acute effect of propionate on SNS activation and its relation to overall glucose homeostasis.
All in all, it appears that the effect of propionate supplementation on post-prandial glucose
homeostasis are yet to be conclusive with the majority of studies portraying a positive effect
on glucose profile. The inconsistent findings may be related to the different dosing and
supplementation strategies between studies as well as the intestinal site of propionate
absorption that could have manipulated the effects on blood glucose and insulin profile. Also,
all the mentioned studies, including this trial, have used MTT to assess effects of
supplementation on glucose profile. However, although MTTs mimic physiological response
to glucoregulation, they may not be reproducible within the same individual due to variability
in glucose absorption, splanchnic glucose uptake, and additional incretin effects on various
days within the same individual (Patarrão et al., 2014) all of which can lead to discrepancies
in outcomes.
As for the effect of propionate supplementation on fasting glucose and insulin profile,
comparable with the present findings, Chambers et al., showed that acute sodium propionate
supplementation (71 mmol) over a 180 min time period has no effect on fasting circulating
glucose and insulin levels (Chambers et al., 2018). However, the current findings do reveal
attenuated glucose levels during the first 180 min of supplementation in the overnight fasted
trial. It is noteworthy, however, that the effect observed in this study was only seen during
the fasted state, particularly during the early 0-180 min period (Figure 1 D). This ‘increase’ in
glucose levels was not observed in the other two studies (Figure 4 B and Figure 7 D), despite
the same applied methods from 0-180min. Moreover, this may have been an artefact of a
slightly higher baseline glucose value in the overnight fasted study in the control trial (4.41 ±
0.12 mmol/L) versus propionate trial (4.28 ± 0.09 mmol/L) (p=0.062) especially since there

240
was no significant main effect of trial (Figure 1 A) or a significant difference in +iAUC (Figure
1 A,C and E) (p>0.05) which reflects a stimulatory effect.
Furthermore, the observed increase in glucose in the overnight fasted trial was not sufficient
to stimulate a compensatory insulin response or a change in insulin sensitivity, as measured
by HOMA-IR. Therefore, it may be safe to conclude that acute sodium propionate
supplementation ingestion in the current trial has no effect on glucose homeostasis
nevertheless further future studies are definitely needed to better assess the effects of
propionate supplementation on fasting glucose and insulin profile.
Gut-derived propionate is a known hepatic gluconeogenic precursor. However, this may not
have been sufficient to cause an increase above baseline glucose values since propionate has
been shown to reduce hepatic glycolysis (Anderson and Bridges, 1984) and to inhibit
gluconeogenesis from endogenous compounds such as lactate (Blair et al., 1973) and
pyruvate via increased propionyl CoA and methylmalonyl CoA which are known inhibitors of
pyruvate carboxylase as well as by decreasing acetyl CoA which potently activates this enzyme
(Chan and Freedland, 1972). Propionate has also been shown to decrease gluconeogenesis
from amino acids (Verbrugghe et al., 2012). Additionally, by acting as a substrate for IGN,
propionate can in turn inhibit hepatic glucose production via a gut-brain neural circuit (De
Vadder et al., 2014).
This trial was the only study that examined the effect of propionate supplementation on
glucose homeostasis during physical activity. And findings reveal no effect of acute sodium
propionate supplementation on glucose and insulin measures. However, this was examined
at a specific low to moderate exercise intensity (Control: 48 ± 2 %; Propionate: 47 ± 2%
VO2max). Therefore, whether these findings also apply at different exercise intensities where
substrate demand would differ, is yet to be determined. Future studies are therefore
warranted to further consolidate these findings.
In conclusion, in order to obtain a more accurate overview of the acute effects of propionate
on glucose homeostasis, future studies relying on more robust methodologies such as HIEC
are clearly needed.

241
5.17.2 Impact of Propionate on GLP-1 levels:
The present trial shows that acute sodium propionate ingestion in healthy volunteers can
increase GLP-1 secretion in the fasted state, but not post-prandially. In contrast, Frost et al.
showed in 10 healthy volunteers that the consumption of pasta with tomato sauce
supplemented with 30g sunflower oil and 30 mmol of sodium propionate can significantly
increase post-prandial GLP-1 levels and delay gastric emptying in comparison to psyllium
enriched pasta (Frost et al., 2003). Also, Chambers et. al have shown an increase in post-
prandial GLP-1 secretion in overweight individuals supplemented acutely with 36.2 mmol of
propionate from IPE (Chambers et al., 2015). The varying response with regards to the effect
of propionate on GLP-1 stimulation may in part be related to the different mode of
supplementation and/or the different dose given. In the current trial, healthy normal weight
subjects were supplemented orally with 71 mmol of sodium propionate in the form of
capsules. Frost et al. study included healthy volunteers who consumed pasta with tomato
sauce supplemented with 30 g sunflower oil and 30 mmol of sodium propionate. Whereas,
Chambers et al. included overweight volunteers supplemented with 36.2 mmol of IPE that
was mixed with subjects’ standardized meals. Taking all these factors into prospective as well
as considering the unique rate, degree and site of intestinal absorption that varies between
the studies, may explain the disparity in the metabolic effects observed. It is also noteworthy
that the “increase” in GLP-1 concentration observed in the current study was relatively minor
and the difference observed from control appears to reflect the prevention of a further
decline in GLP-1 levels that normally occurs with continued fasting i.e. propionate appeared
to maintain baseline GLP-1 levels.
5.17.3 Impact of Propionate on Insulin Resistance and β-cell function:
In the present trial, acute propionate supplementation had no effect on insulin resistance and
β-cell function. In vitro findings nevertheless demonstrate that propionate can enhance
glucose stimulated glucose uptake and glucose stimulated insulin secretion, however, this
was observed with a large dose of propionate (2 to 20 mM) (Pingitore et al., 2017) (300 mM)
(Han et al., 2014) that is not physiologically relevant. Chronic in vivo studies in humans
display similar results. Pingitore et al. showed that long term (24 weeks) colonic delivery of
propionate in the form of an IPE (36.2 mmol) in 60 overweight adults resulted in improved β-

242
cell function, as assessed by the oral disposition index (Pingitore et al., 2017). However,
similar to the present findings, the authors did not observe any effect on insulin resistance as
measured by the Matsuda Index. In contrast, Chambers et al. have shown in twelve
overweight or obese adults supplemented with 72.4 mmol/d of IPE for 42 days had significant
improvement in insulin resistance as measured by HOMA-IR and the Matsuda Index
(Chambers et al., 2019). Thus, the effect of propionate on insulin resistance and β-cell
function is relatively scarce and inconsistent in human studies. It also appears that
discrepancies occur depending on whether supplementation is acute or chronic and also on
the method of supplementation, the dose provided and BMI of the subjects.
5.18 Study Strengths:
This trial is the first to assess the impact of acute oral sodium propionate supplementation on
glucose homeostasis in all three energy states. It is particularly unique in that it examined the
effect of supplementation during exercise. Although there was no effect of acute sodium
propionate supplementation on glucose homeostasis during sub-maximal exercise, future
studies are needed to confirm these findings.
5.19 Study Limitations:
The acute effect of sodium propionate supplementation on glucose homeostasis was a
secondary outcome of the study. And thus, given the nature of the study, surrogate markers
were utilized to assess insulin resistance and β-cell function. Future intervention studies,
using more direct and reliable measures such as HIEC, would be able to give a better reflection
of the effect gut-derived on glucose and insulin profile. Also, carbon-13 (C-13) labelled
propionate may be utilized to investigate the role of gut-derived propionate on its
bioavailability, gluconeogenesis and overall glucose homeostasis. For instance, the present
trial could be repeated using C-13 labelled propionate and by measuring incorporation of C-
13 into expired CO2, an estimate of when propionate is being metabolized can be determined
and by measuring plasma C-13 glucose, propionate’s incorporation into glucose can be
measured in order to examine propionate’s impact on gluconeogenesis.

243
Another limitation of the present trial is that it only included metabolically healthy individuals
and therefore whether the same effects can be replicated in individuals with impaired glucose
homeostasis or T2D is not yet apparent. If propionate is assumed to suppress gluconeogenesis
from other gluconeogenic substrate since no effect on glucose homeostasis was seen in
healthy individuals, this may not hold in compromised individuals since in T2D subjects,
gluconeogenesis is impaired and thus a rise in glucose levels may be seen with propionate
supplementation. Future studies therefore are needed to investigate that further.
5.20 Conclusion:
Acute ingestion of oral sodium propionate in healthy human volunteers can prevent
deterioration in GLP-1 levels observed with prolonged fasting but has no effect on insulin
resistance and β-cell function. Also, the impact of sodium propionate ingestion on glucose
levels in the fasted state (0-180 min) was only observed in one of the three studies and thus
would demonstrate that acute propionate ingestion has no effect on markers of insulin
sensitivity and glucose tolerance in healthy humans. It is noteworthy, however, that the
present trial only included normal weight, healthy individuals with normal glucose tolerance,
hence it may be challenging to enhance an already ‘normal’ parameter. Hence, well-
controlled future studies using more robust methodologies are needed to better investigate
the acute effect of gut derived propionate on glucose homeostasis in individuals with a range
of metabolic health and also in all three different energy states.

244
Chapter 6: Effect of Sodium Propionate on Serum Metabolic
Phenotypes
6.1 Abstract:
Background:
Metabolomic techniques such as nuclear magnetic resonance (NMR) spectroscopy allow the
identification of changes to the metabolic profile of biofluids in response to changes in
biological activity and can thus allow reflection of an organism’s phenotypic state. No human
study up to date has employed metabolomic techniques to assess changes in serum
metabolome in response to raised propionate bioavailability. Thus, this study, was the first to
use NMR spectroscopy to investigate the acute effect of oral sodium propionate
supplementation I71 mmol) in healthy volunteers on serum metabolome in the overnight
fasted and post-prandial states.
Methodology:
This was a randomized controlled double-blind cross-over study. 19 volunteers (12 males and
7 females; age: 45.0 ± 3.5 years; BMI: 24.8 ± 0.8 kg/m2) completed two study visits. In each
visit, following an overnight fast, tablets containing either 6845mg sodium propionate or
4164mg sodium chloride (Control) were first administered over 180 min. At time-point 180
min, a mixed calorie liquid meal (Ensure Original Vanilla Nutrition Shake: 72.7 g carbohydrate,
13.6 g fat and 20.5 g protein; 500 kcal) was provided to volunteers.
1-D (One-dimensional) 1H-NMR spectroscopy was used to analyse serum metabolite changes
associated with propionate supplementation at 0, 180 and 240 min.
Results:
Oral sodium propionate supplementation altered six serum metabolites. At baseline (0 min),
no significant differences between measured metabolites was present between Control and
Propionate (p>0.05). At the end of the overnight fasted period (180 min), 3-Hydroxybutyrate

245
and lysine were downregulated with propionate supplementation, whereas LDL/VLDL, lactate
and methanol were upregulated. During the post-prandial period (240 min), LDL/VLDL,
lactate and alanine were upregulated with propionate supplementation.
Conclusion:
This study is the first to demonstrate that acute ingestion of oral sodium propionate (71
mmol) in healthy human volunteers can affect serum metabolite phenotype in both the
overnight fasted and post-prandial states. The increased methanol concentrations observed
during the overnight fasted period may highlight altered gut microbial activity associated with
propionate supplementation that support increases in methanol production and appearance
in systemic blood. The raised abundance of alanine and lactate could be the consequence of
propionate sparing other precursors for hepatic gluconeogenesis.
6.2 Metabolomics: 6.2.1 Definition:
Metabolomics can be defined as the study of metabolites in biological fluids where
metabolites refer to the small molecules present in biological samples such as blood or urine.
Metabolites, as the downstream products of metabolic pathways, can serve as direct
representatives of biological activity and allow reflection of an organism’s phenotypic state
(Patti et al., 2012). Thus, metabolomics can identify characteristic biomarkers of particular
phenotypes or disease states prior to even ‘symptoms’ occurrence (Wishart, 2016) and can
hence be considered a non-invasive, valuable tool method in many research settings. Indeed,
since its development, metabolomics has widely been employed in nutritional and medicinal
investigations for the identification of certain objective biomarkers related to disease and
health enabling the development of personalized nutrition and even applying that to
epidemiological studies in order to establish a link between diet and health (Astarita and
Langridge, 2013, Wishart, 2016).
6.2.2 Design:
When designing a metabolomic study, it is important to consider the purpose of the research
and the number of metabolites to be determined. For example, when a defined set of

246
metabolites is needed, a targeted based approach is the preferred method. Targeted analysis
involves the prior identification and quantification of metabolites to be measured that are
often related to a particular metabolic pathway of interest. This technique is often used in
order to answer a specific research question or hypothesis. In contrast, the untargeted
analysis is a non-biased approach that measures as many metabolites as possible and allows
a fair comparison between samples under study. This technique analyses all detectable
metabolites, both unknown and known, and identifies which metabolites are significantly
perturbed. Thus, untargeted analysis could be described as a ‘discovery mode’ process and is
used to compare differences between groups such as interventions versus controls but
cannot be used for individual samples analysis (Patti et al., 2012, Gertsman and Barshop,
2018).
6.2.3 Analytical Tools:
The main analytical tools applied in metabolomics include nuclear magnetic resonance (NMR)
and mass spectrometry (MS) combined with chromatography, which are continuously
developing and allowing considerable progress in metabolomic research (González-Peña and
Brennan, 2019). Indeed, NMR and MS metabolomic database have recently expanded
considerably which has allowed significant improvement in query platforms and identification
of metabolites (Bingol et al., 2014, Bingol et al., 2015, Zhao et al., 2019).
6.2.3.1.1 Nuclear Magnetic Resonance Spectroscopy:
NMR is considered a robust and reproducible spectroscopic technique (Keun et al., 2002,
Barton et al., 2008) while also requiring minimal effort during sample preparation. In simple
terms, NMR relies on the behaviour of atoms when exposed to an external magnetic field.
With energy absorption and reemission, the atoms are able to generate radiofrequencies
which can be converted to a frequency spectrum. The resulting spectra can then give both
quantitative data of metabolite concentrations as well as information on their chemical
structure (Tognarelli et al., 2015). Hydrogen, as the most abundant element found in nature,
is often the most targeted nuclei during NMR analysis (1H-NMR). Nevertheless, other atoms
such as carbon (13 C-NMR) and phosphorus (31 P NMR) are also used in NMR (Marion, 2013,
Tognarelli et al., 2015). The various spectral peak areas generated by each molecule

247
corresponds with the concentrations of the metabolites in the tested sample while the type
of metabolite is identified by the unique pattern of peaks that relay information on the
physical properties of each molecule. The spectral data generated can be expressed in two
main ways: a one-dimensional NMR (1D-NMR) or a two-dimensional NMR (2D-NMR). The 1
D-NMR, as the name implies, is based on a single frequency axis with each molecule peak
placed in its resonant frequency, while the 2D-NMR is based on two frequency axis that can
separate overlapping spectral peaks into a second dimension and is often only used when a
large number of overlapping peaks exists due to a large number of compounds present in the
tested sample. Otherwise, 2 D-NMR due to high resolution, can be used to determine
components of unfractionated or partially fractionated mixture such as tomato juice (Ward
et al., 2007).
Statistical analysis of 1 D-NMR spectra can indeed be challenging given the wide range of
metabolite concentrations found in biological fluids and even the variable composition that
could be found in the same biological fluid such as urine (Lindon et al., 2000) in addition that
each metabolite can have a large physiological concentration range (Psychogios et al., 2011).
Thus, this renders evaluation and interpretation of 1 D-NMR biased toward determining
changes in the more bountiful metabolites. Therefore, although 2 D-NMR is more laborious
in terms of time in comparison to 1 D-NMR, in studies where assessing changes in low-
abundance metabolites and overall metabolic profile is the main outcome, 2 D-NMR may
prove to be the preferred analysis method of choice (Van et al., 2008). Nevertheless, 1 D-
NMR, specifically 1D 1H NMR, is the most commonly used method in metabolomic profiling
research due to its highly automated, greatly reliable and speedy technique (Kruk et al., 2017,
Emwas et al., 2019) which allows for identification and quantification of around 50-100
metabolites at a time (Lindon et al., 2000). Indeed, 1D 1H NMR has been used extensively by
multiple research groups in order to assess the pathology and progression of various diseases
and health states such as in trauma and critical illness (Cohen et al., 2010, Serkova et al.,
2011), hepatic disease (Amathieu et al., 2011) as well as cancer (Odunsi et al., 2005).
Moreover, it seems to be the preferred technique for large scale population studies due to its
very high reproducibility (Dumas et al., 2006, Barton et al., 2008, Li-Gao et al., 2019).

248
6.2.3.1.2 Mass Spectrometry:
MS is a highly sensitive analytical tool that could be used for the identification and
quantification of hundreds of metabolites with each use by determining their molecular
weight (Gowda and Djukovic, 2014). Indeed, MS-based metabolomics has been used vastly in
medical sciences including clinical biomarker discovery, drug development, nutritional and
forensic science (Zhang et al., 2020). For instance, in a cohort of 2,324 patients, Fan et al.
identified, using MS-based metabolomics, 89 different metabolites that were reflective of
metabolic disturbances characteristic of the occurrence or development of coronary artery
disease such as upregulation of specific amino acids and creatinine and downregulation of
certain phospholipids (Fan et al., 2016). The basis of MS relies on the development of
positively or negatively charged gas-phase ions that can be separated based on their mass-
to-charge ratio (m/z) via electrical or magnetic means. During the ionization process, some
molecules will break into charged fragments or remain intact and can then be separated and
analysed based on their mass to charge ratio (m/z). The MS spectrum acquired is a graphical
representation of (m/z) versus the total ion counts (the relative intensity of the measured
compounds) which could be used to identify the elements or isotopes present in the sample
and the masses of the molecules and their chemical structure. The detected ions can be
characterized by correlating known masses to the generated masses or via distinctive
fragmentation pattern. Thus, the MS process can be summarized in three main steps: 1)
ionization of molecules into the gaseous phase by an ionization source 2) separation of the
formed ions according to their m/z via magnetic or electric exposure though a mass analyser
3) interpretation of the different peak patterns generated from the electric charge of the
separated ions that are unique to each molecule and are proportional to the quantity of the
ionized compound. A range of equipment and technical variety exist for MS such as
electrospray ionization (ESI) and matrix-assisted laser desorption ionization (MALDI) that can
transform molecules into ions and quadrupole and time of flight (ToF) mass analysers as
spectrometric instruments with each variant suited to specific compounds or applications (El-
Aneed et al., 2009, Girolamo et al., 2013, Urban, 2016). Since in metabolomics research, MS
is rarely performed on single compounds, a separation step is often needed prior to MS. This
is generally achieved through chromatographic techniques such as high-performance liquid
chromatography (HPLC) and gas chromatography (GC) which allow the differentiation or

249
separation of metabolites based on their different absorbent properties inside the
chromatographic column. Thus, metabolites with different characteristics will have varying
time to pass through the column. Nevertheless, direct MS approaches include direct
injection/infusion (DIMS) technique which bypass the use of chromatographic separation and
prior sample preparation thus rendering them a rapid technique. However, high-resolution
mass spectrometers are often needed with more direct approaches in order to distinguish
between existing isomers (Dettmer et al., 2007, Gowda and Djukovic, 2014). Therefore, while
no consensus exists as in which MS analytical method is gold-standard use for measuring each
metabolite, the optimal method/tool to use depends on the purpose of the research and the
availability and cost of the instrument and the required resolution and sensitivity needed for
the study (Zhang et al., 2020).
6.2.3.1.3 NMR versus MS:
When comparing NMR and MS for metabolomic analysis, both technologies have their
strengths and limitations. NMR is typically used to trace metabolic pathways rather than
identify a whole metabolome matrix pathways (Fan and Lane, 2011). Indeed, the use of stable
isotope-enriched tracer in studies have allowed NMR to elucidate the dynamics of metabolite
transformations and biochemical pathways. For instance, Kalderon et al. developed using 13C-
labelled glucose and 1H NMR, a non-invasive and non-radioactive diagnostic test for
measuring hepatic glucose recycling to identify or differentiate between the different types
of glycogen storage disease (GSD) in children. In glycogen storage disease 1 (GSD I), glucose-
6-phosphatase activity is impaired causing inhibition of gluconeogenesis whereas in glycogen
storage disease III (GSD III) amylo-1,6-glucosdiase deficiency is prevalent thereby endogenous
glucose production can still stem from gluconeogenesis. A primed dose-constant infusion of
D-[U-13C] glucose or unlabelled glucose was administered to GSD-I and GSD- III patients after
fasting and glucose carbon recycling was determined by analysing 13C NMR resonances of
plasma glucose 13C-13C coupling of two adjacent glucose carbons C-1-C-C2. Results indicated
that plasma glucose of GSD-I subjects comprised of only a mixture of 99% 13C-enriched D-[U-
13C] glucose and unlabelled glucose but lacked any recycled glucose whereas endogenous
glucose production of non-13C-labeled and unrecycled glucose carbon was found in GSD-III
patients therefore highlighting the differing mechanism of glucose production between both

250
diseases (Kalderon et al., 1989). NMR is indeed considered a fast, non-invasive, non-
destructive and far more reproducible method than MS. For example, in the same type of
fasting sample, with NMR analysis, coefficient of variation (CV) of metabolites, ranges from
0.9–42% in contrast to 1.1–86% with GC-MS technique (Karimpour et al., 2016). Moreover,
NMR allows for quantitative analysis where signal intensity is directly proportional to
metabolite concentrations and number of nuclei in the molecule in contrast to MS where
intensity of the MS line is not often associated with metabolite concentrations since
ionization efficiency is also a key factor. NMR is also the primary method for determination
of unknown structures where it can identify chemical structures and their stereochemistry
which are difficult to assess using MS technique. Among other advantages includes NMR’s
lack of need for a prior purification separation method and typically too, NMR is advantageous
over MS when detecting compounds that are difficult to ionize or require derivatization (Kruk
et al., 2017, Markley et al., 2017). Nevertheless, MS has a higher sensitivity than NMR and can
identify metabolites using much smaller samples and at much lower concentrations reaching
nanomolar and is also capable of detecting individual metabolites in complex mixtures with
simple extraction methods such as gas/liquid chromatography. In addition, the various MS
approaches using different ionization techniques and mass analysers enables a greater
number of metabolites to be detected (in urine sample: >500 different metabolites can be
detected using various MS techniques versus 40-200 using NMR with varying spectral
resolutions) (Bjerrum and Bjerrum, 2015, Emwas et al., 2019, Zhang et al., 2020). Moreover,
its superior targeted analysis over NMR makes it an ideal tool for precision metabolomics of
clinical purposes since in medical science, samples are often quite valuable therefore the
smaller sample size required for MS versus NMR makes MS-based technology widely used in
clinical research (Mittal, 2015). Indeed, although NMR can be utilized for targeted and
untargeted analysis, it is often reserved for untargeted analysis in contrast to MS where GC-
MS and (LC)-MS allow for superior targeted analyses (Emwas et al., 2019).
It must be noted, however, that NMR and MS techniques due to their distinct advantages and
limitations can both be combined to provide a wider coverage of the metabolome. In
combination, these methods can be used to avoid ambiguity when analysing analytes and
help identify individual metabolites in a mixture. Both NMR and MS convey valuable
structural data, however, in order to ensure that the data generated by both methods apply

251
to the same analyte (Elipe, 2003) and in order to obtain more orthogonal data that can
facilitate the identification of metabolites (Li et al., 2019), together they could be used in an
LC (liquid chromatography)-MS-NMR technique. Applications of LC-MS-NMR technique have
expanded in different research settings. An example of this application is in the field of plant
research (Bhinderwala et al., 2018) and pharmakinetic studies of drug development (Rindgen
et al., 2001) to assess metabolic variations with varying treatments and for metabolite
detection and identification.
6.3 Fermentable Fibre and Metabolite Profiling:
Fermentable fibre (FerF) consumption has consistently shown to have positive effects on
energy balance and carbohydrate/lipid metabolism. Indeed, intake of this type of fibre seems
to have inverse associations with weight gain and body lipid accumulation (Wanders et al.,
2011, Adam et al., 2014) and can have favourable effects on glucose homeostasis (Schwartz
et al., 1988, Dehghan et al., 2013). However, in order to better understand the positive effects
of FerF on substrate metabolism and health status, metabolite profiling can be used to map
the relationship between the two by assessing related metabolite changes in biological fluids.
Liu et al. put forth an explorative study on FerF that aimed to examine the effects of sweet
potato (SF) or sweet potato residue (SR) supplementation, that mainly differ in fibre content,
on rat metabolism (Liu et al., 2014). SF typically contains more fibre than SR by an estimated
~70%. For 30 days, rats were given a basal diet containing either 15% SF or 15% SR, or no
supplemental fibre (control). Both SF and SR increased gut production of the short-chain fatty
acid (SCFA) acetate, which is marker of fermentability by the gut microbiota. Plasma 1H NMR
spectroscopy analysis, however, revealed differing metabolite change induced by SF and SR
interventions. In comparison to the control group, SF significantly increased plasma levels of
lipid, lactate, and myo-inositol while decreased plasma levels of glutamine,
glutamine/glutamate, lysine, phosphorylcholine/glycerolphosphocholine, tyrosine, alpha-
glucose, and ß -glucose. SR, on the other hand, also increased plasma levels of lipid and lactate
but differentially increased plasma acetone levels in comparison to control. Moreover, SR
significantly decreased plasma levels of citrate, glutamate, glutamine, isoleucine, lysine,
methionine, alpha-glucose, and ß -glucose. When comparing SF versus SR effects on plasma,
SF significantly decreased plasma levels of lysine, phosphorylcholine/glycerolphosphocholine,

252
a-glucose, and ß-glucose, compared with the SR group. Establishing a link between those
metabolites changes and other biomarkers measured by various techniques allows better
understanding of the effect of SR and SF on host metabolism. For instance, SF decreased
plasma TG levels, and relating that with metabolites changes such as the decreased myo-
inositol, a lipid signalling molecule, indicates that SF can affect lipid metabolism. Myo-inositol
is a known structural backbone for numerous secondary messengers such as inositol
phosphates and phosphatidylinositol that are involved in the regulation of insulin signalling
and fatty acid oxidation. SR too seems to effect lipid metabolism, although differently. Plasma
levels of VLDL, LDL and acetone levels were increased with SR supplementation while plasma
TG levels were decreased. SF and SR also seemed to affect glucose and energy metabolism.
Both interventions increased plasma lactate levels. Lactate is an end-product of compound
energy metabolism and increased lactate levels may indicate increased anaerobic glycolysis,
inhibited gluconeogenesis and a variation in carbohydrate and energy metabolism. Moreover,
plasma glucose concentrations were significantly decreased with SF and SR administration in
comparison to the control which combined with the observed increase in lactate
concentrations can indicate increased glycolysis and decreased gluconeogenesis. Finally, SF
and SR supplementation also seemed to affect amino acid metabolism. Lowered amino acids
such as plasma lysine, glutamate, and glutamine/glutamate which are involved in protein
synthesis were observed with SF supplementation and combining this with the measured
decrease in blood urea nitrogen levels may indicate that total protein synthesis was
diminished with SF supplementation. Glutamine, which can activate signalling pathways that
promote protein synthesis was suppressed with SR supplementation which can also signify
altered amino acid metabolism with SR supplementation.
Wu et al. also examined the effect of a FerF, in this case inulin, on pigs’ metabolic health by
assessing plasma metabolite signatures and changes in metabolic pathways associated with
inulin supplementation using GC-MS (Wu et al., 2016). Pigs were fed with a corn-soybean
meal control diet or the same diet supplemented with 5% inulin for 60 days. Pigs
supplemented with inulin had significant increases in cecum propionate concentrations and
a subsequent lower acetate to propionate ratio in comparison to pigs on the control diet.
Among the metabolites assessed in plasma, the branched chain amino acid (BCAA) isoleucine
was greater (p< 0.05) with inulin supplementation in comparison to control. An increase in

253
BCAA levels could be a marker for development of insulin resistance and elucidating BCAA
metabolism may be a target for therapeutic treatment of insulin resistance or type 2 diabetes
(Yoon, 2016). Proline and ornithine, key components of urea cycle, were also decreased with
inulin supplementation and the authors suggested this could be due to active amino acid
catabolism as there was an 80% increase in plasma urea. A decrease in proline concentration
is an encouraging outcome since increased proline levels are linked with coronary heart
disease risk (Liu et al., 2016). Plasma free fatty acids, saturated (SF) and mono- saturated (MF)
fatty acids were also found to be significantly lower and poly-saturated fatty acids (PUFA)
significantly higher with inulin supplementation in comparison to control. These effects are
quite favourable since higher PUFA and lower SF concentrations are associated with lower
cardiovascular disease risk (Siri-Tarino et al., 2015).
Samuelsson et al. also examined the effect of inulin supplementation on metabolic profile
using LC–MS with an emphasis on lipid metabolism (Samuelsson et al., 2016). Rats were fed
a basal diet supplemented with 5% inulin or a basal control diet for 14 days. Similar to the
findings of Wu et al., with inulin supplementation, elevated levels of propionate were found
in the small and large intestine. However, inulin supplementation seemed to induce
unfavourable effects on PUFA lipid metabolism. Serum eicosapentaenoic acid (EPA) (20:5)
and docosahexaenoic acid (DHA, 22:6) were decreased with inulin exposure i.e. n-3 pathway
was downregulated whereas n-6 pathway where linoleic acid is ultimately converted to
docosapentaenoic acid (DPA, 22:5) was upregulated. While it is often considered that
decreased EPA and DHA concentrations are associated with increased risk of cardiovascular
disease risk (Cottin et al., 2011) current evidence is yet to be conclusive (Abdelhamid et al.,
2020). In any case, rats in the inulin fed group experienced no weight gain in comparison to
controls.
Certainly, these findings highlight that interpretation of the effects of FerF on metabolic
health is quite complex and can involve numerous biochemical processes. Thus, the use of
metabolomic techniques to assess metabolite changes are vital to provide insight on
biochemical processes altered with FerF supplementation and their consequences on overall
metabolic health.

254
6.4 Propionate and Metabolic Profiling:
Accumulating evidence has shown that propionate supplementation can protect against body
weight gain (De Vadder et al., 2014, den Besten et al., 2015, Chambers et al., 2015) and can
have differential effects on substrate metabolism. With regards to lipid metabolism,
propionate has been shown to have hypocholesterolemic effects (Chen et al., 1984, Demigné
et al., 1995, Berggren et al., 1996, Chambers et al., 2015) and can suppress de novo
lipogenesis (Demigné et al., 1995, Heimann et al., 2015) and decrease circulating free fatty
acid concentrations (Chen et al., 1984, den Besten et al., 2015) and triglyceride content in
both the liver (den Besten et al., 2015, Chambers et al., 2015) and white adipose tissue (De
Vadder et al., 2014, den Besten et al., 2015). Moreover, propionate has shown to have
favourable effects with regards to glucose homeostasis where studies have demonstrated
decreases in fasting (Venter et al., 1990, Boillot et al., 1995) and post-prandial (Liljeberg et al.,
1995, Darwiche et al., 2001) glucose and insulin concentrations as well as improvements in
insulin resistance (den Besten et al., 2015, Chambers et al., 2019) and β-cell function
(Pingitore et al., 2017). Stable isotope studies in rodent models have provided mechanistic
insight of how propionate is metabolized in the body. Propionate enters the TCA cycle at the
level of succinyl-CoA and can then be converted to oxaloacetate and ultimately into glucose
(Jones et al., 1997, Perry et al., 2016). However, very limited data actually exists with regards
to propionate’s effect on metabolite profile. A single, recent study by Yu et al. examined in
pigs the effects of cecal infused sodium propionate supplementation on biochemical
parameters in serum and hepatic tissues while using GC−MS for metabolomic analysis (Yu et
al., 2019). During a 28-day time period, pigs were infused with saline (n = 8) or sodium
propionate solution (n = 8) (25 mL, 2 mol/L, pH 5.8) twice per day. Hepatic metabolomic
profiling then revealed twelve metabolites that were altered with propionate
supplementation such as increases in amino acid metabolites (aspartic acid and serine),
tricarboxylic acid (TCA) cycle intermediates (malic acid, fructose-6-phosphate, succinic acid,
and aspartic acid) and decreases in lipid metabolism metabolites (stearic acid and glycerol-2-
phosphate) and in several long-chain fatty acids (LCFAs) (arachidonic acid, docosahexaenoic
acid and hexadecanoic acid) with a tendency for increased glycerin in the propionate group.
The decreases in hepatic lipid TG is suggestive of decreased LCFA synthesis since serum TG
levels were also similarly reduced. Moreover, hepatic transcriptome analysis then revealed

255
numerous lipid−related metabolic pathways that were enriched with propionate
supplementation such as PPAR signalling, adipocytokine signalling, and fatty acid metabolism
that explained the molecular mechanisms of propionate-induced TG reduction. For instance,
CPT1 which transfers LCFAs into the mitochondria for fatty acid β-oxidation was upregulated.
Moreover, fatty acid synthesis genes such as SCD1 and FABP3 were downregulated after
propionate infusions. Therefore, it appears that propionate can affect lipid metabolism by
decreasing fatty acid synthesis and promoting lipid oxidation. Findings from this study
highlight the importance of linking metabolite changes such as lipid parameters detected with
metabolomic profiling with findings of alternative techniques that together provide a better
overview of how propionate can favourably affect host metabolism.
In summary, it appears that metabolomic profiling can help understand how propionate can
affect host metabolism by identifying metabolites responsive to increased propionate
bioavailability. However, a substantial gap remains in the literature, particularly in humans.
Given the limited research on this topic, the aim of this chapter is to examine how serum
metabolic phenotype is altered by acutely raising gut derived propionate in healthy humans.
Acute oral propionate supplementation consistently demonstrated an increase in lipid
oxidation (Chapter 3) and had no effect on serum glucose concentrations (Chapter 5) in the
overnight fasted state (0-180 min). Moreover, an increase in energy expenditure and no effect
on glucose profile was also seen post-prandially. Thus, in order to elucidate how those
metabolic changes came into effect, serum samples from the post-prandial trial that
encompassed all those three main outcomes were assessed using 1D 1H NMR analysis. 1D 1H
NMR technique was chosen since it is a non-destructive technique compared to MS and thus
allows for multiple analysis to be performed on the same sample. Untargeted analysis was
chosen to measure as many metabolites as possible and identify how raised propionate alters
the serum metabolic fingerprint.
6.5 Hypothesis:
I hypothesised that acute oral intake of sodium propionate would alter metabolite the serum
metabolic phenotype in both overnight fasted and postprandial state.

256
6.6 Aims:
This chapter will aim to present and discuss findings related to identification of metabolites
altered with propionate supplementation and relate those changes with the observed
increases in energy expenditure and lipid oxidation (Chapter 3) as well as the lack of effect on
serum glucose levels (Chapter 5).
6.7 Outcome Measures:
The primary outcome measure of this trial is the identification of metabolites altered by
propionate supplementation using untargeted analysis via 1D 1H NMR technique.
6.8 Methods:
Please refer to Chapter 2:
6.9 Results:
6.9.1 Post-Prandial Trial:
RM-MCCV-PLS-DA score plot derived from 1D 1H-NMR CPMG spectra of serum samples,
indicating the comparison between propionate group and control group baselines (t = 0 min),
(t=180 min) and (t=240 min) can be found in Figures 6:1,6:2 and 6:3 respectively. At baseline
(0 min), no significant differences between measured metabolites was present between
Control and Propionate (p>0.05). At the end of the fasting period (timepoint 180 min), 3-
Hydroxybutyrate and lysine were downregulated with propionate supplementation whereas
LDL/VLDL, lactate and methanol were upregulated. During the post-prandial period
(timepoint 240 min), LDL/VLDL, lactate and alanine were upregulated with propionate
supplementation.
A summary of metabolites observed in plasma that significantly changed between the control
and propionate groups observed via RM-MCCV-PLS-DA models at different time points can
be found in Table 6.1.

257
A List of 1H NMR peak assignments for significant metabolites derived from RM-MCCV-PLS-
DA models of serum data set can be found in Table 6.2.
Figure 6-1: RM-MCCV‐PLS‐DA score plot at baseline
RM-MCCV-PLS-DA score plot derived from 1D 1H-NMR CPMG spectra of plasma samples, indicating the
comparison between propionate group (red) and control group (blue) baselines (t = 0 min). The model is
comprised of Kernel Density Estimate (KDE) of the predicted scores (Tpred) for both groups. Dots represent
the metabolic profile of each volunteer from the study cohort when its corresponding NMR spectrum for both
interventions were available at this time point (n = 18). The fit and predictability of the model were obtained
and expressed as R2Y (explained variance) and Q2Y (capability of prediction) values. RM, Repeated Measures,
MCCV, Monte Carlo Cross-Validation; PLS-DA, partial least squares discriminant analysis.

258
Figure 6-2: RM-MCCV‐PLS‐DA score plot at 180 min
A- RM-MCCV-PLS-DA score plot derived from 1D 1H-NMR CPMG spectra of plasma samples, indicating the
differentiation between propionate group (red) and control group (blue) at the end of fasting period (180
min). The model is comprised of Kernel Density Estimate (KDE) of the predicted scores (Tpred) for both
groups. Dots represent the metabolic profile of each volunteer from the study cohort when its corresponding
NMR spectrum for both interventions were available at this time point (n = 20). The fit and predictability of

259
the model were obtained and expressed as R2Y (explained variance) and Q2Y (capability of prediction) values.
B- The corresponding RM-MCCV-PLS-DA loading plot. Top depicts the average 1D 1H-NMR CPMG spectrum
of the 40 plasma samples. The bottom depicts the Manhattan plot showing − log10(q) × sign of regression
coefficient (β) of the RM-MCCV-PLS-DA model that in conjunction represent the contribution of each variable
on it. In blue, metabolites are shown that are significantly higher in the control group, and in red metabolites
significantly higher in the propionate group. Labels: 1, LDL/VLDL; 2, 3-hydroxybutyrate; 3, lactate; 5, lysine; 6,
methanol. RM, Repeated Measures, MCCV, Monte Carlo Cross-Validation; PLS-DA, partial least squares
discriminant analysis. For peak assignments refer to Table 6-2.

260
Figure 6-3: RM-MCCV‐PLS‐DA score plot at 240 min
A- RM-MCCV-PLS-DA score plot derived from 1D 1H-NMR CPMG spectra of plasma samples, indicating the
differentiation between propionate group (red) and control group (blue) during the postprandial period (240
min). The model is comprised of Kernel Density Estimate (KDE) of the predicted scores (Tpred) for both groups.
Dots represent the metabolic profile of each volunteer from the study cohort when its corresponding NMR
spectrum for both interventions were available at this time point (n = 20). The fit and predictability of the model
were obtained and expressed as R2Y (explained variance) and Q2Y (capability of prediction) values. B- The

261
corresponding RM-MCCV-PLS-DA loading plot. Top depicts the average 1D 1H-NMR CPMG spectrum of the 40
plasma samples. The bottom depicts the Manhattan plot showing − log10(q) × sign of regression coefficient (β)
of the RM-MCCV-PLS-DA model that in conjunction represent the contribution of each variable on it. In blue,
metabolites are shown that are significantly higher in the control group, and in red metabolites significantly
higher in the propionate group. Labels: 1, LDL/VLDL; 3, lactate; 4, alanine. RM, Repeated Measures, MCCV,
Monte Carlo Cross-Validation; PLS-DA, partial least squares discriminant analysis. For peak assignments refer to
Table 6-2.
Table 6-1: Serum Metabolite Changes:
Summary of metabolites observed in plasma that significantly changed between the control and propionate
groups observed via RM-MCCV-PLS-DA models at different time points.
Sampling Point R2Ya Q2Yb Metabolite Associationc Baseline (0 min)d 0.99 0.09 N/A N/A At the end of fasting period (180 min) 0.99 0.31 3-
Hydroxybutyrate ↑
Lysine ↑ LDL/VLDL ↓ Lactate ↓ Methanol ↓
During the postprandial period (240 min)
0.99 0.33 LDL/VLDL ↓ Lactate ↓ Alanine ↓
a,bValidation parameters of the corresponding PLS-DA models. cSign of association: ↑ indicates
upregulation in the control group, ↓ indicates upregulation in the group dosed with propionate.dNon-
significant model.

262
Table 6-2: List of 1H NMR peak assignments
List of 1H NMR peak assignments for significant metabolites derived from RM-MCCV-PLS-DA models of serum
data set.
aNo. Metabolite Assignment
Confirmationc 1Hb
1 LDL/VLDL 0.88d 1D,STORM
1.29e
1.57f
2.02g
2.23h
5.31i
2 3-Hydroxybutyrate 1.19 (d) 1D
2.30 (dd) 1D, STORM
2.40 (dd)
4.14 (m)
3 Lactate 1.32 (d) 1D, STORM
4.10 (q)
4 Alanine 1.48 (d) 1D, STORM
3.79 (q)
5 Lysine 1.73 (m) 1D, STORM
1.90 (m)
3.03 (t)
6 Methanol 3.35 (s) 1D aNumber order is based on chemical shift. bThe chemical shifts and multiplicities are listed for
peaks from significantly associated metabolites. Multiplicity key is as follows: s – singlet, d –
doublet, t – triplet, q – quartet, dd – doublet of doublets, m – (other) multiplet. cCorrelation
spectroscopy using 1H 1D-NMR spectra data set via STORM.d1 CH3 group. e-CH2- groups. f -
CH2. gAllylic-CH2. h -CH2. iOlefinic hydrogens.

263
6.10 Discussion:
In this study, the acute effect of oral sodium propionate supplementation (71 mmol) on serum
metabolome in healthy human volunteers was examined. Six metabolites were significantly
altered with propionate supplementation. Between 0-180 min, LDL/VLDL, lactate and
methanol were upregulated whereas 3-hydroxybutyrate and lysine were decreased. This
coincided with an increase in lipid oxidation and unchanged glucose profile. Post-prandially,
when propionate increased energy expenditure, LDL/VLDL, lactate and alanine were
increased with propionate supplementation.
6.10.1 3-hydroxybutyrate:
3-hydroxybutyrate (3OHB) is the most abundant and prominent ketone body found in
humans. Ketone bodies, which can be used as an energy source in most body tissues, are
mainly formed in liver cells from LCFAs derived from TG stored in adipose tissue. Although
the body continuously forms ketone bodies as energy fuels (22 ATP/ketone body), their
concentration in blood is normally low under fed conditions but levels rise significantly in
times of fasting or during prolonged exercise when carbohydrate stores are significantly
decreased or depleted. Several factors regulate ketogenesis and they mainly revolve around
the presence of hormones such as glucagon, cortisol, thyroid hormones, and catecholamines
that promote lipolysis which provide free fatty acids available for ketogenesis. However, the
primary hormone that regulates ketogenesis is insulin, which inhibits fatty acid release and
ketone body formation (McGarry and Foster, 1976, Dhillon and Gupta, 2020, Møller, 2020).
Insulin concentrations, however, were not significantly different (Insulin:). In that case, it
appears that with propionate supplementation, ketogenesis, which is typically active during
fasting, was suppressed and 3-hydroxybutyrate levels were decreased since an alternative
energy source was available in the form of propionate. Propionate oxidation can indeed yield
a maximum of 18 ATP/mol which is equivalent to 131.4 kcal/mol (Baldwin, 1995). And
assuming all the propionate provided (71 mmol) was oxidised, a maximal energy yield of 9.3
kcal would be released.

264
6.10.2 Lysine:
In the fasting state, lysine concentrations were decreased with propionate supplementation.
Lysine is an essential amino acid and is one of two pure ketogenic amino acids along with
leucine (Litwack, 2018). After an overnight fast, hepatic glycogenolysis, gluconeogenesis and
ketogenesis provide half of the energy yielding fuels for the body and with prolonged fasting
ketogenesis from amino acids is typically increased (Lennarz and Lane, 2013) . Thus, when
introducing propionate as an energy source, providing 9.3 kcal if completely oxidized,
ketogenesis would be decreased and hence a decrease in serum ketogenic substrates, in this
case lysine, would be observed.
6.10.3 Methanol:
Methanol concentrations were upregulated with propionate supplementation. No study up
to knowledge has examined the association between propionate supplementation and
methanol concentrations. Therefore, the exact mechanism of how propionate can increase
fasting methanol concentrations in serum is yet to be determined. Nevertheless, dietary
sources rich in fibre such as fruits and vegetables are two main sources of exogenous
methanol in humans (Dorokhov et al., 2015). Particularly, ingestion of the fermentable fibre
pectin that is shown to increase propionate production (Tian et al., 2016), can increase
methanol concentrations in humans mainly via pectin demethylation by pectin
methylesterase (PME) (Dorokhov et al., 2012). However, this cannot explain the raised
methanol concentrations observed in this study since dietary intake was similar between
control and propionate trials and the primary difference in trials was propionate
adminstration. Anaerobic fermentation by human gut microbiota has however previously
shown to be a direct source of endogenous methanol production (Jensen and Canale-Parola,
1985, Siragusa et al., 1988) where gut microbiome knock out mice display significantly
decreased circulating methanol concentrations (Komarova et al., 2014) although the specific
bacterial strain responsible for methanol generation is yet to be identified. No study up to
current knowledge has examined the direct effect of increased propionate bioavailability on
methanol production. However, it may be that propionate can alter gut microbial activity to
promote methanol formation given that methanol was only increased in the fasting state

265
where propionate was the only substrate available for microbial metabolism. Elucidate any
potential mechanism that propionate has on gut microbial activity related to methanol
production would be a very interesting area for future research.
As methanol is a toxic compound and unfit for human consumption, no human intervention
study up to current knowledge has examined the effect of methanol supplementation on
metabolic profile. However, methanol poisoning was found to increase lactate concentrations
(BENNETT Jr et al., 1953) and lipid peroxidation (Skrzydlewska, 2003) which may or may not
induce hyperglycaemia (BENNETT Jr et al., 1953).
Therefore, in the present trial, increased methanol concentrations may be an artefact of
propionate’s effect on gut microbial activity , however, circulating levels are unlikely to have
increased substantially to induce or explain the phenotypic changes observed in this study
especially since after the introduction of dietary substrates, serum methanol concentrations
were no longer changed . Nevertheless, follow up targeted analysis that quantify methanol
concentrations can clarify that further.
6.10.4 Lactate:
6.10.4.1.1 Fasting state:
Lactate is a gluconeogenic substrate that is mainly formed in a reversible reaction from
pyruvate via a fermentation process by lactate dehydrogenase during anaerobic metabolism,
and similarly under resting aerobic conditions although in lesser amounts (~25-50% of total
carbohydrate oxidized may pass through the lactate pool). In the post-absorptive state, stable
isotope studies in healthy humans indicate that ~67% of plasma lactate levels is derived from
glucose (Chochinov et al., 1978) versus 28% from alanine (Kalhan et al., 1988). Lactate and
glucose metabolism are highly interrelated as both compounds are transformed to each other
via the Cori Cycle where glucose is key source of lactate while lactate is a gluconeogenic
substrate able to synthesise glucose (Brooks, 1986, van Hall, 2010, Adeva-Andany et al.,
2014).. Nevertheless, although increasing a gluconeogenic substrate can stimulate
gluconeogenesis, increased lactate concentrations are not linked with increased glucose
production. Tappy et al. explained that this may be since lactate can regulate hepatic glucose

266
production (Tappy et al., 1995). After an overnight fast, 5 healthy volunteers were infused
with a primed continuous glucose infusion over 360 min and subsequently with sodium
lactate after 3 hours. Endogenous glucose production was completely inhibited with glucose
infusion at timepoint 180 min and remained so for the remainder of the trial. Net
carbohydrate oxidation was significantly reduced by 42% with lactate and glucose infusions
in comparison to glucose alone and there was also a non-significant decrease in net lipid
oxidation with no effect on plasma glucose concentrations which indicates that lactate is
unable to stimulate endogenous glucose production but a portion of lactate can be converted
into glucose. The lack of effect of lactate on glucose levels despite increased gluconeogenesis
from lactate, also demonstrates that glucose produced from lactate is equivalent to glycogen
synthesis in the liver thereby highlighting the regulatory effect of lactate on hepatic glucose
production. Similarly, Jenssen et al. demonstrated in healthy human volunteers infused with
sodium lactate that lactate infusion can result in increased gluconeogenesis as evidenced by
a 50% increase in the incorporation of lactate into plasma glucose that was not associated
with an overall increase in glucose concentrations (Jenssen et al., 1990).These changes were
seen despite controlling of plasma hormones such as insulin and glucagon. Also, since lactate
disappearance from plasma was not fully recovered from lactate oxidation in plasma and
conversion into plasma glucose, the authors suggested that lactate could have contributed to
net glycogen synthesis which signifies an overall hepatic autoregulation of gluconeogenesis.
More recently, Lun et al. examined lactate metabolism in vitro to shed light on the underlying
cellular processes of lactate metabolism (Lund et al., 2018). The authors demonstrated that
acute exposure (4 hours) of human myotubes to varying concentrations of lactate can
significantly decrease glucose and oleic acid oxidation. Glucose oxidation was only
significantly decreased at 10 mM lactate whereas oleic acid oxidation was significantly
reduced with differing concentrations (2 mM, 4 mM, 6 mM and 10 mM) of lactate. However,
by replacing glucose with lactate (5mM) during the entire culturing period of the myotubes
significantly increased glucose and oleic acid oxidation by 3- and 1.4-fold respectively. The
underlying mechanism appeared to be related to increased expression of carnitine palmitoyl
transferase 1B (CPT1B) and cytochrome c1 (CYC1) which are involved in the transport of fatty
acids across the mitochondrial membrane and mitochondrial function, respectively as well as
increased protein expression of complex V (ATP synthase subunit α) of the mitochondrial
respiratory chain in lactate-cultured cells. The authors suggested that these finding illustrate

267
that prolonged exposure of cells to lactate can drive cells towards an energy deprivation state
thereby enhancing the oxidative capacity of the cells. These findings also suggest that lactate
can impact the metabolism of glucose and fatty acids and this effect is dependent on the
duration of lactate exposure.
In this trial, it appears that the lack of effect of propionate supplementation on acute glucose
levels may be related to the increased serum lactate concentrations. In the fasting state, when
energy state is low, gluconeogenesis is typically active (Berg et al., 2002), and since propionate
has been shown to act as a gluconeogenic substrate in humans (Boets et al., 2017), it may
have substituted lactate during hepatic gluconeogenesis, which can hence explain the
increase in lactate concentrations observed with propionate supplementation. Indeed,
gluconeogenic substrate inhibition in favour of another gluconeogenic precursor has been
proposed before (Jahoor et al., 1990).
6.10.4.1.2 Post-prandial state:
Increased lactate concentrations were also observed post-prandially, and a likely explanation
is that propionate may have spared lactate from acting as a gluconeogenic substrate since
~6% of gut derived propionate is shown to contribute to endogenous glucose production
post-prandially (Boets et al., 2017). The increased energy expenditure observed post-
prandially may also be related to increased serum lactate concentrations. Ferrannini et al.
demonstrated that a small increase in blood lactate concentrations, similar to that observed
under physiological or pathological circumstances other than physical activity (2.9-2.4 mM),
can increase thermogenic capacity. 4 healthy subjects were infused with sodium lactate at a
rate of 25 µmol/min/kg for 3 hours after an overnight fast. Oxygen consumption and energy
expenditure significantly rose by 10% above baseline. In another experiment involving 8
healthy volunteers, similar lactate infusion rates and an insulin clamp resulted in a significant
increase in oxygen consumption in comparison to when volunteers were infused with a saline
control. Diet-induced thermogenesis also rose significantly by 16% and 10% above baseline
and saline control respectively. The authors suggest that the substantial rise in energy
expenditure observed with lactate supplementation may be an artefact of energy requiring
synthetic processes such as glycogen synthesis and de novo lipogenesis that are observed
with increased lactate levels (Ferrannini et al., 1993). Similarly, Tappy et al. showed in 5

268
healthy volunteers infused with a primed continuous glucose infusion over 360 min and
subsequently with sodium lactate after 3 hours, significantly increased energy expenditure by
18.3% which is comparable with the speculative cost (18%) of lactate conversion into glucose
(Tappy et al., 1995). Also, Chioléro et al demonstrated in six healthy volunteers that infusion
of lactate at a rate of 20µmol/kg/min for 3 hours significantly increased energy expenditure
by 16.3%. The increase in thermogenesis was attributed to gluconeogenesis since the thermic
effect observed with lactate surpassed the hypothesised cost of oxidizing it (Chioléro et al.,
1993). Therefore, the observed increase in energy expenditure post-prandially in this trial
may be attributed to the increase in serum lactate concentrations.
What is quite striking is that all those three studies demonstrate that increased lactate
concentrations are associated with a decrease in lipid oxidation ((Tappy et al., 1995)(Tappy et
al., 1995)(Tappy et al., 1995)(Tappy et al., 1995)(Tappy et al., 1995)(Tappy et al., 1995)(Tappy
et al., 1995)(Tappy et al., 1995)(Tappy et al., 1995)(Tappy et al., 1995)(Tappy et al.,
1995)(Tappy et al., 1995)(Tappy et al., 1995)(Tappy et al., 1995)(Tappy et al., 1995)(Tappy et
al., 1995)~15%, p>0.05 (Ferrannini et al., 1993); 27% p>0.05 (Tappy et al., 1995) ; 13% p<0.05
(Chioléro et al., 1993)) respectively. The primary difference between the present study and
those three trials is propionate supplementation. Thus, it may be proposed then, that
propionate that was associated with increased lipid oxidation in this study, was able to
counteract the decrease in lipid oxidation that is often associated with increased lactate
concentrations.
6.10.5 Alanine:
Alanine is one of the major amino acids in proteins and is primarily produced by skeletal
muscles. In muscle cells, alanine is generated from pyruvate and an amino acid via glutamate-
pyruvate transaminase. Alanine can then be transported in the bloodstream to the liver and
used as a glucose precursor (Litwack, 2018).
Increased alanine concentrations may arise from propionate supplementation. Alanine is a
gluconeogenic amino acid (Litwack, 2018), and therefore it is plausible that propionate may
have spared alanine from contributing to glucose production and elevated alanine
concentrations since ~6% of gut derived propionate is shown to contribute to endogenous

269
glucose production post-prandially (Boets et al., 2017). Indeed, competition between
gluconeogenic substrates has been proposed before. 15 healthy volunteers, following a 14
hour fast, were infused with glycerol (10%) and alanine (7%) solutions. Glucose production
rate, however, was not increased despite the presence of two prominent gluconeogenic
substrates. This suggests that one gluconeogenic substrate was inhibited in favour of the
other. Indeed, urea production rate was decreased, which imply that glycerol was primarily
used for gluconeogenesis (Jahoor et al., 1990). In line with that, stable isotope studies have
proposed that propionate enters the TCA cycle at the level of succinyl CoA (Jones et al., 1997,
Perry et al., 2016) and therefore unlike alanine, bypasses the rate limiting step of pyruvate
conversion into phosphoenolpyruvate before conversion into glucose. Thus, propionate
supplementation in the present trial may have been favoured over alanine with regards to
gluconeogenesis. This would actually be quite important since this suggests that amino acids
would hypothetically be spared and used for vital body processes such as tissue preservation
and immune function. Indeed, animal studies have shown that intervention studies that
increase systemic levels of propionate can increase the concentration of amino acid
metabolites that signify decreased gluconeogenesis originating from amino acids. For
instance, in a cross-over design, 3 normal weight and 3 obese cats were randomly
administered a colonic infusion of either a propionate solution (5.7 mmol/kg; 4 mmol/kg Ideal
body weight respectively) or a control saline solution (0.9% NaCl; 310 mOsmol/l) over 30 min.
30 and 60 min after the propionate infusion ensued a significantly lower plasma 3-hydroxy-3-
methylglutarylcarnitine, a specific metabolite of branched-chain amino acid catabolism that
hence portrays suppressed gluconeogenesis from amino acids (Verbrugghe et al., 2012). Also,
in a crossover study, involving 8 healthy dogs on a low protein diet supplemented with either
sugar beet pulp and guar gum mix (known to stimulate propionate production), or cellulose
for four weeks, resulted in an increase in amino acids (leucine, isoleucine, phenylalanine and
tyrosine) concentrations post-prandially which also indicate amino acid preservation for
other use in the body (Wambacq et al., 2016).
Nevertheless, increased alanine concentrations although has been shown to markedly
increase post-prandial gluconeogenesis, this was not shown to have any effect on glucose
levels in healthy individuals due to a counterbalance in insulin stimulated glucose rate of
disappearance (Krebs et al., 2003).

270
Furthermore, the increased alanine concentrations observed post-prandially may be related
to the increased lactate concentrations also detected during that time-frame where it was
shown in 4 healthy adults that lactate infusions at a rate of 25 µmol/min/kg for 3 hours, can
result in a 37% rise in blood alanine concentrations (Ferrannini et al., 1993) although this
effect does not seem reversible since increased alanine concentrations are associated with
decreased lactate levels (Jahoor et al., 1990).
6.10.6 VLDL/LDL:
The present analysis was unable to differentiate between the different subclasses of
lipoproteins. A very broad class of metabolite exists under the detected VLDL/LDL peaks such
as subfractions of VLDL/LDL falling under cholesterol, free cholesterol, phospholipids, TG and
ApoB. Therefore, a wide gap exists for future research in order to determine which subclass
of LDL/VLDL could be influenced with propionate adminstration.
Given that, comparing the current findings with the literature which often referes to LDL/VLDL
cholesterol such as that obtained after a blood test, is limiting. However, the following section
highlights the possible mechanisms of how propionate can increase VLDL/LDL concnetrations
in different energy states.
6.10.6.1.1 Fasting state/Post-prandial States:
Increased serum VLDL/LDL concentrations with propionate supplementation during fasting
and post-prandial states is somewhat unexpected. Numerous research have highlighted that
propionate has hypercholesteraemic effects and can inhibit free fatty acid (FFA) synthesis
(Chen et al., 1984, Demigné et al., 1995, Berggren et al., 1996).On the other hand, lipid and
glucose metabolism are highly interrelated and a disturbance in one may lead to a disorder
in the other (Krauss, 2004, Parhofer, 2015).Increased lactate concentrations is shown to be
associated with type 2 diabetes and glucose disturbance (Crawford et al., 2010) which hence
may effect lipid homeostasis. Indeed, one study in humans demonstrated that increased
lactate concentrations is associated with disturbances in lipid profile. Sondermeijer et al.
undertook a cross-over study involving eight normolipidemic healthy men and examined the
effect of a 7-hour lactate clamp versus a saline control infusion on VLDL-TG homeostasis

271
(Sondermeijer et al., 2013). The lactate infusion which generated a 5-fold increase in plasma
lactate levels, resulted in a significant increase in hepatic VLDL-TG secretion which may be
related to an increased stearoyl-CoA desaturase (SCD1) activity, a key mediator in hepatic
VLDL-TG excretion, as evidenced by a higher hepatic desaturation index i.e. the ratio of
plasma of palmitoleic acid (16:1) and palmitic acid (16:0) which reflects SCD1 activity. The
authors suggest that excess lactate may be converted into pyruvate and as a substrate of the
TCA cycle can lead to increased citrate synthesis which ultimately promotes FFA and TG
synthesis. Thus, an increase in VLDL/LDL concentrations post-prandially, may be related to
increased lactate concentrations. However, since only one study (Sondermeijer et al., 2013)
which involved a small number of volunteers and has infused a substantial amount of lactate
has highlighted this association, extrapolating these findings to the present outcomes must
be employed cautiously. Another plausible explanation is that other metabolites that could
have been increased with propionate supplementation but missed during NMR analysis may
have disrupted lipid profile and increased LDL/VLDL concentrations in fasting and post-
prandial states. However, future research can investigate that further using more sensitive
and comprehensive metabolomic techniques such as MS.
6.11 Study Limitations:
This study has several limitations. For instance, metabolomic analysis was only performed on
the post-prandial trial albeit the fasting and exercise trials. This was mainly due to time-
constraints and expense. However, the post-prandial trial was chosen since it encompasses
the three main outcomes in the study i.e. the consistent increase in lipid oxidation in the
overnight fasted state, the unaltered glucose profile and post-prandial increase in energy
expenditure. Also, the technique used ,1D 1H NMR, as do all techniques has its drawbacks.
For instance, NMR, although more reproducible and faster to perform than MS, is also less
sensitive and can detect far fewer metabolites than MS (Emwas et al., 2019). However, since
NMR is non-destructive, this method was chosen to allow for multiple sample analysis for
purpose of this research. Also due to time constraints, only an untargeted analysis was
employed. A follow up targeted analysis would have been quite useful in quantifying the
metabolites and comparing their concentrations with established references and other
research trials. Amino acid concentrations could have also been determined using HPLC

272
technique. However, an untargeted analysis was ideal to be performed first since this
technique is inherently intended for ‘discovery’ and span of the whole metabolome rather
than restriction to a prior identified set of metabolites which would have been difficult to
determine given the paucity of research in that area. Another limitation is that the only
biological specimen available for analysis was serum. Urine samples, unfortunately, were only
analysed to determine urea concentration as an estimate of protein oxidation rates. Ideally,
metabolomic analysis on urine samples should have been done as well. Indeed, analysis of
both specimens can provide complementary information on metabolism where serum
metabolites reflect homeostatic regulatory concentrations versus urine metabolites which
highlight excretion after degradation processes (Playdon et al., 2016).
6.12 Conclusion:
This was the first in human trial that employed metabolomic techniques to examine the acute
effect of oral sodium propionate supplementation on serum metabolome. Given the present
findings, it appears that propionate can affect serum phenotype in both the overnight fasted
and post-prandial states. The increased methanol concentrations observed in the fasting
period may highlight altered gut microbial activity with propionate supplementation that
support increases in methanol production that could be an area for future research.
Moreover, future research should focus on differentiating the different subclasses of
lipoprotein subfractions that can be influenced with increased propionate bioavailability.
Perturbations in lactate and alanine metabolites appear to be the most closely related to the
observed effects on energy expenditure and glucose profile. It may be assumed that
propionate, as a gluconeogenic substrate, spared lactate and alanine from gluconeogenesis
for other bodily functions. None of the detected metabolites however, according to previous
research, seem to have an obvious association with the increases in lipid oxidation that was
prevalent in the overnight fasted states. Further research using more sensitive techniques
such as MS that can detect lower abundance molecules or a combination of both MS and
NMR techniques that provide a comprehensive analysis of the metabolome could be very
useful in providing a mechanistic insight of how propionate may affect serum metabolites to
support changes in energy expenditure, substrate oxidation and glucose homeostasis.
Moreover, a key area for future research is to employ an energy matched control in studies

273
in order to characterize whether metabolite changes are influenced by the calories provided
or in fact due to the propionate itself.

274
Chapter 7: General Discussion
7.1 Thesis aims:
The overall aim of this thesis was to investigate the impact of oral sodium propionate
supplementation on energy metabolism in humans. Three separate studies were therefore
conducted to investigate the impact of oral sodium propionate on energy expenditure,
substrate oxidation, appetite response, glucose homeostasis and serum metabolic phenotype
in different energy stats (overnight fasted, sub-maximal exercise and postprandial).
Chapter 3: Investigated the impact of oral sodium propionate supplementation on energy expenditure and substrate oxidation:
• Overnight fasted state: Propionate increased EE (energy expenditure) and lipid
oxidation and decreased CHO oxidation over a period of 360 min. Changes in EE and
lipid oxidation are mainly seen within the first 180 min following propionate ingestion.
HR was stimulated within the first 180 min of propionate ingestion. MAP also
increased with propionate supplementation after a prolonged fast.
• Sub-maximal exercise state: Propionate had no effect on EE and substrate oxidation
during sub-maximal exercise.
• Post-prandial state: Propionate increased EE in the post-prandial state with no
preferential use of a substrate.
Chapter 4 Evaluated the impact of oral sodium propionate supplementation on subjective appetite and nausea. The impact of oral sodium propionate on GLP-1 levels was also investigated:
• Overnight fasted state: Acute propionate ingestion stimulated subjective nausea over
a prolonged fasted period of 360 min. However, it had no effect on subjective hunger
and thirst.

275
• Sub-maximal exercise state: Acute propionate supplementation stimulated
subjective thirst during exercise. No differences in appetite or nausea were observed.
• Post-prandial state: Acute propionate ingestion stimulated subjective nausea but has
no effect on GLP-1 secretion and subjective hunger
Chapter 5 Investigated the impact of propionate supplementation on glucose homeostasis:
• Overnight fasted state: Acute propionate ingestion attenuated the decrease in
glucose concentrations over a prolonged fasted period of 360 min. However, insulin
resistance, assessed by HOMA-IR, was unaffected.
• Sub-maximal exercise state: Propionate has no effect on glucose homeostasis during
sub-maximal exercise.
• Post-prandial state: Propionate ingestion attenuated the decrease in GLP-1
concentrations over the initial 180 min fasted period. This was not associated with
differences in insulin-resistance Propionate had no effect on β-cell function or
peripheral insulin resistance in the post-prandial state.
Chapter 6 Evaluated the impact of propionate Supplementation on serum metabolic phenotype in the overnight fasted and postprandial state:
• Overnight fasted state: LDL/VLDL, lactate and methanol were upregulated whereas
3-hydroxybutyrate and lysine were decreased with propionate supplementation.
• Post-prandial state: LDL/VLDL, lactate and alanine were increased with propionate
supplementation.
7.2 Summary of results:
These three studies observed that acute ingestion of oral sodium propionate (71 mmol) in
healthy human volunteers in different energy states (overnight fasted, sub-maximal exercise

276
and post-prandial) had varying effects on energy expenditure, substrate oxidation, appetite
response, glucose homeostasis and serum metabolic phenotype.
An increase in energy expenditure was found in the overnight fasted state that was mainly
observed within the first 180 min of ingestion and in the post-prandial state. In the overnight
fasted state, heart rate (HR) and mean arterial pressure (MAP) were also stimulated. A
consistent increase in lipid oxidation was found in the overnight fasted state, however, these
effects were not observed during submaximal exercise nor in the post-prandial state. A
decrease in carbohydrate (CHO) oxidation was also found in the overnight, fasted state. With
regards to subjective measures of appetite, propionate ingestion increased subjective thirst
during sub-maximal exercise and subjective nausea in the overnight fasted and post-prandial
states. However, no effect on subjective hunger was found was found in different energy
states. GLP-1 (glucagon-like peptide 1) secretion was significantly increased in the overnight
fasted state, however, insulin sensitivity and β-cell function were unaffected with propionate
ingestion. After an overnight fasted state, LDL (low density lipoprotein)/VLDL (very low-
density lipoprotein), lactate and methanol were upregulated whereas 3-hydroxybutyrate and
lysine were decreased. This coincided with an increase in lipid oxidation and unchanged
glucose profile. Post-prandially, when energy expenditure was increased, LDL/VLDL, lactate
and alanine were upregulated.
7.3 Conclusion, Limitations and Future Work:
In the overnight fasted state, acute ingestion of oral sodium propionate (71 mmol) in healthy
human volunteers increased energy expenditure and lipid oxidation and decreased CHO
oxidation, which seems to be mediated via SNS activity stimulation. It also increased energy
expenditure post-prandially with no preferred use of a substrate. However, acute oral sodium
propionate ingestion had no effect on energy expenditure and substrate oxidation during sub-
maximal exercise. These findings support my hypothesis in the rested, fasted state and post-
prandially but not sub-maximal exercise. As discussed in Chapter 3:, there are multiple factors
that may have contributed to the discrepancy in findings. Nevertheless, this study is the first
in human study to provide direct evidence that acute oral ingestion of sodium propionate can
modulate energy expenditure and substrate metabolism in different energy states and, given

277
these findings, future follow up studies could use a 24-h respiratory chamber and continuous
measurement of SNS activity to assess the full effect of oral sodium propionate
supplementation on energy expenditure and substrate oxidation. Moreover, more reliable
methodologies such as continuous heart rate variability or microneurography (Zygmunt and
Stanczyk, 2010, Seravalle et al., 2013) can also be used to better determine the effects of gut
absorbed propionate on SNS activity.
Acute ingestion of oral sodium propionate in healthy human volunteers influenced subjective
markers of appetite, mainly by increasing subjective feelings of nausea during fasted and
post-prandial states and increasing subjective thirst during exercise. Moreover, it can also
stimulate biological satiety markers such as GLP-1 concentrations in the overnight fasted
state. Of note, several human studies (Frost et al., 2003, Chambers et al., 2018) including this
trial have demonstrated an increase in subjective nausea with propionate supplementation.
Thus, future research aimed at developing therapeutic strategies to increase gut-derived
propionate bioavailability to target appetite would need to consider this limitation.
Noteworthy too, an increase in subjective feelings of nausea with propionate
supplementation may be an indicator that propionate can influence satiation rather than
satiety. Future studies can hence assess this by employing VAS continually during an ad
libitum test meal and observe if propionate promotes an early termination of meals due to
the raised feelings of nausea.
Furthermore, future intervention studies using a combination of subjective and objective
markers of appetite are clearly needed to give a better overview of the effect of sodium
propionate on appetite regulation. It would be interesting to assess the impact of sodium
propionate delivery on appetite in different areas in the gastrointestinal tract. One way of
achieving this is by using tablets similar to the ones used in the present trial, which can
disintegrate at varying pH along the tract. For instance, the current tablets are most likely to
disintegrate in the proximal intestine where pH is 6.6 (Evans et al., 1988) since these tablets
were previously shown to completely dissociate at pH 6.8 (Chapter 2 Section: Supplements)
whereas other tablets could be designed that disintegrate at pH 7.5 and 6.4 that would ideally
deliver propionate to the terminal ileum and cecum respectively.

278
Also, very importantly, future studies should quantify both energy intake and energy
expenditure in order to best determine the acute effect of oral sodium propionate
supplementation on overall energy balance.
This trial also indicates that acute ingestion of oral sodium propionate in healthy human
volunteers can prevent the decline in GLP-1 levels observed with prolonged fasting but has
no effect on insulin resistance and β-cell function. Also, the impact of sodium propionate
ingestion on glucose levels in the fasted state (0-180 min) was only observed in one of the
three studies and thus would demonstrate that acute propionate ingestion has minimal effect
on markers of insulin sensitivity and glucose tolerance in healthy humans. It is noteworthy,
however, that the present trial only included normal weight, healthy individuals with normal
glucose tolerance, hence it may be challenging to enhance an already ‘normal’ parameter.
Hence, well-controlled future studies using more robust methodologies are needed to better
investigate the acute effect of gut derived propionate on glucose homeostasis in individuals
with a range of metabolic health and also in all three different energy states.
Finally, this was the first in human trial that employed metabolomic techniques to examine
the acute effect of oral sodium propionate supplementation on serum metabolome profile.
Given the present findings, it appears that propionate can affect serum phenotype in both
the overnight fasted and post-prandial states. The increased methanol concentrations
observed in the overnight fasted period may highlight altered gut microbial activity with
propionate supplementation that support increases in methanol production. This is an area
that warrants future research. Moreover, future research should focus on differentiating the
different subclasses of lipoprotein subfractions that were raised with increased propionate
bioavailability. Perturbations in lactate and alanine appear to be the metabolites most closely
related to the observed effects on glucose profile. It may be assumed that propionate, as a
gluconeogenic substrate, “spared” lactate and alanine from hepatic gluconeogenesis for
other bodily functions. Moreover, increased lactate concentrations seem to be the most
closely related to the observed increase in post-prandial energy expenditure as a potential
link between raised lactate concentrations and increased energy expenditure has been
demonstrated previously (Chioléro et al., 1993, Ferrannini et al., 1993, Tappy et al., 1995).
However, none of the detected metabolites, according to previous research, seem to have an

279
obvious association with the increases in lipid oxidation that was prevalent in the overnight
fasted states. Thus, further research using more sensitive techniques such as MS that can
detect lower abundance molecules or a combination of both MS and NMR techniques that
provide a comprehensive analysis of the metabolome would be useful in providing a
mechanistic insight of how propionate may affect serum metabolites to support changes in
energy expenditure, substrate oxidation and glucose homeostasis.
A key area for future research is to employ an energy matched control. No study up to date
has included an energy-matched control such as palmitate (4 mmol), although this is vital in
order to distinguish whether the metabolic changes associated with propionate
supplementation is due the calories provided or in fact due to the propionate itself.
To conclude, this thesis is the first to demonstrate that acute oral sodium propionate
supplementation in healthy human volunteers can have favourable effects on energy
metabolism in different energy states. Future studies are warranted to determine if these
effects are sustained chronically. Should these effects be replicated over longer time periods
to improve energy balance, this suggest that increasing systemic levels of gut-derived
propionate in humans through dietary interventions such as the use of propiogenic dietary
fibres or targeted gut delivery methods (Frost et al., 2003, Chambers et al., 2018) would be a
promising strategy to improve long term energy balance and body weight management.

280
References:
ABBOTT, C. R., MONTEIRO, M., SMALL, C. J., SAJEDI, A., SMITH, K. L., PARKINSON, J. R., GHATEI, M. A. & BLOOM, S. R. 2005. The inhibitory effects of peripheral administration of peptide YY3–36 and glucagon-like peptide-1 on food intake are attenuated by ablation of the vagal–brainstem–hypothalamic pathway. Brain research, 1044, 127-131.
ABDELHAMID, A. S., BROWN, T. J., BRAINARD, J. S., BISWAS, P., THORPE, G. C., MOORE, H. J., DEANE, K. H., SUMMERBELL, C. D., WORTHINGTON, H. V. & SONG, F. 2020. Omega‐3 fatty acids for the primary and secondary prevention of cardiovascular disease. Cochrane Database of Systematic Reviews.
ACHTEN, J. & JEUKENDRUP, A. E. 2004. Optimizing fat oxidation through exercise and diet. Nutrition, 20, 716-727.
ADAM, C. L., GRATZ, S. W., PEINADO, D. I., THOMSON, L. M., GARDEN, K. E., WILLIAMS, P. A., RICHARDSON, A. J. & ROSS, A. W. 2016. Effects of dietary fibre (pectin) and/or increased protein (casein or pea) on satiety, body weight, adiposity and caecal fermentation in high fat diet-induced obese rats. PloS one, 11, e0155871.
ADAM, C. L., THOMSON, L. M., WILLIAMS, P. A. & ROSS, A. W. 2015a. Soluble fermentable dietary fibre (pectin) decreases caloric intake, adiposity and lipidaemia in high-fat diet-induced obese rats. PLoS One, 10, e0140392.
ADAM, C. L., WILLIAMS, P. A., DALBY, M. J., GARDEN, K., THOMSON, L. M., RICHARDSON, A. J., GRATZ, S. W. & ROSS, A. W. 2014. Different types of soluble fermentable dietary fibre decrease food intake, body weight gain and adiposity in young adult male rats. Nutrition & metabolism, 11, 36.
ADAM, C. L., WILLIAMS, P. A., GARDEN, K. E., THOMSON, L. M. & ROSS, A. W. 2015b. Dose-dependent effects of a soluble dietary fibre (pectin) on food intake, adiposity, gut hypertrophy and gut satiety hormone secretion in rats. PLoS One, 10, e0115438.
ADDITIVES, E. P. O. F. & FOOD, N. S. A. T. 2016. Safety of the extension of use of sodium propionate (E 281) as a food additive. EFSA Journal, 14, e04546.
ADDITIVES, J. F. W. C. A. C. C. G. S. F. F. 2019a. FOOD ADDITIVE DETAILS [Online]. Available: http://www.fao.org/gsfaonline/additives/details.html?id=246 [Accessed 27/10/2020].
ADDITIVES, J. F. W. C. A. C. C. G. S. F. F. 2019b. FOOD ADDITIVE DETAILS [Online]. Available: http://www.fao.org/gsfaonline/additives/details.html?id=375 [Accessed].
ADEVA-ANDANY, M., LÓPEZ-OJÉN, M., FUNCASTA-CALDERÓN, R., AMENEIROS-RODRÍGUEZ, E., DONAPETRY-GARCÍA, C., VILA-ALTESOR, M. & RODRÍGUEZ-SEIJAS, J. 2014. Comprehensive review on lactate metabolism in human health. Mitochondrion, 17, 76-100.
ADRIAENS, M. P., SCHOFFELEN, P. F. & WESTERTERP, K. R. 2003. Intra-individual variation of basal metabolic rate and the influence of daily habitual physical activity before testing. British Journal of Nutrition, 90, 419-423.
AL‐LAHHAM, S. A., ROELOFSEN, H., REZAEE, F., WEENING, D., HOEK, A., VONK, R. & VENEMA, K. 2012. Propionic acid affects immune status and metabolism in adipose tissue from overweight subjects. European journal of clinical investigation, 42, 357-364.

281
ALLEN, M. S. 2000. Effects of diet on short-term regulation of feed intake by lactating dairy cattle. Journal of dairy science, 83, 1598-1624.
AMATHIEU, R., NAHON, P., TRIBA, M., BOUCHEMAL, N., TRINCHET, J.-C., BEAUGRAND, M., DHONNEUR, G. & LE MOYEC, L. 2011. Metabolomic approach by 1H NMR spectroscopy of serum for the assessment of chronic liver failure in patients with cirrhosis. Journal of proteome research, 10, 3239-3245.
ANDERSON, J. W. & BRIDGES, S. R. 1984. Short-chain fatty acid fermentation products of plant fiber affect glucose metabolism of isolated rat hepatocytes. Proceedings of the Society for Experimental Biology and Medicine, 177, 372-376.
ANG, Z. & DING, J. L. 2016. GPR41 and GPR43 in obesity and inflammation–protective or causative? Frontiers in immunology, 7, 28.
ANNUNZIATA, G., ARNONE, A., CIAMPAGLIA, R., TENORE, G. C. & NOVELLINO, E. 2020. Fermentation of Foods and Beverages as a Tool for Increasing Availability of Bioactive Compounds. Focus on Short-Chain Fatty Acids. Foods, 9, 999.
ARORA, T., LOO, R. L., ANASTASOVSKA, J., GIBSON, G. R., TUOHY, K. M., SHARMA, R. K., SWANN, J. R., DEAVILLE, E. R., SLEETH, M. L. & THOMAS, E. L. 2012. Differential effects of two fermentable carbohydrates on central appetite regulation and body composition. PLoS one, 7, e43263.
ARORA, T., SHARMA, R. & FROST, G. 2011. Propionate. Anti-obesity and satiety enhancing factor? Appetite, 56, 511-515.
ARTS, F. & KUIPERS, H. 1994. The relation between power output, oxygen uptake and heart rate in male athletes. International journal of sports medicine, 15, 228-231.
ARVANITI, K., RICHARD, D. & TREMBLAY, A. 2000. Reproducibility of energy and macronutrient intake and related substrate oxidation rates in a buffet-type meal. British journal of nutrition, 83, 489-495.
ASSOCIATION, A. D. 2014. Diagnosis and classification of diabetes mellitus. Diabetes care, 37, S81-S90.
ASTARITA, G. & LANGRIDGE, J. 2013. An emerging role for metabolomics in nutrition science. Lifestyle Genomics, 6, 181-200.
BAKER, C. 2019. Obesity Statistics. BALDWIN, R. L. 1995. Modeling ruminant digestion and metabolism, Springer Science &
Business Media. BANASIEWICZ, T., DOMAGALSKA, D., BORYCKA-KICIAK, K. & RYDZEWSKA, G.
2020. Determination of butyric acid dosage based on clinical and experimental studies–a literature review. Przeglad gastroenterologiczny, 15, 119.
BANG, S.-J., KIM, G., LIM, M. Y., SONG, E.-J., JUNG, D.-H., KUM, J.-S., NAM, Y.-D., PARK, C.-S. & SEO, D.-H. 2018. The influence of in vitro pectin fermentation on the human fecal microbiome. Amb Express, 8, 1-9.
BARKELING, B., RÖSSNER, S. & SJÖBERG, A. 1995. Methodological studies on single meal food intake characteristics in normal weight and obese men and women. International Journal of Obesity, 19, 284-284.
BARTON, R. H., NICHOLSON, J. K., ELLIOTT, P. & HOLMES, E. 2008. High-throughput 1H NMR-based metabolic analysis of human serum and urine for large-scale epidemiological studies: validation study. International journal of epidemiology, 37, i31-i40.
BEDFORD, A. & GONG, J. 2018. Implications of butyrate and its derivatives for gut health and animal production. Animal Nutrition, 4, 151-159.
BENNETT JR, I. L., CARY, F. H., MITCHELL JR, G. L. & COOPER, M. N. 1953. Acute methyl alcohol poisoning: a review based on experiences in an outbreak of 323 cases. Medicine, 32, 431-463.

282
BERG, J., TYMOCZKO, J. & STRYER, L. 2002. Gluconeogenesis and glycolysis are reciprocally regulated. Biochemistry.
BERGGREN, A. M., NYMAN, E. M. G., LUNDQUIST, I. & BJÖRCK, I. M. 1996. Influence of orally and rectally administered propionate on cholesterol and glucose metabolism in obese rats. British Journal of Nutrition, 76, 287-294.
BERGMAN, E. 1990. Energy contributions of volatile fatty acids from the gastrointestinal tract in various species. Physiological reviews, 70, 567-590.
BESCH, W., WOLTANSKI, K.-P., KEILACKER, H., DIAZ-ALONSO, J., SCHULZ, B., AMENDT, P., KOHNERT, K.-D. & ZIEGLER, M. 1987. Measurement of Insulin in Human Sera Using a New RIA Kit. 1. Insulin Determination in the Absence of Insulin Antibodies—Conventional Assay and Micro Modification2. Experimental and Clinical Endocrinology & Diabetes, 90, 264-270.
BEUKEMA, M., FAAS, M. M. & DE VOS, P. 2020. The effects of different dietary fiber pectin structures on the gastrointestinal immune barrier: impact via gut microbiota and direct effects on immune cells. Experimental & Molecular Medicine, 1-13.
BHINDERWALA, F., WASE, N., DIRUSSO, C. & POWERS, R. 2018. Combining mass spectrometry and NMR improves metabolite detection and annotation. Journal of proteome research, 17, 4017-4022.
BINGOL, K., BRUSCHWEILER-LI, L., LI, D.-W. & BRÜSCHWEILER, R. 2014. Customized metabolomics database for the analysis of NMR 1H–1H TOCSY and 13C–1H HSQC-TOCSY spectra of complex mixtures. Analytical chemistry, 86, 5494-5501.
BINGOL, K., LI, D.-W., BRUSCHWEILER-LI, L., CABRERA, O. A., MEGRAW, T., ZHANG, F. & BRÜSCHWEILER, R. 2015. Unified and isomer-specific NMR metabolomics database for the accurate analysis of 13C–1H HSQC spectra. ACS chemical biology, 10, 452-459.
BJERRUM, J. T. & BJERRUM 2015. Metabonomics, Springer. BJURSELL, M., ADMYRE, T., GÖRANSSON, M., MARLEY, A. E., SMITH, D. M.,
OSCARSSON, J. & BOHLOOLY-Y, M. 2011. Improved glucose control and reduced body fat mass in free fatty acid receptor 2-deficient mice fed a high-fat diet. American Journal of Physiology-Endocrinology and Metabolism, 300, E211-E220.
BLAAK, E. E. 2016. Carbohydrate quantity and quality and cardio-metabolic risk. Current opinion in clinical nutrition and metabolic care, 19, 289-293.
BLAIR, J. B., COOK, D. E. & LARDY, H. A. 1973. Interaction of propionate and lactate in the perfused rat liver effects of glucagon and oleate. Journal of biological chemistry, 248, 3608-3614.
BLOEMEN, J. G., VENEMA, K., VAN DE POLL, M. C., DAMINK, S. W. O., BUURMAN, W. A. & DEJONG, C. H. 2009. Short chain fatty acids exchange across the gut and liver in humans measured at surgery. Clinical nutrition, 28, 657-661.
BLÜHER, M. 2019. Obesity: global epidemiology and pathogenesis. Nature Reviews Endocrinology, 15, 288-298.
BLUNDELL, J., DE GRAAF, C., HULSHOF, T., JEBB, S., LIVINGSTONE, B., LLUCH, A., MELA, D., SALAH, S., SCHURING, E. & VAN DER KNAAP, H. 2010. Appetite control: methodological aspects of the evaluation of foods. Obesity reviews, 11, 251-270.
BOETS, E., GOMAND, S. V., DEROOVER, L., PRESTON, T., VERMEULEN, K., DE PRETER, V., HAMER, H. M., VAN DEN MOOTER, G., DE VUYST, L. & COURTIN, C. M. 2017. Systemic availability and metabolism of colonic‐derived short‐chain fatty acids in healthy subjects: a stable isotope study. The Journal of physiology, 595, 541-555.

283
BOILLOT, J., ALAMOWITCH, C., BERGER, A.-M., LUO, J., BRUZZO, F., BORNET, F. R. & SLAMA, G. 1995. Effects of dietary propionate on hepatic glucose production, whole-body glucose utilization, carbohydrate and lipid metabolism in normal rats. British Journal of Nutrition, 73, 241-251.
BONERA, E. 2000. Homeostasis model assessment closely mirrors the glucose clamp technique in the assessment of insulin sensitivity. Diabetes Care, 23, 57-63.
BORAI, A., LIVINGSTONE, C. & FERNS, G. A. 2007. The biochemical assessment of insulin resistance. Annals of clinical biochemistry, 44, 324-342.
BOZZETTO, L., COSTABILE, G., DELLA PEPA, G., CICIOLA, P., VETRANI, C., VITALE, M., RIVELLESE, A. A. & ANNUZZI, G. 2018. Dietary fibre as a unifying remedy for the whole spectrum of obesity-associated cardiovascular risk. Nutrients, 10, 943.
BRAY, J. K., CHIU, G. S., MCNEIL, L. K., MOON, M. L., WALL, R., TOWERS, A. E. & FREUND, G. G. 2018. Switching from a high-fat cellulose diet to a high-fat pectin diet reverses certain obesity-related morbidities. Nutrition & metabolism, 15, 55.
BROOKS, G. Lactate production under fully aerobic conditions: the lactate shuttle during rest and exercise. Federation proceedings, 1986. 2924.
BUTEAU, J. 2008. GLP-1 receptor signaling: effects on pancreatic β-cell proliferation and survival. Diabetes & metabolism, 34, S73-S77.
BYRNE, C., CHAMBERS, E., MORRISON, D. & FROST, G. 2015. The role of short chain fatty acids in appetite regulation and energy homeostasis. International journal of obesity, 39, 1331.
BYRNE, C. S., CHAMBERS, E. S., ALHABEEB, H., CHHINA, N., MORRISON, D. J., PRESTON, T., TEDFORD, C., FITZPATRICK, J., IRANI, C. & BUSZA, A. 2016. Increased colonic propionate reduces anticipatory reward responses in the human striatum to high-energy foods. The American journal of clinical nutrition, 104, 5-14.
CABALLERO, B. 2007. The global epidemic of obesity: an overview. Epidemiologic reviews, 29, 1-5.
CABALLERO, B., TRUGO, L. C. & FINGLAS, P. M. 2003. Encyclopedia of food sciences and nutrition, Academic.
CAMERON-SMITH, D., COLLIER, G. & O'DEA, K. 1994. Effect of propionate on in vivo carbohydrate metabolism in streptozocin-induced diabetic rats. Metabolism, 43, 728-734.
CANFORA, E. E., JOCKEN, J. W. & BLAAK, E. E. 2015. Short-chain fatty acids in control of body weight and insulin sensitivity. Nature Reviews Endocrinology, 11, 577.
CANFORA, E. E., VAN DER BEEK, C. M., JOCKEN, J. W., GOOSSENS, G. H., HOLST, J. J., DAMINK, S. W. O., LENAERTS, K., DEJONG, C. H. & BLAAK, E. E. 2017. Colonic infusions of short-chain fatty acid mixtures promote energy metabolism in overweight/obese men: a randomized crossover trial. Scientific Reports, 7, 2360.
CANI, P. D., LECOURT, E., DEWULF, E. M., SOHET, F. M., PACHIKIAN, B. D., NASLAIN, D., DE BACKER, F., NEYRINCK, A. M. & DELZENNE, N. M. 2009. Gut microbiota fermentation of prebiotics increases satietogenic and incretin gut peptide production with consequences for appetite sensation and glucose response after a meal. The American journal of clinical nutrition, 90, 1236-1243.
CARPENTIER, A. C., BLONDIN, D. P., VIRTANEN, K. A., RICHARD, D., HAMAN, F. & TURCOTTE, E. E. 2018. Brown adipose tissue energy metabolism in humans. Frontiers in endocrinology, 9, 447.
CARTER, S., RENNIE, C. & TARNOPOLSKY, M. 2001. Substrate utilization during endurance exercise in men and women after endurance training. American Journal of Physiology-Endocrinology And Metabolism.

284
CHAMBERS, E., GUESS, N., VIARDOT, A. & FROST, G. 2011. Dietary starch and fiber: potential benefits to body weight and glucose metabolism. Diabetes Management, 1, 521.
CHAMBERS, E. S., BYRNE, C. S., ASPEY, K., CHEN, Y., KHAN, S., MORRISON, D. J. & FROST, G. 2018. Acute oral sodium propionate supplementation raises resting energy expenditure and lipid oxidation in fasted humans. Diabetes, Obesity and Metabolism, 20, 1034-1039.
CHAMBERS, E. S., BYRNE, C. S., MORRISON, D. J., MURPHY, K. G., PRESTON, T., TEDFORD, C., GARCIA-PEREZ, I., FOUNTANA, S., SERRANO-CONTRERAS, J. I. & HOLMES, E. 2019. Dietary supplementation with inulin-propionate ester or inulin improves insulin sensitivity in adults with overweight and obesity with distinct effects on the gut microbiota, plasma metabolome and systemic inflammatory responses: a randomised cross-over trial. Gut, 68, 1430-1438.
CHAMBERS, E. S., VIARDOT, A., PSICHAS, A., MORRISON, D. J., MURPHY, K. G., ZAC-VARGHESE, S. E., MACDOUGALL, K., PRESTON, T., TEDFORD, C., FINLAYSON, G. S., BLUNDELL, J. E., BELL, J. D., THOMAS, E. L., MT-ISA, S., ASHBY, D., GIBSON, G. R., KOLIDA, S., DHILLO, W. S., BLOOM, S. R., MORLEY, W., CLEGG, S. & FROST, G. 2015. Effects of targeted delivery of propionate to the human colon on appetite regulation, body weight maintenance and adiposity in overweight adults. Gut, 64, 1744-54.
CHAN, T. & FREEDLAND, R. 1972. The effect of propionate on the metabolism of pyruvate and lactate in the perfused rat liver. Biochemical Journal, 127, 539-543.
CHEN, C., ZENG, Y., XU, J., ZHENG, H., LIU, J., FAN, R., ZHU, W., YUAN, L., QIN, Y. & CHEN, S. 2016. Therapeutic effects of soluble dietary fiber consumption on type 2 diabetes mellitus. Experimental and therapeutic medicine, 12, 1232-1242.
CHEN, W.-J. L., ANDERSON, J. W. & JENNINGS, D. 1984. Propionate may mediate the hypocholesterolemic effects of certain soluble plant fibers in cholesterol-fed rats. Proceedings of the society for experimental biology and medicine, 175, 215-218.
CHERBUT, C. 2003. Motor effects of short-chain fatty acids and lactate in the gastrointestinal tract. Proceedings of the Nutrition Society, 62, 95-99.
CHERBUT, C., AUBE, A., BLOTTIERE, H. & GALMICHE, J. 1997. Effects of short-chain fatty acids on gastrointestinal motility. Scandinavian journal of gastroenterology, 32, 58-61.
CHERBUT, C., FERRIER, L., ROZÉ, C., ANINI, Y., BLOTTIÈRE, H., LECANNU, G. & GALMICHE, J.-P. 1998. Short-chain fatty acids modify colonic motility through nerves and polypeptide YY release in the rat. American Journal of Physiology-Gastrointestinal and Liver Physiology, 275, G1415-G1422.
CHIOLÉRO, R., MAVROCORDATOS, P., BURNIER, P., CAYEUX, M., SCHINDLER, C., JÉQUIER, E. & TAPPY, L. 1993. Effects of infused sodium acetate, sodium lactate, and sodium β-hydroxybutyrate on energy expenditure and substrate oxidation rates in lean humans. The American journal of clinical nutrition, 58, 608-613.
CHOCHINOV, R., BOWEN, H. & MOORHOUSE, J. 1978. Circulating alanine disposal in diabetes mellitus. Diabetes, 27, 420-426.
CHOI, C. S., KIM, M. Y., HAN, K. & LEE, M.-S. 2012. Assessment of β-cell function in human patients. Islets, 4, 79-83.
CHOOI, Y. C., DING, C. & MAGKOS, F. 2019. The epidemiology of obesity. Metabolism, 92, 6-10.
COHEN, M. J., SERKOVA, N. J., WIENER-KRONISH, J., PITTET, J.-F. & NIEMANN, C. U. 2010. 1H-NMR-based metabolic signatures of clinical outcomes in trauma

285
patients—beyond lactate and base deficit. Journal of Trauma and Acute Care Surgery, 69, 31-40.
COLORCON. 2019. Acryl-EZE® Enteric Coating Stability [Online]. Available: http://www.colorcon.com/ [Accessed].
COOK, S. & SELLIN, J. 1998. Short chain fatty acids in health and disease. Alimentary pharmacology & therapeutics, 12, 499-507.
CORPET, D. E., YIN, Y., ZHANG, X. M., RÉMÉSY, C., STAMP, D., MEDLINE, A., THOMPSON, L., BRUCE, W. R. & ARCHER, M. C. 1995. Colonic protein fermentation and promotion of colon carcinogenesis by thermolyzed casein.
COTTIN, S., SANDERS, T. & HALL, W. 2011. The differential effects of EPA and DHA on cardiovascular risk factors. Proceedings of the Nutrition Society, 70, 215-231.
COVINGTON, D., BRISCOE, C., BROWN, A. & JAYAWICKREME, C. 2006. The G-protein-coupled receptor 40 family (GPR40–GPR43) and its role in nutrient sensing. Portland Press Ltd.
CRAWFORD, S. O., HOOGEVEEN, R. C., BRANCATI, F. L., ASTOR, B. C., BALLANTYNE, C. M., SCHMIDT, M. I. & YOUNG, J. H. 2010. Association of blood lactate with type 2 diabetes: the Atherosclerosis Risk in Communities Carotid MRI Study. International journal of epidemiology, 39, 1647-1655.
CREBER, C., COOPER, R. S., PLANGE-RHULE, J., BOVET, P., LAMBERT, E. V., FORRESTER, T. E., SCHOELLER, D., RIESEN, W., KORTE, W. & CAO, G. 2018. Independent association of resting energy expenditure with blood pressure: confirmation in populations of the African diaspora. BMC cardiovascular disorders, 18, 4.
CUMMINGS, J., POMARE, E., BRANCH, W., NAYLOR, C. & MACFARLANE, G. 1987. Short chain fatty acids in human large intestine, portal, hepatic and venous blood. Gut, 28, 1221-1227.
CUMMINGS, J. H. 1981. Short chain fatty acids in the human colon. Gut, 22, 763. DANJO, K., SAKAMOTO, J., IWANE, S., TAMURA, K., NAKAJI, S., FUKUDA, S.,
MURAKAMI, H., SHIMOYAMA, T., TAKAHASHI, I. & UMEDA, T. 2008. Effects of cellulose supplementation on fecal consistency and fecal weight. Digestive diseases and sciences, 53, 712.
DARWICHE, G., ÖSTMAN, E. M., LILJEBERG, H. G., KALLINEN, N., BJÖRGELL, O., BJÖRCK, I. M. & ALMÉR, L.-O. 2001. Measurements of the gastric emptying rate by use of ultrasonography: studies in humans using bread with added sodium propionate. The American journal of clinical nutrition, 74, 254-258.
DARZI, J., FROST, G. & ROBERTSON, M. 2012. Effects of a novel propionate-rich sourdough bread on appetite and food intake. European journal of clinical nutrition, 66, 789-794.
DASILVA, S. G., GUIDETTI, L., BUZZACHERA, C. F., ELSANGEDY, H. M., KRINSKI, K., DE CAMPOS, W., GOSS, F. L. & BALDARI, C. 2011. Gender-based differences in substrate use during exercise at a self-selected pace. The Journal of Strength & Conditioning Research, 25, 2544-2551.
DE GRAAF, C., BLOM, W. A., SMEETS, P. A., STAFLEU, A. & HENDRIKS, H. F. 2004. Biomarkers of satiation and satiety. The American journal of clinical nutrition, 79, 946-961.
DE SILVA, A. & BLOOM, S. R. 2012. Gut hormones and appetite control: a focus on PYY and GLP-1 as therapeutic targets in obesity. Gut and liver, 6, 10.
DE VADDER, F., KOVATCHEVA-DATCHARY, P., GONCALVES, D., VINERA, J., ZITOUN, C., DUCHAMPT, A., BÄCKHED, F. & MITHIEUX, G. 2014. Microbiota-

286
generated metabolites promote metabolic benefits via gut-brain neural circuits. Cell, 156, 84-96.
DEBERG, M., HOUSSA, P., FRANK, B. H., SODOYEZ-GOFFAUX, F. & SODOYEZ, J.-C. 1998. Highly specific radioimmunoassay for human insulin based on immune exclusion of all insulin precursors. Clinical chemistry, 44, 1504-1513.
DEHGHAN, P., GARGARI, B. P. & ASGHARIJAFARABADI, M. 2013. Effects of high performance inulin supplementation on glycemic status and lipid profile in women with type 2 diabetes: a randomized, placebo-controlled clinical trial. Health promotion perspectives, 3, 55.
DELZENNE, N. M., CANI, P. D., DAUBIOUL, C. & NEYRINCK, A. M. 2005. Impact of inulin and oligofructose on gastrointestinal peptides. British Journal of Nutrition, 93, S157-S161.
DEMIGNÉ, C., MORAND, C., LEVRAT, M.-A., BESSON, C., MOUNDRAS, C. & RÉMÉSY, C. 1995. Effect of propionate on fatty acid and cholesterol synthesis and on acetate metabolism in isolated rat hepatocytes. British journal of nutrition, 74, 209-219.
DEN BESTEN, G., BLEEKER, A., GERDING, A., VAN EUNEN, K., HAVINGA, R., VAN DIJK, T. H., OOSTERVEER, M. H., JONKER, J. W., GROEN, A. K. & REIJNGOUD, D.-J. 2015. Short-chain fatty acids protect against high-fat diet–induced obesity via a PPARγ-dependent switch from lipogenesis to fat oxidation. Diabetes, 64, 2398-2408.
DEN BESTEN, G., HAVINGA, R., BLEEKER, A., RAO, S., GERDING, A., VAN EUNEN, K., GROEN, A. K., REIJNGOUD, D.-J. & BAKKER, B. M. 2014. The short-chain fatty acid uptake fluxes by mice on a guar gum supplemented diet associate with amelioration of major biomarkers of the metabolic syndrome. PloS one, 9.
DEN BESTEN, G., LANGE, K., HAVINGA, R., VAN DIJK, T. H., GERDING, A., VAN EUNEN, K., MÜLLER, M., GROEN, A. K., HOOIVELD, G. J. & BAKKER, B. M. 2013a. Gut-derived short-chain fatty acids are vividly assimilated into host carbohydrates and lipids. American Journal of Physiology-Gastrointestinal and Liver Physiology.
DEN BESTEN, G., VAN EUNEN, K., GROEN, A. K., VENEMA, K., REIJNGOUD, D.-J. & BAKKER, B. M. 2013b. The role of short-chain fatty acids in the interplay between diet, gut microbiota, and host energy metabolism. Journal of lipid research, 54, 2325-2340.
DETTMER, K., ARONOV, P. A. & HAMMOCK, B. D. 2007. Mass spectrometry‐based metabolomics. Mass spectrometry reviews, 26, 51-78.
DHILLON, K. K. & GUPTA, S. 2020. Biochemistry, ketogenesis. StatPearls [Internet]. DHURANDHAR, E. J. 2016. The food-insecurity obesity paradox: A resource scarcity
hypothesis. Physiology & behavior, 162, 88-92. DIETERICH, W., SCHINK, M. & ZOPF, Y. 2018. Microbiota in the gastrointestinal tract.
Medical Sciences, 6, 116. DIETERLE, F., ROSS, A., SCHLOTTERBECK, G. & SENN, H. 2006. Probabilistic
quotient normalization as robust method to account for dilution of complex biological mixtures. Application in 1H NMR metabonomics. Analytical chemistry, 78, 4281-4290.
DOLTON, P. & XIAO, M. 2017. The intergenerational transmission of body mass index across countries. Economics & Human Biology, 24, 140-152.
DONA, A. C., JIMÉNEZ, B., SCHÄFER, H., HUMPFER, E., SPRAUL, M., LEWIS, M. R., PEARCE, J. T., HOLMES, E., LINDON, J. C. & NICHOLSON, J. K. 2014.

287
Precision high-throughput proton NMR spectroscopy of human urine, serum, and plasma for large-scale metabolic phenotyping. Analytical chemistry, 86, 9887-9894.
DONAHOO, W. T., LEVINE, J. A. & MELANSON, E. L. 2004. Variability in energy expenditure and its components. Current Opinion in Clinical Nutrition & Metabolic Care, 7, 599-605.
DOROKHOV, Y. L., KOMAROVA, T. V., PETRUNIA, I. V., KOSORUKOV, V. S., ZINOVKIN, R. A., SHINDYAPINA, A. V., FROLOVA, O. Y. & GLEBA, Y. Y. 2012. Methanol may function as a cross-kingdom signal. PLoS One, 7, e36122.
DOROKHOV, Y. L., SHINDYAPINA, A. V., SHESHUKOVA, E. V. & KOMAROVA, T. V. 2015. Metabolic methanol: molecular pathways and physiological roles. Physiological reviews, 95, 603-644.
DU, H., VAN DER A, D. L., BOSHUIZEN, H. C., FOROUHI, N. G., WAREHAM, N. J., HALKJÆR, J., TJØNNELAND, A., OVERVAD, K., JAKOBSEN, M. U. & BOEING, H. 2010. Dietary fiber and subsequent changes in body weight and waist circumference in European men and women. The American journal of clinical nutrition, 91, 329-336.
DUMAS, M.-E., MAIBAUM, E. C., TEAGUE, C., UESHIMA, H., ZHOU, B., LINDON, J. C., NICHOLSON, J. K., STAMLER, J., ELLIOTT, P. & CHAN, Q. 2006. Assessment of analytical reproducibility of 1H NMR spectroscopy based metabonomics for large-scale epidemiological research: the INTERMAP Study. Analytical chemistry, 78, 2199-2208.
DUNCAN, S. H., HOLTROP, G., LOBLEY, G. E., CALDER, A. G., STEWART, C. S. & FLINT, H. J. 2004. Contribution of acetate to butyrate formation by human faecal bacteria. British Journal of Nutrition, 91, 915-923.
DUNCAN, S. H., LOBLEY, G., HOLTROP, G., INCE, J., JOHNSTONE, A., LOUIS, P. & FLINT, H. J. 2008. Human colonic microbiota associated with diet, obesity and weight loss. International journal of obesity, 32, 1720-1724.
EATON, S. B. 2006. The ancestral human diet: what was it and should it be a paradigm for contemporary nutrition? Proceedings of the Nutrition Society, 65, 1-6.
EL HAGE, R., HERNANDEZ-SANABRIA, E., CALATAYUD ARROYO, M., PROPS, R. & VAN DE WIELE, T. 2019. Propionate-producing consortium restores antibiotic-induced dysbiosis in a dynamic in vitro model of the human intestinal microbial ecosystem. Frontiers in microbiology, 10, 1206.
EL HAGE, R., HERNANDEZ-SANABRIA, E., CALATAYUD ARROYO, M. & VAN DE WIELE, T. 2020. Supplementation of a propionate-producing consortium improves markers of insulin resistance in an in vitro model of gut-liver axis. American Journal of Physiology-Endocrinology and Metabolism.
EL OUFIR, L., BARRY, J., FLOURIE, B., CHERBUT, C., CLOAREC, D., BORNET, F. & GALMICHE, J. 2000. Relationships between transit time in man and in vitro fermentation of dietary fiber by fecal bacteria. European journal of clinical nutrition, 54, 603-609.
EL-ANEED, A., COHEN, A. & BANOUB, J. 2009. Mass spectrometry, review of the basics: electrospray, MALDI, and commonly used mass analyzers. Applied Spectroscopy Reviews, 44, 210-230.
ELIPE, M. V. S. 2003. Advantages and disadvantages of nuclear magnetic resonance spectroscopy as a hyphenated technique. Analytica Chimica Acta, 497, 1-25.
ELLIOT, J., SYMONDS, H. & PIKE, B. 1985. Effect on feed intake of infusing sodium propionate or sodium acetate into a mesenteric vein of cattle. Journal of dairy science, 68, 1165-1170.

288
EMWAS, A.-H., ROY, R., MCKAY, R. T., TENORI, L., SACCENTI, E., GOWDA, G., RAFTERY, D., ALAHMARI, F., JAREMKO, L. & JAREMKO, M. 2019. NMR spectroscopy for metabolomics research. Metabolites, 9, 123.
ENGLAND, P. H. 2017. Guidance. Health matters: obesity and the food environment. EVANS, D., PYE, G., BRAMLEY, R., CLARK, A., DYSON, T. & HARDCASTLE, J.
1988. Measurement of gastrointestinal pH profiles in normal ambulant human subjects. Gut, 29, 1035-1041.
FAERCH, K., BRØNS, C., ALIBEGOVIC, A. & VAAG, A. 2010. The disposition index: adjustment for peripheral vs. hepatic insulin sensitivity? The Journal of physiology, 588, 759-764.
FAM, B. C., JOANNIDES, C. N. & ANDRIKOPOULOS, S. 2012. The liver: Key in regulating appetite and body weight. Adipocyte, 1, 259-264.
FAN, T. W. & LANE, A. N. 2011. NMR-based stable isotope resolved metabolomics in systems biochemistry. Journal of biomolecular NMR, 49, 267-280.
FAN, Y., LI, Y., CHEN, Y., ZHAO, Y.-J., LIU, L.-W., LI, J., WANG, S.-L., ALOLGA, R. N., YIN, Y. & WANG, X.-M. 2016. Comprehensive metabolomic characterization of coronary artery diseases. Journal of the American College of Cardiology, 68, 1281-1293.
FARNINGHAM, D. & WHYTE, C. 1993. The role of propionate and acetate in the control of food intake in sheep. British Journal of Nutrition, 70, 37-46.
FAROOQI, I. S., YEO, G. S., KEOGH, J. M., AMINIAN, S., JEBB, S. A., BUTLER, G., CHEETHAM, T. & O’RAHILLY, S. 2000. Dominant and recessive inheritance of morbid obesity associated with melanocortin 4 receptor deficiency. The Journal of clinical investigation, 106, 271-279.
FERRANNINI, E., NATALI, A., BRANDI, L. S., BONADONNA, R., DE KREUTZEMBERG, S. V., DELPRATO, S. & SANTORO, D. 1993. Metabolic and thermogenic effects of lactate infusion in humans. American Journal of Physiology-Endocrinology And Metabolism, 265, E504-E512.
FISHER, R. S., MALMUD, L. S., BANDINI, P. & ROCK, E. 1982. Gastric emptying of a physiologic mixed solid-liquid meal. Clinical nuclear medicine, 7, 215-221.
FLEGAL, K. M., SHEPHERD, J. A., LOOKER, A. C., GRAUBARD, B. I., BORRUD, L. G., OGDEN, C. L., HARRIS, T. B., EVERHART, J. E. & SCHENKER, N. 2009. Comparisons of percentage body fat, body mass index, waist circumference, and waist-stature ratio in adults. The American journal of clinical nutrition, 89, 500-508.
FLETCHER, G., EVES, F. F., GLOVER, E. I., ROBINSON, S. L., VERNOOIJ, C. A., THOMPSON, J. L. & WALLIS, G. A. 2017. Dietary intake is independently associated with the maximal capacity for fat oxidation during exercise. The American journal of clinical nutrition, 105, 864-872.
FLINT, A., RABEN, A., BLUNDELL, J. & ASTRUP, A. 2000. Reproducibility, power and validity of visual analogue scales in assessment of appetite sensations in single test meal studies. International journal of obesity, 24, 38-48.
FORBES, J. 1988. Metabolic aspects of the regulation of voluntary food intake and appetite. Nutrition Research Reviews, 1, 145-168.
FORSE, R. A. 1993. Comparison of gas exchange measurements with a mouthpiece, face mask, and ventilated canopy. Journal of Parenteral and Enteral Nutrition, 17, 388-391.
FRAMPTON, J., MURPHY, K. G., FROST, G. & CHAMBERS, E. S. 2020. Short-chain fatty acids as potential regulators of skeletal muscle metabolism and function. Nature Metabolism, 1-9.

289
FRAYN, K. 1983. Calculation of substrate oxidation rates in vivo from gaseous exchange. Journal of applied physiology, 55, 628-634.
FREELAND, K. R., WILSON, C. & WOLEVER, T. M. 2010. Adaptation of colonic fermentation and glucagon-like peptide-1 secretion with increased wheat fibre intake for 1 year in hyperinsulinaemic human subjects. British Journal of Nutrition, 103, 82-90.
FROST, G., BRYNES, A., DHILLO, W., BLOOM, S. & MCBURNEY, M. 2003. The effects of fiber enrichment of pasta and fat content on gastric emptying, GLP-1, glucose, and insulin responses to a meal. European journal of clinical nutrition, 57, 293-298.
FROST, G., CAI, Z., RAVEN, M., OTWAY, D., MUSHTAQ, R. & JOHNSTON, J. 2014a. Effect of short chain fatty acids on the expression of free fatty acid receptor 2 (Ffar2), Ffar3 and early-stage adipogenesis. Nutrition & diabetes, 4, e128-e128.
FROST, G., SLEETH, M. L., SAHURI-ARISOYLU, M., LIZARBE, B., CERDAN, S., BRODY, L., ANASTASOVSKA, J., GHOURAB, S., HANKIR, M. & ZHANG, S. 2014b. The short-chain fatty acid acetate reduces appetite via a central homeostatic mechanism. Nature communications, 5, 1-11.
FRYAR, C. D., KRUSZAN-MORAN, D., GU, Q. & OGDEN, C. L. 2018. Mean body weight, weight, waist circumference, and body mass index among adults: United States, 1999–2000 through 2015–2016.
GARREL, D. R., JOBIN, N. & DE JONGE, L. H. 1996. Should we still use the Harris and Benedict equations? Nutrition in clinical practice, 11, 99-103.
GERTSMAN, I. & BARSHOP, B. A. 2018. Promises and pitfalls of untargeted metabolomics. Journal of inherited metabolic disease, 41, 355-366.
GIBBONS, C., CAUDWELL, P., FINLAYSON, G., WEBB, D.-L., HELLSTRÖM, P. M., NÄSLUND, E. & BLUNDELL, J. E. 2013. Comparison of postprandial profiles of ghrelin, active GLP-1, and total PYY to meals varying in fat and carbohydrate and their association with hunger and the phases of satiety. The Journal of Clinical Endocrinology & Metabolism, 98, E847-E855.
GIBBONS, C., HOPKINS, M., BEAULIEU, K., OUSTRIC, P. & BLUNDELL, J. E. 2019. Issues in measuring and interpreting human appetite (satiety/satiation) and its contribution to obesity. Current obesity reports, 8, 77-87.
GILL, P., VAN ZELM, M., MUIR, J. & GIBSON, P. 2018. Short chain fatty acids as potential therapeutic agents in human gastrointestinal and inflammatory disorders. Alimentary pharmacology & therapeutics, 48, 15-34.
GIROLAMO, F. D., LANTE, I., MURACA, M. & PUTIGNANI, L. 2013. The role of mass spectrometry in the “omics” era. Current organic chemistry, 17, 2891-2905.
GONZÁLEZ HERNÁNDEZ, M. A., CANFORA, E. E., JOCKEN, J. W. & BLAAK, E. E. 2019. The short-chain fatty acid acetate in body weight control and insulin sensitivity. Nutrients, 11, 1943.
GONZÁLEZ-PEÑA, D. & BRENNAN, L. 2019. Recent advances in the application of metabolomics for nutrition and health. Annual review of food science and technology, 10, 479-519.
GOWDA, G. N. & DJUKOVIC, D. 2014. Overview of mass spectrometry-based metabolomics: opportunities and challenges. Mass Spectrometry in Metabolomics. Springer.
GUESS, N. D., DORNHORST, A., OLIVER, N., BELL, J. D., THOMAS, E. L. & FROST, G. S. 2015. A randomized controlled trial: the effect of inulin on weight management and ectopic fat in subjects with prediabetes. Nutrition & metabolism, 12, 1-10.

290
GUNGOR, N., SAAD, R., JANOSKY, J. & ARSLANIAN, S. 2004. Validation of surrogate estimates of insulin sensitivity and insulin secretion in children and adolescents. The Journal of pediatrics, 144, 47-55.
GUPTA, R. D., RAMACHANDRAN, R., PADMANABAN VENKATESAN, S. A., JOSEPH, M. & THOMAS, N. 2017. Indirect calorimetry: from bench to bedside. Indian journal of endocrinology and metabolism, 21, 594.
GUTCH, M., KUMAR, S., RAZI, S. M., GUPTA, K. K. & GUPTA, A. 2015. Assessment of insulin sensitivity/resistance. Indian journal of endocrinology and metabolism, 19, 160.
HAN, J.-H., KIM, I.-S., JUNG, S.-H., LEE, S.-G., SON, H.-Y. & MYUNG, C.-S. 2014. The effects of propionate and valerate on insulin responsiveness for glucose uptake in 3T3-L1 adipocytes and C2C12 myotubes via G protein-coupled receptor 41. PloS one, 9.
HARA, T., KIMURA, I., INOUE, D., ICHIMURA, A. & HIRASAWA, A. 2013. Free fatty acid receptors and their role in regulation of energy metabolism. Reviews of Physiology, Biochemistry and Pharmacology, Vol. 164. Springer.
HAVEL, P. J. 2004. Update on adipocyte hormones: regulation of energy balance and carbohydrate/lipid metabolism. Diabetes, 53, S143-S151.
HEBEBRAND, J., VOLCKMAR, A.-L., KNOLL, N. & HINNEY, A. 2010. Chipping away the ‘missing heritability’: GIANT steps forward in the molecular elucidation of obesity–but still lots to go. Obesity facts, 3, 294-303.
HEIMANN, E., NYMAN, M. & DEGERMAN, E. 2015. Propionic acid and butyric acid inhibit lipolysis and de novo lipogenesis and increase insulin-stimulated glucose uptake in primary rat adipocytes. Adipocyte, 4, 81-88.
HERVIK, A. K. & SVIHUS, B. 2019. The role of fiber in energy balance. Journal of nutrition and metabolism, 2019.
HILL, J. O., WYATT, H. R., REED, G. W. & PETERS, J. C. 2003. Obesity and the environment: where do we go from here? Science, 299, 853-855.
HILLMAN, E. T., LU, H., YAO, T. & NAKATSU, C. H. 2017. Microbial ecology along the gastrointestinal tract. Microbes and environments, ME17017.
HOLT, G. M., OWEN, L. J., TILL, S., CHENG, Y., GRANT, V. A., HARDEN, C. J. & CORFE, B. M. 2017. Systematic literature review shows that appetite rating does not predict energy intake. Critical reviews in food science and nutrition, 57, 3577-3582.
HONG, Y.-H., NISHIMURA, Y., HISHIKAWA, D., TSUZUKI, H., MIYAHARA, H., GOTOH, C., CHOI, K.-C., FENG, D. D., CHEN, C. & LEE, H.-G. 2005. Acetate and propionate short chain fatty acids stimulate adipogenesis via GPCR43. Endocrinology, 146, 5092-5099.
HU, J., LIN, S., ZHENG, B. & CHEUNG, P. C. 2018. Short-chain fatty acids in control of energy metabolism. Critical reviews in food science and nutrition, 58, 1243-1249.
HUNT, J. & KNOX, M. 1969. The slowing of gastric emptying by nine acids. The Journal of Physiology, 201, 161-179.
HUSSAIN, S. & BLOOM, S. 2013. The regulation of food intake by the gut-brain axis: implications for obesity. International journal of obesity, 37, 625-633.
INSTITUTE, M. G. 2014. Overcoming obesity: An initial economic analysis. McKinsey & Company Jakarta.
ISLAM, R., ANZAI, N., AHMED, N., ELLAPAN, B., JIN, C. J., SRIVASTAVA, S., MIURA, D., FUKUTOMI, T., KANAI, Y. & ENDOU, H. 2008. Mouse organic anion transporter 2 (mOat2) mediates the transport of short chain fatty acid propionate. Journal of pharmacological sciences, 106, 525-528.

291
JAHOOR, F., PETERS, E. J. & WOLFE, R. R. 1990. The relationship between gluconeogenic substrate supply and glucose production in humans. American Journal of Physiology-Endocrinology And Metabolism, 258, E288-E296.
JANSSEN, P., VANDEN BERGHE, P., VERSCHUEREN, S., LEHMANN, A., DEPOORTERE, I. & TACK, J. 2011. the role of gastric motility in the control of food intake. Alimentary pharmacology & therapeutics, 33, 880-894.
JEBB, S. A. & PRENTICE, A. M. 1995. Is obesity an eating disorder? Proceedings of the Nutrition Society, 54, 721-728.
JENSEN, N. S. & CANALE-PAROLA, E. 1985. Nutritionally limited pectinolytic bacteria from the human intestine. Applied and environmental microbiology, 50, 172-173.
JENSSEN, T., NURJHAN, N., CONSOLI, A. & GERICH, J. 1990. Failure of substrate-induced gluconeogenesis to increase overall glucose appearance in normal humans. Demonstration of hepatic autoregulation without a change in plasma glucose concentration. The Journal of clinical investigation, 86, 489-497.
JOCKEN, J. W., GONZÁLEZ HERNÁNDEZ, M. A., HOEBERS, N. T., VAN DER BEEK, C. M., ESSERS, Y. P., BLAAK, E. E. & CANFORA, E. E. 2018. Short-chain fatty acids differentially affect intracellular lipolysis in a human white adipocyte model. Frontiers in endocrinology, 8, 372.
JOHNSON, R. K. & MCKENZIE, D. 2001. Energy requirement methodology. Nutrition in the Treatment and Prevention of Disease. Academic Press, San Diego, CA.
JONES, J. G., NAIDOO, R., SHERRY, A. D., JEFFREY, F., COTTAM, G. L. & MALLOY, C. R. 1997. Measurement of gluconeogenesis and pyruvate recycling in the rat liver: a simple analysis of glucose and glutamate isotopomers during metabolism of [1, 2, 3-13C3] propionate. FEBS letters, 412, 131-137.
JOUET, P., MOUSSATA, D., DUBOC, H., BOSCHETTI, G., ATTAR, A., GORBATCHEF, C., SABATÉ, J. M., COFFIN, B. & FLOURIÉ, B. 2013. Effect of short‐chain fatty acids and acidification on the phasic and tonic motor activity of the human colon. Neurogastroenterology & Motility, 25, 943-949.
KALDERON, B., KORMAN, S. H., GUTMAN, A. & LAPIDOT, A. 1989. Estimation of glucose carbon recycling in children with glycogen storage disease: A 13C NMR study using [U-13C] glucose. Proceedings of the National Academy of Sciences, 86, 4690-4694.
KALHAN, S. C., GILFILLAN, C. A., TSERNG, K.-Y. & SAVIN, S. M. 1988. Glucose-alanine relationship in normal human pregnancy. Metabolism, 37, 152-158.
KANG, E. S., YUN, Y. S., PARK, S. W., KIM, H. J., AHN, C. W., SONG, Y. D., CHA, B. S., LIM, S. K., KIM, K. R. & LEE, H. C. 2005. Limitation of the validity of the homeostasis model assessment as an index of insulin resistance in Korea. Metabolism, 54, 206-211.
KARIMPOUR, M., SUROWIEC, I., WU, J., GOUVEIA-FIGUEIRA, S., PINTO, R., TRYGG, J., ZIVKOVIC, A. M. & NORDING, M. L. 2016. Postprandial metabolomics: A pilot mass spectrometry and NMR study of the human plasma metabolome in response to a challenge meal. Analytica chimica acta, 908, 121-131.
KARRA, E., CHANDARANA, K. & BATTERHAM, R. L. 2009. The role of peptide YY in appetite regulation and obesity. The Journal of physiology, 587, 19-25.
KENNY, G. P., NOTLEY, S. R. & GAGNON, D. 2017. Direct calorimetry: a brief historical review of its use in the study of human metabolism and thermoregulation. European journal of applied physiology, 117, 1765-1785.
KEUN, H. C., EBBELS, T. M., ANTTI, H., BOLLARD, M. E., BECKONERT, O., SCHLOTTERBECK, G., SENN, H., NIEDERHAUSER, U., HOLMES, E. &

292
LINDON, J. C. 2002. Analytical reproducibility in 1H NMR-based metabonomic urinalysis. Chemical research in toxicology, 15, 1380-1386.
KEYTEL, L., GOEDECKE, J., NOAKES, T., HIILOSKORPI, H., LAUKKANEN, R., VAN DER MERWE, L. & LAMBERT, E. 2005. Prediction of energy expenditure from heart rate monitoring during submaximal exercise. Journal of sports sciences, 23, 289-297.
KIM, K. N., YAO, Y. & JU, S. Y. 2019. Short chain fatty acids and fecal microbiota abundance in humans with obesity: A systematic review and meta-analysis. Nutrients, 11, 2512.
KIMURA, I., INOUE, D., MAEDA, T., HARA, T., ICHIMURA, A., MIYAUCHI, S., KOBAYASHI, M., HIRASAWA, A. & TSUJIMOTO, G. 2011. Short-chain fatty acids and ketones directly regulate sympathetic nervous system via G protein-coupled receptor 41 (GPR41). Proceedings of the national academy of sciences, 108, 8030-8035.
KIMURA, I., OZAWA, K., INOUE, D., IMAMURA, T., KIMURA, K., MAEDA, T., TERASAWA, K., KASHIHARA, D., HIRANO, K. & TANI, T. 2013. The gut microbiota suppresses insulin-mediated fat accumulation via the short-chain fatty acid receptor GPR43. Nature communications, 4, 1-12.
KLOK, M., JAKOBSDOTTIR, S. & DRENT, M. 2007. The role of leptin and ghrelin in the regulation of food intake and body weight in humans: a review. Obesity reviews, 8, 21-34.
KO, G. T., CHAN, J. C., WOO, J., LAU, E., YEUNG, V. T., CHOW, C.-C. & COCKRAM, C. S. 1998. The reproducibility and usefulness of the oral glucose tolerance test in screening for diabetes and other cardiovascular risk factors. Annals of clinical biochemistry, 35, 62-67.
KOMAROVA, T. V., PETRUNIA, I. V., SHINDYAPINA, A. V., SILACHEV, D. N., SHESHUKOVA, E. V., KIRYANOV, G. I. & DOROKHOV, Y. L. 2014. Endogenous methanol regulates mammalian gene activity. PLoS One, 9, e90239.
KRAUSS, R. M. 2004. Lipids and lipoproteins in patients with type 2 diabetes. Diabetes care, 27, 1496-1504.
KREBS, M., BREHM, A., KRSSAK, M., ANDERWALD, C., BERNROIDER, E., NOWOTNY, P., ROTH, E., CHANDRAMOULI, V., LANDAU, B. & WALDHÄUSL, W. 2003. Direct and indirect effects of amino acids on hepatic glucose metabolism in humans. Diabetologia, 46, 917-925.
KREYMANN, B., GHATEI, M., WILLIAMS, G. & BLOOM, S. 1987. Glucagon-like peptide-1 7-36: a physiological incretin in man. The Lancet, 330, 1300-1304.
KRUK, J., DOSKOCZ, M., JODŁOWSKA, E., ZACHARZEWSKA, A., ŁAKOMIEC, J., CZAJA, K. & KUJAWSKI, J. 2017. NMR techniques in metabolomic studies: A quick overview on examples of utilization. Applied magnetic resonance, 48, 1-21.
KULICZKOWSKA-PLAKSEJ, J., MILEWICZ, A. & JAKUBOWSKA, J. 2012. Neuroendocrine control of metabolism. Gynecological Endocrinology, 28, 27-32.
KUMMITHA, C. M., KALHAN, S. C., SAIDEL, G. M. & LAI, N. 2014. Relating tissue/organ energy expenditure to metabolic fluxes in mouse and human: experimental data integrated with mathematical modeling. Physiological reports, 2.
LAN, R., ZHAO, Z., LI, S. & AN, L. 2020. Sodium butyrate as an effective feed additive to improve performance, liver function, and meat quality in broilers under hot climatic conditions. Poultry Science.
LANZI, S., CODECASA, F., CORNACCHIA, M., MAESTRINI, S., CAPODAGLIO, P., BRUNANI, A., FANARI, P., SALVADORI, A. & MALATESTA, D. 2015. Long

293
maximal incremental tests accurately assess aerobic fitness in class II and III obese men. PloS one, 10, e0124180.
LARRAUFIE, P., MARTIN-GALLAUSIAUX, C., LAPAQUE, N., DORE, J., GRIBBLE, F., REIMANN, F. & BLOTTIERE, H. 2018. SCFAs strongly stimulate PYY production in human enteroendocrine cells. Scientific reports, 8, 1-9.
LATTIMER, J. M. & HAUB, M. D. 2010. Effects of dietary fiber and its components on metabolic health. Nutrients, 2, 1266-1289.
LAURENT, C., SIMONEAU, C., MARKS, L., BRASCHI, S., CHAMP, M., CHARBONNEL, B. & KREMPF, M. 1995. Effect of acetate and propionate on fasting hepatic glucose production in humans. European journal of clinical nutrition, 49, 484-491.
LE POUL, E., LOISON, C., STRUYF, S., SPRINGAEL, J.-Y., LANNOY, V., DECOBECQ, M.-E., BREZILLON, S., DUPRIEZ, V., VASSART, G. & VAN DAMME, J. 2003. Functional characterization of human receptors for short chain fatty acids and their role in polymorphonuclear cell activation. Journal of Biological Chemistry, 278, 25481-25489.
LEE, A., CARDEL, M. & DONAHOO, W. T. 2019. Social and Environmental Factors Influencing Obesity. Endotext [Internet]. MDText. com, Inc.
LENNARZ, W. J. & LANE, M. D. 2013. Encyclopedia of biological chemistry, Academic Press.
LEVISON, M. E. 1973. Effect of colon flora and short-chain fatty acids on growth in vitro of Pseudomonas aeruginosa and Enterobacteriaceae. Infection and immunity, 8, 30-35.
LI, X., LUO, H., HUANG, T., XU, L., SHI, X. & HU, K. 2019. Statistically correlating NMR spectra and LC-MS data to facilitate the identification of individual metabolites in metabolomics mixtures. Analytical and bioanalytical chemistry, 411, 1301-1309.
LI, Z., YI, C.-X., KATIRAEI, S., KOOIJMAN, S., ZHOU, E., CHUNG, C. K., GAO, Y., VAN DEN HEUVEL, J. K., MEIJER, O. C. & BERBÉE, J. F. 2018. Butyrate reduces appetite and activates brown adipose tissue via the gut-brain neural circuit. Gut, 67, 1269-1279.
LI-GAO, R., HUGHES, D. A., LE CESSIE, S., DE MUTSERT, R., DEN HEIJER, M., ROSENDAAL, F. R., WILLEMS VAN DIJK, K., TIMPSON, N. J. & MOOK-KANAMORI, D. O. 2019. Assessment of reproducibility and biological variability of fasting and postprandial plasma metabolite concentrations using 1H NMR spectroscopy. PloS one, 14, e0218549.
LILJEBERG, H. & BJÖRCK, I. 1996. Delayed gastric emptying rate as a potential mechanism for lowered glycemia after eating sourdough bread: studies in humans and rats using test products with added organic acids or an organic salt. The American journal of clinical nutrition, 64, 886-893.
LILJEBERG, H. & BJÖRCK, I. 1998. Delayed gastric emptying rate may explain improved glycaemia in healthy subjects to a starchy meal with added vinegar. European journal of clinical nutrition, 52, 368-371.
LILJEBERG, H. G., LÖNNER, C. H. & BJÖRCK, I. M. 1995. Sourdough fermentation or addition of organic acids or corresponding salts to bread improves nutritional properties of starch in healthy humans. The Journal of nutrition, 125, 1503-1511.
LIN, H. V., FRASSETTO, A., KOWALIK JR, E. J., NAWROCKI, A. R., LU, M. M., KOSINSKI, J. R., HUBERT, J. A., SZETO, D., YAO, X. & FORREST, G. 2012. Butyrate and propionate protect against diet-induced obesity and regulate gut hormones via free fatty acid receptor 3-independent mechanisms. PloS one, 7.

294
LINDON, J. C., NICHOLSON, J. K., HOLMES, E. & EVERETT, J. R. 2000. Metabonomics: metabolic processes studied by NMR spectroscopy of biofluids. Concepts in Magnetic Resonance: An Educational Journal, 12, 289-320.
LINDSTRÖM, J., PELTONEN, M., ERIKSSON, J. G., LOUHERANTA, A., FOGELHOLM, M., UUSITUPA, M. & TUOMILEHTO, J. 2006. High-fibre, low-fat diet predicts long-term weight loss and decreased type 2 diabetes risk: the Finnish Diabetes Prevention Study. Diabetologia, 49, 912-920.
LITWACK, G. 2018. Metabolism of amino acids. Human biochemistry. Academic Press, Boston, 359-394.
LIU, G., YANG, G., FANG, T., CAI, Y., WU, C., WANG, J., HUANG, Z. & CHEN, X. 2014. NMR-based metabolomic studies reveal changes in biochemical profile of urine and plasma from rats fed with sweet potato fiber or sweet potato residue. RSC advances, 4, 23749-23758.
LIU, S., WILLETT, W. C., MANSON, J. E., HU, F. B., ROSNER, B. & COLDITZ, G. 2003. Relation between changes in intakes of dietary fiber and grain products and changes in weight and development of obesity among middle-aged women. The American journal of clinical nutrition, 78, 920-927.
LIU, X., GAO, J., CHEN, J., WANG, Z., SHI, Q., MAN, H., GUO, S., WANG, Y., LI, Z. & WANG, W. 2016. Identification of metabolic biomarkers in patients with type 2 diabetic coronary heart diseases based on metabolomic approach. Scientific reports, 6, 30785.
LIVINGSTONE, M. B. E., ROBSON, P. J., WELCH, R. W., BURNS, A. A., BURROWS, M. S. & MCCORMACK, C. 2000. Methodological issues in the assessment of satiety. Näringsforskning, 44, 98-103.
LU, Y., FAN, C., LI, P., LU, Y., CHANG, X. & QI, K. 2016. Short chain fatty acids prevent high-fat-diet-induced obesity in mice by regulating G protein-coupled receptors and gut microbiota. Scientific reports, 6, 37589.
LUKE, A., ADEYEMO, A., KRAMER, H., FORRESTER, T. & COOPER, R. S. 2004. Association between blood pressure and resting energy expenditure independent of body size. Hypertension, 43, 555-560.
LUND, J., AAS, V., TINGSTAD, R. H., VAN HEES, A. & NIKOLIĆ, N. 2018. Utilization of lactic acid in human myotubes and interplay with glucose and fatty acid metabolism. Scientific reports, 8, 1-14.
MAKI, K. C., MCKENNEY, J. M., FARMER, M. V., REEVES, M. S. & DICKLIN, M. R. 2009. Indices of insulin sensitivity and secretion from a standard liquid meal test in subjects with type 2 diabetes, impaired or normal fasting glucose. Nutrition journal, 8, 22.
MALKOVA, D., POLYVIOU, T., RIZOU, E., GERASIMIDIS, K., CHAMBERS, E. S., PRESTON, T., TEDFORD, M. C., FROST, G. & MORRISON, D. J. 2020. Moderate intensity exercise training combined with inulin-propionate ester supplementation increases whole body resting fat oxidation in overweight women. Metabolism, 104, 154043.
MARION, D. 2013. An introduction to biological NMR spectroscopy. Molecular & Cellular Proteomics, 12, 3006-3025.
MARKLEY, J. L., BRÜSCHWEILER, R., EDISON, A. S., EGHBALNIA, H. R., POWERS, R., RAFTERY, D. & WISHART, D. S. 2017. The future of NMR-based metabolomics. Current opinion in biotechnology, 43, 34-40.
MASSIMINO, S. P., MCBURNEY, M. I., FIELD, C. J., THOMSON, A. B., KEELAN, M., HAYEK, M. G. & SUNVOLD, G. D. 1998. Fermentable dietary fiber increases GLP-

295
1 secretion and improves glucose homeostasis despite increased intestinal glucose transport capacity in healthy dogs. The Journal of nutrition, 128, 1786-1793.
MATSUDA, M. & DEFRONZO, R. A. 1999. Insulin sensitivity indices obtained from oral glucose tolerance testing: comparison with the euglycemic insulin clamp. Diabetes care, 22, 1462-1470.
MATTES, R. D. 2010. Hunger and thirst: issues in measurement and prediction of eating and drinking. Physiology & behavior, 100, 22-32.
MCBURNEY, M. I., APPS, K. V. & FINEGOOD, D. T. 1995. Splanchnic infusions of short chain fatty acids do not change insulin sensitivity of pigs. The Journal of nutrition, 125, 2571-2576.
MCGARRY, J. D. & FOSTER, D. W. 1976. Ketogenesis and its regulation. Elsevier. MCGILL, C. R. & DEVAREDDY, L. 2015. Ten-year trends in fiber and whole grain intakes
and food sources for the United States population: National Health and Nutrition Examination Survey 2001–2010. Nutrients, 7, 1119-1130.
MELZER, K. 2011. Carbohydrate and fat utilization during rest and physical activity. e-SPEN, the European e-Journal of Clinical Nutrition and Metabolism, 6, e45-e52.
MITTAL, R. D. 2015. Tandem mass spectroscopy in diagnosis and clinical research. Springer.
MOKHA, J. S., SRINIVASAN, S. R., DASMAHAPATRA, P., FERNANDEZ, C., CHEN, W., XU, J. & BERENSON, G. S. 2010. Utility of waist-to-height ratio in assessing the status of central obesity and related cardiometabolic risk profile among normal weight and overweight/obese children: the Bogalusa Heart Study. BMC pediatrics, 10, 73.
MØLLER, N. 2020. Ketone Body, 3-hydroxybutyrate: Minor Metabolite-Major Medical Manifestations. The Journal of Clinical Endocrinology & Metabolism.
MORRISON, D. J. & PRESTON, T. 2016. Formation of short chain fatty acids by the gut microbiota and their impact on human metabolism. Gut microbes, 7, 189-200.
MTAWEH, H., TUIRA, L., FLOH, A. A. & PARSHURAM, C. S. 2018. Indirect calorimetry: history, technology, and application. Frontiers in pediatrics, 6, 257.
MÜLLER, M. J., BOSY-WESTPHAL, A., KLAUS, S., KREYMANN, G., LÜHRMANN, P. M., NEUHÄUSER-BERTHOLD, M., NOACK, R., PIRKE, K. M., PLATTE, P. & SELBERG, O. 2004. World Health Organization equations have shortcomings for predicting resting energy expenditure in persons from a modern, affluent population: generation of a new reference standard from a retrospective analysis of a German database of resting energy expenditure. The American journal of clinical nutrition, 80, 1379-1390.
MUNIYAPPA, R. & MADAN, R. 2018. Assessing insulin sensitivity and resistance in humans. Endotext [Internet]. MDText. com, Inc.
MURAKAMI, Y., OJIMA-KATO, T., SABURI, W., MORI, H., MATSUI, H., TANABE, S. & SUZUKI, T. 2015. Supplemental epilactose prevents metabolic disorders through uncoupling protein-1 induction in the skeletal muscle of mice fed high-fat diets. 114, 1774-1783.
NAGANO, A., OHGE, H., TANAKA, T., TAKAHASHI, S., UEMURA, K., MURAKAMI, Y. & SUEDA, T. 2018. Effects of Different Types of Dietary Fibers on Fermentation by Intestinal Flora. Hiroshima Journal of Medical Sciences, 67, 1-5.
NÄSLUND, E., BARKELING, B., KING, N., GUTNIAK, M., BLUNDELL, J., HOLST, J., RÖSSNER, S. & HELLSTRÖM, P. 1999. Energy intake and appetite are suppressed by glucagon-like peptide-1 (GLP-1) in obese men. International journal of obesity, 23, 304-311.

296
NATIONS, F. A. A. O. O. T. U. 2010. "Specifications for Flavourings" [Online]. Available: http://www.fao.org/food/food-safety-quality/scientific-advice/jecfa/jecfa-flav/details/en/c/1993/ [Accessed 28/10/2020].
OBA, M. & ALLEN, M. S. 2003. Intraruminal infusion of propionate alters feeding behavior and decreases energy intake of lactating dairy cows. The Journal of nutrition, 133, c-1099.
ODUNSI, K., WOLLMAN, R. M., AMBROSONE, C. B., HUTSON, A., MCCANN, S. E., TAMMELA, J., GEISLER, J. P., MILLER, G., SELLERS, T. & CLIBY, W. 2005. Detection of epithelial ovarian cancer using 1H‐NMR‐based metabonomics. International journal of cancer, 113, 782-788.
OECD 2017. Obesity Update 2017. ØRGAARD, A., JEPSEN, S. L. & HOLST, J. J. 2019. Short-chain fatty acids and regulation
of pancreatic endocrine secretion in mice. Islets, 11, 103-111. ORGANIZATION, W. H. 1 April 2020. Obesity and overweight [Online]. World Health
Organization. Available: https://www.who.int/news-room/fact-sheets/detail/obesity-and-overweight [Accessed 10/10/2020].
P.M. DAVIDSON, J. N. S., A.J. BRANES 2005. Antimicrobials in Food, CRC Press Taylor & Francis Group. PARHOFER, K. G. 2015. Interaction between glucose and lipid metabolism: more than
diabetic dyslipidemia. Diabetes & metabolism journal, 39, 353-362. PARKER, B. A., STURM, K., MACINTOSH, C., FEINLE, C., HOROWITZ, M. &
CHAPMAN, I. 2004. Relation between food intake and visual analogue scale ratings of appetite and other sensations in healthy older and young subjects. European journal of clinical nutrition, 58, 212-218.
PARNELL, J. A. & REIMER, R. A. 2009. Weight loss during oligofructose supplementation is associated with decreased ghrelin and increased peptide YY in overweight and obese adults. The American journal of clinical nutrition, 89, 1751-1759.
PARNELL, J. A. & REIMER, R. A. 2012. Prebiotic fibres dose-dependently increase satiety hormones and alter Bacteroidetes and Firmicutes in lean and obese JCR: LA-cp rats. British Journal of Nutrition, 107, 601-613.
PATARRÃO, R. S., LAUTT, W. W. & MACEDO, M. P. 2014. Assessment of methods and indexes of insulin sensitivity. Revista Portuguesa de Endocrinologia, Diabetes e Metabolismo, 9, 65-73.
PATTI, G. J., YANES, O. & SIUZDAK, G. 2012. Metabolomics: the apogee of the omics trilogy. Nature reviews Molecular cell biology, 13, 263-269.
PERRY, B. & WANG, Y. 2012. Appetite regulation and weight control: the role of gut hormones. Nutrition & diabetes, 2, e26-e26.
PERRY, R. J., BORDERS, C. B., CLINE, G. W., ZHANG, X.-M., ALVES, T. C., PETERSEN, K. F., ROTHMAN, D. L., KIBBEY, R. G. & SHULMAN, G. I. 2016. Propionate increases hepatic pyruvate cycling and anaplerosis and alters mitochondrial metabolism. Journal of Biological Chemistry, 291, 12161-12170.
PINGITORE, A., CHAMBERS, E. S., HILL, T., MALDONADO, I. R., LIU, B., BEWICK, G., MORRISON, D. J., PRESTON, T., WALLIS, G. A. & TEDFORD, C. 2017. The diet‐derived short chain fatty acid propionate improves beta‐cell function in humans and stimulates insulin secretion from human islets in vitro. Diabetes, Obesity and Metabolism, 19, 257-265.
PISPRASERT, V., INGRAM, K. H., LOPEZ-DAVILA, M. F., MUNOZ, A. J. & GARVEY, W. T. 2013. Limitations in the use of indices using glucose and insulin levels to predict insulin sensitivity: impact of race and gender and superiority of the indices

297
derived from oral glucose tolerance test in African Americans. Diabetes care, 36, 845-853.
PLAYDON, M. C., SAMPSON, J. N., CROSS, A. J., SINHA, R., GUERTIN, K. A., MOY, K. A., ROTHMAN, N., IRWIN, M. L., MAYNE, S. T. & STOLZENBERG-SOLOMON, R. 2016. Comparing metabolite profiles of habitual diet in serum and urine. The American journal of clinical nutrition, 104, 776-789.
PLEUS, S., JENDRIKE, N., BAUMSTARK, A., MENDE, J., HAUG, C. & FRECKMANN, G. 2019. Evaluation of analytical performance of three blood glucose monitoring systems: system accuracy, measurement repeatability, and intermediate measurement precision. Journal of diabetes science and technology, 13, 111-117.
POPOVICH, D. G., JENKINS, D. J., KENDALL, C. W., DIERENFELD, E. S., CARROLL, R. W., TARIQ, N. & VIDGEN, E. 1997. The western lowland gorilla diet has implications for the health of humans and other hominoids. The Journal of nutrition, 127, 2000-2005.
POSMA, J. M., GARCIA-PEREZ, I., DE IORIO, M., LINDON, J. C., ELLIOTT, P., HOLMES, E., EBBELS, T. M. & NICHOLSON, J. K. 2012. Subset optimization by reference matching (STORM): an optimized statistical approach for recovery of metabolic biomarker structural information from 1H NMR spectra of biofluids. Analytical chemistry, 84, 10694-10701.
POSMA, J. M., GARCIA-PEREZ, I., EBBELS, T. M., LINDON, J. C., STAMLER, J., ELLIOTT, P., HOLMES, E. & NICHOLSON, J. K. 2018. Optimized phenotypic biomarker discovery and confounder elimination via covariate-adjusted projection to latent structures from metabolic spectroscopy data. Journal of proteome research, 17, 1586-1595.
POUTEAU, E., VAHEDI, K., MESSING, B., FLOURIÉ, B., NGUYEN, P., DARMAUN, D. & KREMPF, M. 1998. Production rate of acetate during colonic fermentation of lactulose: a stable-isotope study in humans. The American journal of clinical nutrition, 68, 1276-1283.
PSICHAS, A., SLEETH, M., MURPHY, K., BROOKS, L., BEWICK, G., HANYALOGLU, A., GHATEI, M., BLOOM, S. & FROST, G. 2015. The short chain fatty acid propionate stimulates GLP-1 and PYY secretion via free fatty acid receptor 2 in rodents. International journal of obesity, 39, 424-429.
PSOTA, T. & CHEN, K. 2013. Measuring energy expenditure in clinical populations: rewards and challenges. European journal of clinical nutrition, 67, 436-442.
PSYCHOGIOS, N., HAU, D. D., PENG, J., GUO, A. C., MANDAL, R., BOUATRA, S., SINELNIKOV, I., KRISHNAMURTHY, R., EISNER, R. & GAUTAM, B. 2011. The human serum metabolome. PloS one, 6, e16957.
PURDOM, T., KRAVITZ, L., DOKLADNY, K. & MERMIER, C. 2018. Understanding the factors that effect maximal fat oxidation. Journal of the International Society of Sports Nutrition, 15, 1-10.
RABEN, A., TAGLIABUE, A. & ASTRUP, A. 1995. The reproducibility of subjective appetite scores. British Journal of Nutrition, 73, 517-530.
RAHAT-ROZENBLOOM, S., FERNANDES, J., GLOOR, G. B. & WOLEVER, T. M. 2014. Evidence for greater production of colonic short-chain fatty acids in overweight than lean humans. International journal of obesity, 38, 1525-1531.
RAM, J., SNEHALATHA, C., SELVAM, S., NANDITHA, A., SHETTY, A. S., GODSLAND, I. F., JOHNSTON, D. G. & RAMACHANDRAN, A. 2015. The oral disposition index is a strong predictor of incident diabetes in Asian Indian prediabetic men. Acta diabetologica, 52, 733-741.

298
RASMI, R., SHENOY, K. B., SARNAIK, J., KADWAD, V., SOMASHEKARAPPA, H. & SIVAPRASAD, N. 2014. Standardisation of radioimmunoassay for human insulin employing magnetizable cellulose particles. Journal of Radioanalytical and Nuclear Chemistry, 302, 1271-1275.
REYNOLDS, A., MANN, J., CUMMINGS, J., WINTER, N., METE, E. & TE MORENGA, L. 2019. Carbohydrate quality and human health: a series of systematic reviews and meta-analyses. The Lancet, 393, 434-445.
RICHARDSON, A., DELBRIDGE, A., BROWN, N., RUMSEY, R. & READ, N. 1991. Short chain fatty acids in the terminal ileum accelerate stomach to caecum transit time in the rat. Gut, 32, 266-269.
RIDAURA, V. K., FAITH, J. J., REY, F. E., CHENG, J., DUNCAN, A. E., KAU, A. L., GRIFFIN, N. W., LOMBARD, V., HENRISSAT, B. & BAIN, J. R. 2013. Cultured gut microbiota from twins discordant for obesity modulate adiposity and metabolic phenotypes in mice. Science (New York, NY), 341.
RINDGEN, D., KORFMACHER, W. A. & COX, K. A. 2001. Systematic LC/MS Metabolite Identification in Drug Discovery A four-step strategy to characterize metabolites by LC/MS techniques early in the pharmaceutical discovery process. Nigel J. Clarke.
RÍOS-COVIÁN, D., RUAS-MADIEDO, P., MARGOLLES, A., GUEIMONDE, M., DE LOS REYES-GAVILÁN, C. G. & SALAZAR, N. 2016. Intestinal short chain fatty acids and their link with diet and human health. Frontiers in microbiology, 7, 185.
ROBERTS, R. E., GLICKSMAN, C., ALAGHBAND‐ZADEH, J., SHERWOOD, R., AKUJI, N. & LE ROUX, C. 2011. The relationship between postprandial bile acid concentration, GLP‐1, PYY and ghrelin. Clinical endocrinology, 74, 67-72.
ROMERO-CORRAL, A., SOMERS, V. K., SIERRA-JOHNSON, J., THOMAS, R. J., COLLAZO-CLAVELL, M., KORINEK, J. E. C., ALLISON, T. G., BATSIS, J., SERT-KUNIYOSHI, F. & LOPEZ-JIMENEZ, F. 2008. Accuracy of body mass index in diagnosing obesity in the adult general population. International journal of obesity, 32, 959-966.
ROPERT, A., CHERBUT, C., ROZE, C., LE QUELLEC, A., HOLST, J., FU-CHENG, X., DES VARANNES, S. B. & GALMICHE, J. 1996. Colonic fermentation and proximal gastric tone in humans. Gastroenterology, 111, 289-296.
RUIJSCHOP, R. M., BOELRIJK, A. E. & TE GIFFEL, M. C. 2008. Satiety effects of a dairy beverage fermented with propionic acid bacteria. International Dairy Journal, 18, 945-950.
SA'AD, H., PEPPELENBOSCH, M. P., ROELOFSEN, H., VONK, R. J. & VENEMA, K. 2010. Biological effects of propionic acid in humans; metabolism, potential applications and underlying mechanisms. Biochimica et Biophysica Acta (BBA)-Molecular and Cell Biology of Lipids, 1801, 1175-1183.
SACKS, D. B., BRUNS, D. E., GOLDSTEIN, D. E., MACLAREN, N. K., MCDONALD, J. M. & PARROTT, M. 2002. Guidelines and recommendations for laboratory analysis in the diagnosis and management of diabetes mellitus. Clinical chemistry, 48, 436-472.
SAMUEL, B. S., SHAITO, A., MOTOIKE, T., REY, F. E., BACKHED, F., MANCHESTER, J. K., HAMMER, R. E., WILLIAMS, S. C., CROWLEY, J. & YANAGISAWA, M. 2008. Effects of the gut microbiota on host adiposity are modulated by the short-chain fatty-acid binding G protein-coupled receptor, Gpr41. Proceedings of the National Academy of Sciences, 105, 16767-16772.
SAMUELSSON, L. M., YOUNG, W., FRASER, K., TANNOCK, G. W., LEE, J. & ROY, N. C. 2016. Digestive-resistant carbohydrates affect lipid metabolism in rats. Metabolomics, 12, 79.

299
SATOH, N., OGAWA, Y., KATSUURA, G., TSUJI, T., MASUZAKI, H., HIRAOKA, J., OKAZAKI, T., TAMAKI, M., HAYASE, M. & YOSHIMASA, Y. 1997. Pathophysiological significance of the obese gene product, leptin, in ventromedial hypothalamus (VMH)-lesioned rats: evidence for loss of its satiety effect in VMH-lesioned rats. Endocrinology, 138, 947-954.
SAVONA-VENTURA, C. & SAVONA-VENTURA, S. 2015. The inheritance of obesity. Best Practice & Research Clinical Obstetrics & Gynaecology, 29, 300-308.
SCHEPPACH, W., POMARE, E., ELIA, M. & CUMMINGS, J. 1991. The contribution of the large intestine to blood acetate in man. Clinical science (London, England: 1979), 80, 177-182.
SCHÖNFELD, P. & WOJTCZAK, L. 2016. Short-and medium-chain fatty acids in energy metabolism: the cellular perspective. Journal of lipid research, 57, 943-954.
SCHUTZ, Y. 2011. Protein turnover, ureagenesis and gluconeogenesis. International Journal for Vitamin and Nutrition Research, 81, 101.
SCHWARTZ, S. E., LEVINE, R. A., WEINSTOCK, R. S., PETOKAS, S., MILLS, C. A. & THOMAS, F. 1988. Sustained pectin ingestion: effect on gastric emptying and glucose tolerance in non-insulin-dependent diabetic patients. The American journal of clinical nutrition, 48, 1413-1417.
SCHWIERTZ, A., TARAS, D., SCHÄFER, K., BEIJER, S., BOS, N. A., DONUS, C. & HARDT, P. D. 2010. Microbiota and SCFA in lean and overweight healthy subjects. Obesity, 18, 190-195.
SERAVALLE, G., DIMITRIADIS, K., DELL’ORO, R. & GRASSI, G. 2013. How to assess sympathetic nervous system activity in clinical practice. Current clinical pharmacology, 8, 182-188.
SERKOVA, N. J., STANDIFORD, T. J. & STRINGER, K. A. 2011. The emerging field of quantitative blood metabolomics for biomarker discovery in critical illnesses. American journal of respiratory and critical care medicine, 184, 647-655.
SHARMA, A. M. & PADWAL, R. 2010. Obesity is a sign–over‐eating is a symptom: an aetiological framework for the assessment and management of obesity. Obesity reviews, 11, 362-370.
SHIN, H. J., ANZAI, N., ENOMOTO, A., HE, X., KIM, D. K., ENDOU, H. & KANAI, Y. 2007. Novel liver‐specific organic anion transporter OAT7 that operates the exchange of sulfate conjugates for short chain fatty acid butyrate. Hepatology, 45, 1046-1055.
SINGH, A., ZAPATA, R. C., PEZESHKI, A., REIDELBERGER, R. D. & CHELIKANI, P. K. 2018. Inulin fiber dose-dependently modulates energy balance, glucose tolerance, gut microbiota, hormones and diet preference in high-fat-fed male rats. The Journal of nutritional biochemistry, 59, 142-152.
SIRAGUSA, R., CERDA, J., BAIG, M., BURGIN, C. & ROBBINS, F. 1988. Methanol production from the degradation of pectin by human colonic bacteria. The American journal of clinical nutrition, 47, 848-851.
SIRI-TARINO, P. W., CHIU, S., BERGERON, N. & KRAUSS, R. M. 2015. Saturated fats versus polyunsaturated fats versus carbohydrates for cardiovascular disease prevention and treatment. Annual review of nutrition, 35, 517-543.
SJAARDA, L. G., BACHA, F., LEE, S., TFAYLI, H., ANDREATTA, E. & ARSLANIAN, S. 2012. Oral disposition index in obese youth from normal to prediabetes to diabetes: relationship to clamp disposition index. The Journal of pediatrics, 161, 51-57.
SKRZYDLEWSKA, E. 2003. Toxicological and metabolic consequences of methanol poisoning. Toxicology mechanisms and methods, 13, 277-293.
SLAVIN, J. & GREEN, H. 2007. Dietary fibre and satiety. Nutrition Bulletin, 32, 32-42.
300
SO, P.-W., YU, W.-S., KUO, Y.-T., WASSERFALL, C., GOLDSTONE, A. P., BELL, J. D. & FROST, G. 2007. Impact of resistant starch on body fat patterning and central appetite regulation. PLoS One, 2, e1309.
SOLOMON, S. J., KURZER, M. S. & CALLOWAY, D. H. 1982. Menstrual cycle and basal metabolic rate in women. The American journal of clinical nutrition, 36, 611-616.
SONDERMEIJER, B. M., BATTJES, S., VAN DIJK, T. H., ACKERMANS, M. T., SERLIE, M. J., NIEUWDORP, M., GROEN, A. K., DALLINGA-THIE, G. M. & STROES, E. S. 2013. Lactate increases hepatic secretion of VLDL-triglycerides in humans. Atherosclerosis, 228, 443-450.
SOWAH, S. A., HIRCHE, F., MILANESE, A., JOHNSON, T. S., GRAFETSTÄTTER, M., SCHÜBEL, R., KIRSTEN, R., ULRICH, C. M., KAAKS, R. & ZELLER, G. 2020. Changes in Plasma Short-Chain Fatty Acid Levels after Dietary Weight Loss among Overweight and Obese Adults over 50 Weeks. Nutrients, 12, 452.
SOWAH, S. A., RIEDL, L., DAMMS-MACHADO, A., JOHNSON, T. S., SCHÜBEL, R., GRAF, M., KARTAL, E., ZELLER, G., SCHWINGSHACKL, L. & STANGL, G. I. 2019. Effects of Weight-Loss Interventions on Short-Chain Fatty Acid Concentrations in Blood and Feces of Adults: A Systematic Review. Advances in Nutrition, 10, 673-684.
SQUIRES, P. E., RUMSEY, R., EDWARDS, C. & READ, N. 1992. Effect of short-chain fatty acids on contractile activity and fluid flow in rat colon in vitro. American Journal of Physiology-Gastrointestinal and Liver Physiology, 262, G813-G817.
STEPHEN, A. M., CHAMP, M. M.-J., CLORAN, S. J., FLEITH, M., VAN LIESHOUT, L., MEJBORN, H. & BURLEY, V. J. 2017. Dietary fibre in Europe: Current state of knowledge on definitions, sources, recommendations, intakes and relationships to health. Nutrition research reviews, 30, 149-190.
STUBBS, R. J., HUGHES, D. A., JOHNSTONE, A. M., ROWLEY, E., REID, C., ELIA, M., STRATTON, R., DELARGY, H., KING, N. & BLUNDELL, J. 2000. The use of visual analogue scales to assess motivation to eat in human subjects: a review of their reliability and validity with an evaluation of new hand-held computerized systems for temporal tracking of appetite ratings. British Journal of Nutrition, 84, 405-415.
STUNKARD, A. J., HARRIS, J. R., PEDERSEN, N. L. & MCCLEARN, G. E. 1990. The body-mass index of twins who have been reared apart. New England journal of medicine, 322, 1483-1487.
SUKKAR, A. H., LETT, A. M., FROST, G. & CHAMBERS, E. 2019. Regulation of energy expenditure and substrate oxidation by short chain fatty acids. J Endocrinol.
SUN, G., VASDEV, S., MARTIN, G. R., GADAG, V. & ZHANG, H. 2005. Altered calcium homeostasis is correlated with abnormalities of fasting serum glucose, insulin resistance, and β-cell function in the Newfoundland population. Diabetes, 54, 3336-3339.
SUNARTI, S. L. S. R., RUBI, D. S., MIFTAKHUSSOLIKHAH, D. A. & SINORITA, H. 2019. Fiber Increases Endogenous Insulin and Reduces Insulin Resistance in Diabetes. Pakistan Journal of Nutrition, 18, 895-899.
TANG, C., AHMED, K., GILLE, A., LU, S., GRÖNE, H.-J., TUNARU, S. & OFFERMANNS, S. 2015. Loss of FFA2 and FFA3 increases insulin secretion and improves glucose tolerance in type 2 diabetes. Nature medicine, 21, 173-177.
TAPPY, L., CAYEUX, M., SCHNEITER, P., SCHINDLER, C., TEMLER, E., JEQUIER, E. & CHIOLERO, R. 1995. Effects of lactate on glucose metabolism in healthy subjects and in severely injured hyperglycemic patients. American Journal of Physiology-Endocrinology and Metabolism, 268, E630-E635.

301
THIVEL, D., GENIN, P. M., MATHIEU, M.-E., PEREIRA, B. & METZ, L. 2016. Reproducibility of an in-laboratory test meal to assess ad libitum energy intake in adolescents with obesity. Appetite, 105, 129-133.
THOMPSON, D. S., BOYNE, M. S., OSMOND, C., FERGUSON, T. S., TULLOCH-REID, M. K., WILKS, R. J., BARNETT, A. T. & FORRESTER, T. E. 2014. Limitations of fasting indices in the measurement of insulin sensitivity in Afro-Caribbean adults. BMC research notes, 7, 98.
TIAN, L., SCHOLTE, J., BOREWICZ, K., VAN DEN BOGERT, B., SMIDT, H., SCHEURINK, A. J., GRUPPEN, H. & SCHOLS, H. A. 2016. Effects of pectin supplementation on the fermentation patterns of different structural carbohydrates in rats. Molecular nutrition & food research, 60, 2256-2266.
TIROSH, A., CALAY, E. S., TUNCMAN, G., CLAIBORN, K. C., INOUYE, K. E., EGUCHI, K., ALCALA, M., RATHAUS, M., HOLLANDER, K. S. & RON, I. 2019. The short-chain fatty acid propionate increases glucagon and FABP4 production, impairing insulin action in mice and humans. Science translational medicine, 11, eaav0120.
TODESCO, T., RAO, A. V., BOSELLO, O. & JENKINS, D. 1991. Propionate lowers blood glucose and alters lipid metabolism in healthy subjects. The American journal of clinical nutrition, 54, 860-865.
TOGNARELLI, J. M., DAWOOD, M., SHARIFF, M. I., GROVER, V. P., CROSSEY, M. M., COX, I. J., TAYLOR-ROBINSON, S. D. & MCPHAIL, M. J. 2015. Magnetic resonance spectroscopy: principles and techniques: lessons for clinicians. Journal of clinical and experimental hepatology, 5, 320-328.
TOLHURST, G., HEFFRON, H., LAM, Y. S., PARKER, H. E., HABIB, A. M., DIAKOGIANNAKI, E., CAMERON, J., GROSSE, J., REIMANN, F. & GRIBBLE, F. M. 2012. Short-chain fatty acids stimulate glucagon-like peptide-1 secretion via the G-protein–coupled receptor FFAR2. Diabetes, 61, 364-371.
URBAN, P. L. 2016. Quantitative mass spectrometry: an overview. The Royal Society. UȚOIU, E., MATEI, F., TOMA, A., DIGUȚĂ, C. F., ȘTEFAN, L. M., MĂNOIU, S.,
VRĂJMAȘU, V. V., MORARU, I., OANCEA, A. & ISRAEL-ROMING, F. 2018. Bee collected pollen with enhanced health benefits, produced by fermentation with a Kombucha consortium. Nutrients, 10, 1365.
UTZSCHNEIDER, K. M., PRIGEON, R. L., FAULENBACH, M. V., TONG, J., CARR, D. B., BOYKO, E. J., LEONETTI, D. L., MCNEELY, M. J., FUJIMOTO, W. Y. & KAHN, S. E. 2009. Oral disposition index predicts the development of future diabetes above and beyond fasting and 2-h glucose levels. Diabetes care, 32, 335-341.
VALSAMAKIS, G., CHETTY, R., ANWAR, A., BANERJEE, A., BARNETT, A. & KUMAR, S. 2004. Association of simple anthropometric measures of obesity with visceral fat and the metabolic syndrome in male Caucasian and Indo‐Asian subjects. Diabetic medicine, 21, 1339-1345.
VAN BLOEMENDAAL, L., TEN KULVE, J., LA FLEUR, S., IJZERMAN, R. & DIAMANT, M. 2014. Effects of glucagon-like peptide 1 on appetite and body weight: focus on the CNS. J Endocrinol, 221, T1-16.
VAN HALL, G. 2010. Lactate kinetics in human tissues at rest and during exercise. Acta physiologica, 199, 499-508.
VAN, Q. N., ISSAQ, H. J., JIANG, Q., LI, Q., MUSCHIK, G. M., WAYBRIGHT, T. J., LOU, H., DEAN, M., UITTO, J. & VEENSTRA, T. D. 2008. Comparison of 1D and 2D NMR spectroscopy for metabolic profiling. Journal of proteome research, 7, 630-639.

302
VENABLES, M. C., ACHTEN, J. & JEUKENDRUP, A. E. 2005. Determinants of fat oxidation during exercise in healthy men and women: a cross-sectional study. Journal of applied physiology.
VENTER, C. S., VORSTER, H. H. & CUMMINGS, J. H. 1990. Effects of dietary propionate on carbohydrate and lipid metabolism in healthy volunteers. American Journal of Gastroenterology, 85.
VENTI, C. A., VOTRUBA, S. B., FRANKS, P. W., KRAKOFF, J. & SALBE, A. D. 2010. Reproducibility of ad libitum energy intake with the use of a computerized vending machine system. The American journal of clinical nutrition, 91, 343-348.
VERBRUGGHE, A., HESTA, M., DAMINET, S., POLIS, I., HOLST, J. J., BUYSE, J., WUYTS, B. & JANSSENS, G. 2012. Propionate absorbed from the colon acts as gluconeogenic substrate in a strict carnivore, the domestic cat (Felis catus). Journal of animal physiology and animal nutrition, 96, 1054-1064.
VERDICH, C., FLINT, A., GUTZWILLER, J.-P., NASLUND, E., BEGLINGER, C., HELLSTROM, P., LONG, S., MORGAN, L., HOLST, J. & ASTRUP, A. 2001. A meta-analysis of the effect of glucagon-like peptide-1 (7–36) amide on ad libitum energy intake in humans. The Journal of Clinical Endocrinology & Metabolism, 86, 4382-4389.
VILSBØLL, T. 2009. The effects of glucagon‐like peptide‐1 on the beta cell. Diabetes, Obesity and Metabolism, 11, 11-18.
VOGT, J. A. & WOLEVER, T. M. 2003. Fecal acetate is inversely related to acetate absorption from the human rectum and distal colon. The Journal of nutrition, 133, 3145-3148.
WALTER, J., LEONARD, J., THOMPSON, G., BARTLETT, K. & HALLIDAY, D. 1989. Contribution of aminoacid catabolism to propionate production in methylmalonic acidaemia. The Lancet, 333, 1298-1299.
WAMBACQ, W., RYBACHUK, G., JEUSETTE, I., ROCHUS, K., WUYTS, B., FIEVEZ, V., NGUYEN, P. & HESTA, M. 2016. Fermentable soluble fibres spare amino acids in healthy dogs fed a low-protein diet. BMC veterinary research, 12, 130.
WANDERS, A. J., VAN DEN BORNE, J. J., DE GRAAF, C., HULSHOF, T., JONATHAN, M. C., KRISTENSEN, M., MARS, M., SCHOLS, H. A. & FESKENS, E. J. 2011. Effects of dietary fibre on subjective appetite, energy intake and body weight: a systematic review of randomized controlled trials. Obesity reviews, 12, 724-739.
WARD, J. L., BAKER, J. M. & BEALE, M. H. 2007. Recent applications of NMR spectroscopy in plant metabolomics. The FEBS journal, 274, 1126-1131.
WEICKERT, M. O., MÖHLIG, M., SCHÖFL, C., ARAFAT, A. M., OTTO, B., VIEHOFF, H., KOEBNICK, C., KOHL, A., SPRANGER, J. & PFEIFFER, A. F. 2006. Cereal fiber improves whole-body insulin sensitivity in overweight and obese women. Diabetes care, 29, 775-780.
WEIR, J. D. V. 1949. New methods for calculating metabolic rate with special reference to protein metabolism. The Journal of physiology, 109, 1-9.
WEITKUNAT, K., SCHUMANN, S., PETZKE, K. J., BLAUT, M., LOH, G. & KLAUS, S. 2015. Effects of dietary inulin on bacterial growth, short-chain fatty acid production and hepatic lipid metabolism in gnotobiotic mice. The Journal of nutritional biochemistry, 26, 929-937.
WESTERTERP, K. R. 2004. Diet induced thermogenesis. Nutrition & metabolism, 1, 5. WESTERTERP, K. R. 2017. Doubly labelled water assessment of energy expenditure:
principle, practice, and promise. European journal of applied physiology, 117, 1277-1285.

303
WHELAN, K., EFTHYMIOU, L., JUDD, P. A., PREEDY, V. R. & TAYLOR, M. A. 2006. Appetite during consumption of enteral formula as a sole source of nutrition: the effect of supplementing pea-fibre and fructo-oligosaccharides. British journal of nutrition, 96, 350-356.
WHITLOCK, G., LEWINGTON, S., SHERLIKER, P., CLARKE, R., EMBERSON, J., HALSEY, J., QIZILBASH, N., COLLINS, R. & PETO, R. 2009. Body-mass index and cause-specific mortality in 900 000 adults: collaborative analyses of 57 prospective studies. Lancet, 373, 1083-96.
WICKS, J. R., OLDRIDGE, N. B., NIELSEN, L. K. & VICKERS, C. E. 2011. HR index-a simple method for the prediction of oxygen uptake. Medicine & Science in Sports & Exercise, 43, 2005-2012.
WIESSING, K. R., XIN, L., MCGILL, A.-T., BUDGETT, S. C., STRIK, C. M. & POPPITT, S. D. 2012. Sensitivity of ad libitum meals to detect changes in hunger. Restricted-item or multi-item testmeals in the design of preload appetite studies. Appetite, 58, 1076-1082.
WISHART, D. S. 2016. Emerging applications of metabolomics in drug discovery and precision medicine. Nature reviews Drug discovery, 15, 473.
WOLEVER, T., BRIGHENTI, F., ROYALL, D., JENKINS, A. L. & JENKINS, D. J. 1989. Effect of rectal infusion of short chain fatty acids in human subjects. American Journal of Gastroenterology, 84.
WOLEVER, T., SPADAFORA, P. J., CUNNANE, S. C. & PENCHARZ, P. B. 1995. Propionate inhibits incorporation of colonic [1, 2-13C] acetate into plasma lipids in humans. The American journal of clinical nutrition, 61, 1241-1247.
WOLEVER, T. M., JOSSE, R. G., LEITER, L. A. & CHIASSON, J.-L. 1997. Time of day and glucose tolerance status affect serum short-chain fatty concentrations in humans. Metabolism, 46, 805-811.
WOLEVER, T. M., SPADAFORA, P. & ESHUIS, H. 1991. Interaction between colonic acetate and propionate in humans. The American journal of clinical nutrition, 53, 681-687.
WU, W., XIE, J. & ZHANG, H. 2016. Dietary fibers influence the intestinal SCFAs and plasma metabolites profiling in growing pigs. Food & function, 7, 4644-4654.
XIANG, A., WATANABE, R. & BUCHANAN, T. 2014. HOMA and Matsuda indices of insulin sensitivity: poor correlation with minimal model-based estimates of insulin sensitivity in longitudinal settings. Diabetologia, 57, 334-338.
XIONG, Y., MIYAMOTO, N., SHIBATA, K., VALASEK, M. A., MOTOIKE, T., KEDZIERSKI, R. M. & YANAGISAWA, M. 2004. Short-chain fatty acids stimulate leptin production in adipocytes through the G protein-coupled receptor GPR41. Proceedings of the National Academy of Sciences, 101, 1045-1050.
YAJIMA, T. 1984. Effect of sodium propionate on the contractile response of the rat ileum in situ. The Japanese Journal of Pharmacology, 35, 265-271.
YANG, T. C., GRYKA, A. A., AUCOTT, L. S., DUTHIE, G. G. & MACDONALD, H. M. 2017. Longitudinal study of weight, energy intake and physical activity change across two decades in older Scottish women. J Epidemiol Community Health, 71, 499-504.
YOON, M.-S. 2016. The emerging role of branched-chain amino acids in insulin resistance and metabolism. Nutrients, 8, 405.
YU, K., ZHANG, Y., CHEN, H. & ZHU, W. 2019. Hepatic Metabolomic and Transcriptomic Responses Induced by Cecal Infusion of Sodium Propionate in a Fistula Pig Model. Journal of agricultural and food chemistry, 67, 13073-13081.
ZAIBI, M. S., STOCKER, C. J., O'DOWD, J., DAVIES, A., BELLAHCENE, M., CAWTHORNE, M. A., BROWN, A. J., SMITH, D. M. & ARCH, J. R. 2010. Roles

304
of GPR41 and GPR43 in leptin secretory responses of murine adipocytes to short chain fatty acids. FEBS letters, 584, 2381-2386.
ZHAI, F., WANG, H., WANG, Z., POPKIN, B. M. & CHEN, C. 2008. Closing the energy gap to prevent weight gain in China. obesity reviews, 9, 107-112.
ZHANG, X.-W., LI, Q.-H. & DOU, J.-J. 2020. Mass spectrometry-based metabolomics in health and medical science: a systematic review. RSC Advances, 10, 3092-3104.
ZHAO, X., ZHENG, S., LI, Y., HUANG, J., ZHANG, W., XIE, Y., QIN, W. & QIAN, X. 2019. An Integrated Mass Spectroscopy Data Processing Strategy for Fast Identification, In-Depth, and Reproducible Quantification of Protein O-Glycosylation in a Large Cohort of Human Urine Samples. Analytical Chemistry, 92, 690-698.
ZHENG, Y., LEY, S. H. & HU, F. B. 2018. Global aetiology and epidemiology of type 2 diabetes mellitus and its complications. Nature Reviews Endocrinology, 14, 88.
ZHENG, Y., MANSON, J. E., YUAN, C., LIANG, M. H., GRODSTEIN, F., STAMPFER, M. J., WILLETT, W. C. & HU, F. B. 2017. Associations of weight gain from early to middle adulthood with major health outcomes later in life. Jama, 318, 255-269.
ZHU, X., ZHANG, X., GAO, X., YI, Y., HOU, Y., MENG, X., JIA, C., CHAO, B., FAN, W. & LI, X. 2020. Effects of Inulin Propionate Ester on Obesity-Related Metabolic Syndrome and Intestinal Microbial Homeostasis in Diet-Induced Obese Mice. ACS Omega.
ZYGMUNT, A. & STANCZYK, J. 2010. Methods of evaluation of autonomic nervous system function. Archives of medical science: AMS, 6, 11.
Appendices
Appendix 1:
Version 3- 04/04/18
REC Reference number: 230710

305
Information Sheet for Research Participants
The Acute Effect of Propionate on Energy Homeostasis
Study 1: The acute effects of propionate on energy metabolism during fasting
You will be given a copy of this Information Sheet and a signed copy of your consent form to keep,
should you decide to participate in the study.
You are being invited to take part in a research study investigating the role of dietary supplements
called propionate on energy metabolism during fasting. This study is being conducted as part of an
educational qualification at Imperial College London. Before you decide if you would like to
participate, it is important for you to understand why the research is being done and what it will
involve. Please take time to read the following information carefully and discuss it with your friends,
relatives and your GP if you wish. Ask us if there is anything that is not clear or if you would like more
information. Take time to decide whether or not you wish to take part.
If you do decide to take part, please let us know beforehand if you have been involved in any other
study during the last year. You are free to withdraw at any time without explanation.
Thank you for reading this
What is the purpose of this study?
High fibre diets are known to have health benefits and have been widely advertised as a method of
helping people to lose weight. We are investigating the major breakdown products of fibre, short
chain fatty acids (SCFA), which are produced naturally by the body via fermentation of dietary fibre by
the gut microbiota. SCFA are believed to contribute to the beneficial effects of dietary fibre on human
health. One of these SCFA, propionate, may have a role in improving glucose, insulin and fat levels in
the blood as well as increasing energy expenditure which are important obesity risk factors.

306
The aim of the study is to determine the effects of capsules containing propionate on the body’s
response to fasting. The propionate and placebo capsules used in this study have been prepared by
Quay Pharma, whose manufacturing areas meet the standards set out in the Good Manufacturing
Practices criteria:
https://www.quaypharma.com/. The capsules have been used in previous research involving human
volunteers and are well-tolerated with no side-effects.
Who is suitable to participate?
• Male and female healthy adults (aged 18 to 65 years)
• Healthy volunteers (body mass index (BMI) of 18-35 kg/m2)
o (BMI is equal to body weight (kg) divided by height squared (m2))
You are NOT suitable to participate if you have or are:
• Weight change of ≥ 3kg in the preceding 2 months
• A current smoker
• Substance abuse
• Excess alcohol intake
• Pregnancy
• Diabetes
• Cardiovascular disease
• Cancer
• Gastrointestinal disease e.g. inflammatory bowel disease or irritable bowel syndrome
• Kidney disease
• Liver disease
• Pancreatitis
• Started new medication within the last 3 months likely to interfere with energy metabolism,
appetite regulation and hormonal balance, including: anti-inflammatory drugs or steroids,
antibiotics, androgens, phenytoin, erythromycin or thyroid hormones.
• Involved in current research or have recently been involved in any research prior to
recruitment in the past 12 weeks.

307
It is entirely up to you whether or not to take part. If you do we will ask you to sign a consent form.
You are free to withdraw at any time and you do not have to give a reason. A decision either not to
take part or to withdraw from the study will not affect the standard of care you receive.
What will I have to do?
If you do decide to participate, the study will consist of 4 separate study visits. We request that you
do not start any new diets or intensive exercise regimes in-between the study visits as this may give
us conflicting results.
Visit 1- Health Screening
You will be asked to attend the NIHR Imperial Clinical Research Facility at Hammersmith Hospital
where you will be interviewed and examined by one of the research doctors. You will have a blood
test to check that you are not anaemic or diabetic and height and weight measurements and blood
pressure will be taken. You will also have an electrocardiogram (ECG). This is a non-invasive test to
look at the health of your heart. All women of child bearing age will have a pregnancy test. The health
screening should last about 1 hour.
Visits 2-4: Study Day
On the day before each study visit we will ask you to refrain from strenuous exercise, caffeine and
alcohol. You will then be requested to fast overnight (you are allowed to drink water).
On the study day, you will be asked to arrive at the NIHR/Wellcome Trust Imperial Clinical Research
Facility at Hammersmith Hospital at approximately 9:00am. A small plastic tube (cannula) will be
inserted into your arm. This will be in place for the duration of the study day and will be used to take
blood samples at regular intervals without causing you any further discomfort. A total of 110 ml of
blood (20 teaspoons) will be collected at each study visit.

308
Your resting energy expenditure will be collected throughout the study visit. This will involve a large,
clear Perspex calorimeter canopy being placed over your head and upper body to measure your
oxygen consumption for 20 min. We will demonstrate this to you during the initial health screening
visit.
Throughout the day, you will be asked to swallow capsules containing Propionate or a ‘placebo’. On
one of the visits the capsules will contain propionate and on the other two study visits the capsules
will contain the ‘placebo’. A ‘placebo’ is term used to describe a test or procedure that is used as a
control to measure the effectiveness of an intervention.
The study day should last approximately 6 hours and you will be able to go home at around 3:00 p.m.
The procedures collected during the study visit are summarised below:
We will also ask you to collect urine each time you go to the toilet during the study visits. You will be
provided with an appropriate measurement container to collect urine. During the course of the study
day you will be able to read or watch DVDs if you wish.
Will I get paid for participating?

309
You will be reimbursed for any inconvenience caused due to the study. You will receive £25 for
completing each of Study Visits 2-4. You would therefore receive payment of £75 for completing the
entire study.
What are the possible disadvantages and risks of taking part?
In the event that we discover something about your health that you were unaware of, for example if
your blood tests are abnormal, we would immediately inform you of this and inform your GP so that
you can be referred to an appropriate specialist. If you require more urgent assessment we would
arrange this for you immediately within the hospital.
Some of the procedures in this study, such as the recording of your weight, height and blood pressure
present no risk to you. Other procedures, such as taking blood samples, can cause mild discomfort.
The risks of taking a blood sample include: slight discomfort when the needle is inserted and possible
bruising and a localised infection. These procedures will only be carried out by experienced doctors
under aseptic conditions to minimise all these risks.
There are no major side effects associated with taking the propionate capsules. Propionate are
produced naturally in the gut following fermentation of foods which have high levels of non-digestible
fibre e.g. fruits and vegetables. Propionate are widely used in the food industry as a preservative and
as a natural component of food. The total dose of Propionate used in this study (5 grams) has been
used in previous research involving human volunteers and is well-tolerated with no side-effects.
Who has reviewed this study?
This study was reviewed and received favourable opinion by London - Bloomsbury Research Ethics
Committee.
What happens when the research study stops?

310
Once the study has finished, the results of the study can be made available to you and/or your GP. If
you have any problems immediately following the study, then you should contact one of the research
doctors on the numbers provided.
What if new information becomes available?
Sometimes during the course of a research study, new information becomes available about the
treatment that is being studied. If this happens, your research doctor will tell you about it and discuss
with you whether you want to continue in the study. If you decide to continue in the study you will be
asked to sign an updated consent form. Also, on receiving new information your research doctor might
consider it to be in your best interests to withdraw you from the study.
What will happen if I don’t want to carry on with the study?
You can withdraw from the study at any time and you do not need to give a reason. Any stored blood
or urine samples that can still be identified as yours will be destroyed.
Who is funding and organising the study?
This study is being funded and conducted as part of an educational qualification at Imperial College
London.
What if something goes wrong?
Imperial College London holds insurance policies which apply to this study. If you experience serious
and enduring harm or injury as a result of taking part in this study, you may be eligible to claim
compensation without having to prove that Imperial College is at fault. This does not affect your legal
rights to seek compensation.
If you are harmed due to someone’s negligence, then you may have grounds for a legal action.
Regardless of this, if you wish to complain, or have any concerns about any aspect of the way you have

311
been treated during the course of this study then you should immediately inform the Investigator
(Professor Gary Frost; [email protected]; 020 8383 3242). The normal National Health Service
complaint complaints mechanisms are also available to you. If you are still not satisfied with the
response, you may contact the Imperial AHSC Joint Research Compliance Office.
What steps would you take if you have given an informed consent but by an unlikely chance, you lose capacity to consent during the study?
All your identifiable data or tissue collected would be withdrawn from the study. Data or tissue
which is not identifiable to the research team may be retained.
What can I do if I have any complaints or concerns?
If you wish to complain, or have any concerns about any aspect of the way you have been treated
during the course of this study then you should immediately inform the Principal Investigator,
Professor Gary Frost, through his secretary on 020 8383 3242 or by email at [email protected]
Will my taking part in this study be kept confidential?
All information that is collected about you during the course of the research will be kept strictly
confidential. Any information about you that leaves the hospital will have your name and address
removed so that you cannot be recognised from it.
All electronic data about you will be stored on Imperial College London and Imperial College
Healthcare NHS Trust departmental database. This is a confidential computer system which requires
a specific password for access and can only be viewed by authorised persons. It is a requirement that
your GP is informed of your participation in this study.
What will happen to the results of the research study?
The results are likely to be published six months following the study. Your confidentiality will be
ensured at all times and you will not be identified in any publication. At the end of the study, the
results of the study can be made available to you and/or your GP.

312
What would happen to my samples once the study has been completed?
With your consent, your samples will be stored and may be used in future ethically approved studies
whilst keeping your samples unidentifiable to future researchers. If you would prefer, your samples
will be disposed at the end of the study in accordance with the Human Tissue Authority’s Code of
Practice.
Contact for Further Information
The researchers and doctors involved in the study, Professor Gary Frost and Dr. Ed Chambers, will be
available by telephone
During working hours through Professor Gary Frost’s secretary 020 8383 3242
At all other times through Hammersmith Hospital switchboard 020 8383 1000
Appendix 2:
Version 3- 04/04/18
REC Reference number: 230710
Information Sheet for Research Participants

313
The Acute Effect of Propionate on Energy Homeostasis
STUDY 2: The acute effects of propionate on energy metabolism during
exercise
You will be given a copy of this Information Sheet and a signed copy of your consent form to keep,
should you decide to participate in the study.
You are being invited to take part in a research study investigating the role of dietary supplements
called propionate on how the human body responds to exercise. This study is being conducted as part
of an educational qualification at Imperial College London. Before you decide if you would like to
participate, it is important for you to understand why the research is being done and what it will
involve. Please take time to read the following information carefully and discuss it with your friends,
relatives and your GP if you wish. Ask us if there is anything that is not clear or if you would like more
information. Take time to decide whether or not you wish to take part.
If you do decide to take part, please let us know beforehand if you have been involved in any other
study during the last year. You are free to withdraw at any time without explanation.
Thank you for reading this
What is the purpose of this study?
High fibre diets are known to have health benefits and have been widely advertised as a method of
helping people to lose weight. We are investigating the major breakdown products of fibre, short
chain fatty acids (SCFA), which are produced naturally by the body via fermentation of dietary fibre by
the gut microbiota. SCFA are believed to contribute to the beneficial effects of dietary fibre on human
health. One of these SCFA, propionate may have a role in improving glucose, insulin and fat levels in
the blood as well as increasing energy expenditure which are important obesity risk factors.
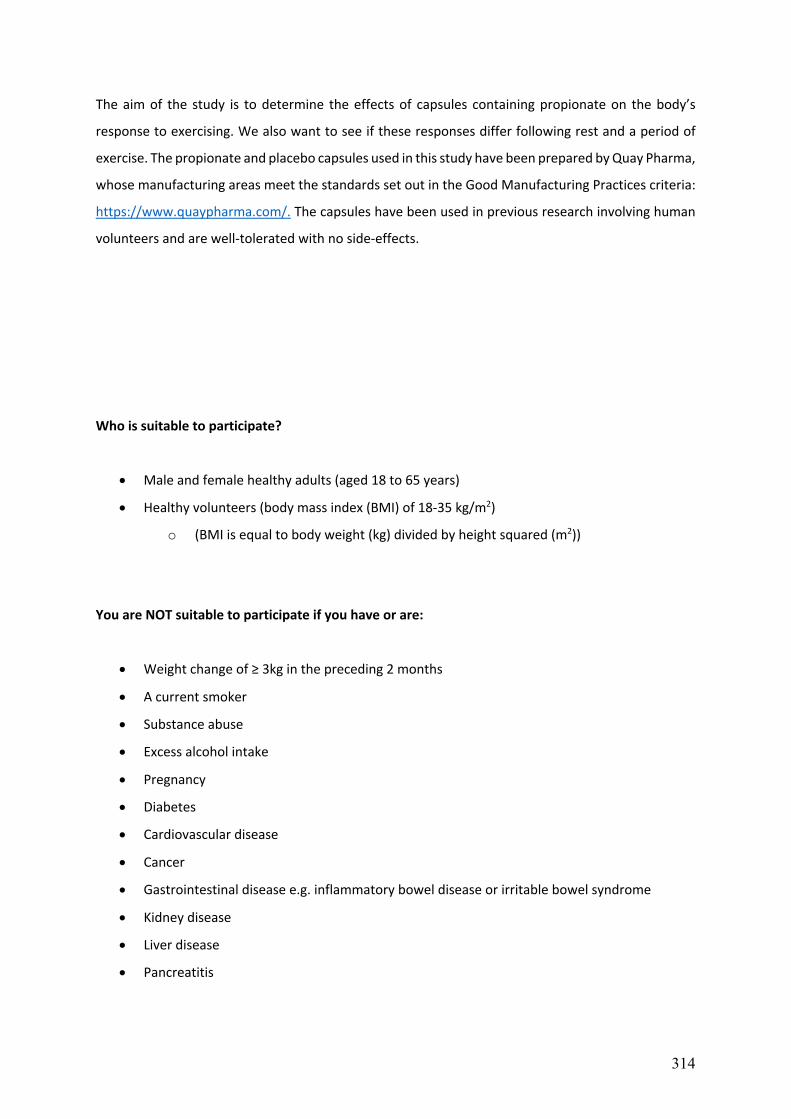
314
The aim of the study is to determine the effects of capsules containing propionate on the body’s
response to exercising. We also want to see if these responses differ following rest and a period of
exercise. The propionate and placebo capsules used in this study have been prepared by Quay Pharma,
whose manufacturing areas meet the standards set out in the Good Manufacturing Practices criteria:
https://www.quaypharma.com/. The capsules have been used in previous research involving human
volunteers and are well-tolerated with no side-effects.
Who is suitable to participate?
• Male and female healthy adults (aged 18 to 65 years)
• Healthy volunteers (body mass index (BMI) of 18-35 kg/m2)
o (BMI is equal to body weight (kg) divided by height squared (m2))
You are NOT suitable to participate if you have or are:
• Weight change of ≥ 3kg in the preceding 2 months
• A current smoker
• Substance abuse
• Excess alcohol intake
• Pregnancy
• Diabetes
• Cardiovascular disease
• Cancer
• Gastrointestinal disease e.g. inflammatory bowel disease or irritable bowel syndrome
• Kidney disease
• Liver disease
• Pancreatitis

315
• Started new medication within the last 3 months likely to interfere with energy metabolism,
appetite regulation and hormonal balance, including: anti-inflammatory drugs or steroids,
antibiotics, androgens, phenytoin, erythromycin or thyroid hormones.
• Involved in current research or have recently been involved in any research prior to
recruitment in the past 12 weeks.
It is entirely up to you whether or not to take part. If you do we will ask you to sign a consent form.
You are free to withdraw at any time and you do not have to give a reason. A decision either not to
take part or to withdraw from the study will not affect the standard of care you receive.
What will I have to do?
If you do decide to participate, the study will consist of 5 separate study visits. We request that you
do not start any new diets or intensive exercise regimes in-between the study visits as this may give
us conflicting results.
Visit 1- Health Screening
You will be asked to attend the NIHR Imperial Clinical Research Facility at Hammersmith Hospital
where you will be interviewed and examined by one of the research doctors. You will have a blood
test to check that you are not anaemic or diabetic and height and weight measurements and blood
pressure will be taken. You will also have an electrocardiogram (ECG). This is a non-invasive test to
look at the health of your heart. All women of child bearing age will have a pregnancy test. The health
screening should last about 1 hour.
Visit 2 - Maximal Exercise Test
This visit is to determine your maximal oxygen uptake (VO2 max) and power output. Following a five-
minute warm up you will exercise on an exercise bike until you reach your limit of endurance. The
workload increases every 3 minutes until you are unable to continue. Your breathing will be measured

316
through a mouthpiece during the test. Water will be freely available and the visit will last no longer
than 1 hour.
Visits 3-5: Study Day
On the day before each study visit we will ask you to refrain from strenuous exercise, caffeine and
alcohol. You will then be requested to fast overnight (you are allowed to drink water).
On the study day, you will be asked to arrive at the NIHR/Wellcome Trust Imperial Clinical Research
Facility at Hammersmith Hospital at approximately 9:00am. A small plastic tube (cannula) will be
inserted into your arm. This will be in place for the duration of the study day and will be used to take
blood samples at regular intervals without causing you any further discomfort. A total of 100 ml of
blood (20 teaspoons) will be collected at each study visit.
Your resting energy expenditure will be collected throughout the study visit. This will involve a large,
clear Perspex calorimeter canopy being placed over your head and upper body to measure your
oxygen consumption for 20 min. We will demonstrate this to you during the initial health screening
visit.
Throughout the day, you will be asked to swallow capsules containing propionate or a ‘placebo’. On
one of the visits, the capsules will contain propionate and on the other study visits the capsule will
contain the ‘placebo’. A ‘placebo’ is term used to describe a test or procedure that is used as a control
to measure the effectiveness of an intervention.
Three hours after ingesting the first capsule you will be asked to complete 60 min of cycling at a
workload equivalent to 40% of your maximum power output (determined from Visit 2). This is light-
intensity exercise (equivalent to a brisk walking) and shouldn’t feel too strenuous. Throughout the
exercise you will be asked to breathe through a mouthpiece connected to the calorimeter. Your heart
rate will also be recorded throughout the exercise period.
The study day should last approximately 6 hours and you will be able to go home at around 3:00 p.m.
The procedures collected during the study visit are summarised below:

317
We will also ask you to collect urine each time you go to the toilet during the study visits. You will be
provided with an appropriate measurement container to collect urine. During the course of the study
day you will be able to read or watch DVDs if you wish.
Will I get paid for participating?
You will be reimbursed for any inconvenience caused due to the study. You will receive £25 for
completing each of Study Visits 2-5. You would therefore receive payment of £100 for completing the
entire study.
What are the possible disadvantages and risks of taking part?
In the event that we discover something about your health that you were unaware of, for example if
your blood tests are abnormal, we would immediately inform you of this and inform your GP so that
you can be referred to an appropriate specialist. If you require more urgent assessment we would
arrange this for you immediately within the hospital.

318
Some of the procedures in this study, such as the recording of your weight, height and blood pressure
present no risk to you. Other procedures, such as taking blood samples, can cause mild discomfort.
The risks of taking a blood sample include: slight discomfort when the needle is inserted and possible
bruising and a localised infection. These procedures will only be carried out by experienced doctors
under aseptic conditions to minimise all these risks.
During Visits 2-5 you will experience sensations associated with exercise but these will constitute no
greater a risk than your usual exercise activities.
There are no major side effects associated with taking the propionate capsules. Propionate is
produced naturally in the gut following fermentation of foods which have high levels of non-digestible
fibre e.g. fruits and vegetables. Propionate are widely used in the food industry as a preservative and
as a natural component of food. The total dose of propionate used in this study (5 grams) has been
used in previous research involving human volunteers and is well-tolerated with no side-effects.
Who has reviewed this study?
This study was reviewed and received favourable opinion by London - Bloomsbury Research Ethics
Committee.
What happens when the research study stops?
Once the study has finished, the results of the study can be made available to you and/or your GP. If
you have any problems immediately following the study, then you should contact one of the research
doctors on the numbers provided.
What if new information becomes available?
Sometimes during the course of a research study, new information becomes available about the
treatment that is being studied. If this happens, your research doctor will tell you about it and discuss
with you whether you want to continue in the study. If you decide to continue in the study you will be

319
asked to sign an updated consent form. Also, on receiving new information your research doctor might
consider it to be in your best interests to withdraw you from the study.
What will happen if I don’t want to carry on with the study?
You can withdraw from the study at any time and you do not need to give a reason. Any stored blood
or urine samples that can still be identified as yours will be destroyed.
Who is funding and organising the study?
This study is being funded and conducted as part of an educational qualification at Imperial College
London.
What if something goes wrong?
Imperial College London holds insurance policies which apply to this study. If you experience serious
and enduring harm or injury as a result of taking part in this study, you may be eligible to claim
compensation without having to prove that Imperial College is at fault. This does not affect your legal
rights to seek compensation.
If you are harmed due to someone’s negligence, then you may have grounds for a legal action.
Regardless of this, if you wish to complain, or have any concerns about any aspect of the way you have
been treated during the course of this study then you should immediately inform the Investigator
(Professor Gary Frost; [email protected]; 020 8383 3242). The normal National Health Service
complaint complaints mechanisms are also available to you. If you are still not satisfied with the
response, you may contact the Imperial AHSC Joint Research Compliance Office.
What can I do if I have any complaints or concerns?

320
If you wish to complain, or have any concerns about any aspect of the way you have been treated
during the course of this study then you should immediately inform the Principal Investigator,
Professor Gary Frost, through his secretary on 020 8383 3242 or by email at [email protected]
Will my taking part in this study be kept confidential?
All information that is collected about you during the course of the research will be kept strictly
confidential. Any information about you that leaves the hospital will have your name and address
removed so that you cannot be recognised from it.
All electronic data about you will be stored on Imperial College London and Imperial College
Healthcare NHS Trust departmental database. This is a confidential computer system which requires
a specific password for access and can only be viewed by authorised persons. It is a requirement that
your GP is informed of your participation in this study.
What will happen to the results of the research study?
The results are likely to be published six months following the study. Your confidentiality will be
ensured at all times and you will not be identified in any publication. At the end of the study, the
results of the study can be made available to you and/or your GP.
What would happen to my samples once the study has been completed?
With your consent, your samples will be stored and may be used in future ethically approved studies
whilst keeping your samples unidentifiable to future researchers. If you would prefer, your samples
will be disposed at the end of the study in accordance with the Human Tissue Authority’s Code of
Practice.
Contact for Further Information
The researchers and doctors involved in the study, Professor Gary Frost and Dr. Ed Chambers, will be
available by telephone
During working hours through Professor Gary Frost’s secretary 020 8383 3242

321
At all other times through Hammersmith Hospital switchboard 020 8383 1000
Appendix 3:
Version 3- 04/04/18
REC Reference number: 230710

322
Information Sheet for Research Participants
The Acute Effect of Propionate on Energy Homeostasis
Study 3: The acute effects of propionate on postprandial metabolism
You will be given a copy of this Information Sheet and a signed copy of your consent form to keep,
should you decide to participate in the study.
You are being invited to take part in a research study investigating the role of dietary supplements
called propionate on how the human body responds to ingesting a sugary drink. This study is being
conducted as part of an educational qualification at Imperial College London. Before you decide if you
would like to participate, it is important for you to understand why the research is being done and
what it will involve. Please take time to read the following information carefully and discuss it with
your friends, relatives and your GP if you wish. Ask us if there is anything that is not clear or if you
would like more information. Take time to decide whether or not you wish to take part.
If you do decide to take part, please let us know beforehand if you have been involved in any other
study during the last year. You are free to withdraw at any time without explanation.
Thank you for reading this
What is the purpose of this study?
High fibre diets are known to have health benefits and have been widely advertised as a method of
helping people to lose weight. We are investigating the major breakdown products of fibre, short
chain fatty acids (SCFA), which are produced naturally by the body via fermentation of dietary fibre by
the gut microbiota. SCFA are believed to contribute to the beneficial effects of dietary fibre on human
health. One of these SCFA, propionate, may have a role in improving glucose, insulin and fat levels in
the blood as well as increasing energy expenditure which are important obesity risk factors.

323
The aim of the study is to determine the effects of capsules containing propionate on the body’s
response to ingesting a sugary drink. We also want to see if these responses differ following rest and
following a meal. The propionate and placebo capsules used in this study have been prepared by Quay
Pharma, whose manufacturing areas meet the standards set out in the Good Manufacturing Practices
criteria: https://www.quaypharma.com/. The capsules have been used in previous research involving
human volunteers and are well-tolerated with no side-effects.
Who is suitable to participate?
• Male and female healthy adults (aged 18 to 65 years)
• Healthy volunteers (body mass index (BMI) of 18-35 kg/m2)
o (BMI is equal to body weight (kg) divided by height squared (m2))
You are NOT suitable to participate if you have or are:
• Weight change of ≥ 3kg in the preceding 2 months
• A current smoker
• Substance abuse
• Excess alcohol intake
• Pregnancy
• Diabetes
• Cardiovascular disease
• Cancer
• Gastrointestinal disease e.g. inflammatory bowel disease or irritable bowel syndrome
• Kidney disease
• Liver disease
• Pancreatitis
• Started new medication within the last 3 months likely to interfere with energy metabolism,
appetite regulation and hormonal balance, including: anti-inflammatory drugs or steroids,
antibiotics, androgens, phenytoin, erythromycin or thyroid hormones.
• Involved in current research or have recently been involved in any research prior to
recruitment in the past 12 weeks.

324
It is entirely up to you whether or not to take part. If you do we will ask you to sign a consent form.
You are free to withdraw at any time and you do not have to give a reason. A decision either not to
take part or to withdraw from the study will not affect the standard of care you receive.
What will I have to do?
If you do decide to participate, the study will consist of 4 separate study visits. We request that you
do not start any new diets or intensive exercise regimes in-between the study visits as this may give
us conflicting results.
Visit 1- Health Screening
You will be asked to attend the NIHR Trust Imperial Clinical Research Facility at Hammersmith Hospital
where you will be interviewed and examined by one of the research doctors. You will have a blood
test to check that you are not anaemic or diabetic and height and weight measurements and blood
pressure will be taken. You will also have an electrocardiogram (ECG). This is a non-invasive test to
look at the health of your heart. All women of child bearing age will have a pregnancy test. The health
screening should last about 1 hour.
Visits 2-4: Study Day
On the day before each study visit we will ask you to refrain from strenuous exercise, caffeine and
alcohol. You will then be requested to fast overnight (you are allowed to drink water).
On the study day, you will be asked to arrive at the NIHR/Wellcome Trust Imperial Clinical Research
Facility at Hammersmith Hospital at approximately 9:00am. A small plastic tube (cannula) will be
inserted into your arm. This will be in place for the duration of the study day and will be used to take
blood samples at regular intervals without causing you any further discomfort. A total of 100 ml of
blood (20 teaspoons) will be collected at each study visit.

325
Your resting energy expenditure will be collected throughout the study visit. This will involve a large,
clear Perspex calorimeter canopy being placed over your head and upper body to measure your
oxygen consumption for 20 min. We will demonstrate this to you during the initial health screening
visit.
Throughout the day, you will be asked to swallow capsules containing Propionate or a ‘placebo’. On
one of the visits the capsules will contain propionate and on the other two study visits the capsules
will contain the ‘placebo’. A ‘placebo’ is term used to describe a test or procedure that is used as a
control to measure the effectiveness of an intervention.
Three hours after ingesting the first capsule you will be asked to consume a mixed meal tolerance test
(500 kcal) will be given in the form of an “ Ensure” drink. This is known as an oral glucose tolerance
test (OGTT), and we will be measuring how quickly the sugar from the drink is cleared from your blood.
The study day should last approximately 6 hours and you will be able to go home at around 3:00 p.m.
The procedures collected during the study visit are summarised below:
We will also ask you to collect urine each time you go to the toilet during the study visits. You will be
provided with an appropriate measurement container to collect urine. During the course of the study
day you will be able to read or watch DVDs if you wish.

326
Will I get paid for participating?
You will be reimbursed for any inconvenience caused due to the study. You will receive £25 for
completing each of Study Visits 2-4. You would therefore receive payment of £75 for completing the
entire study.
What are the possible disadvantages and risks of taking part?
In the event that we discover something about your health that you were unaware of, for example if
your blood tests are abnormal, we would immediately inform you of this and inform your GP so that
you can be referred to an appropriate specialist. If you require more urgent assessment we would
arrange this for you immediately within the hospital.
Some of the procedures in this study, such as the recording of your weight, height and blood pressure
present no risk to you. Other procedures, such as taking blood samples, can cause mild discomfort.
The risks of taking a blood sample include: slight discomfort when the needle is inserted and possible
bruising and a localised infection. These procedures will only be carried out by experienced doctors
under aseptic conditions to minimise all these risks.
There are no major side effects associated with taking the propionate capsules. Propionate are
produced naturally in the gut following fermentation of foods which have high levels of non-digestible
fibre e.g. fruits and vegetables. Propionate are widely used in the food industry as a preservative and
as a natural component of food. The total dose of Propionate used in this study (5 grams) has been
used in previous research involving human volunteers and is well-tolerated with no side-effects.
Who has reviewed this study?

327
This study was reviewed and received favourable opinion by London - Bloomsbury Research Ethics
Committee.
What happens when the research study stops?
Once the study has finished, the results of the study can be made available to you and/or your GP. If
you have any problems immediately following the study, then you should contact one of the research
doctors on the numbers provided.
What if new information becomes available?
Sometimes during the course of a research study, new information becomes available about the
treatment that is being studied. If this happens, your research doctor will tell you about it and discuss
with you whether you want to continue in the study. If you decide to continue in the study you will be
asked to sign an updated consent form. Also, on receiving new information your research doctor might
consider it to be in your best interests to withdraw you from the study.
What will happen if I don’t want to carry on with the study?
You can withdraw from the study at any time and you do not need to give a reason. Any stored blood
or urine samples that can still be identified as yours will be destroyed.
Who is funding and organising the study?
This study is being funded and conducted as part of an educational qualification at Imperial College
London.
What if something goes wrong?

328
Imperial College London holds insurance policies which apply to this study. If you experience serious
and enduring harm or injury as a result of taking part in this study, you may be eligible to claim
compensation without having to prove that Imperial College is at fault. This does not affect your legal
rights to seek compensation.
If you are harmed due to someone’s negligence, then you may have grounds for a legal action.
Regardless of this, if you wish to complain, or have any concerns about any aspect of the way you have
been treated during the course of this study then you should immediately inform the Investigator
(Professor Gary Frost; [email protected]; 020 8383 3242). The normal National Health Service
complaint complaints mechanisms are also available to you. If you are still not satisfied with the
response, you may contact the Imperial AHSC Joint Research Compliance Office.
What steps would you take if you have given an informed consent but by an unlikely chance, you lose capacity to consent during the study?
All your identifiable data or tissue collected would be withdrawn from the study. Data or tissue
which is not identifiable to the research team may be retained.
What can I do if I have any complaints or concerns?
If you wish to complain, or have any concerns about any aspect of the way you have been treated
during the course of this study then you should immediately inform the Principal Investigator,
Professor Gary Frost, through his secretary on 020 8383 3242 or by email at [email protected]
Will my taking part in this study be kept confidential?
All information that is collected about you during the course of the research will be kept strictly
confidential. Any information about you that leaves the hospital will have your name and address
removed so that you cannot be recognised from it.
All electronic data about you will be stored on Imperial College London and Imperial College
Healthcare NHS Trust departmental database. This is a confidential computer system which requires
a specific password for access and can only be viewed by authorised persons. It is a requirement that
your GP is informed of your participation in this study.

329
What will happen to the results of the research study?
The results are likely to be published six months following the study. Your confidentiality will be
ensured at all times and you will not be identified in any publication. At the end of the study, the
results of the study can be made available to you and/or your GP.
What would happen to my samples once the study has been completed?
With your consent, your samples will be stored and may be used in future ethically approved studies
whilst keeping your samples unidentifiable to future researchers. If you would prefer, your samples
will be disposed at the end of the study in accordance with the Human Tissue Authority’s Code of
Practice.
Contact for Further Information
The researchers and doctors involved in the study, Professor Gary Frost and Dr. Ed Chambers, will be
available by telephone
During working hours through Professor Gary Frost’s secretary 020 8383 3242
At all other times through Hammersmith Hospital switchboard 020 8383 1000

330
Appendix 4:
Propionate Study Pre-screening Questionnaire
Age
Weight
Height
BMI
Have you gained or lost any weight
in the last 3 months? If yes, approximately how much weight
did you gain/lose and in what length of
time? Eg: I lost 3kg in 2 months.

331
Are you a smoker or ex-smoker?
Do you take any regular
medication?
Do you currently suffer from any
particular illness?
Have you taken part in any research
studies in the last 3 months?
Have you donated any blood in the
last 3 months?
Database details:
Full name
Date of birth
NHS number
Contact address
Phone number
Email address
Appendix 5:
Version 1 – 14/10/17 REC Reference number: 230710
Department of Investigative Medicine, HammersmithHospital Campus,
ImperialCollegeLondon
6th Floor, CommonwealthBuilding, Ducane Road,
W120NN
Tel 020 838 33242 Fax 020 838 33142
The Acute Effect of Propionate on Energy Homeostasis
STUDY 1: The acute effects of propionate on energy metabolism during fasting
Please initial the box if you agree with each statement.

332
1. I have been given the opportunity to ask questions and discuss the study
2. I have received satisfactory answers to all my questions
3. I have received enough information about the study
4. I confirm that I have read and understand the information sheet Version --------- date:------
“The acute effects of propionate on energy metabolism during fasting” for the above study.
5. I understand that my participation is voluntary and that I am free to withdraw at any time, without giving any reason, without my medical care or legal rights being affected.
6. I understand that sections of any of my research notes may be looked at by responsible
individuals from Imperial College, Imperial College NHS Healthcare Trust, and regulatory authorities
where it is relevant to my taking part in research. I give permission for these individuals to have access to my records.
7. I agree that that my Identifiable information can be stored on Imperial College London and Imperial College NHS Healthcare Trust computer systems.
8. I agree to have my GP informed about participating in this study and any incidental findings
9. I agree to have my blood taken.as detailed in the participant information sheet.
10. I agree to have my collected tissue samples stored and used in future ethically approved studies.
11. I agree to have my study data stored securely at Imperial College London and Imperial College NHS Healthcare Trust for 10 years following completion of the study.
12. I agree that in the event I lose capacity, my personal identifiable data/samples will not be retained and no
further data or samples will be collected. Data or tissue which is not identifiable to the research team may be
retained.

333
13. I agree to take part in this study.
________________________ ________________ ____________________ Name of Patient Date Signature
_________________________ ________________ ____________________
Name of Researcher Date Signature
1 for patient; 1 for researcher; 1 to be kept with hospital notes
Appendix 6:
Version 1 – 14/10/17 REC Reference number: 230710
Department of Investigative Medicine,
HammersmithHospital Campus,
ImperialCollegeLondon 6th Floor, CommonwealthBuilding,
Ducane Road,
W120NN Tel 020 838 33242
Fax 020 838 33142
The Acute Effect of Propionate on Energy Homeostasis
STUDY 2: The acute effects of propionate on energy metabolism during exercise
Please initial the box if you agree with each statement.

334
1. I have been given the opportunity to ask questions and discuss the study
2. I have received satisfactory answers to all my questions
3. I have received enough information about the study
4. I confirm that I have read and understand the information sheet Version --------- date:------ :
“The acute effects of propionate on energy metabolism during exercise” for the above study.
5. I understand that my participation is voluntary and that I am free to withdraw at any time, without giving any reason, without my medical care or legal rights being affected.
6. I understand that sections of any of my research notes may be looked at by responsible individuals from Imperial College, Imperial College NHS Healthcare Trust, and regulatory authorities
where it is relevant to my taking part in research. I give permission for these individuals to have
access to my records.
7. I agree that that my Identifiable information can be stored on Imperial College London and Imperial
College NHS Healthcare Trust computer systems.
8. I agree to have my GP informed about participating in this study and any incidental findings
9. I agree to have my blood taken as detailed in the participant information sheet.
10. I agree to have my collected tissue samples stored and used in future ethically approved studies.
11. I agree to have my study data stored securely at Imperial College and Imperial College NHS Healthcare Trust for
10 years following completion of the study.
12. I agree that in the event I lose capacity, my personal identifiable data/samples will not be retained and no
further data or samples will be collected. Data or tissue which is not identifiable to the research team may be
retained.
13. I agree to take part in this study.
335
________________________ ________________ ____________________
Name of Patient Date Signature
_________________________ ________________ ____________________
Name of Researcher Date Signature
1 for patient; 1 for researcher; 1 to be kept with hospital notes
Appendix 7:
Version 1 – 14/10/17 REC Reference number: 230710
Department of Investigative Medicine, HammersmithHospital Campus,
ImperialCollegeLondon
6th Floor, CommonwealthBuilding, Ducane Road,
W120NN
Tel 020 838 33242 Fax 020 838 33142
The Acute Effect of Propionate on Energy Homeostasis
STUDY 3: The acute effects of propionate on energy metabolism on postprandial metabolism

336
Please initial the box if you agree with each statement.
1. I have been given the opportunity to ask questions and discuss the study
2. I have received satisfactory answers to all my questions
3. I have received enough information about the study
4. I confirm that I have read and understand the information sheet : Version --------- date:------
“The acute effects of propionate on energy metabolism on postprandial metabolism”
for the above study.
5. I understand that my participation is voluntary and that I am free to withdraw at any time, without
giving any reason, without my medical care or legal rights being affected.
6. I understand that sections of any of my research notes may be looked at by responsible
individuals from Imperial College, Imperial College NHS Healthcare Trust, and regulatory authorities where it is relevant to my taking part in research. I give permission for these individuals to have
access to my records.
7. I agree that that my Identifiable information can be stored on Imperial College London and Imperial College NHS Healthcare Trust computer systems
8. I agree to have my GP informed about participating in this study and any incidental findings
9. I agree to have my blood taken as detailed in the participant information sheet.
10. I agree to have my collected tissue samples stored and used in future ethically approved studies.
11. I agree to have my study data stored securely at Imperial College and Imperial College NHS Healthcare Trust for 10 years following completion of the study.
12. I agree that in the event I lose capacity, my personal identifiable data/samples will not be retained but and no further data or samples will be collected. Data or tissue which is not identifiable to the research team may be retained.
13. I agree to take part in this study.

337
________________________ ________________ ____________________ Name of Patient Date Signature
_________________________ ________________ ____________________
Name of Researcher Date Signature
1 for patient; 1 for researcher; 1 to be kept with hospital notes