Azeotropic distillation with an internal decanter
12
Computers and Chemical Engineering 24 (2000) 2435 – 2446 Azeotropic distillation with an internal decanter Amy R. Ciric a , Hassan S. Mumtaz b , Grafton Corbett b , Matthew Reagan b , Warren D. Seider b, *, Leonard A. Fabiano c,1 , David M. Kolesar c,2 , Soemantri Widagdo d a Department of Chemical Engineering, Uni6ersity of Cincinnati, Cincinnati, OH 45202 -0171, USA b Department of Chemical Engineering, Uni6ersity of Pennsyl6ania, Towne Building D3, 220 S. 33rd Street, Philadelphia, PA 19104 -6393, USA c Wayne, PA, USA d 3M, St Paul, MN 55144, USA Received 14 June 1999; received in revised form 5 June 2000; accepted 7 June 2000 Abstract A distillation column with an internal decanter is used to separate a mixture containing five some oxygenated and hydrocarbons and having at least three carbon atoms, and water. One of the species is partially miscible with water, as well as another organic species. Both binary pairs exhibit azeotropes above the minimum bubble-point temperature. The column is very sensitive to small disturbances which can lead to flooding, poor product quality, and migration of an embedded two-liquid phase region within the column. These disturbances can cause the column to move from one steady state to another for the same specifications. Multiple operating regimes are exhibited, with unusual transitions between them. Two regions involving multiple steady states are observed, one of which involves the partial-miscibility of two organic phases. The dynamics of moving interfaces between trays having one- and two-liquid phases, as well as controllers to insure that unwanted transitions do not occur, are examined. © 2000 Elsevier Science Ltd. All rights reserved. Keywords: Azeotropic distillation; Internal decanter; Oxygenated hydrocarbons www.elsevier.com/locate/compchemeng 1. Introduction The sensitivity of azeotropic distillation columns with internal decanters to small disturbances can lead to flooding and the deterioration of distillate and sidedraw purities, from which it is difficult to return to normal operation. Thus far, this sensitivity and the distur- bances that trigger shifts in the operating regimes have not been well understood. Furthermore, while there is an extensive literature on heterogeneous azeotropic dis- tillation, that is, azeotropic distillation towers with two liquid phases on at least one of the trays or decanter, to our knowledge, azeotropic distillation columns with internal decanters have not been studied in the litera- ture (Widagdo & Seider, 1996). This paper examines the behavior of columns with internal decanters, their operating regimes, and the existence of multiple steady states. In normal operation, these columns have a sidedraw composed of a single liquid phase, usually an aqueous phase, and two liquid phases on trays near the decanter tray. When operation in an anomalous regime occurs, there is only one liquid phase on the decanter tray and no sidedraw, two liquid phases appear on trays throughout the stripping sec- tion, the bottoms product contains two liquid phases, and the internal vapor flow rates are increased. Fur- thermore, small disturbances, such as an increase in the feed rate of the light species, can move these columns from normal to anomalous operation. It will be shown that the vapor flow is increased, which results in flood- ing when insufficient capacity is provided. For these reasons, it is an objective of this paper to show the sensitive responses to small disturbances, to show how * Corresponding author. Tel.: +1-215-8988351; fax: +1-215- 5732093. E-mail address: [email protected] (W.D. Seider). 1 Present address: CDI Corporation, Philadelphia, PA 19103-2768, USA. 2 Present address: Rohm & Haas Corporation, Bristol, PA 19007, USA. 0098-1354/00/$ - see front matter © 2000 Elsevier Science Ltd. All rights reserved. PII:S0098-1354(00)00603-7
-
Upload
independent -
Category
Documents
-
view
0 -
download
0
Transcript of Azeotropic distillation with an internal decanter

Computers and Chemical Engineering 24 (2000) 2435–2446
Azeotropic distillation with an internal decanter
Amy R. Ciric a, Hassan S. Mumtaz b, Grafton Corbett b, Matthew Reagan b,Warren D. Seider b,*, Leonard A. Fabiano c,1, David M. Kolesar c,2,
Soemantri Widagdo d
a Department of Chemical Engineering, Uni6ersity of Cincinnati, Cincinnati, OH 45202-0171, USAb Department of Chemical Engineering, Uni6ersity of Pennsyl6ania, Towne Building D3, 220 S. 33rd Street, Philadelphia, PA 19104-6393, USA
c Wayne, PA, USAd 3M, St Paul, MN 55144, USA
Received 14 June 1999; received in revised form 5 June 2000; accepted 7 June 2000
Abstract
A distillation column with an internal decanter is used to separate a mixture containing five some oxygenated and hydrocarbonsand having at least three carbon atoms, and water. One of the species is partially miscible with water, as well as another organicspecies. Both binary pairs exhibit azeotropes above the minimum bubble-point temperature. The column is very sensitive to smalldisturbances which can lead to flooding, poor product quality, and migration of an embedded two-liquid phase region within thecolumn. These disturbances can cause the column to move from one steady state to another for the same specifications. Multipleoperating regimes are exhibited, with unusual transitions between them. Two regions involving multiple steady states are observed,one of which involves the partial-miscibility of two organic phases. The dynamics of moving interfaces between trays having one-and two-liquid phases, as well as controllers to insure that unwanted transitions do not occur, are examined. © 2000 ElsevierScience Ltd. All rights reserved.
Keywords: Azeotropic distillation; Internal decanter; Oxygenated hydrocarbons
www.elsevier.com/locate/compchemeng
1. Introduction
The sensitivity of azeotropic distillation columns withinternal decanters to small disturbances can lead toflooding and the deterioration of distillate and sidedrawpurities, from which it is difficult to return to normaloperation. Thus far, this sensitivity and the distur-bances that trigger shifts in the operating regimes havenot been well understood. Furthermore, while there isan extensive literature on heterogeneous azeotropic dis-tillation, that is, azeotropic distillation towers with twoliquid phases on at least one of the trays or decanter, toour knowledge, azeotropic distillation columns with
internal decanters have not been studied in the litera-ture (Widagdo & Seider, 1996).
This paper examines the behavior of columns withinternal decanters, their operating regimes, and theexistence of multiple steady states. In normal operation,these columns have a sidedraw composed of a singleliquid phase, usually an aqueous phase, and two liquidphases on trays near the decanter tray. When operationin an anomalous regime occurs, there is only one liquidphase on the decanter tray and no sidedraw, two liquidphases appear on trays throughout the stripping sec-tion, the bottoms product contains two liquid phases,and the internal vapor flow rates are increased. Fur-thermore, small disturbances, such as an increase in thefeed rate of the light species, can move these columnsfrom normal to anomalous operation. It will be shownthat the vapor flow is increased, which results in flood-ing when insufficient capacity is provided. For thesereasons, it is an objective of this paper to show thesensitive responses to small disturbances, to show how
* Corresponding author. Tel.: +1-215-8988351; fax: +1-215-5732093.
E-mail address: [email protected] (W.D. Seider).1 Present address: CDI Corporation, Philadelphia, PA 19103-2768,
USA.2 Present address: Rohm & Haas Corporation, Bristol, PA 19007,
USA.
0098-1354/00/$ - see front matter © 2000 Elsevier Science Ltd. All rights reserved.PII: S 0 0 9 8 -1354 (00 )00603 -7
A.R. Ciric et al. / Computers and Chemical Engineering 24 (2000) 2435–24462436
multiple steady states arise, and to explore the dynamicresponses of columns equipped with PID controllers.
This paper also examines a related behavior thatoccurs as the bottoms flow rate is reduced, resulting inan increased recirculation rate. Over a narrow range ofthe bottoms flow rate, two steady-state solutions arecomputed, one which involves only one liquid phase onthe decanter tray and no sidedraw, and the other inwhich two partially-miscible organic phases form on thedecanter tray, providing an organic sidedraw.
2. A typical ternary system
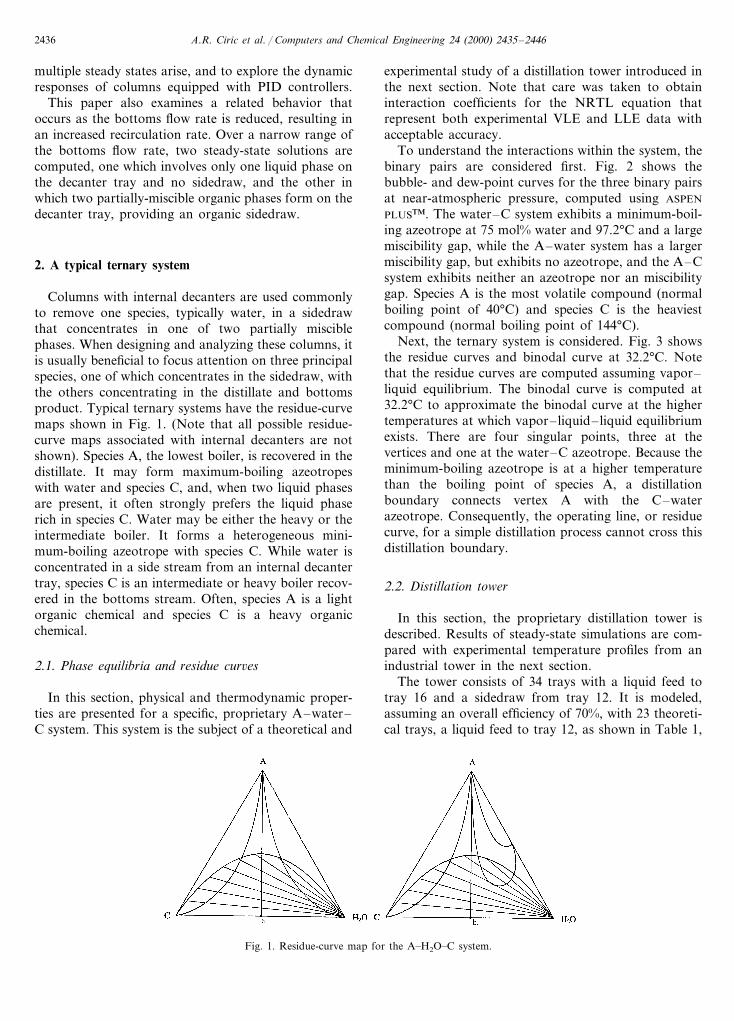
Columns with internal decanters are used commonlyto remove one species, typically water, in a sidedrawthat concentrates in one of two partially misciblephases. When designing and analyzing these columns, itis usually beneficial to focus attention on three principalspecies, one of which concentrates in the sidedraw, withthe others concentrating in the distillate and bottomsproduct. Typical ternary systems have the residue-curvemaps shown in Fig. 1. (Note that all possible residue-curve maps associated with internal decanters are notshown). Species A, the lowest boiler, is recovered in thedistillate. It may form maximum-boiling azeotropeswith water and species C, and, when two liquid phasesare present, it often strongly prefers the liquid phaserich in species C. Water may be either the heavy or theintermediate boiler. It forms a heterogeneous mini-mum-boiling azeotrope with species C. While water isconcentrated in a side stream from an internal decantertray, species C is an intermediate or heavy boiler recov-ered in the bottoms stream. Often, species A is a lightorganic chemical and species C is a heavy organicchemical.
2.1. Phase equilibria and residue cur6es
In this section, physical and thermodynamic proper-ties are presented for a specific, proprietary A–water–C system. This system is the subject of a theoretical and
experimental study of a distillation tower introduced inthe next section. Note that care was taken to obtaininteraction coefficients for the NRTL equation thatrepresent both experimental VLE and LLE data withacceptable accuracy.
To understand the interactions within the system, thebinary pairs are considered first. Fig. 2 shows thebubble- and dew-point curves for the three binary pairsat near-atmospheric pressure, computed using ASPEN
PLUS™. The water–C system exhibits a minimum-boil-ing azeotrope at 75 mol% water and 97.2°C and a largemiscibility gap, while the A–water system has a largermiscibility gap, but exhibits no azeotrope, and the A–Csystem exhibits neither an azeotrope nor an miscibilitygap. Species A is the most volatile compound (normalboiling point of 40°C) and species C is the heaviestcompound (normal boiling point of 144°C).
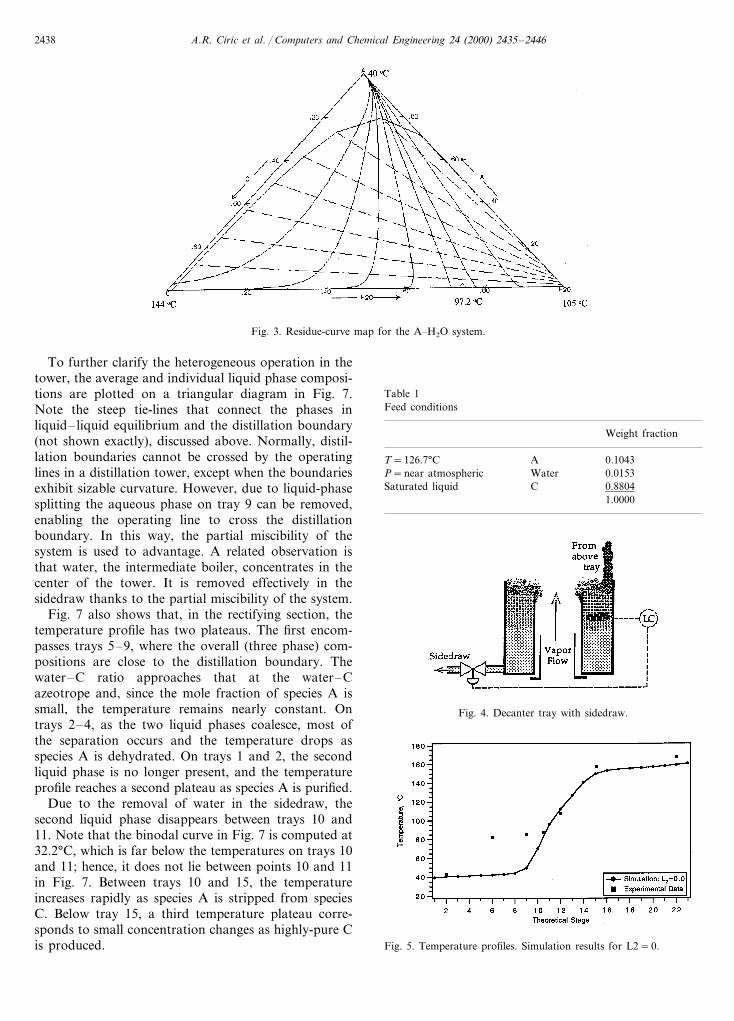
Next, the ternary system is considered. Fig. 3 showsthe residue curves and binodal curve at 32.2°C. Notethat the residue curves are computed assuming vapor–liquid equilibrium. The binodal curve is computed at32.2°C to approximate the binodal curve at the highertemperatures at which vapor–liquid–liquid equilibriumexists. There are four singular points, three at thevertices and one at the water–C azeotrope. Because theminimum-boiling azeotrope is at a higher temperaturethan the boiling point of species A, a distillationboundary connects vertex A with the C–waterazeotrope. Consequently, the operating line, or residuecurve, for a simple distillation process cannot cross thisdistillation boundary.
2.2. Distillation tower
In this section, the proprietary distillation tower isdescribed. Results of steady-state simulations are com-pared with experimental temperature profiles from anindustrial tower in the next section.
The tower consists of 34 trays with a liquid feed totray 16 and a sidedraw from tray 12. It is modeled,assuming an overall efficiency of 70%, with 23 theoreti-cal trays, a liquid feed to tray 12, as shown in Table 1,
Fig. 1. Residue-curve map for the A�H2O�C system.

A.R. Ciric et al. / Computers and Chemical Engineering 24 (2000) 2435–2446 2437
Fig. 2. Bubble- and dew-point temperatures for binary pairs atnear-atmospheric pressure. (a) Water–C binary. (b) A–water binary.(c) A–C binary.
and a sidedraw from tray 9. Depending on the operat-ing conditions, some of the trays contain both aqueousand organic phases. The sidedraw removes some of theaqueous phase flowing from tray 9, while the organicphase flows to the tray below. This is accomplishedusing a built-in ‘donut’ decanter tray that collects theliquid flowing from the tray above and permits phaseseparation, as illustrated in Fig. 4. The cavity in thecenter of the tray carries both the vapor, rising to thetray above, and the overflowing organic phase. Aninterfacial level controller maintains the position of theinterface between the aqueous and organic phases andprevents the organic phase from escaping in the side-draw and the aqueous phase from overflowing to thetray below. It does not prevent entrainment and doesnot insure perfect phase separation.
2.3. Steady-state simulation
The RADFRAC™ subroutine in ASPEN PLUS was usedto simulate the distillation column. RADFRAC can asso-ciate a decanter with any tray in the tower. Phasestability is checked on every stage to determine whetheror not a second liquid phase exists. The decanter tray ismodeled by specifying the fraction of each liquid phaseto be returned to the tower, L1 and L2, for the organicand aqueous phases, respectively. When L1 is specifiedas unity and L2 is zero, the decanter is assumed to beperfectly efficient with all of the organic phase returnedto the tower, and all of the aqueous phase removed asa sidedraw. An imperfect decanter is modeled by speci-fying L1 less than unity and/or L2 greater than zero.
The simulation was tuned to fit an experimentaltemperature profile by varying L2, while keeping L1 atunity. As shown in Fig. 5, when L2 is zero, the temper-ature profile of the model does not match the experi-mental data in the rectifying section. For L2B0.47,significant differences between the experimental andtheoretical profiles exist in the rectifying section,whereas for L2\0.49, the differences are primarily inthe stripping section. Only at L2=0.48 (90.005) isthere good agreement everywhere, as illustrated in Fig.6.
In normal operation, none of the aqueous phase isrecycled. However, since good agreement is obtainedwhen the recycle fraction L2 is specified at 0.48, thewater flow rates in the tower are higher than expected.One possible explanation is that the level controller ofthe decanter tray may not be functioning properly, andconsequently, the entire aqueous phase may not beremoved, resulting in the buildup and overflow of theaqueous phase. Another explanation would be the fail-ure of the two liquid phases to separate completely dueto an insufficient tray volume. This would result in theentrainment of water in the organic phase. By recyclinga fraction of the aqueous phase below the decantertray, these effects appear to be simulated adequately.
A.R. Ciric et al. / Computers and Chemical Engineering 24 (2000) 2435–24462438
Fig. 3. Residue-curve map for the A�H2O system.
To further clarify the heterogeneous operation in thetower, the average and individual liquid phase composi-tions are plotted on a triangular diagram in Fig. 7.Note the steep tie-lines that connect the phases inliquid–liquid equilibrium and the distillation boundary(not shown exactly), discussed above. Normally, distil-lation boundaries cannot be crossed by the operatinglines in a distillation tower, except when the boundariesexhibit sizable curvature. However, due to liquid-phasesplitting the aqueous phase on tray 9 can be removed,enabling the operating line to cross the distillationboundary. In this way, the partial miscibility of thesystem is used to advantage. A related observation isthat water, the intermediate boiler, concentrates in thecenter of the tower. It is removed effectively in thesidedraw thanks to the partial miscibility of the system.
Fig. 7 also shows that, in the rectifying section, thetemperature profile has two plateaus. The first encom-passes trays 5–9, where the overall (three phase) com-positions are close to the distillation boundary. Thewater–C ratio approaches that at the water–Cazeotrope and, since the mole fraction of species A issmall, the temperature remains nearly constant. Ontrays 2–4, as the two liquid phases coalesce, most ofthe separation occurs and the temperature drops asspecies A is dehydrated. On trays 1 and 2, the secondliquid phase is no longer present, and the temperatureprofile reaches a second plateau as species A is purified.
Due to the removal of water in the sidedraw, thesecond liquid phase disappears between trays 10 and11. Note that the binodal curve in Fig. 7 is computed at32.2°C, which is far below the temperatures on trays 10and 11; hence, it does not lie between points 10 and 11in Fig. 7. Between trays 10 and 15, the temperatureincreases rapidly as species A is stripped from speciesC. Below tray 15, a third temperature plateau corre-sponds to small concentration changes as highly-pure Cis produced.
Table 1Feed conditions
Weight fraction
AT=126.7°C 0.1043P=near atmospheric 0.0153Water
CSaturated liquid 0.88041.0000
Fig. 4. Decanter tray with sidedraw.
Fig. 5. Temperature profiles. Simulation results for L2=0.

A.R. Ciric et al. / Computers and Chemical Engineering 24 (2000) 2435–2446 2439
Fig. 6. Temperature profiles. Simulation results for L2=0.48.Fig. 8. Trays having two liquid phases (within dashed envelopes) asL2 varies.
2.4. Sensiti6ity analysis
As mentioned above, the column responds very sensi-tively to the recycle fraction of the aqueous sidedraw.This can be seen in the responses of the two-liquidphase region. First, Fig. 8 shows that the two-liquidphase region expands as the flow rates of water in thecolumn increase. At zero recycle, two liquid phasesappear in the decanter tray only. At the other extreme,when the aqueous phase is completely recycled, twoliquid phases appear on every tray except the reboiler.Note that the upper interface, between trays having twoand one liquid phase(s), is especially sensitive when therecycle fraction varies between 0.4 and 0.5. Also, whenincreasing the fraction of the aqueous phase recycled,the second liquid phase does not advance into thestripping section until all of the stages in the rectifyingsection contain two liquid phases.
Similarly, the temperature and composition profilesare extremely sensitive to the fraction of the aqueousphase recycled. When none of the aqueous phase isrecycled, the bulk of the separation occurs between
trays 8 and 15, where the temperature gradient isconstant as shown in Fig. 5. First, species A is sepa-rated from water at the bottom of the rectifying section,and then from species C at the top of the strippingsection, leaving nearly constant temperatures and com-positions between trays 1–7 and 16–23. These profilesare not affected significantly as the recycle fraction isincreased to 0.4. Although the composition of waterincreases substantially, only one additional tray has twoliquid phases, beyond the decanter tray. However, asthe recycle fraction increases toward 0.45, the separa-tion between species A and water is shifted up thetower. A region, dilute in species A, involving waterand C phases, spreads into the rectifying section, creat-ing temperature and composition plateaus above thedecanter tray, as shown in Fig. 9. From 0.45 to 0.48,the separation of species A from species C begins tomove down in the stripping section. This movement isdrastic from 0.48 to 0.49, as shown in Fig. 10. It isaccompanied by a sharp increase in the concentrationof species A in the stripping section, as shown in Fig.11. Further increases of the recycle fraction further
Fig. 7. Operating points for the simulated tower at L2=0.48; average liquid mole fractions. * are calculated by RADFRAC.

A.R. Ciric et al. / Computers and Chemical Engineering 24 (2000) 2435–24462440
Fig. 9. Temperature profiles. Simulation results for L2=0.4, 0.43 and0.45.
concentrate species A and spread the temperature com-position plateaus.
On the basis of the steady-state simulations, it seemsclear that the embedded two-liquid phase region isdesirable. Sufficient water is needed to allow the embed-ded region to contract, without coalescing, when thewater concentration in the feed decreases. However, asthe region expands (especially for L2\0.48) the lossesof species A increase in the sidedraw and the bottomsproduct. To select a desirable operating strategy withan embedded two-liquid phase region, dynamic simula-tions, with and without controllers, are helpful, asdescribed next.
2.5. Process dynamics
Dynamic simulations are carried out with theSPEEDUP system. The trays in the rectifying sectionhave a residence time of clear liquid between 23 and 29s, whereas the residence time is much smaller in thestripping section, between approximately 2.5 and 3.5 s.The decanter tray, reflux accumulator, and reboilerhave residence times of approximately one-third hour,between 2.7 and 5.4 min, and approximately 9.6 min,respectively.
The trays are modelled with the Francis Weir For-mula. The MESH (Material balance, Equilibrium,Summation of mole fraction, and Heat balance) equa-tions include terms that represent the enthalpy and flowrates of the species in a second liquid (aqueous) phase.Note that when the aqueous phase does not exist, theflow rate variables are zero. Furthermore, during eachtime step, the stability of the phase distribution on eachtray is checked using tangent-plane-distance analysis(Michelsen, 1982). When the distribution is unstable, aliquid phase is added or deleted as necessary. For thistower, this stability analysis is critical in the dynamicsimulations to permit the two interfaces between trayshaving two and one liquid phase(s) to be trackedproperly in response to typical disturbances. This isestablished in a similar tower, involving the dehydra-tion of sec-butanol, by Widagdo, Seider and Sebastian(1992). In the results that follow, this movement seemsreasonable, although confirmation with experimentaldata has not been accomplished.
The tower simulations begin at steady states with therecycle fraction of the aqueous sidedraw (L2) at 0.48and 0.49. At L2=0.48, two liquid phases exist on thedecanter tray but not further down into the strippingsection. At L2=0.49, the aqueous phase moves fardown into the stripping section. First, open-loop simu-lation results are presented to show the movement ofthe interface below the decanter tray, beginning withL2=0.48, after an increase in the weight fraction ofwater in the feed from 0.0153 to 0.0191 (holding theweight fraction of species A fixed). Fig. 12 shows themovement of the temperature front, which corresponds
Fig. 10. Temperature profiles. Simulation results for L2=0.48 and0.49.
Fig. 11. Overall mole fractions in the liquid phases. Simulation resultsfor L2=0.48 and 0.49.
Fig. 12. Temperature response to a step increase in the weightfraction of water in the feed (0.0153 to 0.0191). L2=0.48 at theinitial steady state.

A.R. Ciric et al. / Computers and Chemical Engineering 24 (2000) 2435–2446 2441
Fig. 13. Responses to a step increase in the weight fraction of waterin the feed (0.0153 to 0.0191) with PI control. L2=0.48. (a) Temper-ature. (b) Reboiler heat duty.
ments in the rectifying section are substantial as thecomposition and temperature fronts move closer to thecondenser. To avoid a break-through, a temperaturemeasurement in the rectifying section, coupled withanother manipulated variable, such as the reflux rate,may be desirable. Alternatively, it may be possible toprevent the movement in the rectifying section with amodel-predictive controller (MPC) that incorporatesthe SPEEDUP model within an optimization algorithm.
Figs. 14 and 15 repeat these simulations, beginningwith the steady state at L2=0.49, and a decrease in theweight fraction of water in the feed from 0.0153 to0.0141. Fig. 14 shows that, without the controller, theinterfaces move upward in the stripping section anddownward in the rectifying section. With the controller,as shown in Fig. 15, the movement in the strippingsection is negligible. In the rectifying section, however,the movement is substantial, but away from the con-denser. Note that, in this case, the temperature set pointon tray 15 is 111.74°C (at the L2=0.49 steady state)and the time to reach the new steady state is approxi-mately 4 h.
These results highlight some of the considerations incontrolling such a sensitive tower that contains animbedded two-liquid phase region. They are presentedto suggest important issues in developing model-basedcontrollers.
Fig. 14. Temperature response to a step decrease in the weightfraction of water in the feed (0.0153 to 0.0141). L2=0.49 at theinitial steady state.
Fig. 15. Responses to a step decrease in the weight fraction of waterin the feed (0.0153–0.0141) with PI control. L2=0.49. (a) Tempera-ture. (b) Reboiler heat duty.
to the interface between stages having two and oneliquid phase(s), to a new steady state in about 2 h. Thisfigure also shows that the interface moves up in therectifying section. Note that the temperature profile atL2=0.49 in Fig. 10, computed using ASPEN PLUS, isnot identical to that in Fig. 12, computed usingSPEEDUP. This is because the initial conditions for thedynamic simulation are not exactly at the steady statecorresponding to L2=0.49.
These studies were repeated with a PI controllerwhich measures the temperature on tray 15 and at-tempts to maintain the set point (150°C at the L2=0.48 steady state) by adjusting the reboiler heat duty.The responses, with a controller gain and reset timeequal to 2 and 54.27, respectively, are shown in Fig. 13.Observe that the controller maintains the temperaturesand compositions below the decanter tray with rathersmall changes in the boilup rate. However, the move-

A.R. Ciric et al. / Computers and Chemical Engineering 24 (2000) 2435–24462442
Table 2Feed stream for multiplicity studies
Mole fraction
T=84.4°C 0.173A0.084WaterP=1.2 bar
BF=10.566 kmol/h 0.477C 0.002
0.025DE 0.239
1.000
in the multicomponent mixture. Two regions of multi-ple steady states are observed, one involving the partialmiscibility of the C–water pair, as above, and the otherinvolving the partial miscibility of the B–C pair.
For the calculations that follow, the MESH equa-tions are solved using the RADFRAC model in ASPEN
PLUS, Version 9.3-2, with vapor–liquid–liquid equi-librium modeled using UNIFAC. Most of the interactionparameters are in the ASPEN PLUS database, with theexception of those for the groups in species D and Ewhich are estimated.
For the feed stream in Table 2, the first region ofmultiple steady states is computed with the distillateflow rate specified at 1.825 kmol/h, equal to the flowrate of species A in the feed, and the reboil ratiospecified at unity. Two steady-state solutions are com-puted. The first corresponds to the desired regime, withtwo liquid phases on trays 6–9, a reflux ratio of 2.66,and a sidedraw flow rate of 0.914 kmol/h. The second,anomalous, solution has two liquid phases on trays11–23, a reflux ratio of 5.79, and zero sidedraw flowrate. The corresponding profiles of liquid-phase molefractions appear in Figs. 16 and 17. In the first solution,species A is concentrated (\90 mol%) on trays 1–3,while in the second solution, species A is concentratedon trays 1–9. Similarly, in the first solution, the molefraction of water peaks on tray 8, and in the secondsolution, it peaks on tray 11.
A closer examination of the second solution showsthat the bottoms flow rate is increased. For specifieddistillate flow rate and reboil ratio, the reflux ratio andvapor boilup are increased as explained below, assum-ing constant molar overflow. Beginning with the refluxsplitter, the overall mass balance is:
V=D+L (1)
and the reflux ratio is defined:
L=RD (2)
Then, at the feed tray, the overall mass balance is:
V=V %+qF (3)
and the reboil ratio is defined:
V %=R %B (4)
Here, F is the feed flow rate, D and B are the distillateand bottoms flow rates, V and V % are internal vaporflow rates in the rectifying and stripping sections, L isthe liquid flow rate in the rectifying section, q is thefeed quality, and R and R % are the reflux and reboilratios.
With q=0, Eqs. (1)–(3) combine to:
R=R %B/D−1 (5)
In the first operating regime, the bottoms flow rate isapproximately equal to H, the flow rate of heavyorganics (species B–E) in the column feed. Substitutingin Eq. (5):
Fig. 16. Profiles of average mole fractions in the liquid phases —Solution I.
Fig. 17. Profiles of average mole fractions in the liquid phases —Solution II.
3. Multiple steady states
Having concentrated on the analysis of the towerwith three species, A, water, and C, in this section, theanalysis is extended to include organic species B, D,and E. Note that, in the ternary mixture, species C bestrepresents the combination of species B, C, D, and E,
A.R. Ciric et al. / Computers and Chemical Engineering 24 (2000) 2435–2446 2443
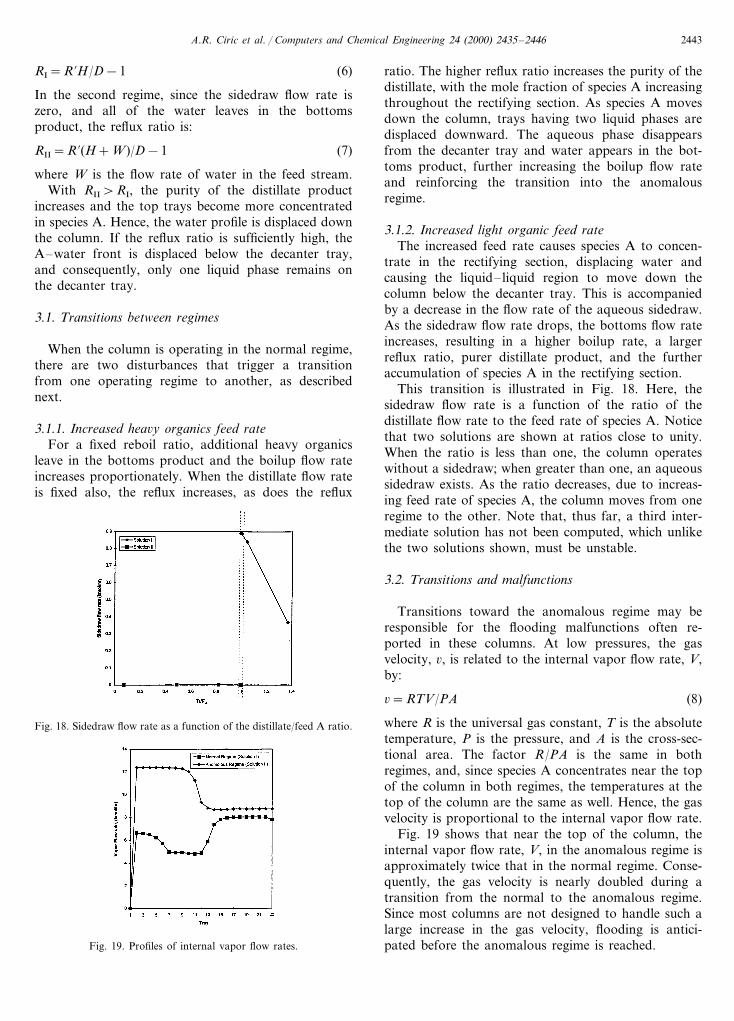
RI=R %H/D−1 (6)
In the second regime, since the sidedraw flow rate iszero, and all of the water leaves in the bottomsproduct, the reflux ratio is:
RII=R %(H+W)/D−1 (7)
where W is the flow rate of water in the feed stream.With RII\RI, the purity of the distillate product
increases and the top trays become more concentratedin species A. Hence, the water profile is displaced downthe column. If the reflux ratio is sufficiently high, theA–water front is displaced below the decanter tray,and consequently, only one liquid phase remains onthe decanter tray.
3.1. Transitions between regimes
When the column is operating in the normal regime,there are two disturbances that trigger a transitionfrom one operating regime to another, as describednext.
3.1.1. Increased hea6y organics feed rateFor a fixed reboil ratio, additional heavy organics
leave in the bottoms product and the boilup flow rateincreases proportionately. When the distillate flow rateis fixed also, the reflux increases, as does the reflux
ratio. The higher reflux ratio increases the purity of thedistillate, with the mole fraction of species A increasingthroughout the rectifying section. As species A movesdown the column, trays having two liquid phases aredisplaced downward. The aqueous phase disappearsfrom the decanter tray and water appears in the bot-toms product, further increasing the boilup flow rateand reinforcing the transition into the anomalousregime.
3.1.2. Increased light organic feed rateThe increased feed rate causes species A to concen-
trate in the rectifying section, displacing water andcausing the liquid–liquid region to move down thecolumn below the decanter tray. This is accompaniedby a decrease in the flow rate of the aqueous sidedraw.As the sidedraw flow rate drops, the bottoms flow rateincreases, resulting in a higher boilup rate, a largerreflux ratio, purer distillate product, and the furtheraccumulation of species A in the rectifying section.
This transition is illustrated in Fig. 18. Here, thesidedraw flow rate is a function of the ratio of thedistillate flow rate to the feed rate of species A. Noticethat two solutions are shown at ratios close to unity.When the ratio is less than one, the column operateswithout a sidedraw; when greater than one, an aqueoussidedraw exists. As the ratio decreases, due to increas-ing feed rate of species A, the column moves from oneregime to the other. Note that, thus far, a third inter-mediate solution has not been computed, which unlikethe two solutions shown, must be unstable.
3.2. Transitions and malfunctions
Transitions toward the anomalous regime may beresponsible for the flooding malfunctions often re-ported in these columns. At low pressures, the gasvelocity, 6, is related to the internal vapor flow rate, V,by:
6=RTV/PA (8)
where R is the universal gas constant, T is the absolutetemperature, P is the pressure, and A is the cross-sec-tional area. The factor R/PA is the same in bothregimes, and, since species A concentrates near the topof the column in both regimes, the temperatures at thetop of the column are the same as well. Hence, the gasvelocity is proportional to the internal vapor flow rate.
Fig. 19 shows that near the top of the column, theinternal vapor flow rate, V, in the anomalous regime isapproximately twice that in the normal regime. Conse-quently, the gas velocity is nearly doubled during atransition from the normal to the anomalous regime.Since most columns are not designed to handle such alarge increase in the gas velocity, flooding is antici-pated before the anomalous regime is reached.
Fig. 18. Sidedraw flow rate as a function of the distillate/feed A ratio.
Fig. 19. Profiles of internal vapor flow rates.
A.R. Ciric et al. / Computers and Chemical Engineering 24 (2000) 2435–24462444
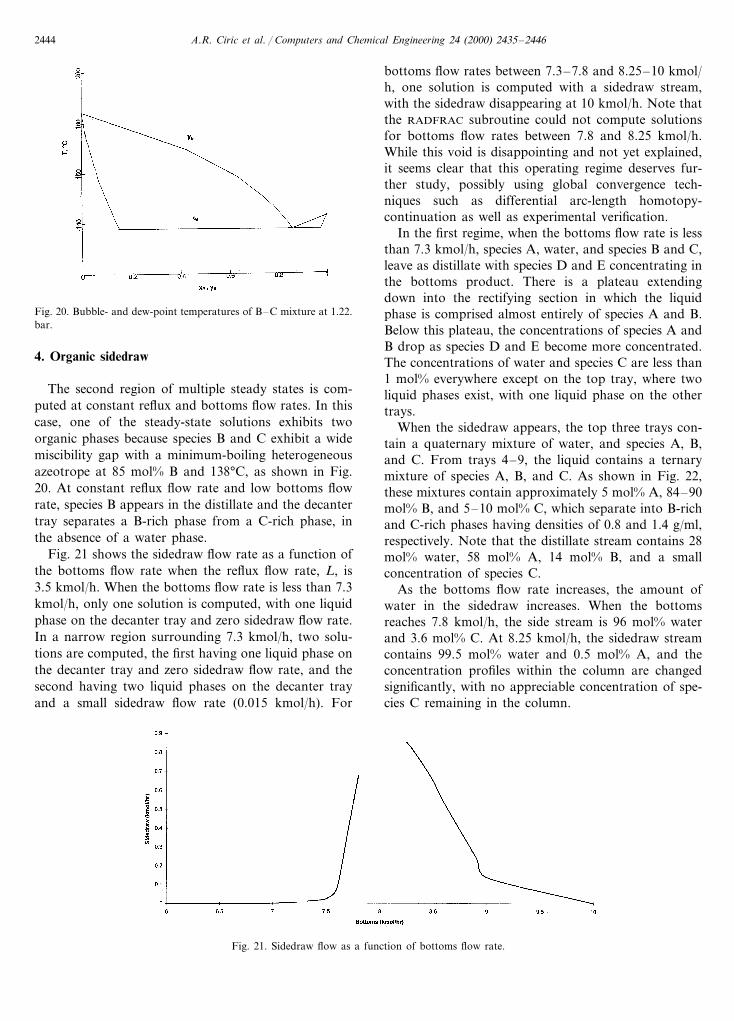
Fig. 20. Bubble- and dew-point temperatures of B–C mixture at 1.22.bar.
bottoms flow rates between 7.3–7.8 and 8.25–10 kmol/h, one solution is computed with a sidedraw stream,with the sidedraw disappearing at 10 kmol/h. Note thatthe RADFRAC subroutine could not compute solutionsfor bottoms flow rates between 7.8 and 8.25 kmol/h.While this void is disappointing and not yet explained,it seems clear that this operating regime deserves fur-ther study, possibly using global convergence tech-niques such as differential arc-length homotopy-continuation as well as experimental verification.
In the first regime, when the bottoms flow rate is lessthan 7.3 kmol/h, species A, water, and species B and C,leave as distillate with species D and E concentrating inthe bottoms product. There is a plateau extendingdown into the rectifying section in which the liquidphase is comprised almost entirely of species A and B.Below this plateau, the concentrations of species A andB drop as species D and E become more concentrated.The concentrations of water and species C are less than1 mol% everywhere except on the top tray, where twoliquid phases exist, with one liquid phase on the othertrays.
When the sidedraw appears, the top three trays con-tain a quaternary mixture of water, and species A, B,and C. From trays 4–9, the liquid contains a ternarymixture of species A, B, and C. As shown in Fig. 22,these mixtures contain approximately 5 mol% A, 84–90mol% B, and 5–10 mol% C, which separate into B-richand C-rich phases having densities of 0.8 and 1.4 g/ml,respectively. Note that the distillate stream contains 28mol% water, 58 mol% A, 14 mol% B, and a smallconcentration of species C.
As the bottoms flow rate increases, the amount ofwater in the sidedraw increases. When the bottomsreaches 7.8 kmol/h, the side stream is 96 mol% waterand 3.6 mol% C. At 8.25 kmol/h, the sidedraw streamcontains 99.5 mol% water and 0.5 mol% A, and theconcentration profiles within the column are changedsignificantly, with no appreciable concentration of spe-cies C remaining in the column.
4. Organic sidedraw
The second region of multiple steady states is com-puted at constant reflux and bottoms flow rates. In thiscase, one of the steady-state solutions exhibits twoorganic phases because species B and C exhibit a widemiscibility gap with a minimum-boiling heterogeneousazeotrope at 85 mol% B and 138°C, as shown in Fig.20. At constant reflux flow rate and low bottoms flowrate, species B appears in the distillate and the decantertray separates a B-rich phase from a C-rich phase, inthe absence of a water phase.
Fig. 21 shows the sidedraw flow rate as a function ofthe bottoms flow rate when the reflux flow rate, L, is3.5 kmol/h. When the bottoms flow rate is less than 7.3kmol/h, only one solution is computed, with one liquidphase on the decanter tray and zero sidedraw flow rate.In a narrow region surrounding 7.3 kmol/h, two solu-tions are computed, the first having one liquid phase onthe decanter tray and zero sidedraw flow rate, and thesecond having two liquid phases on the decanter trayand a small sidedraw flow rate (0.015 kmol/h). For
Fig. 21. Sidedraw flow as a function of bottoms flow rate.

A.R. Ciric et al. / Computers and Chemical Engineering 24 (2000) 2435–2446 2445
Fig. 22. Composition profile for B=7.3 kmol/h.
Potentially, there are two reasons no solution iscomputed for bottoms flow rates from 7.8–8.25 kmol/h. Since the total feed rate of species B, C, D, and E is7.8 kmol/h, as the bottoms flow rate increases above 7.8kmol/h, water moves from the sidedraw to the bottomsproduct, and the embedded liquid–liquid region movesfrom trays 2–10 to trays 7–22. This abrupt transitionmay be accompanied by steep gradients, with associ-ated numerical problems. Alternatively, an unexplainedphysical mechanism might be needed to show thatsolutions are not feasible in this region.
5. Conclusions
In distillation columns with internal decanters, thesteady-state regimes and dynamic transitions show un-usually sensitive behavior patterns and tendencies tomove from one steady state to another. This has beendemonstrated herein for a proprietary tower involving amixture of oxygenated hydrocarbons and water. On thebasis of simulation studies, with limited experimentalresults, it is concluded that these towers, for the separa-tion of multiple azeotropes with partial miscibility havecomplex solution spaces, and need to be characterizedmore completely.
More specifically, for the simulations and experimen-tal data reported herein, it is concluded that:1. When operating in the normal regime, the overall
effect of changing the aqueous recycle fraction ofthe sidedraw is to change the positions of the twoseparations, species A from water, and species Afrom species C. When the recycle fraction is zero,both separations occur near the center of the tower,with temperature and composition plateaus locatedat the top and bottom of the tower. At the otherlimit, when the recycle fraction is unity, the temper-ature and composition plateaus are located in the
middle of the tower and the separations occur at theextremes of the tower.
2. At an aqueous recycle fraction of 0.48, the com-puted temperature profile closely approximates thetemperature measurements. Under these conditions,the aqueous phase extends from the decanter trayupward into the rectifying section, but not below thedecanter tray. Whereas at an aqueous recycle frac-tion of 0.49, the aqueous phase extends downwardbelow the decanter tray. This sensitivity suggestsdifficult operating problems.
3. To reject typical disturbances, such as changes inthe concentration of water in the feed stream, it isdesirable to operate with two liquid phases in therectifying section and below the decanter tray. Fordisturbances involving the amounts of the heavy orlight organic species in the feed stream, care must betaken to avoid a shift toward a second steady state,without a sidedraw and with larger flow rates ofbottoms product and boilup, which could lead toflooding.
4. The dynamic simulations about the normal regimeshow that a single PI control loop can reject thesedisturbances nicely, but not perfectly. Additionalmeasurements and manipulated variables, togetherwith model-predictive control, show promise foreven better operation in this sensitive regime.
5. At constant reflux and low flow rates of the bottomsproduct, the partial miscibility of species B and Ccan express itself in an anomalous steady state inwhich two organic liquid phases appear on thedecanter tray, one of which is removed in the side-draw. This steady state is shown for the first time inthis paper. Further studies are needed to examinethe kinds of disturbances that can lead to thisregime of operation, their dynamic responses andassociated control issues.

A.R. Ciric et al. / Computers and Chemical Engineering 24 (2000) 2435–24462446
6. Nomenclature
A cross-sectional area (m2)distillate flow rate (kmol/s)Dfeed flow rate (kmol/s)F
H flow rate of heavy organic species (B–E) in the column feed (kmol/s)
L reflux flow rate (kmol/s)L1 fraction of organic phase in sidedraw
sent to tray 10fraction of aqueous phase in sidedrawL2sent to tray 10pressure (bar)P
q quality of feedR reflux ratio (L/D); Universal gas con-
stantR % boilup ratio (V %/B)
time (s)tT temperature (K)
gas velocity (m/s)n
vapor flow rate from rectifying sectionV(kmol/s)
V % boilup rate (kmol/s)
flow rate of water in feed streamW(kmol/s)
Subscriptsspecies AAregime II
II regime II
Acknowledgements
Partial support was provided by the National ScienceFoundation under Grants No. EEC 952 7441 ans CTS-9904099 and is gratefully acknowledged.
References
Michelsen, M. L. (1982). The isothermal flash problem I: stability. FluidPhase Equilibria, 9, 21.
Widagdo, S., Seider, W. D., & Sebastian, D. H. (1992). Dynamicanalysis of heterogeneous azeotropic distillation. American Instituteof Chemical Engineering Journal, 38, 1229.
Widagdo, S., & Seider, W. D. (1996). Azeotropic distillation — areview. American Institute of Chemical Engineering Journal, 42(1),96–130.
.