spontaneum for sugarcane and - SciELO
10
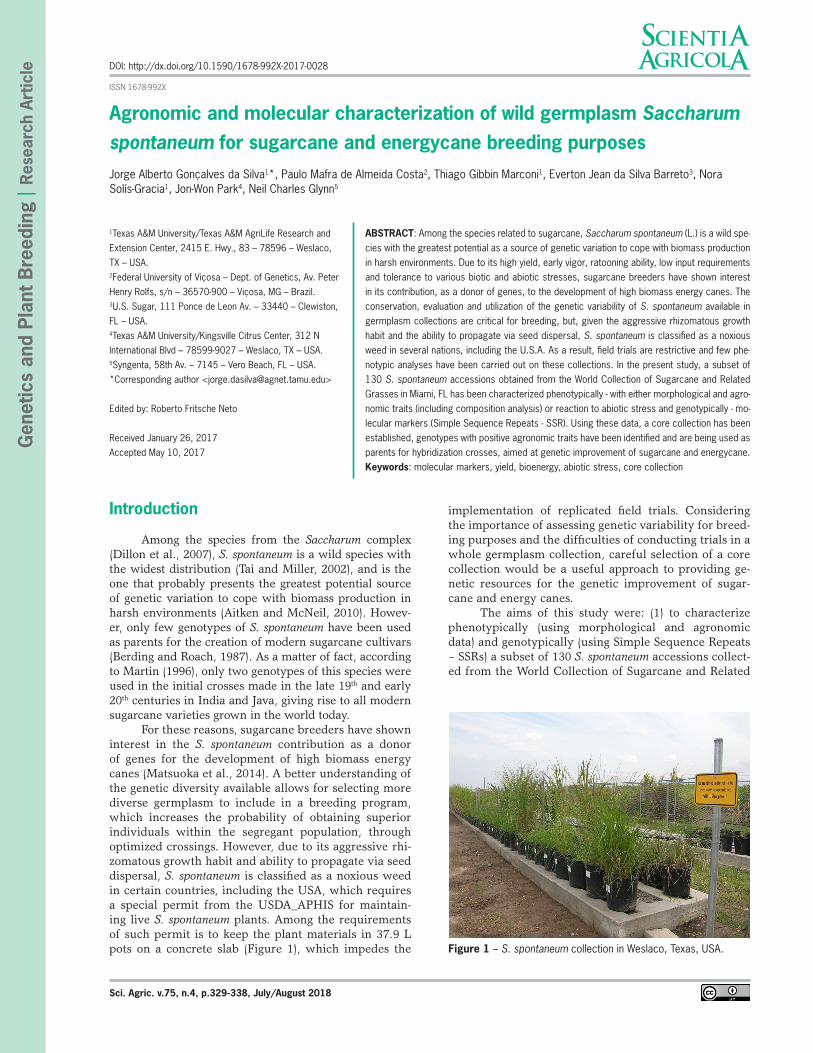
DOI: http://dx.doi.org/10.1590/1678-992X-2017-0028 Sci. Agric. v.75, n.4, p.329-338, July/August 2018 ISSN 1678-992X ABSTRACT: Among the species related to sugarcane, Saccharum spontaneum (L.) is a wild spe- cies with the greatest potential as a source of genetic variation to cope with biomass production in harsh environments. Due to its high yield, early vigor, ratooning ability, low input requirements and tolerance to various biotic and abiotic stresses, sugarcane breeders have shown interest in its contribution, as a donor of genes, to the development of high biomass energy canes. The conservation, evaluation and utilization of the genetic variability of S. spontaneum available in germplasm collections are critical for breeding, but, given the aggressive rhizomatous growth habit and the ability to propagate via seed dispersal, S. spontaneum is classified as a noxious weed in several nations, including the U.S.A. As a result, field trials are restrictive and few phe- notypic analyses have been carried out on these collections. In the present study, a subset of 130 S. spontaneum accessions obtained from the World Collection of Sugarcane and Related Grasses in Miami, FL has been characterized phenotypically - with either morphological and agro- nomic traits (including composition analysis) or reaction to abiotic stress and genotypically - mo- lecular markers (Simple Sequence Repeats - SSR). Using these data, a core collection has been established, genotypes with positive agronomic traits have been identified and are being used as parents for hybridization crosses, aimed at genetic improvement of sugarcane and energycane. Keywords: molecular markers, yield, bioenergy, abiotic stress, core collection Agronomic and molecular characterization of wild germplasm Saccharum Jorge Alberto Gonçalves da Silva 1 *, Paulo Mafra de Almeida Costa 2 , Thiago Gibbin Marconi 1 , Everton Jean da Silva Barreto 3 , Nora Solís-Gracia 1 , Jon-Won Park 4 , Neil Charles Glynn 5 1 Texas A&M University/Texas A&M AgriLife Research and Extension Center, 2415 E. Hwy., 83 – 78596 – Weslaco, TX – USA. 2 Federal University of Viçosa – Dept. of Genetics, Av. Peter Henry Rolfs, s/n – 36570-900 – Viçosa, MG – Brazil. 3 U.S. Sugar, 111 Ponce de Leon Av. – 33440 – Clewiston, FL – USA. 4 Texas A&M University/Kingsville Citrus Center, 312 N International Blvd – 78599-9027 – Weslaco, TX – USA. 5 Syngenta, 58th Av. – 7145 – Vero Beach, FL – USA. *Corresponding author <[email protected]> Edited by: Roberto Fritsche Neto Received January 26, 2017 Accepted May 10, 2017 Introduction Among the species from the Saccharum complex (Dillon et al., 2007), S. spontaneum is a wild species with the widest distribution (Tai and Miller, 2002), and is the one that probably presents the greatest potential source of genetic variation to cope with biomass production in harsh environments (Aitken and McNeil, 2010). Howev- er, only few genotypes of S. spontaneum have been used as parents for the creation of modern sugarcane cultivars (Berding and Roach, 1987). As a matter of fact, according to Martin (1996), only two genotypes of this species were used in the initial crosses made in the late 19 th and early 20 th centuries in India and Java, giving rise to all modern sugarcane varieties grown in the world today. For these reasons, sugarcane breeders have shown interest in the S. spontaneum contribution as a donor of genes for the development of high biomass energy canes (Matsuoka et al., 2014). A better understanding of the genetic diversity available allows for selecting more diverse germplasm to include in a breeding program, which increases the probability of obtaining superior individuals within the segregant population, through optimized crossings. However, due to its aggressive rhi- zomatous growth habit and ability to propagate via seed dispersal, S. spontaneum is classified as a noxious weed in certain countries, including the USA, which requires a special permit from the USDA_APHIS for maintain- ing live S. spontaneum plants. Among the requirements of such permit is to keep the plant materials in 37.9 L pots on a concrete slab (Figure 1), which impedes the implementation of replicated field trials. Considering the importance of assessing genetic variability for breed- ing purposes and the difficulties of conducting trials in a whole germplasm collection, careful selection of a core collection would be a useful approach to providing ge- netic resources for the genetic improvement of sugar- cane and energy canes. The aims of this study were: (1) to characterize phenotypically (using morphological and agronomic data) and genotypically (using Simple Sequence Repeats – SSRs) a subset of 130 S. spontaneum accessions collect- ed from the World Collection of Sugarcane and Related Genetics and Plant Breeding | Research Article spontaneum for sugarcane and energycane breeding purposes Figure 1 – S. spontaneum collection in Weslaco, Texas, USA.
-
Upload
khangminh22 -
Category
Documents
-
view
0 -
download
0
Transcript of spontaneum for sugarcane and - SciELO
DOI: http://dx.doi.org/10.1590/1678-992X-2017-0028
Sci. Agric. v.75, n.4, p.329-338, July/August 2018
ISSN 1678-992X
ABSTRACT: Among the species related to sugarcane, Saccharum spontaneum (L.) is a wild spe-cies with the greatest potential as a source of genetic variation to cope with biomass production in harsh environments. Due to its high yield, early vigor, ratooning ability, low input requirements and tolerance to various biotic and abiotic stresses, sugarcane breeders have shown interest in its contribution, as a donor of genes, to the development of high biomass energy canes. The conservation, evaluation and utilization of the genetic variability of S. spontaneum available in germplasm collections are critical for breeding, but, given the aggressive rhizomatous growth habit and the ability to propagate via seed dispersal, S. spontaneum is classified as a noxious weed in several nations, including the U.S.A. As a result, field trials are restrictive and few phe-notypic analyses have been carried out on these collections. In the present study, a subset of 130 S. spontaneum accessions obtained from the World Collection of Sugarcane and Related Grasses in Miami, FL has been characterized phenotypically - with either morphological and agro-nomic traits (including composition analysis) or reaction to abiotic stress and genotypically - mo-lecular markers (Simple Sequence Repeats - SSR). Using these data, a core collection has been established, genotypes with positive agronomic traits have been identified and are being used as parents for hybridization crosses, aimed at genetic improvement of sugarcane and energycane. Keywords: molecular markers, yield, bioenergy, abiotic stress, core collection
Agronomic and molecular characterization of wild germplasm Saccharum
Jorge Alberto Gonçalves da Silva1*, Paulo Mafra de Almeida Costa2, Thiago Gibbin Marconi1, Everton Jean da Silva Barreto3, Nora Solís-Gracia1, Jon-Won Park4, Neil Charles Glynn5
1Texas A&M University/Texas A&M AgriLife Research and Extension Center, 2415 E. Hwy., 83 – 78596 – Weslaco, TX – USA. 2Federal University of Viçosa – Dept. of Genetics, Av. Peter Henry Rolfs, s/n – 36570-900 – Viçosa, MG – Brazil. 3U.S. Sugar, 111 Ponce de Leon Av. – 33440 – Clewiston, FL – USA.4Texas A&M University/Kingsville Citrus Center, 312 N International Blvd – 78599-9027 – Weslaco, TX – USA. 5Syngenta, 58th Av. – 7145 – Vero Beach, FL – USA.*Corresponding author <[email protected]>
Edited by: Roberto Fritsche Neto
Received January 26, 2017Accepted May 10, 2017
Introduction
Among the species from the Saccharum complex (Dillon et al., 2007), S. spontaneum is a wild species with the widest distribution (Tai and Miller, 2002), and is the one that probably presents the greatest potential source of genetic variation to cope with biomass production in harsh environments (Aitken and McNeil, 2010). Howev-er, only few genotypes of S. spontaneum have been used as parents for the creation of modern sugarcane cultivars (Berding and Roach, 1987). As a matter of fact, according to Martin (1996), only two genotypes of this species were used in the initial crosses made in the late 19th and early 20th centuries in India and Java, giving rise to all modern sugarcane varieties grown in the world today.
For these reasons, sugarcane breeders have shown interest in the S. spontaneum contribution as a donor of genes for the development of high biomass energy canes (Matsuoka et al., 2014). A better understanding of the genetic diversity available allows for selecting more diverse germplasm to include in a breeding program, which increases the probability of obtaining superior individuals within the segregant population, through optimized crossings. However, due to its aggressive rhi-zomatous growth habit and ability to propagate via seed dispersal, S. spontaneum is classified as a noxious weed in certain countries, including the USA, which requires a special permit from the USDA_APHIS for maintain-ing live S. spontaneum plants. Among the requirements of such permit is to keep the plant materials in 37.9 L pots on a concrete slab (Figure 1), which impedes the
implementation of replicated field trials. Considering the importance of assessing genetic variability for breed-ing purposes and the difficulties of conducting trials in a whole germplasm collection, careful selection of a core collection would be a useful approach to providing ge-netic resources for the genetic improvement of sugar-cane and energy canes.
The aims of this study were: (1) to characterize phenotypically (using morphological and agronomic data) and genotypically (using Simple Sequence Repeats – SSRs) a subset of 130 S. spontaneum accessions collect-ed from the World Collection of Sugarcane and Related
Gen
etic
s an
d Pl
ant B
reed
ing
| Res
earc
h Ar
ticle
spontaneum for sugarcane and energycane breeding purposes
Figure 1 – S. spontaneum collection in Weslaco, Texas, USA.
330
Da Silva et al. Energycane and sugarcane genetic breeding
Sci. Agric. v.75, n.4, p.329-338, July/August 2018
Grasses in Miami, FL and maintained in Weslaco, TX, USA; (2) combine this data to establish a core collection representing the variability in the available S. Spontaneum germplasm and (3) utilize in hybridization crosses the Core Collection identified, aimed at genetic breeding of sugar and energy cane.
Materials and Methods
Plant materials All the accessions used in this study were col-
lected from the World Collection of Sugarcane and Re-lated Grasses (WCSRG) Miami, FL, USA and planted in Weslaco, Texas, USA (26°9’26” N 97°56’32” E 26 m). In this study, one hundred and thirty genotypes have been phenotypically characterized, 121 for agronomic traits (number of tillers, dry weight, brix content and cell wall composition) and 67 for reaction to salinity stress. Most genotypes were propagated as sugarcane, by 3-bud seed sets, but those genotypes which did not have buds on their stalks were propagated through rhizomes.
Data collection of agronomic traitsTrait measurements were taken during the period
of Mar through July 2014, on 6-month-old plants (except brix, which was measured in 10-month-old plants) main-tained under the same conditions. Plants were kept in large pots (50 cm diameter) and had a profuse number of stalks, which allowed for the samples to be taken from stalks in different positions on the pot. Measurements were taken from single plants since among the restrictions imposed by the USDA-APHIS special permit to plant S. spontaneum (considered as a noxious weed, as explained in the Discus-sion section), is the need to have plants in heavy duty pots on concrete slabs. Since this reduces the number of plants that can be grown at a time in our facilities, we opted for including the whole set of genotypes rather than increas-ing the number of replicates per genotype. A specific area of 78.5 cm2, taken from the center of the stool, was used to sample and collect the data. The traits measured were: number of tillers, dry weight and brix. Each brix measure-ment was taken on the middle part (half way of the culm) of three stalks and averaged. Stalks were squeezed with a plier, for juice extraction, and the brix quantified on a digital refractometer (model RHB-32/ATC).
Near Infrared (NIR) analysis was used to predict cell wall components using a calibration curve construct-ed in Weslaco, Texas, USA, specifically for S. spontaneum samples, based on results of wet chemistry analysis. Sam-ples which consisted of tissues from the aerial part of the plant, including leaves and stalks, were oven-dried over-night at 65 °C, ground using a Thomas Scientific grinder model 3379-K38 and transferred to a glass ring supplied by the manufacturer, for powder scanning. Samples were scanned using a near infrared reflectance spectrophotom-eter Model 2500X RTW, USA. The reflectance readings were converted to absorbance values as follows: A= log (1/R). Only the region from 1,100 to 2,400 nm with 1 nm
intervals was considered for analysis, as recommended by the manufacturer.
To determine the lignin, cellulose and hemicellulose content, thirty divergent samples were previously selected based on principal component analysis (PCA) of the NIR data and submitted to compositional analysis. Through wet chemistry, the biomass composition was determined in triplicates, according to DeMartini et al. (2011), with few modifications. NIST8419 was used as the internal standard (Hanssen, 1995). The spectra data resulting from the NIR analysis was used to predict biomass components for all 121 samples, using a previously developed calibration curve. The calibration was made using the CalStar 2.10 software program employing partial least squares (PLS) regression, according to the software’s default parameters.
Salinity tolerance screeningIn order to test tolerance to salinity, a screening
was performed on a subset of sixty- seven genotypes, us-ing high concentrations of sodium chloride in water used for irrigation. To standardize the age of the plants for the study, each genotype was clonally propagated, and the plants were grown in 8.9 cm square pots (401 mL capac-ity) in a greenhouse in Weslaco, Texas, USA. To determine which sodium chloride concentration to use for the screen-ing, a preliminary test with different concentrations was performed, as follows: 2-month old plants of seven geno-types of S. spontaneum and two sugarcane (Saccharum spp.) cultivars, CP72-1210 and CP96-1252, were irrigated every third day with 130 mL of a 400 mM sodium chloride solu-tion (NaCl). There were three plants per genotype and the two sugarcane cultivars were used as controls, given their known susceptibility to salinity. In order to determine the NaCl solution to best discriminate the plants’ reaction to salinity, the plants were irrigated with a 200 mM solution for the first three irrigations. The concentration of sodium chloride in the irrigation water was increased to 400 mM in the fourth and fifth irrigations, and to 600 mM in the sixth and last irrigation, after which the treatment was dis-continued and tap water was used for irrigation. A set of three pots of plants of the same genotypes received hand irrigation from a water can, as needed, using ultra-pure water (18.2 MΩ cm at 25 °C) in the same way and at the same times to be used as a control.
Once the optimum NaCl concentration had been determined, plants were tested 4 months after planting in a greenhouse in a completely randomized design, with three reps. During this period, plants were irrigated weekly with 120 mL of the above mentioned NaCl solution for 5 weeks. Three individual plants of each genotype were watered with ultrapure water (18.2 MΩ cm at 25 °C) under the same conditions and at the same time. A visual evalua-tion of the extent of necrotic tissue, resulting from salinity stress on the top 4 leaves of the plants was conducted 6 weeks after the initiation of the experiment, and a grade was assigned on a scale of 0-5, according to the extent of salt damage symptoms (leaf necrotic area), where: 0 = green leaves with no signs of salt damage; 1 = less than 10
331
Da Silva et al. Energycane and sugarcane genetic breeding
Sci. Agric. v.75, n.4, p.329-338, July/August 2018
% area of salt damage; 2 = 11- 30 % area of salt damage; 3 = 30-50 % area of salt damage; 4 = more than 50 % area of salt damage and 5 = dead plants due to salt toxicity.
Symptoms evaluation was performed independent-ly by three different evaluators, who compared the leaf appearance of the NaCl treated and untreated plants. Grades were transformed using the Square Root function, based on the analysis of the data, after a visual check that the transformed data appeared appropriate for the context of the results (Mead, 1988) for the Analysis of Variance, which was performed using the software SAS v. 9.4. program.
Molecular markersGenomic DNA was extracted from 100 mg of fresh
leaf tissue after macerating with TissueLyzer (Qiagen), following the manufacturer’s guidelines. DNA quality and quantity was checked using a spectrophotometer.
PCR reactions were generated following the proce-dure reported by Schuelke (2000). The PCR mixtures con-sisted of 50 ng genomic DNA, one μL of one × standard PCR buffer, 0.2 mM of dNTP, 0.02 μM forward primer with M13 (-29) tail (5’-cac gac gtt gta aaa cga cgg cac ggt cgg ttc cct c-3’), 0.2 μM of IRDye labeled M13 forward primer, 0.2 μM of reverse primer and 0.04 U of Taq DNA polymerase, in a total volume 10 μL. The reaction was generated in a thermal cycler under the following cycling conditions: 94 °C (5 min), then 30 cycles at 94 °C (30 s) / 64 °C (45 s) / 72 °C (45 s), followed by 8 cycles 94 °C (30 s) / 53 °C (45 s) / 72 °C (45 s), and a final extension at 72 °C for 10 min.
Simple Sequence Repeat (SSR) markers were used for genotyping each accession and were selected from Marconi et al. (2011). Twenty-four SSR primer pairs were used in a preliminary screening. PCR products were visu-alized on 6 % denatured polyacrylamide gel using a Licor 4300 DNA analyzer (Licor), following the manufacturer’s recommendation. Only the loci presenting consistent am-plifications and readable patterns were considered for ge-netic evaluation. Each SSR allele was treated as dominant and all alleles detected were converted to a binary system, and scored as present (1) or absent (0). Non-amplified or inconsistent loci were scored as missing data. Thus, a bi-nary matrix (0/1) was generated for further analysis.
Data analyses The phenotypic data matrix was generated from the
six agronomic traits (number of tillers, dry weight, brix, lignin, cellulose and hemicellulose content) measured in the 121 accessions used. A Principal Component Analysis (PCA) was performed using the prcomp function imple-mented in the stats R software package (R: A language and environment for statistical computing).
A standardized pairwise matrix, based on mean Eu-clidean distance, was generated using the DARwin V6.0.4 software (Perrier and Jacquemoud-Collet, 2006).
Genetic diversity measures from the molecular marker data were estimated as follows: estimated allele frequency, expected heterozigosity (He, or gene diversity),
Shannon’s Information Index of Diversity (I) and Nei’s distance were estimated by GenAlEx v. 6.5 software pro-gram (Peakall and Smouse, 2012). The Nei’s distance ma-trix was used for Principal Coordinate Analysis (PCoA). This analysis is a multivariate technique that allows for finding and plotting the major patterns in a multivariate data set (multiple loci and multiple samples). The major axes of variation are located within a multidimensional data set, revealing the separation between distinct groups (Peakall and Smouse, 2012). Polymorphism information content (PIC) and major allele frequency (MAF) were ob-tained using the software PowerMarker v. 3.25 program (Liu and Muse, 2005).
A cluster analysis was carried out using the DAR-win software program and a dissimilarity matrix was calculated using Jaccard’s coefficient, with pairwise vari-able deletion. A dissimilarity matrix was used to draw a dendrogram by means of the weighted neighbor-joining method with 500 bootstrap replicates, which was em-ployed to evaluate the reliability of the dendrogram topol-ogy. The cophenetic correlation coefficient between the matrix of genetic dissimilarity and the dendrogram was computed using DARwin, which measures the correla-tion between distance values calculated during the den-drogram construction and the observed distance. This has been used as a criterion for evaluating the efficiency of the cluster method (Sokal and Rohlf, 1962).
The correlation between the dissimilarity matrices from the phenotypic and molecular data was measured using Mantel’s test with 5,000 permutations, allowing us to assess the resemblance between the genotypic and phenotypic matrices. In order to simultaneously capture all available information, i.e., phenotypic and molecular data, the matrices were summed algebraically to generate a joint matrix, which was used for cluster analysis of the combined dataset. Mantel’s test and the sum of matri-ces procedures were performed using the Genes software program (Cruz, 2013).
To construct a core collection representing the maximum diversity of the whole collection with mini-mal redundancy, we used the maximum length sub-tree method implemented by the DARwin software package. This method searches for a subset of units minimizing the redundancy between units and limiting, if possible, the loss of diversity. Redundancy means that a number of units are very close and they garner the same informa-tion on diversity. In order to maintain, at best, diversity in the tree, we chose to remove the unit with the smallest edge and to keep the unit with the longest edge as recom-mended by the software’s guidelines.
To evaluate the average performance of all acces-sions for each phenotypic trait studied, each accession had a Trait Performance Ratio (TPR) calculated as follows:
TPR = TPi/TPm
where: TP = Trait Performance; i = accession; m = mean value for the whole set.
332
Da Silva et al. Energycane and sugarcane genetic breeding
Sci. Agric. v.75, n.4, p.329-338, July/August 2018
Results
Phenotypic characterization of the S. spontaneum collection
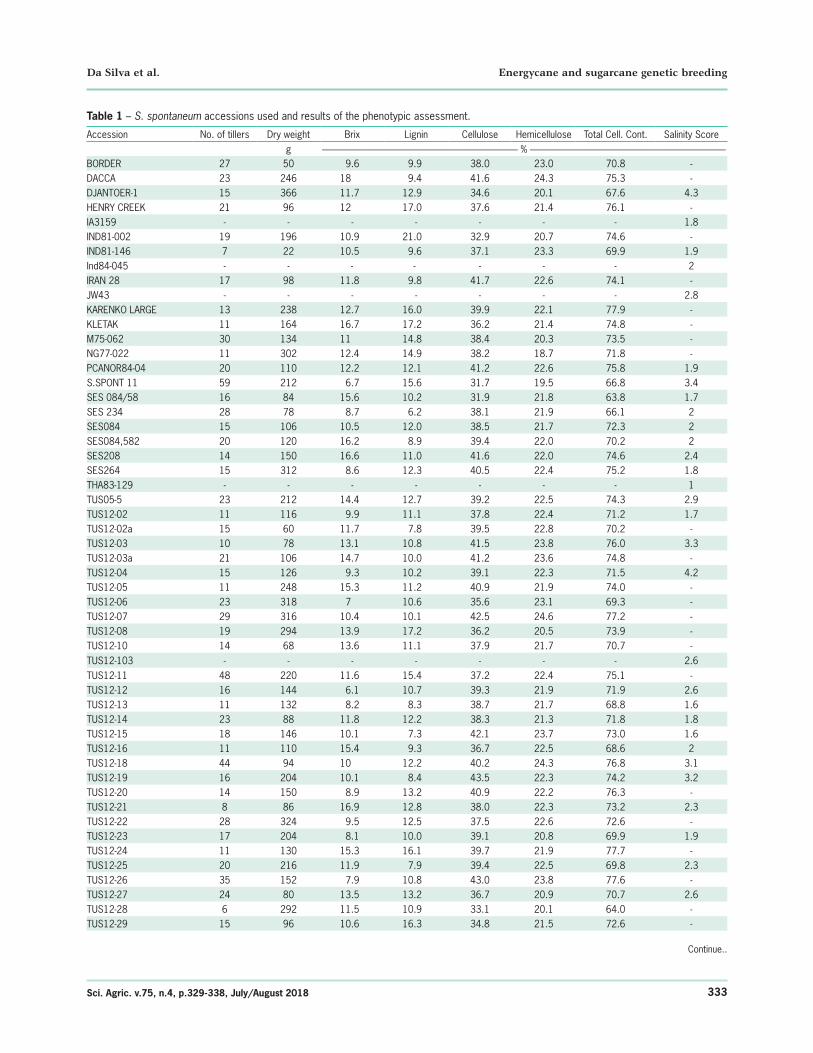
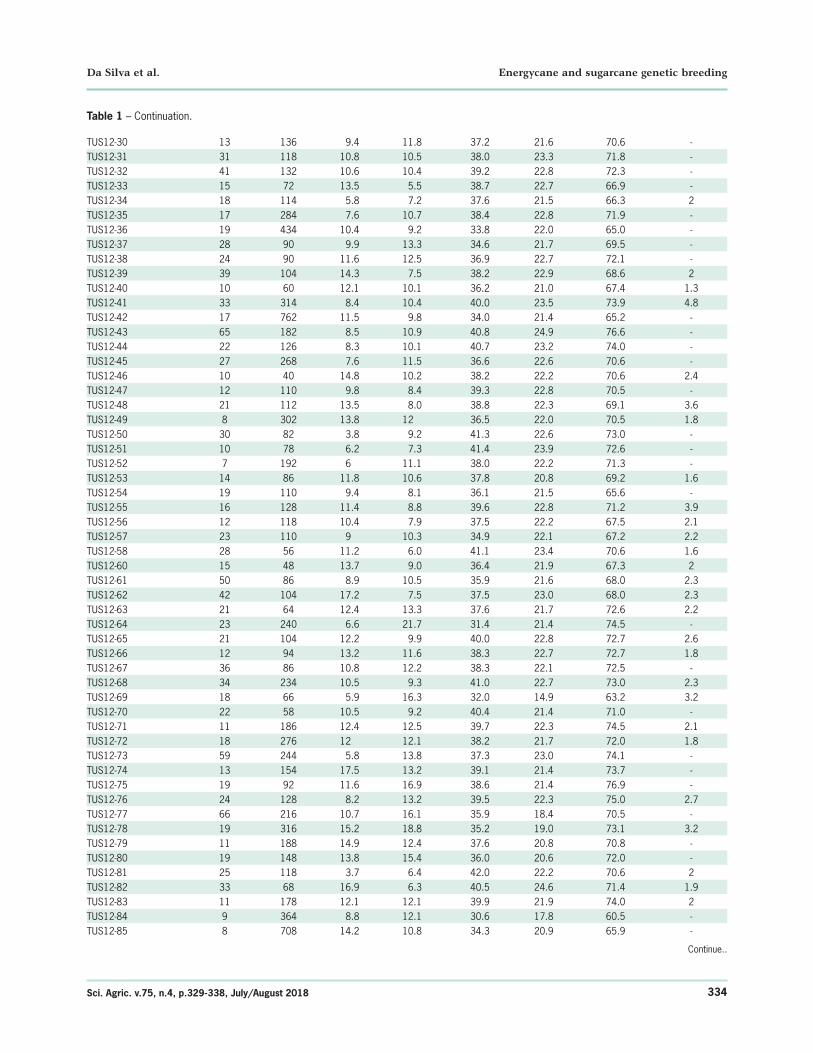
Agronomic trait measurements are presented in Table 1. The individuals showed considerable variation in all traits studied: the number of tillers ranged from 6 to 69, with a mean of 22.0 ± 13. Dry weight ranged from 22 to 762 g (per unit area evaluated), with a mean of 178 ± 130 g. Brix ranged from 3.7 to 18, with a mean of 11.2 ± 3.0. Lignin, cellulose and hemicellulose content ranged from 6 to 22 %, 29 to 44 % and 15 to 25 %, with averages of 12 % ± 3 %, 38 % ± 3 %, 38 % ± 3 % and 22 % ± 2 %, respectively, while Total Cellulosic Content ranged from 5 % to 78 % with a mean of 72 % ± 4 %.
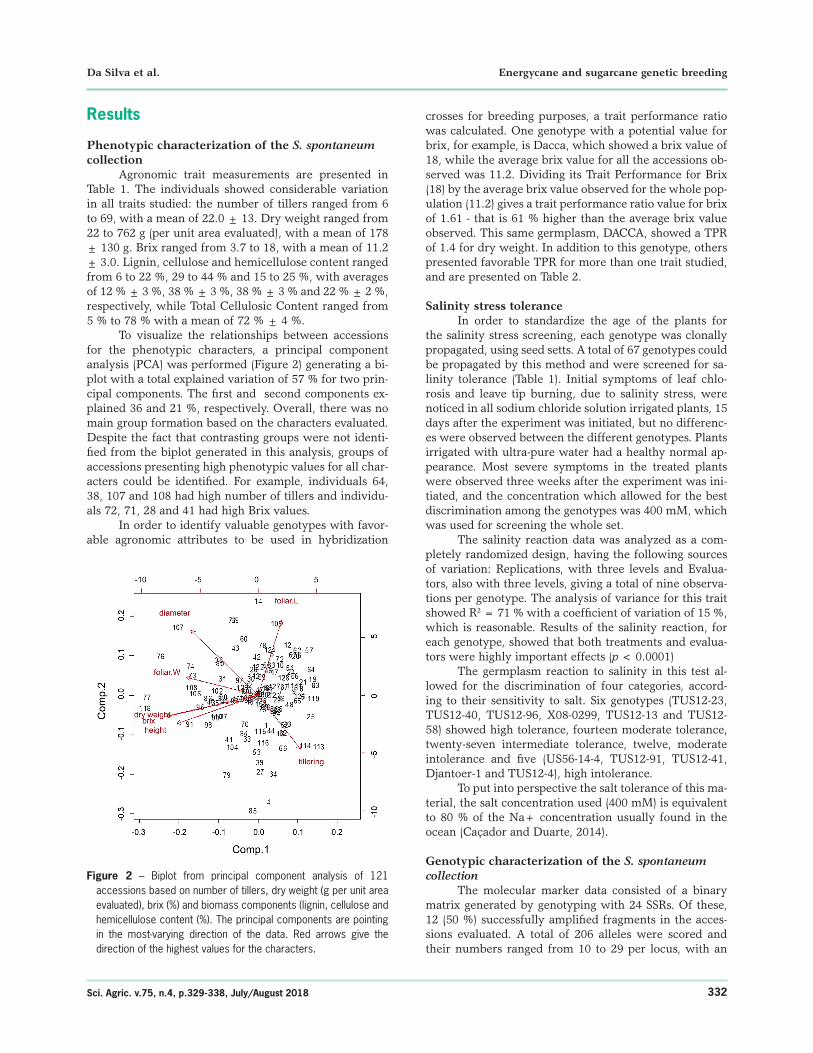
To visualize the relationships between accessions for the phenotypic characters, a principal component analysis (PCA) was performed (Figure 2) generating a bi-plot with a total explained variation of 57 % for two prin-cipal components. The first and second components ex-plained 36 and 21 %, respectively. Overall, there was no main group formation based on the characters evaluated. Despite the fact that contrasting groups were not identi-fied from the biplot generated in this analysis, groups of accessions presenting high phenotypic values for all char-acters could be identified. For example, individuals 64, 38, 107 and 108 had high number of tillers and individu-als 72, 71, 28 and 41 had high Brix values.
In order to identify valuable genotypes with favor-able agronomic attributes to be used in hybridization
crosses for breeding purposes, a trait performance ratio was calculated. One genotype with a potential value for brix, for example, is Dacca, which showed a brix value of 18, while the average brix value for all the accessions ob-served was 11.2. Dividing its Trait Performance for Brix (18) by the average brix value observed for the whole pop-ulation (11.2) gives a trait performance ratio value for brix of 1.61 - that is 61 % higher than the average brix value observed. This same germplasm, DACCA, showed a TPR of 1.4 for dry weight. In addition to this genotype, others presented favorable TPR for more than one trait studied, and are presented on Table 2.
Salinity stress tolerance
In order to standardize the age of the plants for the salinity stress screening, each genotype was clonally propagated, using seed setts. A total of 67 genotypes could be propagated by this method and were screened for sa-linity tolerance (Table 1). Initial symptoms of leaf chlo-rosis and leave tip burning, due to salinity stress, were noticed in all sodium chloride solution irrigated plants, 15 days after the experiment was initiated, but no differenc-es were observed between the different genotypes. Plants irrigated with ultra-pure water had a healthy normal ap-pearance. Most severe symptoms in the treated plants were observed three weeks after the experiment was ini-tiated, and the concentration which allowed for the best discrimination among the genotypes was 400 mM, which was used for screening the whole set.
The salinity reaction data was analyzed as a com-pletely randomized design, having the following sources of variation: Replications, with three levels and Evalua-tors, also with three levels, giving a total of nine observa-tions per genotype. The analysis of variance for this trait showed R2 = 71 % with a coefficient of variation of 15 %, which is reasonable. Results of the salinity reaction, for each genotype, showed that both treatments and evalua-tors were highly important effects (p < 0.0001)
The germplasm reaction to salinity in this test al-lowed for the discrimination of four categories, accord-ing to their sensitivity to salt. Six genotypes (TUS12-23, TUS12-40, TUS12-96, X08-0299, TUS12-13 and TUS12-58) showed high tolerance, fourteen moderate tolerance, twenty-seven intermediate tolerance, twelve, moderate intolerance and five (US56-14-4, TUS12-91, TUS12-41, Djantoer-1 and TUS12-4), high intolerance.
To put into perspective the salt tolerance of this ma-terial, the salt concentration used (400 mM) is equivalent to 80 % of the Na+ concentration usually found in the ocean (Caçador and Duarte, 2014).
Genotypic characterization of the S. spontaneum collection
The molecular marker data consisted of a binary matrix generated by genotyping with 24 SSRs. Of these, 12 (50 %) successfully amplified fragments in the acces-sions evaluated. A total of 206 alleles were scored and their numbers ranged from 10 to 29 per locus, with an
Figure 2 – Biplot from principal component analysis of 121 accessions based on number of tillers, dry weight (g per unit area evaluated), brix (%) and biomass components (lignin, cellulose and hemicellulose content (%). The principal components are pointing in the most-varying direction of the data. Red arrows give the direction of the highest values for the characters.
333
Da Silva et al. Energycane and sugarcane genetic breeding
Sci. Agric. v.75, n.4, p.329-338, July/August 2018
Continue..
Table 1 – S. spontaneum accessions used and results of the phenotypic assessment.
Accession No. of tillers Dry weight Brix Lignin Cellulose Hemicellulose Total Cell. Cont. Salinity Scoreg --------------------------------------------------------------------------------------------------- % ---------------------------------------------------------------------------------------------------
BORDER 27 50 9.6 9.9 38.0 23.0 70.8 -DACCA 23 246 18 9.4 41.6 24.3 75.3 -DJANTOER-1 15 366 11.7 12.9 34.6 20.1 67.6 4.3HENRY CREEK 21 96 12 17.0 37.6 21.4 76.1 -IA3159 - - - - - - - 1.8IND81-002 19 196 10.9 21.0 32.9 20.7 74.6 -IND81-146 7 22 10.5 9.6 37.1 23.3 69.9 1.9Ind84-045 - - - - - - - 2IRAN 28 17 98 11.8 9.8 41.7 22.6 74.1 -JW43 - - - - - - - 2.8KARENKO LARGE 13 238 12.7 16.0 39.9 22.1 77.9 -KLETAK 11 164 16.7 17.2 36.2 21.4 74.8 -M75-062 30 134 11 14.8 38.4 20.3 73.5 -NG77-022 11 302 12.4 14.9 38.2 18.7 71.8 -PCANOR84-04 20 110 12.2 12.1 41.2 22.6 75.8 1.9S.SPONT 11 59 212 6.7 15.6 31.7 19.5 66.8 3.4SES 084/58 16 84 15.6 10.2 31.9 21.8 63.8 1.7SES 234 28 78 8.7 6.2 38.1 21.9 66.1 2SES084 15 106 10.5 12.0 38.5 21.7 72.3 2SES084,582 20 120 16.2 8.9 39.4 22.0 70.2 2SES208 14 150 16.6 11.0 41.6 22.0 74.6 2.4SES264 15 312 8.6 12.3 40.5 22.4 75.2 1.8THA83-129 - - - - - - - 1TUS05-5 23 212 14.4 12.7 39.2 22.5 74.3 2.9TUS12-02 11 116 9.9 11.1 37.8 22.4 71.2 1.7TUS12-02a 15 60 11.7 7.8 39.5 22.8 70.2 -TUS12-03 10 78 13.1 10.8 41.5 23.8 76.0 3.3TUS12-03a 21 106 14.7 10.0 41.2 23.6 74.8 -TUS12-04 15 126 9.3 10.2 39.1 22.3 71.5 4.2TUS12-05 11 248 15.3 11.2 40.9 21.9 74.0 -TUS12-06 23 318 7 10.6 35.6 23.1 69.3 -TUS12-07 29 316 10.4 10.1 42.5 24.6 77.2 -TUS12-08 19 294 13.9 17.2 36.2 20.5 73.9 -TUS12-10 14 68 13.6 11.1 37.9 21.7 70.7 -TUS12-103 - - - - - - - 2.6TUS12-11 48 220 11.6 15.4 37.2 22.4 75.1 -TUS12-12 16 144 6.1 10.7 39.3 21.9 71.9 2.6TUS12-13 11 132 8.2 8.3 38.7 21.7 68.8 1.6TUS12-14 23 88 11.8 12.2 38.3 21.3 71.8 1.8TUS12-15 18 146 10.1 7.3 42.1 23.7 73.0 1.6TUS12-16 11 110 15.4 9.3 36.7 22.5 68.6 2TUS12-18 44 94 10 12.2 40.2 24.3 76.8 3.1TUS12-19 16 204 10.1 8.4 43.5 22.3 74.2 3.2TUS12-20 14 150 8.9 13.2 40.9 22.2 76.3 -TUS12-21 8 86 16.9 12.8 38.0 22.3 73.2 2.3TUS12-22 28 324 9.5 12.5 37.5 22.6 72.6 -TUS12-23 17 204 8.1 10.0 39.1 20.8 69.9 1.9TUS12-24 11 130 15.3 16.1 39.7 21.9 77.7 -TUS12-25 20 216 11.9 7.9 39.4 22.5 69.8 2.3TUS12-26 35 152 7.9 10.8 43.0 23.8 77.6 -TUS12-27 24 80 13.5 13.2 36.7 20.9 70.7 2.6TUS12-28 6 292 11.5 10.9 33.1 20.1 64.0 -TUS12-29 15 96 10.6 16.3 34.8 21.5 72.6 -
334
Da Silva et al. Energycane and sugarcane genetic breeding
Sci. Agric. v.75, n.4, p.329-338, July/August 2018
TUS12-30 13 136 9.4 11.8 37.2 21.6 70.6 -TUS12-31 31 118 10.8 10.5 38.0 23.3 71.8 -TUS12-32 41 132 10.6 10.4 39.2 22.8 72.3 -TUS12-33 15 72 13.5 5.5 38.7 22.7 66.9 -TUS12-34 18 114 5.8 7.2 37.6 21.5 66.3 2TUS12-35 17 284 7.6 10.7 38.4 22.8 71.9 -TUS12-36 19 434 10.4 9.2 33.8 22.0 65.0 -TUS12-37 28 90 9.9 13.3 34.6 21.7 69.5 -TUS12-38 24 90 11.6 12.5 36.9 22.7 72.1 -TUS12-39 39 104 14.3 7.5 38.2 22.9 68.6 2TUS12-40 10 60 12.1 10.1 36.2 21.0 67.4 1.3TUS12-41 33 314 8.4 10.4 40.0 23.5 73.9 4.8TUS12-42 17 762 11.5 9.8 34.0 21.4 65.2 -TUS12-43 65 182 8.5 10.9 40.8 24.9 76.6 -TUS12-44 22 126 8.3 10.1 40.7 23.2 74.0 -TUS12-45 27 268 7.6 11.5 36.6 22.6 70.6 -TUS12-46 10 40 14.8 10.2 38.2 22.2 70.6 2.4TUS12-47 12 110 9.8 8.4 39.3 22.8 70.5 -TUS12-48 21 112 13.5 8.0 38.8 22.3 69.1 3.6TUS12-49 8 302 13.8 12 36.5 22.0 70.5 1.8TUS12-50 30 82 3.8 9.2 41.3 22.6 73.0 -TUS12-51 10 78 6.2 7.3 41.4 23.9 72.6 -TUS12-52 7 192 6 11.1 38.0 22.2 71.3 -TUS12-53 14 86 11.8 10.6 37.8 20.8 69.2 1.6TUS12-54 19 110 9.4 8.1 36.1 21.5 65.6 -TUS12-55 16 128 11.4 8.8 39.6 22.8 71.2 3.9TUS12-56 12 118 10.4 7.9 37.5 22.2 67.5 2.1TUS12-57 23 110 9 10.3 34.9 22.1 67.2 2.2TUS12-58 28 56 11.2 6.0 41.1 23.4 70.6 1.6TUS12-60 15 48 13.7 9.0 36.4 21.9 67.3 2TUS12-61 50 86 8.9 10.5 35.9 21.6 68.0 2.3TUS12-62 42 104 17.2 7.5 37.5 23.0 68.0 2.3TUS12-63 21 64 12.4 13.3 37.6 21.7 72.6 2.2TUS12-64 23 240 6.6 21.7 31.4 21.4 74.5 -TUS12-65 21 104 12.2 9.9 40.0 22.8 72.7 2.6TUS12-66 12 94 13.2 11.6 38.3 22.7 72.7 1.8TUS12-67 36 86 10.8 12.2 38.3 22.1 72.5 -TUS12-68 34 234 10.5 9.3 41.0 22.7 73.0 2.3TUS12-69 18 66 5.9 16.3 32.0 14.9 63.2 3.2TUS12-70 22 58 10.5 9.2 40.4 21.4 71.0 -TUS12-71 11 186 12.4 12.5 39.7 22.3 74.5 2.1TUS12-72 18 276 12 12.1 38.2 21.7 72.0 1.8TUS12-73 59 244 5.8 13.8 37.3 23.0 74.1 -TUS12-74 13 154 17.5 13.2 39.1 21.4 73.7 -TUS12-75 19 92 11.6 16.9 38.6 21.4 76.9 -TUS12-76 24 128 8.2 13.2 39.5 22.3 75.0 2.7TUS12-77 66 216 10.7 16.1 35.9 18.4 70.5 -TUS12-78 19 316 15.2 18.8 35.2 19.0 73.1 3.2TUS12-79 11 188 14.9 12.4 37.6 20.8 70.8 -TUS12-80 19 148 13.8 15.4 36.0 20.6 72.0 -TUS12-81 25 118 3.7 6.4 42.0 22.2 70.6 2TUS12-82 33 68 16.9 6.3 40.5 24.6 71.4 1.9TUS12-83 11 178 12.1 12.1 39.9 21.9 74.0 2TUS12-84 9 364 8.8 12.1 30.6 17.8 60.5 -TUS12-85 8 708 14.2 10.8 34.3 20.9 65.9 -
Table 1 – Continuation.
Continue..
335
Da Silva et al. Energycane and sugarcane genetic breeding
Sci. Agric. v.75, n.4, p.329-338, July/August 2018
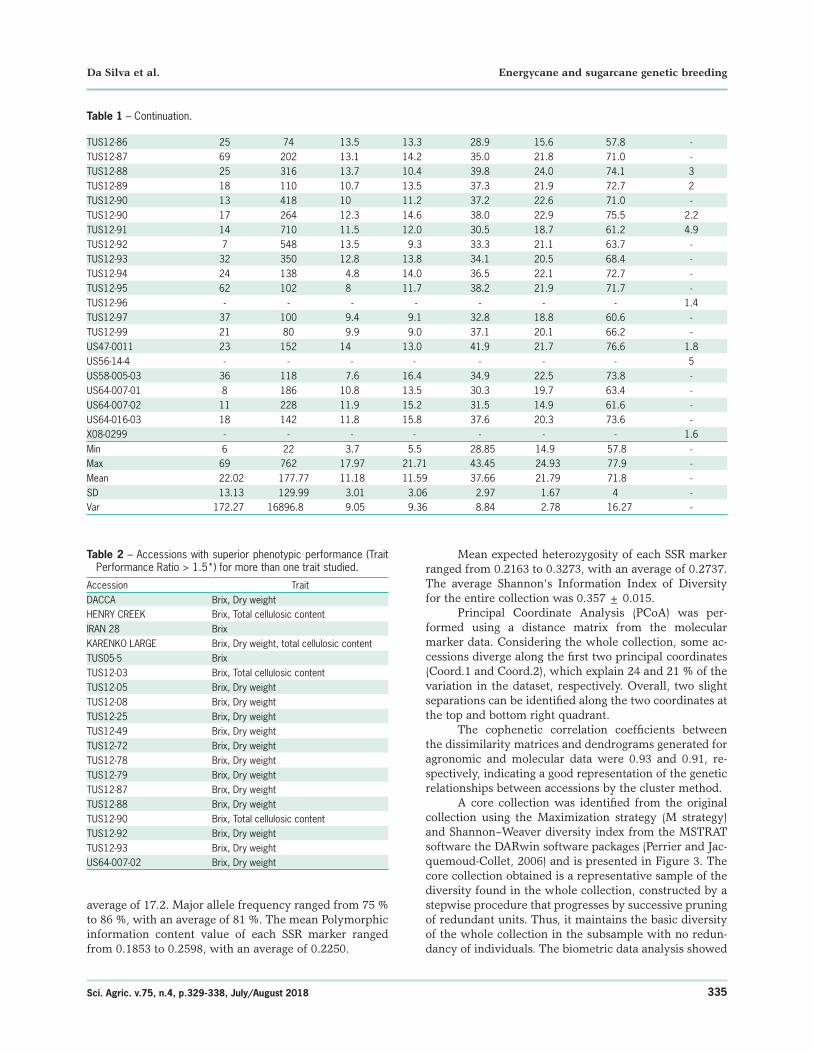
TUS12-86 25 74 13.5 13.3 28.9 15.6 57.8 -TUS12-87 69 202 13.1 14.2 35.0 21.8 71.0 -TUS12-88 25 316 13.7 10.4 39.8 24.0 74.1 3TUS12-89 18 110 10.7 13.5 37.3 21.9 72.7 2TUS12-90 13 418 10 11.2 37.2 22.6 71.0 -TUS12-90 17 264 12.3 14.6 38.0 22.9 75.5 2.2TUS12-91 14 710 11.5 12.0 30.5 18.7 61.2 4.9TUS12-92 7 548 13.5 9.3 33.3 21.1 63.7 -TUS12-93 32 350 12.8 13.8 34.1 20.5 68.4 -TUS12-94 24 138 4.8 14.0 36.5 22.1 72.7 -TUS12-95 62 102 8 11.7 38.2 21.9 71.7 -TUS12-96 - - - - - - - 1.4TUS12-97 37 100 9.4 9.1 32.8 18.8 60.6 -TUS12-99 21 80 9.9 9.0 37.1 20.1 66.2 -US47-0011 23 152 14 13.0 41.9 21.7 76.6 1.8US56-14-4 - - - - - - - 5US58-005-03 36 118 7.6 16.4 34.9 22.5 73.8 -US64-007-01 8 186 10.8 13.5 30.3 19.7 63.4 -US64-007-02 11 228 11.9 15.2 31.5 14.9 61.6 -US64-016-03 18 142 11.8 15.8 37.6 20.3 73.6 -X08-0299 - - - - - - - 1.6Min 6 22 3.7 5.5 28.85 14.9 57.8 -Max 69 762 17.97 21.71 43.45 24.93 77.9 -Mean 22.02 177.77 11.18 11.59 37.66 21.79 71.8 -SD 13.13 129.99 3.01 3.06 2.97 1.67 4 -Var 172.27 16896.8 9.05 9.36 8.84 2.78 16.27 -
Table 1 – Continuation.
Table 2 – Accessions with superior phenotypic performance (Trait Performance Ratio > 1.5*) for more than one trait studied.
Accession TraitDACCA Brix, Dry weightHENRY CREEK Brix, Total cellulosic contentIRAN 28 Brix KARENKO LARGE Brix, Dry weight, total cellulosic contentTUS05-5 BrixTUS12-03 Brix, Total cellulosic contentTUS12-05 Brix, Dry weightTUS12-08 Brix, Dry weightTUS12-25 Brix, Dry weightTUS12-49 Brix, Dry weightTUS12-72 Brix, Dry weightTUS12-78 Brix, Dry weightTUS12-79 Brix, Dry weightTUS12-87 Brix, Dry weightTUS12-88 Brix, Dry weightTUS12-90 Brix, Total cellulosic contentTUS12-92 Brix, Dry weightTUS12-93 Brix, Dry weightUS64-007-02 Brix, Dry weight
average of 17.2. Major allele frequency ranged from 75 % to 86 %, with an average of 81 %. The mean Polymorphic information content value of each SSR marker ranged from 0.1853 to 0.2598, with an average of 0.2250.
Mean expected heterozygosity of each SSR marker ranged from 0.2163 to 0.3273, with an average of 0.2737. The average Shannon’s Information Index of Diversity for the entire collection was 0.357 ± 0.015.
Principal Coordinate Analysis (PCoA) was per-formed using a distance matrix from the molecular marker data. Considering the whole collection, some ac-cessions diverge along the first two principal coordinates (Coord.1 and Coord.2), which explain 24 and 21 % of the variation in the dataset, respectively. Overall, two slight separations can be identified along the two coordinates at the top and bottom right quadrant.
The cophenetic correlation coefficients between the dissimilarity matrices and dendrograms generated for agronomic and molecular data were 0.93 and 0.91, re-spectively, indicating a good representation of the genetic relationships between accessions by the cluster method.
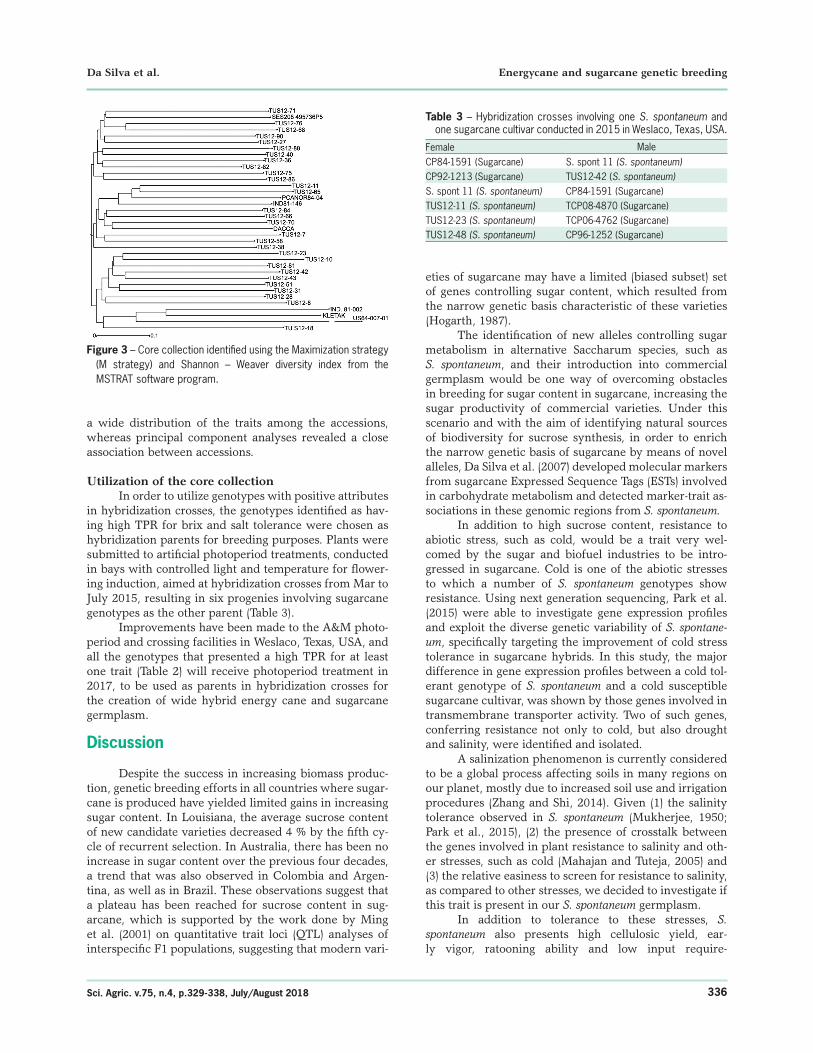
A core collection was identified from the original collection using the Maximization strategy (M strategy) and Shannon–Weaver diversity index from the MSTRAT software the DARwin software packages (Perrier and Jac-quemoud-Collet, 2006) and is presented in Figure 3. The core collection obtained is a representative sample of the diversity found in the whole collection, constructed by a stepwise procedure that progresses by successive pruning of redundant units. Thus, it maintains the basic diversity of the whole collection in the subsample with no redun-dancy of individuals. The biometric data analysis showed
336
Da Silva et al. Energycane and sugarcane genetic breeding
Sci. Agric. v.75, n.4, p.329-338, July/August 2018
a wide distribution of the traits among the accessions, whereas principal component analyses revealed a close association between accessions.
Utilization of the core collectionIn order to utilize genotypes with positive attributes
in hybridization crosses, the genotypes identified as hav-ing high TPR for brix and salt tolerance were chosen as hybridization parents for breeding purposes. Plants were submitted to artificial photoperiod treatments, conducted in bays with controlled light and temperature for flower-ing induction, aimed at hybridization crosses from Mar to July 2015, resulting in six progenies involving sugarcane genotypes as the other parent (Table 3).
Improvements have been made to the A&M photo-period and crossing facilities in Weslaco, Texas, USA, and all the genotypes that presented a high TPR for at least one trait (Table 2) will receive photoperiod treatment in 2017, to be used as parents in hybridization crosses for the creation of wide hybrid energy cane and sugarcane germplasm.
Discussion
Despite the success in increasing biomass produc-tion, genetic breeding efforts in all countries where sugar-cane is produced have yielded limited gains in increasing sugar content. In Louisiana, the average sucrose content of new candidate varieties decreased 4 % by the fifth cy-cle of recurrent selection. In Australia, there has been no increase in sugar content over the previous four decades, a trend that was also observed in Colombia and Argen-tina, as well as in Brazil. These observations suggest that a plateau has been reached for sucrose content in sug-arcane, which is supported by the work done by Ming et al. (2001) on quantitative trait loci (QTL) analyses of interspecific F1 populations, suggesting that modern vari-
Figure 3 – Core collection identified using the Maximization strategy (M strategy) and Shannon – Weaver diversity index from the MSTRAT software program.
Table 3 – Hybridization crosses involving one S. spontaneum and one sugarcane cultivar conducted in 2015 in Weslaco, Texas, USA.
Female MaleCP84-1591 (Sugarcane) S. spont 11 (S. spontaneum)CP92-1213 (Sugarcane) TUS12-42 (S. spontaneum)S. spont 11 (S. spontaneum) CP84-1591 (Sugarcane)TUS12-11 (S. spontaneum) TCP08-4870 (Sugarcane)TUS12-23 (S. spontaneum) TCP06-4762 (Sugarcane)TUS12-48 (S. spontaneum) CP96-1252 (Sugarcane)
eties of sugarcane may have a limited (biased subset) set of genes controlling sugar content, which resulted from the narrow genetic basis characteristic of these varieties (Hogarth, 1987).
The identification of new alleles controlling sugar metabolism in alternative Saccharum species, such as S. spontaneum, and their introduction into commercial germplasm would be one way of overcoming obstacles in breeding for sugar content in sugarcane, increasing the sugar productivity of commercial varieties. Under this scenario and with the aim of identifying natural sources of biodiversity for sucrose synthesis, in order to enrich the narrow genetic basis of sugarcane by means of novel alleles, Da Silva et al. (2007) developed molecular markers from sugarcane Expressed Sequence Tags (ESTs) involved in carbohydrate metabolism and detected marker-trait as-sociations in these genomic regions from S. spontaneum.
In addition to high sucrose content, resistance to abiotic stress, such as cold, would be a trait very wel-comed by the sugar and biofuel industries to be intro-gressed in sugarcane. Cold is one of the abiotic stresses to which a number of S. spontaneum genotypes show resistance. Using next generation sequencing, Park et al. (2015) were able to investigate gene expression profiles and exploit the diverse genetic variability of S. spontane-um, specifically targeting the improvement of cold stress tolerance in sugarcane hybrids. In this study, the major difference in gene expression profiles between a cold tol-erant genotype of S. spontaneum and a cold susceptible sugarcane cultivar, was shown by those genes involved in transmembrane transporter activity. Two of such genes, conferring resistance not only to cold, but also drought and salinity, were identified and isolated.
A salinization phenomenon is currently considered to be a global process affecting soils in many regions on our planet, mostly due to increased soil use and irrigation procedures (Zhang and Shi, 2014). Given (1) the salinity tolerance observed in S. spontaneum (Mukherjee, 1950; Park et al., 2015), (2) the presence of crosstalk between the genes involved in plant resistance to salinity and oth-er stresses, such as cold (Mahajan and Tuteja, 2005) and (3) the relative easiness to screen for resistance to salinity, as compared to other stresses, we decided to investigate if this trait is present in our S. spontaneum germplasm.
In addition to tolerance to these stresses, S. spontaneum also presents high cellulosic yield, ear-ly vigor, ratooning ability and low input require-
337
Da Silva et al. Energycane and sugarcane genetic breeding
Sci. Agric. v.75, n.4, p.329-338, July/August 2018
ments. These results indicate how a S. spontaneum collection can represent a valuable source of genes. Being the species with the greatest potential source of genetic variability among all sugarcane related species, S. spontaneum has the widest distribution (Da Silva and Sobral, 1996; Tai and Miller, 2002). Its ability to rapidly propagate and colonize even in low-input areas makes it an obnoxious weed in many countries, including the U.S.A., but the senior author of this work currently holds a USDA-APHIS special permit to plant noxious weeds. Under such permit, a collection of S. spontaneum was introduced in Weslaco, Texas, USA. Germplasm from this collection have been used as parents in hybridiza-tion crosses with sugarcane, aimed at creating energycane genotypes and introgressing positive alleles for brix and stress related traits in sugarcane and energy cane.
Considering the importance of assessing genetic variability for breeding purposes and the difficulties in conducting trials in a whole collection, the establishment of a representative core collection, carefully selected, is a useful approach to provide genetic resources for the ge-netic improvement of sugarcane cultivars. It allows for replicated and more intensive studies, such as parental selection for crossing, gene discovery and marker-trait associations aimed at marker-assisted selection. Using this approach, the first S. spontaneum × sugarcane hybrid germplasm were created in 2015 and are currently grow-ing in the field.
With the goal of identifying candidate genes re-sponsible for the traits of interest, molecular markers be-gan to be applied in sugarcane in the early 90’s for linkage mapping (A1-Janabi et al., 1993; Da Silva et al., 1993; A1-Janabi et al., 1994; Da Silva et al., 1995), gene tagging us-ing ESTs - Expressed Sequence Tags - (Da Silva, 2001; Da Silva and Bressiani, 2005; Da Silva and Solís-Gracia, 2006) and DNA fingerprinting to variety identification (Da Silva et al., 2008). One important application of these works to genetic breeding would be the implementation of mark-er assisted selection (MAS), if important traits could be tagged by markers.
Several molecular maps of sugarcane, having a S. spontaneum parent, have been created, aimed at identify-ing quantitative trait loci (QTL) for sugar yield (Da Silva and Sorrells, 1996; Ming et al., 2001; Aitken et al., 2005; Da Silva and Bressiani, 2005), but the genome coverage in these maps is restricted, given the limited number of markers mapped. Another limitation of the current sug-arcane linkage maps is the fact that very few of them involve genotypes commonly used in cultivar improve-ment programs. Molecular markers tagging S. spontaneum genes controlling stress resistance, both to abiotic and biotic stresses, could expedite the introgression of these traits into elite lines. For these markers to be useful, in addition to being tightly linked to the allele of interest, they need to be adaptable to high-throughput genotyp-ing systems, in order to be a cost effective strategy. Since all the genetic maps of sugarcane are low resolution, the number of markers available are still quite limited, mak-
ing the lack of tightly linked polymorphic markers the major limiting factor for MAS application in sugarcane.
With this study, the development of informative (polymorphic) markers for these S. spontaneum genotypes, together with their characterization, we have created the tools to explore the naturally occurring genetic variability in this species. Because S. spontaneum naturally hybridiz-es with sugarcane, these tools may expedite introgression through breeding (without the need for costly genetic modification) of S. spontaneum positive alleles controlling important traits such as sucrose content, with the poten-tial to break the plateau observed, and abiotic stress resis-tance into modern sugarcane and energy cane lines.
The core collection obtained in this study may be validated by principal component analysis, comparing the distribution of accessions and the genetic structure of the core collection with the whole collection. The determina-tion of the genetic diversity available in the collection will allow for the optimum establishment of a S. spontaneum core collection, improving conservation, documentation and optimum utilization of this important germplasm for genetic breeding, towards the “Spontanization” Process (Da Silva, 2017), not only of energy cane, but also of sug-arcane.
Conclusion
Genotypes of S. spontaneum showing positive ag-ronomic traits, have been identified and will be used in hybridization crosses with sugarcane cultivars and elite clones, resulting in new wide hybrid genotypes. If the fa-vorable alleles controlling these traits are expressed in the presence of the S. officinarum chromosomes, coming from the sugarcane genotype parent, in the same way as they are in S. spontaneum, these wide hybrids may then rep-resent an extremely important asset, for both sugarcane and energycane, offering the potential to (1) increase the sucrose concentration in their stalks and (2) allow for the production of sugar and/or biomass for energy under low input conditions, in areas prone to abiotic stress.
Acknowledgments
This work was financially supported by the Texas A&M AgriLife Research, Texas A&M University System, with funds from the Texas Governor’s Office, Emerging Technologies Fund – Bioenergy. Special thanks, on behalf of P.M.A. Costa, to the Coordination for the Improvement of Higher Level Personnel (CAPES), for a visiting student fellowship to the Texas A&M AgriLife Research and Ex-periment Center in Weslaco, Texas, USA.
References
Aitken, K.S.; Jackson, P.A.; McIntyre, C.L. 2005. A combination of AFLP and SSR markers provides extensive map coverage and identification of homo(eo)logous linkage groups in a sugarcane cultivar. Theoretical and Applied Genetics 110: 789-801.
338
Da Silva et al. Energycane and sugarcane genetic breeding
Sci. Agric. v.75, n.4, p.329-338, July/August 2018
Aitken, K.S.; McNeil, M. 2010. Diversity analysis. p. 19-42. In: Henry, R.J.; Kole, C., eds. Genetics, genomics and breeding of sugarcane. CRC Press, Boca Raton, FL, USA.
A1-Janabi, S.M.; Honeycutt, R.J.; McClelland, M.; Sobral, B.W.S. 1993. A genetic linkage map of Saccharum spontaneum (L.) 'SES 208'. Genetics 134: 1249-1260.
A1-Janabi, S.M.; Honeycutt, R.J.; Sobral, B.W.S. 1994. Chromosome assortment in Saccharum. Theoretical and Applied Genetics 89: 959-963.
Berding, N.; Roach, B.T. 1987. Germplasm collection, maintenance, and use. p. 143-210. In: Heinz, D.J., ed. Sugarcane improvement through breeding. Elsevier, New York, NY, USA.
Caçador, I.; Duarte, B. 2014. Mechanisms of salt stress tolerance in halophytes: biophysical and biochemical adaptations. p. 19-34. In: Hussain, S.; Wani, M.; Hossain, A., eds. Managing salt tolerance in plants. CRC Press, Boca Raton, FL, USA. DOI: 10.1201/b19246-3
Cruz, C.D. 2013. GENES: a software package for analysis in experimental statistics and quantitative genetics. Acta Scientiarum. Agronomy 35: 271-276. DOI: 10.4025/actasciagron.v35i3.21251
Da Silva, J.A.; Sorrells, M.E.; Burnquist, W.L.; Tanksley, S.D. 1993. RFLP linkage map and genome analysis of Saccharum spontaneum. Genome 36: 782-791.
Da Silva, J.A.; Honeycutt, R.J.; Burnquist, W.L.; Al-Janabi, S.M.; Sorrells, M.E.; Tanksley, S.D.; Sobral, B.W.S. 1995. Saccharum spontaneum L. ‘SES 208’ genetic linkage map combining RFLP- and PCR-based markers. Molecular Breeding 1: 165-179.
Da Silva, J.A.; Sorrells, M.E. 1996. Linkage analysis in polyploids using molecular markers. p. 211-228. In: Jauhar, P.P., ed. Methods of genome analysis in plants. CRC Press, Boca Raton, FL, USA.
Da Silva, J.A.; Sobral, B.W.S. 1996. Genetics of polyploids. p. 3-37. In: Sobral, B. ed. the impact of plant molecular genetics. Birkhäuser, Cambridge, MA, USA.
Da Silva, J.A. 2001. Preliminary analysis of microsatellite markers derived from sugarcane ESTs. Genetics and Molecular Biology 24: 155-159.
Da Silva, J.A.; Bressiani, J.A. 2005. Sucrose synthase EST-derived RFLP marker associated to sugar content in elite sugarcane progeny. Genetics and Molecular Biology 28: 294-298.
Da Silva, J.A.; Solís-Gracia N. 2006. Development of simple sequence repeat markers from genes related to stress resistance in sugarcane. Subtropical Plant Science 58: 5-11.
Da Silva, J.A.; Veremis, J.; Solís-Gracia, N. 2007. Saccharum spontaneum gene tagging by markers developed from sugarcane expressed sequence tags. Subtropical Plant Science 58: 6-14.
Da Silva, J.A.; Solís-Gracia, N.; Silva, P.; Mehkri, F.M. 2008. Sugarcane variety identification through DNA fingerprinting with microsatellites markers. Subtropical Plant Science 60: 1-7.
Da Silva, J.A. 2017. The Importance of the wild cane Saccharum spontaneum for bioenergy genetic breeding. Sugar Tech 19: 229-240. DOI: 10.1007/s12355-017-0510-1
DeMartini, J.D.; Studer, M.H.; Wyman, C.E. 2011. Small-scale and automatable high-throughput compositional analysis of biomass. Biotechnology and Bioengineering 108: 306-12. DOI: 10.1002/bit.22937
Dillon, S.L.; Shapter, F.M.; Henry, R.J.; Cordeiro, G.; Izquierdo, L.; Lee, L.S. 2007. Domestication to crop improvement: genetic resources for sorghum and saccharum (Andropogoneae). Annals of Botany 100: 975-989.
Hanssen, L. 1995. Spectrophotometry, luminescence and colour. p. 115-128. In: Burgess, C.; Jones, D.G., eds. Science and compliance. Elsevier, Amsterdam, Netherlands.
Hogarth, D.M. 1987. Genetics of sugarcane. p. 255-272. In: Heinz, D.J., ed. Sugarcane improvement through breeding. Elsevier, New York, NY, USA.
Liu, K.; Muse, S.V. 2005. PowerMarker: an integrated analysis environment for genetic marker analysis. Bioinformatics 21: 2128-2129. DOI: 10.1093/bioinformatics/bti282
Mahajan, S.; Tuteja, N. 2005. Cold, salinity and drought stresses: an overview. Archives of Biochemistry and Biophysics 444: 139-158.
Marconi, T.; Costa, G.; Estela, A.; Miranda, H.R.C.A.N.; Mancini, M.C.; Cardoso-Silva, C.B.; Oliveira, K.M.; Pinto, L.R.; Mollinari, M.; Garcia, A.A.F.; Souza, A.P. 2011. Functional markers for gene mapping and genetic diversity studies in sugarcane. BMC Research Notes 4: 264.
Martin, F. 1996. Survey of germplasm needs for saccharum species in the United States. Available at: http://www.ars-grin.gov/npgs/cgc_reports/sugar.html [Accessed Aug 12, 2016]
Matsuoka, S.; Kennedy, A.J.; Santos, E.G.D.; Tomazela, A.L.; Rubio, L.C.S. 2014. Energy cane: its concept, development, characteristics, and prospects. Advances in Botany article ID 597275. DOI: http://dx.doi.org/10.1155/2014/597275
Mead, R. 1988. Model assumptions and more general models. p. 283-286. In: Mead, R. The design of experiments. Cambridge University Press, New York, NY, USA.
Ming, R.; Liu, S.-C.; Moore, P.H.; Irvine, J.E.; Paterson, A.H. 2001. QTL analysis in a complex autopolyploid: genetic control of sugar content in sugarcane. Genome Research 11: 2075-2084.
Mukherjee, S.K. 1950. Search for wild relatives of sugarcane in India. International Sugar Journal 52: 261-262.
Park, J.-W.; Benatti, T.; Marconi, T.; Yu, Q.; Solis-Gracia, N.; Mora, V.; Da Silva, J.A. . 2015. Cold Responsive gene expression profiling of sugarcane and Saccharum spontaneum with functional analysis of a cold inducible saccharum homolog of NOD26-like intrinsic protein to salt and water stress. Plos One 10: e0125810. DOI: 10.1371/journal.pone.0125810
Peakall, R.; Smouse, P.E. 2012. GenALEx 6.5: genetic analysis in Excel. Population genetic software for teaching and research-an update. Bioinformatics 28: 2537-2539.
Perrier, X.; Jacquemoud-Collet, J.P. 2006. DARwin software. Available at: http://darwin.cirad.fr/ [Accessed 5 July, 2012]
Schuelke, M. 2000. An economic method for the fluorescent labeling of PCR fragments. Nature Biotechnology 18: 233-234. DOI: 10.1038/72708
Sokal, R.R.; Rohlf, F.J. 1962. The comparison of dendrograms by objective methods. Taxon 11: 33-40.
Tai, P.Y.P.; Miller, J.D. 2002. Germplasm diversity among four sugarcane species for sugar composition. Crop Science 42: 958-964.
Zhang, J.-L.; Shi, H. 2014. Physiological and molecular mechanisms of plant salt tolerance. Photosynthesis Research 115: 1-22.