Preparation of Papers for JMOe - SciELO
14
Journal of Microwaves, Optoelectronics and Electromagnetic Applications, Vol. 16, No. 1, March 2017 DOI: http://dx.doi.org/10.1590/2179-10742017v16i1886 Brazilian Microwave and Optoelectronics Society-SBMO received 30 Oct 2016; for review 03 Nov 2016; accepted 28 Dec 2016 Brazilian Society of Electromagnetism-SBMag © 2017 SBMO/SBMag ISSN 2179-1074 259 Abstract—This paper presents a theoretical and computational study on the analysis of parameters for distributed temperature sensing in optical fibers, based on spontaneous Raman scattering effect. The parameters studied were the optical power level, the range of frequency modulation and the length of the sensor element, as well as the application of optical frequency domain reflectometry (OFDR). Two different approaches of reading temperature information from the backscattered signal were also tested. First, one considered the pulse response, and later the ratio between the amplitudes of the detected signals were taken. Such analysis has shown the second method is more efficient to detect the peak of hot spot temperature in the fiber. Spatial resolution equal to 0.96 m and a temperature resolution of 0.089 ºC were achieved using singlemode fiber 30 meters long. Index Terms — DTS, OFDR, Spontaneous Raman Scattering. I. INTRODUCTION Optical fiber sensors have been extensively studied and shown to be very promising for practical applications. Among the reasons one can highlight the commercial potential of this technology, as well as the ability to monitor various physical parameters such as temperature, pressure, strain, vibration, electrical current, and others [1] – [5]. Optical fiber sensing systems base their operation in optical effects, for example diffraction gratings inscribed on the fiber itself [6] – [9], or explore nonlinear optical effects in fiber to measure physical parameters such as temperature, stress and so on [10] – [14]. In the latter type, such nonlinear optical effects are attractive for sensing because they are derived from a natural interaction of light with the medium in which it travels, allowing the fiber itself be the sensing element. It allows a large number of monitoring points [14]. Such characteristics give to this sensing technology based on nonlinear effects an applicability in structural health monitoring of bridges [15], ships [16], dams [14], as well as oil and gas platforms [2]. In this context, the analysis of parameters for optical sensors, is nowadays one of the reasons Analysis of Parameters for a Distributed Temperature Sensing based on Raman Scattering Luís Cicero Bezerra da Silva 1 , Maria José Pontes 2 , Marcelo Eduardo Vieira Segatto 3 Technology Center, Federal University of Espírito Santo –Vitória, ES - Brazil. E-mails: 1 [email protected], 2 [email protected], 3 [email protected].
-
Upload
khangminh22 -
Category
Documents
-
view
0 -
download
0
Transcript of Preparation of Papers for JMOe - SciELO

Journal of Microwaves, Optoelectronics and Electromagnetic Applications, Vol. 16, No. 1, March 2017 DOI: http://dx.doi.org/10.1590/2179-10742017v16i1886
Brazilian Microwave and Optoelectronics Society-SBMO received 30 Oct 2016; for review 03 Nov 2016; accepted 28 Dec 2016
Brazilian Society of Electromagnetism-SBMag © 2017 SBMO/SBMag ISSN 2179-1074
259
Abstract—This paper presents a theoretical and computational
study on the analysis of parameters for distributed temperature
sensing in optical fibers, based on spontaneous Raman scattering
effect. The parameters studied were the optical power level, the
range of frequency modulation and the length of the sensor
element, as well as the application of optical frequency domain
reflectometry (OFDR). Two different approaches of reading
temperature information from the backscattered signal were also
tested. First, one considered the pulse response, and later the ratio
between the amplitudes of the detected signals were taken. Such
analysis has shown the second method is more efficient to detect the
peak of hot spot temperature in the fiber. Spatial resolution equal
to 0.96 m and a temperature resolution of 0.089 ºC were achieved
using singlemode fiber 30 meters long.
Index Terms — DTS, OFDR, Spontaneous Raman Scattering.
I. INTRODUCTION
Optical fiber sensors have been extensively studied and shown to be very promising for practical
applications. Among the reasons one can highlight the commercial potential of this technology, as
well as the ability to monitor various physical parameters such as temperature, pressure, strain,
vibration, electrical current, and others [1] – [5].
Optical fiber sensing systems base their operation in optical effects, for example diffraction gratings
inscribed on the fiber itself [6] – [9], or explore nonlinear optical effects in fiber to measure physical
parameters such as temperature, stress and so on [10] – [14]. In the latter type, such nonlinear optical
effects are attractive for sensing because they are derived from a natural interaction of light with the
medium in which it travels, allowing the fiber itself be the sensing element. It allows a large number
of monitoring points [14]. Such characteristics give to this sensing technology based on nonlinear
effects an applicability in structural health monitoring of bridges [15], ships [16], dams [14], as well
as oil and gas platforms [2].
In this context, the analysis of parameters for optical sensors, is nowadays one of the reasons
Analysis of Parameters for a Distributed
Temperature Sensing based on Raman
Scattering
Luís Cicero Bezerra da Silva1, Maria José Pontes
2, Marcelo Eduardo Vieira Segatto
3
Technology Center, Federal University of Espírito Santo –Vitória, ES - Brazil.
E-mails: [email protected],

Journal of Microwaves, Optoelectronics and Electromagnetic Applications, Vol. 16, No. 1, March 2017 DOI: http://dx.doi.org/10.1590/2179-10742017v16i1886
Brazilian Microwave and Optoelectronics Society-SBMO received 30 Oct 2016; for review 03 Nov 2016; accepted 28 Dec 2016
Brazilian Society of Electromagnetism-SBMag © 2017 SBMO/SBMag ISSN 2179-1074
260
involving new research with optical fibers for sensor models showing better results, and to explore
new applications [2].
Among the sensors based on nonlinear effects developed, and that meet requirements related to
commercial viability, are systems based on spontaneous Raman Scattering (RS) in optical fibers. With
applications for distributed temperature sensor (DTS).
The main limitations of DTS systems that can be mentioned are: the low intensity of the received
signal, requiring signal amplification [17]; the specific attention during practical operation with the
sensor element, which is the fiber itself [3]; determining specific length and adjust of the sensor [17].
In order to overcome such restrictions, research conducted with optical time domain reflectometry
(OTDR) explores the use of algorithms applied to the measured data to improve the performance of
DTS systems [2], [18].
This paper discusses the main features Raman Scattering in optical fibers for use in DTS systems. It
is explored the technique of optical frequency domain reflectometry (OFDR) to optimize spatial
resolution and temperature of DTS.
Section II presents theoretical aspects and main equations to describe the spontaneous RS in optical
fibers. Section III discusses how to exploit the effect of the spontaneous RS for temperature sensing in
fibers. In Section IV is discussed as the choice (or selection) of parameters can affect the performance
of DTS systems, bringing also the results of the implementation of the sensor model performed in
Matlab®. Finally, the conclusions are presented in Section V.
II. THEORETICAL ASPECTS
High power incident light coupled into an optical fiber will propagate and be spread to effects such
as Raman, Brillouin and Rayleigh scattering. If any change occurs in physical parameters, for
example temperature, pressure or strain at some point, the change will modulate the signal
propagating through the fiber [14]. Thus, by measuring the variation resulting of such modulation, one
can perform the sensing along the fiber. This allows obtaining sensors with good accuracy and
repeatability in their measures [14]. It is important to emphasize that Raman scattering, Brillouin and
Rayleigh occur simultaneously along the fiber, each one depending on a specific threshold of power
to be observed.
Therefore, when high intensity light interacts with the molecules that constitute the fiber material,
energy exchanges occur between the photons of incident light and the molecules of the material, for
instance fused silica. The energy changes generate new electromagnetic fields with different
frequencies propagating in all directions within the fiber [14]. If the scattered light has the frequency
lower than the incident light, the molecules of the medium will absorb this energy. It means
generating scattered photons with lower energy, which is known as Stokes ( S ) [14].
On the other hand, if the scattered frequency is higher than the frequency of incident light, the

Journal of Microwaves, Optoelectronics and Electromagnetic Applications, Vol. 16, No. 1, March 2017 DOI: http://dx.doi.org/10.1590/2179-10742017v16i1886
Brazilian Microwave and Optoelectronics Society-SBMO received 30 Oct 2016; for review 03 Nov 2016; accepted 28 Dec 2016
Brazilian Society of Electromagnetism-SBMag © 2017 SBMO/SBMag ISSN 2179-1074
261
molecules of the medium transfer part of their energy to the photons of incident light. This generates
photons with higher energy that is known as Anti-Stokes ( AS ) scattering [14]. Fig. 1 illustrates the
light interaction with the optical fiber with respective mechanisms of scattering observed as a function
of the light wavelength, where the peak intensity depends on the temperature (T).
Fig. 1. Scattering phenomena in fiber [20].
As shown in Fig. 1, the intensity of the Raman upshifted frequency component (Anti-Stokes light)
exhibits a strong dependence on the temperature, while the downshifted frequency component (Stokes
light) is slightly temperature dependent [19].
The spontaneous scattering is observed when scattered photons are generated independently from
other photons; and stimulated scattering, occurs due to photons generated from scattered photons.
Raman scattering in fibers spreads in all directions and only a small fraction of this scattering is
guided along the fiber [17].
Fig. 2 illustrates the experimental setup to obtain the spectrum of the spontaneous RS. It comprises
a pump laser, a fiber optic circulator and the optical fiber where the light propagates. The detector
capture the backscattered power spectrum.
Fig.2. Setup to measure the spontaneous RS.
The equation that describes the fraction of backscattered power SP Stokes signal captured and
guided along the fiber is [20]:
)cos( mod SSSS twAPP (1)
With the average SP , the amplitude of Stokes scattering SA , and phase S defined, respectively,
by:
LnPP S
S
SSBS
2exp12
1 (2)

Journal of Microwaves, Optoelectronics and Electromagnetic Applications, Vol. 16, No. 1, March 2017 DOI: http://dx.doi.org/10.1590/2179-10742017v16i1886
Brazilian Microwave and Optoelectronics Society-SBMO received 30 Oct 2016; for review 03 Nov 2016; accepted 28 Dec 2016
Brazilian Society of Electromagnetism-SBMag © 2017 SBMO/SBMag ISSN 2179-1074
262
2mod
mod
22
1
sinsinhexp
S
S
S
SSSBS
k
LkL
L
LnPA
(3)
L
LkkLk
SS
S
tanh
tanarctanarctan modmod
mod (4)
In equations (1)-(4), BP refers to the pumping signal modulated with angular frequency modw and
the group wave number cnwk grmodmod , where grn is the group refractive index of the fiber core,
and c the speed of light in vacuum. S is the Raman Stokes capture coefficient,
S the fiber
attenuation coefficient for Stokes signal, and L is the total fiber length.
The Bose-Einstein probability distribution of phonons is written as [21]:
kTEnS
exp1
1
(5)
Here E is the difference between the molecule energy levels [20]. k is the Boltzmann’s constant,
T the absolute temperature of the fiber.
For the Anti-Stokes signal, we have:
kTE
kTEnAS
exp1
exp (6)
The equations for the Anti-Stokes scattering signal are similar to those presented above for the
Stokes signal. However, replacing in (1)-(4) the index S by AS .
III. DISTRIBUTED TEMPERATURE SENSOR BASED ON SPONTANEOUS RAMAN SCATTERING
The first approach to read the temperature along the fiber, when the spontaneous RS is generated
(see Fig.2) calculates the ratio of the real part of the pulse responses given by [20]:
zR
R
h
hk
EzT
AS
S
S
AS
S
AS
AS
S
expln
4
(7)
Where SR and ASR are the responsivity of the avalanche photodiode (APD), respectively to Stokes
and Anti-Stokes signals. is the difference between the attenuation of Stokes and Anti-Stokes. S
and AS are the respective wavelengths for Stokes and Anti-Stokes signals. The term Sh represents
the pulse response of the Stokes signal, given by [20]:
Journal of Microwaves, Optoelectronics and Electromagnetic Applications, Vol. 16, No. 1, March 2017 DOI: http://dx.doi.org/10.1590/2179-10742017v16i1886
Brazilian Microwave and Optoelectronics Society-SBMO received 30 Oct 2016; for review 03 Nov 2016; accepted 28 Dec 2016
Brazilian Society of Electromagnetism-SBMag © 2017 SBMO/SBMag ISSN 2179-1074
263
S
B
S
oo
SsS j
P
AIFFT
fR
fRh expRe (8)
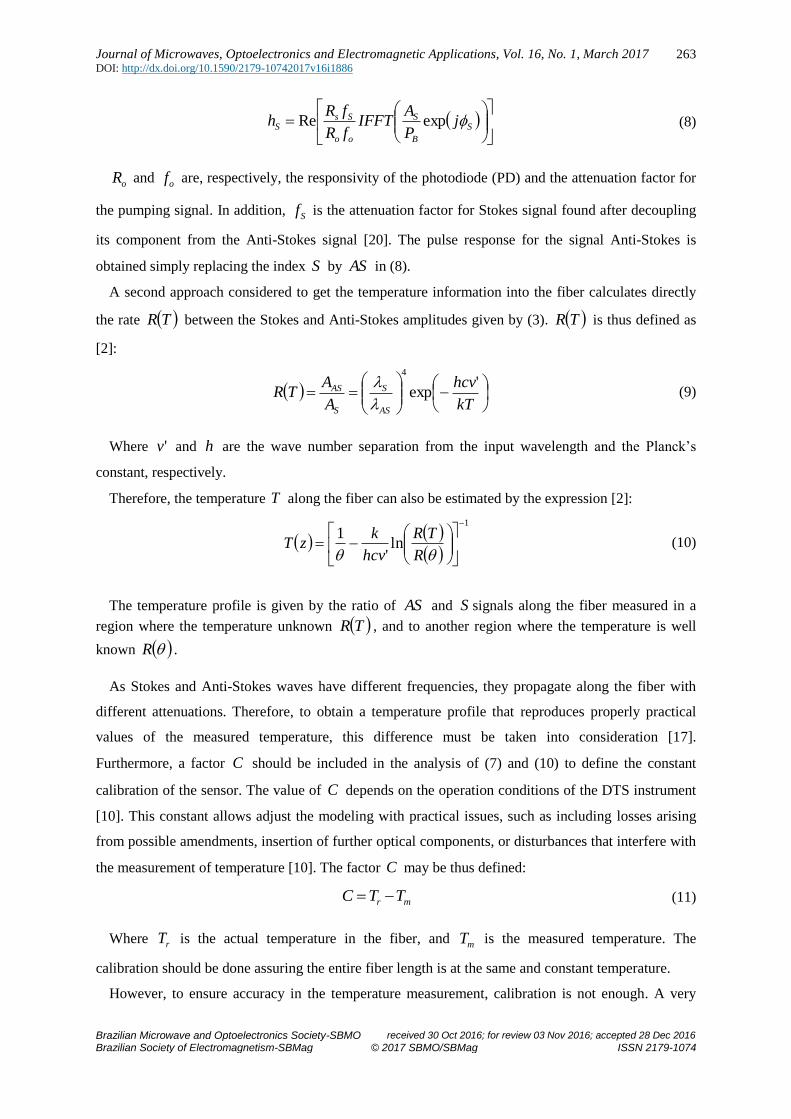
oR and of are, respectively, the responsivity of the photodiode (PD) and the attenuation factor for
the pumping signal. In addition, Sf is the attenuation factor for Stokes signal found after decoupling
its component from the Anti-Stokes signal [20]. The pulse response for the signal Anti-Stokes is
obtained simply replacing the index S by AS in (8).
A second approach considered to get the temperature information into the fiber calculates directly
the rate TR between the Stokes and Anti-Stokes amplitudes given by (3). TR is thus defined as
[2]:
kT
hcv
A
ATR
AS
S
S
AS 'exp
4
(9)
Where 'v and h are the wave number separation from the input wavelength and the Planck’s
constant, respectively.
Therefore, the temperature T along the fiber can also be estimated by the expression [2]:
1
ln'
1
R
TR
hcv
kzT (10)
The temperature profile is given by the ratio of AS and S signals along the fiber measured in a
region where the temperature unknown TR , and to another region where the temperature is well
known R .
As Stokes and Anti-Stokes waves have different frequencies, they propagate along the fiber with
different attenuations. Therefore, to obtain a temperature profile that reproduces properly practical
values of the measured temperature, this difference must be taken into consideration [17].
Furthermore, a factor C should be included in the analysis of (7) and (10) to define the constant
calibration of the sensor. The value of C depends on the operation conditions of the DTS instrument
[10]. This constant allows adjust the modeling with practical issues, such as including losses arising
from possible amendments, insertion of further optical components, or disturbances that interfere with
the measurement of temperature [10]. The factor C may be thus defined:
mr TTC (11)
Where rT is the actual temperature in the fiber, and mT is the measured temperature. The
calibration should be done assuring the entire fiber length is at the same and constant temperature.
However, to ensure accuracy in the temperature measurement, calibration is not enough. A very

Journal of Microwaves, Optoelectronics and Electromagnetic Applications, Vol. 16, No. 1, March 2017 DOI: http://dx.doi.org/10.1590/2179-10742017v16i1886
Brazilian Microwave and Optoelectronics Society-SBMO received 30 Oct 2016; for review 03 Nov 2016; accepted 28 Dec 2016
Brazilian Society of Electromagnetism-SBMag © 2017 SBMO/SBMag ISSN 2179-1074
264
important parameter is the spatial resolution, that defines the spacing between distinguishable adjacent
measurement points that ensure accuracy in measurements. In other words, if temperature variations
occur in lengths less than the spatial resolution, there is no guarantee the measured temperature
obtained is the actual one. The spatial resolution is thus defined [20]:
maxmod,
1
2 fn
cz
gr
(12)
Where maxmod,f is the maximum modulation frequency the pump signal.
IV. ANALYSIS OF PARAMETERS AND RESULTS
Fig.3 shows the diagram based on [2] and [20], which allows discussing the parameters’ analysis
performed by simulations for temperature sensing using spontaneous RS.
Time
(OTDR)
Analysis
Domain
Frequency
(OFDR)
Backscattered
power
Sensing Fiber
Input
ESA
(Amplitude
and phase)
Processing
Rate between
Stokes and
Anti-Stokes
IFFT
Impulse
response
Temperature profile
Spatial
resolutionSensor range
Temperature
resolution
Spatial
resolutionSensor range
Temperature
resolution
Performance Parameters
Spatial
resolutionSensor range
Temperature
resolution
Performance Parameters
Time
(OTDR)
Analysis
Domain
Frequency
(OFDR)
Backscattered
power
Sensing Fiber
Input
ESA
(Amplitude
and phase)
Processing
Rate between
Stokes and
Anti-Stokes
IFFT
Impulse
response
Temperature profile
Spatial
resolutionSensor range
Temperature
resolution
Performance Parameters
Processing
Rate between
Stokes and
Anti-Stokes
Fig. 3. Diagram of the possible steps to analyze the output of the DTS.
The diagram in Fig.3 illustrates three different possibilities to analyze the output of the DTS. The
input configuration depends on basically the sensor range intended. For long distances (up to tenth of
km), it is preferable to the use of pulsed lasers and the analysis is performed in the optical time
domain reflectometry (OTDR). However, for short distances (few km) CW lasers are usually
employed with amplitude modulation. Such a configuration is analyzed in the optical frequency
domain reflectometry (OFDR).

Journal of Microwaves, Optoelectronics and Electromagnetic Applications, Vol. 16, No. 1, March 2017 DOI: http://dx.doi.org/10.1590/2179-10742017v16i1886
Brazilian Microwave and Optoelectronics Society-SBMO received 30 Oct 2016; for review 03 Nov 2016; accepted 28 Dec 2016
Brazilian Society of Electromagnetism-SBMag © 2017 SBMO/SBMag ISSN 2179-1074
265
After defining the analysis domain in the output of the system the next step is the definition of what
type of processing to the backscattered power provides better temperature profile. The profile can be
evaluated by spatial resolution, range of the temperature, and temperature resolution.
The analysis with OFDR presents two possible configurations, as shown in Fig. 3. The one using
the electrical spectrum analyzer (ESA) involves more complex processing. In this case, the amplitude
and phase of the signals are stored in the ESA to a post-processing using an Inverse Fast Fourier
Transform (IFFT). This procedure allows obtaining the pulse response of scattered signals that carries
the temperature information along the fiber.
The configuration of OFDR technique to determine the temperature profile in the fiber by
calculating the rate between Stokes and Anti-Stokes spontaneous RS signals amplitudes reduces the
processing of data.
Next, one discusses specific parameters in the modeling of DTS.
A. Pumping Power Range
It is shown that the spontaneous RS grows linearly with the power of incident light in fiber [17].
With this information, it is possible to define the range of optical power to be used to generate the
spontaneous RS and suppress the effect stimulated that degrades the temperature measure [17], [21].
By calculating the pump power range for generating the Anti-Stokes signal with (1), the obtained
curve given by the solid line is shown in Fig.4. The curve in dashed line indicates the linear behavior
of Anti-Stokes component as a function of pumping power.
Fig. 4. Anti-Stokes component calculated as a function of pumping power for standard singlemode fiber.
Fig. 4 shows the pumping power range of Anti-Stokes component is linear with pump power. It
indicates a value around 100 mW to be coupled to the optical fiber, corresponding to the region where
the curves overlap in Fig. 4. As a result, values lower than 100 mW should be launched to the fiber in
order to generate just the spontaneous RS. This result is equivalent to those presented in [17], [20].
Besides, singlemode fibers present reduced diameter of the core if compared with multimode fibers,
causing the light to stay confined to a small region at the center of the fiber. This high concentration

Journal of Microwaves, Optoelectronics and Electromagnetic Applications, Vol. 16, No. 1, March 2017 DOI: http://dx.doi.org/10.1590/2179-10742017v16i1886
Brazilian Microwave and Optoelectronics Society-SBMO received 30 Oct 2016; for review 03 Nov 2016; accepted 28 Dec 2016
Brazilian Society of Electromagnetism-SBMag © 2017 SBMO/SBMag ISSN 2179-1074
266
of power promotes the emergence of stimulated RS that is not desired, since it interferes with the
interrogation of the temperature and cannot be filtered from spontaneous RS. Typical values of power
for commercial DTS systems are around 50 mW [17].
The input parameters used in the simulations are summarized in Table I.
TABLE I. INPUT PARAMETERS CONSIDERED IN THE SIMULATIONS
Description Value
Frequency range ( RF ) 1 KHz – 10 MHz
Number of samples (SN ) 4096
S 3.04x10⁻¹⁰
m-1
AS 4.00x10⁻¹⁰
m-1
S 0.210 dB/Km
AS 0.225 dB/Km
L 30 m
E 50 meV
T 300 T
grn 1.5
SR 0.7 A/W
ASR 0.8 A/W
0R 0.73 A/W
Sf 0.5
ASf 0.5
0f 0.1
0P 100 mW
S 1663 nm
AS 1451 nm
B. Exploring Optical Frequency Domain Reflectometry
In commercial DTS systems that employs the OTDR technique, a pulse with relatively short
duration (s) is sent along the fiber and the backscattered signal is detected with high temporal
resolution. The range of distance for such systems is typically 10 km [14]. The limitation in the range
of the sensor is due to the attenuation losses along the fiber and the laser repetition rate of the laser
pump. However, features such as the need for short duration pulses with high peak power; bandwidth
required in the order of GHz and fast electronics; make the systems sensors based on OTDR
expensive and with complicated implementation [14], [17].
An alternative to DTS systems is the OFDR. In this technique, the laser source is amplitude
modulated, so that each increment in frequency results in a new value for the amplitude and phase of
the backscattered signal [14]. In this case, the pump power to be launched into an optical fiber can be
written as [20]:
twPwPB mod0mod cos1 (13)
Where 0P is the amplitude of the signal to be modulated, and modmod 2 fw is the angular

Journal of Microwaves, Optoelectronics and Electromagnetic Applications, Vol. 16, No. 1, March 2017 DOI: http://dx.doi.org/10.1590/2179-10742017v16i1886
Brazilian Microwave and Optoelectronics Society-SBMO received 30 Oct 2016; for review 03 Nov 2016; accepted 28 Dec 2016
Brazilian Society of Electromagnetism-SBMag © 2017 SBMO/SBMag ISSN 2179-1074
267
frequency of modulation, defined by the increased frequency modf that modulates the pumping laser
source.
Fig. 5(a) shows that for values of spatial resolution lower than 1 m, it is necessary to work with
modulation frequencies in the range of hundreds of MHz. However, at high frequencies the
backscattered signal presents strong attenuation as shown in Fig. 5(b).
Fig. 5. (a) Spatial resolution against maximum modulation frequency for the analysis of spatial resolution for OFDR.
(b) Frequency response for 4.7 km of fiber.
The analysis in the frequency domain shows clearly the frequency component of the backscattered
signal where temperature changes occurred in the fiber. Fig. 5 (b) reveals a hot spot in the fiber,
observed at a frequency of 5 Hz.
The OFDR technology provides an almost invariant spatial resolution along the entire sensor
length, which ensures to identify and measure a typical hot spot [23]. This is in contrast to other
measurement principles (e.g. laser pulse principle, OTDR), which are sensitive to dispersion effects
and therefore affected by a broadened spatial resolution at longer measurement distances; in other
words, the hot spot sensitivity of pulse type measurements degrades as a function of distance [23].
C. Fiber Optic for DTS
The intensity of the scattered signal measured at the photodiode is highly dependent on the type of
fiber used. Basic parameters in the selection of fiber are the attenuation and the numerical aperture
(NA).
A fiber specification such as a high NA means a higher coefficient of capture the scattered signal
and enhance the backscattered signal. Therefore, the intensity of backscattered signal is larger for
multimode fibers due to present higher NA. However, the attenuation of light propagating in such
fibers is higher and spontaneous RS suffers greater attenuation to propagate over long distances, i.e.
up to 12 km to DTS. Fig. 6 shows the backscattered power against fiber length that enables comparing
the amplitude of backscattered signal in multimode and singlemode fibers in terms of these two
parameters.

Journal of Microwaves, Optoelectronics and Electromagnetic Applications, Vol. 16, No. 1, March 2017 DOI: http://dx.doi.org/10.1590/2179-10742017v16i1886
Brazilian Microwave and Optoelectronics Society-SBMO received 30 Oct 2016; for review 03 Nov 2016; accepted 28 Dec 2016
Brazilian Society of Electromagnetism-SBMag © 2017 SBMO/SBMag ISSN 2179-1074
268
Fig. 6. Backscattered signal power as a function of fiber length for multimode and singlemode fibers, where Anti-Stokes
(centered at 1451 nm) and Stokes (centered at 1663 nm) signals are indicated by arrows.
Fig. 6 shows that the spontaneous RS is detected with greater intensity, for multimode fiber lengths
less than 1.5 km, making such fibers proper for sensing in short distances. The analysis also presents
that due to low attenuation (in the order of 0.2 dB/km) in the wavelength of 1550 nm, the singlemode
fiber best suited to generate the spontaneous RS. Since the scattered signals from this effect have low
intensity, singlemode fiber becomes the best choice for sensing long distances due to its low
attenuation [17]. Therefore, this fiber is adopted in the simulations carried out in this study.
D. Estimating Temperature
The temperature information along the fiber is contained in the AS signal, as already mentioned.
The accuracy in the estimation of the temperature will rely on the signal processing applied (or
interrogation technique) to extract the temperature from the values of AS and S signals. Fig. 7 shows
the results of temperature estimation through (7) and (10).
Fig. 7. Temperature profile against fiber length showing the hot spot. Simulated 1 obtained with (7) and simulated 2 obtained
with (10), compared to a DTS response provided by a commercial DTS model AP Sensing N4385B [1].
The results in Fig.7 show that calculating the temperature directly determining the rate TR

Journal of Microwaves, Optoelectronics and Electromagnetic Applications, Vol. 16, No. 1, March 2017 DOI: http://dx.doi.org/10.1590/2179-10742017v16i1886
Brazilian Microwave and Optoelectronics Society-SBMO received 30 Oct 2016; for review 03 Nov 2016; accepted 28 Dec 2016
Brazilian Society of Electromagnetism-SBMag © 2017 SBMO/SBMag ISSN 2179-1074
269
among the Stokes and Anti-Stokes signals amplitudes with (10) allows higher accuracy to determine
the peak temperature. The characterization curve of the sensor, presented in Fig. 8, can be used to
determine TR .
Fig. 8 Characterization of Stokes and Anti-Stokes amplitudes’ ratio) as a function of temperature obtained by simulation to
the modeled sensor.
E. Temperature Resolution
Another parameter commonly found in DTS systems analysis is the temperature resolution, which
can be calculated from the standard deviation of the temperature throughout the fiber. Typically, DTS
systems based on Raman scattering present temperature resolution of 0.1 ºC [22].
Usually, the temperature resolution is presented as a function of fiber length. Such analysis is
shown in Fig. 9 (a). The accuracy of temperature measurements along the fiber is reduced, due to the
fact the intensity of backscattered signal measured in the detector is smaller and therefore noisier.
In addition to this already known analysis, we present the error in determining the hot spot as a
function of temperature. This information sets an operation limit to the sensor in terms of temperature,
as shown in Fig. 9 (b).
Fig. 9. (a) Temperature resolution to 16 km of singlemode fiber. (b) Error in measurement the peak temperature in the hot
spot, with RF = 1 KHz to 100 MHz and T = 27 ºC to 527 ºC.
High temperature measurements could be useful in different scenarios including oil or gas industrial

Journal of Microwaves, Optoelectronics and Electromagnetic Applications, Vol. 16, No. 1, March 2017 DOI: http://dx.doi.org/10.1590/2179-10742017v16i1886
Brazilian Microwave and Optoelectronics Society-SBMO received 30 Oct 2016; for review 03 Nov 2016; accepted 28 Dec 2016
Brazilian Society of Electromagnetism-SBMag © 2017 SBMO/SBMag ISSN 2179-1074
270
sectors. The optical fibers are generally protected with a temperature resistant polymer coating (such
as polyamide) or some metals such as aluminum or gold for these special applications [24]. However,
for real industrial applications, these fibers should be protected from external mechanical actions
during installation . In [24] was conducted experiments with temperatures up to 450° C, using OTDR
and multimode fibers. The error to determine the temperature was 7.2° C. From the analysis of Fig. 9
(b), errors lower than or equal to 1 °C, means temperatures below 377 °C.
F. Profile of Backscattered Signal (avaliar se vale a pena manter esta sub-seção)
Based on data reported in the literature and in the simulations carried out applying (1), Fig. 10
shows the behavior of the backscattered signal along the optical fiber with temperature varying from
300 to 350 oC.
Fig. 10. Backscattered power as a function of fiber length for different temperatures.
It is possible to confirm the nature of the Stokes and Anti-Stokes signals. It can be observed in Fig.
11 the signals have very low intensity, around 60 dBm or nW. Any incorrect filtering of such signals
in the detector, or even small sources of noise can distort the obtained temperature information.
The fiber attenuation of these signals along its propagation is another issue to be addressed in the
selection of laser source wavelength in order to coincide with the lowest possible attenuation.
V. CONCLUSIONS
This paper presents the analysis of parameters for distributed temperature sensing in optical fibers,
based on spontaneous Raman scattering propagating in optical fibers. The main equations to generate
the Stokes and Anti-Stokes scattered signals, which contain the temperature information along the
fiber, were implemented and analyzed. The key input parameters were taken from the literature and
simulations were performed using Matlab® in order to predict DTS systems and determine the best
combination of enhanced parameters.
Two different approaches of extracting temperature information from the backscattered signal were
also tested. First, considering the pulse response, and later calculating the ratio the amplitudes of the

Journal of Microwaves, Optoelectronics and Electromagnetic Applications, Vol. 16, No. 1, March 2017 DOI: http://dx.doi.org/10.1590/2179-10742017v16i1886
Brazilian Microwave and Optoelectronics Society-SBMO received 30 Oct 2016; for review 03 Nov 2016; accepted 28 Dec 2016
Brazilian Society of Electromagnetism-SBMag © 2017 SBMO/SBMag ISSN 2179-1074
271
detected Stokes and Anti-Stokes scattered signals. Such an analysis has shown that the second method
is more efficient to detect the peak temperature in the hot spot in the fiber. It means, it enables a
spatial resolution of 0.96 m and a temperature resolution of 0.089 °C for the sensor under study. This
performance was obtained to 30 meters of singlemode fiber with pump power equal to 100 mW.
Regarding the range of temperatures evaluated, the error increases exponentially for temperatures
around 190 °C. The error is less than 1° C to temperatures lower than 377 °C. This indicates the
sensor operation limit in terms of temperature. To validate the simulation model, the simulated DTS
data is compared to the DTS response provided by a commercial DTS model AP Sensing N4385B.
ACKNOWLEDGMENT
The authors acknowledge the financial support of CNPq, PETROBRAS, and the gentleness of João
Paulo Bazzo to provide the experimental data/curves included in this study.
REFERENCES
[1] J. P. Bazzo, D. R. Pipa, C. Martelli, E. V. Silva and J. C. C. Silva, "Improving Spatial Resolution of Raman DTS Using
Total Variation Deconvolution," IEEE Sensors Journal, vol. 16, no. 11, pp. 4425-4430, Jun. 2016.
[2] H. S. Pradhan and P. K. Sahu, "Characterisation of Raman distributed temperature sensor using deconvolution
algorithms," IET Optoelectronics, vol. 9, no. 2, pp. 101-107, 2015.
[3] Z. Sha-lu, G. Hui, P. Jian-yu, Z. Hui-hui and W. Jian-feng, "Application research of distributed optical fiber Raman
temperature sensor in the security of oil depot," Optoelectronics Global Conference (OGC), 2015, Shenzhen, 2015, pp.
1-4.
[4] E. Udd, W. Spillman, “The emergence of fiber optic sensor technology,” Fiber Optic Sensors: An Introduction for
Engineers and Scientists. pp. 1-8, 2011.
[5] F. Marignetti et al., "Fiber Bragg Grating Sensor for Electric Field Measurement in the End Windings of High-Voltage
Electric Machines," IEEE Transactions on Industrial Electronics, vol. 63, no. 5, pp. 2796-2802, May. 2016.
[6] J. Clement, G. Torregrosa, J. Hervás, D. Barrera, S. Sales and C. R. Fernández-Pousa, "Interrogation of a Sensor Array
of Identical Weak FBGs Using Dispersive Incoherent OFDR," IEEE Photonics Technology Letters, vol. 28, no. 10, pp.
1154-1156, May. 2016.
[7] A. Morana, S. Girard, E. Marin, J. Perisse, J. Genot, J. Kuhnhenn, J. Grelin, L. Hutter, G. Melin, L. Lablonde, T. Robin,
B. Cadier, J. R. Mace, A. Boukenter, Y. Ouerdane, "Radiation-Hardened Fiber Bragg Grating Based Sensors for Harsh
Environments," IEEE Transactions on Nuclear Science , 2016.
[8] D. Leandro, V. deMiguel-Soto and M. López -Amo, "High-Resolution Sensor System Using a Random Distributed
Feedback Fiber Laser," Journal of Lightwave Technology, vol. 34, no. 19, pp. 4596-4602, Oct. 2016.
[9] J. Li, L. Xu and K. Kishida, "FBG-Based Positioning Method for BOTDA Sensing," IEEE Sensors Journal, vol. 16, no.
13, pp. 5236-5242, Jul. 2016.
[10] A. Ukil, H. Braendle and P. Krippner, "Distributed Temperature Sensing: Review of Technology and Applications,"
IEEE Sensors Journal, vol. 12, no. 5, pp. 885-892, May. 2012.
[11] A. Lopez-Gil, X. Angulo-Vinuesa, A. Dominguez-Lopez, S. Martin-Lopez and M. Gonzalez-Herraez, "Simple
Baseband Method for the Distributed Analysis of Brillouin Phase-Shift Spectra," IEEE Photonics Technology Letters,
vol. 28, no. 13, pp. 1379-1382, Jul. 2016.

Journal of Microwaves, Optoelectronics and Electromagnetic Applications, Vol. 16, No. 1, March 2017 DOI: http://dx.doi.org/10.1590/2179-10742017v16i1886
Brazilian Microwave and Optoelectronics Society-SBMO received 30 Oct 2016; for review 03 Nov 2016; accepted 28 Dec 2016
Brazilian Society of Electromagnetism-SBMag © 2017 SBMO/SBMag ISSN 2179-1074
272
[12] H. Q. Chang et al., "DBA-Based BOTDA Using Optical Comb Pump and Pulse Coding With a Single Laser," IEEE
Photonics Technology Letters, vol. 28, no. 10, pp. 1142-1145, May. 2016.
[13] X. Angulo-Vinuesa, A. Dominguez-Lopez, A. Lopez-Gil, J. D. Ania-Castañón, S. Martin-Lopez and M. Gonzalez-
Herraez, "Limits of BOTDA Range Extension Techniques," IEEE Sensors Journal, vol. 16, no. 10, pp. 3387-3395,
May. 2016.
[14] X. Bao and L. Chen, “Recent progress in distributed fiber optic sensors,” Sensors, vol. 12, no. 7, pp. 8601–8639, 2012.
[15] L. Ferreira, F. Araújo, C. Barbosa, N. Costa, A. Arêde, A. Costa, and P. Costa, “Implementation of a fiber Bragg
grating sensor network for structural monitoring of a new stone bridge,” presented at the Proceedings of the 3rd
International Conference on Bridge Maintenance, Safety and Management-Bridge Maintenance, Life-Cycle
Performance and Cost, 2006.
[16] E. J. Friebele, “Fiber Bragg grating strain sensors: present and future applications in smart structures,” Optics and
Photonics News, vol. 9, no. 8, 1998.
[17] E. Karamehmedovic, “Incoherent optical frequency domain reflectometry for distributed thermal sensing,” thesis,
Department of Communications, Optics and Materials, Technical University of Denmark, 2006.
[18] L. Zhang, X. Feng, W. Zhang, and X. Liu, “Improving spatial resolution in fiber Raman distributed temperature sensor
by using deconvolution algorithm,” Chinese Optics Letters, vol. 7, no. 7, pp. 560–563, 2009.
[19] Y. S. Muanenda et al., "Advanced Coding Techniques for Long-Range Raman/BOTDA Distributed Strain and
Temperature Measurements," Journal of Lightwave Technology, vol. 34, no. 2, pp. 342-350, Jan. 2016.
[20] M. A. Farahani and T. Gogolla, "Spontaneous Raman scattering in optical fibers with modulated probe light for
distributed temperature Raman remote sensing," Journal of Lightwave Technology, vol. 17, no. 8, pp. 1379-1391, Aug.
1999.
[21] K. Rottwitt, J. Bromage, A. J. Stentz, Lufeng Leng, M. E. Lines and H. Smith, "Scaling of the Raman gain coefficient:
applications to germanosilicate fibers," Journal of Lightwave Technology, vol. 21, no. 7, pp. 1652-1662, Jul. 2003.
[22] G. Bolognini and A. Hartog, “Raman-based fibre sensors: Trends and applications,” Optical Fiber Technology, vol. 19,
no. 6, pp. 678–688, 2013.
[23] LIOS TECHNOLOGY®, Manuals, whitepapers. [accessed in 21 October 2016]. Available: http://www.lios-
technology.com.
[24] L. Ismail, et al., "High-temperature distributed sensor based on Raman and multimode standard telecom fiber," Novel
Optical Materials and Applications, Optical Society of America, 2016.