Next-generation sequencing and syntenic integration of flow-sorted arms of wheat chromosome 4A...
10
FEATURED ARTICLE Next-generation sequencing and syntenic integration of flow-sorted arms of wheat chromosome 4A exposes the chromosome structure and gene content Pilar Hernandez 1 , Mihaela Martis 2 , Gabriel Dorado 3 , Matthias Pfeifer 2 , Sergio Ga ´ lvez 4 , Sebastian Schaaf 2 , Nicola ´ s Jouve 5 , Hana S ˇ imkova ´ 6 , Miroslav Vala ´ rik 6 , Jaroslav Dolez ˇel 6 and Klaus F.X. Mayer 2, * 1 Instituto de Agricultura Sostenible (IAS-CSIC), Alameda del Obispo s/n, 14080 Co ´ rdoba, Spain, 2 Institute for Bioinformatics and Systems Biology, Helmholtz Center Munich, Ingolsta ¨ dter Landstraße 1, 85764 Neuherberg, Germany, 3 Departamento de Bioquı´mica y Biologı´a Molecular, Campus Rabanales C6-1-E17, Campus de Excelencia Internacional Agroalimentario, Universidad de Co ´ rdoba, 14071 Co ´ rdoba, Spain, 4 Departamento de Lenguajes y Ciencias de la Computacio ´ n, ETSI Informa ´ tica, Campus de Teatinos, Universidad de Ma ´ laga, Bulevar Louis Pasteur 35, 29071 Ma ´ laga, Spain, 5 Departamentode Biologı´a Celular y Gene ´ tica, Universidad de Alcala ´ , Campus Universitario, 28871 Alcala ´ de Henares, Madrid, Spain, and 6 Centre of the Hana ´ Region for Biotechnological and Agricultural Research, Institute of Experimental Botany, Sokolovska ´ 6, 77200 Olomouc, Czech Republic Received 3 August 2011; revised 29 September 2011; accepted 30 September 2011; published online 25 November 2011. *For correspondence (fax +49 89 3187 2225; e-mail [email protected]). SUMMARY Wheat is the third most important crop for human nutrition in the world. The availability of high-resolution genetic and physical maps and ultimately a complete genome sequence holds great promise for breeding improved varieties to cope with increasing food demand under the conditions of changing global climate. However, the large size of the bread wheat (Triticum aestivum) genome (approximately 17 Gb/1C) and the triplication of genic sequence resulting from its hexaploid status have impeded genome sequencing of this important crop species. Here we describe the use of mitotic chromosome flow sorting to separately purify and then shotgun-sequence a pair of telocentric chromosomes that together form chromosome 4A (856 Mb/1C) of wheat. The isolation of this much reduced template and the consequent avoidance of the problem of sequence duplication, in conjunction with synteny-based comparisons with other grass genomes, have facilitated construction of an ordered gene map of chromosome 4A, embracing ‡85% of its total gene content, and have enabled precise localization of the various translocation and inversion breakpoints on chromosome 4A that differentiate it from its progenitor chromosome in the A genome diploid donor. The gene map of chromosome 4A, together with the emerging sequences of homoeologous wheat chromosome groups 4, 5 and 7, represent unique resources that will allow us to obtain new insights into the evolutionary dynamics between homoeologous chromosomes and syntenic chromosomal regions. Keywords: wheat genome, chromosome sorting, genome zipper, grass comparative genomics, wheat shotgun chromosome, Triticeae genome INTRODUCTION Bread wheat (Triticum aestivum) provides approximately 20% of mankind’s dietary energy supply (http://www.fao. org), but, despite its importance as a crop, acquisition of its genome sequence remains a major challenge. The biologi- cal features responsible for the slowness of progress towards this goal are its large genome size (1C is ª 2011 The Authors 377 The Plant Journal ª 2011 Blackwell Publishing Ltd The Plant Journal (2012) 69, 377–386 doi: 10.1111/j.1365-313X.2011.04808.x
Transcript of Next-generation sequencing and syntenic integration of flow-sorted arms of wheat chromosome 4A...
FEATURED ARTICLE
Next-generation sequencing and syntenic integration offlow-sorted arms of wheat chromosome 4A exposes thechromosome structure and gene content
Pilar Hernandez1, Mihaela Martis2, Gabriel Dorado3, Matthias Pfeifer2, Sergio Galvez4, Sebastian Schaaf2, Nicolas Jouve5,
Hana Simkova6, Miroslav Valarik6, Jaroslav Dolezel6 and Klaus F.X. Mayer2,*
1Instituto de Agricultura Sostenible (IAS-CSIC), Alameda del Obispo s/n, 14080 Cordoba, Spain,2Institute for Bioinformatics and Systems Biology, Helmholtz Center Munich, Ingolstadter Landstraße 1, 85764 Neuherberg,
Germany,3Departamento de Bioquımica y Biologıa Molecular, Campus Rabanales C6-1-E17, Campus de Excelencia Internacional
Agroalimentario, Universidad de Cordoba, 14071 Cordoba, Spain,4Departamento de Lenguajes y Ciencias de la Computacion, ETSI Informatica, Campus de Teatinos,
Universidad de Malaga, Bulevar Louis Pasteur 35, 29071 Malaga, Spain,5Departamento de Biologıa Celular y Genetica, Universidad de Alcala, Campus Universitario, 28871 Alcala de Henares,
Madrid, Spain, and6Centre of the Hana Region for Biotechnological and Agricultural Research, Institute of Experimental Botany,
Sokolovska 6, 77200 Olomouc, Czech Republic
Received 3 August 2011; revised 29 September 2011; accepted 30 September 2011; published online 25 November 2011.
*For correspondence (fax +49 89 3187 2225; e-mail [email protected]).
SUMMARY
Wheat is the third most important crop for human nutrition in the world. The availability of high-resolution
genetic and physical maps and ultimately a complete genome sequence holds great promise for breeding
improved varieties to cope with increasing food demand under the conditions of changing global climate.
However, the large size of the bread wheat (Triticum aestivum) genome (approximately 17 Gb/1C) and the
triplication of genic sequence resulting from its hexaploid status have impeded genome sequencing of this
important crop species. Here we describe the use of mitotic chromosome flow sorting to separately purify and
then shotgun-sequence a pair of telocentric chromosomes that together form chromosome 4A (856 Mb/1C) of
wheat. The isolation of this much reduced template and the consequent avoidance of the problem of sequence
duplication, in conjunction with synteny-based comparisons with other grass genomes, have facilitated
construction of an ordered gene map of chromosome 4A, embracing ‡85% of its total gene content, and have
enabled precise localization of the various translocation and inversion breakpoints on chromosome 4A that
differentiate it from its progenitor chromosome in the A genome diploid donor. The gene map of
chromosome 4A, together with the emerging sequences of homoeologous wheat chromosome groups 4, 5
and 7, represent unique resources that will allow us to obtain new insights into the evolutionary dynamics
between homoeologous chromosomes and syntenic chromosomal regions.
Keywords: wheat genome, chromosome sorting, genome zipper, grass comparative genomics, wheat
shotgun chromosome, Triticeae genome
INTRODUCTION
Bread wheat (Triticum aestivum) provides approximately
20% of mankind’s dietary energy supply (http://www.fao.
org), but, despite its importance as a crop, acquisition of its
genome sequence remains a major challenge. The biologi-
cal features responsible for the slowness of progress
towards this goal are its large genome size (1C is
ª 2011 The Authors 377The Plant Journal ª 2011 Blackwell Publishing Ltd
The Plant Journal (2012) 69, 377–386 doi: 10.1111/j.1365-313X.2011.04808.x
approximately 17 Gb), its hexaploid status, and its high
content of repetitive DNA (approximately 80%) (Flavell,
1986). Each wheat chromosome is larger than the entire
genome of rice (Oryza sativa), and the whole genome is
more than one hundred times larger than that of Arabidopsis
thaliana. The species arose from two separate hybridization
and allopolyploidization events, the first involving a hybrid
between the A genome donor Triticum urartu (closely
related to the cultivated species Triticum monococcum)
(Dvorak et al., 1993) and the B genome donor, thought to be
an ancestor of Aegilops speltoides (Sarkar and Stebbins,
1956; Dvorak and Zhang, 1990; Wang et al., 1997; Kilian
et al., 2007). This formed the wild tetraploid Triticum dic-
occoides, which was the ancestor of the cultivated tetraploid
parent of bread wheat Triticum turgidum. The second, much
more recent, event involved T. turgidum and the D genome
diploid Aegilops tauschii (McFadden and Sears, 1946).
A successful strategy that is frequently adopted to
circumvent many of the difficulties created by polyploidy
has been to rely on diploid, and in some cases tetraploid,
progenitors as surrogates (Feuillet et al., 2003). The avail-
ability of the genome sequences of rice and Brachypodium
distachyon (Brachypodium) has been of particular value in
providing saturation of the genetic map in specific regions of
the wheat genome (International Rice Genome Sequencing
Project 2005, International Brachypodium Initiative 2010). As
an alternative, Dolezel et al. (2007) proposed that genome
sequencing be based on flow-sorted individual chromo-
somes or chromosome arms, an approach that simplifies
genome analysis by simultaneously reducing the template
to a manageable size, and crucially avoids all of the
complications introduced by the triplication of genic
sequence arising from wheat’s hexaploid status (Kubala-
kova et al., 2002). Next-generation sequencing of chromo-
somal DNA provides a powerful approach to identify most
of the genes and low-copy regions on a chromosome and to
produce annotated syntenic builds whereby the majority of
genes are placed in an approximate order and orientation
(Berkman et al., 2011; Mayer et al., 2011, 2009; Wicker et al.,
2011). The so-called GenomeZipper approach (Mayer et al.,
2011) relies on comparisons of chromosomal shotgun
sequences with reference grass genomes (typically rice,
sorghum (Sorghum bicolor) and Brachypodium) to detect
syntenic regions in these reference genomes. Genes in the
detected regions are selected to generate a genomic build
along a marker scaffold that takes into account the sequen-
tial order of sequence-tagged genes in the reference
genomes as well as the ordering deduced from the marker
scaffold.
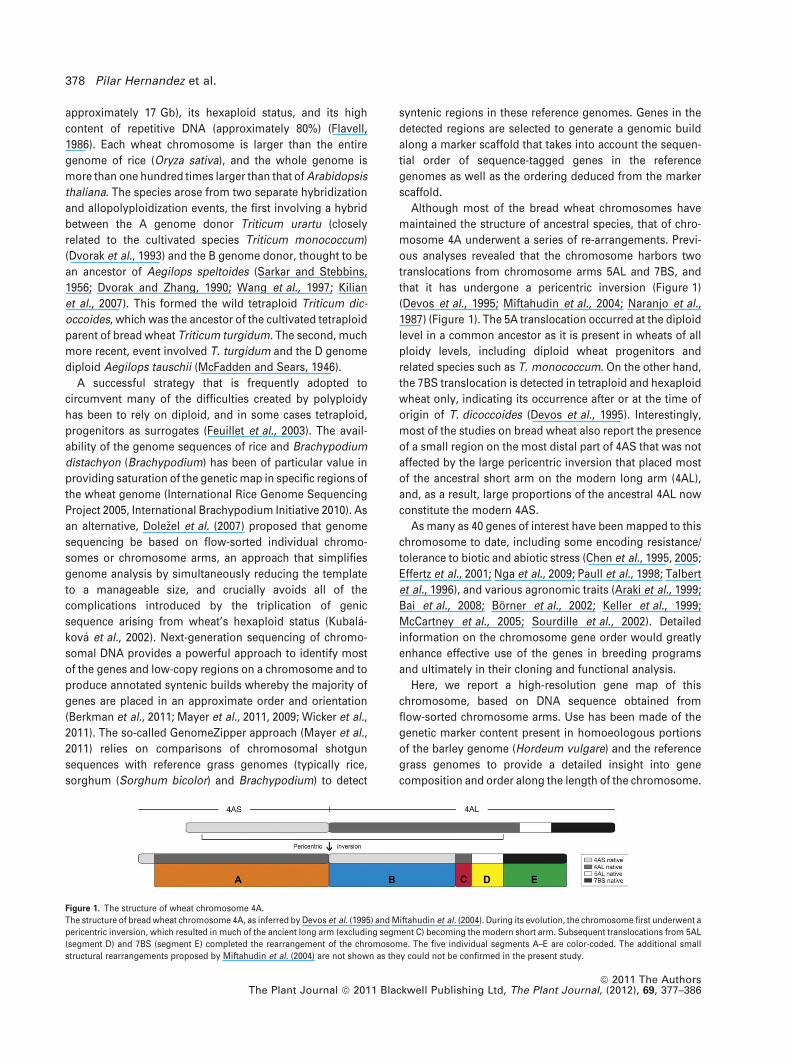
Although most of the bread wheat chromosomes have
maintained the structure of ancestral species, that of chro-
mosome 4A underwent a series of re-arrangements. Previ-
ous analyses revealed that the chromosome harbors two
translocations from chromosome arms 5AL and 7BS, and
that it has undergone a pericentric inversion (Figure 1)
(Devos et al., 1995; Miftahudin et al., 2004; Naranjo et al.,
1987) (Figure 1). The 5A translocation occurred at the diploid
level in a common ancestor as it is present in wheats of all
ploidy levels, including diploid wheat progenitors and
related species such as T. monococcum. On the other hand,
the 7BS translocation is detected in tetraploid and hexaploid
wheat only, indicating its occurrence after or at the time of
origin of T. dicoccoides (Devos et al., 1995). Interestingly,
most of the studies on bread wheat also report the presence
of a small region on the most distal part of 4AS that was not
affected by the large pericentric inversion that placed most
of the ancestral short arm on the modern long arm (4AL),
and, as a result, large proportions of the ancestral 4AL now
constitute the modern 4AS.
As many as 40 genes of interest have been mapped to this
chromosome to date, including some encoding resistance/
tolerance to biotic and abiotic stress (Chen et al., 1995, 2005;
Effertz et al., 2001; Nga et al., 2009; Paull et al., 1998; Talbert
et al., 1996), and various agronomic traits (Araki et al., 1999;
Bai et al., 2008; Borner et al., 2002; Keller et al., 1999;
McCartney et al., 2005; Sourdille et al., 2002). Detailed
information on the chromosome gene order would greatly
enhance effective use of the genes in breeding programs
and ultimately in their cloning and functional analysis.
Here, we report a high-resolution gene map of this
chromosome, based on DNA sequence obtained from
flow-sorted chromosome arms. Use has been made of the
genetic marker content present in homoeologous portions
of the barley genome (Hordeum vulgare) and the reference
grass genomes to provide a detailed insight into gene
composition and order along the length of the chromosome.
Figure 1. The structure of wheat chromosome 4A.
The structure of bread wheat chromosome 4A, as inferred by Devos et al. (1995) and Miftahudin et al. (2004). During its evolution, the chromosome first underwent a
pericentric inversion, which resulted in much of the ancient long arm (excluding segment C) becoming the modern short arm. Subsequent translocations from 5AL
(segment D) and 7BS (segment E) completed the rearrangement of the chromosome. The five individual segments A–E are color-coded. The additional small
structural rearrangements proposed by Miftahudin et al. (2004) are not shown as they could not be confirmed in the present study.
378 Pilar Hernandez et al.
ª 2011 The AuthorsThe Plant Journal ª 2011 Blackwell Publishing Ltd, The Plant Journal, (2012), 69, 377–386
This is a powerful approach for production of a high-
resolution draft of gene space for the complex genome of
bread wheat, including its highly rearranged chromosome
4A. The approach has important implications for the
whole-genome analysis of both bread wheat and other
large genomes of agriculturally important grasses such as
rye (Secale cereale), fescue (Festuca ssp.) and ryegrass
(Lolium ssp.).
RESULTS
Preparation of chromosomal DNA and shotgun sequencing
Two separate DNA bulks were prepared from the mitotically
dividing cells of the double di-telosomic 4A stock. The 4AS
preparation contained approximately 78 000 flow-sorted
telosomes, and the 4AL one contained approximately
50 000. The level of purity of these preparations, as esti-
mated by fluorescent in situ hybridization, was 86.9% and
89.0%, respectively. Chromosome 1D comprised approxi-
mately 50% of the contaminants in the 4AL preparation, but
no single chromosome predominated in the 4AS prepara-
tion. The 4AS bulk yielded 29.5 ng DNA, which was
amplified in three independent multiple displacement
amplification reactions to generate 16 lg DNA; similarly, the
4AL bulk produced 44.6 ng DNA, which was amplified in
four reactions to yield 22.7 lg DNA. The individual multiple
displacement amplification reactions for each template were
combined to reduce the probability of bias introduced by
multiple displacement amplification itself. The amplified
DNA was used for 454 shotgun sequencing (Table 1), which
produced 2 181 649 4AS reads of mean length 324 bp,
representing a total of 707 Mb of sequence (NCBI sequence
read archive, http://www.ncbi.nlm.nih.gov/sra, reference
SRA038898.1). Given the estimated length of this arm
(317 Mbp; Safar et al., 2010), this is equivalent to a
sequencing depth of approximately 2.2-fold. For chromo-
some 4AL, the 2 987 571 reads (mean length 302 bp) yielded
901 Mb of sequence (NCBI sequence read archive, reference
SRA034928.1), equivalent to a sequencing depth of approx-
imately 1.7-fold. Sequencing details are summarized in
Table 1.
Identification of syntenic regions in related grass genomes
The full genome sequences of Brachypodium, rice and
sorghum (International Rice Genome Sequencing Project
2005, Paterson et al., 2009; International Brachypodium
Initiative 2010) were used to identify regions of synteny in
order to take advantage of the GenomeZipper approach
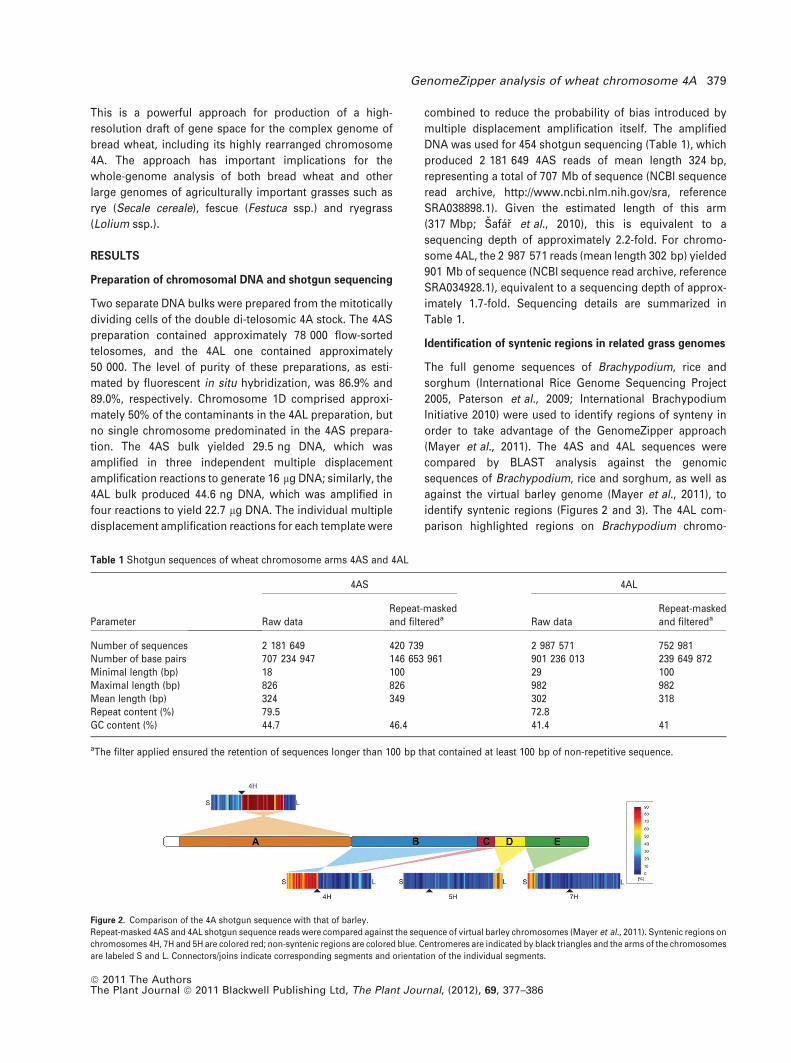
(Mayer et al., 2011). The 4AS and 4AL sequences were
compared by BLAST analysis against the genomic
sequences of Brachypodium, rice and sorghum, as well as
against the virtual barley genome (Mayer et al., 2011), to
identify syntenic regions (Figures 2 and 3). The 4AL com-
parison highlighted regions on Brachypodium chromo-
Table 1 Shotgun sequences of wheat chromosome arms 4AS and 4AL
Parameter
4AS 4AL
Raw dataRepeat-maskedand filtereda Raw data
Repeat-maskedand filtereda
Number of sequences 2 181 649 420 739 2 987 571 752 981Number of base pairs 707 234 947 146 653 961 901 236 013 239 649 872Minimal length (bp) 18 100 29 100Maximal length (bp) 826 826 982 982Mean length (bp) 324 349 302 318Repeat content (%) 79.5 72.8GC content (%) 44.7 46.4 41.4 41
aThe filter applied ensured the retention of sequences longer than 100 bp that contained at least 100 bp of non-repetitive sequence.
Figure 2. Comparison of the 4A shotgun sequence with that of barley.
Repeat-masked 4AS and 4AL shotgun sequence reads were compared against the sequence of virtual barley chromosomes (Mayer et al., 2011). Syntenic regions on
chromosomes 4H, 7H and 5H are colored red; non-syntenic regions are colored blue. Centromeres are indicated by black triangles and the arms of the chromosomes
are labeled S and L. Connectors/joins indicate corresponding segments and orientation of the individual segments.
GenomeZipper analysis of wheat chromosome 4A 379
ª 2011 The AuthorsThe Plant Journal ª 2011 Blackwell Publishing Ltd, The Plant Journal, (2012), 69, 377–386
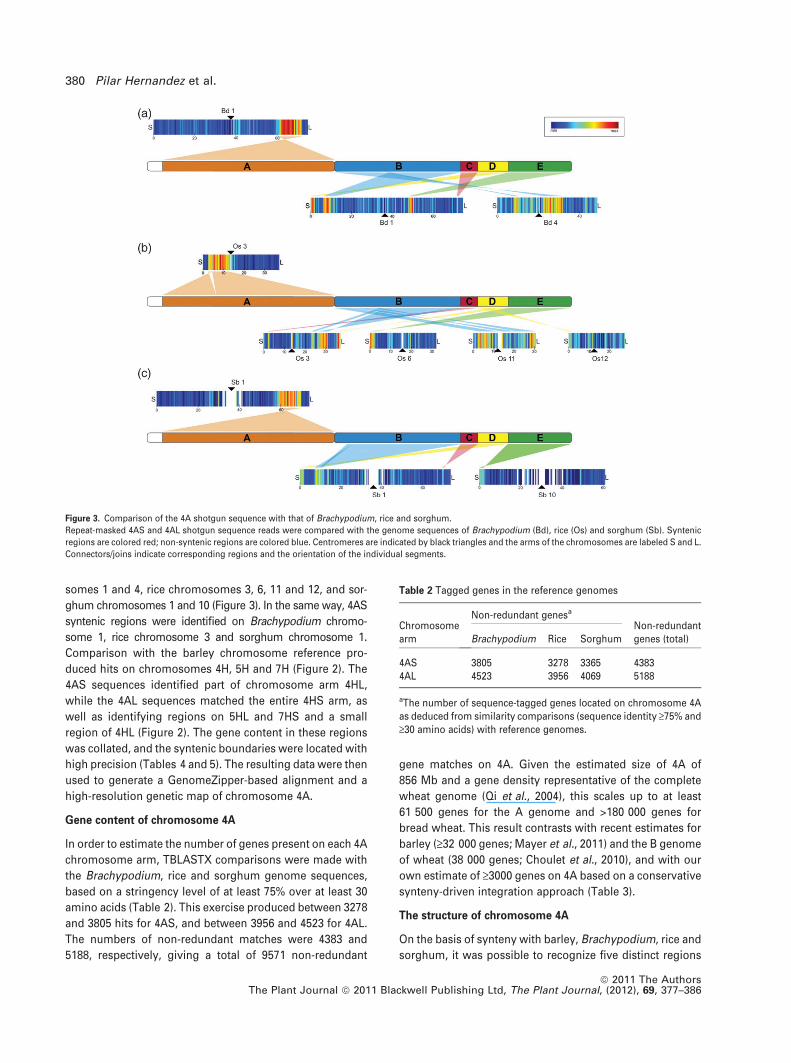
somes 1 and 4, rice chromosomes 3, 6, 11 and 12, and sor-
ghum chromosomes 1 and 10 (Figure 3). In the same way, 4AS
syntenic regions were identified on Brachypodium chromo-
some 1, rice chromosome 3 and sorghum chromosome 1.
Comparison with the barley chromosome reference pro-
duced hits on chromosomes 4H, 5H and 7H (Figure 2). The
4AS sequences identified part of chromosome arm 4HL,
while the 4AL sequences matched the entire 4HS arm, as
well as identifying regions on 5HL and 7HS and a small
region of 4HL (Figure 2). The gene content in these regions
was collated, and the syntenic boundaries were located with
high precision (Tables 4 and 5). The resulting data were then
used to generate a GenomeZipper-based alignment and a
high-resolution genetic map of chromosome 4A.
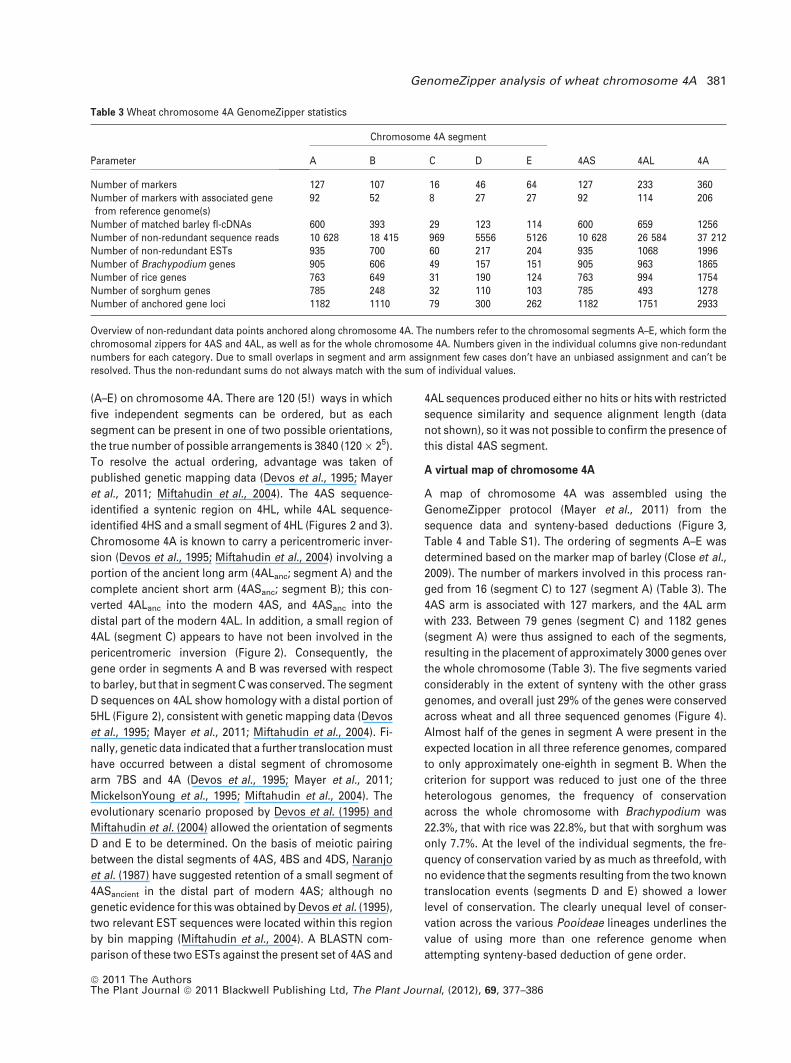
Gene content of chromosome 4A
In order to estimate the number of genes present on each 4A
chromosome arm, TBLASTX comparisons were made with
the Brachypodium, rice and sorghum genome sequences,
based on a stringency level of at least 75% over at least 30
amino acids (Table 2). This exercise produced between 3278
and 3805 hits for 4AS, and between 3956 and 4523 for 4AL.
The numbers of non-redundant matches were 4383 and
5188, respectively, giving a total of 9571 non-redundant
gene matches on 4A. Given the estimated size of 4A of
856 Mb and a gene density representative of the complete
wheat genome (Qi et al., 2004), this scales up to at least
61 500 genes for the A genome and >180 000 genes for
bread wheat. This result contrasts with recent estimates for
barley (‡32 000 genes; Mayer et al., 2011) and the B genome
of wheat (38 000 genes; Choulet et al., 2010), and with our
own estimate of ‡3000 genes on 4A based on a conservative
synteny-driven integration approach (Table 3).
The structure of chromosome 4A
On the basis of synteny with barley, Brachypodium, rice and
sorghum, it was possible to recognize five distinct regions
Figure 3. Comparison of the 4A shotgun sequence with that of Brachypodium, rice and sorghum.
Repeat-masked 4AS and 4AL shotgun sequence reads were compared with the genome sequences of Brachypodium (Bd), rice (Os) and sorghum (Sb). Syntenic
regions are colored red; non-syntenic regions are colored blue. Centromeres are indicated by black triangles and the arms of the chromosomes are labeled S and L.
Connectors/joins indicate corresponding regions and the orientation of the individual segments.
Table 2 Tagged genes in the reference genomes
Chromosomearm
Non-redundant genesa
Non-redundantgenes (total)Brachypodium Rice Sorghum
4AS 3805 3278 3365 43834AL 4523 3956 4069 5188
aThe number of sequence-tagged genes located on chromosome 4Aas deduced from similarity comparisons (sequence identity ‡75% and‡30 amino acids) with reference genomes.
380 Pilar Hernandez et al.
ª 2011 The AuthorsThe Plant Journal ª 2011 Blackwell Publishing Ltd, The Plant Journal, (2012), 69, 377–386
(A–E) on chromosome 4A. There are 120 (5!) ways in which
five independent segments can be ordered, but as each
segment can be present in one of two possible orientations,
the true number of possible arrangements is 3840 (120 · 25).
To resolve the actual ordering, advantage was taken of
published genetic mapping data (Devos et al., 1995; Mayer
et al., 2011; Miftahudin et al., 2004). The 4AS sequence-
identified a syntenic region on 4HL, while 4AL sequence-
identified 4HS and a small segment of 4HL (Figures 2 and 3).
Chromosome 4A is known to carry a pericentromeric inver-
sion (Devos et al., 1995; Miftahudin et al., 2004) involving a
portion of the ancient long arm (4ALanc; segment A) and the
complete ancient short arm (4ASanc; segment B); this con-
verted 4ALanc into the modern 4AS, and 4ASanc into the
distal part of the modern 4AL. In addition, a small region of
4AL (segment C) appears to have not been involved in the
pericentromeric inversion (Figure 2). Consequently, the
gene order in segments A and B was reversed with respect
to barley, but that in segment C was conserved. The segment
D sequences on 4AL show homology with a distal portion of
5HL (Figure 2), consistent with genetic mapping data (Devos
et al., 1995; Mayer et al., 2011; Miftahudin et al., 2004). Fi-
nally, genetic data indicated that a further translocation must
have occurred between a distal segment of chromosome
arm 7BS and 4A (Devos et al., 1995; Mayer et al., 2011;
MickelsonYoung et al., 1995; Miftahudin et al., 2004). The
evolutionary scenario proposed by Devos et al. (1995) and
Miftahudin et al. (2004) allowed the orientation of segments
D and E to be determined. On the basis of meiotic pairing
between the distal segments of 4AS, 4BS and 4DS, Naranjo
et al. (1987) have suggested retention of a small segment of
4ASancient in the distal part of modern 4AS; although no
genetic evidence for this was obtained by Devos et al. (1995),
two relevant EST sequences were located within this region
by bin mapping (Miftahudin et al., 2004). A BLASTN com-
parison of these two ESTs against the present set of 4AS and
4AL sequences produced either no hits or hits with restricted
sequence similarity and sequence alignment length (data
not shown), so it was not possible to confirm the presence of
this distal 4AS segment.
A virtual map of chromosome 4A
A map of chromosome 4A was assembled using the
GenomeZipper protocol (Mayer et al., 2011) from the
sequence data and synteny-based deductions (Figure 3,
Table 4 and Table S1). The ordering of segments A–E was
determined based on the marker map of barley (Close et al.,
2009). The number of markers involved in this process ran-
ged from 16 (segment C) to 127 (segment A) (Table 3). The
4AS arm is associated with 127 markers, and the 4AL arm
with 233. Between 79 genes (segment C) and 1182 genes
(segment A) were thus assigned to each of the segments,
resulting in the placement of approximately 3000 genes over
the whole chromosome (Table 3). The five segments varied
considerably in the extent of synteny with the other grass
genomes, and overall just 29% of the genes were conserved
across wheat and all three sequenced genomes (Figure 4).
Almost half of the genes in segment A were present in the
expected location in all three reference genomes, compared
to only approximately one-eighth in segment B. When the
criterion for support was reduced to just one of the three
heterologous genomes, the frequency of conservation
across the whole chromosome with Brachypodium was
22.3%, that with rice was 22.8%, but that with sorghum was
only 7.7%. At the level of the individual segments, the fre-
quency of conservation varied by as much as threefold, with
no evidence that the segments resulting from the two known
translocation events (segments D and E) showed a lower
level of conservation. The clearly unequal level of conser-
vation across the various Pooideae lineages underlines the
value of using more than one reference genome when
attempting synteny-based deduction of gene order.
Table 3 Wheat chromosome 4A GenomeZipper statistics
Parameter
Chromosome 4A segment
4AS 4AL 4AA B C D E
Number of markers 127 107 16 46 64 127 233 360Number of markers with associated genefrom reference genome(s)
92 52 8 27 27 92 114 206
Number of matched barley fl-cDNAs 600 393 29 123 114 600 659 1256Number of non-redundant sequence reads 10 628 18 415 969 5556 5126 10 628 26 584 37 212Number of non-redundant ESTs 935 700 60 217 204 935 1068 1996Number of Brachypodium genes 905 606 49 157 151 905 963 1865Number of rice genes 763 649 31 190 124 763 994 1754Number of sorghum genes 785 248 32 110 103 785 493 1278Number of anchored gene loci 1182 1110 79 300 262 1182 1751 2933
Overview of non-redundant data points anchored along chromosome 4A. The numbers refer to the chromosomal segments A–E, which form thechromosomal zippers for 4AS and 4AL, as well as for the whole chromosome 4A. Numbers given in the individual columns give non-redundantnumbers for each category. Due to small overlaps in segment and arm assignment few cases don’t have an unbiased assignment and can’t beresolved. Thus the non-redundant sums do not always match with the sum of individual values.
GenomeZipper analysis of wheat chromosome 4A 381
ª 2011 The AuthorsThe Plant Journal ª 2011 Blackwell Publishing Ltd, The Plant Journal, (2012), 69, 377–386
Translocation and inversion breakpoints
Alignment of the 4A sequence against that of the barley,
Brachypodium, rice and sorghum genomes allowed precise
localization of the breakpoints associated with the various
rearrangements that have determined the structure of
chromosome 4A (Figures 2 and 3, and Tables 4 and 5).
Sequence comparison against a genome built of the barley
genome as well as against the reference genomes of Brac-
hypodium, rice and sorghum allow precise delineation and
detection of the regions where the rearrangements
occurred, with an almost single-gene resolution (Figures 2
and 3, and Tables 4 and 5). We analyzed the corresponding
regions in the reference genomes for syntenic intervals and
syntenic borders. Based on gene detection by sequence
comparisons of 4AS and 4AL, reads bordering syntenic
regions could be accurately identified. The regions range
between 370 kb and 28 Mb, and contain between 905 genes
and only 31 genes in the respective syntenic regions
(Table 4). The exact positioning of syntenic borders also
allows definition of the bordering genes for the individual
segments and their orthologous counterparts in the
reference genomes (Table 5). The approach based on
flow sorting-facilitated isolation of chromosome arms,
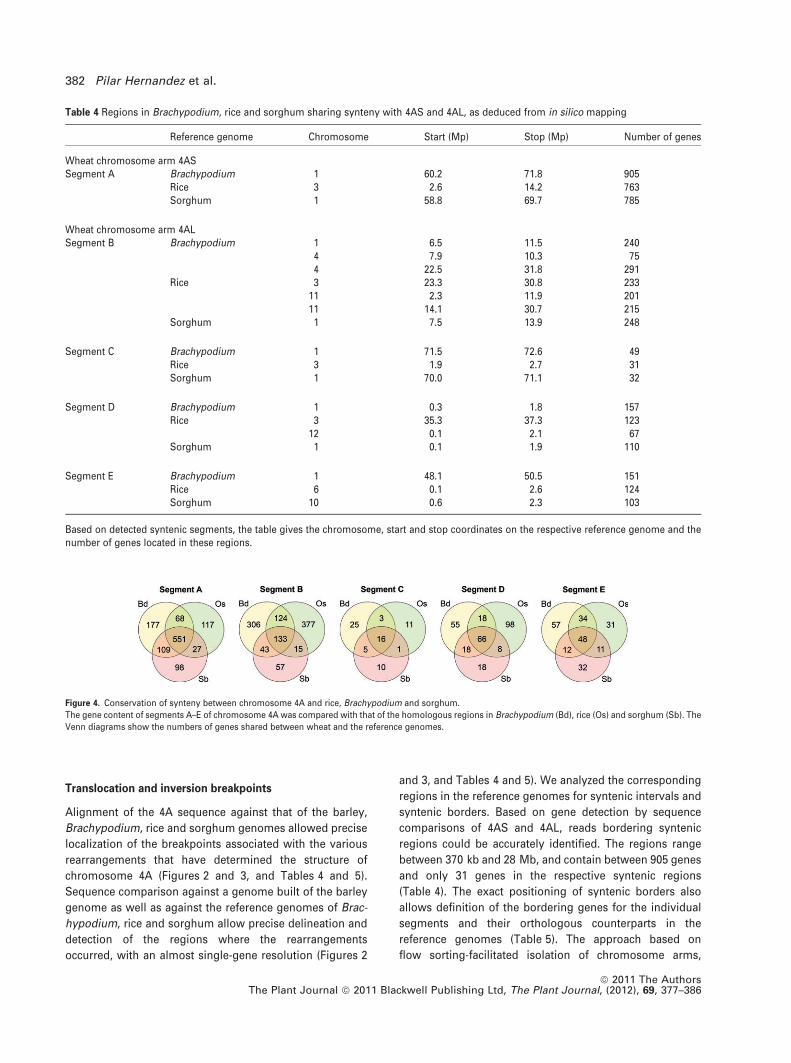
Table 4 Regions in Brachypodium, rice and sorghum sharing synteny with 4AS and 4AL, as deduced from in silico mapping
Reference genome Chromosome Start (Mp) Stop (Mp) Number of genes
Wheat chromosome arm 4ASSegment A Brachypodium 1 60.2 71.8 905
Rice 3 2.6 14.2 763Sorghum 1 58.8 69.7 785
Wheat chromosome arm 4ALSegment B Brachypodium 1 6.5 11.5 240
4 7.9 10.3 754 22.5 31.8 291
Rice 3 23.3 30.8 23311 2.3 11.9 20111 14.1 30.7 215
Sorghum 1 7.5 13.9 248
Segment C Brachypodium 1 71.5 72.6 49Rice 3 1.9 2.7 31Sorghum 1 70.0 71.1 32
Segment D Brachypodium 1 0.3 1.8 157Rice 3 35.3 37.3 123
12 0.1 2.1 67Sorghum 1 0.1 1.9 110
Segment E Brachypodium 1 48.1 50.5 151Rice 6 0.1 2.6 124Sorghum 10 0.6 2.3 103
Based on detected syntenic segments, the table gives the chromosome, start and stop coordinates on the respective reference genome and thenumber of genes located in these regions.
Figure 4. Conservation of synteny between chromosome 4A and rice, Brachypodium and sorghum.
The gene content of segments A–E of chromosome 4A was compared with that of the homologous regions in Brachypodium (Bd), rice (Os) and sorghum (Sb). The
Venn diagrams show the numbers of genes shared between wheat and the reference genomes.
382 Pilar Hernandez et al.
ª 2011 The AuthorsThe Plant Journal ª 2011 Blackwell Publishing Ltd, The Plant Journal, (2012), 69, 377–386

high-throughput sequencing and comparative genome
analysis is thus capable of reconstructing genomes and
identifying evolutionary translocation breakpoints.
DISCUSSION
The structure of chromosome 4A
The large size and polyploidy of the bread wheat genome
pose a considerable challenge for its sequencing. Current
sequencing technology has the ability to acquire large
amounts of sequence economically, but sequence assem-
bly, and, most importantly, establishment of the gene order
within each of the 21 chromosomes are particularly difficult,
mostly because of the presence of homoeologous copies of
most genes and the extent of repetitive DNA present. For-
tunately, much synteny has been retained among Poaceae
species in general, and among the Triticeae species in par-
ticular (Bolot et al., 2009; Devos and Gale, 2000; Moore,
1995; Salse and Feuillet, 2007). A small number of major
chromosomal rearrangements are known among the Triti-
ceae (Devos et al., 1995), but collinearity has largely been
retained across the wheat and barley genomes, despite
their divergence approximately 12 Myr (Gaut, 2002). Within
wheat itself, chromosome 4A suffered the most significant
overall re-arrangement (Figures 1 and 2) (Devos et al., 1995;
Miftahudin et al., 2004), as confirmed by an extensive com-
parative study of the gene content of wheat and barley
(Mayer et al., 2011; Qi et al., 2004). Integration of sequence
and mapping data allowed recognition that chromosome 4A
comprises five separate segments. Segments A, B and C
originated from the pericentromeric inversion, while seg-
ments D and E arose from later interchanges with chromo-
somes 5A and 7B. All five segments were successfully
ordered and oriented to allow subsequent GenomeZipper-
based gene integration and positioning.
Identification of translocations and inversions
While assignment of 4AS-derived sequences to corre-
sponding syntenic segments in the reference genomes and
barley was relatively straightforward, the assignment was
much more complex for 4AL (Figure 3). Integration of the
resulting patterns and comparison with barley chromo-
somes 4H, 5H and 7H led to identification of five syntenic
segments A–E. The orientation of segments A, B and C was
evident from comparisons based on the most parsimonious
single pericentromeric inversion event. On the other hand,
the positioning and orientation of segments D and E, which
resulted from translocations from chromosomes 5A and 7B,
respectively, could not be deduced from synteny patterns
alone. In conjunction with genetic mapping data and a
derived order of segments and their orientation (Devos
et al., 1995; Miftahudin et al., 2004), all five segments were
ordered and oriented for GenomeZipper-based gene inte-
gration and positioning. Thus, by integrating genetic data
with our molecular and comparative data, a conclusive order
and orientation of segments and accordingly a linear order
of genes could be established. This demonstrates the power
of combining and integrating genetic data with chromo-
some next-generation sequencing-derived shotgun
sequence data and comparative and bioinformatic analysis.
Gene content of wheat chromosome 4A
A rather stringent comparison between the 4A sequences
and the various annotated reference genomes produced an
estimated gene content on chromosome 4A of >9500 genes, a
number that is rather higher than has been suggested for
either barley chromosome 4H (4000) or wheat chromosome
3B (6360) (Mayer et al., 2011; Paux et al., 2008). Other
estimates of gene number based on the analysis of individual
chromosomes have also diverged from those based on
Table 5 Overview of the breakpoints between the five chromosome4A segments
Segment Brachypodium Rice Sorghum
A Bradi1g72080.1 Os03g0187500 Sb01g044730.1Bradi1g72086.1 Os03g0187400 Sb01g044740.1Bradi1g72092.1 Os03g0187300 Sb01g044750.1
… … …Bradi1g65190.1 Os03g0296700 Sb01g038210.1Bradi1g65197.1 Os03g0296600 Sb01g038220.1Bradi1g65210.1 Os03g0296400 Sb01g038230.1
B Bradi4g26690.1 Os11g0150450 Sb01g013770.1Bradi4g26670.3 Os11g0151600 Sb01g013780.1Bradi4g26640.1 Os11g0152700 Sb01g013830.1
… … …Bradi1g13777.1 Os03g0652100 Sb01g013490.1Bradi1g13850.1 Os03g0648200 Sb01g013540.1Bradi1g13870.1 Os03g0645100 Sb01g013650.1
C Bradi1g75740.1 Os03g0138200 Sb01g047640.1Bradi1g75720.1 Os03g0140100 Sb01g047630.1Bradi1g75707.1 Os03g0141100 Sb01g047610.1
… … …Bradi1g75960.1 Os03g0147900 Sb01g047070.1Bradi1g75970.1 Os03g0147700 Sb01g047850.1Bradi1g76227.1 Os03g0136900 Sb01g047860.1
D Bradi1g00227.1 Os03g0861800 Sb01g000210.1Bradi1g00237.1 Os03g0860900 Sb01g000220.1Bradi1g00247.1 Os03g0860700 Sb01g000300.1
… … …Bradi1g02940.1 Os03g0823800 Sb01g002280.1Bradi1g02950.1 Os03g0822100 Sb01g002300.1Bradi1g02980.1 Os03g0821633 Sb01g002410.1
E Bradi1g49450.1 Os06g0122200 Sb10g001470.1Bradi1g49460.1 Os06g0125000 Sb10g001520.1Bradi1g49470.1 Os06g0125300 Sb10g001530.1
… … …Bradi1g52060.1 Os06g0103300 Sb10g000300.1Bradi1g52090.1 Os06g0102900 Sb10g000270.1Bradi1g52110.1 Os06g0102700 Sb10g000260.1
Only the first and last three syntenic genes anchored in each segmentare shown.
GenomeZipper analysis of wheat chromosome 4A 383
ª 2011 The AuthorsThe Plant Journal ª 2011 Blackwell Publishing Ltd, The Plant Journal, (2012), 69, 377–386
whole-genome analyses (Mayer et al., 2009; Wicker et al.,
2011). One explanation is that individual chromosomes/
chromosome arms are compared with complete reference
genomes, which may result in a higher rate of false-positive
gene identifications due to the presence of cross-matching
paralogous sequences. In an analysis of shotgun sequences
from wheat homoeologous group 1 chromosomes, Wicker
et al. (2011) identified a significant number of potential
pseudogenes (similar to, or even exceeding the number of
functional genes) that shared homology with various known
genes but were not present in the syntenic regions of either
Brachypodium or rice. This underlines the value of the com-
parative approach when attempting estimation of the num-
ber of genes present on a particular wheat chromosome.
The GenomeZipper method identified 1182 genes on
4AS and 1751 on 4AL, so a total of approximately 3000 genes
supported by synteny was placed on the entire chromosome.
Important in understanding the context of this estimate are
(i) the sequencing depth achieved (2.2-fold for 4AS; 1.7-fold
for 4AL), (ii) the expected gene detection rate (85%, based
on the method described by Lander and Waterman, 1988),
and (iii) that 20–25% of wheat genic sequences fail to detect a
close homolog in the reference genomes (Mayer et al., 2011).
Based on these considerations, we estimate the gene con-
tent of chromosome 4A to be approximately 4300 (2933/
0.85 · 100/80). Assuming that the gene density on chromo-
some 4A is representative of the A genome as a whole, and
given that its physical length is 15.6% of the entire genome,
the A genome contains approximately 28 000 genes, a
number largely in line with estimates for both the B genome
(38 000; Choulet et al., 2010) and for barley (32 000; Mayer
et al., 2011). However, due to the series of translocations of
presumably gene-rich telomeric regions that shaped the
modern chromosome 4A, the gene content of chromosome
4A may deviate from that of other less rearranged wheat
chromosomes. Thus chromosomal shotgun sequences for
other chromosomes will be helpful to refine gene estimates
for the individual wheat sub-genomes.
Limitations in resolution
A high-resolution EST map has been constructed for both
Ae. tauschii, the D genome donor species (Luo et al., 2009),
and chromosome 3B (Paux et al., 2008). At present, only
binned EST markers (Qi et al., 2004) are available for the
other wheat chromosomes. Bin maps lack sufficient reso-
lution to be used for syntenic integration and genome zip-
ping, which is why it was necessary here to rely on the barley
genetic map. The validity of this approach depends on the
retention of a high degree of synteny between barley and
wheat; any small-scale rearrangements will not be detected
until a dense marker map of the wheat genome has been
generated. Nevertheless, it was still possible to identify with
high precision the boundaries between the five segments
that arose as a result of the evolutionary inversion and
translocations. Earlier research based on mapping of cDNA
RFLP loci (Devos et al., 1995) and bin mapping (Miftahudin
et al., 2004) suggested the presence of at least two other
segments on chromosome 4A, but we have not been able to
confirm the presence of either of these. The availability of
higher-resolution genetic maps (which are certainly attain-
able given the volume of relevant sequence data now
available) will enable confirmation of the veracity of these
proposed additional structural rearrangements. A full com-
parative analysis awaits acquisition of genomic sequence
from chromosomes 4B and 4D, and from the translocated
portions of 5A and 7B. These data will enable determination
of the degree of similarity between homoeologs with respect
to gene content and potential loss of genes. Identification of
the translocation breakpoints on chromosomes 7B and 5A
may also allow recognition of molecular signatures and the
molecular environment that marks these translocations.
CONCLUSION
We have demonstrated here that fractionation of the com-
plex wheat genome into single chromosome arms, coupled
with the analysis of shotgun sequences using GenomeZip-
per, provides a successful strategy for constructing a high-
resolution gene-based chromosome map. The acquisition of
a complete ordered gene map, and ultimately of the genome
sequence itself, requires the development of a reliable
physical map, the construction of which is presently being
coordinated by the International Wheat Genome Sequenc-
ing Consortium. A physical map, together with chromosome
survey sequences, offers an ideal means of performing a
detailed analysis of chromosomal rearrangements. Further
developments in sequencing efficiency should also provide
opportunities to improve both chromosome coverage and
gene detection rate. This will eventually enable discovery of
the full genomic gene territories to enable study of the gene
structure and associated non-transcribed elements such as
cis elements.
EXPERIMENTAL PROCEDURES
Plant material
The 4A double di-telosomic stock of bread wheat cv. Chinese Springis a stable line in which chromosome 4A is represented by a pair oftelosomes, one of which is the short arm (4AS) and the other thelong arm (4AL) (Sears and Sears, 1978). Grain of this stock waskindly provided by Dr Bikram Gill (Department of Plant Pathology,Kansas State University, Manhattan, KS).
Chromosome sorting and DNA amplification
Liquid suspensions of mitotic chromosomes were prepared fromseedling root tips as described by Vrana et al. (2000). Telosomeswere isolated and sorted using a FACSVantage SE flow cytometer(Becton Dickinson) into 40 ll sterile deionized water. The level ofpurity of the sorted material was determined using fluorescencein situ hybridization based on a probe containing either the telo-meric repeat Afa or [GAA]n, as described by Kubalakova et al.
384 Pilar Hernandez et al.
ª 2011 The AuthorsThe Plant Journal ª 2011 Blackwell Publishing Ltd, The Plant Journal, (2012), 69, 377–386
(2003). The flow-sorted chromosomes were treated with proteinase,and DNA was then extracted using a Microcon YM-100 column(Millipore, http://www.millipore.com/), as described by Simkovaet al. (2008). Chromosomal DNA was amplified by multiple dis-placement amplification using an Illustra GenomiPhi V2 DNAamplification kit (GE Healthcare, http://www.gehealthcare.com),and a Roche shotgun library (http://www.roche.com) was thencreated for each chromosome arm based on 5 lg multipledisplacement-amplified DNA.
DNA sequencing and analysis
Sequencing of the 4AS and 4AL libraries was performed at theLifesequencing S.L. facilities in Valencia (Spain) (http://www.lifesequencing.com/) on a Genome Sequencer FLX instrument (Roche),using titanium chemistry 454 Life Sciences Technology (Roche).Three full sequencing runs were performed for the 4AL library andtwo for the 4AS library. Repetitive DNA was masked using VMATCH
software (http://www.vmatch.de/), using the MIPS-REDAT POA-CEAE version 8.6.2 repeat library as a reference (http://mips.helmholtz-muenchen.de/plant/genomes.jsp). The following para-meters were applied: 70% identity cut-off, 100 bp minimal length,seed length 14, exdrop 5, e-value 0.001. To estimate the number ofgenes present, the repeat-filtered sequence reads were comparedby TBLASTX against the coding sequences for Brachypodium(ftp://ftpmips.helmholtz-muenchen.de/plants/brachypodium/v1.2),rice (rice RAP-DB genome build 4, http://rapdb.dna.affrc.go.jp)and SORGHUM (version 1.4, http://genome.jgi-psf.org/Sorbi1/Sorbi1.download.ftp.html).
GenomeZipper analysis
The GenomeZipper workflow described by Mayer et al. (2011) wasused, with some adjustments. Comparison and integration of theshotgun sequence into a linear gene order reference were achievedby exploiting synteny with barley, Brachypodium, rice and sor-ghum. The 4A segments were delineated by a BLASTN comparisonof the shotgun sequence data with that of barley artificial chromo-somes (Mayer et al., 2011). Only hits showing at least 85% identityand a minimum alignment of 100 bp were considered. BLASTX wasused to identify homologs in the reference genomes, applying acriterion of >70% similarity and a minimum length of 30 aminoacids. To position and orient genes, a selection of genes present inboth the five 4A segments and the relevant syntenic regions of theother grass genome(s) was aligned using a marker-based map ofbarley chromosomes 4H, 5H and 7H.
ACKNOWLEDGEMENTS
We warmly acknowledge the help provided by Jarmila Cıhalıkova,Romana Sperkova and Zdenka Dubska in chromosome sorting, aswell as the helpful comments of two anonymous reviewers. Thisresearch was financially supported by the Spanish Ministry of Sci-ence and Innovation (grant numbers BIO2009–07443, BIO2011–15237 and AGL2010–17316), the German Ministry of Education andResearch GABI Barlex project, the European Commission FP7-212019 Triticeae Genome grant, the Czech Science Foundation(awards 521/08/1629 and P501/10/1740), and the Czech RepublicMinistry of Education, Youth and Sports/European RegionalDevelopment Fund (Operational Programme Research and Devel-opment for Innovations grant number CZ.1.05/2.1.00/01.0007).
SUPPORTING INFORMATION
Additional Supporting Information may be found in the onlineversion of this article:Table S1. GenomeZipper analysis of wheat chromosome 4A.
Please note: As a service to our authors and readers, this journalprovides supporting information supplied by the authors. Suchmaterials are peer-reviewed and may be re-organized for onlinedelivery, but are not copy-edited or typeset. Technical supportissues arising from supporting information (other than missingfiles) should be addressed to the authors.
REFERENCES
Araki, E., Miura, H. and Sawada, S. (1999) Identification of genetic loci
affecting amylose content and agronomic traits on chromosome 4A of
wheat. Theor. Appl. Genet. 98, 977–984.
Bai, G.H., Chen, C.X. and Cai, S.B. (2008) A major QTL controlling seed dor-
mancy and pre-harvest sprouting resistance on chromosome 4A in a Chi-
nese wheat landrace. Mol. Breeding, 21, 351–358.
Berkman, P.J., Skarshewski, A., Lorenc, M.T. et al. (2011) Sequencing and
assembly of low copy and genic regions of isolated Triticum aestivum
chromosome arm 7DS. Plant Biotechnol. J. 9, 768–775.
Bolot, S., Abrouk, M., Masood-Quraishi, U., Stein, N., Messing, J., Feuillet, C.
and Salse, J. (2009) The ‘inner circle’ of the cereal genomes. Curr. Opin.
Plant Biol. 12, 119–125.
Borner, A., Schumann, E., Furste, A., Coster, H., Leithold, B., Roder, M.S. and
Weber, W.E. (2002) Mapping of quantitative trait loci determining agro-
nomic important characters in hexaploid wheat (Triticum aestivum L.).
Theor. Appl. Genet. 105, 921–936.
Chen, X.M., Line, R.F. and Jones, S.S. (1995) Chromosomal location of genes
for resistance to Puccinia striiformis in winter-wheat cultivars Heines-Vii,
Clement, Moro, Tyee, Ikes, and Daws. Phytopathology, 85, 1362–1367.
Chen, X.M., Luo, Y.H., Xia, X.C., Xia, L.Q., Chen, X., Ren, Z.L., He, Z.H. and Jia,
J.Z. (2005) Chromosomal location of powdery mildew resistance gene
Pm16 in wheat using SSR marker analysis. Plant Breeding, 124, 225–228.
Choulet, F., Wicker, T., Rustenholz, C. et al. (2010) Megabase level sequenc-
ing reveals contrasted organization and evolution patterns of the wheat
gene and transposable element spaces. Plant Cell, 22, 1686–1701.
Close, T.J., Bhat, P.R., Lonardi, S. et al. (2009) Development and implemen-
tation of high-throughput SNP genotyping in barley. BMC Genomics, 10,
582.
Devos, K. and Gale, M. (2000) Genome relationships: the grass model in
current research. Plant Cell, 12, 637–646.
Devos, K.M., Dubcovsky, J., Dvorak, J., Chinoy, C.N. and Gale, M.D. (1995)
Structural evolution of wheat chromosomes 4A, 5A, and 7B and its impact
on recombination. Theor. Appl. Genet. 91, 282–288.
Dolezel, J., Kubalakova, M., Paux, E., Bartos, J. and Feuillet, C. (2007) Chro-
mosome-based genomics in the cereals. Chromosome Res. 15, 51–66.
Dvorak, J. and Zhang, H.B. (1990) Variation in repeated nucleotide sequences
sheds light on the phylogeny of the wheat B and G genomes. Proc. Natl
Acad. Sci. USA, 87, 9640–9644.
Dvorak, J., Terlizzi, P., Zhang, H.B. and Resta, P. (1993) The evolution of
polyploid wheats: identification of the A genome donor species. Genome,
36, 21–31.
Effertz, R.J., Anderson, J.A. and Francl, L.J. (2001) Restriction fragment length
polymorphism mapping of resistance to two races of Pyrenophora tritici-
repentis in adult and seedling wheat. Phytopathology, 91, 572–578.
Feuillet, C., Travella, S., Stein, N., Albar, L., Nublat, A. and Keller, B. (2003)
Map-based isolation of the leaf rust disease resistance gene Lr10 from the
hexaploid wheat (Triticum aestivum L.) genome. Proc. Natl Acad. Sci. USA,
100, 15253–15258.
Flavell, R.B. (1986) Repetitive DNA and chromosome evolution in plants.
Philos. Trans. R. Soc. Lond. B Biol. Sci. 312, 227–242.
Gaut, B.S. (2002) Evolutionary dynamics of grass genomes. New Phytol. 154,
15–28.
International Brachypodium Initiative (2010) Genome sequencing and anal-
ysis of the model grass Brachypodium distachyon. Nature, 463, 763–768.
International Rice Genome Sequencing Project (2005) The map-based se-
quence of the rice genome. Nature, 436, 793–800.
Keller, M., Karutz, C., Schmid, J.E., Stamp, P., Winzeler, M., Keller, B. and
Messmer, M.M. (1999) Quantitative trait loci for lodging resistance in a
segregating wheat x spelt population. Theor. Appl. Genet. 98, 1171–1182.
Kilian, B., Ozkan, H., Deusch, O., Effgen, S., Brandolini, A., Kohl, J., Martin, W.
and Salamini, F. (2007) Independent wheat B and G genome origins in
outcrossing Aegilops progenitor haplotypes. Mol. Biol. Evol. 24, 217–227.
GenomeZipper analysis of wheat chromosome 4A 385
ª 2011 The AuthorsThe Plant Journal ª 2011 Blackwell Publishing Ltd, The Plant Journal, (2012), 69, 377–386
Kubalakova, M., Vrana, J., Cıhalıkova, J., Simkova, H. and Dolezel, J. (2002)
Flow karyotyping and chromosome sorting in bread wheat (Triticum aes-
tivum L.). Theor. Appl. Genet. 104, 1362–1372.
Kubalakova, M., Valarik, M., Bartos, J., Vrana, J., Cıhalıkova, J., Molnar-Lang,
M. and Dolezel, J. (2003) Analysis and sorting of rye (Secale cereale L.)
chromosomes using flow cytometry. Genome, 46, 893–905.
Lander, E.S. and Waterman, M.S. (1988) Genomic mapping by fingerprinting
random clones: a mathematical analysis. Genomics, 2, 231–239.
Luo, M.C., Deal, K.R., Akhunov, E.D. et al. (2009) Genome comparisons reveal
a dominant mechanism of chromosome number reduction in grasses and
accelerated genome evolution in Triticeae. Proc. Natl Acad. Sci. USA, 106,
15780–15785.
Mayer, K.F., Taudien, S., Martis, M. et al. (2009) Gene content and virtual gene
order of barley chromosome 1H. Plant Physiol. 151, 496–505.
Mayer, K.F., Martis, M., Hedley, P.E. et al. (2011) Unlocking the barley
genome by chromosomal and comparative genomics. Plant Cell, 23,
1249–1263.
McCartney, C.A., Somers, D.J., Humphreys, D.G., Lukow, O., Ames, N., Noll,
J., Cloutier, S. and McCallum, B.D. (2005) Mapping quantitative trait loci
controlling agronomic traits in the spring wheat cross RL4452 x ‘AC
Domain’. Genome, 48, 870–883.
McFadden, E. and Sears, E. (1946) The origin of Triticum spelta and its free-
threshing hexaploid relatives. J. Hered. 37, 107–116.
MickelsonYoung, L., Endo, T.R. and Gill, B.S. (1995) A cytogenetic ladder-map
of the wheat homoeologous group-4 chromosomes. Theor. Appl. Genet.
90, 1007–1011.
Miftahudin, R.K., Ma, X.F., Mahmood, A.A. et al. (2004) Analysis of
expressed sequence tag loci on wheat chromosome group 4. Genetics,
168, 651–663.
Moore, G. (1995) Cereal genome evolution – pastoral pursuits with lego
genomes. Curr. Opin. Genet. Dev. 5, 717–724.
Naranjo, T., Roca, A., Goicoechea, P.G. and Giraldez, R. (1987) Arm homo-
eology of wheat and rye chromosomes. Genome, 29, 873–882.
Nga, N.T.T., Hau, V.T.B. and Tosa, Y. (2009) Identification of genes for resis-
tance to a Digitaria isolate of Magnaporthe grisea in common wheat cul-
tivars. Genome, 52, 801–809.
Paterson, A.H., Bowers, J.E., Bruggmann, R. et al. (2009) The Sorghum
bicolor genome and the diversification of grasses. Nature, 457, 551–556.
Paull, J.G., Chalmers, K.J., Karakousis, A., Kretschmer, J.M., Manning, S.
and Langridge, P. (1998) Genetic diversity in Australian wheat varieties
and breeding material based on RFLP data. Theor. Appl. Genet. 96,
435–446.
Paux, E., Sourdille, P., Salse, J. et al. (2008) A physical map of the 1-gigabase
bread wheat chromosome 3B. Science, 322, 101–104.
Qi, L.L., Echalier, B., Chao, S. et al. (2004) A chromosome bin map of 16,000
expressed sequence tag loci and distribution of genes among the three
genomes of polyploid wheat. Genetics, 168, 701–712.
Safar, J., Simkova, H., Kubalakova, M., Cıhalıkova, J., Suchankova, P., Bartos,
J. and Dolezel, J. (2010) Development of chromosome-specific BAC
resources for genomics of bread wheat. Cytogenet. Genome Res. 129,
211–223.
Salse, J. and Feuillet, C. (2007) Comparative genomics of cereals. In
Genomics-Assisted Crop Improvement (Rajeev, K. and Varshney, R.T.,
eds). New York: Springer, pp. 177–205.
Sarkar, P. and Stebbins, G.L. (1956) Morphological evidence concerning the
origin of the B genome in wheat. Am. J. Bot. 43, 297–304.
Sears, E.R. and Sears, L.M.S. (1978) The telocentric chromosomes of common
wheat. In Proceedings of the 5th International Wheat Genetics Symposium
(Ramanujam, S. ed.). New Dehli: Indian Soc. Genet Plant Breed, pp. 389–
407.
Simkova, H., Svensson, J.T., Condamine, P., Hribova, E., Suchankova, P.,
Bhat, P.R., Bartos, J., Safar, J., Close, T.J. and Dolezel, J. (2008) Coupling
amplified DNA from flow-sorted chromosomes to high-density SNP map-
ping in barley. BMC Genomics, 9, 294.
Sourdille, P., Cadalen, T., Gay, G., Gill, B. and Bernard, M. (2002) Molecular
and physical mapping of genes affecting awning in wheat. Plant Breeding,
121, 320–324.
Talbert, L.E., Bruckner, P.L., Smith, L.Y., Sears, R. and Martin, T.J. (1996)
Development of PCR markers linked to resistance to wheat streak mosaic
virus in wheat. Theor. Appl. Genet. 93, 463–467.
Vrana, J., Kubalakova, M., Simkova, H., Cıhalıkova, J., Lysak, M.A. and
Dolezel, J. (2000) Flow sorting of mitotic chromosomes in common wheat
(Triticum aestivum L.). Genetics, 156, 2033–2041.
Wang, G.Z., Miyashita, N.T. and Tsunewaki, K. (1997) Plasmon analyses of
Triticum (wheat) and Aegilops: PCR-single-strand conformational poly-
morphism (PCR-SSCP) analyses of organellar DNAs. Proc. Natl Acad. Sci.
USA, 94, 14570–14577.
Wicker, T., Mayer, K.F., Gundlach, H. et al. (2011) Frequent gene movement
and pseudogene evolution is common to the large and complex genomes
of wheat, barley, and their relatives. Plant Cell, 23, 1706–1718.
386 Pilar Hernandez et al.
ª 2011 The AuthorsThe Plant Journal ª 2011 Blackwell Publishing Ltd, The Plant Journal, (2012), 69, 377–386