Chromosome distribution studies after inorganic lead exposure
12
Hum. Genet. 49, 147--158 (1979) © by Springer-Verlag 1979 Chromosome Distribution Studies After Inorganic Lead Exposure L. Verschaeve*, M. Driesen, M. Kirsch-Volders, L. Hens, and C. Susanne Laboratorium voor Antropogenetica, Vrije Universiteit Brussel, Pleinlaan 2, B-1050 Brussel, Belgium Summary. We studied the chromosome distribution in persons professionally exposed to inorganic lead. The degree of lead exposure was evaluated by biochemical measurements and cytogenetic analysis. The chromosome dis- tribution was analyzed from trypsin banded karyotypes; in particular we studied centromere distances (A 2) and centromere-metaphase-center dis- tances (d 2) which were obtained by computer-aided mathematical trans- formation of the individual metaphase coordinates. Higher concentrations of blood lead and urine d-ALA and a statistically significant increase in aneuploidy, hypoploidy, and type-B chromosome aber- rations revealed appreciable exposure although none of the subjects showed signs of excessive lead absorption. However study of the chromosome distribution showed no major dif- ferences with that of the controls indicating that lead acts preferentially (directly or indirectly) on the chromosomes rather than on the spindle apparatus. A dissociation of the acrocentric chromosomes was observed in the lead group when compared with the controls. This is thought to reflect a secondary action of lead on the nucleolar organiser regions. Introduction Since many studies have demonstrated a nonrandom distribution of chromo- somes in normal human mitotic metaphases (Hoo and Cramer, 1971; Warburton et al., 1973; Hens et al., 1975; Kirsch-Volders et al., 1977), we may assume that chemical or physical factors that influence the mitotic processes directly or indirectly (for example interaction with the spindle apparatus) will change the normal distribution pattern. This was observed in persons professionally exposed to phenyl-mercury-acetate (Verschaeve et al., 1978) and was at least partially * To whom offprint requests should be sent 0340-6717/79/0049/0147/$ 02.40
-
Upload
independent -
Category
Documents
-
view
1 -
download
0
Transcript of Chromosome distribution studies after inorganic lead exposure
Hum. Genet. 49, 147--158 (1979)
© by Springer-Verlag 1979
Chromosome Distribution Studies After Inorganic Lead Exposure
L. Verschaeve*, M. Driesen, M. Kirsch-Volders, L. Hens, and C. Susanne
Laboratorium voor Antropogenetica, Vrije Universiteit Brussel, Pleinlaan 2, B-1050 Brussel, Belgium
Summary. We studied the chromosome distribution in persons professionally exposed to inorganic lead. The degree of lead exposure was evaluated by biochemical measurements and cytogenetic analysis. The chromosome dis- tribution was analyzed from trypsin banded karyotypes; in part icular we studied centromere distances (A 2) and centromere-metaphase-center dis- tances (d 2) which were obtained by computer-aided mathematical trans- formation of the individual metaphase coordinates.
Higher concentrations of blood lead and urine d-ALA and a statistically significant increase in aneuploidy, hypoploidy, and type-B chromosome aber- rations revealed appreciable exposure although none of the subjects showed signs of excessive lead absorption.
However study of the chromosome distribution showed no major dif- ferences with that of the controls indicating that lead acts preferentially (directly or indirectly) on the chromosomes rather than on the spindle apparatus. A dissociation of the acrocentric chromosomes was observed in the lead group when compared with the controls. This is thought to reflect a secondary action of lead on the nucleolar organiser regions.
Introduction
Since many studies have demonstrated a nonrandom distribution of chromo- somes in normal human mitotic metaphases (Hoo and Cramer, 1971; Warburton et al., 1973; Hens et al., 1975; Kirsch-Volders et al., 1977), we may assume that chemical or physical factors that influence the mitotic processes directly or indirectly (for example interaction with the spindle apparatus) will change the normal distribution pattern. This was observed in persons professionally exposed to phenyl-mercury-acetate (Verschaeve et al., 1978) and was at least partially
* To whom offprint requests should be sent
0340-6717/79/0049/0147/$ 02.40
148 L. Verschaeve et al.
e x p l a i n e d t h r o u g h the k n o w n reac t iv i ty o f m e r c u r y c o m p o u n d s wi th sulf-
hyd ry l g r o u p s in the sp ind le a p p a r a t u s . T h e s t r o n g a f f in i ty fo r m e r c a p t a n e s is
h o w e v e r n o t the sole p r o p e r t y o f m e r c u r y c o m p o u n d s b u t is a l so e n c o u n t e r e d ,
t h o u g h less p r o n o u n c e d , fo r o t h e r h e a v y meta l s l ike l ead a n d c a d m i u m (Val lee
a n d U l m e r , 1972). Based on this s imi l a r i ty in b i o c h e m i c a l b e h a v i o r we thus m a y
expec t an a l t e r ed c h r o m o s o m e d i s t r i b u t i o n in pe r sons p r o f e s s i o n a l l y e x p o s e d to
lead. W e r e p o r t he re the resul t s o f a c h r o m o s o m e d i s t r i bu t i on s t udy p e r f o r m e d
on p e r s o n s e x p o s e d to i n o r g a n i c l ead a n d on age r e l a t ed con t ro l s . These resul ts
m a y give us s o m e n e w ins ight a b o u t the m e c h a n i s m o f ac t i on o f l ead c o m p o u n d s
at the ce l lu la r a n d c h r o m o s o m a l levels.
Materials and Methods
Blood samples were obtained from nine workers occupationally exposed to inorganic lead (mean age 37.8 years). All nine men showed no signs of intoxication or obvious excessive lead absorption, although in the past some of them had been periodically transferred to a lead-free work environment or even temporarily discharged because of clinical and preclinical signs of intoxication. At the time of sampling, which occurred during routine medical supervision, all subjects were considered 'normalized', that is as being in a 'normal' state of health. No exposure to environmental factors other than lead could be traced. They furthermore had no history of significant disease including genetic disorders. Blood samples from the controls were obtained from an organization for blood transfusion. The controls (12 men, mean age 40.5 years) had previously served as controls in a chromosome distribution study after exposure to phenyl- mercury-acetate (Verschaeve et al., 1978).
The exposure level to lead was estimated from biochemical and standard cytogenetic analyses. Lead concentrations in whole blood were determined by the method of Roosels and Bossiroy (in preparation). The hemoglobin content in the blood and ~-ALA concentration in the urine were also determined in the lead-exposed subjects.
Chromosome analysis was performed by standard procedures on lymphocytes from 48 h cultures. For structural chromosome aberrations and chromosome count an average of 100 cells per subject in both the exposed group and the controls were analyzed after Giemsa staining.
For the study of chromosome distribution, a total of 100 metaphase plates were karyotyped in the control group (eight subjects with 10 metaphases and four with 5 metaphases), and a total of 89 metaphase plates in the lead exposed group (eight subjects with 10 metaphases and one with 9 metaphases. Karyotypes were made after trypsin banding by the method of Klinger (1972). The identification of the chromosome pairs after banding allowed us to study the chromosome distribution in both exposed and control groups. The methodology used in this study is given in detail in other papers (Hens et al., 1975; Hens, 1976; Galperin-Lema~tre et al., 1977; etc.). Briefly, the Coordinates of all chromosomes in each metaphase plate were recorded and a circular transformation was then performed according to Barton et al. (1965) to obtain the 'generalized square distance A 2' (between the centromeres of two chromosomes and the 'generalized square distance d z' (between the centromere of a chromosome and the center of gravity of the metaphase). These values, obtained with the aid of a CDC 6400 computer, are dimensionless, and the procedure allows a direct comparison between the different metaphases independent from their form and photographic magnification. Within both investigated populations, d 2 and A 2 for a given chromosome combination were transformed into percentage frequencies and arranged in histogram classes of equal intervals. Comparison with a reference distribution allowed us to decide if a given chromosome combination showed a specific distribution pattern. The reference distribution was obtained by adding all d 2 ( o r A 2 values) for all possible chromosome combinations. But to make the population of numbers in the reference distribution and that of the particular histogram under study independent of each other, the absolute class frequencies of the reference distribution were diminished with the absolute class frequencies of the particular histogram.
Chromosome Distribution Studies After Inorganic Lead Exposure 149
2 '2 tests allow us to decide within a group (A 2 or d 2 of one chromosome combination with corresponding reference distribution) or between the two investigated groups (A 2 or d: in the control group with the same A 2 or d 2 in the exposed group) whether the compared histograms belong to the same population of numbers.
For A 2 generalized distances, supplementary data were obtained by studying the 'as- sociation tendency' as defined by Galperin et al. (1977).
Here 2z tests were performed for only two histogram classes: the first included the absolute values corresponding to the first column of the previously described histograms containing the lowest A 2 values; the second class contained all the rest of the absolute values. Again, both cell populations were compared.
Special attention was also paid to combinations of the D- and G-group chromosomes since they are known to associate preferentially (Cook, 1972; Galperin-Lema~tre et al., 1977; and others) and a specific action on those acrocentrics would not be surprising according to our previous results for mercury (Verschaeve et al., 1978).
Finally, cumulative frequencies of A 2 distances were also studied for both populations for the following combinations: within and between acrocentrics and within and between homol- ogous non acrocentrics.
Results
Cytogenetic and Biochemical Analyses
Biochemical and cytogenet ic analyses were per fo rmed to evaluate the degree o f
exposure. Lead concent ra t ions in the b lood ranged between 50 and 84y% in the
exposed popu la t ion (mean: 65.6) and between 10 and 25~% in the cont ro l
popu la t ion (mean: 16.25). Thus the b lood lead concentra t ions of all exposed
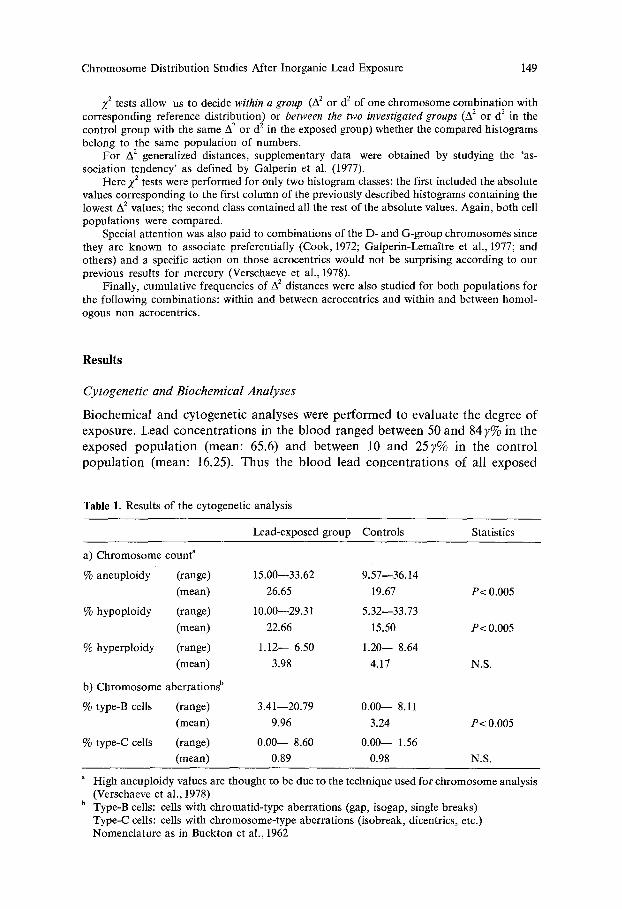
Table 1. Results of the cytogenetic analysis
Lead-exposed group Controls Statistics
a) Chromosome count a
% aneuploidy (range) 15.00--33.62 9.57--36.14
(mean) 26.65 19.67 P< 0.005
% hypoploidy (range) 10.00--29.31 5.32--33.73
(mean) 22.66 15.50 P< 0.005
% hyperploidy (range) 1.12-- 6.50 1.20-- 8.64
(mean) 3.98 4.17 N.S.
b) Chromosome aberrations b
% type-B cells (range) 3.41--20.79 0.00-- 8.11
(mean) 9.96 3.24 P< 0.005
% type-C cells (range) 0.00-- 8.60 0.00-- 1.56
(mean) 0.89 0.98 N.S.
High aneuploidy values are thought to be due to the technique used for chromosome analysis (Verschaeve et al., 1978)
b Type-B cells: cells with chromatid-type aberrations (gap, isogap, single breaks) Type-C ceils: ceils with chromosome-type aberrations (isobreak, dicentrics, etc.) Nomenclature as in Buckton et al., 1962
150
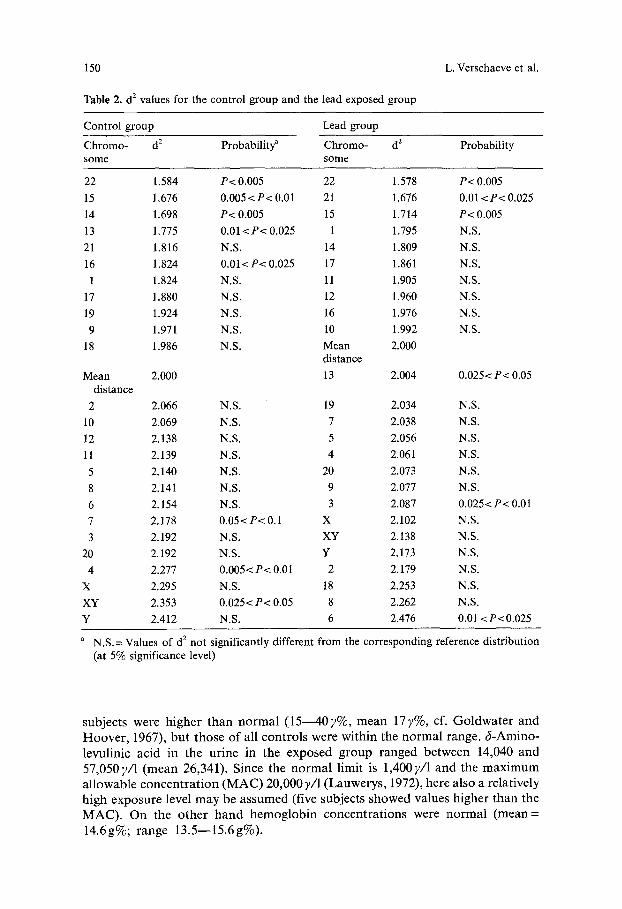
Table 2. d 2 values for the control group and the lead exposed group
L. Verschaeve et al.
Control group Lead group
Chromo- d 2 Probability ~ Chromo- d 2 Probability some some
22 1.584 P< 0.005 22 1.578 P< 0.005
15 1.676 0.005 <P< 0.01 21 1.676 0.01 <P< 0.025
14 1.698 P< 0.005 15 1.714 P< 0.005
13 1.775 0.01 <P< 0.025 1 1.795 N.S.
21 1.816 N.S. 14 1.809 N.S.
16 1.824 0.01< P< 0.025 17 1.861 N.S.
1 1.824 N.S. 11 1.905 N.S.
17 1.880 N.S. 12 1.960 N.S.
19 1.924 N.S. 16 1.976 N.S.
9 1.971 N.S. 10 1.992 N.S.
18 1.986 N.S. Mean 2.000 distance
Mean 2.000 13 2.004 0.025 < P< 0.05 distance
2 2.066 N.S. 19 2.034 N.S.
10 2.069 N.S. 7 2.038 N.S.
12 2.138 N.S. 5 2.056 N.S.
11 2.139 N.S. 4 2.061 N.S.
5 2.140 N.S. 20 2.073 N.S.
8 2.141 N.S. 9 2.077 N.S.
6 2.154 N.S. 3 2.087 0.025< P< 0.01
7 2.178 0.05< P< 0.1 X 2.102 N.S.
3 2.192 N.S. XY 2.138 N.S.
20 2.192 N.S. Y 2.173 N.S.
4 2.277 0.005< P< 0.01 2 2.179 N.S.
X 2.295 N.S. 18 2.253 N.S.
XY 2.353 0.025< P< 0.05 8 2.262 N.S.
Y 2.412 N.S. 6 2.476 0.01 <P<0.025
a N.S.= Values of d 2 not significantly different from the corresponding reference distribution (at 5% significance level)
subjects were higher than norma l (15 - -407%, mean 177%, cf. Goldwater and Hoover , 1967), but those of all controls were within the no rma l range, f i-Amino- levulinic acid in the ur ine in the exposed group ranged between 14,040 and 57,0507/1 (mean 26,341). Since the no rma l limit is 1,4007/1 and the ma x i mum allowable concen t ra t ion (MAC) 20,000 ~/1 (Lauwerys, 1972), here also a relatively high exposure level may be assumed (five subjects showed values higher than the MAC). On the other h a n d hemoglob in concentra t ions were normal ( m e a n = 14.6g%; range 13.5--15.6g%).
Chromosome Distribution Studies After Inorganic Lead Exposure 151
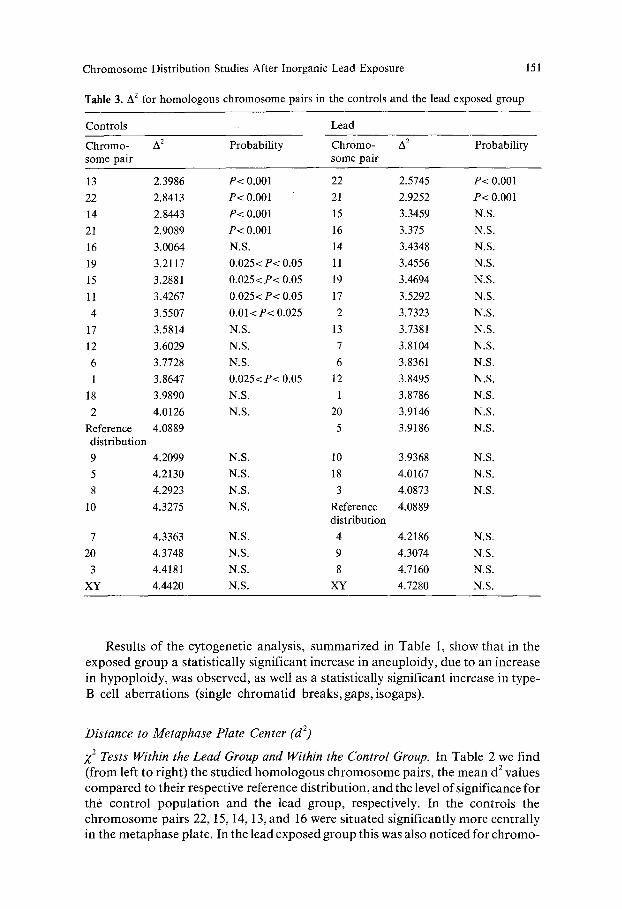
Table 3. A 2 for homologous chromosome pairs in the controls and the lead exposed group
Controls Lead
Chromo- 42 Probability Chromo- A z Probability some pair some pair
13 2.3986 P< 0.001 22 2.5745 P< 0.001
22 2.8413 P< 0.001 21 2.9252 P< 0.001
14 2.8443 P< 0.001 15 3.3459 N.S.
21 2.9089 P< 0.001 16 3.375 N.S.
16 3.0064 N.S. 14 3.4348 N.S.
19 3.2117 0.025< P< 0.05 11 3.4556 N.S.
15 3.2881 0.025< P< 0.05 19 3.4694 N.S.
11 3.4267 0.025< P< 0.05 17 3.5292 N.S.
4 3.5507 0.01<P< 0.025 2 3.7323 N.S.
17 3.5814 N.S. 13 3.7381 N.S.
12 3.6029 N.S. 7 3.8104 N.S.
6 3.7728 N.S. 6 3.8361 N.S.
1 3.8647 0.025< P< 0.05 12 3.8495 N.S.
18 3.9890 N.S. 1 3.8786 N.S.
2 4.0126 N.S. 20 3.9146 N.S.
Reference 4.0889 5 3.9186 N.S. distribution 9 4.2099 N.S. 10 3.9368 N.S.
5 4.2130 N.S. 18 4.0167 N.S.
8 4.2923 N.S. 3 4.0873 N.S.
10 4.3275 N.S. Reference 4.0889 distribution
7 4.3363 N.S. 4 4.2186 N.S.
20 4.3748 N.S. 9 4.3074 N.S.
3 4.4181 N.S. 8 4.7160 N.S.
XY 4.4420 N.S. XY 4.7280 N.S.
Results of the cytogenetic analysis, summarized in Table 1, show that in the exposed group a statistically significant increase in aneuploidy, due to an increase in hypoploidy, was observed, as well as a statistically significant increase in type- B cell aberrat ions (single chromat id breaks, gaps, isogaps).
Distance to Metaphase Plate Center (d 2)
X 2 Tests Within the Lead Group and Within the Control Group. In Table 2 we find (from left to right) the studied homologous chromosome pairs, the mean d 2 values compared to their respective reference dis tr ibut ion, and the level of significance for the control popu la t ion and the lead group, respectively. In the controls the chromosome pairs 22, 15, 14, 13, and 16 were situated significantly more centrally in the metaphase plate. In the lead exposed group this was also noticed for chromo-
152 L. Verschaeve et al.
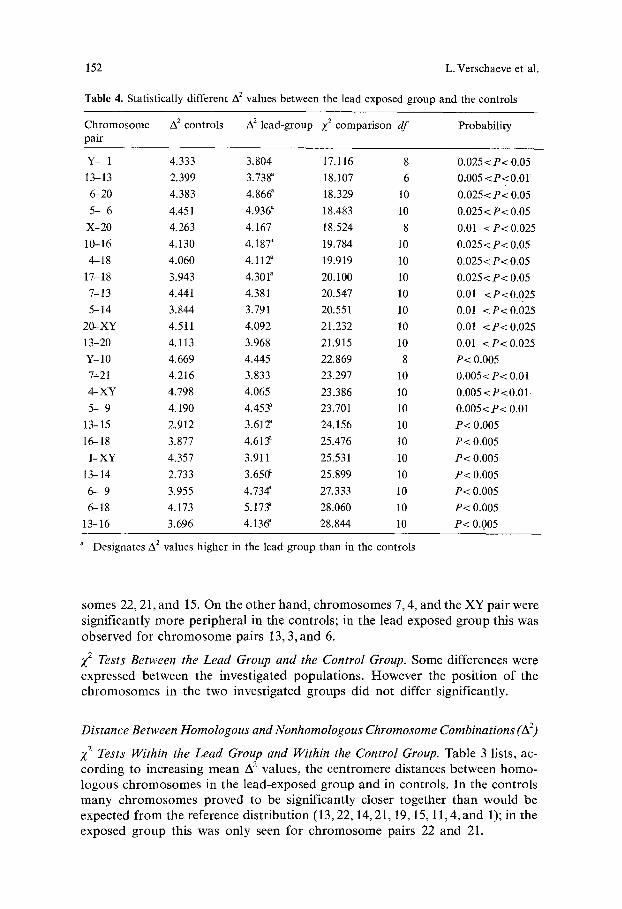
Table 4. Statistically different A 2 values between the lead exposed group and the controls
Chromosome A 2 controls A 2 lead-group X 2 comparison df Probability pair
Y- 1 4.333 3.804 17.116 8 0.025<P< 0.05
13-13 2.399 3.738 ~ 18.107 6 0.005 <P<O.01
6-20 4.383 4.86& 18.329 10 0.025<P< 0.05
5- 6 4.451 4.936 a 18.483 10 0.025<P< 0.05
X-20 4.263 4.167 18.524 8 0.01 <P< 0.025
10-16 4.130 4.187 ~ 19.784 10 0.025< P< 0.05
4-18 4.060 4.112" 19.919 10 0.025< P< 0.05
1%18 3.943 4.301" 20.100 10 0.025<P< 0.05
7-13 4.441 4.381 20.547 10 0.01 <P<0.025
5-14 3.844 3.791 20.551 10 0.01 <P< 0.025
20-XY 4.511 4.092 21.232 10 0.01 <P< 0.025
13-20 4.113 3.968 21.915 10 0.01 <P< 0.025
Y- 10 4.669 4.445 22.869 8 P< 0.005
7--21 4.216 3.833 23.297 10 0.005<P< 0.01
4-XY 4.798 4.065 23.386 10 0.005 <P<0.01.
5- 9 4.190 4.453" 23.701 10 0.005<P< 0.01
13-15 2.912 3.612" 24.156 10 P< 0.005
16-- 18 3.877 4.613" 25.476 10 P< 0.005
1-XY 4.357 3.911 25.531 10 P< 0.005
13-- 14 2.733 3.650 ~ 25.899 10 P< 0.005
6- 9 3.955 4.734 a 27.333 10 P< 0.005
6-18 4~ 173 5.173" 28.060 10 P< 0.005
13-- 16 3.696 4.136 ~ 28.844 10 P< 0..005
a Designates A 2 values higher in the lead group than in the controls
somes 22, 21, and 15. On the o ther hand, ch romosomes 7, 4, and the XY pair were
significantly more per iphera l in the controls ; in the lead exposed group this was
observed for c h r o m o s o m e pairs 13, 3, and 6.
Z 2 Tests Between the Lead Group and the Control Group. Some differences were
expressed between the invest igated popula t ions . H ow eve r the posi t ion o f the c h r o m o s o m e s in the two invest igated groups did not differ significantly.
Distance Between Homologous and Nonhomologous Chromosome Combinations (A 2)
Z 2 Tests Within the Lead Group and Within the Control Group. Table 3 lists, ac- cording to increasing mean A 2 values, the cen t romere distances between h o m o -
logous c h r o m o s o m e s in the lead-exposed group and in controls. In the controls many c h r o m o s o m e s p roved to be significantly closer together than would be
expected f rom the reference dis t r ibut ion (13, 22, 14, 21, 19, 15, 11,4, and 1); in the exposed group this was only seen for c h r o m o s o m e pairs 22 and 21.
Chromosome Distribution Studies After Inorganic Lead Exposure 153
%
40-
3 0
20
10
CONTROLS % LEAD GROUP
13 - 13 13 - 13 40
30-
20-
~ ~ V ~ , , , z x 2 , , 5 10 15 5 10 15
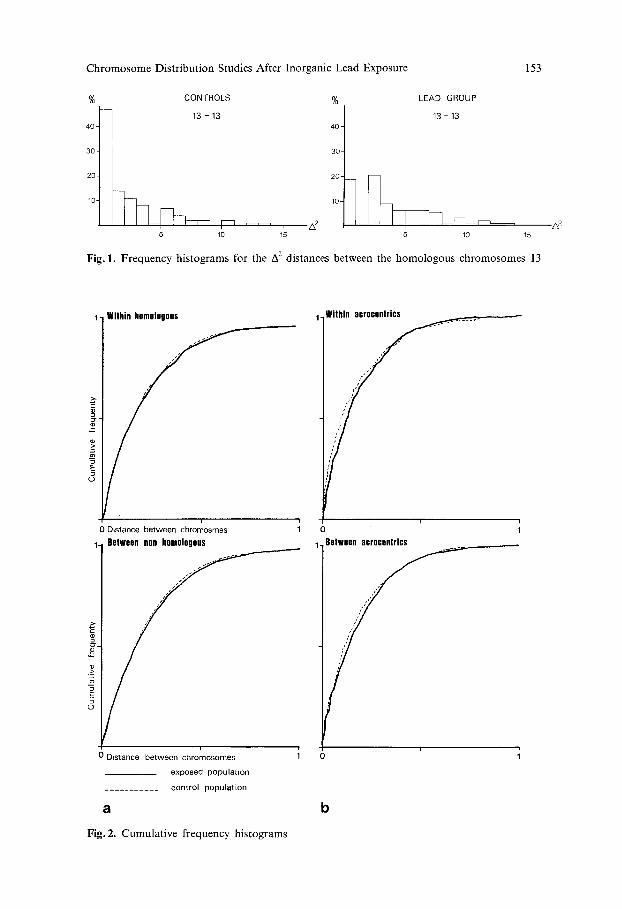
Fig. 1. Frequency histograms for the A 2 distances between the homologous chromosomes 13
1- Within acrocentrics 1- Within homologous
o r -
:>-
#-
E c_)
i / Distance be tween chromosmes 1
Between non homologous
O Distance b e t w e e n c h r o m o s o m e s
exposed p o p u l a t i o n
. . . . . . . . . . . c o n t r o l p o p u l a t i o n
a
Fig. 2. Cumulative frequency histograms
i
o 1- Between acrocentrics
b
154
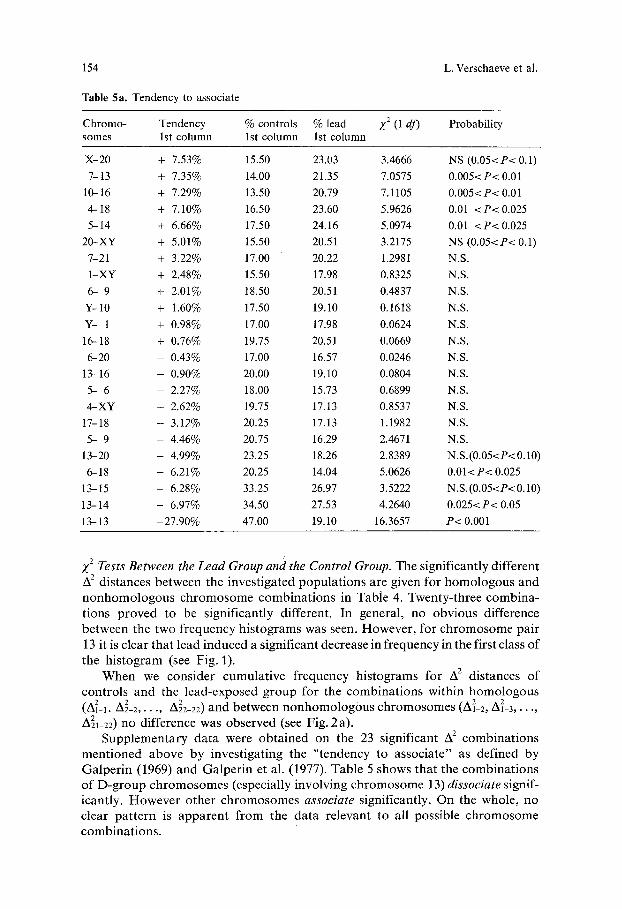
Table 5a. Tendency to associate
L. Verschaeve et al.
Chromo- Tendency % controls % lead Z 2 (1 df) Probability somes 1st column 1st column 1st column
X-20 + 7.53% 15.50 23.03 3.4666 NS (0.05<P< 0.1)
%13 + 7.35% 14.00 21.35 7 .0575 0.005<P< 0.01
10-16 + 7.29% 13.50 20.79 7 .1105 0.005<P< 0.01
4--18 + 7.10% 16.50 23.60 5.9626 0.01 <P< 0.025
5--14 + 6.66% 17.50 24.16 5.0974 0.01 <P<0.025
20-XY + 5.01% 15.50 20.51 3.2175 NS (0.05<P< 0.1)
%21 + 3.22% 17.00 20.22 1.2981 N.S.
1-XY + 2.48% 15.50 17.98 0.8325 N.S.
6- 9 + 2.01% 18.50 20.51 0.4837 N.S.
Y-10 + 1.60% 17.50 19.10 0.1618 N.S.
Y- 1 + 0.98% 17.00 17.98 0.0624 N.S.
16-18 + 0.76% 19.75 20.51 0.0669 N.S.
6-20 - 0.43% 17.00 16.57 0.0246 N.S.
13-16 - 0.90% 20.00 19.10 0.0804 N.S.
5- 6 - 2.27% 18.00 15.73 0.6899 N.S.
4--XY - 2.62% 19.75 17.13 0.8537 N.S.
1%18 - 3.12% 20.25 17.13 1.1982 N.S.
5- 9 - 4.46% 20.75 16.29 2.4671 N.S.
13-20 - 4.99% 23.25 18.26 2 .8389 N.S.(0.05<P< 0.10)
6-18 - 6.21% 20.25 14.04 5 .0626 0.01<P< 0.025
1 3-15 - 6.28% 33.25 26.97 3.5222 N.S. (0.05<P< 0.10)
1 3-14 - 6.97% 34.50 27.53 4.2640 0.025< P< 0.05
13-13 -27.90% 47.00 19.10 16.3657 P< 0.001
X 2 Tests Between the Lead Group and the Control Group. The significantly different A 2 distances between the investigated popula t ions are given for homologous and n o n h o m o l o g o u s chromosome combina t ions in Table 4. Twenty-three combina- t ions proved to be significantly different. In general, no obvious difference between the two frequency his tograms was seen. However, for chromosome pair 13 it is clear that lead induced a significant decrease in frequency in the first class of the his togram (see Fig. 1).
When we consider cumula t ive frequency histograms for A 2 distances of controls and the lead-exposed group for the combina t ions within homologous (A~-I, A 2 A 2 ., 2-2 . . . . . 22-22) and between nonhomolog0us chromosomes (A]_2, A~_3,.. A~1-22) no difference was observed (see Fig. 2a).
Supplementary data were ob ta ined on the 23 significant A 2 combina t ions ment ioned above by invest igat ing the " tendency to associate" as defined by Galper in (1969) and Galper in et al. (1977). Table 5 shows that the combina t ions of D-group chromosomes (especially involving chromosome 13) dissociate signif- icantly. However other chromosomes associate significantly. On the whole, no clear pa t te rn is apparen t f rom the data relevant to all possible chromosome combina t ions .
Chromosome Distribution Studies After Inorganic Lead Exposure
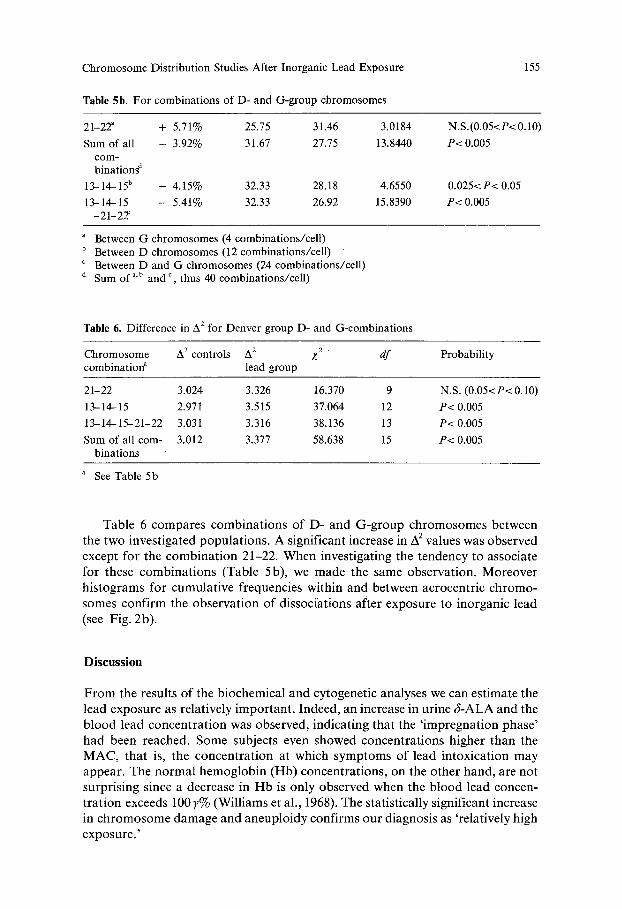
Table 5b. For combinations of D- and G-group chromosomes
155
21-22 ~ + 5.71% 25.75 31.46 3.0184
Sum of all - 3.92% 31.67 27.75 13.8440 c o m -
b i n a t i o n s d
13-14-15 b - 4.15% 32.33 28.18 4.6550
13-14-15 - 5.41% 32.33 26.92 15.8390 -21-22f
N.S. (0.05<P< 0.10)
P< 0.005
0.025< P< 0.05
P< 0.005
Between G chromosomes (4 combinations/cell) b Between D chromosomes (12 combinations/cell) c Between D and G chromosomes (24 combinations/cell) d Sum o f a'b and c, thus 40 combinations/cell)
Table 6. Difference in A 2 for Denver group D- and G-combinations
Chromosome A 2 controls A 2 Z 2 d f Probability combination a lead group
21-22 3.024 3.326 16.370 9 N.S. (0.05<P< 0.10)
13-14-15 2.971 3.515 37.064 12 P< 0.005
13--14-15--21-22 3.031 3.316 38.136 13 P< 0.005
Sum of all corn- 3.012 3.377 58.638 15 P< 0.005 binations
a See Table 5b
Table 6 compares combina t ions of D- and G-group chromosomes between the two investigated populat ions . A significant increase in A 2 values was observed except for the combina t ion 21-22. When investigating the tendency to associate for these combina t ions (Table 5b), we made the same observation. Moreover histograms for cumulat ive frequencies within and between acrocentric chromo- somes confirm the observat ion of dissociations after exposure to inorganic lead (see Fig. 2b).
Discussion
F r o m the results of the biochemical and cytogenetic analyses we can estimate the lead exposure as relatively impor tant . Indeed, an increase in urine c~-ALA and the b lood lead concent ra t ion was observed, indicat ing that the ' impregnat ion phase ' had been reached. Some subjects even showed concentra t ions higher than the MAC, that is, the concent ra t ion at which symptoms of lead intoxicat ion may appear. The norma l hemoglobin (Hb) concentrat ions , on the other hand, are not surprising since a decrease in Hb is only observed when the b lood lead concen- t ra t ion exceeds 100 7% (Williams et al., 1968). The statistically significant increase in chromosome damage and aneuplo idy confirms our diagnosis as 'relatively high exposure. '
156 L. Verschaeve et al.
Reviewing the results of the chromosome distribution studies, we observe that: (1) centromere--metaphase center distances (d 2) do not significantly differ between the controls and the lead-exposed group. (2) There are approximately as many associations as dissociations in the lead group vs the controls for the 23 significantly different centromere distances (A 2, cf. Table 4). This was confirmed by the analysis of the association tendency (Table 5 a) and may explain why no difference is seen between the cumulative frequency histograms of both popula- tions (see Fig. 2a). (3) Generally we observed dissociation of acrocentric chromo- somes for combinations of the D- and G-group chromosomes (Tables 5 b and 6). A dissociation is also obvious in the cumulative frequencies of acrocentric chromosomes (see Fig. 2b). These observations will now be discussed.
1) Although no significant difference is seen in d 2 between the controls and the lead group, chromosome 13 shifted from a significant central position in the controls to a significant peripheral position in the lead group. Lack of significant differences between controls and the lead group does however not allow further considerations in this respect.
2) Before considering the A 2 distances, we have to remark on the statistical inter- pretation of the results. Indeed, using a 5% significance level, we obtained, from 276 different Z 2 tests, 23 statistically significant A 2 distances between the two investigated populations. However, the 5% level will give approximately 14 or 15 significant differences that are not biologically meaningfull. Indeed, few really obvious differences are seen. Only the distance between the homologous chromo- somes 13 is obvious (see Fig. 1).
If a possible interaction of lead with the spindle apparatus is accepted as a working hypothesis, one would expect to find, certainly at an appreciable exposure level, a relatively thorough alteration of the chromosome distribution. Some differences were indeed found, but not at the expected level. Absence of a clear 'alteration pattern' in the chromosome distribution (for instance approx, as many associations as dissociations) suggests a nonspecific action of lead on the spindle apparatus. No very striking alterations (except the 13-13 distance and related distances such as 13-14 and 13-15, which will be considered later) probably means that the first target of lead is not the spindle.
3) In the chromosome distribution of the 'normal' population, a specific as- sociation of acrocentric chromosomes is observed (Cooke, 1972; Hens et al., 1975; Galperin et al., 1977; and others). This association is thought to be due to the presence of rDNA connectives associated with rRNA and acid proteins related to the nucleolus organizing regions (NOR's). When considering these chromosomes alone, we observed in the lead-exposed population an obvious dissociation of intercentromeric distances. This is clear from analysis of the distances between two chromosome pairs or between combinations of acrocentrics (except as- sociation for the 21-22 distance) and from analysis of the cumulative frequencies (Fig. 2b). The major contribution to the observed dissociation is undoubtedly from chromosome 13 or, more generally, from combinations of D-group chromosome distances.
This remarkable action on at least some acrocentrics may suggest a possible effect of lead on factors regulating nucleolus organization (indirect action by enzymatic modifications). Through this action the nucleolus organizing activity
Chromosome Distribution Studies After Inorganic Lead Exposure 157
may be diminished so that less r D N A , rRNA, and protein connectives would hold the chromosomes firmly together, resulting in less associations. In this respect we may suggest that lead and mercury have a similar action, a l though it is p robably less impor tant for lead. Indeed the lead-exposure level was relatively high, but cumulative frequencies were not statistically significant. On the other hand mercury exposure was considered only low and here cumulative frequencies were significant (not published).
In evaluating the possible mechanism by which lead may be mutagenic, we still have to consider that our s tandard cytogenetic analysis demonst ra ted a statistically significant increase in chromat id- type aberrations, aneuploidy, and hypoploidy. At the given exposure level, evaluated as relatively important , no clear-cut general alteration in the ch romosome distribution could be observed.
We therefore believe that the main target of inorganic lead is not the spindle appara tus but the chromosomes. The latter as target is in agree- ment with the observed increase in chromatid- type aberrations, but might be in dissacord with the observed increase in aneuploidy and hypoploidy. Al though aneuploidy may be due to other factors than non-disjunction, e.g. cell membrane fragility, the aneuploidy increase remain indeed difficult to explain and may be considered as a warning against hasty conclusions. For that reason we believe that our results point, not without caution, to a pr imary action of lead on the chromosomes followed by a less important action on the nucleolar organization. In contrast to mercury, a direct (or indirect) action on the spindle apparatus is less evident.
References
Barton, D. E., David, F. M., Merrington, M.: The relative positions of the chromosomes in the human cell mitosis. Ann. Hum. Genet. 28, 123--128 (1965)
Buckton, K. E., Jacobs, P. A., Court Brown, W. M., Dall, R., Goldstein, H.: A study, of the chromosome damage persisting after X-ray therapy for ankylosing spondylitis. Lancet 1962 II, 676--682
Cook, P.: Patterns of secondary association between the acrocentric autosomes of man. Chromo- soma 36, 221--240 (1972)
Galperin, H.: Relative position of homologous chromosomes or groups in male and female metaphase figures. Humangenetik 7, 265--274 (1969)
Galperin-LemaTtre, H., Hens, L., Kirsch-Volders, M., Susanne, C.: Nonrandom association of trypsin-banded human acrocentric chromosomes. Hum. Genet. 35, 261--268 (1977)
Goldwater, L. J., Hoover, A. W.: An international study of "normal" levels of lead in blood and urine. Arch. Environ. Health 15, 60--63 (1967)
Hens, L., Kirsch-Volders, M., Susanne, C., Galperin-Lema]tre, H.: Relative position of trypsin banded homologous chromosomes in human (Q) metaphase figures. Humangenetik 28, 303--311 (1975)
Hens, L.: Chromosome distribution in a23 chinese hamster fibroblasts. Chromosoma 57, 205-- 217 (1976)
Hoo, J. J., Cramer, H.: On the position of chromosomes in prepared mitosis figures of human fibroblasts. Humangenetik 13, 166--170 (1971)
Kirsch-Volders, M., Hens, L., Susanne, C., Galperin-Lema~tre, H.: Stability of centromere- center distances in normal human metaphases. Cytogenet. Cell Genet. 18, 61--74 (1977)
Klinger, H. P.: Rapid processing of primary embryonic tissues for chromosome banding pattern analysis. Cytogenetics 11, 424--435 (1972)

158 L. Verschaeve et al.
Lauwerys, R.: Pr6cis de toxicologie industrielle et des intoxications professionnelles. Duculot, Gembloux (1972)
Vallee, B. L., Ulmer, D. D.: Biochemical effects of mercury, cadmium and lead. Ann. Rev. Biochem. 41, 91--128 (1972)
Verschaeve, L., Kitsch-Voiders, M., Hens, L., Susanne, C.: Chromosome distribution studies in phenyl-mercury-acetate exposed subjects and in age related controls. Mutation Res. 57, 335--347 (1978)
Warburton, D., Naylor, A. F., Warburton, F. E.: Spatial relations of human chromosomes identified by quinacrine fluorescence at aphase. I. Mean interchromosomal distances and distances from the cell centre. Humangenetik 18, 297--306 (1973)
Williams, M. K., King, E., Walford, J.: Method for estimating objectively the comparative merits of biological tests of lead exposure. Brit. Med. J. 19681, 618--621
Received November 25, 1978