Determining individual chromosome missegregation rates and ...
299
Determining individual chromosome missegregation rates and the responses to aneuploidy in human cells Joseph Thomas Worrall A thesis submitted in partial fulfilment of the requirements for the degree of Doctor of Philosophy August 2017
-
Upload
khangminh22 -
Category
Documents
-
view
0 -
download
0
Transcript of Determining individual chromosome missegregation rates and ...

Determining individual chromosome
missegregation rates and the
responses to aneuploidy in human
cells
Joseph Thomas Worrall
A thesis submitted in partial fulfilment of the
requirements for the degree of Doctor of Philosophy
August 2017

2
Statement of originality
I, Joseph Thomas Worrall, confirm that the research included within this thesis is my
own work or that where it has been carried out in collaboration with, or supported by
others, that this is duly acknowledged below and my contribution indicated.
Previously published material is also acknowledged below.
I attest that I have exercised reasonable care to ensure that the work is original, and
does not to the best of my knowledge break any UK law, infringe any third party’s
copyright or other Intellectual Property Right, or contain any confidential material.
I accept that the College has the right to use plagiarism detection software to check
the electronic version of the thesis.
I confirm that this thesis has not been previously submitted for the award of a degree
by this or any other university.
The copyright of this thesis rests with the author and no quotation from it or
information derived from it may be published without the prior written consent of the
author.
Signature:
Date: 21st August 2017
3
Publications during PhD enrolment
1. Phillips M*, Khadeir R* , Worrall JT, Sharpe K, Yuan M, Tookman L, Steele
J, Lemoine N, Frezza C, Cutts R, Chelala C, Bomalaski J, Sheaff M, Ghazaly E,
Szlosarek P. (2017). Macrophages mediate resistance to ADI-PEG20 in
Mesothelioma. Cancer Discovery. In Review.
2. Quétier I, Marshall JJ, Spencer-Dene B, Lachmann S, Casamassima
A, Franco C, Escuin S, Worrall JT, Baskaran P, Rajeeve V, Howell M, Copp
AJ, Stamp G, Rosewell I, Cutillas P, Gerhardt H, Parker PJ, Cameron AJ. (2016).
Knockout of the PKN family of Rho effector kinases reveals a non-redundant role for
PKN2 in developmental mesoderm expansion. Cell Reports. 14(3):440-8.
3. Campbell GR, Worrall JT, Mahad DJ. (2014). The central role of
mitochondria in axonal degeneration in multiple sclerosis. Multiple Sclerosis
Journal. 20(14) 1806-13.
Conference abstracts: selected oral presentation
1. Worrall JT and McClelland SE (2016). Determining the missegregation rates
of individual human chromosomes. Molecular Biology of the Cell. vol. 27. American
Society for Cell Biology annual meeting, San Francisco, USA, December 2016.
2. Worrall JT and McClelland SE (2016). Determining the missegregation rates
of individual human chromosomes. Cytogenetics and genome research. vol. 148,
131-131. 21st International Chromosome conference, Foz do Iguaçu, Brazil, July
2016. Runner up: Best Student Oral Presentation Award.
Collaborations
1. Single-cell sequencing analysis and RPE-1/DLD1 cells harbouring mutant
CENP-A alleles were a generous collaboration with the Fachinetti laboratory,
Institut Curie, Paris, France.
2. Figures in chapter 6, and data in chapter 7.1, were generated in collaboration
with Dr. Sarah McClelland, Barts Cancer Institute, London, UK.
* Equally contributing authors
4
Abstract
Background.
Genomic instability and aneuploidy, which are ubiquitous hallmarks of cancer cells,
encompass both structural and numerical chromosome aberrations. Strikingly,
cancer cells often display recurrent patterns of aneuploidy which are thought to be
contingent on selection pressures within the tumour microenvironment maintaining
advantageous karyotypes. However, it is currently unknown if individual
chromosomes are intrinsically vulnerable to missegregation, and therefore whether
chromosome bias may also contribute to pathological aneuploidy patterns.
Moreover, the earliest responses to chromosome missegregation in non-
transformed cells, and how these are overcome in cancer, has remained elusive due
to the difficult nature of isolating nascent aneuploid cells.
Results.
Individual chromosomes displayed recurrent patterns of biased missegregation in
response to a variety of cellular stresses across cell lines. Likewise, a small subset
of chromosomes accounted for a large fraction of segregation errors following one
specific mechanism driving aneuploidy. This was supported by the discovery that
chromosomes 1 and 2 are strikingly susceptible to the premature loss of sister
chromatid cohesion during prolonged prometaphase arrest. Additionally, I have
elucidated the arrangement of individual metaphase human chromosomes,
highlighting missegregation vulnerabilities occurring at the metaphase plate
periphery following nocodazole wash-out. Finally, I have developed a novel system
for isolating nascent aneuploid cells, suggesting the earliest transcriptome
responses to chromosome missegregation in non-transformed human cells involve
ATM and BCL2-mediated apoptosis.

5
Acknowledgements
I am grateful to the Medical Research Council for providing the generous funding
for this research and Barts Cancer Institute for the provision of excellent facilities.
I would first like to thank Dr. Sarah McClelland for providing unparalleled support,
supervision and opportunities throughout this PhD. Sincere thanks is extended to
the members of the McClelland lab for frequent sanity-checks, encouragement and
experimental teachings. Additionally, I cannot express enough gratitude and
appreciation to everyone in the “kindergarten” PhD office for providing the backbone
to my most joyous times and memories from BCI – no matter how cramped the desk
space.
This PhD would have been an insurmountable academic and personal endeavour,
had it not have been for the unwavering support of my family and friends, to whom I
dedicate this thesis.
6
Table of contents
ABSTRACT ....................................................................................................................................... 4
TABLE OF CONTENTS ...................................................................................................................... 6
LIST OF FIGURES ........................................................................................................................... 10
LIST OF TABLES ............................................................................................................................. 12
LIST OF ABBREVIATIONS ............................................................................................................... 13
1. INTRODUCTION ........................................................................................................................ 18
1.1. CHROMOSOMES .......................................................................................................................... 21 1.1.1. Chromosome structure and function ............................................................................... 21
1.1.1.1. Chromatin architecture and remodelling ................................................................................. 22 1.1.1.2. Centromeres ............................................................................................................................. 24 1.1.1.3. Telomeres ................................................................................................................................. 27
1.1.2. The nuclear organisation of chromosomes ...................................................................... 29 1.1.2.1. Radial chromosome positioning ............................................................................................... 29 1.1.2.3. Chromatin domains .................................................................................................................. 32 1.1.2.4. Nuclear membrane-associated chromatin ............................................................................... 32
1.1.3. Mitotic chromosome assembly ........................................................................................ 35 1.1.3.1. The structure and composition of SMC complexes .................................................................. 35 1.1.3.2. Condensins ............................................................................................................................... 36 1.1.3.3. Sister chromatid cohesion ........................................................................................................ 37
1.2. MECHANISMS DRIVING ANEUPLOIDY ............................................................................................... 40 1.2.1. DNA damage .................................................................................................................... 40
1.2.1.1. DNA damage repair .................................................................................................................. 40 1.2.1.2. Cell cycle checkpoints ............................................................................................................... 44
1.2.2. Replication stress ............................................................................................................. 49 1.2.2.1. Replication-transcription collisions .......................................................................................... 49 1.2.2.2. Restarting at collapsed forks .................................................................................................... 50 1.2.2.3. Replication stress in cancer ...................................................................................................... 51
1.2.3. The spindle assembly checkpoint ..................................................................................... 52 1.2.4. Chromosome cohesion abnormalities .............................................................................. 53
1.3. CELLULAR CONSEQUENCES OF ANEUPLOIDY ....................................................................................... 54 1.3.1. Cell fitness and cell cycle changes .................................................................................... 54 1.3.2. Genome stability .............................................................................................................. 55 1.3.3. Transcriptional and proteomic reprogramming............................................................... 56 1.3.4. Aneuploidy tolerance ....................................................................................................... 58
1.4. THE ANEUPLOIDY-CIN RELATIONSHIP IN CANCER ............................................................................... 60 1.4.1. Promoting tumourigenesis ............................................................................................... 60 1.4.2. Inhibiting tumourigenesis ................................................................................................ 62 1.4.3. Aneuploidy as a therapeutic target .................................................................................. 63
1.5. METHODS FOR DETECTING ANEUPLOIDY ........................................................................................... 65 1.5.1. Comparative genomic hybridisation ................................................................................ 65 1.5.3. Single-cell sequencing ...................................................................................................... 66 1.5.4. Flow cytometry................................................................................................................. 67 1.5.5. Fluorescence in situ hybridisation .................................................................................... 71
2. AIMS AND OBJECTIVES ............................................................................................................. 73
3. MATERIALS AND METHODS ...................................................................................................... 74
3.1. TISSUE CULTURE ASSAYS ............................................................................................................... 75 3.1.1. Reagents and cell culture ................................................................................................. 75
7
3.1.2. Plasmid transfections ....................................................................................................... 77 3.1.3. Small-molecule perturbation of the cell cycle .................................................................. 77 3.1.4. Colony formation assay .................................................................................................... 78
3.2. FLUORESCENCE MICROSCOPY ......................................................................................................... 79 3.2.1. Live-cell imaging .............................................................................................................. 79 3.2.2. Immunofluorescence ........................................................................................................ 79
3.3. CONSTRUCTION OF A MAMMALIAN DSEGFP EXPRESSION VECTOR ........................................................ 81 3.3.1. Amplification of pEGFP-C1 vector .................................................................................... 81 3.3.2. Cloning the dsEGFP gene into the pEGFP-C1 vector ......................................................... 83
3.4. FLUORESCENCE IN SITU HYBRIDISATION ............................................................................................ 85 3.4.1. Traditional fluorescence in situ hybridisation .................................................................. 85 3.4.2. Fluorescence in situ hybridisation in-suspension ............................................................. 86 3.4.3. Mitosis fluorescence in situ hybridisation ........................................................................ 87
3.4.3.1. Anaphase fluorescence in situ hybridisation ............................................................................ 87 3.4.3.2. Late prometaphase fluorescence in situ hybridisation ............................................................. 87
3.5. FLOW AND IMAGE CYTOMETRY ...................................................................................................... 89 3.5.1. Fluorescence-activated cell sorting .................................................................................. 89 3.5.2. Cell cycle analysis ............................................................................................................. 89 3.5.3. Apoptosis.......................................................................................................................... 90 3.5.4. Image cytometry analysis ................................................................................................ 91
3.6. DNA ANALYSIS ............................................................................................................................ 94 3.6.1. Genomic DNA extraction .................................................................................................. 94 3.6.2. Southern blot .................................................................................................................... 94 3.6.3. Polymerase chain reaction and probe labelling ............................................................... 96
3.6.3.1. Generating fluorescently-labelled dsEGFP probes ................................................................... 96 3.6.3.2. Generating digoxygenin-labelled dsEGFP probes ..................................................................... 97
3.6.4. Single-nucleotide polymorphism array ............................................................................ 97 3.6.5. Metaphase spreads .......................................................................................................... 99 3.6.6. Single-cell sequencing ...................................................................................................... 99
3.7. TRANSCRIPTOME ANALYSIS ......................................................................................................... 100 3.7.1. RNA extraction ............................................................................................................... 100 3.7.2. Determination of dsEGFP insertion frequency ............................................................... 100 3.7.3. Transcriptome responses to monosomy 6 ..................................................................... 101
3.8. MATHEMATICAL PROOFS ............................................................................................................. 102 3.8.1. Chromatid geometry ...................................................................................................... 102
3.9. STATISTICS ................................................................................................................................ 104
4. DEVELOPING A NOVEL SYSTEM TO ISOLATE NASCENT ANEUPLOID CELLS ............................... 105
4.1. OPTIMISING A DRUG-INDUCED CHROMOSOME MISSEGREGATION STRATEGY ......................................... 106 4.1.1. The rate of micronuclei formation ................................................................................. 108 4.1.2. DNA damage in nocodazole-arrested cells .................................................................... 111 4.1.3. Centromere signal in the micronucleus .......................................................................... 112 4.1.4. p21 and p53 nuclear stabilisation following chromosome missegregation ................... 114
4.2. GENERATING RPE-1-HTERT CELLS EXPRESSING DSEGFP ................................................................. 117 4.2.1. Construction of a mammalian expression vector harbouring dsEGFP ........................... 117 4.2.2. Inserting the dsEGFP gene into RPE-1 cells .................................................................... 119 4.2.3. Determining the half-life of dsEGFP in RPE-1 cells ......................................................... 121 4.2.4. Sorting RPE-1-4 cells by flow cytometry ......................................................................... 123
4.3. DSEGFP IS EXPRESSED FROM A SINGLE CHROMOSOME IN RPE-1-4F CELLS .......................................... 125 4.3.1. Enumerating dsEGFP integration frequency by FISH ..................................................... 125
4.4. SUMMARY ................................................................................................................................ 127
5. ISOLATION AND CHARACTERISATION OF MONOSOMIC HUMAN CELLS .................................. 128
8
5.1. ISOLATION OF ANEUPLOID CELLS BY FLUORESCENCE-ACTIVATED CELL SORTING ...................................... 129 5.2. DETERMINING THE IDENTITY OF THE REPORTER CHROMOSOME .......................................................... 132
5.2.1. SNP array ....................................................................................................................... 132 5.2.1.1. HCT116 SNP array ................................................................................................................... 132 5.2.1.1. RPE-1 SNP array ...................................................................................................................... 135
5.2.2. Transcriptome analysis .................................................................................................. 137 5.2.3. FISH analysis of chromosome 6 in EGFP-negative and positive cells ............................. 140
5.3. CHARACTERISATION OF ANEUPLOID CELLS ....................................................................................... 142 5.3.1. Cell cycle arrest and apoptosis ....................................................................................... 142 5.3.2. Transcriptome analysis of the early responses to aneuploidy ....................................... 145
5.3.2.1. Cell cycle regulators ................................................................................................................ 145 5.3.2.2. G1/S checkpoint down-regulation .......................................................................................... 147 5.3.2.3. DNA damage response and apoptosis .................................................................................... 149
5.4. SUMMARY ................................................................................................................................ 151
6. THE MISSEGREGATION RATES OF INDIVIDUAL CHROMOSOMES ............................................. 152
6.1. AN IMAGE CYTOMETRY-BASED APPROACH TO DETECT ANEUPLOIDY ..................................................... 154 6.1.1. Optimising aneuploidy detection by the ImageStreamX ................................................ 155 6.1.2. An assessment of aneuploidy detection by the ImageStreamX ...................................... 157
6.2. ANEUPLOIDY RATES FOLLOWING NOCODAZOLE WASH-OUT ................................................................ 160 6.2.1. RPE-1 aneuploidy rates following nocodazole wash-out ............................................... 161 6.2.2. RPE-1 aneuploidy rates: single-cell sequencing validation ............................................ 164 6.2.3. BJ aneuploidy rates following nocodazole wash-out ..................................................... 167 6.2.4. HCT116 aneuploidy rates following nocodazole wash-out ............................................ 170 6.2.5. RPE-1 12/3 aneuploidy rates following nocodazole wash-out ....................................... 173
6.3. ANEUPLOIDY RATES FOLLOWING DNA REPLICATION STRESS .............................................................. 176 6.3.1. RPE-1 aneuploidy rates following DNA replication stress .............................................. 177 6.3.2. BJ aneuploidy rates following DNA replication stress .................................................... 179 6.3.3. HCT116 aneuploidy rates following DNA replication stress ........................................... 182 6.3.4. RPE-1 12/3 aneuploidy rates following DNA replication stress ...................................... 185
6.4. ANEUPLOIDY RATES FOLLOWING CENTROMERE PROTEIN A DEPLETION ................................................. 188 6.4.1. An inducible CENP-A depletion system .......................................................................... 189 6.4.2. RPE-1 aneuploidy rates following CENP-A depletion ..................................................... 191 6.4.3. DLD1 aneuploidy rates following CENP-A depletion ...................................................... 193
6.5. SUMMARY ................................................................................................................................ 195
7. VISUALISING INDIVIDUAL CHROMOSOME DYNAMICS DURING MITOSIS ................................ 196
7.1. INDIVIDUAL CHROMOSOME SEGREGATION BEHAVIOUR AT ANAPHASE ................................................. 197 7.1.1. RPE-1 individual chromosome segregation error rates .................................................. 198
7.2. METAPHASE CHROMOSOME TERRITORIES ....................................................................................... 202 7.2.1. The geometry of metaphase chromosomes ................................................................... 203 7.2.2. RPE-1 metaphase chromosome geometry ..................................................................... 206
7.2.2.1. Radial metaphase chromosome positioning .......................................................................... 206 7.2.2.2. Inter-homologue distance ...................................................................................................... 208 7.2.2.3. Inter-centromere distance ..................................................................................................... 209 7.2.2.4. Inter-centromere angle .......................................................................................................... 212
7.2.3. BJ metaphase chromosome geometry ........................................................................... 214 7.2.3.1. Radial metaphase chromosome positioning .......................................................................... 214 7.2.3.2. Inter-homologue distance ...................................................................................................... 217 7.2.3.3. Inter-centromere distance ..................................................................................................... 217 7.2.3.4. Inter-centromere angle .......................................................................................................... 219
7.2.4. RPE-1 metaphase chromosome geometry post-nocodazole .......................................... 221 7.2.4.1. Radial metaphase chromosome positioning .......................................................................... 221 7.2.4.2. Inter-homologue distance ...................................................................................................... 224
9
7.2.4.3. Inter-centromere distance ..................................................................................................... 224 7.2.4.4. Inter-centromere angle .......................................................................................................... 226
7.3. SUMMARY ................................................................................................................................ 228
8. DISCUSSION ............................................................................................................................ 230
8.1. OVERVIEW ............................................................................................................................... 231 8.5. CONCLUSIONS AND MODELS ........................................................................................................ 242
9. REFERENCES ............................................................................................................................ 244
10. APPENDIX ............................................................................................................................. 292
10.1. MACROS AND PROGRAMMING SCRIPTS ........................................................................................ 293 10.1.1. Fluorescence intensity within the nucleus – ImageJ macro ......................................... 293 10.1.2. Metaphase plate positioning – ImageJ macro ............................................................. 295 10.1.3. Metaphase plate positioning – R script ........................................................................ 297 10.1.4. Sister chromatid angle rose plot – R script ................................................................... 297 10.1.5. Inter-homologue distance – R script ............................................................................ 297 10.1.6. Chromatid geometry – Microsoft Excel function macro .............................................. 298
10.1.6.1. Cell definitions ...................................................................................................................... 298 10.1.6.2. Cell functions ........................................................................................................................ 299
10
List of figures
Figure 1.0 Spectral karyotyping of aneuploid cells
Figure 1.1 The structure and function of the centromere.
Figure 1.2 The radial positioning of chromosomes.
Figure 1.3 Cell cycle checkpoints and regulation.
Figure 1.4 DNA analysis by flow cytometry.
Figure 3.1 Diagrammatic representation of the pEGFP-C1 plasmid.
Figure 3.2 Diagrammatic representation of the dsEGFP-C1 plasmid.
Figure 4.1 Experimental strategy for isolating aneuploid cells using FACS.
Figure 4.2 Micronuclei formation rates following nocodazole wash-out.
Figure 4.3 Prometaphase DNA damage and micronuclei characterisation
following nocodazole wash-out.
Figure 4.4 p21 and p53 nuclear stabilisation following nocodazole wash-out.
Figure 4.5 Generating a destabilised EGFP expression cassette.
Figure 4.6 Proteasome inhibition in RPE-1 clones.
Figure 4.7 Characterising the half-life of dsEGFP in RPE-1-4.
Figure 4.8 Sorting a pure population dsEGFP-expressing RPE-1-4 cells.
Figure 4.9 The dsEGFP gene integrated into a single chromosome in RPE-1-4F
cells.
Figure 5.1 The loss of dsEGFP fluorescence following nocodazole wash-out.
Figure 5.2 HCT116 and HCT116+3 single nucleotide polymorphism array.
Figure 5.3 RPE-1 single nucleotide polymorphism array.
Figure 5.4 RPE-1-4F transcriptome analysis.
Figure 5.5 Fluorescence in situ hybridisation of cells RPE-1-4F cells sorted by
flow cytometry.
11
Figure 5.6 The early responses to aneuploidy in RPE-1 cells post-nocodazole
wash-out.
Figure 5.7 Transcriptome analysis of cell cycle proteins in EGFP-negative RPE-
1-4F cells.
Figure 5.8 Transcriptome analysis of DNA damage-related proteins in EGFP-
negative RPE-1-4F cells.
Figure 5.9 Transcriptome analysis of apoptotic signalling networks in EGFP-
negative RPE-1-4F cells.
Figure 6.1 Aneuploidy can be accurately detected by image cytometry.
Figure 6.2 RPE-1 aneuploidy rates following nocodazole wash-out.
Figure 6.3 RPE-1 single cell sequencing following nocodazole wash-out.
Figure 6.4 BJ aneuploidy rates following nocodazole wash-out.
Figure 6.5 HCT116 aneuploidy rates following nocodazole wash-out.
Figure 6.6 RPE-1 12/3 aneuploidy rates following nocodazole wash-out.
Figure 6.7 RPE-1 aneuploidy rates following DNA replication stress.
Figure 6.8 BJ aneuploidy rates following DNA replication stress.
Figure 6.9 HCT116 aneuploidy rates following replication stress.
Figure 6.10 RPE-1 12/3 aneuploidy rates following DNA replication stress.
Figure 6.11 An inducible CENP-A degradation system.
Figure 6.12 RPE-1 aneuploidy rates following CENP-A depletion.
Figure 6.13 DLD1 aneuploidy rates following CENP-A depletion.
Figure 7.1 Characterising RPE-1 segregation errors following nocodazole wash-
out.
Figure 7.2 The geometry of metaphase chromosomes.
Figure 7.3 The radial positioning of metaphase chromosomes in RPE-1 cells.
Figure 7.4 The separation of sister chromatids and homologous chromosomes
in RPE-1 cells.
Figure 7.5 The rotation of sister chromatids at metaphase in RPE-1 cells.
12
Figure 7.6 The radial positioning of metaphase chromosomes in BJ cells.
Figure 7.7 The separation of sister chromatids and homologous chromosomes
in BJ cells.
Figure 7.8 The rotation of sister chromatids at metaphase in BJ cells.
Figure 7.9 The relative position of metaphase chromosomes post-nocodazole
wash-out in RPE-1 cells.
Figure 7.10 The separation of sister chromatids and homologous chromosomes
in RPE-1 cells post-nocodazole wash-out.
Figure 7.11 The rotation of sister chromatids at metaphase in RPE-1 cells post-
nocodazole wash-out.
Figure 7.12 Chromosome missegregation and positioning summary.
Figure 8.1 Models for aneuploidy mechanisms and responses in human cells.
List of tables
Table 3.1. A panel of transformed and non-transformed human cell lines.
Table 3.2. Polymerase chain reaction primers and thermocycling.
Table 8.1 Significantly elevated aneuploidies display recurrent biases
13
List of abbreviations
2D two-dimensional
3D three-dimensional
A adenine
aCGH array-based comparative genomic hybridisation
APC/C anaphase-promoting complex/cyclosome
AML acute myeloid leukaemia
ANOVA analysis of variance
ATM ataxia-telangiectasia mutated
ATP adenosine triphosphate
bp base pair
BSA bovine serum albumin
C cytosine
CO2 carbon dioxide
CDK cyclin-dependent kinase
CENP-A centromere-associated protein A
CENP-B centromere-associated protein B
CENP-C centromere-associated protein C
CENP-E centromere-associated protein E
CEP centromere enumeration probe
CIN chromosomal instability
CLIP chromosome linkage inner nuclear membrane
CNA copy number alteration
CRC colorectal cancer
DAM deoxyadenosine methyl
DAPI 4’,6-diamidino-2-phenylindole, dihydrochloride
14
dATP deoxyadenine triphosphate
DDK Drf1-dependent kinase
DCC dosage compensation complex
dCTP deoxycytosine triphosphate
dGTP deoxyguanine triphosphate
DIG digoxygenin
DMSO dimethyl sulfoxide
DNA deoxyribonucleic acid
DNMT deoxyribonucleic acid methyltransferase
dNTP deoxynucleotide triphosphate
dTTP deoxythymine triphosphate
DSB double-strand break
dsDNA double-stranded deoxyribose nucleic acid
dsEGFP destabilised enhanced green fluorescent protein
EDF extended depth of field
EDTA ethylenediaminetetraacetic acid
EGFP enhanced green fluorescent protein
FACS fluorescence-activated cell sorting
FBS foetal bovine serum
FISH fluorescence in situ hybridisation
FISH-IS fluorescence in situ hybridisation in suspension
G Giemsa
G guanine
G0 gap 0 phase
G1 gap 1 phase
G2 gap 2 phase
GFP green fluorescent protein
H2O water
15
H2A histone protein 2A
H2B histone protein 2B
H3 histone protein family H3
H3K4me2 histone H3 dimethyl lysine-4
H3K4me3 histone H3 trimethyl lysine-4
H4 histone protein family H4
HDAC histone deacetylase
HR homologous recombination
INM inner nuclear membrane
ISWI imitation switch
Kb kilobase
Kbp kilobase pair
KT kinetochore
LB Luria-Bertani
LOR late origin of replication
M mitosis
Mb megabase
Mbp megabase pair
MAP mitogen-activated protein
MCC mitotic check-point complex
mRNA messenger ribose nucleic acid
nm nano meters
NEB nuclear envelope break-down
NER nucleotide excision repair
NDR nucleosome-depleted region
NHEJ non-homologous end joining
NPC nuclear pore complex
NPS nucleosome positioning sequence
16
OD optical density
ORI origin of replication
PBS phosphate-buffered saline
PCR polymerase chain reaction
PFA paraformaldehyde
PLK polo-like kinase
PS phosphatidyl serine
PSCS premature sister chromatid separation
R replication
RC replication complex
rDNA ribosomal deoxyribose nucleic acid
RFP red fluorescent protein
RMA repeated measure assistance
RMS root mean squared
RNA ribonucleic acid
RNAi ribonucleic acid interference
ROS reactive oxygen species
rpm revolutions per minute
rSAP recombinant shrimp alkaline phosphatase
S-phase synthesis phase
siRNA small-interfering ribose nucleic acid
SNF sucrose non-fermentable
SNP single nucleotide polymorphism
ssDNA single-stranded deoxyribose nucleic acid
SMC structural maintenance of chromosomes
SSC saline sodium citrate
STBR spot-to-background ratio
SUMO small ubiquitin-related modifier

17
SWI switch
SWR switch-related protein
T thymine
TBE tris borate ethylenediaminetetraacetic acid
TBP transcription initiator binding protein
UV ultraviolet

18
1. Introduction
19
Preface
The complement of genetic material in eukaryotic cells is usually diploid –
possessing pairs of homologous chromosomes. The diploid state appears to be
advantageous because it is permissive for the balanced genetic exchange which
occurs during recombination in the gametes, thereby enabling sexual reproduction.
Surprisingly, there are notable exceptions in which the diploid state is perturbed
without catastrophic cellular consequences. Numerous plant species are tetraploid
(containing a multiple of the diploid chromosome number) and many species of fungi
are haploid (half the diploid chromosome number) for a majority of their life cycle.
Additionally, there is the phenomenon of aneuploidy – the gain or loss of whole
chromosomes – which usually has deleterious consequences on cell fitness but is
surprisingly well-tolerated by cancer cells.
The large variety of chromosome states observed, even between cells from a single
organism, is still poorly defined and mechanistically unclear. Moreover, stably-
maintained aneuploidies for particular chromosomes are likely an interplay of both
selection and recurrent chromosome missegregation. Both possibilities are
contingent on subverting the mechanisms which act to maintain a stable
chromosome number between generations. Aneuploid cells may therefore, in-effect,
bypass or dysregulate a putative ‘aneuploidy sensing’ pathway which is as-yet
undefined.
In this introductory chapter I describe the structure and function of chromosomes,
drawing particular attention to their molecular regulation, organisation and
segregation which impacts upon aneuploidy mechanisms and responses in
eukaryotic cells, with emphasis on aneuploidy in tumourigenesis.
20
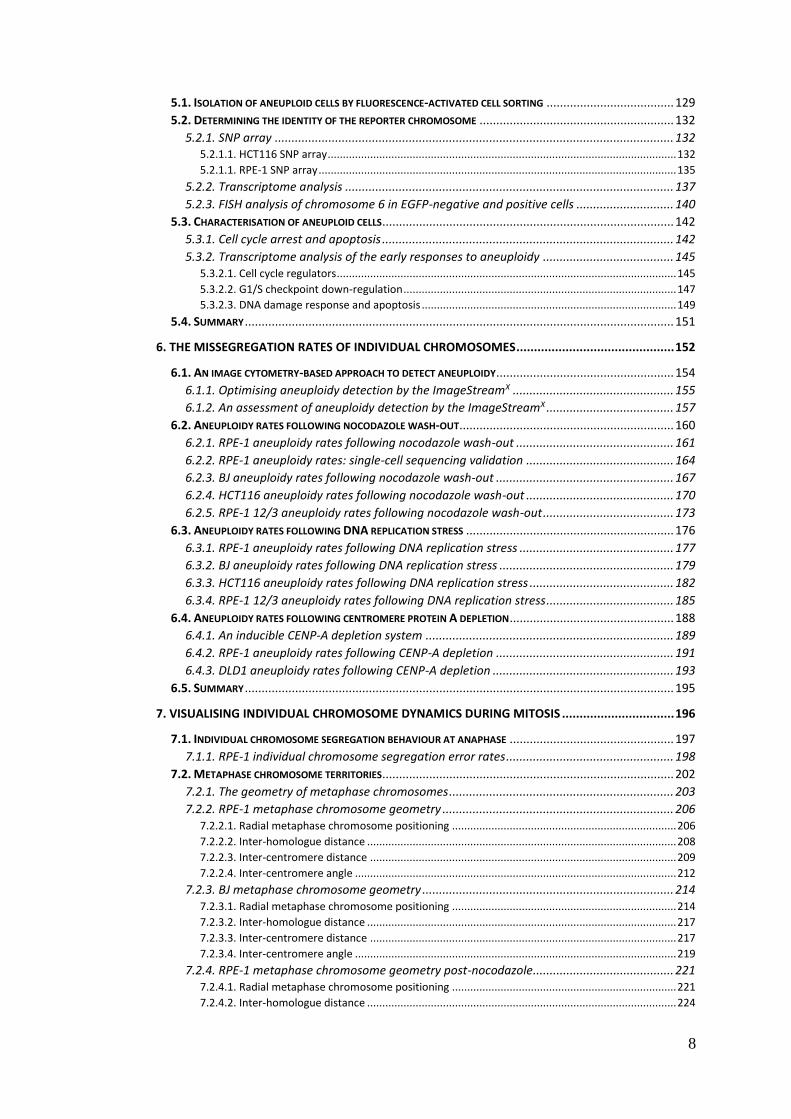
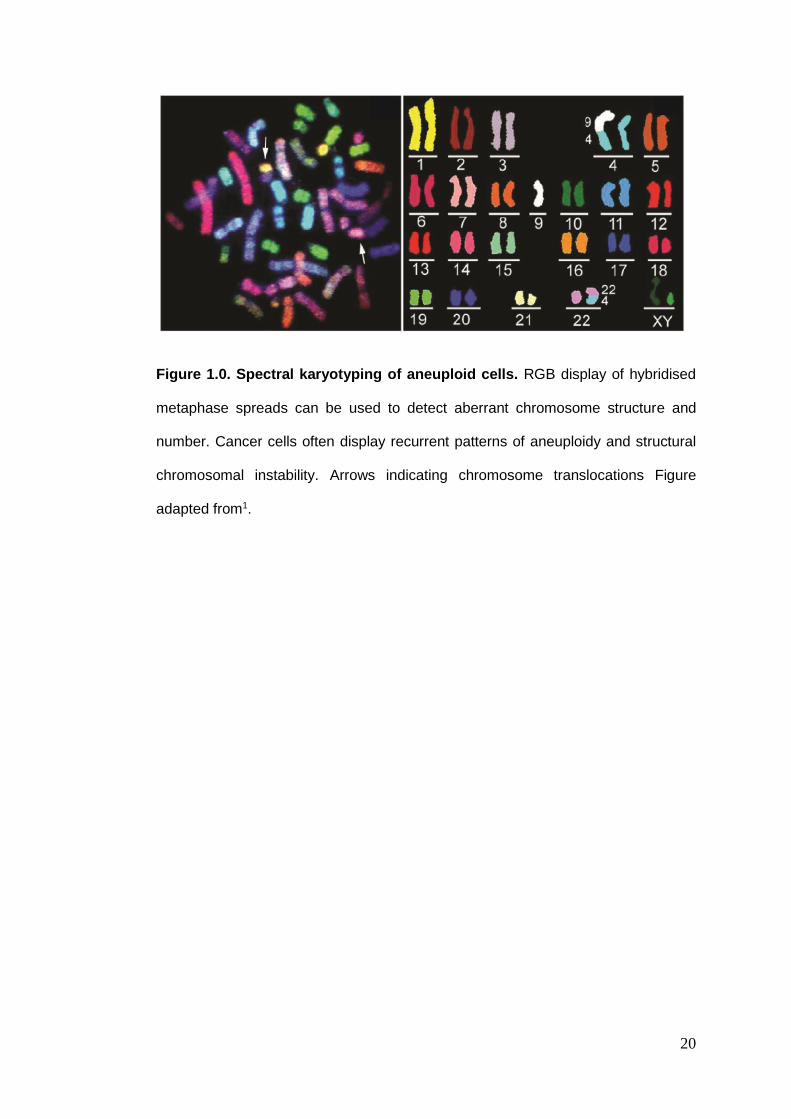
Figure 1.0. Spectral karyotyping of aneuploid cells. RGB display of hybridised
metaphase spreads can be used to detect aberrant chromosome structure and
number. Cancer cells often display recurrent patterns of aneuploidy and structural
chromosomal instability. Arrows indicating chromosome translocations Figure
adapted from1.
21
1.1. Chromosomes
In eukaryotes, linear deoxyribonucleic acid (DNA) is tightly packaged into a higher-
order structure known as chromatin, a DNA-protein composite containing histones
and non-histone proteins. Hierarchical compaction of this nature allows a large
amount of DNA to exist as discreet entities known as chromosomes which reside in
the comparatively small volume of the nucleus of each cell2. Here I describe the
molecular pathways concerning chromosome function, regulation and segregation
during cell division.
1.1.1. Chromosome structure and function
The DNA comprising the human genome is divided unequally into 22 chromosome
pairs, known as the autosomes, and two sex-determining chromosomes – XX in
females and XY in males. The structure and organisation of chromosomes are
governed by several requirements including gene expression control3. As such,
human cells have evolved chromatin remodelling strategies that are capable of
enormous plasticity under the control of complex, regulatory signalling networks4.
Two structural features common to all chromosomes are the centromeric and
telomeric regions, occurring at the central constriction and capping the ends of
chromosomes, respectively. These regions contain highly-repetitive DNA
sequences that serve several important functions. Although they are present in each
chromosome, the length and position of these repetitive elements varies between
chromosomes.
22
1.1.1.1. Chromatin architecture and remodelling
The basic repeating subunit of chromatin, known as the nucleosome, is highly
conserved across species5. It is comprised of a 147bp segment of DNA wrapped
around homodimers of each of the four histone proteins (H2A, H2B, H3 and H4)
which assembles to form the histone octamer. The tight association between DNA
and the octameric core afford protection from nuclease digestion and permit an initial
compaction of linear genomic DNA of approximately 7-fold6,7. Nucleosomes serve to
package the genome, but in doing so they also restrict the access of DNA-binding
transcription factors, meaning there is a fine balance between DNA accessibility and
packaging efficiency8. Gene expression in transcriptionally active areas of the
genome is controlled by a number of regulators. Firstly, there is dynamic competition
between transcription factors and nucleosomes for elements in gene promoters
known as the cis-regulatory sequences9. Competition of this nature is regulated by
enzymes known as ‘chromatin modifiers’ which covalently alter nucleosomes, and
‘chromatin remodellers’ which eject or reconfigure nucleosomes. Studies in yeast
suggest that the chromatin architecture at promoters exists in two broad states –
constitutive and highly regulated – with protein complexes for specific genes blurring
the distinction in special cases10,11.
Constitutive (open promoter) genes are spatially organised to allow the binding of
transcription factors at the expense of nucleosomes, therefore promoting gene
expression. The chromatin immediately upstream of the transcription start site of
these genes typically contains a large nucleosome-depleted region (NDR) that is
densely populated with poly(dA:dT) tracts12–14. These sequences are rigid in
structure, thereby promoting nucleosome instability and inhibiting chromatin
spooling15. Conversely, AA/TT dinucleotide repeats induce a chromatin curvature
which promotes nucleosome assembly16,17. Regions of this nature which extend for
more than 150bp are known as nucleosome positioning sequences (NPS). Notably,
23
transcriptional activator binding sites often reside in the NDR, increasing
transcription factor binding efficiency and gene expression.
At regulated (closed promoter) genes, transcription factors compete with
nucleosomes for occupancy of the cis-regulatory binding sites. These promoters are
littered with NPS sequences of varying length, which dictate the nucleosome-
transcription factor balance by altering the rigidity of promoter chromatin18. In most
cases, there is at least one exposed binding site, between adjacent nucleosomes,
on the linker DNA that permits a ‘pioneer’ access to the promoter which can then
initiate chromatin remodelling in a controlled manner to expose further sites
concealed by the nucleosome19,20. Transcription initiation can also vary between
open and closed promoters. The transcription initiation binding protein (TBP) is an
absolute requirement for TATA-less and TATA-containing promoters21. Whereas
very few open genes contain TATA boxes, almost all closed promoters contain
TATA boxes inside the proximal nucleosome edge, enhancing the requirement for
chromatin remodelling and nucleosome displacement before TBP access and gene
expression can occur22.
The transition between chromatin states can also be achieved through the hydrolysis
of adenosine triphosphate (ATP) by chromatin remodellers. These are specialised
protein complexes that are classified by their mechanism of action. The imitation
switch (ISWI) and sucrose non-fermentable (SNF) remodelling families assemble
and organise chromatin by the deposition of nucleosomes23; the SWI/SNF family
facilitate nucleosome ejection or movement, and the SWR1 family insert specialised
histones into nucleosomes for reconstruction24,25. By cooperating the expression and
localisation of remodelling complexes with environmental changes, chromatin
architecture around promoters controls the expression of target genes with high
temporal precision.
24
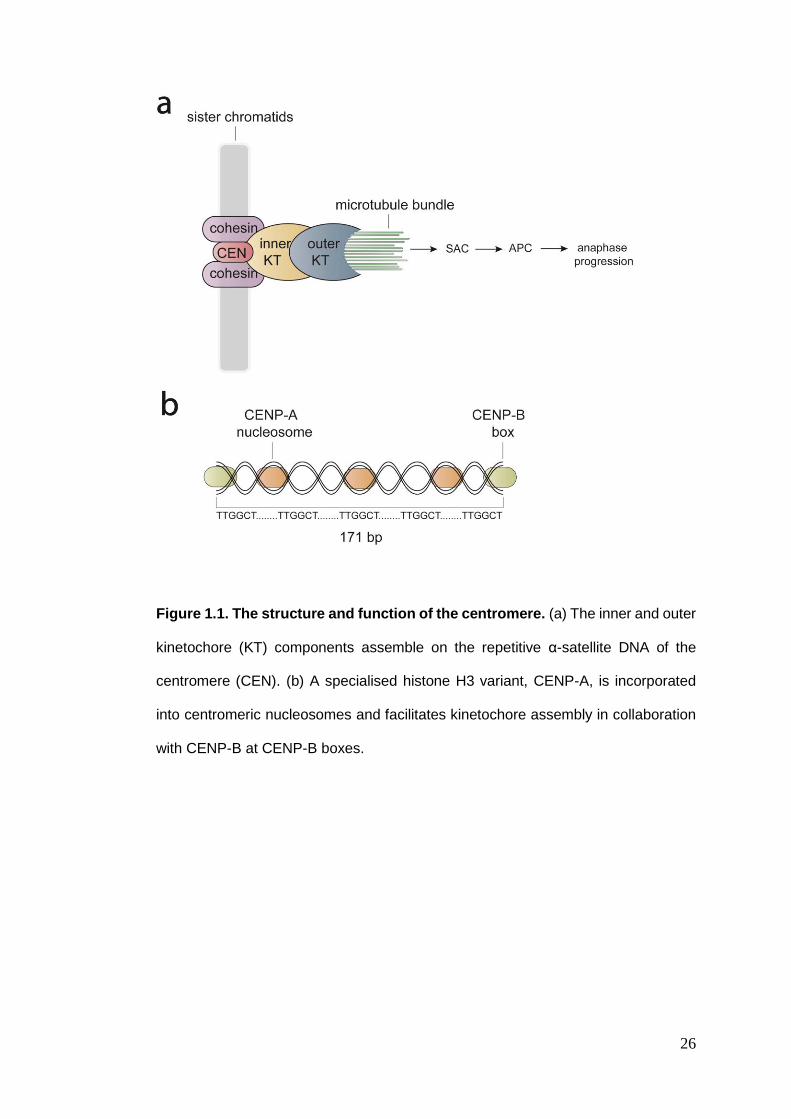
1.1.1.2. Centromeres
The repetitive sequence which specifies the centromere, known as α-satellite DNA,
is organised into functional subdomains and is flanked by regions of
heterochromatin. The centromere serves as more than a junction point between the
two chromatid arms – it also coordinates the movement of chromosomes during
mitosis and meiosis, regulates sister chromatid cohesion and helps synchronise
chromatin condensation26,27. Most of the available data concerning centromere
function describe its important role in mitosis, where it serves as the assembly site
for microtubules through its interaction with a multi-protein complex, known as the
kinetochore28.
The centromeric α-satellite DNA is host to a specialised histone H3 variant, CENP-
A, which is important, but not essential for, kinetochore assembly on the centromere
(figure 1.1a)29. It has been shown that the octamer of histone proteins that form the
nucleosome can assemble in vitro with purified CENP-A, suggesting that CENP-A
is sufficient to replace endogenous H3 dimers at centromeric regions30. Unlike other
histone proteins which are removed and reincorporated into chromatin during early
S-phase, CENP-A nucleosomes are inherited in a semi-conservative manner with
nascent-synthesised CENP-A loading occurring at the centromere during G131. This
explains how CENP-A specificition at α-satellite DNA is faithfully maintained
between generations32,33. It is now known that CENP-A does not completely replace
histone H3 at centromeric sequences. Instead, H3-containing nucleosomes are
interspersed with CENP-A-containing nucleosomes. These H3 histones are tagged
with a dimethyl modification on lysine 4 (H3K4me2) which is essential for the
specification and maintenance of CENP-A at centromeres. Interestingly, it has been
shown that CENP-A contributes to the rigidity of the centromere through its
interaction with H4, which is less flexible than the common H3-H4 interaction,
25
thereby providing a stable platform for downstream assembly of kinetochore
components34.
Centromeres are also distinguished from the rest of the genome by higher-order
packaging. This relies on two other members of the CENP family – CENP-B and
CENP-C. Targeting of CENP-B to the centromere is achieved through its interaction
with the CENP-B protein binding motifs, the CENP-B boxes, which are deposited at
alternating 171bp monomers (figure 1.1b)35. Functionally, this allows dimerization
of conserved domains on adjacent CENP-B proteins so that the CENP-B boxes are
brought in close proximity36. This looping of α-satellite DNA induces non-random
phasing of CENP-A nucleosomes throughout the centromere37. Likewise, CENP-C
has several targeting domains specifying it to centromeric DNA, where it is important
for the dimerization of CENP-B and promoting other protein-protein interactions.
During mitosis, CENP-C functions as a scaffolding protein, remodelling the
centromeric architecture to create a chromatin environment which is permissive for
the assembly of the inner kinetochore at metaphase38.
Given that most centromeres are flanked by heterochromatin – transcriptionally
silenced regions of the genome characterised by dense histone methylation – it is
likely that the epigenetic environment surrounding the centromere plays an
important role in either specifying the centromere, or aiding its function39. More
recently, it has been suggested that heterochromatin might be important to limit
kinetochore assembly to centromeric DNA40. Experimentally, this has been shown
by heterochromatin restriction of CENP-A to the centromere, even in conditions
when CENP-A is overexpressed41. Conversely, the removal of pericentromeric
heterochromatin is permissive for the spread of CENP-A into flanking sequences,
which may impact on kinetochore assembly and, therefore, chromosome
segregation42.
26
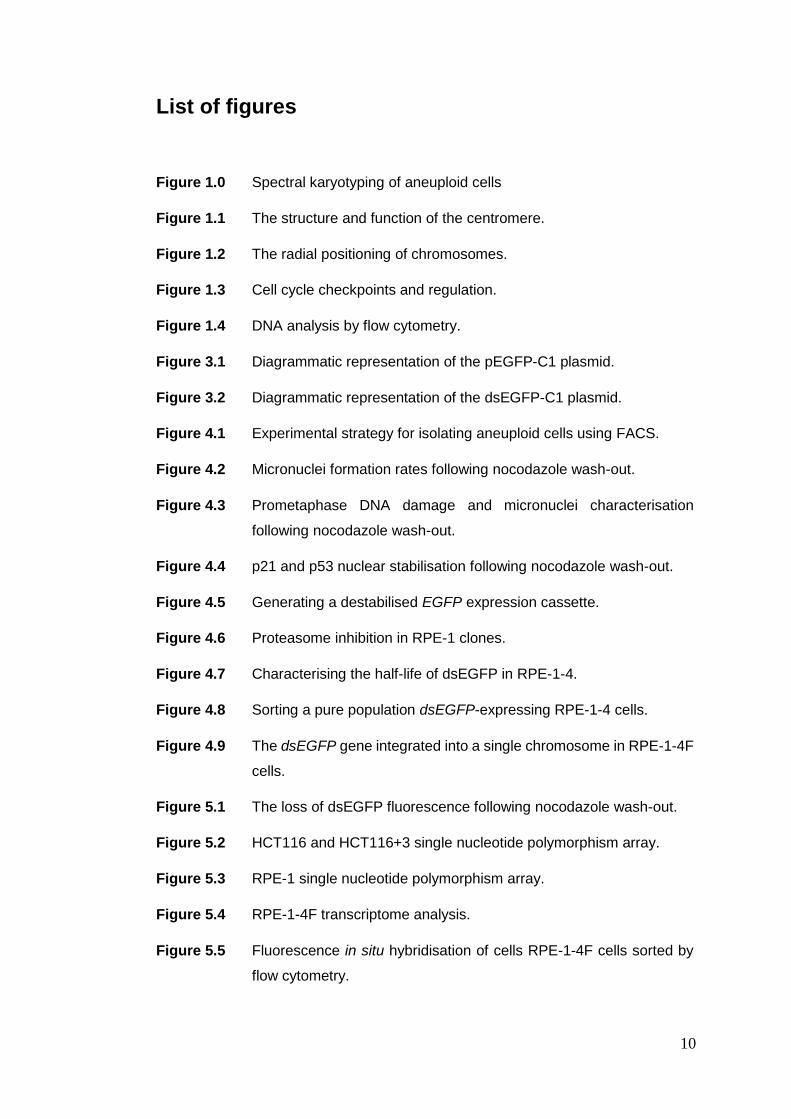
Figure 1.1. The structure and function of the centromere. (a) The inner and outer
kinetochore (KT) components assemble on the repetitive α-satellite DNA of the
centromere (CEN). (b) A specialised histone H3 variant, CENP-A, is incorporated
into centromeric nucleosomes and facilitates kinetochore assembly in collaboration
with CENP-B at CENP-B boxes.
27
1.1.1.3. Telomeres
As the name suggests – from the Greek nouns telos (‘end’) and meros (‘part’) –
telomeres are found at the extremities of each chromosome arm. Much like
centromeres, telomeres are specialised chromatin environments consisting of
repetitive DNA sequences which are essential for chromosome function. Without
telomeres, each round of genome duplication would lead to progressive
chromosome attrition. Of equal importance is their ability to mask the ends of
chromosomes which would otherwise be recognised as DNA breaks leading to cell-
cycle arrest43.
Human telomeres are characterised by multiple tandem repeats of the sequence
TTAGGG proceeded by G-rich single-stranded overhangs at the 3’ terminus.
Telomeric DNA adopts an unusual conformation known as ‘T-loop’ where the
telomeric ends fold back and invade the adjacent double-stranded DNA (dsDNA)44.
These repeat regions are generated and maintained by a specialised reverse
transcriptase, known as telomerase, which is unusual in that it carries its own RNA
template.
The precise molecular mechanisms which recruit telomerase to the telomeres are
still unclear; however it is known that Cdc13, a G-rich-specific DNA-binding protein
which is necessary to protect telomeres against double-strand breaks (DSBs), is
involved in telomerase recruitment45–47. These G-rich overhangs are also able to
quadruplex with themselves, by virtue of the fact that each base serves as both an
acceptor and donor for hydrogen bonds. This quaternary structure limits telomerase
activity (preventing promiscuous telomere extension), suppresses recombination
events and acts to protect the chromosome ends from exogenous DNA damage47.
It has been shown that the length of the 3’ G-overhang is essential for telomerase
regulation and end processing, with the shortest telomeres eliciting the strongest
telomerase recruitment at S-phase48–50.
28
The transition between the repetitive regions of telomeres to transcriptionally-active
euchromatin is not abrupt. Instead most, but not all, telomeres are underpinned by
a dynamic and variable region known as the subtelomere, which may traverse up to
300kb51,52. The precise evolutionary origin of subtelomeric regions are unknown, but
are likely to have arisen by many translocation and recombination events.
Functionally, subtelomeres may provide enhanced protection for telomeres;
however it has recently been demonstrated that they are also able to rescue genes
located at the ends of chromosomes from telomeric methylation, which would
otherwise disrupt their expression53,54. Additionally, subtelomeres play an important
role in meiosis, where they inhibit crossover events. This is important as it has been
shown that meiotic recombination events near the ends of chromosomes could
impair proper chromosome segregation55.
29
1.1.2. The nuclear organisation of chromosomes
The nucleus is an organelle which is spatially separated from the cytoplasm by two
membrane bilayers – the outer nuclear membrane and the inner nuclear membrane.
The non-random arrangement of chromosome within the nucleus is important for
many of their functions including transcriptional regulation, DNA stability and
chromosome segregation during mitosis.
1.1.2.1. Radial chromosome positioning
Individual chromosomes can be stained with fluorescent probes by Fluorescence in
situ Hybridisation (FISH). This technique revolutionised my understanding of the
spatial organisation of DNA, as it allowed the sub-nuclear location of genetic loci to
be mapped along an axis extending from the nuclear core to the inner nuclear
membrane56,57. By mapping the radial positions of chromosomes, it is now known
that many cell types have a preference for gene-dense chromosomes locating in the
nuclear core and gene-poor chromosomes occupying the nuclear periphery; this is
known to be conserved among primates and a similar phenomenon for chromosome
size has been reported (figure 1.2)57–59. Confusingly, despite this general density
phenomenon, there is little evidence that each chromosome has a defined ‘3D
neighbourhood’ of chromosome with which it resides60.
The mobility of chromatin in the interphase nucleus is limited61–63. This has important
implications for human disease, as the proximity of chromosomes becomes the
limiting factor for the variety of chromosome translocations which can occur; only
chromosomes which are sufficiently close may exchange genetic material by
double-strand break repair64. This has been shown in both mouse and human
lymphocytes65. It has also been reported that reciprocal translocations involving
chromosomes with stochastic arrangements can disrupt nuclear organisation. This
is most pronounced in the example of the recurrent t(11;22)(q23;q11) translocation
30
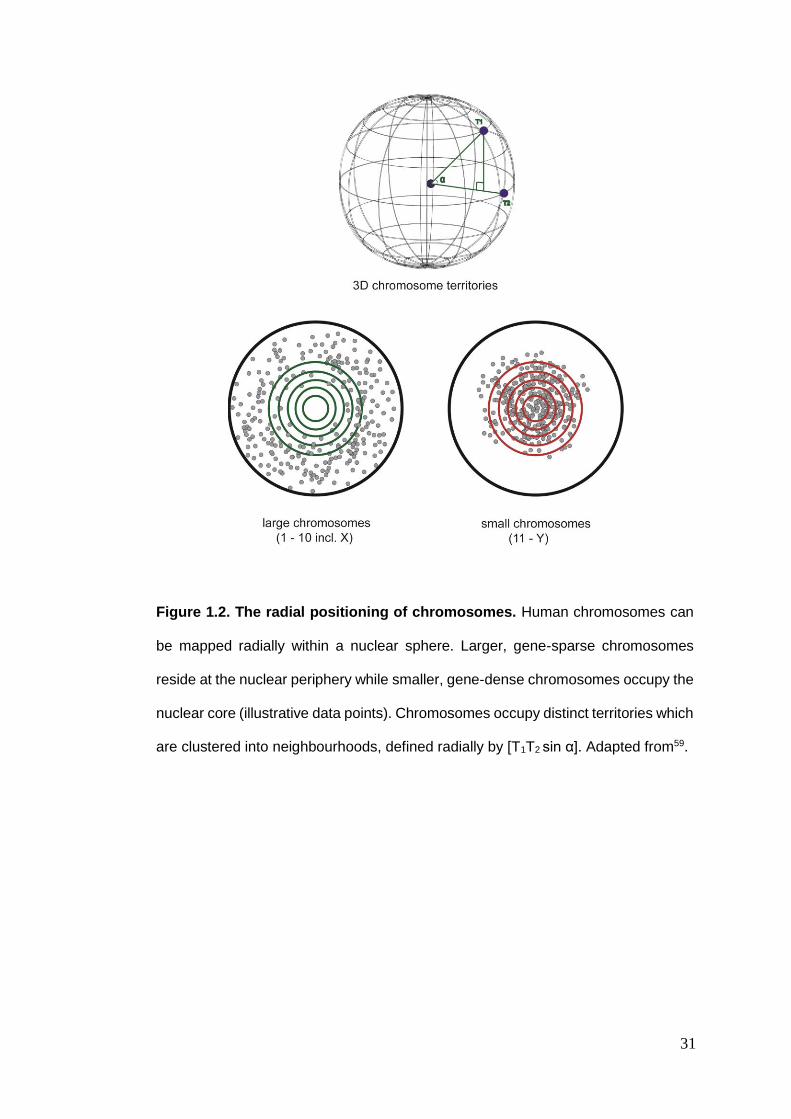
where chromosome 22, usually positioned in the nuclear core, is shifted towards the
periphery when chromosome 11 is located more centrally than expected56. The
radial positioning of chromosomes, given the consequences for translocations and
other structural DNA aberrations, may have important implications for chromosome
evolution66.
Each chromosome, regardless of its position in the nucleus, occupies a well-defined
territory67. At the boundary between adjacent territories, there are regions where
chromatin is able to loop into the no-mans-land and form cis and trans associations
between chromosomes68. Interestingly, it has been shown that the centromere is
important for attenuating the association of looped sequences present on opposite
arms of the same chromosome, preventing intra-chromosome translocations,
although the mechanistic basis for this is still unclear69. Functionally, the looping of
DNA may aid transcription of these regions. Recent data suggest that most of these
looping regions are gene-dense and hyper-sensitive to DNase I treatment, indicative
of highly-active promoter regulatory elements70. It has also been suggested that
DNA looping may allow actively-expressed regions of the genome to explore a larger
nuclear space, which is thought to be important for certain mRNA splicing events71.
31
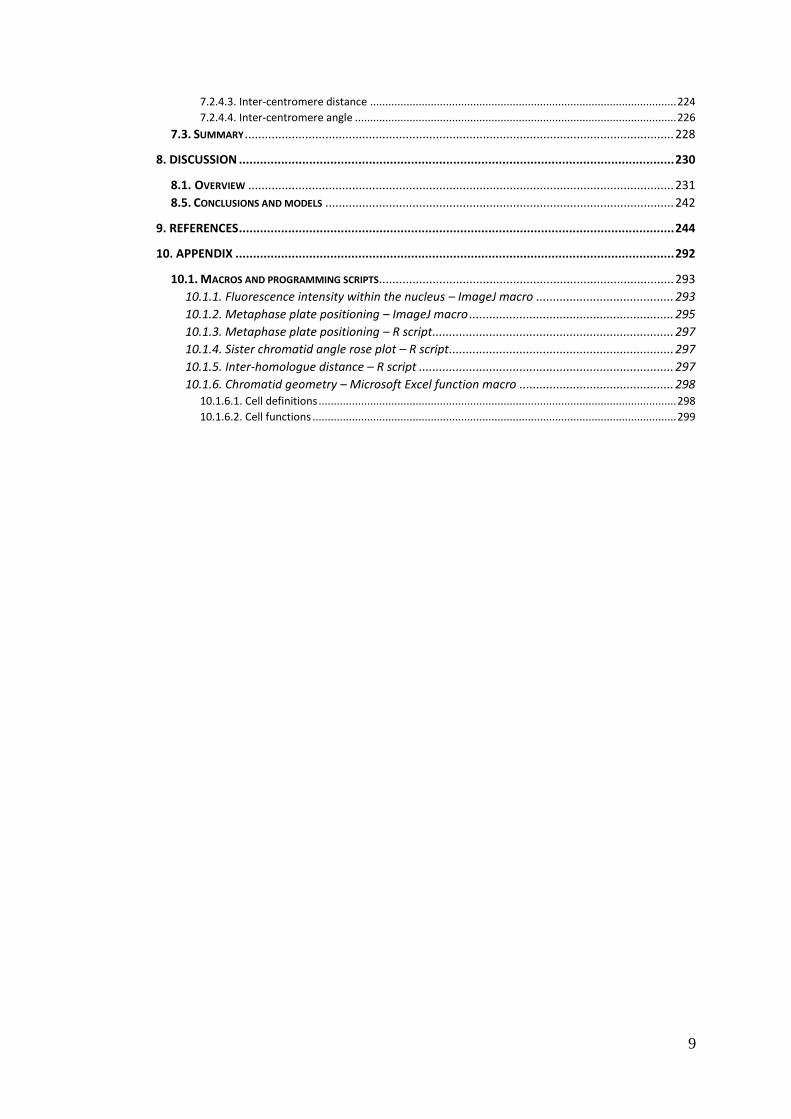
Figure 1.2. The radial positioning of chromosomes. Human chromosomes can
be mapped radially within a nuclear sphere. Larger, gene-sparse chromosomes
reside at the nuclear periphery while smaller, gene-dense chromosomes occupy the
nuclear core (illustrative data points). Chromosomes occupy distinct territories which
are clustered into neighbourhoods, defined radially by [T1T2 sin α]. Adapted from59.
32
1.1.2.3. Chromatin domains
Within each chromosome territory, there is further clustering of active and inactive
gene regions, known as chromatin domains72. The interaction of inactive domains
occurs in two broad categories – centromere proximal and centromere distal – which
is likely to reflect their reduced freedom of movement and are usually found within
their own chromosome territory73. Conversely, active regions are able to associate
over long distances, which may reflect their requirement to cluster around shared
gene splicing machinery. Local chromatin domains form unique structures which
correspond with replication timing during S-phase. Regions of the genome with
active genes, the ‘replication (R) bands’, are known as early replicating and inactive
genomic regions, the ‘Giemsa (G)-bands’, are late-replicating74. It has also been
shown that late-replicating domains tend to cluster at the nuclear periphery and that
replication timing can significantly affect chromosome translocations75. This is
important as it suggests that aberrant S-phase execution may predispose to the
structural rearrangement of chromosomes.
1.1.2.4. Nuclear membrane-associated chromatin
The inner nuclear membrane (INM), aside from being the physical boundary of the
nucleoplasm, is important for cooperating gene expression, genome stability and
initiating DNA repair76. The INM is traversed by filamentous lamin proteins and
nuclear pore complexes which interact with perinuclear chromatin and play an
important role in maintaining the structural and functional integrity of the genome77.
It is now possible to detect loci which interact with the INM by fusing DAM
methyltransferases to INM proteins and identifying de novo DNA methylation by
sequencing78. Using this approach, it is now known that transcriptionally silent
chromatin regions associate with perinuclear membrane proteins in both humans
and flies79. Interestingly, treatment with histone deacetylases causes the release of
33
lamin-associated sequences from lamins, suggesting that gene silencing by
methylation is sufficient to promote association with the nuclear membrane79. This
further supports the view that heterochromatic regions of the genome preferentially
occupy the nuclear periphery80. It is important to highlight that the nuclear periphery
is not always associated with gene silencing. It has been shown in yeast that genes
associated with nuclear pore complexes (NPCs) can promote transcription, and that
treatment with histone deacetylases inhibitors can promote the reactivation of silent
chromatin to active domains at the NPC81,82. The precise mechanisms governing
expression at the nuclear periphery are blurred further by activation, or silencing, of
some genes at the INM in a regulatory element-dependent nature. These data
highlight the complex interplay between perinuclear compartments, genetic
elements and the nuclear envelope.
In yeast cells, the nucleolus is comprised largely of repetitive ribosomal DNA (rDNA),
abuts the inner nuclear membrane and is prone to homologous recombination
events, which cause genomic instability83. Affinity purification and proteomic analyse
have revealed two key proteins, Heh1 and Nur1, which form the CLIP (chromosome
linkage INM proteins) complex which bridges the rDNA repeats to the INM. It has
recently been shown that disruption of the CLIP complex releases rDNA repeats
from the nuclear membrane leading to recombination events and the accumulation
of genetic lesions – a phenotype which was rescued by reintroducing artificial
tethering to the INM84,85.
Additionally, it is known that other repetitive sequences can associate with
perinuclear proteins – one of which is telomeres. Early work identified at least one
protein, Mps3, which is able to promote clustering of the 32 yeast telomeres into 4-
8 foci at the nuclear envelope86. This discovery led to the study of INM chromatin
silencing at telomeres and it was shown that several telomere-binding proteins are
important for perinuclear anchoring87. More recently, it has been shown that Mps3-
34
dependent telomere clustering is important to sequester transcription inhibitors
which can otherwise erroneously silence non-subtelomeric genes88.
Surprisingly, DNA insulted with double-strand breaks (DSBs) is actively relocated to
the nuclear membrane, where it interacts with nuclear pore complexes89. This
recruitment to the INM is dependent on Mec1, a kinase that delays cell-cycle
progression in response to DSBs. Importantly, damaged loci do not cluster with
telomeric attachment sites, and damaged telomeric sequences promote co-
localisation of telomeres with the NPC, suggesting that damaged DNA may be
targeted to the NPC regardless of its nuclear envelope attachment status. The role
of NPCs and lamins in genome stability and maintenance of chromatin organisation
is reinforced by a number of important studies. For example, mutations in lamin
proteins are linked with chromatin architecture abnormalities and loss of nuclear
structural integrity; and lamins have also been linked to transcriptional regulation by
modulating the availability of transcription factors at the nuclear envelope90,91.
It is possible that the inner nuclear membrane helps stabilise DNA by acting as a
large support platform enabling cells to control the distribution of repetitive loci
relative to each other. The INM may also limit long-range recombination events
between susceptible loci, by keeping sister chromatids spatially separated during S-
phase. The clustering of repetitive domains at the nuclear periphery may also permit
genetic co-regulation, which can promote beneficial recombination diversity under
stress. Together, the above data demonstrate that the nuclear periphery is an
important organisational region, where transmembrane proteins act to minimise
DNA damage and as tethers for chromosomal domains.
35
1.1.3. Mitotic chromosome assembly
Profound changes in chromatin structure occur during mitosis, when the duplicated
genome is equally partitioned into two daughter cells. Disassembly of the nuclear
envelope, at mitotic onset, occurs concurrently with the rearrangement of an
amorphous chromatin mass, resolving as sister chromatid pairs which line up on the
equatorial spindle. This sequence of carefully-coordinated events is known as
chromosome condensation, or assembly, and is an absolute requirement for the
faithful segregation of genetic material92,93.
1.1.3.1. The structure and composition of SMC complexes
Mechanisms of chromosome condensation, DNA repair and sister chromatid
cohesion rely on a families of proteins known as the structural maintenance of
chromosomes (SMC) complexes. These essential genomic functions are carried out
by the three SMC complexes: condensin, Smc5/6 and cohesin94. These complexes
assemble around heterodimers of SMC proteins (named SMC1-5), which are
obligatory for DNA binding activity and the hydrolysis of ATP.
Smc1 and Smc3 create a ring-like structure, which is important for entrapping sister
chromatids until proteolytic cleavage of Ssc1 at anaphase onset95,96. The
entrapment of DNA is also known to hold condensins in close association with their
target site. However, whereas cohesion is bound at physiological ionic strength, the
interaction of condensins has been shown to dissociate only at high salt
concentrations, suggesting that condensins are also able to bind DNA directly97. It
is currently unknown whether Smc5/6 is able to bind DNA directly, or if it forms a
similar ring-like structure. Given the structural similarity with condensins and
cohesin, this seems entirely plausible.
36
1.1.3.2. Condensins
The primary function of condensins is to establish proper mitotic chromosome
structure and promote faithful chromosome segregation during meiosis and mitosis.
There are two condensin complexes, referred to as condensin I and condensin II,
that share two core subunits, which are independently coordinated by distinct
regulatory subunits. The two core protein subunits belong to a larger family of
ATPases called the structural maintenance of chromosomes complex. Condensins
are able to hydrolyse ATP to promote both superhelical rigidity and DNA
compaction98,99. Despite data suggesting that condensins are crucial for
chromosome assembly, there is an abundance of conflicting literature on their
precise mechanism of action.
The earliest stages of chromosome condensation are characterised by the
hierarchical supercoiling of chromatin fibres. One of the SMC subunit of condensins,
Smc2, first associates with chromatin fibres at the periphery of the nucleus and
subsequently accumulates at prometaphase along the central axis of each
chromosome. Importantly, NEBD is coincident with the relocalisation of Smc2 and
condensin I recruitment to chromatin arms, suggesting that chromosome structural
changes observed before and after NEBD may be mechanistically distinct. More
recently, it has been suggested that topoisomerase II is important for the axial
formation of chromosome arms and recruitment of condensin I subunits; however
this cannot explain the activities of condensin II100.
Chromosome bridges, DNA spanning between dividing chromosome masses at
anaphase, are one of the most prominent segregation defects observed in
condensin-deficient cells101–103. Segregation defects of this kind are thought to be
linked to improper chromosome condensation in the preceding metaphase.
Condensin depletion in human cells and Xenopus embryos has been shown to
increase the formation of merotelic chromosome attachments, single kinetochores
37
attached to microtubules emanating from both spindle poles, raising the possibility
that condensins are also important for bipolar orientation of chromosomes104.
Chromosome assembly defects have also been observed in condensin-depleted C.
elegans models. Unlike vertebrate chromosomes which have one kinetochore per
sister chromatid, C. elegans have many kinetochores which assemble along the
length of each sister chromatid pair, known as holocentric chromosomes105,106.
1.1.3.3. Sister chromatid cohesion
The dissolution of sister chromatid cohesion is coordinated in a two-step process.
The first, occurring during prophase, does not affect centromeric cohesion, which
gives mitotic chromosomes their single constriction107,108. The activity of separase at
the onset of anaphase is responsible for the cleavage of the SMC protein Scc1,
triggering disjunction of sister chromatids109,110. Cohesin exists as different
populations which are loaded onto chromatin at various stages of the cell cycle. In
human cells, >90 % the cohesin bound on chromosomes becomes dissociated
during early prophase, leading to soluble mitotic cohesin complexes in the cytoplasm
which are spared separase cleavage111. Cohesin subunits tagged with a green
fluorescence protein (GFP) suggests that the residence time of some chromosomal
cohesin is shorter than 25 minutes, in both G1 and G2 cells112. However, a distinct
population engages with chromatin for significantly longer and may represent the
pool responsible for holding sister chromatids together113.
The loading of cohesin onto chromatin requires ATP hydrolysis at all stages and is
facilitated by the ATPase domain of Smc1 and Smc3 of the cohesin complex. This
was first shown using mutated Smc1 and Smc3 proteins which could bind, but not
hydrolyse, ATP which were able to form cohesin ring-like structures but failed to
stably associate with DNA114,115. The DNA binding capacity of cohesin varies at
different parts of the genome, with some requiring the presence of additional factors
or proteins before a stable association can be formed. At every known site, the
38
Ssc2/4 complex is essential for binding in mammals, Xenopus and yeast116–119.
Unsurprisingly, defects in either Ssc2 or Ssc4 precipitate as global failure of sister
chromatid cohesion120. It is unlikely that Ssc2/4 functions solely in cohesin loading,
given that ssc2 mutation is also known to compromise Smc5/6 onto chromatin
concurrently with defects in condensin121,122.
Chromatin association of cohesin in Xenopus requires, in addition to Ssc2/4, the
formation of the pre-replication complex (RC)123. Purified extracts from Xenopus
larvae display associations between Ssc2/4 and Cdc7/Drf1-dependent kinase
(DDK), which is an essential member of the pre-RC124. The sequential binding of
various cofactors in this assembly have revealed the possibility that Ssc2/4-DDK
may act prior to DNA replication, suggesting that Ssc2/4’s functions include
chromatin fibre trapping in addition to cohesin recruitment to chromatin.
The two phase process of cohesin removal from sister chromatids is under tight
temporal control. Unlike the metaphase-to-anaphase transition, in which the
separase-mediated cleavage is well characterised, the prophase pathway of
cohesin dissolution is separase-independent and has yet to be fully elucidated. It is
known that, during the prophase pathway, moderate dissociation is mediated by
polo-like kinase (PLK) and Aurora B phosphorylation on the C-terminal domains of
Scc3125. Given that cohesin removal can still occur in the absence of these proteins,
they are unlikely to be requisite. Recent data suggests that the master regulator of
prophase cohesin removal is Wapl, a protein which binds to the SMC scaffolding
subunit Pds5. This was demonstrated in Wapl-depleted cells, resulting in the
majority of cohesin remaining on chromatin arms126,127. The prophase pathway
removes most, but not all, chromatin-bound cohesin. Centromeric cohesin is
protected from this pathway because of a centromere-specific Sgo1128,129.
The metaphase-to-anaphase transition is characterised by separase cleavage of
Ssc1, the α-kleisin subunit of the cohesin complex96. A non-cleavable mutant Ssc1
39
in HeLa cells disrupts sister chromatid disjunction and blocks Rec8’s removal from
bivalent chromosomes110. The activity of separase is further regulated, in a cell-
cycle-dependent manner, by the chaperone protein inhibitor, securin130. The
phosphorylation of separase by Cdk1 on serine 1121 promotes the stable interaction
with cyclin-B/Cdk1, rendering the protease domain catalytically null131. This function
is of paramount importance, especially in pre-implantation mouse embryos and
primordial germ cells, where securin levels are known to be lower than in other cell
types132,133.
Crucially, the activity of separase is prevented until all sister chromatid pairs are
bioriented. Once all kinetochores are attached to microtubules the APC/C
ubiquitinates securin and cyclin B, leading to their proteolysis 134. This signalling
cascades culminates with the cleavage of Ssc1 subunit of cohesin complexes at
centromeric DNA, triggering sister chromatid disjunction110.
An important emerging role for cohesin is in double-strand break repair in meiotic
and mitotic cells122,135. Two distinct cohesin population engage in repairing DSBs in
mitotic cells – cohesin recruited to the break point and cohesin already holding sister
chromatids together when the break occurred136,137. Cohesin in meiotic cells is
involved in generating reciprocal translocation events by DSB repair and generates
the chiasmata, which secures bivalent chromosomes to each other until meiosis I138.
It is known from yeast studies that the α-kleisin subunits Ssc1 and Rad21 present in
mitosis are replaced by Rec8, which is specific to the meiotic cohesin complex139.
Functionally, this may permit the repairing of DSBs by non-sister chromatid
recombination and therefore promote genetic diversity. Human cells also swap these
subunits for meiotic-specific variants, namely STAG3 replacing Scc3 and Smc1B
(replacing Smc1), which are important for generating heterogeneity during
oogenesis and spermatogenesis.
40
1.2. Mechanisms driving aneuploidy
1.2.1. DNA damage
The DNA of human cells is under continual assault by a barrage of exogenous DNA
damage-inducing agents and cellular metabolites. These insults may alter the
primary nucleotide sequence, which is a leading cause of many of human diseases.
Unperturbed cells have the capacity to sense errors arising from DNA damage and
have evolved regulatory networks which correct damage below a threshold,
removing cells with damage which cannot be corrected by programmed cell
death140,141. Aneuploid cells often display high rates of protein mis-folding due to
protein stoichiometry imbalances142,143. It is also known that DNA damage is a major
driver of chromosome instability and cause of aneuploidy144–147. This section
describes the foundations of DNA damage phenotypes with examples of
perturbations which give rise to aneuploid progeny.
1.2.1.1. DNA damage repair
Repair pathways which maintain the integrity of DNA are broadly divided into sub-
categories, depending on their mechanism of action: base excision repair,
nucleotide excision repair, double-strand break repair, direct repair and repair of
cross-linked DNA.
The repair of DNA by base excision is initiated by the removal of the base by a DNA
glycosylase to form an abasic site. This class of glycosylase enzymes are capable
of recognising a wide range of aberrant nucleotides including deaminated, oxidised,
reduced, alkylated and mismatched bases. In most cases, the removal of the base
occurs by a process known as the abasic lyase reaction in which the 1’-aldehyde
from the deoxyribose is reduced by a β-elimination reaction, leaving the 3’-sugar
phosphate residue unsaturated148. This is proceeded by removal of the sugar 5’ to
the abasic site and the gap is filled by DNA polymerase and subsequently nick
41
ligated149. In human cells, this process is known simply as the short-patch base
excision repair as the reaction only involves three enzymes: APE1, DNA ligase III
and DNA Polβ. Glycosylases use simple diffusion and Brownian motion to detect
distortions created by the formation of hydrogen bonds in the DNA backbone caused
by base damage150. Careful analysis of their crystal structure has revealed that some
glycosylases compress DNA helices on either side of the damaged base, which
permits rotational movement, thereby exposing the glycosylic bond which can be
hydrolysed by specialised domains151. These act as a proof-reading mechanism to
ensure base repair specificity. The dysregulation of Polβ is a frequent occurrence in
human cancers.
Of particular interest is the centrosome-associated abnormal localisation of gamma-
tubulin during mitosis in nude mice with aberrant Polβ expression. These changes
were shown to promote numerical aneuploidy and increase malignancy aggression,
possibly as a result of mitotic checkpoint deficiency152. Therefore, it is likely that
defects in base excision repair could manifest as stochastic errors which promote
chromosomal instability (CIN) and tumour progression.
Lesions formed on DNA after exposure to chemicals, irradiation or proteins cross-
linked to DNA are repaired by the process of nucleotide excision repair (NER).
Insults of this nature are repaired by the enzymatic removal of the offending base by
multi-protein complexes which envelope the damaged strand153. Excision repair is
known to recognise a wide range of substrates; consequently, it is thought that rather
than identifying chemical variation in the lesions, it is structural changes in the
phosphodiester backbone which are the point of engagement153.
Once identified, lesions are subject to incision and removal of an oligomer of 24-
32nt in length, which can be filled in by template-strand complementarity. An
assembly of 6 repair factors form a multi-protein complex responsible for all the
activity associated with NER154. In humans, it is the nuclease activity of XPC, XPA
42
and RPA which confer the initial DNA binding specificity, although there is still some
uncertainty over their preferences for damaged DNA. It was demonstrated that these
three nucleases have different DNA binding affinities and are present in different
abundances154. It is likely that a combination of all of these play an important role in
the final excision nuclease complex assembly. DNA unwinding and kinetic
proofreading during NER is devolved to a specialised protein complex, the TFIIH,
consisting of 6 subunits with both 3'-5' and 5'-3' helicase activity154. The helicase
subunit unwinds DNA 20bp downstream of the assembly site; if this happens to be
a non-damaged site then disassembly of the complex is promoted by hydrolysis of
ATP.
Conversely, sites of DNA damage provide a high-affinity binding site for other
subunits which recruit the nuclease domains in to contact with the damaged
nucleotide155. Excision, polymerase activity and nick ligation complete the nucleotide
replacement. Of interest, the proof-reading activity of TFIIH to detect only damaged
nucleotides is not absolute, and gratuitous repair of undamaged bases does occur
in human cells and may be mutagenic156.
In yeast models it has been shown that NER is a requirement for faithful
chromosome disjunction. In the absence of the repair factors, Rad1, Rad2 and
Rad4, there was a significantly elevated rate of spontaneous gain of chromosome
XV in both diploid and haploid mutant strains157. Emerging data also suggest that
the nuclease activity of XPA is required for the maintenance of proper centrosome
number (2 centrosomes per cell) 188. This in vitro work has shown that the loss of
Xpa is associated with centrosome amplification and micronuclei formation.
Interestingly, the concurrent loss of p53 showed a more severe phenotype than
haploinsufficiency of either alone, suggesting that there is cross-talk between NER
and p53 pathways to supress chromosomal instability in response to DNA damage.
43
Double-stranded DNA breaks are unusual in that they occur by exogenous damage,
by ionising radiation and ROS, but also occur naturally as a mechanism for
generating genetic variation (such as in V[D]J recombination) and meiotic cross-over
events158–160. DSBs are repaired by either homologous recombination (HR) or non-
homologous end-joining (NHEJ). The process of HR is a multi-step process which
requires the damaged strand to invade its homologous template, mediated by
Rad51, BRCA1 and BRCA2161. The resulting structure, known as a Holliday junction,
is resolved in such a way that the ‘lost base’ information is retrieved from the
homologous duplex. NHEJ involves the heterodimer of Ku proteins which recruit
ligase4-XRCC4, ligating two ends of a double strand break irrespective of whether
the arms are from the same chromosome162.
Defective HR pathways are prevalent in a number of cancers with heterogeneous
chromosome content. These are typified by BRCA1 and BRCA2-deficient breast
cancers. The loss of either of these genes is coincident with loss of genome
stability163. This is most likely due to defects in HR-mediated repair which gives rise
to cells with translocations and large-region deletions. Additionally, BRCA1/2 act in
a tumour-suppressive manner as they regulate the cell cycle by signalling to
checkpoint complexes164. It is by these mechanisms that BRCA1/2 likely act to
simultaneously supress tumour initiation and maintain genome stability.
A number of anti-cancer drugs cause cell death by inducing the formation of inter-
strand DNA cross-links. During replication, cross-linked DNA impairs polymerase
activity and leads to the formation of DSBs both in vivo and in vitro as a result of
replication fork collapse165. At replication-induced DSBs there is nuclease digestion
which degrades the cross-link in a 3’ to 5’ direction. The combined actions of Rad51
and Rad52 with RPA form a Holliday junction which can then be resolved by
homologous recombination166.
44
1.2.1.2. Cell cycle checkpoints
The eukaryotic cell cycle is characterised by four distinct phases: G1, S, G2 and M.
Transition between these states is carefully controlled to ensure that deleterious
events in one stage are not left uncorrected before the next stage commences167.
Human cells possess many inter-connected pathways, known as checkpoints, which
inspect the integrity of DNA before permitting the cell to proceed to the next phase
of the cell cycle (figure 1.3)168. The term 'checkpoint' has been expanded to include
the execution of more ambiguous responses such as apoptosis, DNA repair and
arrest of cell-cycle progression as a general phenomenon, independent of DNA
damage. For this reason, I reserve the use of ‘DNA-damage checkpoint’ exclusively
for signalling cascades which arrest, or slow, the cell cycle as a direct result of DNA
damage. In this context, checkpoints which monitor DNA damage are not uniquely
activated by such an event. Rather, they are continually operative pathways whose
members are upregulated during a damage response.
In most human cancers, aneuploid cells are often deficient in proteins which execute
various stages of the cell cycle checkpoints169–172. Often, multiple key checkpoint
proteins are mutated in a single cell, allowing the uncontrolled proliferation of
aneuploid cells with accumulating DNA damage and increased karyotypic
complexity. The underlying cause of this chromosomal instability (CIN) phenotype is
complex, but some studies suggest that the primary cause is due to improper mitotic
checkpoint signalling, allowing cells to proceed to anaphase with misaligned
chromosomes173.
The G1/S checkpoint, also known as the restriction point in human cells, prevents
entry into S-phase in response to DNA damage by preventing the initiation of
replication. Ionising radiation leading to double-strand breaks activates ATM which
phosphorylates Chk2 and p53. Chk2 initiates Cdc25a degradation or exclusion from
the nucleus resulting in p-Chk2 (inactive) accumulation, thereby preventing Cdc45
45
phosphorylation and hence preventing replication initiation174,175. UV light, and UV-
mimetic compounds, cause DNA damage which is recognised by ATR, leading to
Chk1 and Cdc25 phosphorylation-mediated arrest in G1. Regardless of which
pathway initiates the arrest, p53 is crucial for the maintenance of the G1/S arrest
which occurs several hours after DNA damage detection175. During this period, p53
becomes phosphorylated on ser15 and ser20, by Chk2 and Chk1 respectively,
preventing its export from the nucleus and activating target genes including p21
(inhibiting Cdk2-cyclin E S-phase progression)176,177. Inhibition of transition to S-
phase is also prevented by p21 binding to Cdk4-cyclin D, preventing Rb
phosphorylation which in turn inhibits E2F transcription factor-activation of S-phase
genes178.
Importantly, the G1/S checkpoint is activated precipitously in response to excision
repair processing cascades. In yeast, this has been shown in cells which are
deficient in excision repair exhibiting no S-phase entry delay following UV
radiation178. Interestingly, checkpoint activation occurs in these cells once they are
in S-phase, perhaps as a result of UV-induced photoproducts causing replication
blockade. The G1/S checkpoint is therefore critical for limiting the proliferation of
aneuploid cells.
The main signal transducers which promote this response are ATM and p53 – ATM
activates p53 leading to cell-cycle arrest and subsequently p53-mediated apoptosis.
This has been validated in vivo with p53 and ataxia-telangiectasia mutated kinase
(ATM) -null mice which develop thymic lymphomas with high levels of aneuploidy179.
Importantly these tumours exhibited elevated ROS, characteristic of aneuploid cells.
In these cells, ROS-induced oxidative DNA damage is thought to contribute to the
activation of ATM which prompted the speculation of an ‘aneuploidy checkpoint’180.
It is known that p53 is one of the most commonly mutated genes in cancer, with p53-
/- tumours exhibiting high levels of aneuploidy and chromosomal instability181. It is
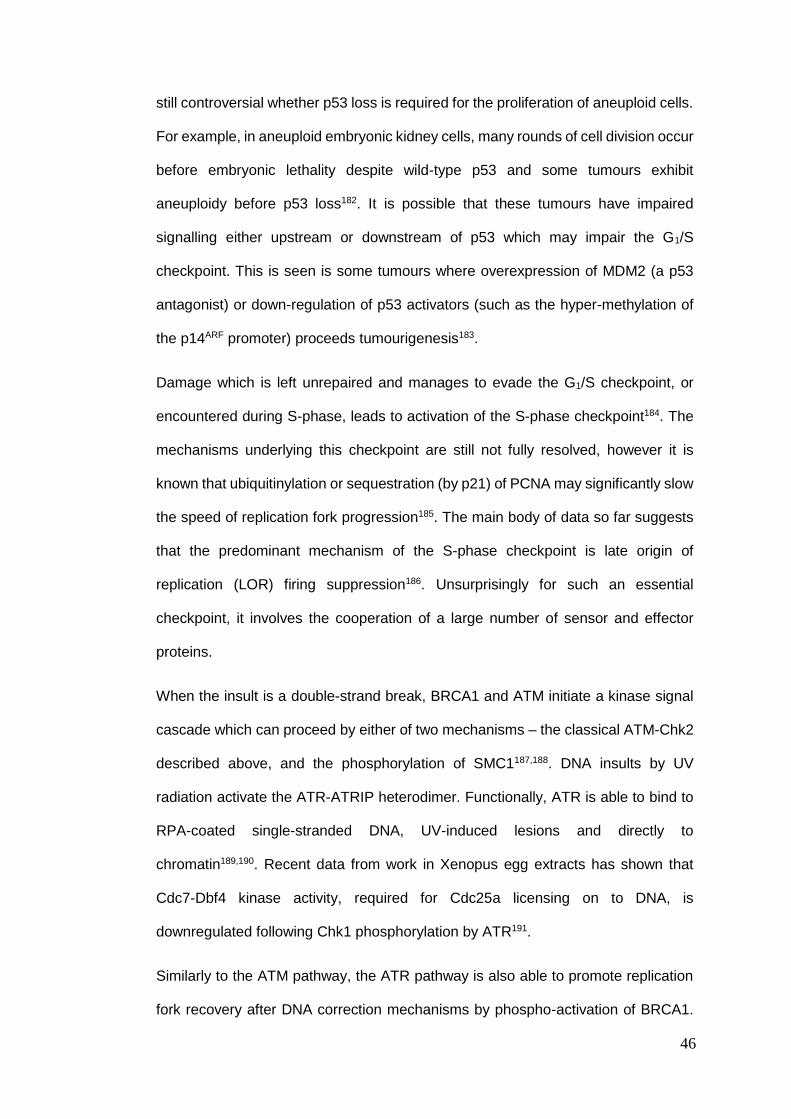
46
still controversial whether p53 loss is required for the proliferation of aneuploid cells.
For example, in aneuploid embryonic kidney cells, many rounds of cell division occur
before embryonic lethality despite wild-type p53 and some tumours exhibit
aneuploidy before p53 loss182. It is possible that these tumours have impaired
signalling either upstream or downstream of p53 which may impair the G1/S
checkpoint. This is seen is some tumours where overexpression of MDM2 (a p53
antagonist) or down-regulation of p53 activators (such as the hyper-methylation of
the p14ARF promoter) proceeds tumourigenesis183.
Damage which is left unrepaired and manages to evade the G1/S checkpoint, or
encountered during S-phase, leads to activation of the S-phase checkpoint184. The
mechanisms underlying this checkpoint are still not fully resolved, however it is
known that ubiquitinylation or sequestration (by p21) of PCNA may significantly slow
the speed of replication fork progression185. The main body of data so far suggests
that the predominant mechanism of the S-phase checkpoint is late origin of
replication (LOR) firing suppression186. Unsurprisingly for such an essential
checkpoint, it involves the cooperation of a large number of sensor and effector
proteins.
When the insult is a double-strand break, BRCA1 and ATM initiate a kinase signal
cascade which can proceed by either of two mechanisms – the classical ATM-Chk2
described above, and the phosphorylation of SMC1187,188. DNA insults by UV
radiation activate the ATR-ATRIP heterodimer. Functionally, ATR is able to bind to
RPA-coated single-stranded DNA, UV-induced lesions and directly to
chromatin189,190. Recent data from work in Xenopus egg extracts has shown that
Cdc7-Dbf4 kinase activity, required for Cdc25a licensing on to DNA, is
downregulated following Chk1 phosphorylation by ATR191.
Similarly to the ATM pathway, the ATR pathway is also able to promote replication
fork recovery after DNA correction mechanisms by phospho-activation of BRCA1.
47
Work in yeast has demonstrated that replication fork arrest can be initiated by the
presence of lesions in replicating DNA192. The recovery of such regions is dependent
on the activity of the recombination proteins MUS81 and Rad51193. Mutant yeast
strains in which these genes have been knocked out, or disrupted, accumulate lethal
double-stranded DNA breaks with long single-stranded intermediates194,195. The
occurrence of these breaks is not random in the genome, certain areas are more
susceptible than others. For example, in human cells, ATR depletion is known to
cause breaks in regions of the genome that replicate slower than others – known as
fragile sites196.
The G2/M boundary is the final fail-safe guarding cells from entering mitosis with
damaged DNA. If damage is detected, either ATR-Chk1 or ATM-Chk2 signalling
cascades arrest cells in G2, however the maintenance of arrest is predominantly by
ATM-Chk2197. Cells are prevented from entering mitosis by the down-regulation of
Cdc25 which modulates Cdc2-Cyclin B activity164. Early experiments interrogated
Cdc25C-knockout mutant mice strains, revealing that Cdc25C is not essential for
checkpoint activation. Rather, the phosphatase activity of Cdc25A was shown to be
essential for G2/M checkpoint activation following ionising radiation (IR)198. In
addition, it is known that p38 and p38α are also important following IR and UV
respectively199,200.
48
Figure 1.3. Cell cycle checkpoints and regulation. The cell cycle is regulated by
a network of signalling cascades, which maintains genome fidelity. Progression
through each of the four phases (G1, S, G2 and M) is controlled by cyclins and cyclin-
dependent kinases (CDKs). Errors occurring during DNA replication at S-phase, or
exogenous DNA damage accumulating throughout the cell cycle, restrict entry into
mitosis until each checkpoint has been satisfied.
49
1.2.2. Replication stress Replication of eukaryotic DNA is initiated from many origins, which are each
'licensed' by proteins which signal the start of S-phase201–204. The timing of
replication at each origin is carefully orchestrated to ensure that nucleic acid
resources, the accuracy and the speed are replication are balanced appropriately.
There are many factors which can impede DNA synthesis, leading to the slowing,
stalling and collapsing of replication forks – this is known as replication stress205–
207. Replication stress can be thought of as a specialised form of DNA damage which
has profound implication for genomic stability and cell survival. Unsurprisingly then,
there are effector kinases that are shared between both replication stress and DNA
damage pathways; the main sensors and effectors of replication stress being ATM
and ATR208–210. Replication stress is rather unusual, compared to direct DNA
damage, in the sense that the major underlying causes appear to be endogenous.
1.2.2.1. Replication-transcription collisions The machinery for both transcription and replication operate on
DNA simultaneously. Recent data has identified regions of the genome which are
highly transcribed, particularly susceptible to double-strand breaks
and replicated during early S-phase211. These are known as 'early replication fragile
sites', and highlight the importance of collisions between protein complexes on DNA
with separate agendas. It has been shown that, in some cases, DSBs can occur
even before the convergence of the replication-transcription machinery at the
nuclear periphery. This phenotype is surprising at it reveals that replication stress
might be increased by the tethering of actively-transcribed genes to nuclear pore
complexes212. The sequence of DNA itself may also determine its fragility to
replication stress. For example: nascent RNA transcripts with particular AT/GC
content have a propensity to form R-loop structures by re-hybridising with DNA
emerging from behind the transcription complex, leading to polymerase stalling and
50
the replication fork collapsing213. Alternatively, if there is insufficient RNA-processing
capacity at certain sites then this may inhibit dissociation of the replication complex
from DNA, indirectly causing replication stress. To avoid these situations, human
cells have the capacity to resolve R-loops by helicase and topoisomerase activity
together with RNA-processing complexes that serve to prevent RNA from re-
annealing with DNA214,215.
1.2.2.2. Restarting at collapsed forks If replication stress persists, or replication stress response pathways are abrogated,
the fork may collapse. Recent data in mice and yeast suggest that ATR is crucial in
restarting collapsed forks by recruiting and stabilising replication machinery in
addition to preventing 'replisome' disengagement216,217. It has been shown that DNA
breaks can occur following the collapse of a replication fork. Interestingly, treatment
of human cells with fork-stalling agents leads to the presence of detectable breaks
as early as four hours after fork collapse218. If the ATR pathway is abrogated in these
cells, activation of DNA-PK and ATM are rapidly recruited to DSBs which may
functionally compensate for ATR’s absence219.
It is thought that double strand breaks occur at collapsed forks as a result of
endonuclease attack on persistent ssDNA or nucleotide gaps behind the fork194.
Alternatively, the cell may be in a futile effort to correct stalled fork structures by
initiating recombination or endonucleolytic cleavage repair pathways218. Curiously,
fork structure resolution occurs significantly more frequently in the absence of
signalling by ATR. One possibility is that HR-mediated processing of cleaved
nucleotides in the absence of ATR permits fork restart without a checkpoint
response, which may lead to permanent stalling of the replication fork220. If a fork
reverses inappropriately, nascent-synthesised DNA is prone to degradation;
although more recent data also suggest that reversal may, paradoxically, promote
51
fork restart and decrease the formation rate of DNA breaks by sheltering
neighbouring DNA220.
1.2.2.3. Replication stress in cancer
The timing of DNA polymerase activity at replication origins is crucial. It has been
shown that re-replication and unscheduled initiation at these origins in human cells
is controlled by Cdt1221,222. Overexpression of Cdt1 is associated with epithelial
cancers with high-incidence of replication fork collisions and DNA breaks; an
observation which can be recapitulated by injection of premalignant CDT1-
overexpressing human cells into mice, generating genetically heterogeneous
tumours223–225. Importantly, it has been shown that replication stress and impaired
replication fork progression are present in human colorectal cancers (CRC) and are
sufficient to promote chromosome missegregation, leading to aneuploidy226.
Interestingly, this phenotype could be alleviated by supplementing chromosomally
unstable colorectal cancer cells with nucleosides to suppress replication stress,
suggesting that this mechanism plays a central role in maintaining the fidelity of the
genome. This worked also demonstrated the existence of CIN-suppressor genes
located on chromosome 18q which are subject to recurrent loss in CRC. Taken
together these data provide evidence for a causal link between CIN and aneuploidy
in vivo and show that there may be selective pressures for the generation and
maintenance of discreet aneuploid karyotypes between tumour types.
It has been shown that the ATR pathway is upregulated in several cancer types, and
that overexpression of ATR can lead to aneuploidy227,228. This is important as it
known that loss of ATR in p53 null cells, or cells with oncogene-induced replication
stress undergo senescence or apoptosis229–231. Together these data suggest that
cancer cells depend on ATR for the maintenance of a CIN phenotype, and that
52
targeting ATR therapeutically may provide a mechanism for selective cell death in
CIN+ tumour cells232.
1.2.3. The spindle assembly checkpoint
The spindle assembly checkpoint (SAC) detects unattached kinetochores, and
delays anaphase onset until all chromosomes are attached on the spindle233. The
Achilles heel of this molecular switch is that merotelic attachments, single
kinetochores attached to microtubules from both spindle poles, are not detected by
the SAC and these chromosomes can become trapped at the spindle equator during
anaphase. Some data show that most of these ‘lagging’ chromosomes are
eventually segregated to the correct cell; however, a proportion do not and result in
aneuploid progeny234,235. There are many ways in which merotelic attachments can
occur, and an elevated rate of merotelic attachments is a hallmark of CIN cancer
cells236. The mitotic checkpoint complex (MCC) is responsible for this ‘wait
anaphase’ signal and is comprised of a number of key proteins and signalling
effector kinases including Mps1, MAD2, Bub1 and BUBR1. In mouse models of
mosaic variegated aneuploidy, it has been shown that there is inactivation of
BUBR1, demonstrating that disruption of MCC signalling is sufficient to disrupt
faithful chromosome segregation237. However, the presence of MCC gene mutation
in human cancers is rare and some data suggests that MCC gene methylation is a
more common route to SAC disruption leading to CIN238,239.
During the wait anaphase signal by the SAC/MCC, microtubule-kinetochore
attachments are dynamically regulated by Aurora-B kinase which regulates
microtubule turnover allowing merotelically attached kinetochores to be resolved
before anaphase240. Aurora-B is also directly involved in the separation of duplicated
centrosomes and, when overexpressed, centrosome amplification240. It has been
shown that cancer cells cluster their extra centrosomes to form a pseudo-bipolar
53
spindle which permits bipolar cell division with an increased incidence of merotelic
attachments and chromosome missegregation241,242. Together with Aurora-B kinase
there are two main microtubule depolymerising proteins, MCAK and KIF2B, which
reside at the kinetochore and are involved with the correction of erroneous
attachments. Experimental knockdown of MCAK has been shown to increase the
frequency of lagging chromosomes, and it has been reported that MCAK inactivating
mutations are present in CIN colorectal cancer243,244. Taken together, these data
suggest that merotelic attachments can lead to aneuploid daughter cells and provide
a mechanism for the continual karyotype shuffling observed in many cancers.
1.2.4. Chromosome cohesion abnormalities
The cohesin complex is a ring-like structure which holds sister chromatids together
until the onset of anaphase. At the metaphase-anaphase transition, this complex
must be removed allowing the separation of genetic material134,245. STAG2, the main
structural subunit of the cohesin complex, has been shown to play a fundamental
role in maintaining the stability of the genome272. The relationship between STAG2
and chromosomal instability is complicated; in vitro knockdown of STAG2 in non-
CIN cancer cell lines is correlated with increased aneuploidy and decreased
cohesin, while genome sequencing of acute myeloid leukaemia (AML) samples
revealed that very few STAG2 mutations are coincident with CIN246. The disparity
between these results may be explained by recent work demonstrating that STAG2-
dependent aneuploidy may be tissue specific, and likely to be linked to its secondary
role as a transcriptional regulator247.
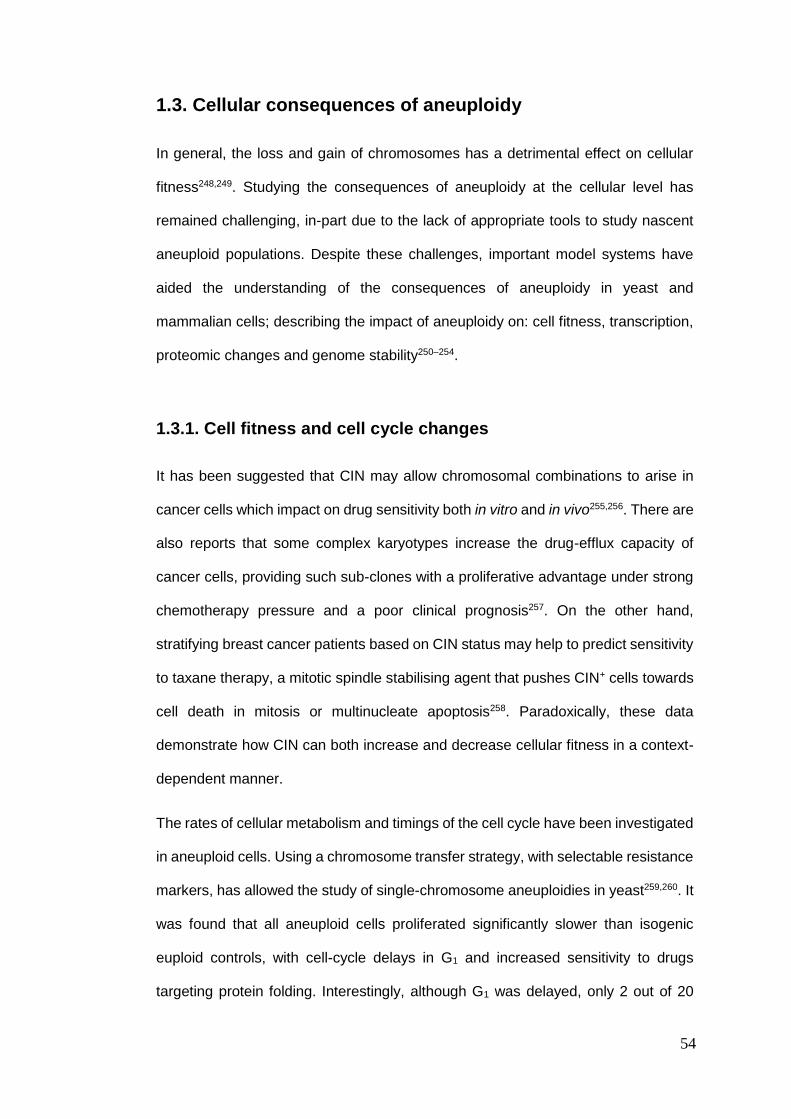
54
1.3. Cellular consequences of aneuploidy
In general, the loss and gain of chromosomes has a detrimental effect on cellular
fitness248,249. Studying the consequences of aneuploidy at the cellular level has
remained challenging, in-part due to the lack of appropriate tools to study nascent
aneuploid populations. Despite these challenges, important model systems have
aided the understanding of the consequences of aneuploidy in yeast and
mammalian cells; describing the impact of aneuploidy on: cell fitness, transcription,
proteomic changes and genome stability250–254.
1.3.1. Cell fitness and cell cycle changes
It has been suggested that CIN may allow chromosomal combinations to arise in
cancer cells which impact on drug sensitivity both in vitro and in vivo255,256. There are
also reports that some complex karyotypes increase the drug-efflux capacity of
cancer cells, providing such sub-clones with a proliferative advantage under strong
chemotherapy pressure and a poor clinical prognosis257. On the other hand,
stratifying breast cancer patients based on CIN status may help to predict sensitivity
to taxane therapy, a mitotic spindle stabilising agent that pushes CIN+ cells towards
cell death in mitosis or multinucleate apoptosis258. Paradoxically, these data
demonstrate how CIN can both increase and decrease cellular fitness in a context-
dependent manner.
The rates of cellular metabolism and timings of the cell cycle have been investigated
in aneuploid cells. Using a chromosome transfer strategy, with selectable resistance
markers, has allowed the study of single-chromosome aneuploidies in yeast259,260. It
was found that all aneuploid cells proliferated significantly slower than isogenic
euploid controls, with cell-cycle delays in G1 and increased sensitivity to drugs
targeting protein folding. Interestingly, although G1 was delayed, only 2 out of 20
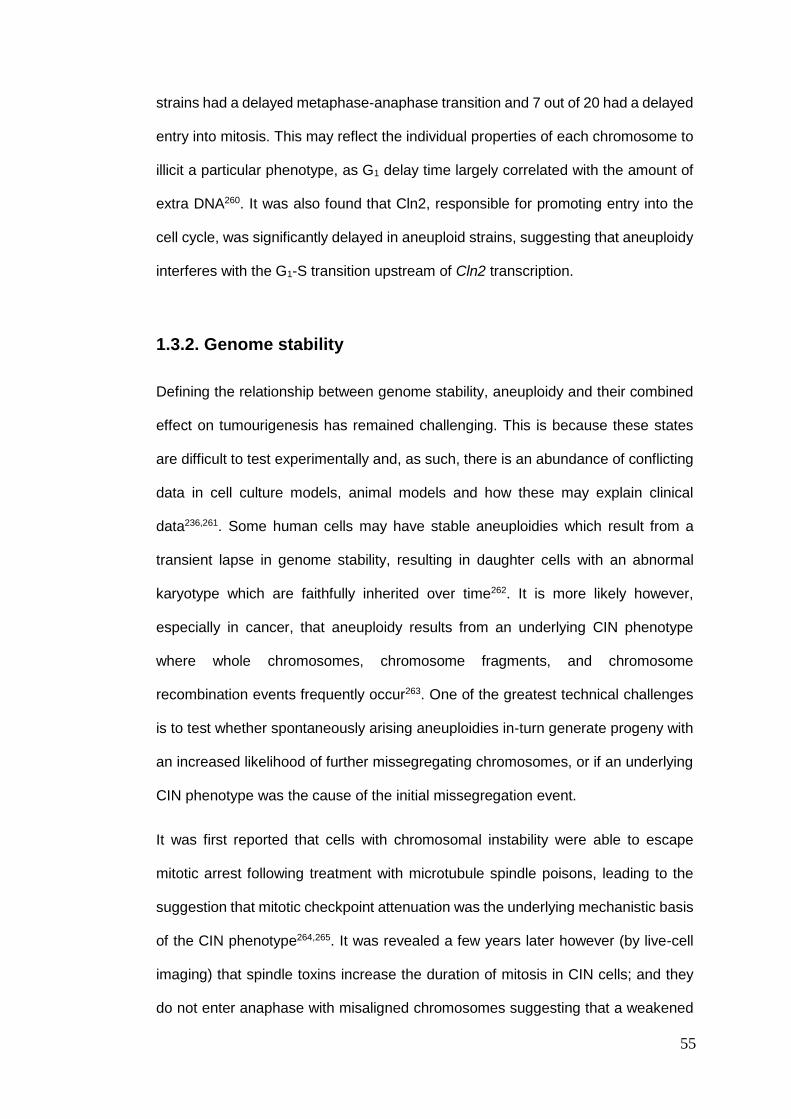
55
strains had a delayed metaphase-anaphase transition and 7 out of 20 had a delayed
entry into mitosis. This may reflect the individual properties of each chromosome to
illicit a particular phenotype, as G1 delay time largely correlated with the amount of
extra DNA260. It was also found that Cln2, responsible for promoting entry into the
cell cycle, was significantly delayed in aneuploid strains, suggesting that aneuploidy
interferes with the G1-S transition upstream of Cln2 transcription.
1.3.2. Genome stability
Defining the relationship between genome stability, aneuploidy and their combined
effect on tumourigenesis has remained challenging. This is because these states
are difficult to test experimentally and, as such, there is an abundance of conflicting
data in cell culture models, animal models and how these may explain clinical
data236,261. Some human cells may have stable aneuploidies which result from a
transient lapse in genome stability, resulting in daughter cells with an abnormal
karyotype which are faithfully inherited over time262. It is more likely however,
especially in cancer, that aneuploidy results from an underlying CIN phenotype
where whole chromosomes, chromosome fragments, and chromosome
recombination events frequently occur263. One of the greatest technical challenges
is to test whether spontaneously arising aneuploidies in-turn generate progeny with
an increased likelihood of further missegregating chromosomes, or if an underlying
CIN phenotype was the cause of the initial missegregation event.
It was first reported that cells with chromosomal instability were able to escape
mitotic arrest following treatment with microtubule spindle poisons, leading to the
suggestion that mitotic checkpoint attenuation was the underlying mechanistic basis
of the CIN phenotype264,265. It was revealed a few years later however (by live-cell
imaging) that spindle toxins increase the duration of mitosis in CIN cells; and they
do not enter anaphase with misaligned chromosomes suggesting that a weakened
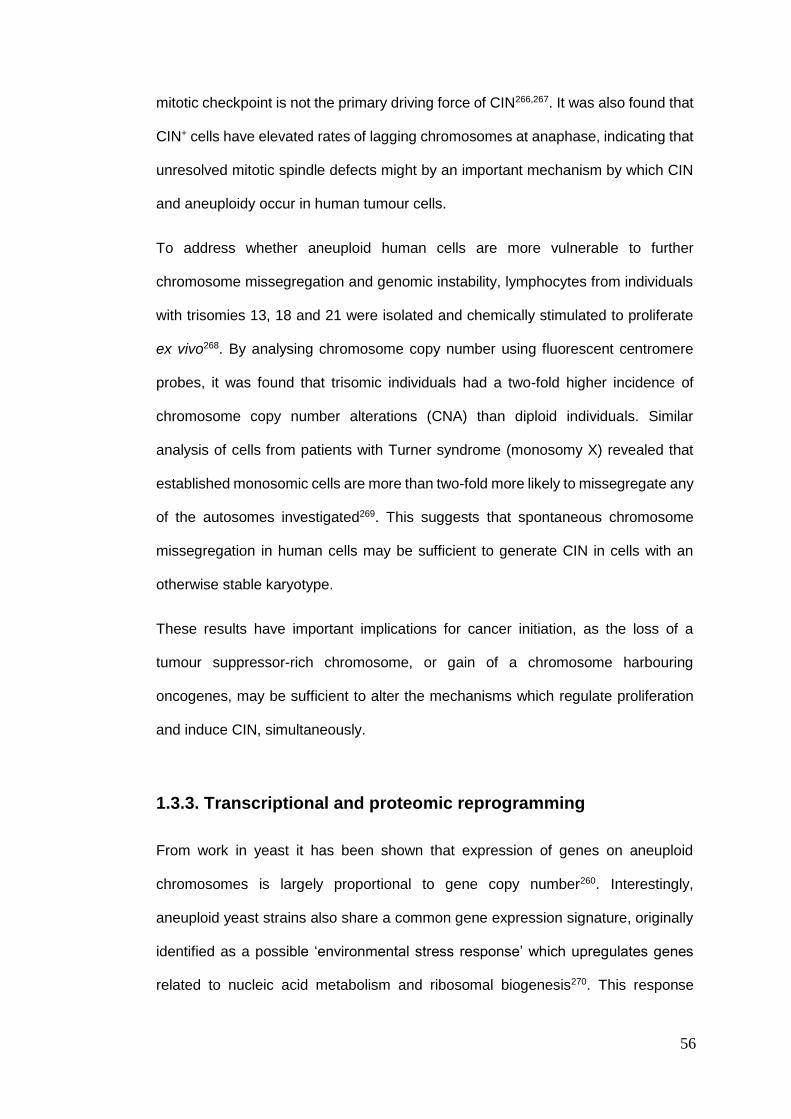
56
mitotic checkpoint is not the primary driving force of CIN266,267. It was also found that
CIN+ cells have elevated rates of lagging chromosomes at anaphase, indicating that
unresolved mitotic spindle defects might by an important mechanism by which CIN
and aneuploidy occur in human tumour cells.
To address whether aneuploid human cells are more vulnerable to further
chromosome missegregation and genomic instability, lymphocytes from individuals
with trisomies 13, 18 and 21 were isolated and chemically stimulated to proliferate
ex vivo268. By analysing chromosome copy number using fluorescent centromere
probes, it was found that trisomic individuals had a two-fold higher incidence of
chromosome copy number alterations (CNA) than diploid individuals. Similar
analysis of cells from patients with Turner syndrome (monosomy X) revealed that
established monosomic cells are more than two-fold more likely to missegregate any
of the autosomes investigated269. This suggests that spontaneous chromosome
missegregation in human cells may be sufficient to generate CIN in cells with an
otherwise stable karyotype.
These results have important implications for cancer initiation, as the loss of a
tumour suppressor-rich chromosome, or gain of a chromosome harbouring
oncogenes, may be sufficient to alter the mechanisms which regulate proliferation
and induce CIN, simultaneously.
1.3.3. Transcriptional and proteomic reprogramming
From work in yeast it has been shown that expression of genes on aneuploid
chromosomes is largely proportional to gene copy number260. Interestingly,
aneuploid yeast strains also share a common gene expression signature, originally
identified as a possible ‘environmental stress response’ which upregulates genes
related to nucleic acid metabolism and ribosomal biogenesis270. This response
57
appears to be evolutionarily conserved across plants, yeast mice and humans,
although the cause, nature and mechanism remain unclear254. In human cells, the
presence of an extra chromosome has been shown to upregulate pathways involved
with energy metabolism and autophagy, and causes down-regulation of DNA and
RNA synthesis pathways251. Recent work has used a novel strategy to silence the
extra copy of chromosome 21 in cells from Down syndrome patients271. It was
demonstrated that genetic insertion of the X-inactivation gene on chromosome 21
could promote transcription repression through similar mechanisms as for the
inactive X chromosomes in females. Silencing of the one extra copy of chromosome
21 by this method resulted in an 18-34 % increase in cell growth rate, suggesting
that transcription is partly responsible for the compromised proliferation rate of
aneuploid human cells. Importantly, chromosome silencing did not rescue
proliferation to wild type levels, reflecting the multifactorial response to trisomy and
that extra DNA alone, regardless of transcriptional state, may be sufficient to slow
cellular growth. If there is an aneuploidy-sensing mechanism hard-wired into cells
that regulates transcription, it raises the exciting possibility that it can be exploited
therapeutically to target tumour cells whilst sparing healthy diploid cells.
The correlation between transcription and the proteome in aneuploid cells is unclear.
Although gene expression is proportional to gene copy number, it has been shown
that many proteins encoded by additional chromosomes do not scale in the same
manner260. Importantly, many of the proteins that do not are part of larger multi-
protein complexes, suggesting that protein stoichiometry imbalances may be
influencing the proteolytic pathways in aneuploid cells251. This is an attractive
hypothesis as it fits with the data demonstrating that aneuploid cells have a higher
energetic demand, possibly due to the synthesis and degradation of superfluous
proteins, and are sensitive to chemical inhibition of protein synthesis and
folding260,272.
58
More recently, proteomic dosage compensation has been observed in human cells
in response to trisomy and tetrasomy, and post-translational mechanisms have been
shown to further self-attenuate protein expression when the genes encoding them
are present in excess250,251. This proteomic analysis further revealed the existence
of a novel aneuploidy-related proteomic signature which is characteristic of redox
homeostasis and altered metabolism, which could be alleviated by increasing
protein turnover.
These results demonstrate that aneuploidy is sufficient to alter the metabolism and
redox state of human cells which is subject to a negative feedback loop by both post-
transcriptional and post-translational mechanisms. Both of these are important
factors which increase the energetic burden in cells with abnormal karyotypes.
1.3.4. Aneuploidy tolerance
Human neurons and hepatocytes are known to harbour non-diploid chromosome
complements271,273. Surprisingly, where they do arise, these aneuploidies do not
appear to be deleterious to cellular function, and are not thought to predispose to
tumourigenesis274. The mechanisms which allow some cell types to tolerate
aneuploidy are currently unknown, and careful comparison with non-quiescent cells
may reveal important transcriptional/proteomic reprogramming which occurs during
cancer development and confers similar tolerance to a non-diploid genome.
There are thought to be numerous ways that cells can buffer the deleterious effects
of aneuploidy. One hypothesis is that polyploidy, the entire genome present in
multiple copies, may dilute the protein stoichiometric imbalances of a single extra
chromosome302. It has been shown that there may be a strong selective pressure
for this phenotype during tumour evolution, as many cancer types have a near
tetraploid karyotype275,276. Further evidence of the need for superfluous-protein
59
regulation as a prerequisite to aneuploidy tolerance has been demonstrated by
inactivation of UBP6305. UBP6 is a deubiquitinylating enzyme which regulates the
activity of the proteasome. When UBP6 is inactivated, proteasomal turnover of
proteins is accelerated and provides aneuploid yeast strains with a mechanism for
reducing the proteotoxic effect of uncomplexed cytosolic proteins277,278. Upregulation
of the proteasome by this mechanism was shown to be strongly correlated with
increased aneuploid yeast proliferation rates. It has yet to be determined whether
phenotypically-equivalent mutations are present in human cancers cells, and the
subsequent impact this may have on proliferative capacity.
The integrity of DNA and progression of the cell cycle are tightly controlled by
regulatory pathways which provide feedback to p53, a key cell cycle regulator.
Aberrations which compromise any part of these processes ultimately lead to p53-
dependent cell cycle arrest or delays, and it has been shown that this is also true for
aneuploid cells180,267,279,280. Accordingly, it is unsurprising that p53 inactivation is a
common occurrence in human cancers, acting as a driver of tumourigenesis and
strongly correlated with a poor clinical outcome279. Interestingly, it has been shown
that p53 mutations can act synergistically with progesterone, but not estrogen,
stimulation to significantally increase chromosomal instability and aneuploidy in
mammary epithelial cells281. Importantly, this reveals the existence of tumour
microenvironment-specific differences in tumour suppressor inactivation and extent
of aneuploidy in vivo.
60
1.4. The Aneuploidy-CIN relationship in cancer
Despite widespread aneuploidy in human cancers, there is little consensus on the
exact role aneuploidy and chromosomal instability play in tumour development and
progression. Much of the in vivo work to study chromosomal abnormalities has relied
on mouse models with a spectrum of abnormalities in the key cell cycle checkpoints
described above. The reliability and similarity to human carcinogenesis in these
models is a topic of debate but have revealed that, somewhat paradoxically,
aneuploidy and chromosomal instability can both promote and inhibit
tumourigenesis256,282–284. The ubiquitous nature of aneuploidy across almost all
cancer types is starting to be recognised as an important therapeutic target and is
an active area of research.
1.4.1. Promoting tumourigenesis
It has been shown that mitotic checkpoint dysfunction, by overexpression of genes
regulating the checkpoint, can lead to aneuploidy. Importantly, this is also true in
human cancers, where overexpression of spindle assembly checkpoint genes
occurs more frequently than their inactivation285. Experimentally, it has been shown
that overexpression of mitotic check-point complex (MCC) protein MAD2 produces
aneuploid tumours in various tissues including hepatomas, adenomas and, in some
cases, intestinal tumours286,287. Interestingly, transient MAD2 overexpression is
sufficient to promote tumour formation, suggesting that sustained mitotic checkpoint
abnormalities are not a prerequisite for this phenotype314. Importantly, this may
reflect the nature of aneuploid cells to perpetuate their own transformation through
increased chromosomal instability. It has also been observed that the degree of
overexpression of the outer-kinetochore protein HEC1 is correlated with the
formation of aneuploid tumours in mice, and is a poor prognostic indicator in human
61
cancers288. These data suggest that there is a strong mechanistic relationship
between cells with abnormal microtubule-kinetochore attachments, CIN and
aneuploidy in vivo.
It has been demonstrated, through the analysis of array-based comparative genomic
hybridisation (aCGH) and cytogenetics, that solid tumours show preferential loss of
small chromosomes289. It is also reported that patients with chronic myeloid
leukaemia have a significantly elevated rate of small chromosome gain; raising the
possibility that the tumour microenvironment plays an important role in the
propensity for different aneuploidies between malignancy types290. The most
common aneuploidies in human gametes include chromosomes 21, 22, X and Y in
sperm cells and chromosomes 16, 21 and 22 in oocytes291–293. Interestingly these
also occur most frequently during early-stage astrocytomagenesis, potentially
reflecting the nature of solid tumour cells to spontaneously lose small chromosomes,
independent of oncogenic potential289.
The recurrent gain of specific chromosomes in tumour cells supports the hypothesis
that the loss of tumour suppressor genes, or the gain of oncogenes, through CIN
mechanisms facilitates oncogenesis. For example, individuals with Down’s
syndrome (trisomy 21) are at a significantly higher risk of developing acute myeloid
leukaemia and acute lymphoblastic leukaemia294,295. This is compounded by the
observation that an extra copy of chromosome 21 is often present in haematological
cancers, suggesting there may be a context-dependent selective pressure for
cancer cells with discrete karyotypes235. Additionally it has also been shown that
chromosomal instability, as a result of replication stress, can lead to the recurrent
loss of three tumour suppressors on chromosome 18q, providing a putative
mechanism which could drive CIN in colorectal cancers226. Taken together these
data suggest that aneuploidy and CIN can facilitate and drive tumourigenesis.
62
1.4.2. Inhibiting tumourigenesis
Having established that the majority of aneuploidy and CIN phenotypes are
tumorigenic, it is important to highlight that they can also inhibit tumour formation in
a highly context-dependent manner256,296,297. It has been shown that inducing
excessive CIN by treatment with spindle poisons leads to cell death following a gross
aneuploidy phenotype, but the presence of CIN in cancer suggests there may be an
optimal level of genome instability which is sufficient for tumour progression, without
catastrophic genomic dysfunction298.
Accordingly, it has recently been shown that the stratification of breast cancer
patients on their ‘CIN score’ correlated with a poor prognosis; that is until a threshold
of CIN was reached after which increasing genome instability correlated with
increased survival outcome255. This suggests that aneuploidy and chromosomal
instability are only tumourigenic within given limits, and raises the possibility that
raising CIN beyond this threshold could be a novel therapeutic approach.
Returning to the example of trisomy 21, it is important to note that although there is
a significant increased risk of leukemias, the incidence of solid tumours is markedly
decreased299. These inhibitory effects have been investigated and reported linked to
two key genes encoded on chromosome 21: DYRK1A and DSCR1. Although the
underlying mechanism has not been fully elucidated, it is known that these genes
are involved with the inhibition of the calci-neurin pathway of tumour
angiogenesis300.
It has also been reported that aneuploidy can inhibit tumourigenesis in tissues which
are already prone to tumour formation, such as the liver301. By heterozygous deletion
of one allele of CENP-E, a centromere protein important for chromosome
congression, it was observed that the formation of spontaneous liver tumours was
decreased by 50%301. Additionally it was also observed that when liver tumours did
63
occur in CENP-E+/- mice they were significantly reduced in volume, suggesting that
mitotic dysfunction in cells with an inherent propensity to missegregate
chromosomes can act as a tumour suppressive mechanism.
1.4.3. Aneuploidy as a therapeutic target
Therapeutic targeting of aneuploid human cells, whilst sparing diploid cells, is a very
active research area with high impact potential. Many of the current compounds
exploit the perturbed processes of metabolism and protein production in aneuploid
cells ultimately leading to cell death and arrest through uncharacterised
mechanisms. One such molecule is 17-AAG, an inhibitor of the protein-folding
chaperone Hsp90 which associates with the endoplasmic reticulum272. Reducing the
protein folding capacity of aneuploid cells that are already under proteotoxic stress
is hypothesised to lead to AMP-mediated cell death. Further supporting this model,
combination therapy of 17-AAG and AICAR, an energy stress-inducing compound,
in trisomic mouse embryonic fibroblasts and human cell lines significantly reduced
their proliferation compared to diploid control cells272. However it has been shown
recently that these compounds are associated with unacceptably high side-effects
in phase II clinical trials, but provide preliminary evidence that it is possible to target
aneuploid cells specifically with small molecules302,303.
More recently, the idea of targeting CIN cells specifically has been suggested.
Cancer cells have been shown to cluster extra centrosomes to allow a pseudobipolar
mitosis with increased incidence of merotelic attachments241. In the absence of a
pseudobipolar spindle, cells proceed through mitosis with multipolar spindles
leading to cell death304. An RNAi screen identified HSET, a kinesin motor protein
involved in microtubule trafficking, as an important effector protein for extra
centrosome clustering. Importantly, it has been shown that HSET is expendable in
normal cells, possibly because there is some functional overlap with other kinesin

64
motor proteins, suggesting it may be possible to induce cell death in cells with extra
centrosomes. Excitingly, small-molecule HSET inhibitors are already in clinical
trials305,306.
65
1.5. Methods for detecting aneuploidy
Experimental technologies for investigating aneuploidy can be broadly grouped into
those which measure aneuploidy on a population-wide basis and those which give
single-cell resolution. One critical consideration for any technique is the over or
under estimation of aneuploidy rates due to the introduction of experimental
artefacts during sample preparation and analysis. More recent approaches have
tried to improve on legacy techniques by coupling high-throughput, population-
based analysis with single-cell resolution. Here I discuss the advantages and
disadvantages of the most widely used karyotype analysis techniques to detect
aneuploidies in human cells.
1.5.1. Comparative genomic hybridisation
Comparative genomic hybridisation (CGH) technologies are microarray-based
sequencing platforms which were developed to assess genomic aberrations in
cancer307,308. The development of array-CGH (αCGH) permitted, for the first time,
DNA copy number alterations to be correlated with population-wide chromosome
abnormalities thus transforming clinical cytogenetics. In traditional αCGH, genomic
DNA from a reference genome and the sample of interest are differentially
hybridised with two fluorescent probes which competitively bind to nucleic acid
targets immobilised on a solid support309. The amount of DNA hybridised to each
array position, expressed as a log2 ratio of fluorescent signal relative to the reference
genome, correlates with the ploidy of that particular genetic locus. There are two
main factors which determine the resolution of αCGH array – the density of genome
coverage and the size of the nucleic acid target. The most apparent benefit to using
αCGH over traditional FISH is that one is able to detect multiple DNA copy number
alterations simultaneously across the genome. These changes include
66
amplifications, deletions and duplications at any locus represented on the array. In
this way, αCGH can be thought of as a concurrent and coordinated FISH experiment
over thousands of loci, compared to traditional FISH which is limited by the
availability of fluorophores which can visualised simultaneously310.
Aneuploidy, in the broadest sense, encompasses both structural and numerical
chromosome aberrations. Therefore, as αCGH is based exclusively on DNA
hybridisation, it is unable to detect structural abnormalities such as inversions or
reciprocal translocations as these are not reflected by chromosomal content.
Additionally, only copy number changes which are present in the majority of the
population, and therefore above the intrinsic noise of the analysis, will be detectable
with αCGH311. These make αCGH unsuitable where subtle structural and numerical
aneuploidies are to be detected.
1.5.3. Single-cell sequencing
The rapid development of next-generation sequencing has significantally reduced
the cost and time to obtain a complete genome DNA sequence. This has realised
the possibility of sequencing individual cells and detecting aneuploidies on a cell-by-
cell basis. This has already been demonstrated for both mouse and human tissue
samples from the brain, liver and skin312. A critical step in single-cell sequencing
(SGS) is isolating and amplifying target DNA from individual cells. The isolation of
single cells can be achieved through FACS, cell pickers or, more crudely, serial
dilution. Preparation of the genomic library for sequencing begins with whole-
genome amplification (WGA), where DNA is fragmented and end-ligated to be
amplified by PCR. Libraries from individual sequencing lanes can subsequently be
demultiplexed, subjected to quality control and mapped onto the genome of
reference313.
67
The copy number variation (CNV) can be determined using a Hidden Markov model
which determines the read copy number for each genomic loci in turn, generating a
resolution that is equal to, or greater than, αCGH314. Importantly, determining faithful
chromosome copy number does not depend on high resolution sequencing data, as
only 0.5-1% DNA sequence coverage per cell is necessary.
Single-cell sequencing is less subject to artefacts than traditional FISH as thousands
of sequencing reads are analysed for each chromosome simultaneously, compared
to a small number of loci by FISH315,316. Additionally, the preparation of the library
and robotic fluidic systems can automate a large proportion of the wet lab work,
further reducing costs. Unfortunately, although next-generation sequencing (NGS)
is only a fraction of the former cost, it is still considered relatively expensive to
sequence enough individual cells to obtain representative population aneuploidy
rates, as a large number of single cells are required. Furthermore, it is not yet
possible, at low coverage, to detect inversions and balanced translocations which
precludes some usages, such as the study of chromothripsis317. It is also difficult to
amplify and sequence such small quantities of DNA without significant risk of
sequencing artefacts including GC bias during PCR amplification; although these
can be mitigated using well-designed bioinformatic tools318. As NGS costs continue
to drop precipitously, it is likely SCS will become a viable option for investigating
clinical aneuploidy.
1.5.4. Flow cytometry
The use of flow cytometry to detect chromosome copy number has increased
significantally in resolution in recent years and encompasses three broad
applications: DNA profiling, population chromosome copy number and single cell
chromosome copy number319–322.
68
DNA profiling is a term used to describe the intensity of fluorescent staining of DNA
intercalating dyes, where the intensity of DNA staining is proportional to the DNA
content of each cell (figure 1.4a). Its most common application is to determine the
cell cycle profile of a population, where cells in G2/M have approximately double the
fluorescence intensity of G1 cells. Cells in S-phase have a spectrum of DNA
intercalation between these two peaks. It is therefore possible to determine an
approximate value of the ploidy for a population of cells by comparing the DNA
profile of a sample population to a known diploid population – cells with aberrant
ploidy are shifted towards the higher end of the fluorescence spectrum. The data
from these experiments only provide a rough approximation of ploidy for two
reasons; firstly, the intercalation of DNA dye may be incomplete or dependent on
the cell type, which could cloak or distort subpopulation of cells. Secondly, aneuploid
cell populations may not be homogenous which gives rise to noisy DNA profiles with
less sharp peaks, particularly in cycling cells where there are a large number of
karyotype states or polyploidy which makes analysis difficult.
The variation between chromosomes, with respect to size and base pair content
ratio, lends favourably to interrogation with bivariate flow cytometry. Principally,
chromosomes are stained with chromomycin A3, which specifically binds GC-rich
DNA, and Hoechst 33258, with specificity for AT-rich DNA. These two dyes can be
resolved by flow cytometry on naked human chromosome DNA, not only by DNA
content, but by base pair ratio, which varies between each chromosome.
Chromomycin and Hoechst have excitation maxima which are sufficiently separated
that they can be excited by different lasers, however there is a considerable degree
of overlap in emission spectra. It is for this reason that the only flow cytometry
instruments capable of bivariate chromosome analysis have two spatially separated
lasers required to obtain spatially separated emissions from each dye.
69
The primary drawback of flow cytometry is that a consequence of the specialised
optical arrangement is a linear time delay between signals at the two detectors
requires highly sensitive compensation electronics to correct the elliptical laser
optics. Data output can be interpreted using a bivariate cluster algorithm, where
aneuploidies in single chromosomes can be detected as an increase in dot-plot
density in a given region (figure 1.4b)323. Chromosomes 9-12 are similar enough in
their AT and GC ratios that they are not resolved using this method, which obscures
aneuploidies of these chromosomes. Furthermore, bivariate chromosome analysis
is not sensitive enough to determine small translocations and deletions324. However,
larger structural chromosomal abnormalities may be visualised as a shift or
separation in two dimensions on the plot.
It has recently been shown that, using specialised image cytometry technologies
coupled with FISH, it is possible to visualise chromosome copy number alterations
in a high-throughput, single cell approach325. This is able to couple the high-
throughput requirements for population-based analysis with the resolution of single
cell sequencing. I discuss the precise application of this technology in chapter 6 and
demonstrate its practical applications for detecting aneuploidy in response to
environmental stresses.

70
Figure 1.4. DNA analysis by flow cytometry. (a) DAPI-stained populations of fixed
cells fluoresce proportional to their DNA content. Cell cycle profiles can determine
the proportion of cells at each stage of the cell cycle and detect polyploidy by
comparison to diploid population. (b) Staining chromosomes with chromomycin and
Hoechst can detect aneuploidy using bivariate chromosome flow analysis
(illustrative data points). Aneuploidy can be detected as an increase in the staining
number or density at a defined regions compared to diploid control cells. Adapted
from326.
71
1.5.5. Fluorescence in situ hybridisation
Population-based studies of aneuploidy can be analysed in both dividing and non-
dividing cells by decorating the DNA with fluorescent probes and/or DNA
intercalating agents. In simple metaphase preparations, stained only with
intercalating agents such as Giemsa, it is possible to detect a number of large
chromosome abnormalities including translocations, deletions, inversions,
insertions, amplifications as well as whole chromosome copy number variations327–
329. Coupling DNA banding staining with fluorescent probes against individual
genomic loci can help establish cytogenetic abnormalities with clinical phenotypes
such as the BCR-ABL translocation t(9;22)(q34;q11)330.The use of a single probes
to measure aneuploidy rates can introduce false positive and negative results if there
are duplication or deletions events at the probe-binding region which necessitates,
in some cases, the use of dual probes against subtly different regions of the same
chromosome, which can be expensive.
Additionally, the FISH procedure can introduce artefacts itself due to failure of probe
hybridisation, probe clustering, or incomplete metaphase spreading331,332. FISH on
interphase cells has the advantage of providing single cell copy number state and it
is possible to couple this information with immunofluorescence to determine to
down-stream spatial and temporal responses of aneuploidy with exquisite
resolution.
Whole-chromosome FISH paints permit spectral karyotyping analysis which reveal
whole chromosome copy number changes and gross genome translocation
events333–335. The process is moderately expensive as it requires the use of
chromosome-specific chromosome paint sets with five fluorescent dyes, which
barcode each chromosome in metaphase preparations. Importantly, both structural
and numerical aberrations can be detected using this method, which lends itself to
clinical applications where there are known disease drivers caused by chromosome

72
abnormalities. One important consideration for clinical oncology applications is the
process of aneuploidy speciation over time, as heterogeneous sub-populations
evolve in response to subtle microenvironmental pressures.
The very nature of sampling size in populations of genetically diverse tumour
samples therefore limits the probability that true aneuploidies are represented
faithfully by these analysis methods.
73
2. Aims and objectives
Develop a novel system to isolate nascent aneuploid cells
The earliest responses to chromosome missegregation in non-transformed cells are
largely unknown. In-part, this is due to technical limitations preventing the isolation
of cells within the few hours following chromosome loss. The first aim of this PhD
was to generate a novel, fluorescence-based aneuploidy reporter cell line to isolate
nascent aneuploid cells. Analysis of monosomic populations isolated using this
approach aimed to expose changes at the level of the transcriptome in response to
aneuploidy, within 12 hours of chromosome loss.
Determine the missegregation rates of individual chromosomes
A ubiquitous feature of cancer cells is elevated chromosome missegregation and
recurrent patterns of aneuploidy. The second aim of this PhD was to undertake the
first high-throughput and systematic approach to elucidate the missegregation rates
of individual human chromosomes in response to different cellular stresses. Further,
this PhD aimed to characterise the mechanisms underlying the most striking
differences between individual chromosome segregation error rates.
Elucidate the arrangement of metaphase chromosomes
The well-defined territories of interphase chromatin are intimately linked with
ordinary function. At present, the only data for metaphase territories are derived from
radial measurements in metaphase spreads, which are subject to significant
artefacts. The final aim of this PhD was therefore to develop an image analysis tool
to elucidate the arrangement of metaphase human chromosomes in the native
metaphase plate.

74
3. Materials and Methods
75
3.1. Tissue Culture Assays
3.1.1. Reagents and cell culture
All cells were maintained in sterile conditions at 37 ºC with 5% atmospheric CO2.
Cell culture media was supplemented with 10% (v/v) foetal bovine serum (FBS;
Gibco) and 1% (v/v) penicillin-streptomycin (Sigma). Cell lines were selected which
had previously been characterised as chromosomally stable (table 3.1).
Cell lines were grown as adherent monolayers and passaged through trypsinisation.
To trypsinise cells, media was removed by aspiration and cells were carefully
washed twice in phosphate-buffered saline solution (PBS) at room temperature for
30 seconds. PBS was removed and 1x trypsin-EDTA (Sigma) was incubated with
cells at 37ºC until cells had detached from the surface of the culture vessel. Cells
were fully resuspended in at least five times the volume of trypsin in appropriate
media supplemented with FBS - to inhibit the trypsin enzyme. Cells taken from this
suspension were used to seed new culture vessels, containing fresh media, at the
appropriate density for the application.
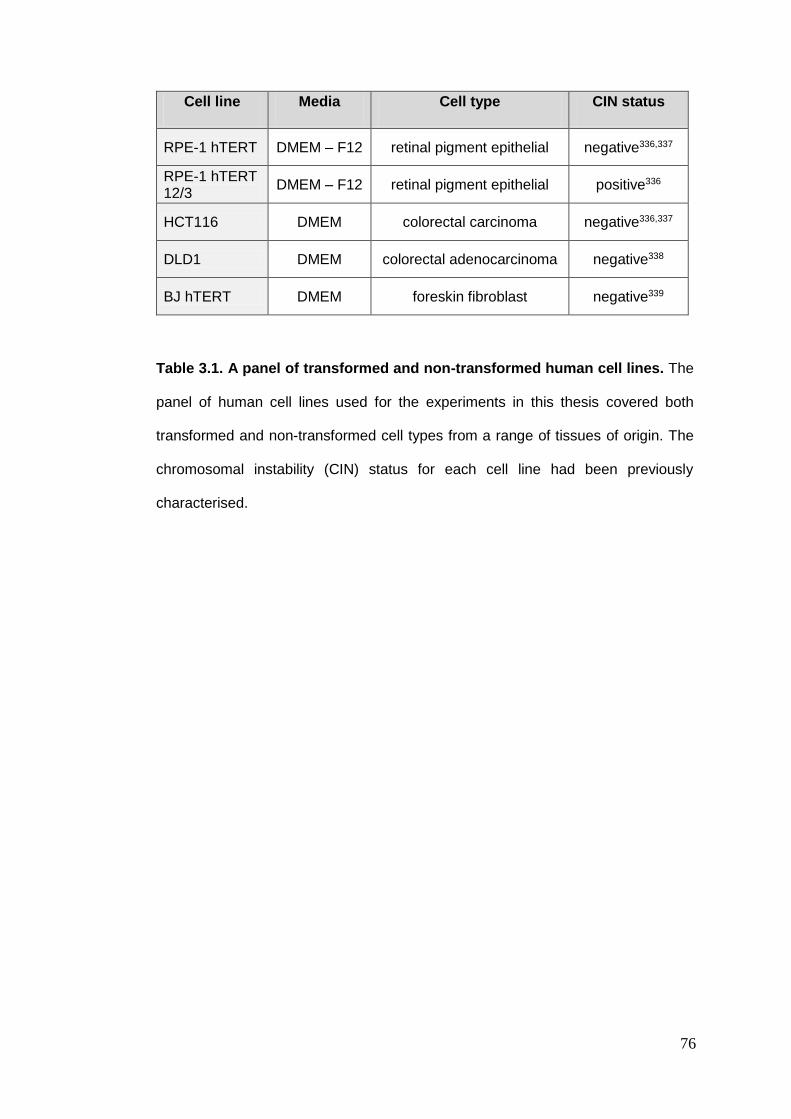
76
Table 3.1. A panel of transformed and non-transformed human cell lines. The
panel of human cell lines used for the experiments in this thesis covered both
transformed and non-transformed cell types from a range of tissues of origin. The
chromosomal instability (CIN) status for each cell line had been previously
characterised.
Cell line Media Cell type CIN status
RPE-1 hTERT DMEM – F12 retinal pigment epithelial negative336,337
RPE-1 hTERT 12/3
DMEM – F12 retinal pigment epithelial positive336
HCT116 DMEM colorectal carcinoma negative336,337
DLD1 DMEM colorectal adenocarcinoma negative338
BJ hTERT DMEM foreskin fibroblast negative339
77
3.1.2. Plasmid transfections
Adherent cell monolayers in 6-well dishes were grown to approximately 60 %
confluence for transfection. 6 µL Lipofectamine 2000 reagent (Life Technologies)
was diluted in 150 µL Opti-MEM reagent (Life Technologies) and added in a 1:1 ratio
with the required amount of plasmid DNA diluted in 700 µL Opti-MEM reagent.
Following incubation for five minutes at room temperature, 250 µL of the DNA-lipid
complex solution was added, drop-wise, to the surface of the media in each
transfection well. After 24 hours, the media was replaced and cells grown for a
further 24 hours. For stable cell line generation, transfected cells were passaged at
low density into culture vessels supplemented with media containing G418 at a final
concentration of 500 µg/mL (Sigma) to select for drug-resistant clones. The selection
media in each well was replaced every three days for two weeks, after which time
drug-resistant colonies had formed and were harvested for down-stream
applications.
3.1.3. Small-molecule perturbation of the cell cycle
Nocodazole is a microtubule depolymerising drug which arrests cells in mitosis as
they are unable to form a functional mitotic spindle. To arrest cells in mitosis, and to
induce chromosome missegregation, cells were treated with 100 nM nocodazole
(Sigma) dissolved in dimethyl sulfoxide (DMSO) for between 2 hours and 16 hours.
To allow microtubule re-polymerisation, nocodazole was washed out of cells by
completely replacing the media three times with PBS pre-warmed to 37 ºC for two
minutes each, followed by fresh media pre-warmed to 37 ºC, twice. Cells were
released from nocodazole for up to 24 hours to allow cells to proceed through
mitosis. A variation of this protocol includes the physical removal of mitotic cells from
the culture vessel by mitotic shake-off. Dislodgement of mitotic cells into suspension
is achieved by gentle shaking of the culture vessel. To release mitotic cells from
78
nocodazole, mitotic cells in suspension following shake-off were harvested by
centrifugation at 1,200 rpm for three minutes. The supernatant was aspirated and
cells were resuspended in the appropriate media pre-warmed to 37 ºC, twice.
To synchronise cells at the G2/M check-point, cells were treated with the CDK1
inhibitor RO-3306, dissolved in deionised water, for 14 hours at a final concentration
of 9 µM. To allow cells to proceed through the mitotic checkpoint, RO-3306 was
washed out of cells by completely replacing the media three times with PBS pre-
warmed to 37 ºC for two minutes each, followed by fresh media pre-warmed to 37
ºC, twice. In experiments requiring cells synchronisation prior to nocodazole
treatment, the final media wash contained 100 µM nocodazole.
3.1.4. Colony formation assay
Single cells sorted by FACS were counted in experimental triplicate using a
haemocytometer (BioRad) and 100 cells from each condition were seeded into 6-
well dishes from triplicate experiments and allowed to form colonies over a period of
10 days. After 10 days the number of colonies in each well were counted as follows.
Colonies were stained with 5 mL 0.01 % (w/v) Crystal Violet in deionised water for
one hour at room temperature on a rocker. Excess dye was removed and colonies
were dissolved in 1 mL 2 % (w/v) Triton X-100 for a minimum of 16 hours with
agitation. The optical density (OD) of 200 µL crystal violet-stained cell suspension
was read at 570 nm on an optical density plate reader (Victor2D - 1420, Perkin-
Elmer Inc.).
79
3.2. Fluorescence Microscopy
3.2.1. Live-cell imaging
Cells expressing a fluorescent histone H2B variant (H2B-RFP/GFP) were seeded
into live-cell imaging dishes at low density at least two days prior to filming, mounted
on an Olympus DeltaVision microscope (Applied Precision) and maintained at 37 ºC
in CO2-independent medium (L15, Sigma) for the duration of the experiment.
Additionally, the DeltaVision stage environment was maintained at 5 % CO2.
Proliferating cells were imaged by acquiring seven 2.0µm optical sections in the Z-
axis, with TRITC laser line band-pass filter (488/532 nm), at three-minute intervals
for three hours, followed by 15-minute intervals for between 24 and 72 hours. Movies
were analysed in the softWoRx Explorer 1.3 (Applied Precision). The timing of
mitotic events was determined by analysis of cells going through mitosis during the
three-minute time-lapse filming, to allow precise timings to be obtained. Nuclear
envelope break-down, congression of the last chromosome and anaphase onset
were easily identifiable at this temporal resolution. The fate of daughter cells was
followed in the 15-minute time-lapse period.
3.2.2. Immunofluorescence
Cells were seeded onto microscopy coverslips were treated with 9 µM RO-3306
(Santa-Cruz) and/or 100 µM nocodazole (Sigma). After treatment, cells were
washed once with 1x PBS, fixed and permeabilised with PTEMF solution (20 mM
PIPES pH 6.8, 0.2 %, Triton X-100, 10 mM EGTA, 1 mM MgCl2 and 4 %
formaldehyde) for 10 minutes at room temperature. Fixed cells were blocked for 30
minutes in PBS + 3 % BSA, washed twice in 1x PBS (5 minutes, room temperature)
and stored in 1x PBS at 4 ºC for at least two hours and up to two weeks before
80
immunostaining. For immunostaining, cells were incubated for one hour at room
temperature in the appropriate primary antibody diluted in 1x PBS.
Following primary antibody staining, cells were washed three times with 1x PBS for
five minutes each. Primary antibodies were detected by appropriate FITC/ TRITC/
Cy5-conjugated secondary antibodies (Life Technologies) for 30 minutes at room
temperature, diluted in 1x PBS containing 1 µg/mL DAPI, followed by three five-
minute washes with 1x PBS. Coverslips were mounted on glass microscopy slides
in Vectashield (Vector laboratories). 3D fluorescent image stacks were acquired on
an Olympus DeltaVision microscope in 0.2 µm steps, using the Olympus 20x, 40x,
60x or 100x UPlanSApo immersion oil objectives with a 1.4 numerical aperture.
81
3.3. Construction of a mammalian dsEGFP expression
vector
3.3.1. Amplification of pEGFP-C1 vector
A pEGFP-C1-containing vector was obtained from a commercially available source
(Addgene), as it had a suitable backbone for cloning into mammalian cell lines. The
vector DNA was first amplified, for downs-stream applications, by transforming α-
Select Gold Efficiency competent cells (Bioline Reagents). Competent cells stored
at -80 ºC were thawed on ice for 15 minutes before addition of 10 ng plasmid DNA
was added to 50 µL of cells. Cells were incubated with plasmid DNA, on ice, for a
further 15 minutes prior to heat-shock. Competent cells were heat-shocked by
incubating at 42 ºC in a water bath, without agitation, for two minutes before being
immediately plunged into ice for five minutes. For one hour, cells were incubated at
37 ºC in a shaking incubator at a rate of 220 rpm in 350 µL of S.O.C medium to
supressed catabolite production. Bacteria colonies were left to grow overnight at 37
ºC on Luria-Bertani (LB)-agar plates containing 50 µg/mL kanamycin. Single
colonies were picked, used to inoculate 50 mL LB broth plates containing 50 µg/mL
kanamycin, and grown overnight in a shaking incubator at 37 ºC, 220 rpm. DNA of
the correct size was confirmed by running approximately 200 ng of plasmid DNA,
recovered from overnight bacterial cultures by the QIAprep Spin Miniprep (Qiagen),
on a 1 % (w/v) agarose gel stained with gel red (Biotium), with a 1 kb ladder (NEB),
for one hour in Tris Borate EDTA (TBE) at 80 volts.
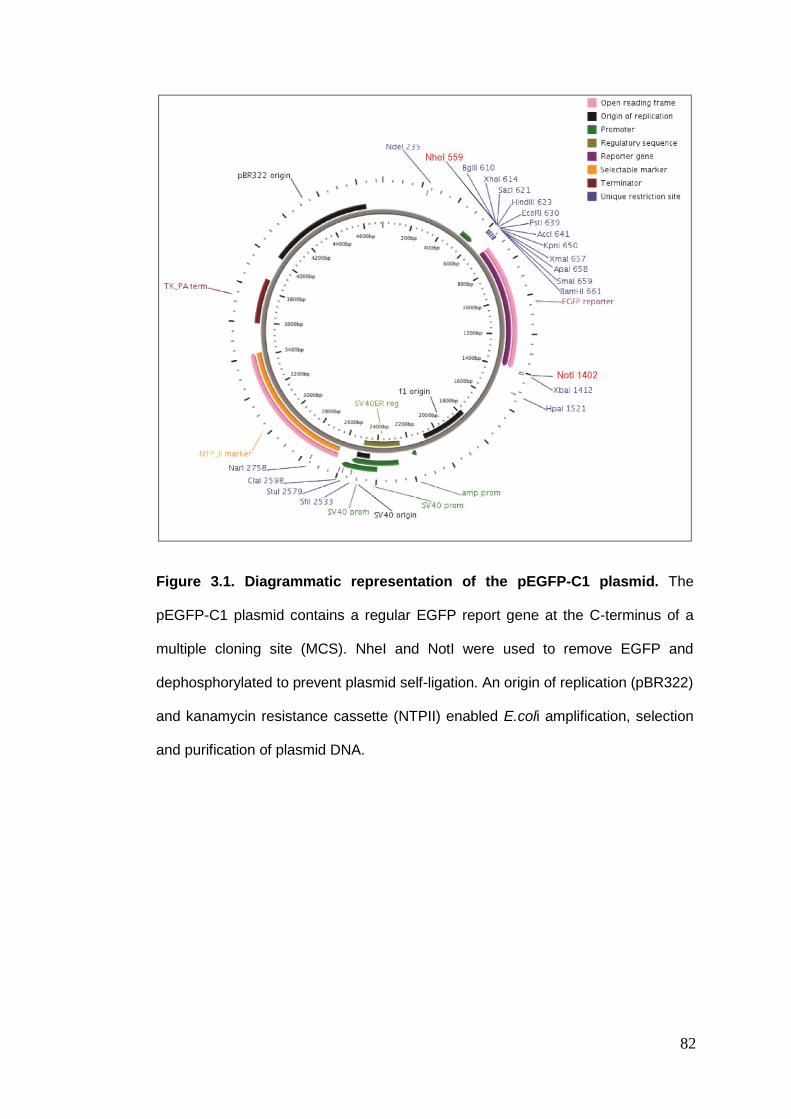
82
Figure 3.1. Diagrammatic representation of the pEGFP-C1 plasmid. The
pEGFP-C1 plasmid contains a regular EGFP report gene at the C-terminus of a
multiple cloning site (MCS). NheI and NotI were used to remove EGFP and
dephosphorylated to prevent plasmid self-ligation. An origin of replication (pBR322)
and kanamycin resistance cassette (NTPII) enabled E.coli amplification, selection
and purification of plasmid DNA.
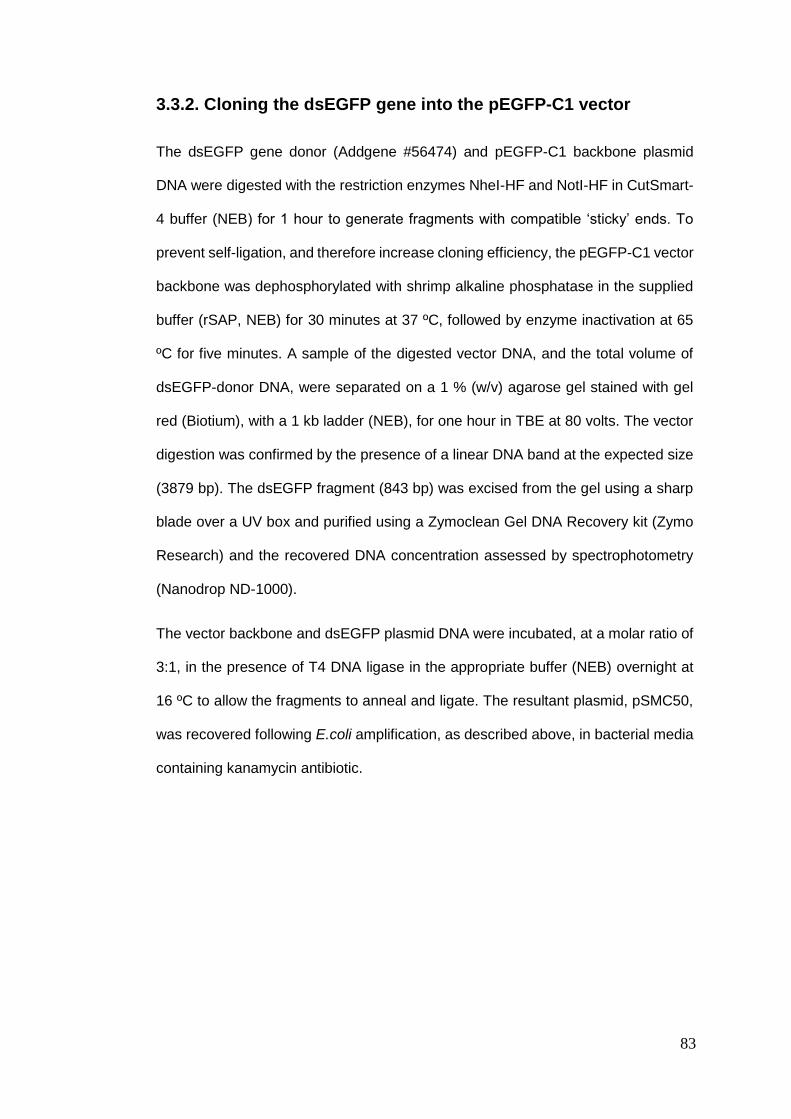
83
3.3.2. Cloning the dsEGFP gene into the pEGFP-C1 vector
The dsEGFP gene donor (Addgene #56474) and pEGFP-C1 backbone plasmid
DNA were digested with the restriction enzymes NheI-HF and NotI-HF in CutSmart-
4 buffer (NEB) for 1 hour to generate fragments with compatible ‘sticky’ ends. To
prevent self-ligation, and therefore increase cloning efficiency, the pEGFP-C1 vector
backbone was dephosphorylated with shrimp alkaline phosphatase in the supplied
buffer (rSAP, NEB) for 30 minutes at 37 ºC, followed by enzyme inactivation at 65
ºC for five minutes. A sample of the digested vector DNA, and the total volume of
dsEGFP-donor DNA, were separated on a 1 % (w/v) agarose gel stained with gel
red (Biotium), with a 1 kb ladder (NEB), for one hour in TBE at 80 volts. The vector
digestion was confirmed by the presence of a linear DNA band at the expected size
(3879 bp). The dsEGFP fragment (843 bp) was excised from the gel using a sharp
blade over a UV box and purified using a Zymoclean Gel DNA Recovery kit (Zymo
Research) and the recovered DNA concentration assessed by spectrophotometry
(Nanodrop ND-1000).
The vector backbone and dsEGFP plasmid DNA were incubated, at a molar ratio of
3:1, in the presence of T4 DNA ligase in the appropriate buffer (NEB) overnight at
16 ºC to allow the fragments to anneal and ligate. The resultant plasmid, pSMC50,
was recovered following E.coli amplification, as described above, in bacterial media
containing kanamycin antibiotic.
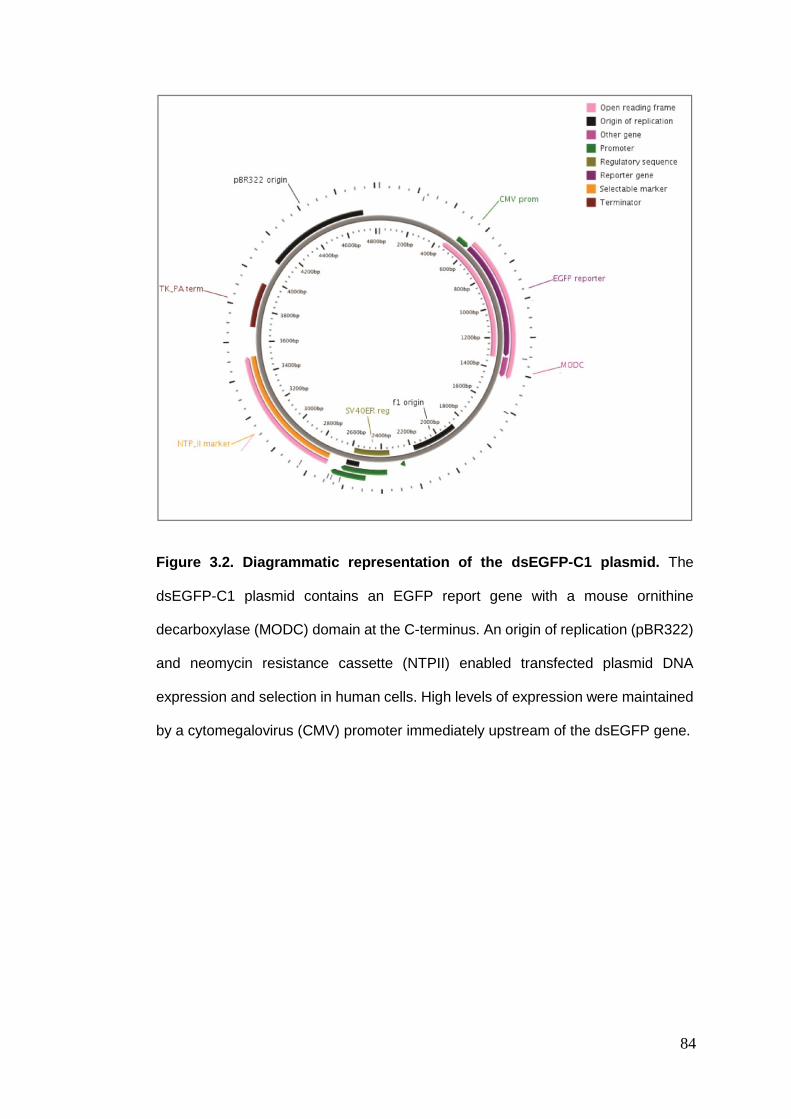
84
Figure 3.2. Diagrammatic representation of the dsEGFP-C1 plasmid. The
dsEGFP-C1 plasmid contains an EGFP report gene with a mouse ornithine
decarboxylase (MODC) domain at the C-terminus. An origin of replication (pBR322)
and neomycin resistance cassette (NTPII) enabled transfected plasmid DNA
expression and selection in human cells. High levels of expression were maintained
by a cytomegalovirus (CMV) promoter immediately upstream of the dsEGFP gene.
85
3.4. Fluorescence in situ hybridisation
3.4.1. Traditional fluorescence in situ hybridisation
Cells were cultured on sterile glass microscopy slides until log-phase growth and
fixed using freshly-prepared Carnoy’s fixative solution (3:1 methanol-glacial acetic
acid) for 10 minutes at room temperature. For cells sorted by fluorescence-activated
cell sorting, samples were harvested by centrifugation at 1,200rpm for three minutes
and fixed with Carnoy’s fixative, in suspension for 10 minutes at room temperature,
followed by settling onto glass slides. The fixative was allowed to evaporate and air-
dried slides were immersed in 2x SSC for two minutes, without agitation, at room
temperature. Samples were dehydrated through an ethanol series for two minutes
each (70 %, 80 % and 100 %) and allowed to dry.
Each centromere enumeration probe (CEP, CytoCell) was equilibrated to room
temperature for five minutes and uniformly mixed with a nuclease-free pipette tip.
Solutions of complete hybridisation mixture consisted of 2µL of each probe and
made up to a final volume of 10 µL with hybridisation solution B (CytoCell), briefly
vortexed to mix, and pulsed in a microcentrifuge for 10 seconds. The probe mixture
and sample slide were pre-warmed on a hotplate at 37 ºC for five minutes prior to
hybridisation.
The probe mixture was spotted onto the sample slides and carefully covered with a
nuclease-free coverslip. The probe and sample were denatured simultaneously for
two minutes 75 ºC. After two minutes, the samples were placed in a light-proof,
humid container at 37 ºC for at least eight hours. Post-hybridisation, the coverslip
was carefully removed and the samples immersed in 0.2x SSC at 72 ºC for one
minute without agitation. The sample slide was drained and submerged in PBS with
DAPI (1 µg/mL) for two minutes. Sample slides were allowed to air dry at room
temperature. Slides were prepared for fluorescence microscopy by addition 10 µL
86
of anti-fade reagent (Vectashield, Vector Laboratories) and sealed with a nuclease-
free coverslip and non-aqueous fixative.
3.4.2. Fluorescence in situ hybridisation in-suspension
Cells in log-phase growth were treated with 100 µM nocodazole for eight hours and
released following mitotic shake-off into fresh medium for 12 hours before analysis.
Replication stress was induced by treatment with 0.2 µM aphidicolin for 24 hours.
Cells from all experimental conditions were harvested, as previously described, and
fixed by adding freshly-prepared 3:1 methanol-glacial acetic acid drop-wise to a
pellet of PBS-washed cells. For hybridisation, cells were washed with 1x PBS with
3% BSA twice for five minutes, pelleted, and resuspended in 0.05% Tween20 and
2x Saline-sodium Citrate (SSC) in PBS. 1 x10⁶ cells from this suspension were
pelleted and the supernatant removed by pipetting. Cells were then resuspended in
40µL of complete hybridisation mixture containing 28 µL hybridisation buffer, 10µL
nuclease-free H2O and 2 µL CEP probe. Denaturing and probe hybridisation were
performed in a thermocycler under the following conditions: 80 ºC (five minutes), 42
ºC (9 to 16 hours) and an optional storage step of 4 ºC. Following hybridisation, 200
µL of 2x SSC was added to each reaction mixture. Cells were pelleted and
resuspended in 50 to 100 µL of 1x PBS before analysis (optional: DAPI, 1 µg/mL).
All samples were analysed on the ImageStreamX cytometer by excitation with the
488 nm laser with a power of 100 mW at a ‘high’ flow speed.
87
3.4.3. Mitosis fluorescence in situ hybridisation
3.4.3.1. Anaphase fluorescence in situ hybridisation
Cells were treated with 100 µM nocodazole for eight hours. Following mitotic shake-
off, cells were pelleted and seeded onto glass microscopy slides pre-coated with
poly-L-lysine. After 60 minutes, cells were incubated for 10 minutes at room
temperature with freshly prepared fixative solution (3:1 methanol-glacial acetic acid).
Fixed cells were hybridised with centromere-specific probes with, and without, all-
centromere probe according to manufacturer instructions (Cytocell), as previously
described, and counter-stained with DAPI (1 µg/mL). For chromosome laggard
rates, anaphase cells with lagging chromosomes were analysed from three
independent experiments. Chromosome lagging rates were determined from the
absolute number of CEP signals for specific chromosomes and the total number of
chromosomes lagging in each anaphase judged by the all-centromere probe.
3.4.3.2. Late prometaphase fluorescence in situ hybridisation
Late prometaphase were identified by the presence of five or less uncongressed
chromosomes 45 minutes post-nocodazole wash-out. Cells were analysed to
determine the percentage of uncongressed chromosomes, split centromere rates
and chromosome positioning in the metaphase plate. Uncongressed chromosome
rates were determined from the total number of chromosomes uncongressed and
the absolute number of CEP signals for specific chromosomes. The centromeres of
individually stained sister-chromatid pairs were deemed to be ‘separated’ or ‘split’ if
the centre of the two signals for each chromatid were greater than 2 µm apart, or
were on opposing sides of the metaphase plate. The metaphase plate territory for
individual chromosomes were interrogated by determining the distance of each
sister chromatid pair from one end of the metaphase plate. Data were transformed

88
as a ratio of the distance from one end of the metaphase plate, to normalise for
variation in metaphase plate length as a result of sample preparation. Chromosome
territories at metaphase were analysed by generating frequency histograms of each
chromosome for positions along the length of the plate.
89
3.5. Flow and Image Cytometry
3.5.1. Fluorescence-activated cell sorting
To sort RPE-1-4 cells by flow cytometry, a hierarchical gating strategy that measures
parameters of each cell as it passes through the capillary-flow chamber was utilised.
The first parameter identifies all cells, and is a readout of the total cell area, based
on how much light is scattered from two lasers in the ‘forward’ (FSC) area and ‘side’
(SSC) area directions. Material below a threshold scatter of ~30,000-50,000 in both
axes is determined to be debris and is excluded from the subsequent analysis and
sorting. Of the ‘all cells’ population, doublet cells can be eliminated by plotting FSC-
A (area) against FSC-H (height). Cells with a high ratio of their total area against
height are likely to be two cells together and are excluded. Single cells are identified
from clumps of cells, which still satisfy the area to height ratio, by gating those with
a low total area side-scatter (SCA-A) and a low total width side-scatter (SCA-W).
3.5.2. Cell cycle analysis
The DNA content of single cells was used to determine population-wide changes in
progression through the cell cycle. The cell cycle phases can be determined by
plotting a frequency histogram of the relative amount of DNA in each cell. In
proliferating cells, the majority of the population will be in G1 and have a 2n DNA
content that is visualised as the largest peak. Cells at various stages of S-phase, as
the genome is being duplicated, will have an intermediate DNA content between 2n
and 4n. Cells in G2 and mitosis, following S-phase, can be distinguished as a DNA
content with a fluorescence value roughly twice that of the G1 peak. To prepare cells
for cell cycle analysis, cells were fixed using 4% paraformaldehyde (PFA) at room
temperature for seven minutes. Fixed cells were centrifuged out of the fixative
solution at 1200 rpm for three minutes, and resuspended in a PBS + 0.2 % Triton X-
90
100 for three minutes to permeabilise the cell membrane. Permeabilised cells
harvested by centrifugation at 1200 rpm for three minutes and resuspended in 500
– 1000 µL PBS containing DAPI at a final concentration of 1µ/mL and incubated for
a minimum of five minutes at room temperature prior to analysis. Samples were
analysed on a BD LSR Fortessa flow cytometer (BD Biosciences) by excitation of
DAPI-stained cells with a 350nm laser and data recorded after a band-pass
450/50nm emission filter. For each sample, the DNA content of a minimum of 10,000
cells was acquired and the percentage of the population in each phase of the cell
cycle determine in the FlowJo flow cytometry analysis software package (FlowJo
LLC).
3.5.3. Apoptosis
In living cells, phosphatidyl serine (PS) is on the plasma membrane leaflet facing the
cytoplasm. When cells are undergoing apoptosis, PS is transported to the outer
plasma membrane where it binds, with high affinity, to the calcium-dependent lipid-
binding protein, annexin V. The percentage of cells in early and late apoptosis, as
well as dead cells, was determined by immunofluorescent staining of annexin V and
the incorporation of DAPI by flow cytometry. Cells that are negative for both stains
are living cells. Early apoptotic cells are identified by the presence of annexin V on
the outer membrane, but are still impermeable to DAPI. Late apoptotic cells are
positive for both DAPI and annexin V staining. Dead cells remove annexin V from
the cell membrane by proteolysis, and are therefore only positive for DAPI.
Samples were harvested as previously described, washed once with PBS for three
minutes, and stained for annexin V. Annexin V was stained using an anti-annexin V
antibody conjugated to a far-red fluorophore (AlexaFluor 647, Thermo Fischer).
Annexin binding buffer (1X, 140 mM NaCl, 10 mM HEPES, 2.5 mM CaCL2, pH 7.4)
was added in a ratio of 25:1 with the conjugated antibody and incubated with the
91
sample for 15 minutes at room temperature. DAPI, diluted to a final concentration of
1 mg/mL in 200 µL of annexin binding buffer, was added to the samples and
incubated for five minutes at room temperature prior to analysis. Reference voltages
for each laser on the flow cytometer were set using stained and unstained control
cells. Cells were excitated simultaneously with light of wavelength 450 nm and 647
nm. Annexin V and DAPI staining was recorded through the 450/50 and 670/14
band-pass filters, respectively. A minimum of 10,000 cells were recorded for each
experiment.
3.5.4. Image cytometry analysis
Data obtained by the ImageStreamX were analysed in IDEAS 6.2 (Merck Millipore).
Samples for each chromosome and experimental condition were obtained
separately and contained within a single data file. For each sample between 500
and 40,000 individual cells were analysed.
Raw data files were opened in the IDEAS software package and the built-in
compensation matrix applied. This correction is necessary to remove fluorescent
noise introduced from the spatial alignment between channels, the flow speed,
camera background normalisation and the level of brightfield gain. During
acquisition, the EDF element was used to increase the focus range from 4 µm to 16
µm, allowing close to 100% of cells to be focused. Single cells are distinguished
from cell aggregates by low area and high aspect ratio.
The gating of single cells was manually verified by visual observation of brightfield
images in the selected region. Plotting the Gradient Root Mean Squared (RMS)
value of the brightfield channel allowed only cells that were in-focus to be analysed.
In-focus cells have a high Gradient RMS value. For some samples, where the
hybridisation efficiency was weaker, a further gate was applied to select for only cells
92
in the sample above a threshold of probe signal intensity. This was achieved by
plotting the total intensity of fluorescence in each cell, versus the Raw Max Pixel
intensity within the cell. Cells with hybridised probe have an average total
fluorescence, and a high Raw Max Pixel intensity. Single, in-focus, hybridised cells
were then analysed for the chromosomal content of a particular chromosome by
applying a ‘spot mask’ and ‘spot counting’ feature to the centromere probe signals
for each image. The masking parameters were determined on user-defined
variables: the radius of the spot and the spot-to-background ratio (STBR). The STBR
is the spot pixel value divided by the background fluorescence of the bright detail
image. The spot mask therefore denotes a region that is of appropriate area to be
considered a centromeric signal, and the boundary at which the signal diminishes.
Where the radius value is x, this suggests that the denoted area of a single spot
should have a minimum value of 2x+1 pixels. Regions that satisfy the spot mask
criteria in single cells are enumerated by the spot-counting wizard. For the wizard to
accurately determine chromosome ploidy, true populations were denoted for both
2n-1 and 2n+1 cells for a minimum of 25 images. The wizard then compiles the
common features for over 250 elements and assigns each image a spot count.
The images obtained of CEP spots are 2D projections of 3D images, to encompass
the entire volume of the nucleus. If a cell is aligned so that the two centromere
signals are in the same x, y position, but different z positions, they sometimes appear
as a single focus, because they overlap following image projection. To correct for
this, CEP signal intensity was plotted as a histogram from the original spot count
data which correlates with the amount of probe hybridised, rather than the spot
count. Disomic cells had a medium (M) intensity of hybridisation signal intensity,
representing two spots. Cells with one spot that had lost a chromosome will fall
below the value represented by two standard deviations above the mean fluorescent
intensity; cells that had gained a chromosome will fall above two standard deviations
93
of the mean of the hybridisation signal intensity. Events that are classified as one
spot by the software usually fell into the medium range for intensity in the majority
of cases. This suggests that, for the reasons stated above, they are disomic cells
with aberrant ploidy-spot relationship. Cells designated as one spot that fell outside
the 2 standard deviation window were deemed to be true monosomies. Cells
designated as 2n+1 by the spot-counting wizard were manually verified by visual
inspection of each image and correlating it with the 2 standard deviation cut-off
above the mean diploid fluorescence intensity.
94
3.6. DNA analysis
3.6.1. Genomic DNA extraction
Genomic DNA was extracted from cell lines using the DNeasy Mini kit (Qiagen). For
control experiments, where starting material was not limiting, DNA was extracted
from 1 x10⁶ cells. For all experimental conditions sorted by FACS, genomic DNA
was extracted from at least 50,000 cells. To extract genomic DNA, harvested cells
were centrifuged and resuspended in 200 µL PBS and 20 µL proteinase K, to
remove proteins from the sample. Following resuspension, 200 µL buffer AL was
added and the sample thoroughly vortexed and incubated at 56 ºC for 10 minutes.
200 µL of ethanol absolute was added to the sample and mixed by vortexing. The
mixture was pipetted into a DNeasy Mini spin column and centrifuged at 6000 xg for
one minute. DNA in the column was washed twice by addition of 500 µL buffer AW1
and AW2 followed by centrifugation, at 6,000 xg for one minute and 20,000 xg for
three minutes, respectively. DNA was eluted by centrifugation at 12,000 xg in a
variable volume of nuclease-free PBS (60 to 200 µL), depending on the sample. For
elution in a total volume of 60 µL, the DNeasy Mini column was washed with 2x 30
µL PBS to increase the total yield.
The absolute DNA concentration was determined by a spectrophotometer
(Nanodrop ND-1000), where the ratio of absorbance at 260 nm and 280 nm was at
least 1.8, and therefore considered to be DNA of sufficient quality for down-stream
applications.
3.6.2. Southern blot
Cells from clone RPE-1-4F were harvested and resuspended in 200 µL PBS + 20
µL proteinase K, to digest proteins. Genomic DNA was extracted as previously
described. To fragment the genome, 1 µg of genomic DNA was restriction-digested
95
with XhoI and KpnI-HF in the supplied buffers (NEB), followed by heat-inactivation
at 80 ºC for 10 minutes. Genome fragmentation was confirmed by imaging each
sample on a 0.8 % (w/v) agarose gel, stained with gel red, after running for 100
minutes at 65 volts in TBE.
To transfer DNA to the membrane the following procedure was implemented: A
nitrocellulose membrane and three sheets of blotting were wetted by brief immersion
in 0.4 M NaOH. Two of the blotting papers served as wicks for the transfer, and the
third was overlaid on the gel support stand to prevent direct contact with the acrylic.
The gel was rinse briefly with de-ionised water and placed on top of the acrylic
support surface. The nitrocellulose membrane was laid carefully across the top of
the gel, ensuring no air bubbles were trapped which would prevent proper transfer
of DNA to the membrane. To this, the two sheets of additional blotting paper were
stacked, followed by dry paper towels, increasing the total thickness to
approximately 7 cm. A further piece of acrylic was stacked on to the assembly to
allow the stable balance of a 500 gram weight, to weight the entire assembly and
promote capillary diffusion of the NaOH through the nitrocellulose membrane. The
transfer assembly was allowed to stand and the DNA transferred to the membrane
for a minimum of 16 hours at room temperature
The membrane was carefully removed and washed in neutralisation buffer (Sigma).
Before hybridisation with labelled probes, the membrane was blocked in salmon
sperm DNA. To prepare the complete blocking agent, pre-hybridisation solution
(Sigma) was incubated in a water bath at 42 ºC. Salmon sperm (Sigma) was
denatured for 5 minutes at 95 ºC, immediately chilled on ice, and added to the pre-
warmed hybridisation solution to a final concentration of 50 µg/mL. The membrane
was carefully rolled into a hybridisation tube, complete hybridisation blocking
solution added, and placed in a revolving hybridisation oven for five hours at 42 ºC.
96
For hybridisation, fluorescently-labelled pSMC50 probe was added to 10 mL
hybridisation solution (Sigma), pre-warmed to 49 ºC, up to a final concentration of
10 ng/mL. The pre-hybridisation solution was discarded from the membrane and the
hybridisation solution added, followed by incubation for 16 hours at 49 ºC. A 6X wash
solution; consisting of 180 mL 20X SSPE (Sigma), 12 mL 10 % SDS and 408 mL
deionised water; was pre-heated to 49 ºC and used to wash the blot on a shaking
incubator for 15 minutes at 49 ºC. An aliquot of the 6X wash solution was diluted
three times in deionised water, pre-heated to 49 ºC and used to wash the blot for 30
seconds. Hybridised blots were visualised on an Odyssey CLx imaging system
(Licor) with a one minute and three minute exposure time.
3.6.3. Polymerase chain reaction and probe labelling
3.6.3.1. Generating fluorescently-labelled dsEGFP probes
The dsEGFP gene host plasmid, pSMC50, was digested with DNAse I – a restriction
enzyme with no known sequence specificity – for 10 minutes at 37 ºC to generate a
library of pSMC50 DNA molecules between ~100 bp and ~1,000 bp in length. DNA
digestion was confirmed by running approximately 100 ng of the digestion mixture
on a 1 % agarose gel for 30 minutes before down-stream applications. Precipitation
of 1 µg of the fragment library was achieved by adding 1/10 volume of sodium
acetate (pH 5.2, 3 M) and two volumes of ethanol absolute to the mixture, freezing
at -70 ºC for 30 minutes then centrifuging at 12,000 rpm for 15 minutes. The
supernatant was removed carefully by pipetting and the pellet washed with 70 %
ethanol and allowed to air dry at room temperature. The pellet was resuspended in
20 µL of labelling buffer (Ulysis), denatured at 95 ºC for 5 minutes, snap cooled on
ice and briefly centrifuged to redeposit DNA to the bottom of the tube. To this mixture
was added 1 µL of ULS Alexa Fluor® 488 labelling stock solution (Ulysis) and
incubated at 80 ºC for 15 minutes. The reaction was stopped by plunging the sample
97
into ice. Labelled DNA was recovered from the reaction mixture by a gel filtration-
based spin column (BioRad) according to the manufacturer’s instructions. The
labelling efficiency, quality and concentration of labelled DNA was determined by a
spectrophotometer (Nandrop ND-100).
3.6.3.2. Generating digoxygenin-labelled dsEGFP probes
Digoxygenin-labelled probes were generated by amplifying the target sequence by
polymerase chain reaction (PCR). To a microcentrifuge tube was added the
following reagents: PCR buffer with MgCL2, PCR DIG-probe dNTP synthesis mix
(Roche; 200 µM dATP, dCTP, dGTP, 130 µM dTTP, 70 µM DIG-dUTP), 0.5 µM
forward PCR primer, 0.5 µM reverse PCR primer, 0.75 µL enzyme mix (Roche) and
50 pg template plasmid DNA (or 50 ng genomic DNA, depending on the application;
Table 3.2). The total reaction volume was brought to a total of 50 µL with PCR-grade
water (Roche). For the PCR reaction, 0.2 µL microfuge tubes and DNA amplified by
thermocycling (Table 3.2). The PCR amplification was confirmed by running 5 µL of
the sample mix on a 1 % (w/v) agarose gel for one hour. Successful probe labelling
was confirmed by comparing the gel shift of the DIG-labelled PCR products with the
unlabelled control PCR reaction.
3.6.4. Single-nucleotide polymorphism array
The ploidy of each sample was determined by a Genome-Wide Human SNP Array
6.0 (Affymetrix) and data analysed in the Chromosome Analysis Suite (CAS,
Affymetrix). Data were transformed from global references obtained from signals in
the CAS normalised reference library. Normalised signals were log2 transformed,
and the copy number variation of a single SNP between samples was estimated
from the weighted log2 ratio.
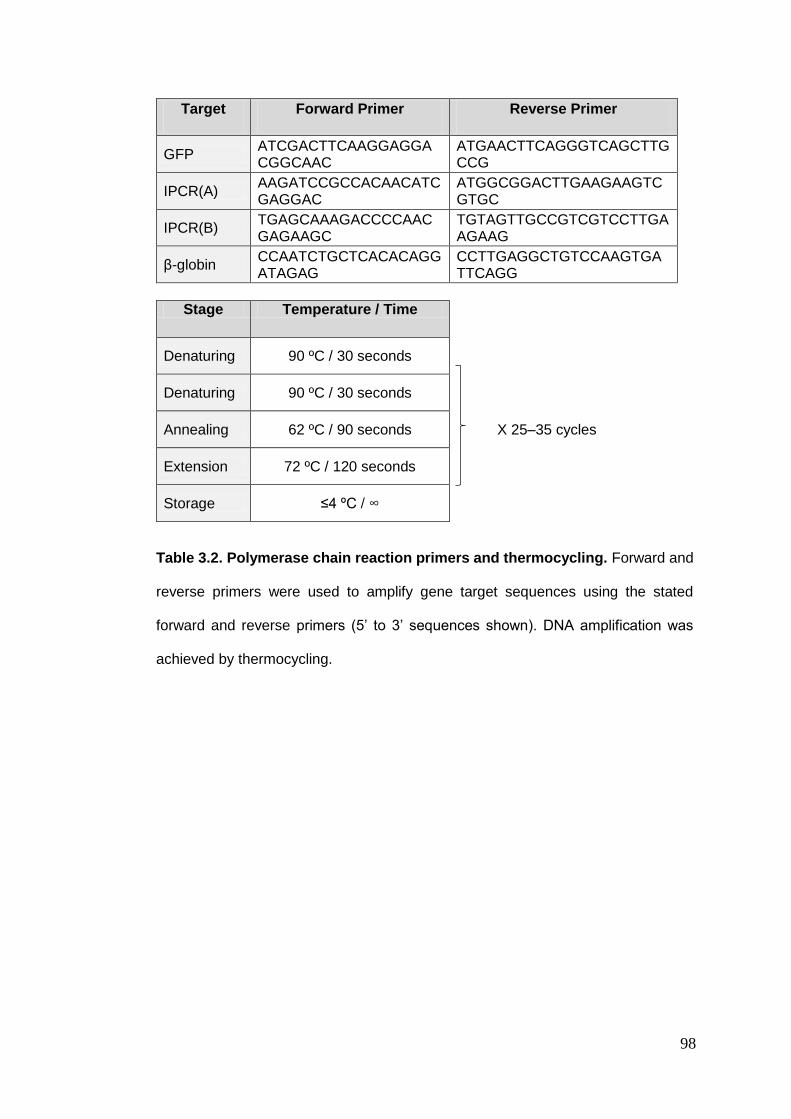
98
Table 3.2. Polymerase chain reaction primers and thermocycling. Forward and
reverse primers were used to amplify gene target sequences using the stated
forward and reverse primers (5’ to 3’ sequences shown). DNA amplification was
achieved by thermocycling.
Target Forward Primer Reverse Primer
GFP ATCGACTTCAAGGAGGACGGCAAC
ATGAACTTCAGGGTCAGCTTGCCG
IPCR(A) AAGATCCGCCACAACATCGAGGAC
ATGGCGGACTTGAAGAAGTCGTGC
IPCR(B) TGAGCAAAGACCCCAACGAGAAGC
TGTAGTTGCCGTCGTCCTTGAAGAAG
β-globin CCAATCTGCTCACACAGGATAGAG
CCTTGAGGCTGTCCAAGTGATTCAGG
Stage Temperature / Time
Denaturing 90 ºC / 30 seconds
Denaturing 90 ºC / 30 seconds
Annealing 62 ºC / 90 seconds X 25–35 cycles
Extension 72 ºC / 120 seconds
Storage ≤4 ºC / ∞
99
3.6.5. Metaphase spreads
Cells were treated with colcemid for six hours, harvested and resuspended in pre-
warmed hypotonic solution (1:1; 0.4 % KCl 0.4 % Sodium citrate) at 37 ºC for seven
minutes. Pelleted cells were resuspended by adding freshly-prepared fixative (3:1
methanol-glacial acetic acid) in a drop-wise fashion to prevent clumping and
incubated for 30 minutes at room temperature. Metaphase spreads were obtained
by dropping the fixed cell suspension onto clean glass microscopy slides from a
height of between 1.5 and 1.8 meters and allowed to air-dry before storage at 4 ºC
for up to three months prior to analysis.
3.6.6. Single-cell sequencing
Samples from control and experimentally-induced aneuploid cells sorted by FACS
were sent to a collaborator for single-cell sequencing analysis using AneuFinder as
previously reported314. Briefly, sequence reads are determined as non-overlapping
bins with an average length of 1 Mb, a GC correction is applied, and binned
sequences are analysed using a Hidden Markov model to differentiate aneuploidies
from zero (nullisomy) to 10 (decasomy) chromosome copies. To negate the inherent
sample variation introduced by sequencing single cells, a stringent quality control
step was included that uses multivariate clustering analysis to excluded samples of
insufficient quality. Chromosome copy number is plotted as a genome-wide state
with clustering of cells based on the similarity of copy number profiles.
100
3.7. Transcriptome Analysis
3.7.1. RNA extraction
EGFP-positive and negative cells were collected by FACS as previously described.
Cells were pelleted by centrifugation at 1200 rpm for three minutes and 350 µL RLT
lysis buffer (Qiagen) added drop-wise to a loosened cell pellet. Cells in lysis buffer
were homogenised by passage through a P200 pipette tip and one volume of 70 %
ethanol added and mixed by vortexing. The sample was transferred to an RNeasy
Mini Spin column (Qiagen) and centrifuged for 15 seconds and 12,000 rpm to bind
total RNA to the column. RNA was washed by addition of 700 µL buffer RW1 and
15 second centrifugation at 12,000 rpm. To remove all traces of ethanol from the
RNA sample, 500 µL Buffer RPE was added to the column and centrifuged at 12,000
rpm for two minutes. Total RNA from each sample was eluted by applying 50 µL
RNase-free water directly to the column and centrifuging for one minute at 12,000
rpm. The total RNA concentration and RNA quality were analysed on a
spectrophotometer (Nanodrop ND-1000).
3.7.2. Determination of dsEGFP insertion frequency
Total RNA from each sample was analysed using the GeneChip Human
Transcriptome Array 2.0 (Affymetrix). Raw data from the array were transformed to
normalise for quantile variation between samples, and correct for background noise,
using the conservative RMA transformation function within the Affymetrix Power
Tool software package (Affymetrix). RMA-transformed data were smoothed by
plotting mRNA expression across the genome as a 1000-point moving average of
Log2 expression values.
101
3.7.3. Transcriptome responses to monosomy 6
Raw transcriptomics data files were normalised by SST-RMA transformation within
the Transcriptome Analysis Console software package (Affymetrix). Differences in
expression for each probe between samples were determined by one-way, unpaired
ANOVA where significance was p<0.05. The fold change for each gene was plotted
on a linear scale from -4 to +4. Data were plotted as pathway maps using the built-
in WikiPathways compatibility function340.
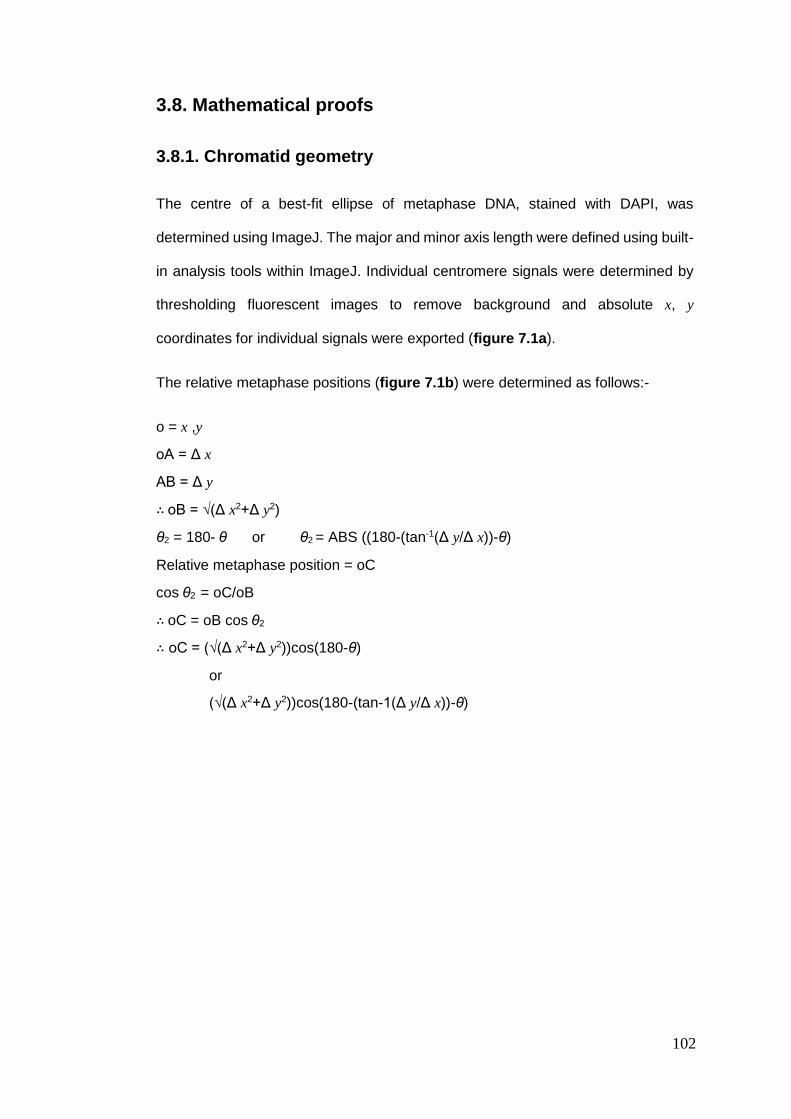
102
3.8. Mathematical proofs
3.8.1. Chromatid geometry
The centre of a best-fit ellipse of metaphase DNA, stained with DAPI, was
determined using ImageJ. The major and minor axis length were defined using built-
in analysis tools within ImageJ. Individual centromere signals were determined by
thresholding fluorescent images to remove background and absolute x, y
coordinates for individual signals were exported (figure 7.1a).
The relative metaphase positions (figure 7.1b) were determined as follows:-
o = x ,y
oA = Δ x
AB = Δ y
∴ oB = √(Δ x2+Δ y2)
θ2 = 180- θ or θ2 = ABS ((180-(tan-1(Δ y/Δ x))-θ)
Relative metaphase position = oC
cos θ2 = oC/oB
∴ oC = oB cos θ2
∴ oC = (√(Δ x2+Δ y2))cos(180-θ)
or
(√(Δ x2+Δ y2))cos(180-(tan-1(Δ y/Δ x))-θ)
103
The angular deviation between sister chromatids (figure 7.1c) was determined as
follows:-
o = x, y
AE = Δ x
AB = Δ y
∴ BE = √(Δ x2+Δ y2)
CD = ΔoCoD (see relative metaphase positioning proof)
cosθ = CD / BE
∴ θ = cos-1(ΔoCoD / BE)
θ2 = 90 - θ
∴ θ2 = 90 - (cos-1(ΔoCoD / BE))
Raw data for ellipse centre coordinates (x, y), metaphase rotation angle (θ), major
axis length, and sister chromatid coordinates (x, y) were extracted from each image
by a custom ImageJ macro command (chapter 10.1.2). The mathematical
calculations above were performed on extracted data using a Microsoft Excel
function workflow (chapter 10.1.6).
104
3.9. Statistics
Where required, data were normalised to the appropriate control before analysis.
Statistical analyses of in vitro assays were performed in GraphPad Prism 5.4
(GraphPad). Data with two experimental conditions were analysed using a two-tailed
Student’s T-test assuming unequal variance. For two or more treatment groups,
significance between mean values was determined by one-way ANOVA with
Tukey’s post-hoc test to correct for family-wise errors.
Chi-squared significance and p-values were calculated by comparing the observed
and expected values for the independent variables (aneuploidy-vulnerability and
metaphase plate region) from a 2x2 contingency table.
Unless stated otherwise all graphs plot the mean, with error bars showing +/- one
standard deviation of the mean, of triplicate biological repeats. Asterisks have been
used to denote the significance value between experimental conditions, adhering to
the following nomenclature: p<0.05 (*); p<0.01 (**); p<0.001 (***); p<0.0001 (****).

105
4. Developing a novel
system to isolate nascent
aneuploid cells
106
4.1. Optimising a drug-induced chromosome
missegregation strategy
Aneuploidy has detrimental consequences for cell fitness; therefore, the
preservation of a diploid karyotype between generations is a fundamental priority of
proliferating human cells260,341,342. Elucidation of the earliest responses to aneuploidy
in human cells is severely limited by the lack of appropriate tools to isolate aneuploid
cells in the few hours following chromosome missegregation, before cells undergo
apoptosis145,180,259. To circumvent these issues, and investigate the early responses
to chromosome missegregation, I devised an experimental strategy to isolate
nascent populations of aneuploid cells using a fluorescence-based aneuploidy-
reporter cell line (figure 4.1).
The insertion of an enhanced green fluorescent protein (EGFP) transgene into a
single chromosome locus would enable the isolation of populations of cells which
have lost this chromosome by fluorescence-activated cell sorting (FACS). I have
chosen to create my initial aneuploidy-reporter cell line using retinal pigment
epithelium cells (RPE-1-hTERT; RPE-1 herein); a chromosomally-stable, non-
transformed cell line which has been immortalised by constitutive expression of
telomerase343. This cell line is well-suited for the outlined experimental strategy as it
is has a low rate of spontaneous chromosome missegregation, and thus control and
aneuploid (EGFP-negative) populations are biologically distinct and can be used for
comparative analysis of the early responses to aneuploidy226,337.
The analysis of the responses to aneuploidy requires enough cells to be able to
utilise population-based approaches, such as gene expression arrays and
transcriptomics, which require tens of thousands of cells344. Since the rate of
spontaneous chromosome missegregation in RPE-1 cells is very low, chromosome
missegregation will be artificially elevated using small molecule inhibitors of mitosis.
107
Figure 4.1. Experimental strategy for isolating aneuploid cells using FACS. A
chromosome reporter strategy, based on fluorescence-activated cell sorting
(FACS), was devised. A de-stabilised green fluorescence protein (dsEGFP) gene
would be inserted into a single chromosome. Elevating aneuploidy using small
molecule inhibitors of mitosis (nocodazole) would, in some cells, lead to reporter
chromosome missegregation. This would generate a pool of aneuploidies, a sub-
population of which would have missegregated the reporter chromosome and could
be identified by EGFP fluorescence (lack thereof). Cells would be sorted by FACS
post-chromosome missegregation and used for down-stream experiments.
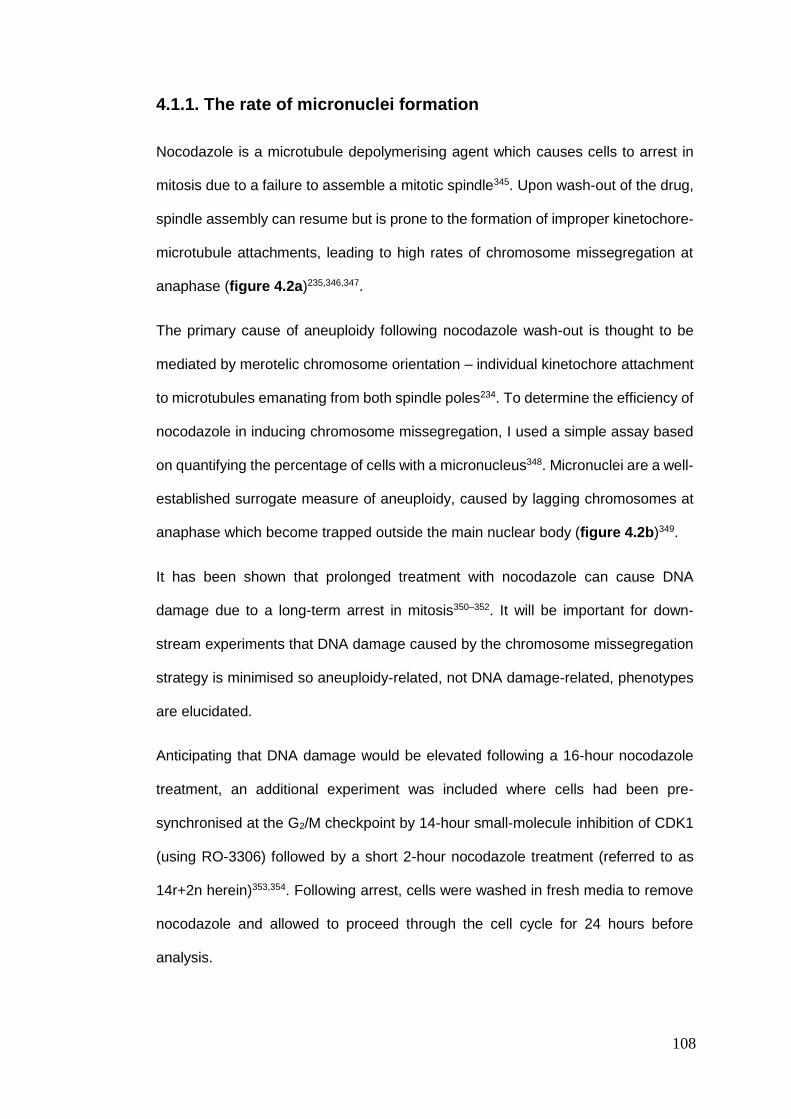
108
4.1.1. The rate of micronuclei formation
Nocodazole is a microtubule depolymerising agent which causes cells to arrest in
mitosis due to a failure to assemble a mitotic spindle345. Upon wash-out of the drug,
spindle assembly can resume but is prone to the formation of improper kinetochore-
microtubule attachments, leading to high rates of chromosome missegregation at
anaphase (figure 4.2a)235,346,347.
The primary cause of aneuploidy following nocodazole wash-out is thought to be
mediated by merotelic chromosome orientation – individual kinetochore attachment
to microtubules emanating from both spindle poles234. To determine the efficiency of
nocodazole in inducing chromosome missegregation, I used a simple assay based
on quantifying the percentage of cells with a micronucleus348. Micronuclei are a well-
established surrogate measure of aneuploidy, caused by lagging chromosomes at
anaphase which become trapped outside the main nuclear body (figure 4.2b)349.
It has been shown that prolonged treatment with nocodazole can cause DNA
damage due to a long-term arrest in mitosis350–352. It will be important for down-
stream experiments that DNA damage caused by the chromosome missegregation
strategy is minimised so aneuploidy-related, not DNA damage-related, phenotypes
are elucidated.
Anticipating that DNA damage would be elevated following a 16-hour nocodazole
treatment, an additional experiment was included where cells had been pre-
synchronised at the G2/M checkpoint by 14-hour small-molecule inhibition of CDK1
(using RO-3306) followed by a short 2-hour nocodazole treatment (referred to as
14r+2n herein)353,354. Following arrest, cells were washed in fresh media to remove
nocodazole and allowed to proceed through the cell cycle for 24 hours before
analysis.
109
Basal levels of micronuclei in control cells were low (figure 4.2c). Treatment of RPE-
1 cells with nocodazole for 2 hours did not significantly increase aneuploidy
compared to the untreated control. Following 16 hours nocodazole wash-out,
chromosome missegregation was significantly elevated, in-line with the literature
(***p<0.001)337. Pre-synchronising cells at G2/M followed by 2-hours nocodazole
wash-out (14r+2n) significantly elevated chromosome missegregation above 2-hour
treatment alone and to approximately similar rates as for 16-hour nocodazole
treatment (***p<0.001).
These data confirm that I are able to induce chromosome missegregation using
small molecule inhibitors of the cell cycle. Importantly, it is possible to significantly
elevate aneuploidy following a short (2-hour) nocodazole wash-out by pre-
synchronising cells at the G2/M boundary, which I anticipate to be important to
minimise DNA damage.
110
Figure 4.2. Micronuclei formation rates following nocodazole wash-out. (a)
Treatment with the microtubule spindle poison nocodazole leads to mitotic arrest
due to a failure to assemble a mitotic spindle. Following nocodazole wash-out,
chromosomes form merotelic attachments on the spindle. (b) Micronuclei are extra-
nuclear compartments containing whole chromosome or chromosome fragments
which arise following a faulty mitosis. (c) Micronuclei rates are elevated following a
faulty mitosis induced by 14r+2n and 16 hours nocodazole. One-way ANOVA with
Tukey’s post-hoc multiple comparison; ***p<0.001.
111
4.1.2. DNA damage in nocodazole-arrested cells
As described above, DNA damage occurring during induction of chromosome
missegregation is deleterious to my experimental strategy, resulting as a
consequence of a prolonged mitotic arrest and should be therefore be minimised.
To quantify DNA damage levels in each condition, the extent of DNA damage was
determined by immunofluorescent staining of γ-H2AX, a phosphorylated histone H3
variant that is incorporated at sites of DNA damage355–357. Cells were deemed to be
positive for DNA damage if they contained three or more discreet γ-H2AX foci, as
previously described226.
Nocodazole treatment for two hours did not significantly elevate DNA damage in
prometaphase RPE-1 cells above the untreated control (figure 4.3a and 4.3b).
Extended treatment with nocodazole for 16 hours significantly increased unresolved
DNA damage at prometaphase, in line with the literature (***p<0.001)350–352,358.
Importantly, pre-synchronising cells at G2/M before a 2-hour nocodazole treatment
did not elevate DNA damage; conversely, a small decrease was observed, although
this did not reach significance. This slight decrease in DNA damage may reflect a
longer time in G2 to correct errors that occurred during DNA replication359.
Importantly, pre-synchronising cells before 2-hour nocodazole wash-out reduced
DNA damage to levels comparable to that observed in the untreated control cells
(figure 4.3a and 4.3b). This demonstrates that the induction of chromosome
missegregation can be uncoupled from drug treatment-induced DNA damage in
RPE-1 cells.
In practise, despite the concomitant elevation of DNA damage, the 16-hour
nocodazole treatment is a more cost effective and efficient means of elevating
chromosome missegregation. Therefore, during some of the optimisation steps
below, I continue to use this treatment. However, during isolation of aneuploid cells
for further downstream analysis in future experiments I will pre-synchronise cells
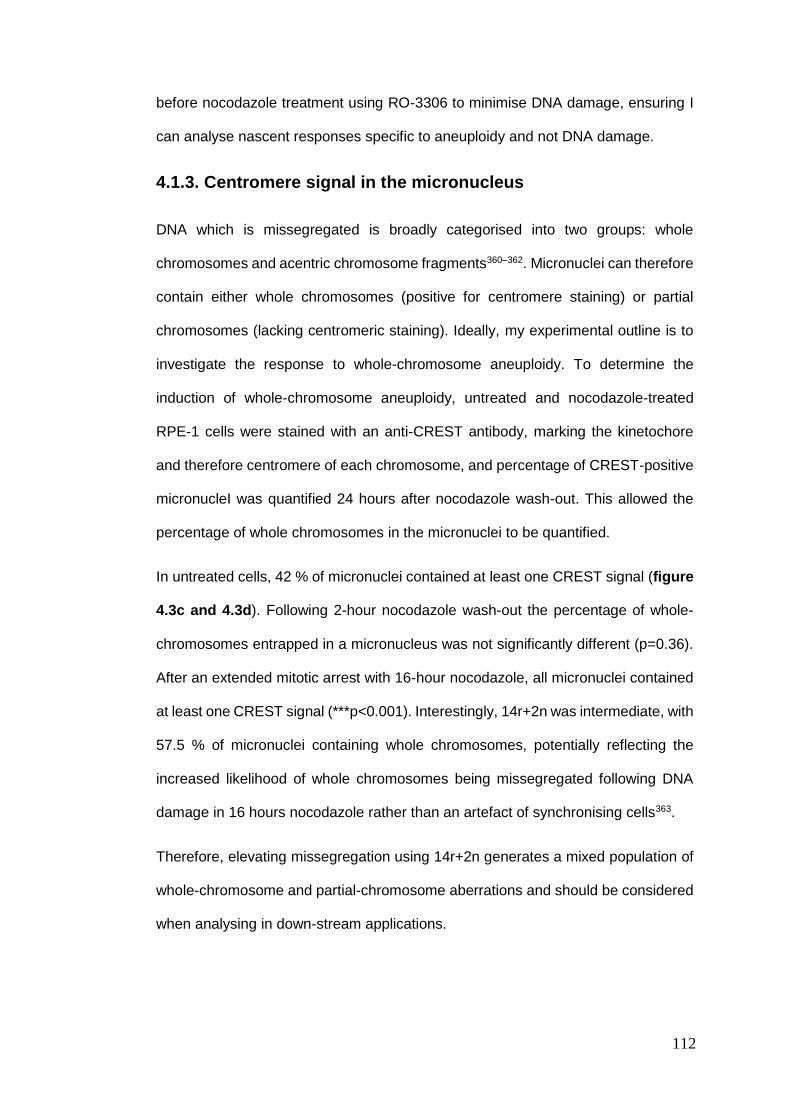
112
before nocodazole treatment using RO-3306 to minimise DNA damage, ensuring I
can analyse nascent responses specific to aneuploidy and not DNA damage.
4.1.3. Centromere signal in the micronucleus
DNA which is missegregated is broadly categorised into two groups: whole
chromosomes and acentric chromosome fragments360–362. Micronuclei can therefore
contain either whole chromosomes (positive for centromere staining) or partial
chromosomes (lacking centromeric staining). Ideally, my experimental outline is to
investigate the response to whole-chromosome aneuploidy. To determine the
induction of whole-chromosome aneuploidy, untreated and nocodazole-treated
RPE-1 cells were stained with an anti-CREST antibody, marking the kinetochore
and therefore centromere of each chromosome, and percentage of CREST-positive
micronucleI was quantified 24 hours after nocodazole wash-out. This allowed the
percentage of whole chromosomes in the micronuclei to be quantified.
In untreated cells, 42 % of micronuclei contained at least one CREST signal (figure
4.3c and 4.3d). Following 2-hour nocodazole wash-out the percentage of whole-
chromosomes entrapped in a micronucleus was not significantly different (p=0.36).
After an extended mitotic arrest with 16-hour nocodazole, all micronuclei contained
at least one CREST signal (***p<0.001). Interestingly, 14r+2n was intermediate, with
57.5 % of micronuclei containing whole chromosomes, potentially reflecting the
increased likelihood of whole chromosomes being missegregated following DNA
damage in 16 hours nocodazole rather than an artefact of synchronising cells363.
Therefore, elevating missegregation using 14r+2n generates a mixed population of
whole-chromosome and partial-chromosome aberrations and should be considered
when analysing in down-stream applications.
113
Figure 4.3. Prometaphase DNA damage and micronuclei characterisation
following nocodazole wash-out. (a & b) DNA damage is increased in
prometaphase cells arrested in mitosis by extended nocodazole (16 hours,
***p<0.001) but not a 2-hour nocodazole arrest in synchronised cells (14r+2n). (c &
d) Whole-chromosome missegregation was identified using a centromeric stain,
CREST, at 24 hours following nocodazole wash-out. The percentage of CREST-
positive micronuclei (MN) was elevated following 16 hours nocodazole but not for
any other treatment. Inset: CREST negative and positive micronuclei. Boxes:
Micronucleus. One-way ANOVA with Tukey’s post-hoc multiple comparison;
***p<0.001. Scale bars: 15 µm.
114
4.1.4. p21 and p53 nuclear stabilisation following chromosome
missegregation
It has been shown that, following chromosome missegregation, p21 and p53 are
stabilised in the nucleus and limit the proliferation of aneuploid cells by inducing cell-
cycle arrest180,337,364,365. I hypothesised that populations of RPE-1 cells with an
assortment of aneuploidies would stain positive for nuclear p21 and p53, and could
therefore be isolated by fluorescent activated cell sorting – thereby providing an
alternative strategy to that proposed in the primary experimental outline, should it
prove difficult to execute (figure 4.4a cf. figure 4.1).
The nuclear stabilisation of p21 and p53 in control and nocodazole-treated RPE-1
cells was analysed 24 hours following drug wash-out. Cells were classified by the
presence of a micronucleus (MN), indicating that chromosome missegregation had
occurred in the preceding anaphase366. The sister of a cell that harboured a
micronucleus was identified by proximity and classified as MN-positive, as it would
have a high chance of aneuploidy, where an MN represents a change in
chromosome number.
To analyse every cell in the image set, a macro was written for ImageJ which would
automatically quantify the p21 and p53 nuclear staining intensity, therefore reducing
the requirement for time-intensive manual analysis (figure 4.4b & chapter 10.1.1).
Chromosome missegregation induced by 16-hour nocodazole wash-out significantly
increased nuclear p21 and p53 stabilisation in micronuclei-positive cells, as
expected (figure 4.4c-e, ***p<0.001). Interestingly, micronuclei-positive (MN+) cells
following 14r+2n did not show significantly elevated p21 or p53 stabilisation
compared to the internal control cells without micronuclei (MN-). However, it is still
unclear from this experiment whether p21 and p53 are stabilised in the nucleus as
a response to aneuploidy or the DNA damage induced under these conditions. In
115
MN+ cells following 14r+2n, where DNA damage is abrogated, no p21 or p53
stabilisation was observed which suggests that this approach cannot be used to
differentiate between diploid and aneuploid cells, without significant DNA damage
artefacts at this time point. Therefore, below I continue optimising the reporter
chromosome-based approach for aneuploidy detection.
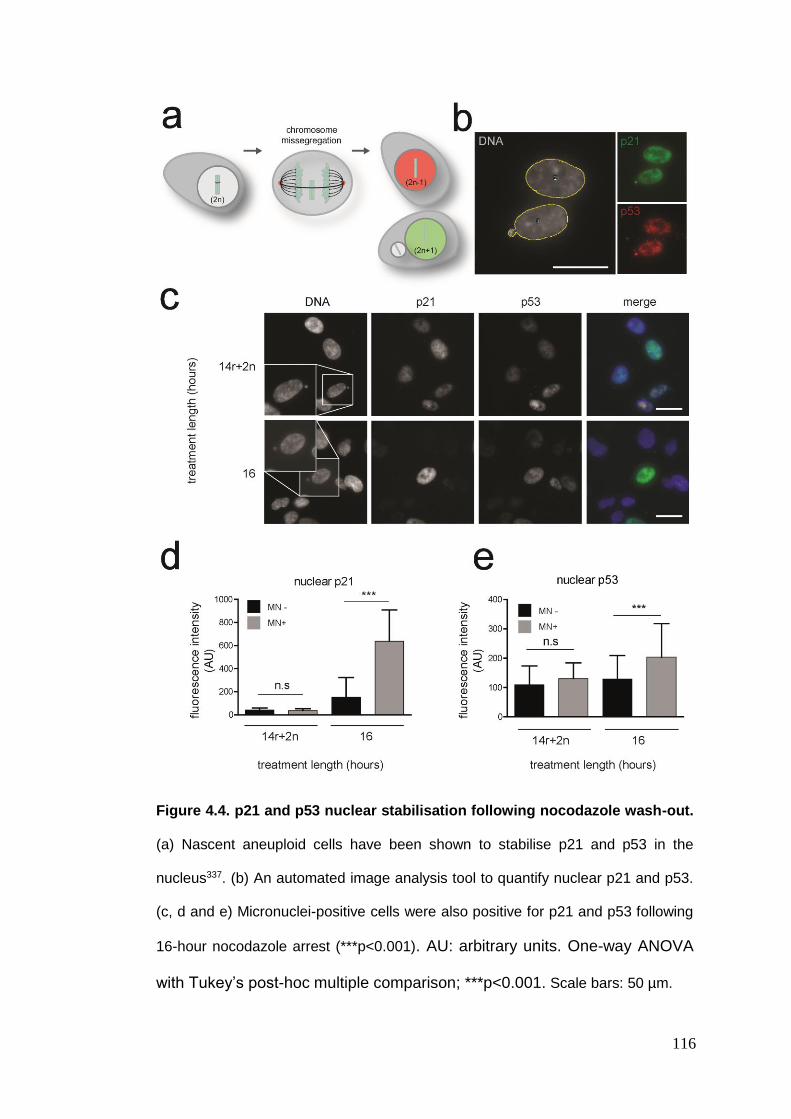
116
Figure 4.4. p21 and p53 nuclear stabilisation following nocodazole wash-out.
(a) Nascent aneuploid cells have been shown to stabilise p21 and p53 in the
nucleus337. (b) An automated image analysis tool to quantify nuclear p21 and p53.
(c, d and e) Micronuclei-positive cells were also positive for p21 and p53 following
16-hour nocodazole arrest (***p<0.001). AU: arbitrary units. One-way ANOVA
with Tukey’s post-hoc multiple comparison; ***p<0.001. Scale bars: 50 µm.
117
4.2. Generating RPE-1-hTERT cells expressing dsEGFP
4.2.1. Construction of a mammalian expression vector
harbouring dsEGFP
To isolate aneuploid cells requires rapid EGFP turn-over following reporter
chromosome loss. However, EGFP is a very stable protein, with a half-life of over
24 hours, therefore I have taken advantage of a destabilised-EGFP (dsEGFP)
protein which has a C-terminal Mouse Ornithine Decarboxylase (ODC1) domain
which targets EGFP for rapid proteasome-mediated degradation (figure 4.5a)367–369.
A plasmid cassette harbouring dsEGFP, a kanamycin antibiotic resistance gene and
a selectable Geneticin (G418) resistance gene was designed (chapter 3.3.1 and
3.3.2). The identity of the resulting plasmid (pSMC50) was checked by restriction
digestion using NheI and NotI that produced bands of the expected sizes (3879 bp
and 843 bp, figure 4.5b), confirming the successful generation of the expression
construct.
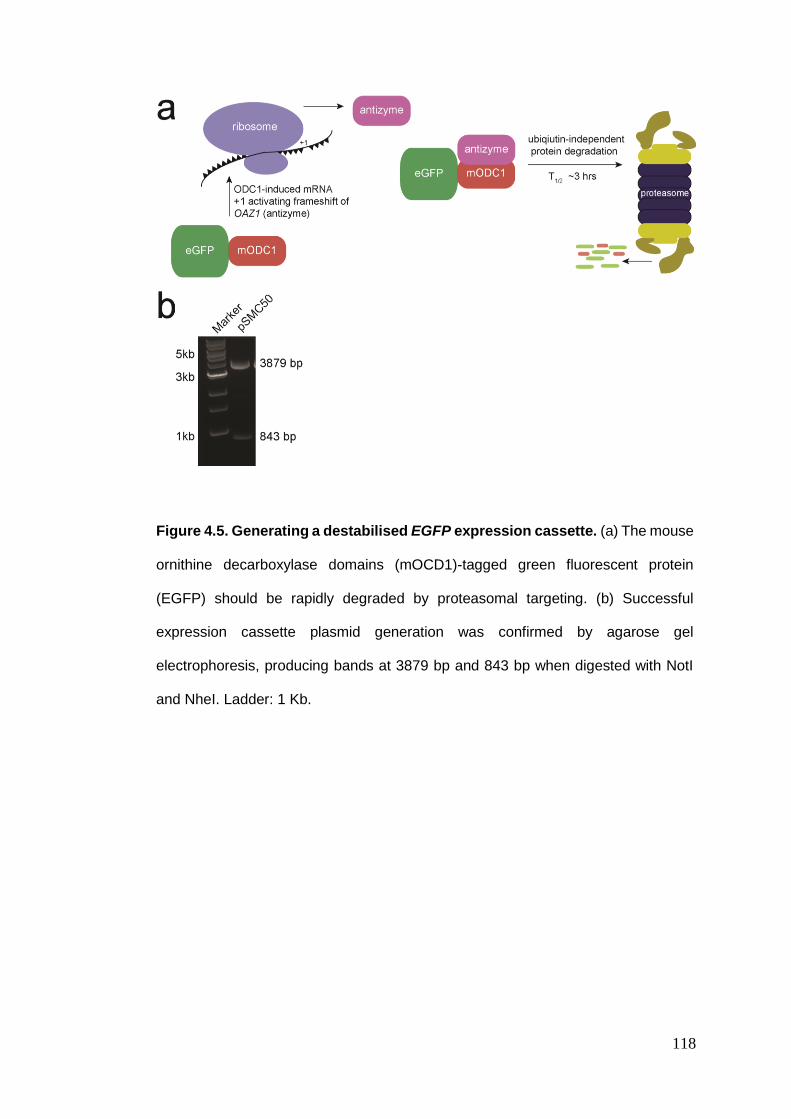
118
Figure 4.5. Generating a destabilised EGFP expression cassette. (a) The mouse
ornithine decarboxylase domains (mOCD1)-tagged green fluorescent protein
(EGFP) should be rapidly degraded by proteasomal targeting. (b) Successful
expression cassette plasmid generation was confirmed by agarose gel
electrophoresis, producing bands at 3879 bp and 843 bp when digested with NotI
and NheI. Ladder: 1 Kb.
119
4.2.2. Inserting the dsEGFP gene into RPE-1 cells
To maximise the chances of integration into a single chromosome, RPE-1 cells were
transfected with a dilution series (1µg, 500ng, 200ng and 100ng) of plasmid DNA.
To isolate cells which had stably taken up the plasmid, cells were re-plated at low
density and treated with Geneticin for 10 days. Geneticin is an antibiotic which is
broken down by a selectable marker on the pSMC50 plasmid cassette –
neomycin370. Following selection, the only plate with single-cell colonies arose from
RPE-1 cells transfected with 1µg plasmid DNA, suggesting that these population
had taken up the plasmid. A total of five clones were isolated, RPE-1-[1-5],
expanded over 14 days, and characterised for expression of dsEGFP.
By conventional fluorescence microscopy the EGFP signal was faint, but visible in
RPE-1 clones. RPE-1 clones 1, 2, 4 and 5 expressed dsEGFP to similar degrees by
fluorescence microscopy (control; figure 4.6a). No detectable EGFP signal was
observed in clone 3.
To confirm the proteasome dependency of EGFP degradation, and more easily
visualise EGFP expression conclusively, each clone was treated with MG132, a
small-molecule inhibitor of the proteasome, for 24 hours371. As expected, apart from
clone 3 which remained negative, EGFP fluorescence intensity increased in each
clone following proteasome inhibition, confirming the proteasome dependency of the
mODC1 domain (figure 4.6a and 4.6b).
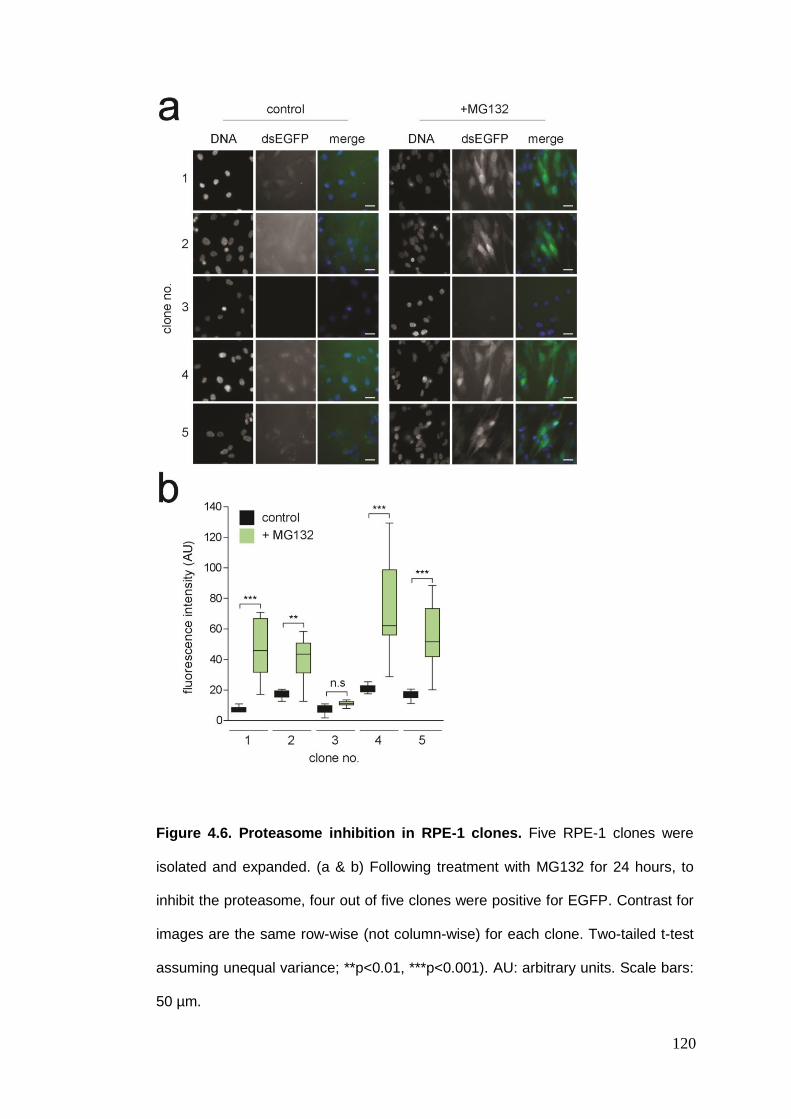
120
Figure 4.6. Proteasome inhibition in RPE-1 clones. Five RPE-1 clones were
isolated and expanded. (a & b) Following treatment with MG132 for 24 hours, to
inhibit the proteasome, four out of five clones were positive for EGFP. Contrast for
images are the same row-wise (not column-wise) for each clone. Two-tailed t-test
assuming unequal variance; **p<0.01, ***p<0.001). AU: arbitrary units. Scale bars:
50 µm.
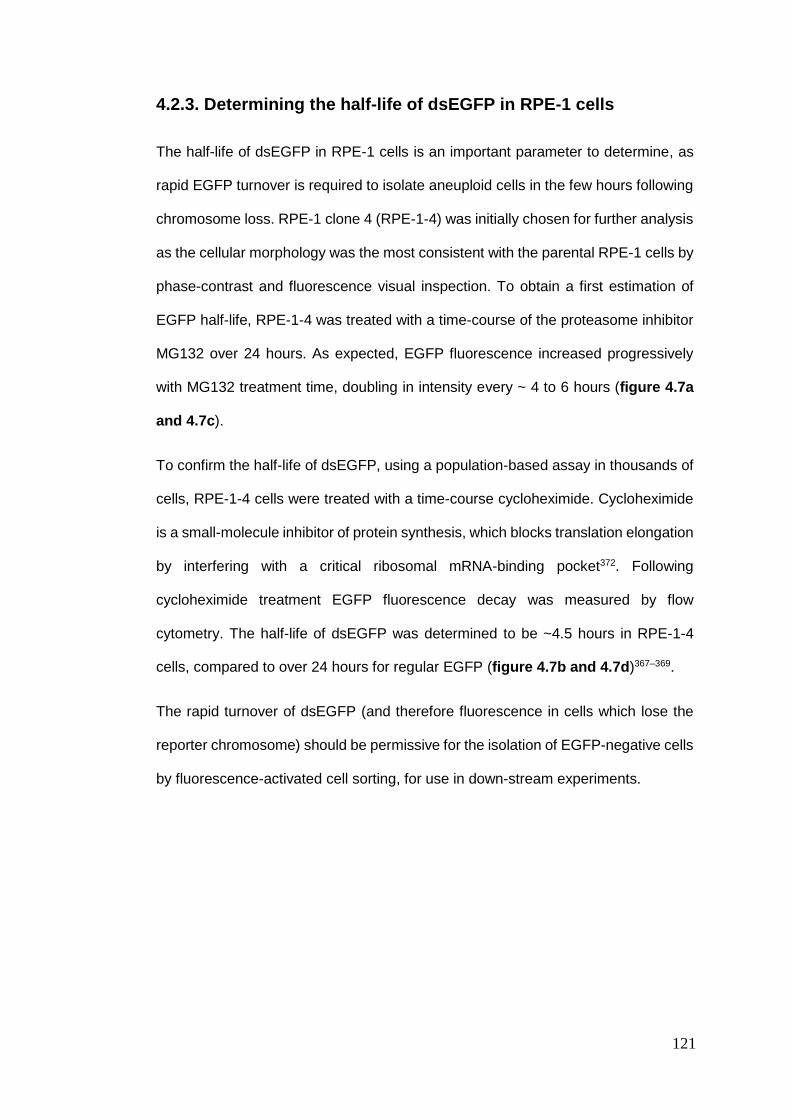
121
4.2.3. Determining the half-life of dsEGFP in RPE-1 cells
The half-life of dsEGFP in RPE-1 cells is an important parameter to determine, as
rapid EGFP turnover is required to isolate aneuploid cells in the few hours following
chromosome loss. RPE-1 clone 4 (RPE-1-4) was initially chosen for further analysis
as the cellular morphology was the most consistent with the parental RPE-1 cells by
phase-contrast and fluorescence visual inspection. To obtain a first estimation of
EGFP half-life, RPE-1-4 was treated with a time-course of the proteasome inhibitor
MG132 over 24 hours. As expected, EGFP fluorescence increased progressively
with MG132 treatment time, doubling in intensity every ~ 4 to 6 hours (figure 4.7a
and 4.7c).
To confirm the half-life of dsEGFP, using a population-based assay in thousands of
cells, RPE-1-4 cells were treated with a time-course cycloheximide. Cycloheximide
is a small-molecule inhibitor of protein synthesis, which blocks translation elongation
by interfering with a critical ribosomal mRNA-binding pocket372. Following
cycloheximide treatment EGFP fluorescence decay was measured by flow
cytometry. The half-life of dsEGFP was determined to be ~4.5 hours in RPE-1-4
cells, compared to over 24 hours for regular EGFP (figure 4.7b and 4.7d)367–369.
The rapid turnover of dsEGFP (and therefore fluorescence in cells which lose the
reporter chromosome) should be permissive for the isolation of EGFP-negative cells
by fluorescence-activated cell sorting, for use in down-stream experiments.
122
Figure 4.7. Characterising the half-life of dsEGFP in RPE-1-4. RPE-1-4 was
phenotypically the most similar to the parental RPE-1 cell line. (a and c) A time-
course of MG132 proteasome inhibition in RPE-1-4 increased EGFP fluorescence
intensity (arbitrary units; AU). (b & d) Treatment with the protein synthesis inhibitor
cycloheximide revealed the dsEGFP half-life to be ~ 4.5 hours in RPE-1-4 by flow
cytometry (n=10,000 cells, from a single experiment). AU: arbitrary units. Scale bars:
50 µm.
123
4.2.4. Sorting RPE-1-4 cells by flow cytometry
To enable a clear separation between the EGFP-negative and positive cells in
subsequent experiments, RPE-1-4 cells expressing the highest 20 % EGFP
fluorescence (named RPE-1-4F herein) were collected by fluorescence-activated
cell sorting (FACS) and used for down-stream experiments (figure 4.8).
To sort single RPE-1-4 cells by flow cytometry a hierarchical gating strategy, which
measures parameters of each cell as it passes through the capillary-flow chamber,
was used. Parental RPE-1 cells were used to set the reference voltage for the laser
that excites EGFP (B530/30-A) so that, on a logarithmic scale of arbitrary
fluorescence intensity, cells fluoresced with a maximum intensity of 103 EGFP
arbitrary units (AU). This is important as cells from clones RPE-1-4 which fluoresced
greater than this could be easily identified and represented at least a doubling in
EGFP signal. Single, EGFP-positive cells were sorted using by FACS using a BD
FACSAria II (BD Biosciences) and re-cultured for down-stream applications.
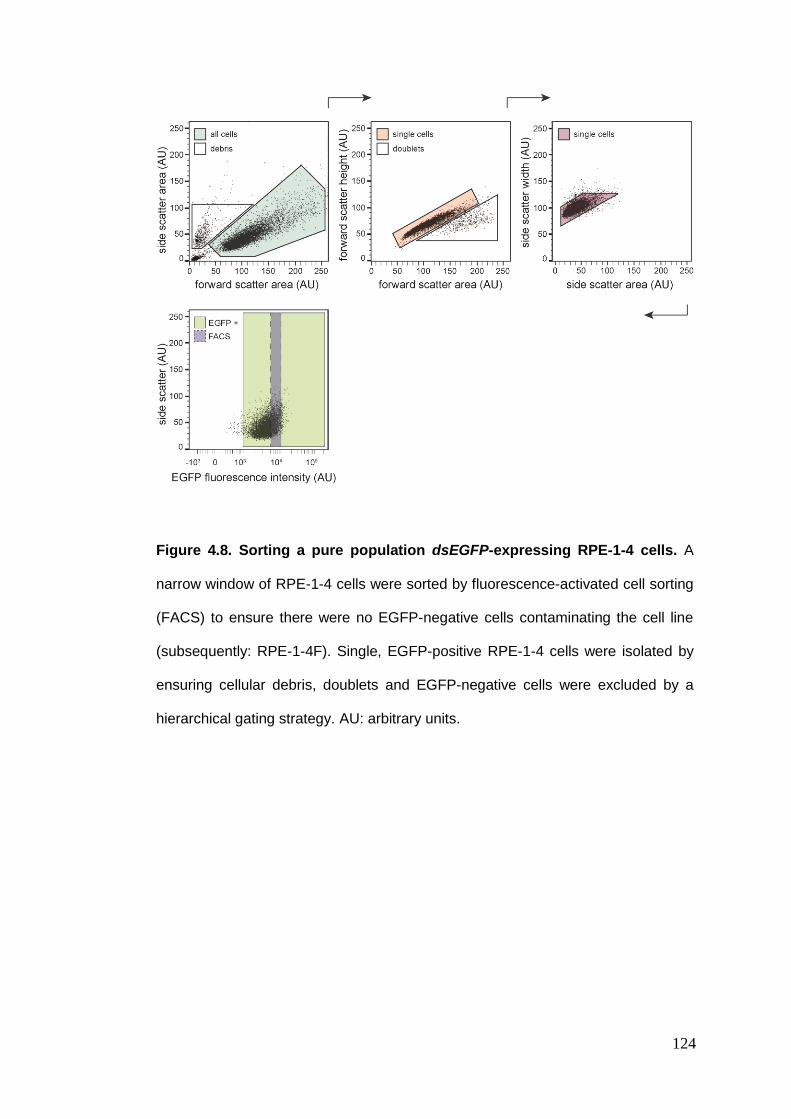
124
Figure 4.8. Sorting a pure population dsEGFP-expressing RPE-1-4 cells. A
narrow window of RPE-1-4 cells were sorted by fluorescence-activated cell sorting
(FACS) to ensure there were no EGFP-negative cells contaminating the cell line
(subsequently: RPE-1-4F). Single, EGFP-positive RPE-1-4 cells were isolated by
ensuring cellular debris, doublets and EGFP-negative cells were excluded by a
hierarchical gating strategy. AU: arbitrary units.
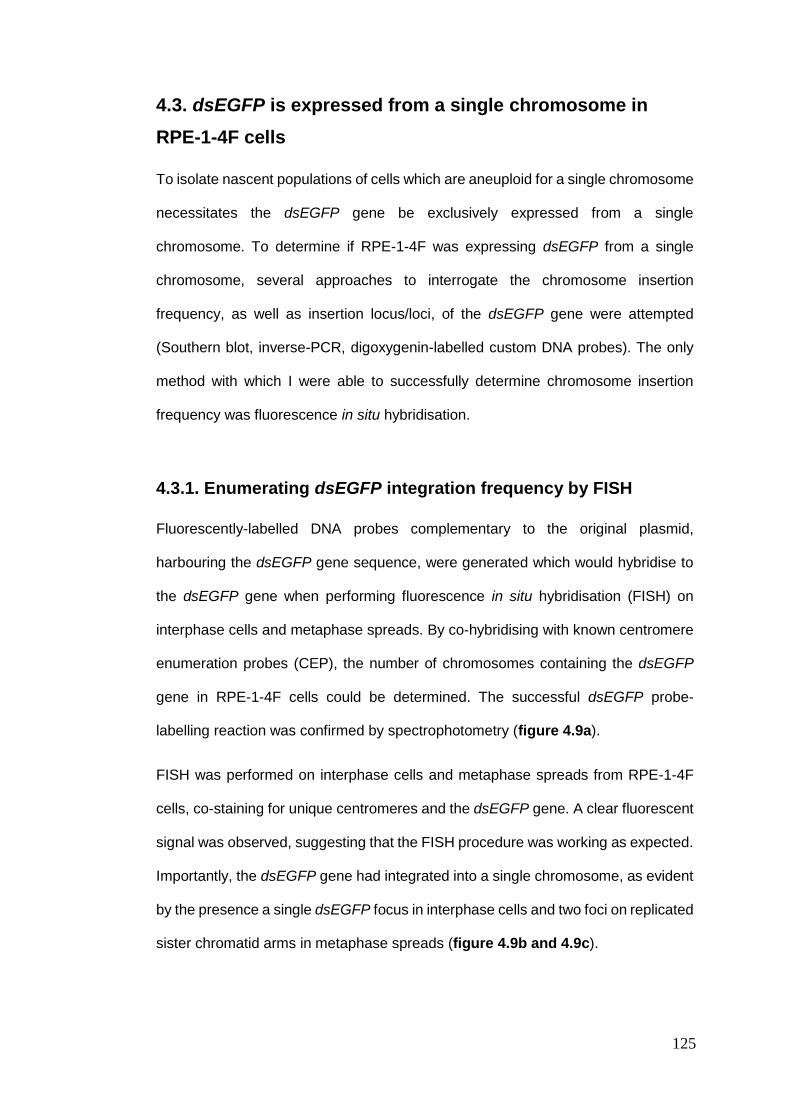
125
4.3. dsEGFP is expressed from a single chromosome in
RPE-1-4F cells
To isolate nascent populations of cells which are aneuploid for a single chromosome
necessitates the dsEGFP gene be exclusively expressed from a single
chromosome. To determine if RPE-1-4F was expressing dsEGFP from a single
chromosome, several approaches to interrogate the chromosome insertion
frequency, as well as insertion locus/loci, of the dsEGFP gene were attempted
(Southern blot, inverse-PCR, digoxygenin-labelled custom DNA probes). The only
method with which I were able to successfully determine chromosome insertion
frequency was fluorescence in situ hybridisation.
4.3.1. Enumerating dsEGFP integration frequency by FISH
Fluorescently-labelled DNA probes complementary to the original plasmid,
harbouring the dsEGFP gene sequence, were generated which would hybridise to
the dsEGFP gene when performing fluorescence in situ hybridisation (FISH) on
interphase cells and metaphase spreads. By co-hybridising with known centromere
enumeration probes (CEP), the number of chromosomes containing the dsEGFP
gene in RPE-1-4F cells could be determined. The successful dsEGFP probe-
labelling reaction was confirmed by spectrophotometry (figure 4.9a).
FISH was performed on interphase cells and metaphase spreads from RPE-1-4F
cells, co-staining for unique centromeres and the dsEGFP gene. A clear fluorescent
signal was observed, suggesting that the FISH procedure was working as expected.
Importantly, the dsEGFP gene had integrated into a single chromosome, as evident
by the presence a single dsEGFP focus in interphase cells and two foci on replicated
sister chromatid arms in metaphase spreads (figure 4.9b and 4.9c).
126
Figure 4.9. The dsEGFP gene integrated into a single chromosome in RPE-1-
4F cells. (a) DNA probes conjugated with Alexa-488 dye were generated and the
probe quality checked by spectrophotometry. (b) Fluorescence in situ hybridisation
(FISH) with dsEGFP probes and known centromere enumeration probes (CEP;
chromosomes 15, 13 and 21) revealed a single integration in interphase cells. (c)
FISH on metaphase spreads confirmed the dsEGFP gene had integrated on the
distal q-arm of an unidentified chromosome. (c, inset) One signal could be observed
on each sister chromatid as expected following DNA replication. Scale bars: 30µm.
127
4.4. Summary
Here I have optimised a drug-induced chromosome missegregation strategy and
generated a fluorescence-based aneuploidy reporter cell line. The main benefit of
using the mitotic inhibitor drugs described (sequential RO-3306 synchronisation
followed by a short nocodazole wash-out) is that I are able to significantly elevate
chromosome missegregation, without generating DNA damage, in a cell line with
otherwise low spontaneous aneuploidy rates. Moreover, the rapid loss of EGFP
fluorescence in my single-chromosome aneuploidy-reporter cell line should enable
the isolation of monosomic cells by FACS for down-stream experiments.
It is important to highlight that it is still unclear whether there is the potential for EGFP
loss by other transcriptional or post-translational mechanisms independent of
aneuploidy; or if EGFP signal is lost during apoptosis. Therefore during my analysis
in chapter 5 I draw particular attention to these caveats where applicable.

128
5. Isolation and
characterisation of
monosomic human cells
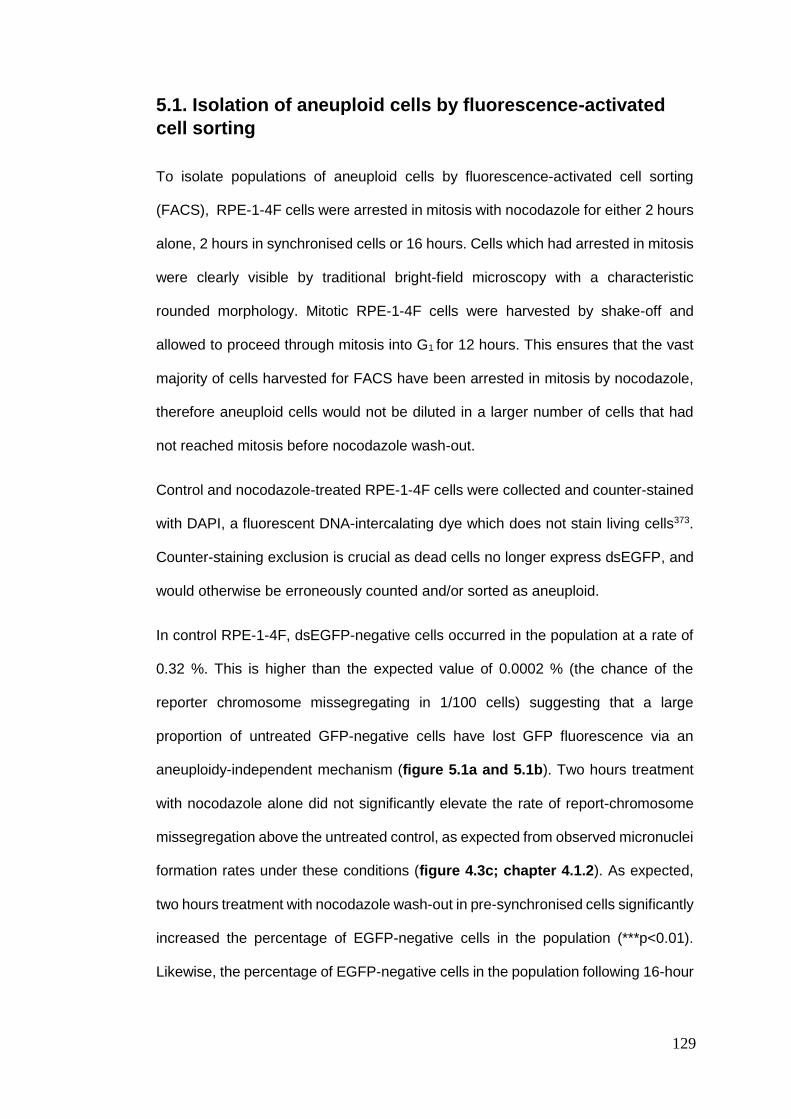
129
5.1. Isolation of aneuploid cells by fluorescence-activated
cell sorting
To isolate populations of aneuploid cells by fluorescence-activated cell sorting
(FACS), RPE-1-4F cells were arrested in mitosis with nocodazole for either 2 hours
alone, 2 hours in synchronised cells or 16 hours. Cells which had arrested in mitosis
were clearly visible by traditional bright-field microscopy with a characteristic
rounded morphology. Mitotic RPE-1-4F cells were harvested by shake-off and
allowed to proceed through mitosis into G1 for 12 hours. This ensures that the vast
majority of cells harvested for FACS have been arrested in mitosis by nocodazole,
therefore aneuploid cells would not be diluted in a larger number of cells that had
not reached mitosis before nocodazole wash-out.
Control and nocodazole-treated RPE-1-4F cells were collected and counter-stained
with DAPI, a fluorescent DNA-intercalating dye which does not stain living cells373.
Counter-staining exclusion is crucial as dead cells no longer express dsEGFP, and
would otherwise be erroneously counted and/or sorted as aneuploid.
In control RPE-1-4F, dsEGFP-negative cells occurred in the population at a rate of
0.32 %. This is higher than the expected value of 0.0002 % (the chance of the
reporter chromosome missegregating in 1/100 cells) suggesting that a large
proportion of untreated GFP-negative cells have lost GFP fluorescence via an
aneuploidy-independent mechanism (figure 5.1a and 5.1b). Two hours treatment
with nocodazole alone did not significantly elevate the rate of report-chromosome
missegregation above the untreated control, as expected from observed micronuclei
formation rates under these conditions (figure 4.3c; chapter 4.1.2). As expected,
two hours treatment with nocodazole wash-out in pre-synchronised cells significantly
increased the percentage of EGFP-negative cells in the population (***p<0.01).
Likewise, the percentage of EGFP-negative cells in the population following 16-hour
130
nocodazole wash-out was significantly greater than the untreated control
(***p<0.001).
These data suggest that a prolonged (16-hour), or a short (2-hour in synchronised
cells), nocodazole arrest is able to elevate the rate of reporter-chromosome loss in
the EGFP-negative population. Due to a wide range of EGFP fluorescence, it was
not possible to identify EGFP- double positive cells (with two copies of the reporter
chromosome; 2n+1), which would be expected to exhibit approximately twice the
EGFP fluorescence of diploid cells. Of note, EGFP-positive cells represent a
population in which an assortment of aneuploidies (for unlabelled chromosomes) is
likely, and should not be mistaken for completely diploid.
EGFP-negative and EGFP-positive cells were sorted by FACS following both 16-
hour and 14r+2n wash-out in this way for the subsequent characterisation
experiments described below.
131
Figure 5.1. The loss of dsEGFP fluorescence following nocodazole wash-out.
(a) Aneuploidy, as judged by the loss of dsEGFP expression by flow cytometry, was
rare in untreated RPE-1-4F cells (control). The loss of dsEGFP was increased
following nocodazole wash-out. (b) Treatment with nocodazole for two hours did not
significantly elevate the rate of dsEGFP-negative cells in the population. Elevating
aneuploidy by both 14r+2n and 16 hours nocodazole wash-out significantly
increased the rate of dsEGFP loss in RPE-1-4F cells. AU: arbitrary units. One-way
ANOVA with Tukey’s post-hoc multiple comparison; **p<0.01, ***p<0.001).
132
5.2. Determining the identity of the reporter chromosome
Having isolated EGFP-negative cells, I wanted to identify the reporter chromosome.
Given that I had preliminary data suggesting the dsEGFP gene was located on a
single chromosome (see chapter 4.3.1), it is was likely that EGFP-negative cells
were aneuploid for a single chromosome, and so I proceeded with down-stream
analyses for confirmation. Unfortunately, temporary problems were encountered
with dsEGFP FISH probe hybridisation efficiency. Therefore below, I characterise
EGFP-negative cells, using alternative strategies, to determine the reporter
chromosome identity.
5.2.1. SNP array
Changes in chromosome copy number can be determined by assessing the allelic
frequency of single-nucleotide polymorphisms (SNP) – changes to a single base at
many susceptible genomic loci374. EGFP-positive and negative RPE-1-4F cells
sorted by FACS following 14r+2n and 16h nocodazole wash-out were sent for SNP
array analysis (Affymetrix). Additionally, control samples from parental RPE-1,
untreated RPE-1-4F, HCT116 and HCT116+3 cells were also analysed to calibrate
the SNP array sensitivity.
5.2.1.1. HCT116 SNP array
HCT116 cells are a near-diploid, chromosomally-stable human colon carcinoma cell
line of male origin that are known to have lost their Y chromosome in ~90% of
cells338. Accordingly, the SNP array revealed the presence of a single X
chromosome (Log2=-0.5) and complete loss of the Y chromosome (log2=<1).
HCT116 cells are also known to harbour three stable-propagated chromosome
translocations on one of each chromosomes 10, 16 and 18 allele (figure 5.2a)276,338.
Comparison between the published karyogram and the SNP array revealed the
133
translocation on chromosome 10q is a result of short chromosome 10q duplication
(log2=0.5, figure 5.2b). The translocated chromosome 16 allele is a large
translocation and duplication involving chromosome 8q, visible by the G-banding
pattern and amplification of chromosome 8q (log2=0.5,). Finally, the chromosome
18p translocation results from a duplication of a region at the distal end of
chromosome 17q (log2=0.5). HCT116+3 cells possess a known gene amplification
site on chromosome 3q375. I were unable to detect the chromosome 3q amplification
(log2<0.5, figure 5.2c). These data demonstrate that SNP array is sensitive to whole
chromosome copy number alterations and population-wide translocations. However,
gene amplifications cannot be detected due to the inherently low resolution of
population-based genomic assays.
134
Figure 5.2. HCT116 and HCT116+3 single nucleotide polymorphism array. (a)
HCT116 cells are known to harbour three stably propagated translocated alleles276.
(b) Single nucleotide polymorphism (SNP) array revealed the translocations to be
t(10q:10q), t(18q:16p) and t(17q:18p). (c) A sub-clone of HCT116 with a
chromosome 3 amplification was undetectable above the level of background noise.
135
5.2.1.1. RPE-1 SNP array
Parental RPE-1 cells, of female origin, are ostensibly diploid however some isolates
are known to display stably-propagated aberrations particularly of chromosomes 10
and 12336,376. I were unaware of the additional chromosome 12 aberration in some
RPE-1 isolates prior to generating my aneuploid reporter clone (RPE-1-4F) in RPE-
1 cells.
SNP array analysis confirmed both gain of chromosome 12 (log2=0.25) and
amplification of chromosome 10q in parental RPE-1 cells (log2=>0.5; figure 5.3a).
Fortuitously, in RPE-1-4F cells, the trisomy of chromosome 12 was not observed,
suggesting that this clone originated from the small percentage of cells not carrying
trisomy 12 in my isolate of RPE-1 cells (figure 5.3b). This is important as trisomy 12
in my aneuploidy reporter strategy would have been a direct conflict of the
experimental aim – to induce aneuploidy. No other significant gross chromosomal
changes were observed.
EGFP-negative RPE-1-4F cells were sorted by FACS following both 14r+2n and 16
hours nocodazole wash-out. The variability in DNA content induced by both
treatments was similar (figure 5.3c and figure 5.3d). Unfortunately, I were unable
to detect a significant change in chromosome copy number in EGFP-negative RPE-
1-4F cells by SNP array following either drug treatment. This could reflect the
sensitivity of the SNP array to detect changes in whole chromosome copy number
where the aneuploidy is not present in every cell, suggesting that my EGFP-negative
population is not sufficiently enriched for a specific monosomy above the noise for
detection by SNP array. The enrichment of monosomy in the EGFP-negative
population, and the level required for SNP array detection, are therefore unclear
from this data.
136
Figure 5.3. RPE-1 single nucleotide polymorphism array. RPE-1 cells were sent
for SNP array analysis. (a) RPE-1 parental. (b) RPE-1-4F control. (c) RPE-1-4F,
14r+2n, EGFP-negative. (d) RPE-1-4F, 16 hours nocodazole, EGFP-negative.
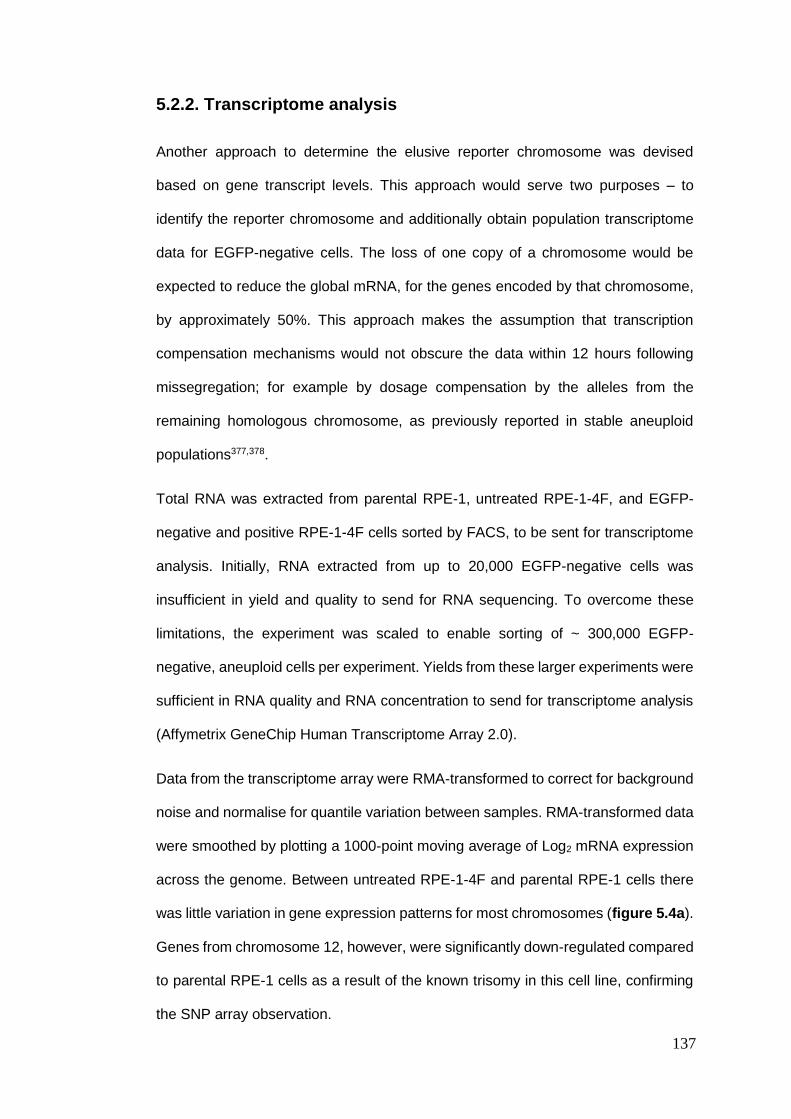
137
5.2.2. Transcriptome analysis
Another approach to determine the elusive reporter chromosome was devised
based on gene transcript levels. This approach would serve two purposes – to
identify the reporter chromosome and additionally obtain population transcriptome
data for EGFP-negative cells. The loss of one copy of a chromosome would be
expected to reduce the global mRNA, for the genes encoded by that chromosome,
by approximately 50%. This approach makes the assumption that transcription
compensation mechanisms would not obscure the data within 12 hours following
missegregation; for example by dosage compensation by the alleles from the
remaining homologous chromosome, as previously reported in stable aneuploid
populations377,378.
Total RNA was extracted from parental RPE-1, untreated RPE-1-4F, and EGFP-
negative and positive RPE-1-4F cells sorted by FACS, to be sent for transcriptome
analysis. Initially, RNA extracted from up to 20,000 EGFP-negative cells was
insufficient in yield and quality to send for RNA sequencing. To overcome these
limitations, the experiment was scaled to enable sorting of ~ 300,000 EGFP-
negative, aneuploid cells per experiment. Yields from these larger experiments were
sufficient in RNA quality and RNA concentration to send for transcriptome analysis
(Affymetrix GeneChip Human Transcriptome Array 2.0).
Data from the transcriptome array were RMA-transformed to correct for background
noise and normalise for quantile variation between samples. RMA-transformed data
were smoothed by plotting a 1000-point moving average of Log2 mRNA expression
across the genome. Between untreated RPE-1-4F and parental RPE-1 cells there
was little variation in gene expression patterns for most chromosomes (figure 5.4a).
Genes from chromosome 12, however, were significantly down-regulated compared
to parental RPE-1 cells as a result of the known trisomy in this cell line, confirming
the SNP array observation.
138
Significant changes in mRNA expression in EGFP-negative, aneuploid cells were
observed (figure 5.4b). The variation of mRNA expression increased in comparison
to untreated RPE-1-4F cells. Additionally, notable differences above this base-line
were observed for chromosomes 1q, 5, 6 and 15. Chromosome 1q exhibited a
marked drop in expression (up to -15.9 %), chromosome 5 increased (up to +40.39
%), chromosome 6 expression had fallen (up to -28.37 %) and chromosome 15
expression had significantly increased (up to 66.12 %).
These data suggest that the EGFP-negative populations are enriched for monosomy
6 cells, and thus chromosome 6 is a candidate to be harbouring the EGFP
transgene. Although monosomy enrichment was sufficient to be observed by
transcriptome analysis, monosomy 6 was not enriched enough to be seen by SNP
array suggesting that some of the analysis down-stream applies to populations
which are not 100 % monosomic. This could further be a consequence of sorting
EGFP-negative cells which are not aneuploid, due to a transient loss of EGFP signal
or other mechanisms which spontaneously alter EGFP intensity following
nocodazole wash-out.
139
Figure 5.4. RPE-1-4F transcriptome analysis. RPE-1 cells sorted by FACS were
sent for transcriptome analysis. (a) RPE-1-4F mRNA normalised to parental RPE-1
global mRNA. No differences were observed for any chromosomes except
chromosome 12. (b) RPE-1-4F, 14r+2n, GFP-negative. mRNA were normalised to
parental RPE-1. Blue box: chromosome 6 gene down-regulation.
140
5.2.3. FISH analysis of chromosome 6 in EGFP-negative and
positive cells
To confirm the identity of the reporter chromosome, centromeric FISH was
performed on EGFP-negative and positive cell sorted by FACS, post-nocodazole
treatment. The signal to noise ratio for centromere probes specific to chromosome
6 and a control, chromosome 11, were sufficient to score aneuploidy rates in 1000
cells for each condition.
Importantly, EGFP-positive cells remained largely diploid for both chromosome 6
and chromosome 11 (figure 5.5 and 5.5b). Conversely, dsEGFP-negative cells
were enriched for cells containing either nullisomy or monosomy 6 (74.9 %),
whereas chromosome 11 monosomy remained comparable to the EGFP-positive,
diploid cells.
These data suggest that chromosome 6 is the identity of the dsEGFP reporter
chromosome which is lost in EGFP-negative RPE-1-4F cells post-nocodazole wash-
out. However, I could not validate this with SNP array, suggesting EGFP-negative
monosomy enrichment needs to be improved. Down-stream analysis of aneuploid
cells isolated in this way may be a useful tool for assessing the early responses to
aneuploidy in human cells. However, further optimisations of the methods used to
induce missegregation (to induce greater whole-chromosome aneuploidy) and ways
to enhance monosomy enrichment are required for extensive characterisation using
this novel approach. The McClelland lab is currently developing more precise ways
to isolate highly-enriched monosomy population for single chromosomes which will
augment the data presented below in future experiments.
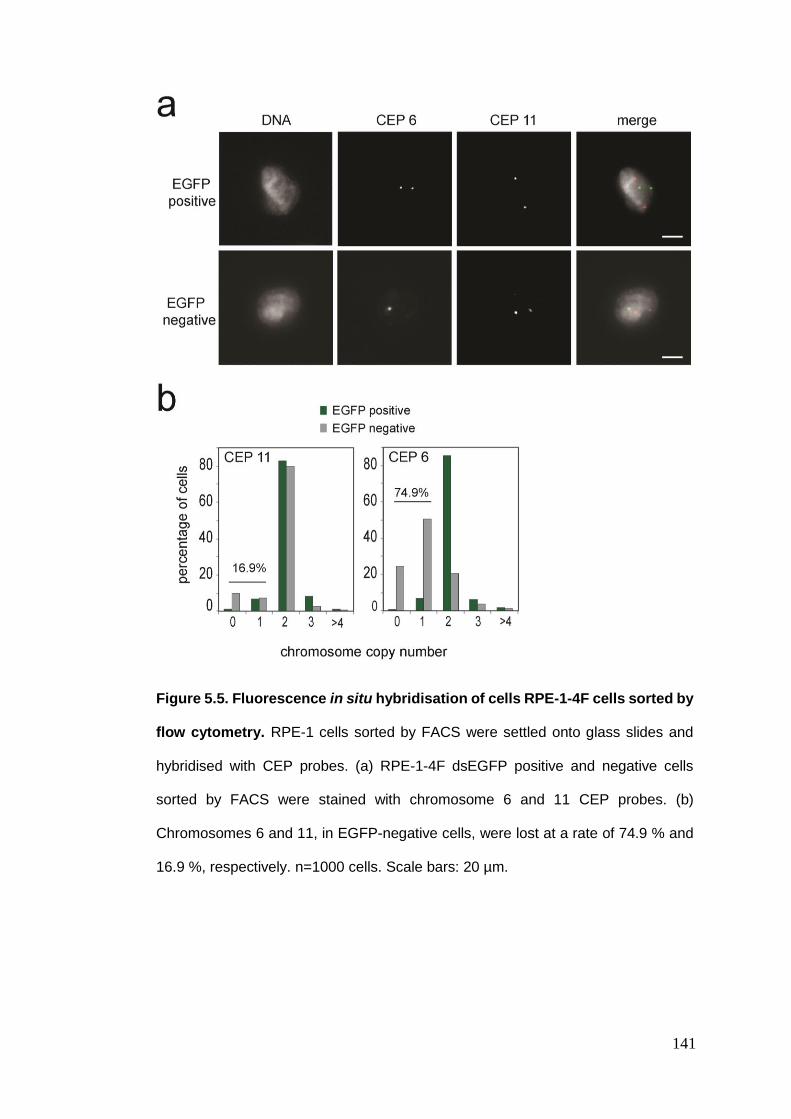
141
Figure 5.5. Fluorescence in situ hybridisation of cells RPE-1-4F cells sorted by
flow cytometry. RPE-1 cells sorted by FACS were settled onto glass slides and
hybridised with CEP probes. (a) RPE-1-4F dsEGFP positive and negative cells
sorted by FACS were stained with chromosome 6 and 11 CEP probes. (b)
Chromosomes 6 and 11, in EGFP-negative cells, were lost at a rate of 74.9 % and
16.9 %, respectively. n=1000 cells. Scale bars: 20 µm.
142
5.3. Characterisation of aneuploid cells
In this section, I begin to characterise the phenotypic responses of non-transformed
human cells to chromosome missegregation, albeit from a less than 100 % pure
population of cells. Therefore, the data described below are likely to underrepresent
the de facto responses to monosomy in human cells and form the preliminary basis
for further experimentation to validate the data presented in this chapter.
5.3.1. Cell cycle arrest and apoptosis
It is known that non-transformed cells arrest in the subsequent G1 following
chromosome missegregation337,379–382. To confirm this phenotype in my aneuploidy-
reporter cell line, EGFP-positive and negative RPE-1-4F cells were fixed and stained
with DAPI, and the DNA content of single cells analysed by flow cytometry (figure
5.6a). EGFP-positive cells showed a cell-cycle profile consistent with that expected
for proliferating diploid cells 12 hours following release from mitotic arrest, with the
emergence of S-phase and G2/M peaks (4.99 %). In contrast, EGFP-negative cells
had arrested in G1, as expected, and were not observed at either S or G2/M (0.00
%).
To determine the survival rate of aneuploid human cells, EGFP-positive and
negative cells were seeded at low density and allowed to form colonies over 10 days.
The colony outgrowth of the EGFP-negative cells was significantly reduced, as
determined by crystal violet staining and absolute colony counts (figure 5.6b;
**p<0.01). One important consideration is that EGFP-positive cells are not strictly
diploid, as a small fraction of cells will also have missegregated unlabelled
chromosomes. Therefore these data are more reflective of enriched vs. non-
enriched aneuploid population survival.
143
To determine the mechanism(s) of reduced colony outgrowth, EGFP-positive and
negative cells were interrogated for markers of apoptosis. Apoptotic cells were
identified by the incorporation of DAPI, and the presence of annexinV on the cell
membrane, of unfixed samples at 12 and 24 hours post-nocodazole wash-out by
flow cytometry373. These preliminary data reveal that 36.9 % of EGFP-negative cells
were in late apoptosis by 12 hours post-nocodazole wash-out, compared to 0.2 %
for the untreated control (figure 5.6c and 5.6e). By 24 hours, the fraction of EGFP-
negative cells in late apoptosis had decreased to 3.1 % whilst the percentage of
dead EGFP-negative cells had risen from 13.8 % to 61.6 %, compared to just 0.8 %
for the untreated control (figure 5.6d and 5.6e). These data demonstrate that the
majority of EGFP-negative cells die via apoptosis within 24 hours of nocodazole
wash-out.
Unfortunately, from this experiment alone, the distinction between two main
possibilities is still unclear. Are EGFP-negative cells dying via apoptosis because
they are aneuploid? Or, alternatively, are EGFP-negative cell arising independently
of chromosome loss for reasons which are inducing apoptosis (possibly induced by
unknown nocodazole-related effects)?
I had already observed ~ 20 % of cells in the EGFP-negative population with a
diploid chromosome 6 content, therefore it is not possible to determine the
contribution of diploid vs. aneuploid cells to the overall apoptotic fraction. The
McClelland lab has previously observed aneuploid cells surviving beyond 12 hours
following missegregation by live-cell imaging, therefore it is likely that a proportion
of the EGFP-negative cells are in late apoptosis (or dead) despite the absence of
chromosome missegregation in the preceding anaphase.
However, EGFP-negative cells (although diluted ~ 20 %) may still reveal interesting
transcriptome changes occurring in the early response to chromosome
missegregation in nascent aneuploid cells. These results are described below.
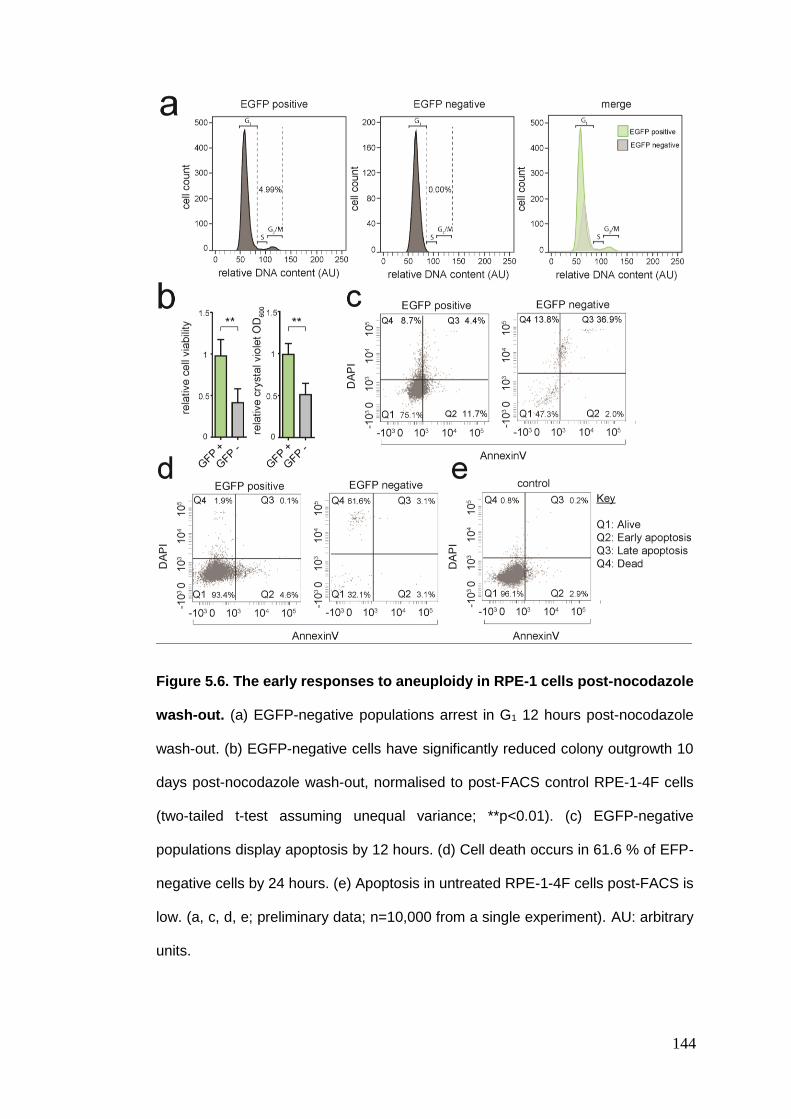
144
Figure 5.6. The early responses to aneuploidy in RPE-1 cells post-nocodazole
wash-out. (a) EGFP-negative populations arrest in G1 12 hours post-nocodazole
wash-out. (b) EGFP-negative cells have significantly reduced colony outgrowth 10
days post-nocodazole wash-out, normalised to post-FACS control RPE-1-4F cells
(two-tailed t-test assuming unequal variance; **p<0.01). (c) EGFP-negative
populations display apoptosis by 12 hours. (d) Cell death occurs in 61.6 % of EFP-
negative cells by 24 hours. (e) Apoptosis in untreated RPE-1-4F cells post-FACS is
low. (a, c, d, e; preliminary data; n=10,000 from a single experiment). AU: arbitrary
units.
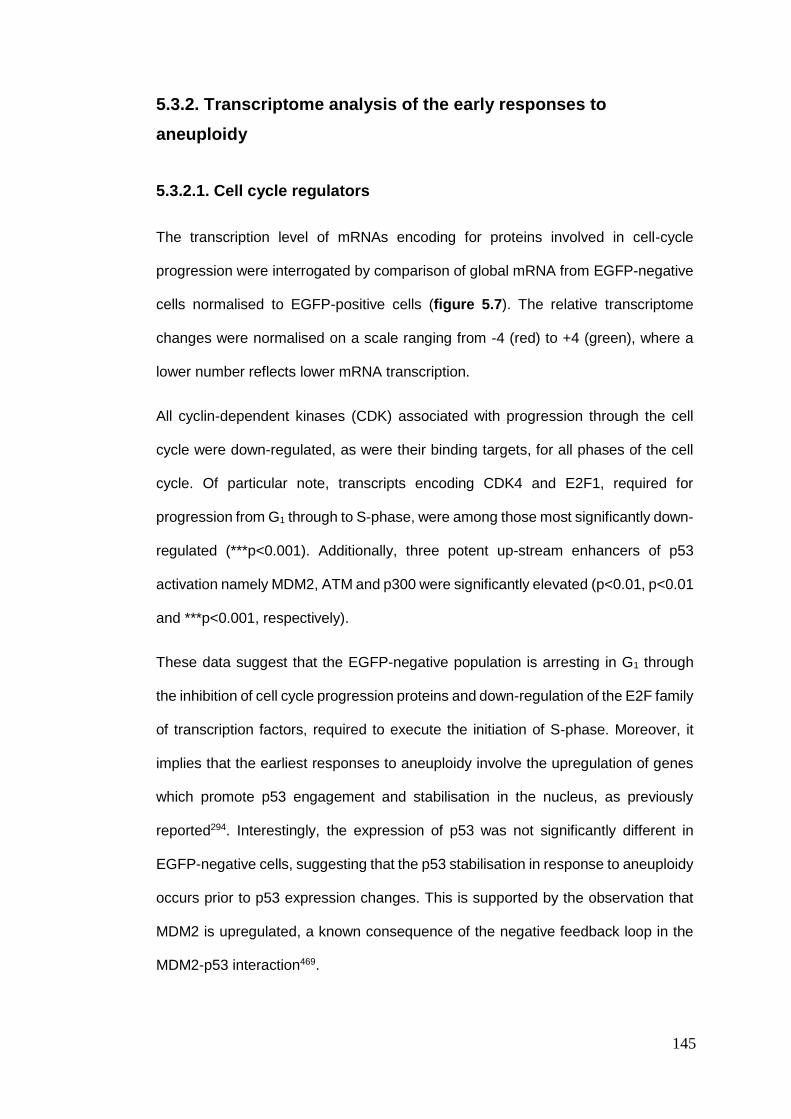
145
5.3.2. Transcriptome analysis of the early responses to
aneuploidy
5.3.2.1. Cell cycle regulators
The transcription level of mRNAs encoding for proteins involved in cell-cycle
progression were interrogated by comparison of global mRNA from EGFP-negative
cells normalised to EGFP-positive cells (figure 5.7). The relative transcriptome
changes were normalised on a scale ranging from -4 (red) to +4 (green), where a
lower number reflects lower mRNA transcription.
All cyclin-dependent kinases (CDK) associated with progression through the cell
cycle were down-regulated, as were their binding targets, for all phases of the cell
cycle. Of particular note, transcripts encoding CDK4 and E2F1, required for
progression from G1 through to S-phase, were among those most significantly down-
regulated (***p<0.001). Additionally, three potent up-stream enhancers of p53
activation namely MDM2, ATM and p300 were significantly elevated (p<0.01, p<0.01
and ***p<0.001, respectively).
These data suggest that the EGFP-negative population is arresting in G1 through
the inhibition of cell cycle progression proteins and down-regulation of the E2F family
of transcription factors, required to execute the initiation of S-phase. Moreover, it
implies that the earliest responses to aneuploidy involve the upregulation of genes
which promote p53 engagement and stabilisation in the nucleus, as previously
reported294. Interestingly, the expression of p53 was not significantly different in
EGFP-negative cells, suggesting that the p53 stabilisation in response to aneuploidy
occurs prior to p53 expression changes. This is supported by the observation that
MDM2 is upregulated, a known consequence of the negative feedback loop in the
MDM2-p53 interaction469.
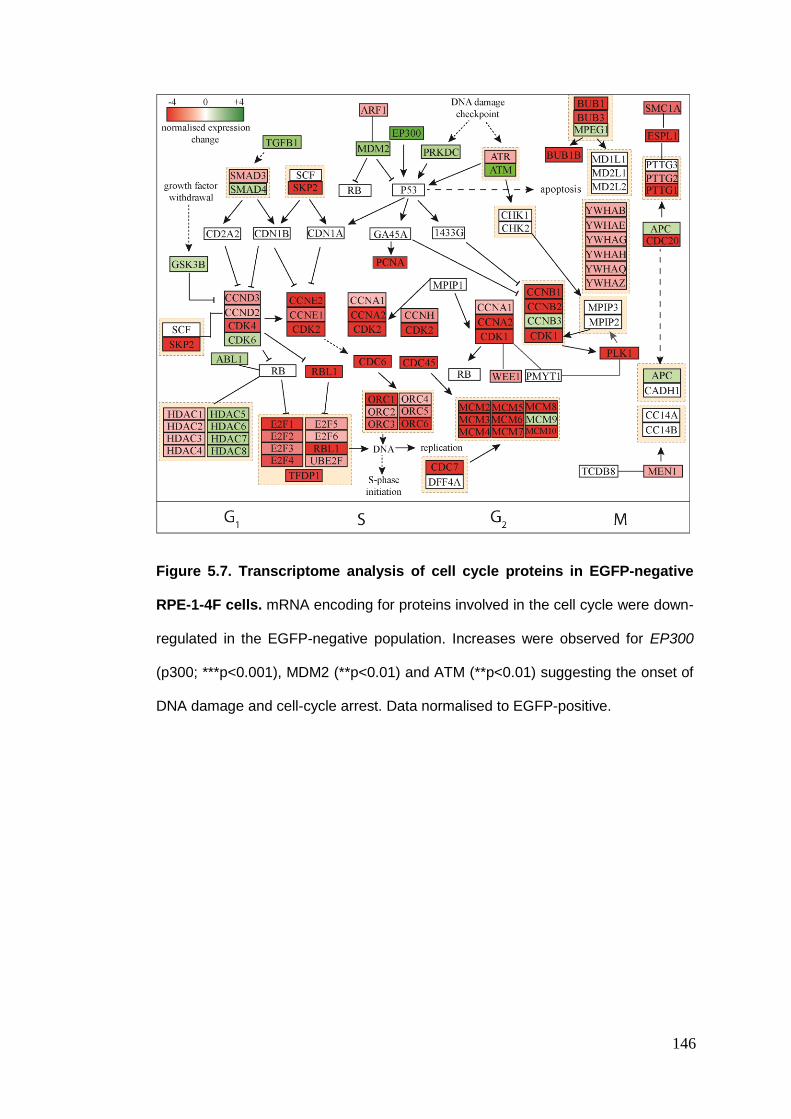
146
Figure 5.7. Transcriptome analysis of cell cycle proteins in EGFP-negative
RPE-1-4F cells. mRNA encoding for proteins involved in the cell cycle were down-
regulated in the EGFP-negative population. Increases were observed for EP300
(p300; ***p<0.001), MDM2 (**p<0.01) and ATM (**p<0.01) suggesting the onset of
DNA damage and cell-cycle arrest. Data normalised to EGFP-positive.
147
5.3.2.2. G1/S checkpoint down-regulation
Of particular interest is the level of transcripts encoding for regulators of the transition
from G1 to S phase of the cell cycle. Strikingly, all transcripts coding for pro-cell
cycle progression proteins, including E2F transcription factor family proteins and
retinoblastoma proteins were significantly down-regulated (figure 5.8). Additionally,
several proteins required for DNA replication and S-phase execution were
significantly down-regulated, most notably POLƐ, MCM2 and RPA2 (***p<0.001).
Additionally, there was an increase in transcripts for the cell cycle CDK regulators,
CDKN2B (***p<0.001). All members of the origin recognition complex (ORC) family
of proteins remained unchanged compared to the untreated control (data not
shown).
The effects of these changes are likely to promote a complete cessation of cell cycle
progression and engaging the DNA damage response pathway. The upregulation of
RPA2 suggests either that a short nocodazole wash-out in synchronised cells is
inducing single-stranded DNA formation, or that the link between aneuploidy and the
DNA damage response is mediated by RPA2. I propose that the latter is more likely,
given that I did not observe significant unresolved DNA damage at prometaphase
following a short nocodazole wash-out in synchronised cells (figure 4.3a and 4.3b;
chapter 4). It is also unclear if some genes may be down-regulated due to
haploinsufficiency of the reporter chromosome and it would be important to correct
for this in further analysis of these data.
148
Figure 5.8. Transcriptome analysis of DNA damage-related proteins in EGFP-
negative RPE-1-4F cells. Gene expression profiles of proteins involved in the DNA
damage repair demonstrated an increase in the upstream DNA damage pathway
activation occurs in nascent aneuploid cells including MDM2 and RPA2. Data
normalised to EGFP-positive.
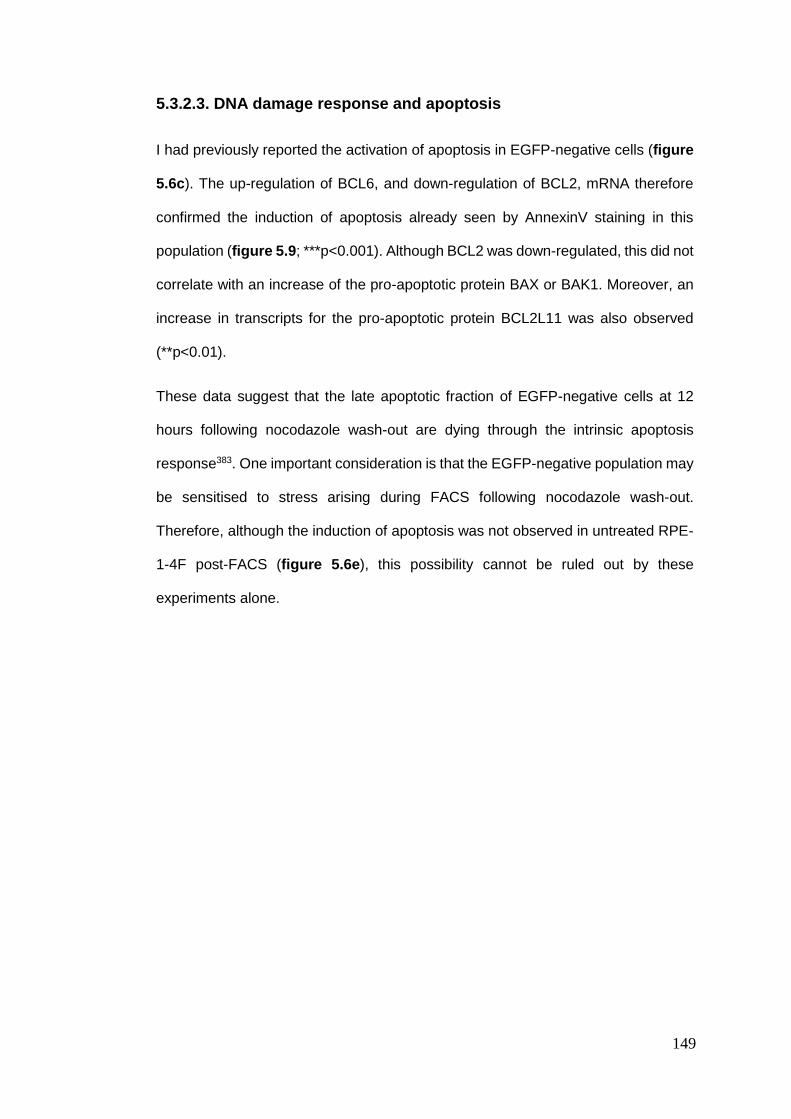
149
5.3.2.3. DNA damage response and apoptosis
I had previously reported the activation of apoptosis in EGFP-negative cells (figure
5.6c). The up-regulation of BCL6, and down-regulation of BCL2, mRNA therefore
confirmed the induction of apoptosis already seen by AnnexinV staining in this
population (figure 5.9; ***p<0.001). Although BCL2 was down-regulated, this did not
correlate with an increase of the pro-apoptotic protein BAX or BAK1. Moreover, an
increase in transcripts for the pro-apoptotic protein BCL2L11 was also observed
(**p<0.01).
These data suggest that the late apoptotic fraction of EGFP-negative cells at 12
hours following nocodazole wash-out are dying through the intrinsic apoptosis
response383. One important consideration is that the EGFP-negative population may
be sensitised to stress arising during FACS following nocodazole wash-out.
Therefore, although the induction of apoptosis was not observed in untreated RPE-
1-4F post-FACS (figure 5.6e), this possibility cannot be ruled out by these
experiments alone.
150
Figure 5.9. Transcriptome analysis of apoptotic signalling networks in EGFP-
negative RPE-1-4F cells. Gene expression profiles of proteins involved in the pro-
and anti-apoptotic responses suggests a significant increase in pro-apoptotic factors
occurs in nascent aneuploid cells. Data normalised to EGFP-positive.
151
5.4. Summary
In chapter 5, I have applied the chromosome missegregation strategy and
aneuploidy reporter cell line from chapter 4 to enrich for EGFP-negative cells and
sort this population by FACS. Using a combination of transcriptome analysis and
traditional FISH, I have identified a ~75 % monosomy 6 enrichment in my EGFP-
negative population. Moreover, I have started to assess the validity of this system
for isolating aneuploid cells as early as 12 hours following chromosome loss.
Populations of cells isolated in this way behave similarly to the literature, arresting
in G1 and undergoing apoptosis, although whether EGFP loss is a cause or
consequence of these phenotypes is still being investigated.
Furthermore, my preliminary transcriptome pathway analysis indicates that many of
the expected consequences of chromosome loss are in agreement with my results,
particularly the down-regulation of cell cycle progression proteins and increased
transcription of pro-apoptotic proteins. However, it is apparent that further
optimisations of this system are required to improve the enrichment of monosomic
cells for down-stream applications to determine nascent aneuploidy responses more
faithfully.
152
6. The missegregation rates
of individual chromosomes
153
Preface
Due to technical limitations, the rate of spontaneous chromosome
missegregation in human tissues is currently unknown. Recent in vitro studies and
mouse models estimate the rate of spontaneous chromosome gain or loss to be
around once in every 100 cell divisions, and this is likely to vary between cell lines
with different tissues of origin312,343. However, the rates of chromosome gain and
loss for the majority of individual chromosomes have yet to be determined in a robust
and systematic manner.
Human chromosomes are very different to each other and this intrinsic variation may
pre-dispose particular chromosomes to missegregation (figure 6.1a). This question
is of fundamental interest to the fields of cell biology and medicine as it is currently
unclear how patterns of aneuploidy in human disease arise, and if certain
chromosomes are vulnerable to missegregation384,385. The available next-generation
technologies, such as single-cell sequencing, are still expensive for routine analysis.
Moreover, manual FISH scoring is artefact-prone and labour intensive, thus there is
high demand for novel approaches to assess the rates of individual human
chromosome missegregation386,387.
Here, I implement a high-throughput image cytometry–based technology to detect
whole-chromosome copy-number alterations (CNA) in response to a variety of
cellular stresses, revealing striking difference in individual chromosome
missegregation rates and patterns of aneuploidy across cell lines with different
tissues of origin.
154
6.1. An image cytometry-based approach to detect
aneuploidy
A variety of methods for imaging cells in flow have been refined following the advent
of traditional flow cytometry. Such approaches have included flying spot scanning,
slit scanning, mirror tracking and strobed illumination cytometry388–390. One of the
greatest challenges for analysing single cells by flow cytometry is achieving imagery
with high enough spatial resolution, fluorescence sensitivity and accuracy to
combine with brightfield images of each cell in the flow. Over the last 10 years,
advances in computing and optical filtration have combined all of these important
parameters, permitting the practical application of imaging flow cytometry.
One such example is the ImageStreamX cytometer, a commercially available
instrument which combines high resolution multispectral imaging with electronic cell
tracking, producing images of comparable quality and resolution as a conventional
60X fluorescent microscope391. With a maximum throughput of 300 cells per second,
the ImageStreamX produces 60,000 images of 10,000 cells in 30 seconds.
Combined with the data analysis software package – IDEAS – this system can
quantify over 250 individual features per cell, opening up a realm of high-throughput
fluorescent imaging and analysis possibilities391.
It has previously been shown that the ImageStreamX can accurately detect
monosomies and trisomies in clinical acute myeloid leukaemia samples, with a
detection sensitivity and false discovery rate of ~ 1 %325. I wanted to test the
ImageStreamX system in my own hands, to determine if I could also detect
aneuploidy in a high-throughput manner. If possible, it was my intent to use this
technology to determine the missegregation rates of individual human
chromosomes, in response to a variety of cellular stresses, as outlined in the preface
to this chapter.
155
6.1.1. Optimising aneuploidy detection by the ImageStreamX
Individual chromosomes were labelled with fluorescent α-satellite centromere
enumeration probes (CEP) by FISH in suspension (FISH-IS). Fluorescent and
bright-field images of single cells were then obtained using the ImageStreamX
cytometer (figure 6.1b). Images were analysed, and the ploidy for each
chromosome determined, using the IDEAS software package325.
Single cells passing through the flow chamber are distinguished from cell
aggregates by low area and high aspect ratio. The extended depth of field (EDF)
element was used to increase the focus range from 4 µm to 16 µm, allowing close
to 100% of cells to be focused. Single, in-focus cells were then analysed for the
ploidy of individual chromosomes by applying a ‘spot mask’ and ‘spot counting’
feature to the centromere probe signals for each image (figure 6.1b).
The images obtained of CEP spots are 2D projections of 3D images, to encompass
the entire volume of the nucleus. If a cell is aligned so that the two centromere
signals are in the same plane, they appear as a single focus, because they overlap
following image deconvolution and projection (figure 6.1c).
To correct for this discrepancy, CEP fluorescence signal intensity was plotted as a
histogram which correlates with the amount of probe hybridised, as well as the spot
count (figure 6.1d). Disomic chromosomes (e.g. RPE-1 chromosome 18) had a
medium intensity of hybridisation signal, representing two spots. Cells with one spot
(e.g. HCT116 chromosome X) will have approximately 50% of the hybridisation
intensity and fall in the low range; cells which had gained a chromosome will have
150% of the hybridisation signal intensity, falling in the high range (e.g. HCT116
stained for both chromosome 18 and X). For the majority of cells with a single CEP
spot, where disomy is anticipated (e.g. RPE-1 chromosome 18), the total
fluorescence for that cell was observed in the medium range of intensity (>99 %).
156
This suggests that they are disomic cells with aberrant ploidy-spot relationship in
which the two signals are eclipsed following image projection, appearing as a single
focus.
Given this, it is anticipated that there will be a small error margin of ploidy
misclassification in my particular ImageStreamX configuration, of approximately 1 %,
as previously reported325. Therefore, complementary approaches such as traditional
FISH and single-cell sequencing will be used to validate these data.
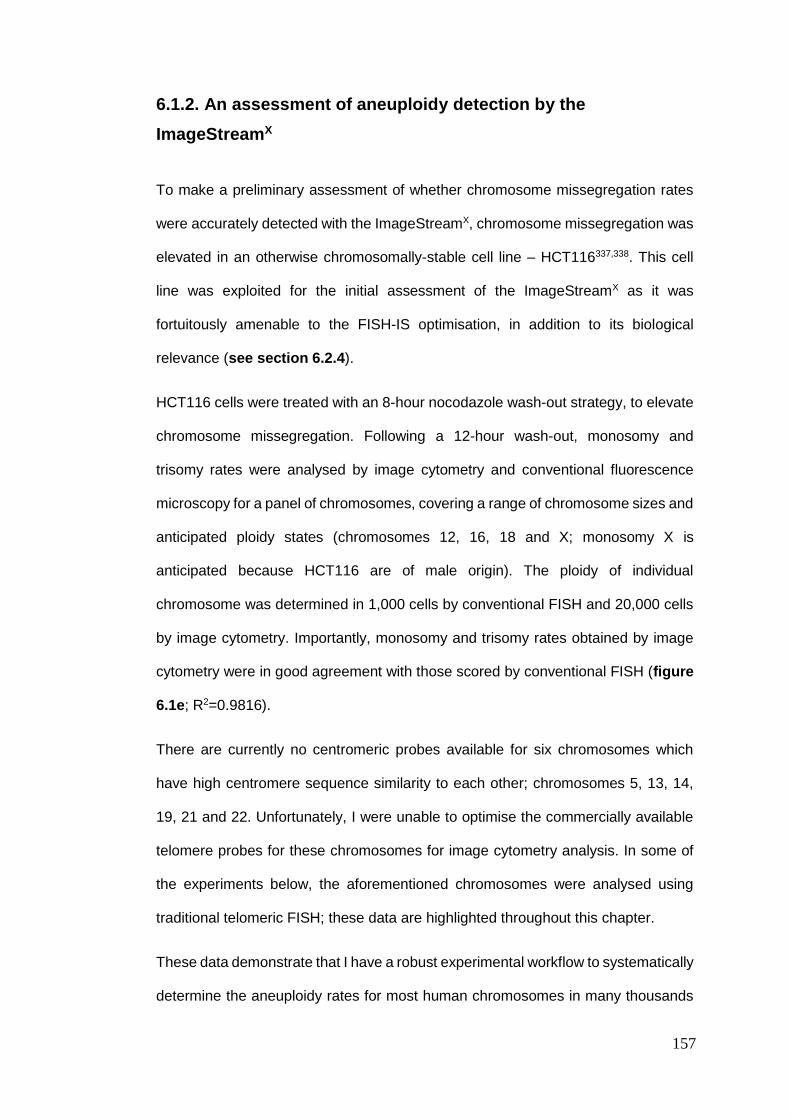
157
6.1.2. An assessment of aneuploidy detection by the
ImageStreamX
To make a preliminary assessment of whether chromosome missegregation rates
were accurately detected with the ImageStreamX, chromosome missegregation was
elevated in an otherwise chromosomally-stable cell line – HCT116337,338. This cell
line was exploited for the initial assessment of the ImageStreamX as it was
fortuitously amenable to the FISH-IS optimisation, in addition to its biological
relevance (see section 6.2.4).
HCT116 cells were treated with an 8-hour nocodazole wash-out strategy, to elevate
chromosome missegregation. Following a 12-hour wash-out, monosomy and
trisomy rates were analysed by image cytometry and conventional fluorescence
microscopy for a panel of chromosomes, covering a range of chromosome sizes and
anticipated ploidy states (chromosomes 12, 16, 18 and X; monosomy X is
anticipated because HCT116 are of male origin). The ploidy of individual
chromosome was determined in 1,000 cells by conventional FISH and 20,000 cells
by image cytometry. Importantly, monosomy and trisomy rates obtained by image
cytometry were in good agreement with those scored by conventional FISH (figure
6.1e; R2=0.9816).
There are currently no centromeric probes available for six chromosomes which
have high centromere sequence similarity to each other; chromosomes 5, 13, 14,
19, 21 and 22. Unfortunately, I were unable to optimise the commercially available
telomere probes for these chromosomes for image cytometry analysis. In some of
the experiments below, the aforementioned chromosomes were analysed using
traditional telomeric FISH; these data are highlighted throughout this chapter.
These data demonstrate that I have a robust experimental workflow to systematically
determine the aneuploidy rates for most human chromosomes in many thousands

158
of cells per experiment. I are therefore able to assess chromosome copy number
alterations, with high accuracy, to determine if certain chromosomes are more
vulnerable to missegregation. This is an important question as determining the
missegregation rates of individual chromosomes may help elucidate the basis for
the recurrent aneuploidy patterns observed in human diseases – do aneuploidy
patterns arise mainly through selection pressure or is there also continual
missegregation of particular chromosomes?
159
Figure 6.1. Aneuploidy can be accurately detected by image cytometry. (a)
Human chromosome attribute map. Chromosomes display heterogeneity in physical
characteristics, composition and interphase nuclear arrangement. (b) Centromere
enumeration probes can be detected by image cytometry. (c & d) Overlapping
centromere signals can be resolved by population-based histogram fluorescence
quantification. (e) Aneuploidy rates scored by image cytometry are in good
agreement with those by traditional scoring methods for a range of chromosomes
within the 95 % confidence limits (CL; R2 = 0.9816). Scale bars: 20 µm.
160
6.2. Aneuploidy rates following nocodazole wash-out
Chromosome missegregation can arise because of chromosome spindle
malorientation occurring during mitosis265,392. To mimic spindle orientation defects,
cell were arrested in mitosis for 8 hours with nocodazole. Nocodazole depolymerises
microtubules which can reassemble upon wash-out, leading to chromosomes that
are not correctly bioriented on the spindle, due to an increased frequency of
merotelic attachments, as previously described in chapter 4 (figure 4.2a) After an
8-hour mitotic arrest, nocodazole was washed out for 12 hours to allow cells to
complete mitosis, after which the of ploidy of single cells was analysed, before
significant cell death (and therefore selection) has occurred339.
Here, I characterise the aneuploidy rates for individual human chromosomes
following nocodazole wash-out in cell lines of different tissue origin, ploidy and
tumorigenic status. Addressing the issue of chromosome missegregation following
nocodazole wash-out is a fundamental priority for two reasons; firstly, the rate of
merotelic attachments are known to be increased in human cancers and therefore
patterns of aneuploidy might arise from the chromosomes most prone to orientation
defects234,248,393. Secondly, nocodazole wash-out is a popular strategy for increasing
chromosome missegregation in cell biology studies346,394–396. Therefore, it is
important to interrogate whether segregation error rates and aneuploidy observed in
vitro support the prevailing assumption that chromosomes missegregate with equal
frequencies following nocodazole wash-out236.
I chose to assess the rates of aneuploidy in RPE-1, BJ, HCT116 and RPE 12/3 (with
a stable chromosome 12 trisomy) cells as these cell lines have been established in
culture for many years, are derived from different tissues of origin and are
karyotypically well-defined236.
161
6.2.1. RPE-1 aneuploidy rates following nocodazole wash-out
RPE-1 cells are a chromosomally stable, non-transformed cell line of epithelial origin
which were used for my aneuploidy reporter strategy in chapters 4 and 5. It was
anticipated that the rate of spontaneous chromosome missegregation would be low
in this cell line, therefore elevated aneuploidy rates could be detected for individual
chromosomes above this baseline.
In untreated RPE-1 cells, basal levels of aneuploidy were low, as expected for a
chromosomally stable cell line – and from the micronuclei formation rates already
observed in untreated RPE-1 cells (figure 6.2; grey dots and figure 4.2c; chapter
4). On average, chromosomes were lost at a frequency of 1.83 %. However,
chromosome 8 was lost more frequently than the mean over triplicate experiments
(3.49 %; p<0.05). The average chromosome gain rate was 1.03 % with no individual
chromosomes varying significantly from the mean.
I next determined aneuploidy rates following microtubule disruption with 8-hour
nocodazole wash-out, to elevate merotely. Twelve hours post-nocodazole wash-out,
an increase in chromosome missegregation was observed, as expected (figure 6.2;
blue and red dots). The average rate of chromosome gain was 3.92 %. However, I
did not observe uniform chromosome gains. Strikingly, chromosomes 1, 3, 4, 7 and
10 were gained at significantly higher rates than all other chromosomes tested (3.59,
3.97, 10.20, 5.48 and 5.09 %, respectively; *p<0.05).
Chromosome loss also showed similar patterns, with chromosomes 1, 3, 4, 7, 10
and 18 being lost at high rates (6.39, 10.95, 5.20, 5.56, 5.83 and 5.43 %,
respectively; *p<0.05). Chromosome 2 loss rates appeared elevated above the
mean, but marginally failed to reach significance (p=0.063). For chromosomes 3, 4,
and 18 the loss rate was not equal to the gain rate. This was unexpected, given that
the McClelland lab has not observed cell death following chromosome
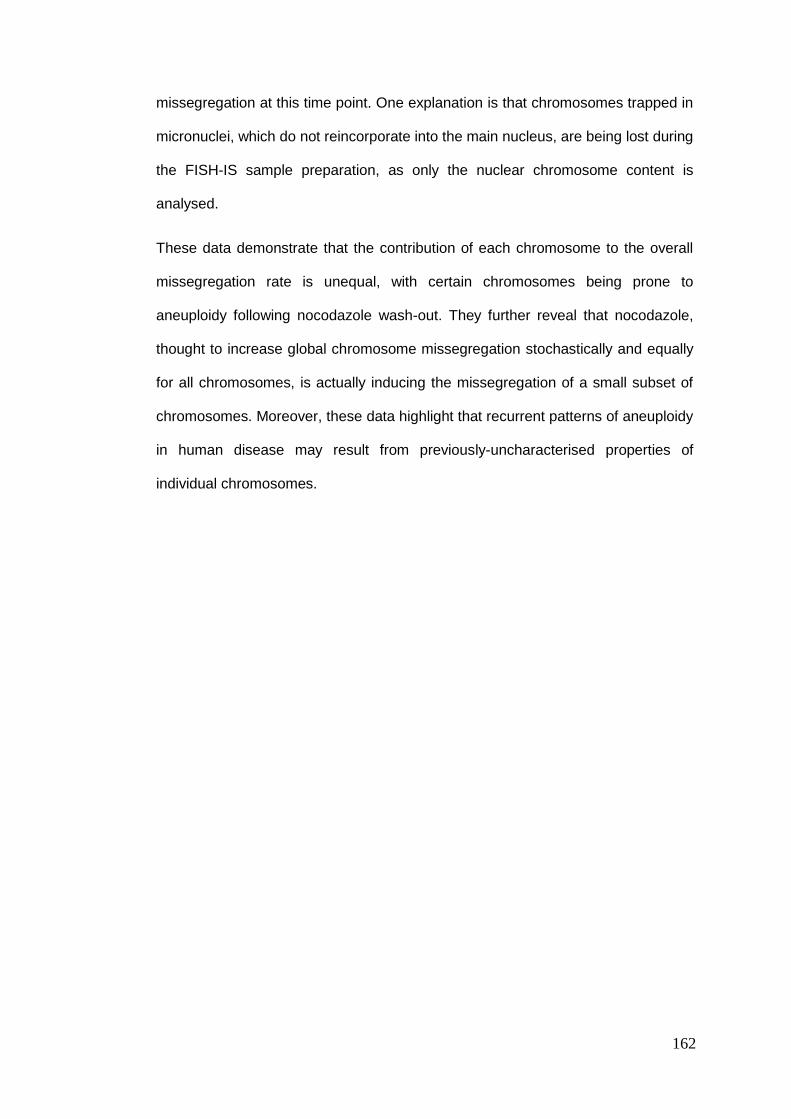
162
missegregation at this time point. One explanation is that chromosomes trapped in
micronuclei, which do not reincorporate into the main nucleus, are being lost during
the FISH-IS sample preparation, as only the nuclear chromosome content is
analysed.
These data demonstrate that the contribution of each chromosome to the overall
missegregation rate is unequal, with certain chromosomes being prone to
aneuploidy following nocodazole wash-out. They further reveal that nocodazole,
thought to increase global chromosome missegregation stochastically and equally
for all chromosomes, is actually inducing the missegregation of a small subset of
chromosomes. Moreover, these data highlight that recurrent patterns of aneuploidy
in human disease may result from previously-uncharacterised properties of
individual chromosomes.
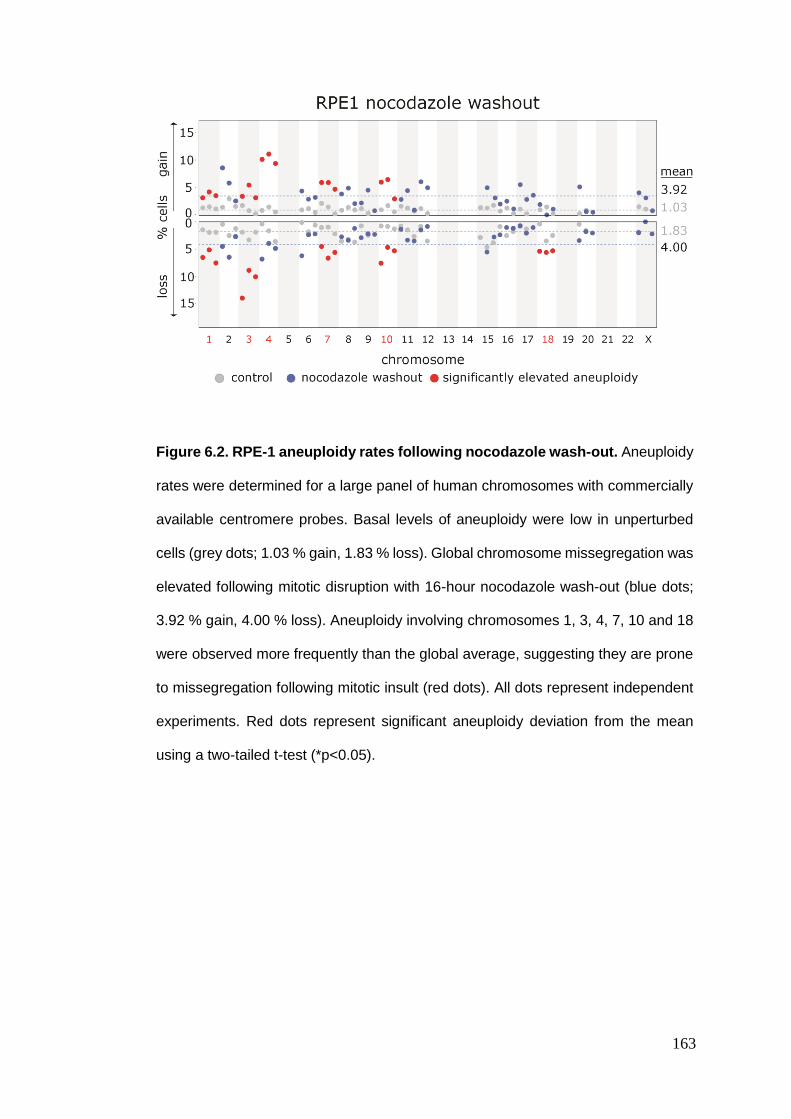
163
Figure 6.2. RPE-1 aneuploidy rates following nocodazole wash-out. Aneuploidy
rates were determined for a large panel of human chromosomes with commercially
available centromere probes. Basal levels of aneuploidy were low in unperturbed
cells (grey dots; 1.03 % gain, 1.83 % loss). Global chromosome missegregation was
elevated following mitotic disruption with 16-hour nocodazole wash-out (blue dots;
3.92 % gain, 4.00 % loss). Aneuploidy involving chromosomes 1, 3, 4, 7, 10 and 18
were observed more frequently than the global average, suggesting they are prone
to missegregation following mitotic insult (red dots). All dots represent independent
experiments. Red dots represent significant aneuploidy deviation from the mean
using a two-tailed t-test (*p<0.05).
164
6.2.2. RPE-1 aneuploidy rates: single-cell sequencing validation
To further validate the missegregation rates using an independent methodology,
control and nocodazole-treated RPE-1 cells were analysed by single-cell
sequencing.
Single-cell sequencing is a recent technological development which allows the
genomic content of single cells to be analysed. The advantages of single-cell
sequencing over conventional sequencing approaches is that it allow genomic
aberrations to be detected with exquisite resolution, providing highly-accurate
determination of chromosome copy number alterations on a per-cell basis. Single
cells were sorted by flow cytometry, to obtain a pure G1 cell fraction, and sequenced
by a collaborator using proprietary AneuFinder software as previously
described314,386. Samples were frozen and analysed 12 hours following nocodazole
release, therefore the majority of cells sequenced were in G1 and were of sufficient
DNA quality for analysis (data not shown).
In untreated RPE-1 cells, basal levels of aneuploidy were low, in-line with the data
obtained by image cytometry (figure 6.3; top panel). In all cells, I observed a gain
of chromosome 10q, confirming the data from SNP array analysis of untreated RPE-
1 cells already observed in my hands (see chapter 5.2.1.1). One of the single cells
sequenced harboured four copies of chromosome 10q, in addition to partial gains of
chromosomes 6, 10p, 12 and X. Monosomy X was observed in a single cell; and
partial trisomy of chromosome X in two single cells. These data validate basal levels
of aneuploidy to be low in untreated RPE-1 cells, as observed by image cytometry.
Following nocodazole wash-out aneuploidy was elevated, as expected (figure 6.3;
bottom panel). The known chromosome 10q aberration in this cell line was observed
in all cells, as for the untreated control. Importantly, chromosomes 1, 2, 3, 4, 7, 10
and 18 were lost in between 10-30 % of cells, confirming the data obtained by image
165
cytometry. Additionally, chromosomes 5, 12 and 21 were observed to be lost in one
single cell, out of the 12 analysed. In “cell 1”, the missegregation of six chromosomes
was observed simultaneously, and accounted for a fraction of the chromosome loss
rates not observed by image cytometry. This is likely a cell that underwent a
multipolar division and would therefore be excluded, based on area and aspect ratio,
by the ImageStreamX.
Importantly, these data are in good agreement with the missegregation rates
observed by image cytometry. Therefore, I conclude that the ImageStreamX is a
robust system for determining the missegregation rates of individual human
chromosomes in a high-throughput manner, which I have validated by two further
independent methodologies (traditional FISH on glass slides and single-cell
sequencing).
Furthermore, these data confirm chromosome missegregation rates to be unequal
following nocodazole wash-out, demonstrating that a subset of chromosomes are
more vulnerable to merotely. If I exclude cell 1 from my analysis, which presumably
went through a multipolar division, I do not see either the high gain or loss rates for
chromosome 4 as observed by image cytometry. One explanation is that the CEP
probe for chromosome 4 is subject to cross-hybridisation artefacts between
centromeres, a possibility which is raised in the corresponding manufacturer data
sheet for this probe, and may be exacerbated through unknown means following
nocodazole wash-out. Finally, chromosome 2, which was borderline significant by
image cytometry (p=0.063), was lost in 25 % of cells by SCS. One explanation is the
experimental variance for chromosome 2 in a single experiment accounted for the
failure to reach significance, as two of three experiments were above the mean and
more closely aligned with the data obtained by SCS (figure 6.2 vs. 6.3).
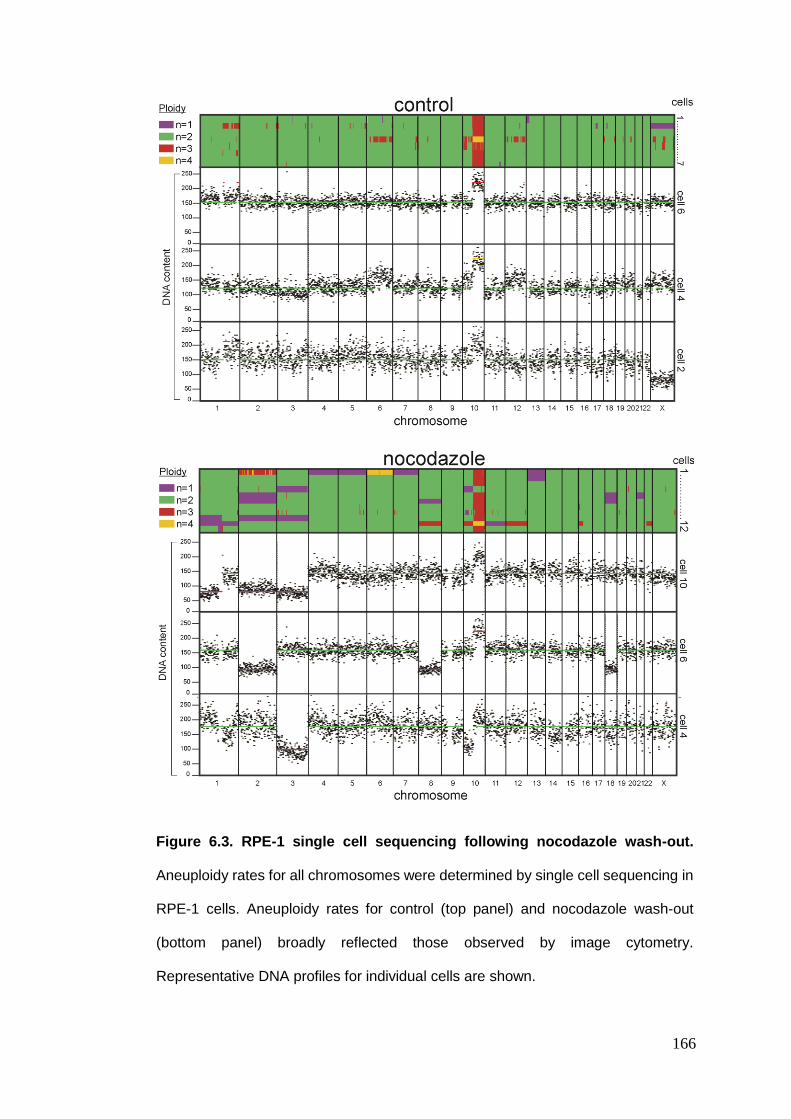
166
Figure 6.3. RPE-1 single cell sequencing following nocodazole wash-out.
Aneuploidy rates for all chromosomes were determined by single cell sequencing in
RPE-1 cells. Aneuploidy rates for control (top panel) and nocodazole wash-out
(bottom panel) broadly reflected those observed by image cytometry.
Representative DNA profiles for individual cells are shown.
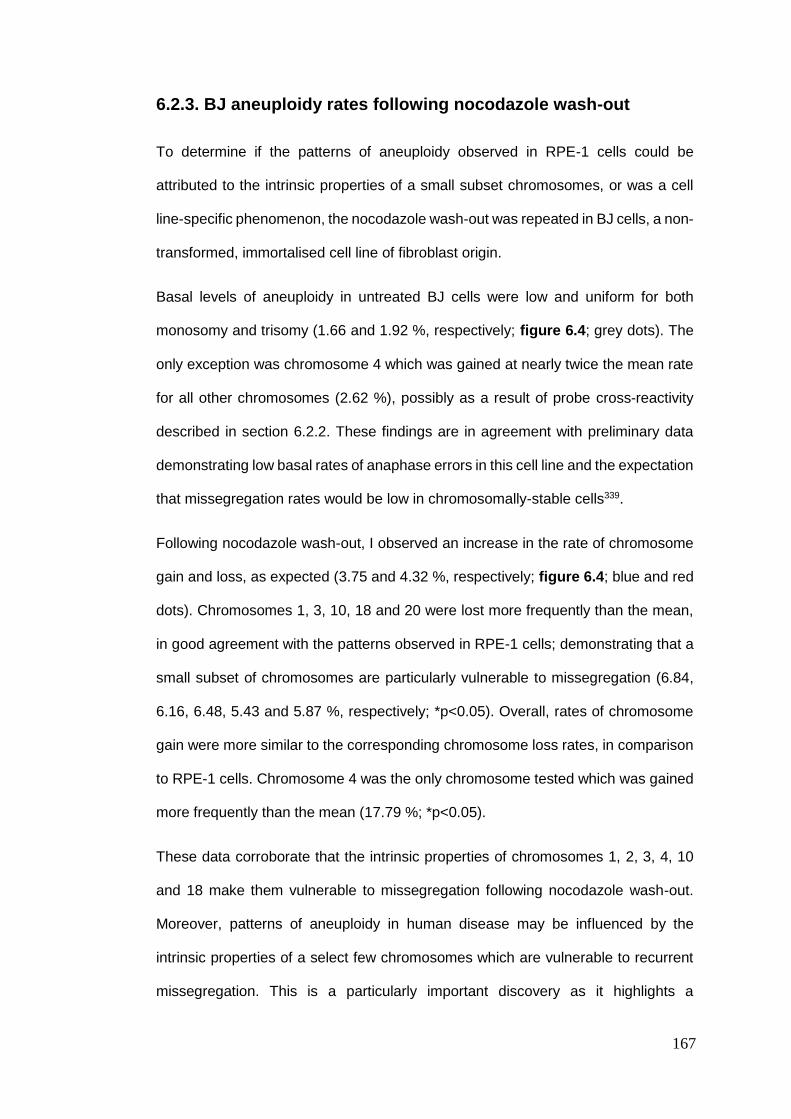
167
6.2.3. BJ aneuploidy rates following nocodazole wash-out
To determine if the patterns of aneuploidy observed in RPE-1 cells could be
attributed to the intrinsic properties of a small subset chromosomes, or was a cell
line-specific phenomenon, the nocodazole wash-out was repeated in BJ cells, a non-
transformed, immortalised cell line of fibroblast origin.
Basal levels of aneuploidy in untreated BJ cells were low and uniform for both
monosomy and trisomy (1.66 and 1.92 %, respectively; figure 6.4; grey dots). The
only exception was chromosome 4 which was gained at nearly twice the mean rate
for all other chromosomes (2.62 %), possibly as a result of probe cross-reactivity
described in section 6.2.2. These findings are in agreement with preliminary data
demonstrating low basal rates of anaphase errors in this cell line and the expectation
that missegregation rates would be low in chromosomally-stable cells339.
Following nocodazole wash-out, I observed an increase in the rate of chromosome
gain and loss, as expected (3.75 and 4.32 %, respectively; figure 6.4; blue and red
dots). Chromosomes 1, 3, 10, 18 and 20 were lost more frequently than the mean,
in good agreement with the patterns observed in RPE-1 cells; demonstrating that a
small subset of chromosomes are particularly vulnerable to missegregation (6.84,
6.16, 6.48, 5.43 and 5.87 %, respectively; *p<0.05). Overall, rates of chromosome
gain were more similar to the corresponding chromosome loss rates, in comparison
to RPE-1 cells. Chromosome 4 was the only chromosome tested which was gained
more frequently than the mean (17.79 %; *p<0.05).
These data corroborate that the intrinsic properties of chromosomes 1, 2, 3, 4, 10
and 18 make them vulnerable to missegregation following nocodazole wash-out.
Moreover, patterns of aneuploidy in human disease may be influenced by the
intrinsic properties of a select few chromosomes which are vulnerable to recurrent
missegregation. This is a particularly important discovery as it highlights a

168
previously-uncharacterised requirement for individual chromosome-level resolution
of aneuploidy mechanisms; the absence of which obfuscates the interplay between
selection pressures and karyotype complexity in aneuploid human diseases.
169
Figure 6.4. BJ aneuploidy rates following nocodazole wash-out. Aneuploidy
rates were investigated in a second cell line, BJ, of fibroblast origin. Basal levels of
aneuploidy were low in unperturbed cells (grey dots; 1.92 % gain, 1.66 % loss).
Global chromosome missegregation was elevated to similar levels following
microtubule disruption with 8-hour nocodazole wash-out (blue dots; 3.75 % gain,
4.32 % loss). Significantly elevated aneuploidies were similar to RPE-1 cells,
involving chromosomes 1, 3, 4, 10, 18 and 20 (red dots). All dots represent
independent experiments. Red dots represent significant aneuploidy deviation from
the mean using a two-tailed t-test (*p<0.05).
170
6.2.4. HCT116 aneuploidy rates following nocodazole wash-out
To elucidate if non-random missegregation could be observed in human cancers, I
took advantage of a chromosomally-stable, transformed cell line HCT116, originally
derived from male colon carcinoma tissue. Determining the rates of missegregation
in a transformed cell line may provide additional insight into the intrinsic propensities
of chromosomes to missegregate in cancer cells, with potentially important
implications for tumourigenesis and cancer evolution. Additionally, this would allow
us to investigate whether recurrent patterns of non-random aneuploidy occur for the
same subset of chromosomes observed in RPE-1 and BJ cells.
In untreated HCT116 cells, basal levels of chromosome gain were higher than
expected for a chromosomally-stable cell line, and compared to RPE-1 cells (1.96
%; figure 6.5, grey dots; *p<0.05). Particularly, chromosomes 6, 12 and 16 were
being gained at rates approximately twice that of the mean for all other
chromosomes tested (3.87, 3.37 and 4.57 %, respectively; *p<0.05). However, this
could also represent a low level of previously-uncharacterised stable aneuploidy in
the population as I cannot distinguish between these possibilities with this
experiment.
The average rate of basal chromosome loss was 1.83 % in untreated HCT116 cells.
Of note, HCT116 cells are derived from the male colon and therefore monosomic
for chromosome X. In my hands, I find that basal levels of chromosome X loss was
zero (which is likely an artefact of the detection limit of the ImageStreamX), indicating
that HCT116 cells with stable nullisomy X karyotype are extremely rare. Additionally,
chromosome 12 was lost significantly less frequently than the mean (0.37 % loss;
*p<0.05). For all other chromosomes tested, basal rates of chromosome loss were
low and uniform, as expected.
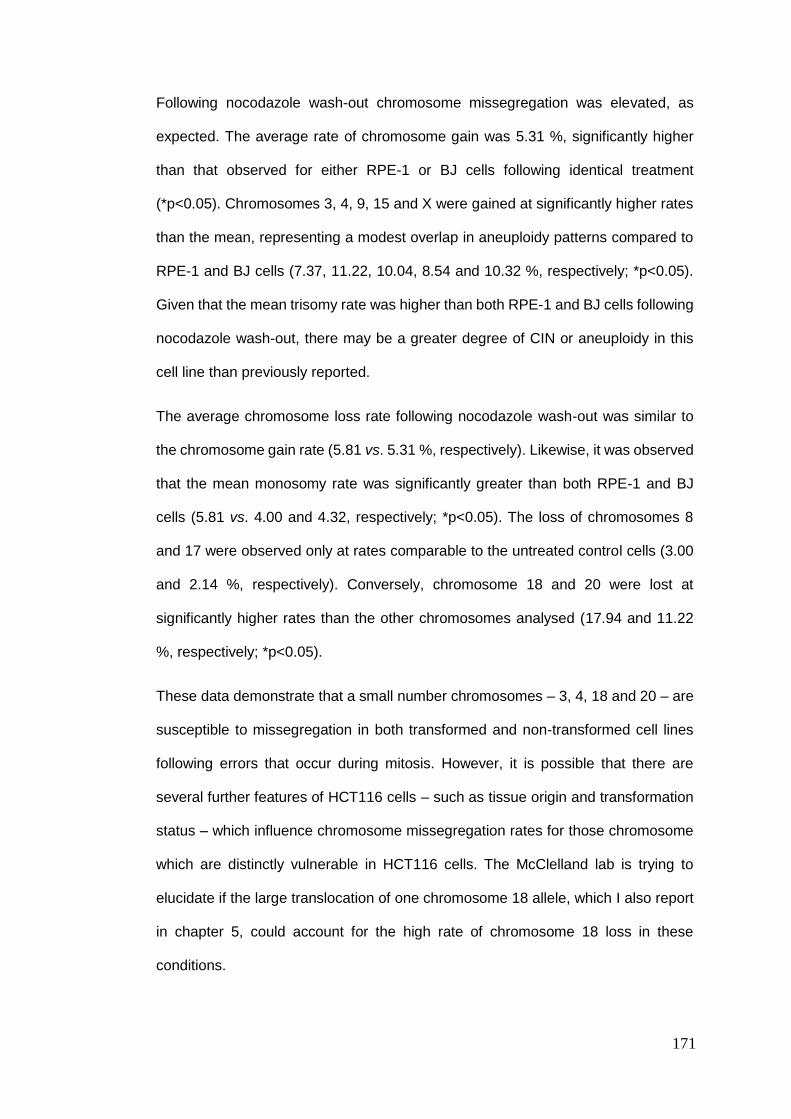
171
Following nocodazole wash-out chromosome missegregation was elevated, as
expected. The average rate of chromosome gain was 5.31 %, significantly higher
than that observed for either RPE-1 or BJ cells following identical treatment
(*p<0.05). Chromosomes 3, 4, 9, 15 and X were gained at significantly higher rates
than the mean, representing a modest overlap in aneuploidy patterns compared to
RPE-1 and BJ cells (7.37, 11.22, 10.04, 8.54 and 10.32 %, respectively; *p<0.05).
Given that the mean trisomy rate was higher than both RPE-1 and BJ cells following
nocodazole wash-out, there may be a greater degree of CIN or aneuploidy in this
cell line than previously reported.
The average chromosome loss rate following nocodazole wash-out was similar to
the chromosome gain rate (5.81 vs. 5.31 %, respectively). Likewise, it was observed
that the mean monosomy rate was significantly greater than both RPE-1 and BJ
cells (5.81 vs. 4.00 and 4.32, respectively; *p<0.05). The loss of chromosomes 8
and 17 were observed only at rates comparable to the untreated control cells (3.00
and 2.14 %, respectively). Conversely, chromosome 18 and 20 were lost at
significantly higher rates than the other chromosomes analysed (17.94 and 11.22
%, respectively; *p<0.05).
These data demonstrate that a small number chromosomes – 3, 4, 18 and 20 – are
susceptible to missegregation in both transformed and non-transformed cell lines
following errors that occur during mitosis. However, it is possible that there are
several further features of HCT116 cells – such as tissue origin and transformation
status – which influence chromosome missegregation rates for those chromosome
which are distinctly vulnerable in HCT116 cells. The McClelland lab is trying to
elucidate if the large translocation of one chromosome 18 allele, which I also report
in chapter 5, could account for the high rate of chromosome 18 loss in these
conditions.
172
Figure 6.5. HCT116 aneuploidy rates following nocodazole wash-out.
Aneuploidy rates were investigated in a transformed cell line, HCT116, of human
colon carcinoma origin. Basal levels of aneuploidy were higher than RPE-1 and BJ
cells in unperturbed cells (grey dots; 1.96 % gain, 1.83 % loss; *p<0.05). Global
chromosome missegregation was elevated to higher levels than RPE-1 and BJ cells
following microtubule disruption with 16-hour nocodazole wash-out (blue dots; 5.31
% gain, 5.81 % loss; *p<0.05). The most frequently elevated aneuploidies were
strikingly different to RPE-1 and BJ cells, involving chromosomes 3, 4, 9, 15, 18, 20
and X (red dots). All dots represent independent experiments. Red dots represent
significant aneuploidy deviation from the mean using a two-tailed t-test (*p<0.05).
173
6.2.5. RPE-1 12/3 aneuploidy rates following nocodazole wash-
out
It has already been observed that the presence of extra chromosomes leads to
genomic instability236,336. Specifically, RPE-1 cells harbouring a stable chromosome
12 trisomy (RPE-1 12/3) are susceptible to an increased frequency of DNA damage
and anaphase chromosome bridges336. In my hands, I have already confirmed the
stable maintenance of a chromosome 12 trisomy by SNP array in this cell line (see
chapter 5.2.1.1). Therefore, image cytometry was used to determine whether the
presence of an extra chromosome generates recurrent patterns of missegregation
for specific chromosomes in RPE-1 12/3 cells. This is an important question as it is
currently unclear if aneuploidy itself influences patterns of pathological chromosome
missegregation. Additionally, the missegregation rates for chromosomes 5, 13, 14,
19, 21 and 22 were analysed by conventional telomeric FISH on glass slides
(preliminary data shown).
In untreated RPE-1 12/3 cells, basal levels of chromosome gain and loss were
significantly higher (approximately twice) that observed for untreated, disomic RPE-
1 cells (figure 6.6; grey dots; 2.17 and 2.53 %, respectively; *p<0.05). The
chromosome 12 trisomy was present in 82.4 % of cells, as expected from my SNP
array observations (figure 6.6, bottom panel). No individual chromosomes loss rates
in untreated cells varied significantly from the mean. Conversely, chromosomes 4,
16, 20 and X were gained at significantly higher rates than the mean (4.02, 3.03,
3.18 and 5.01 %, respectively; *p<0.05), highlighting that certain chromosomes may
be vulnerable to missegregation in unperturbed aneuploid cells by the presence of
a single extra copy of chromosome 12.
In RPE-1 12/3 cells, following nocodazole wash-out, an increase in chromosome
missegregation was observed (figure 6.5; blue and red dots). The mean
174
chromosome loss rate, but not gain rate, was significantly higher than that observed
for diploid RPE-1 cells under the same conditions (4.00 vs. 5.27 %; *p<0.05).
Chromosomes 1, 3 and 10 were lost at significantly higher rates than the other
chromosomes tested, a pattern which was similar, but incomplete, to that observed
for diploid RPE-1 and BJ cells (7.64, 7.41 and 8.01%, respectively; *p<0.05).
These data demonstrate that basal chromosome missegregation is elevated in
aneuploid cell lines by the presence of a single extra copy of chromosome 12, as
previously reported336. Strikingly, this phenomenon is exaggerated following
nocodazole wash-out where overall chromosome loss rates are ~ 25 % greater than
diploid RPE-1 cells. Interestingly, patterns of chromosome missegregation following
nocodazole wash-out were similar, but not identical, to those observed for diploid
RPE-1 cells. This suggests that the presence of an extra chromosome influences
patterns of aneuploidy, at least in this cell type. Further validation of other trisomies
and cell lines are required for extensive characterisation.
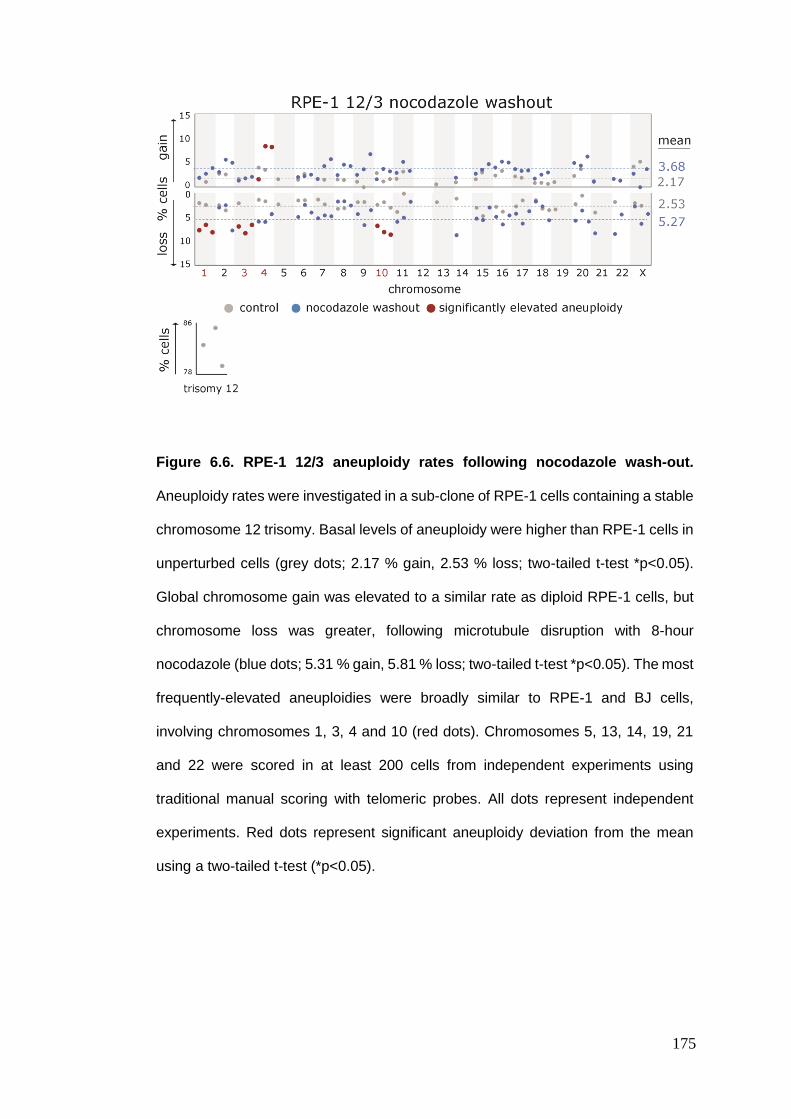
175
Figure 6.6. RPE-1 12/3 aneuploidy rates following nocodazole wash-out.
Aneuploidy rates were investigated in a sub-clone of RPE-1 cells containing a stable
chromosome 12 trisomy. Basal levels of aneuploidy were higher than RPE-1 cells in
unperturbed cells (grey dots; 2.17 % gain, 2.53 % loss; two-tailed t-test *p<0.05).
Global chromosome gain was elevated to a similar rate as diploid RPE-1 cells, but
chromosome loss was greater, following microtubule disruption with 8-hour
nocodazole (blue dots; 5.31 % gain, 5.81 % loss; two-tailed t-test *p<0.05). The most
frequently-elevated aneuploidies were broadly similar to RPE-1 and BJ cells,
involving chromosomes 1, 3, 4 and 10 (red dots). Chromosomes 5, 13, 14, 19, 21
and 22 were scored in at least 200 cells from independent experiments using
traditional manual scoring with telomeric probes. All dots represent independent
experiments. Red dots represent significant aneuploidy deviation from the mean
using a two-tailed t-test (*p<0.05).
176
6.3. Aneuploidy rates following DNA replication stress
DNA replication stress can induce chromosome missegregation through the
formation of dicentric chromosomes and chromosome bridges226. It is also known
that replication stress is increased in aging cells and human colorectal
carcinomas397,398. However, the mechanisms underlying pathological aneuploidy
patterns observed in conditions of high replication stress are currently unknown and
therefore of high therapeutic interest.
Moreover, it is known that one major mechanism generating replication stress is
collisions between the replication and transcription machinery399–401. I therefore
hypothesised that gene-dense chromosomes, where replication-transcription
collisions may be elevated402, may be more prone to structural aberrations which
could generate aneuploidy-prone chromosomes. To interrogate these important
questions, patterns of aneuploidy were determined by image cytometry following
replication stress induced for 24 hours, with low-dose DNA polymerase II inhibition,
using aphidicolin403. This treatment length was chosen to allow the majority of cells
to proceed through at least one erroneous S-phase339.
177
6.3.1. RPE-1 aneuploidy rates following DNA replication stress
As expected, replication stress-induced chromosome missegregation was elevated
in RPE-1 cells at 24 hours post-aphidicolin treatment (figure 6.7; blue and red dots).
The mean gain and loss rates were not significantly different to the rates following
nocodazole wash-out, demonstrating that global aneuploidy is similar under different
cellular stresses (3.79 and 4.73 %, respectively). However, chromosomes 2, 4 and
20 were gained at significantly higher rates than the mean (10.56, 5.37 and 7.25 %,
respectively; *p<0.05).
Additionally, chromosomes 3, 4, 6, 16 and 18 were lost significantly more frequently
than the mean following the induction of DNA replication stress (5.83, 5.69, 5.98,
6.82 and 9.27 % respectively; *p<0.05). I have therefore discovered that high
aneuploidy rates can be observed for chromosomes that were not elevated following
nocodazole wash-out, namely for chromosomes 6 and 16. One important
consideration is that these data only reflect changes in centromere number.
Therefore, structural aberrations which result in centromere duplication or loss
following DNA replication stress cannot be differentiated in this experiment and may
lead to a false discovery rate.
These data demonstrate that similar patterns of chromosome loss can be observed
in the same cell type (RPE-1) under different cellular stresses (nocodazole wash-
out vs. replication stress). Importantly, they also highlight that some patterns of
chromosome missegregation, for example chromosomes 6 and 16, are induced by
different mechanisms. Moreover, the lack of high chromosome 1 missegregation
following replication stress, observed after nocodazole wash-out, raises the
possibility that there are multiple routes to aneuploidy which may be chromosome
and error-type specific.
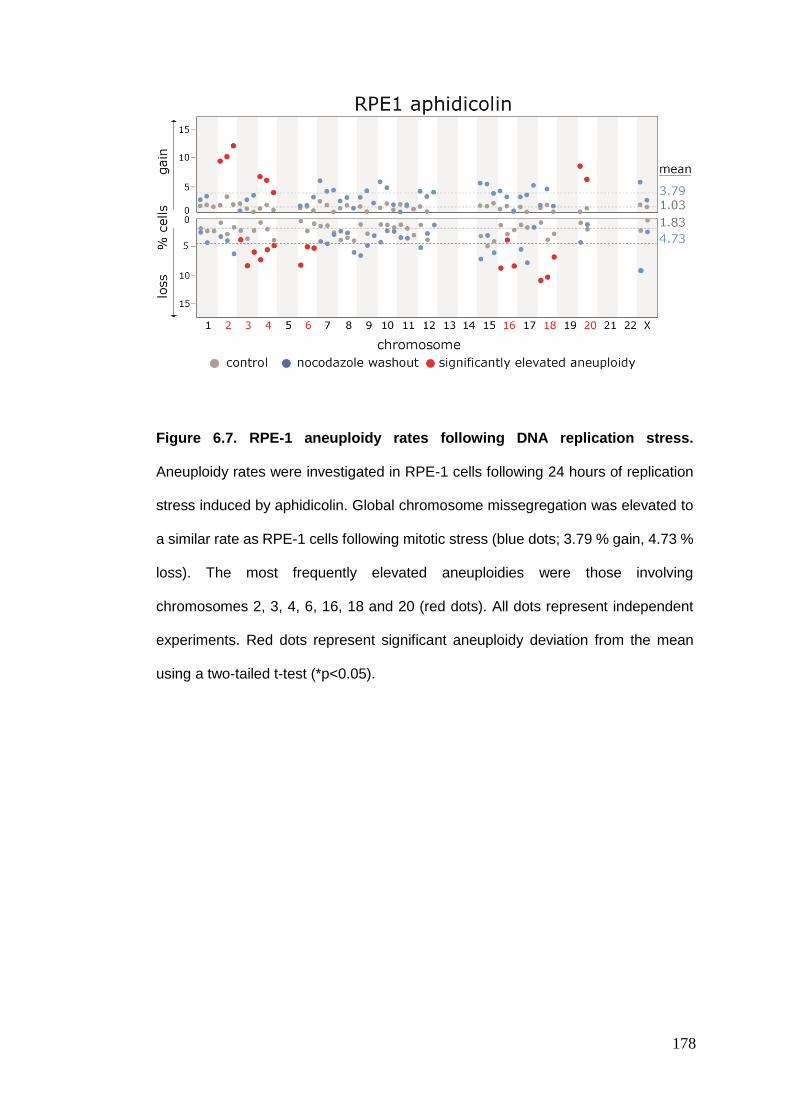
178
Figure 6.7. RPE-1 aneuploidy rates following DNA replication stress.
Aneuploidy rates were investigated in RPE-1 cells following 24 hours of replication
stress induced by aphidicolin. Global chromosome missegregation was elevated to
a similar rate as RPE-1 cells following mitotic stress (blue dots; 3.79 % gain, 4.73 %
loss). The most frequently elevated aneuploidies were those involving
chromosomes 2, 3, 4, 6, 16, 18 and 20 (red dots). All dots represent independent
experiments. Red dots represent significant aneuploidy deviation from the mean
using a two-tailed t-test (*p<0.05).
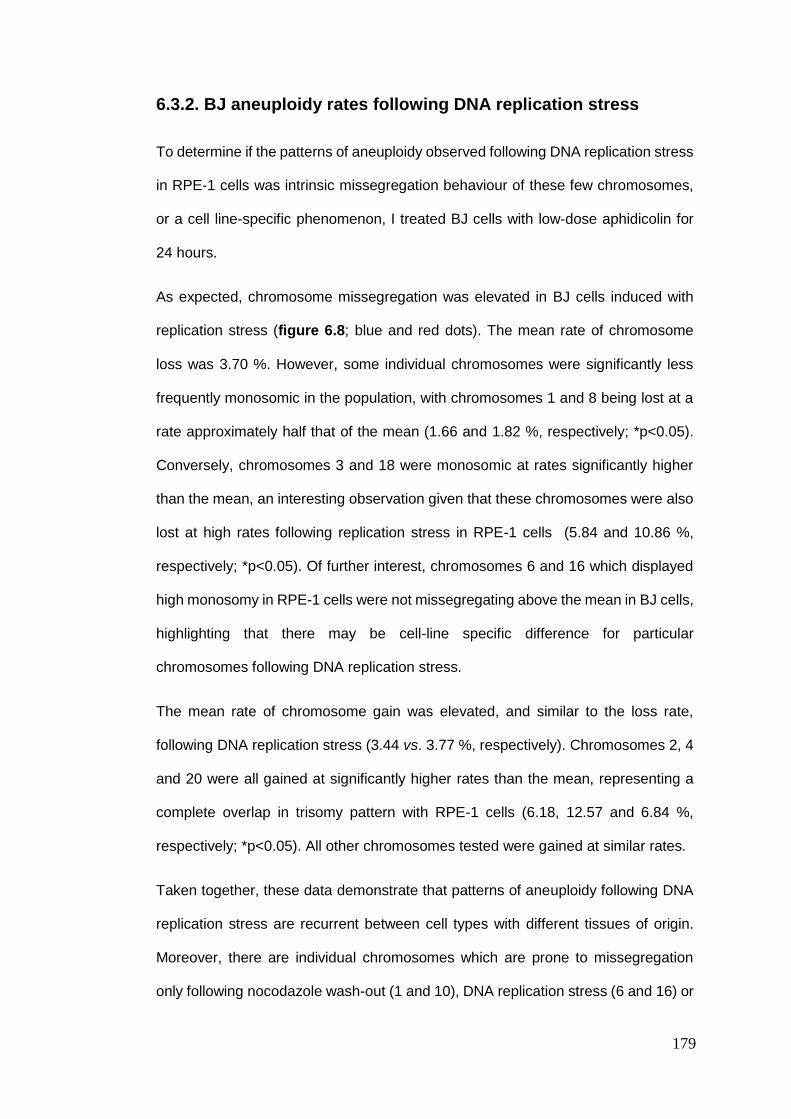
179
6.3.2. BJ aneuploidy rates following DNA replication stress
To determine if the patterns of aneuploidy observed following DNA replication stress
in RPE-1 cells was intrinsic missegregation behaviour of these few chromosomes,
or a cell line-specific phenomenon, I treated BJ cells with low-dose aphidicolin for
24 hours.
As expected, chromosome missegregation was elevated in BJ cells induced with
replication stress (figure 6.8; blue and red dots). The mean rate of chromosome
loss was 3.70 %. However, some individual chromosomes were significantly less
frequently monosomic in the population, with chromosomes 1 and 8 being lost at a
rate approximately half that of the mean (1.66 and 1.82 %, respectively; *p<0.05).
Conversely, chromosomes 3 and 18 were monosomic at rates significantly higher
than the mean, an interesting observation given that these chromosomes were also
lost at high rates following replication stress in RPE-1 cells (5.84 and 10.86 %,
respectively; *p<0.05). Of further interest, chromosomes 6 and 16 which displayed
high monosomy in RPE-1 cells were not missegregating above the mean in BJ cells,
highlighting that there may be cell-line specific difference for particular
chromosomes following DNA replication stress.
The mean rate of chromosome gain was elevated, and similar to the loss rate,
following DNA replication stress (3.44 vs. 3.77 %, respectively). Chromosomes 2, 4
and 20 were all gained at significantly higher rates than the mean, representing a
complete overlap in trisomy pattern with RPE-1 cells (6.18, 12.57 and 6.84 %,
respectively; *p<0.05). All other chromosomes tested were gained at similar rates.
Taken together, these data demonstrate that patterns of aneuploidy following DNA
replication stress are recurrent between cell types with different tissues of origin.
Moreover, there are individual chromosomes which are prone to missegregation
only following nocodazole wash-out (1 and 10), DNA replication stress (6 and 16) or

180
both (2, 3, 4, 18 and 20). The underlying mechanistic basis for these recurrent
patterns and differences are still unclear, as chromosome-specific rates of
aneuploidy are likely to reflect a range of individual chromosome characteristics and
vary subtly between cell types.
181
Figure 6.8. BJ aneuploidy rates following DNA replication stress. Aneuploidy
rates were investigated in BJ cells following 24 hours of replication stress induced
by aphidicolin. Global chromosome missegregation was gain was elevated to a
similar rate as RPE-1 cells, but chromosome loss was marginally reduced (blue dots;
3.44 % gain, 3.70 % loss). The most frequently elevated aneuploidies were broadly
similar to RPE-1 cells, involving chromosomes 2, 3, 4, 18 and 20 (red dots). All dots
represent independent experiments. Red dots represent significant aneuploidy
deviation from the mean using a two-tailed t-test (*p<0.05).
182
6.3.3. HCT116 aneuploidy rates following DNA replication stress
It is known that DNA replication stress is increased in colorectal carcinomas
(CRC)398. I wanted to test the effect of replication stress in a cancer cell line,
particularly colorectal cancer as it is known that CIN+ CRCs are associated with
replication stress226. Importantly, HCT116 are CIN- and therefore a good tissue-type
and cancer-specific control to determine patterns of aneuploidy following replication
stress-induced chromosome missegregation. Additionally, the karyotype of HCT116
cells had already been extensively characterised by SNP array, and patterns of
aneuploidy following nocodazole wash-out elucidated for this cell line (see chapter
5.2.1.1 and chapter 6.2.4, respectively). The missegregation rates for
chromosomes 5, 13, 14, 19, 21 and 22 were also analysed by conventional telomeric
FISH on glass slides (preliminary data shown).
HCT116 cells were treated with low-dose aphidicolin for 24 hours, as for RPE-1 and
BJ cells. As expected, chromosome missegregation was elevated following DNA
replication stress (figure 6.9; blue and red dots). The mean rate of chromosome
gain and loss were significantly higher than that observed for either RPE-1 or BJ
cells under the same conditions (4.07 and 8.26 %, respectively; *p<0.05), implying
that there are unique characteristics of HCT116 cells which predispose to replication
stress-induced chromosome missegregation.
Overall, there was a wide range of chromosome gain rates following replication
stress from individual experiments (0.46 to 10.66 %). Of note, chromosomes 4, 7
and 15 were being gained at a rate significantly above all other chromosomes (6.47,
6.29 and 8.06 %, respectively; *p<0.05).
Similarly, there was a wide range of chromosome loss rates across all chromosomes
tested from independent experiments (0.46 to 29.4 %). Chromosomes 6, 18, 21 and
X were lost at significantly higher rates than the mean (13.11, 14.91, 13.77 and 27.90
183
%, respectively; *p<0.05). The loss of chromosome X in HCT116 cells (27.90 %)
was the highest rate of chromosome missegregation I observed for any cell line
under any cellular stress, which is interesting as HCT116 cells are of male origin and
therefore monosomy X in untreated cell; the loss of chromosome X therefore
represents an extraordinary nullisomy population following DNA replication stress.
Given that basal levels of monosomy X in HCT116 cells are undetectable in this
assay, it is likely that this population will undergo apoptosis.
These data demonstrate that HCT116 cells missegregate chromosomes more
frequently than non-transformed RPE-1 and BJ cells following DNA replication
stress. They also reveal differences in chromosome missegregation patterns
compared to RPE-1 and BJ cells, implying that there may be characteristics of
transformed cells which promote instability of a different subset of chromosomes.
One key observation is that there was a modest overlap between HCT116 cells
following nocodazole wash-out and replication stress, suggesting that certain
chromosomes are intrinsically vulnerable and others depend on the underlying
mechanism in this cell line.
It is important to reiterate that only changes in centromere number for each
chromosome are quantified. Furthermore, I have not formally validated these results
by single-cell sequencing. These data therefore form the basis for further
experiments elucidating how replication stress generates aneuploidy in cancer.
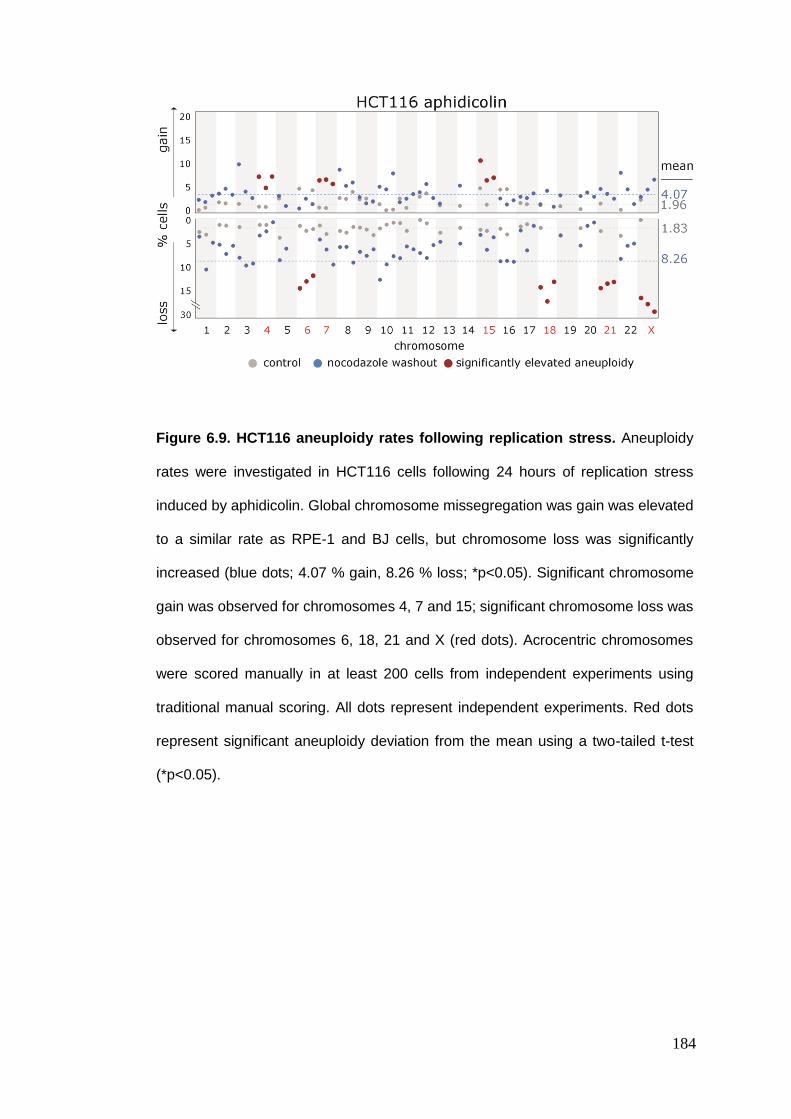
184
Figure 6.9. HCT116 aneuploidy rates following replication stress. Aneuploidy
rates were investigated in HCT116 cells following 24 hours of replication stress
induced by aphidicolin. Global chromosome missegregation was gain was elevated
to a similar rate as RPE-1 and BJ cells, but chromosome loss was significantly
increased (blue dots; 4.07 % gain, 8.26 % loss; *p<0.05). Significant chromosome
gain was observed for chromosomes 4, 7 and 15; significant chromosome loss was
observed for chromosomes 6, 18, 21 and X (red dots). Acrocentric chromosomes
were scored manually in at least 200 cells from independent experiments using
traditional manual scoring. All dots represent independent experiments. Red dots
represent significant aneuploidy deviation from the mean using a two-tailed t-test
(*p<0.05).
185
6.3.4. RPE-1 12/3 aneuploidy rates following DNA replication
stress
Following the observation of recurrent patterns of missegregation in diploid and
aneuploid RPE-1 cells after nocodazole wash-out, I wondered if similar patterns
could be observed, and whether missegregation rates would be exaggerated in a
similar way, following DNA replication stress in the trisomic RPE-1 cell line already
discussed in this chapter – RPE-1 12/3 (section 6.2.5). One hypothesis is that the
presence of an extra chromosome may increase chromosomal aberrations,
following replication stress, by increasing the frequency of novel translocation
involving the trisomic chromosome 12. Additionally, the missegregation rates for
chromosomes 5, 13, 14, 19, 21 and 22 by were analysed by conventional telomeric
FISH on glass slides (preliminary data shown).
RPE-1- 12/3 cells were treated with low-dose aphidicolin for 24 hours. Chromosome
missegregation was elevated following DNA replication stress, as expected (figure
6.10; blue and red dots). The mean rates of chromosome gain and losses were
comparable to HCT116 cells, but significantly higher than that observed for both
diploid RPE-1 and BJ cells (4.37 and 6.31 %, respectively; *p<0.05). This is
interesting as it suggests that the presence of a single extra chromosome is sufficient
to increase aneuploidy globally following replication stress versus diploid RPE-1
cells.
Chromosomes 2, 4, 7 and 14 were gained at significantly higher rates than the mean,
indicating that aneuploid cells also become frequently trisomic for a small subset of
chromosomes following replication stress (4.64, 6.87, 9.15 and 11.58 %,
respectively; *p<0.05). Interestingly, chromosomes 2 and 4 were also gained at high
rates in diploid RPE-1 cells under the same conditions (chromosome 7 failed
significance p=0.64 and chromosome 14 was not analysed in diploid RPE-1 cells),
186
confirming that patterns of chromosome gain are similar, but not identical, between
diploid and aneuploid cells induced by DNA replication stress.
Furthermore, chromosomes 3, 13, 16, 18 and X were lost at high rates, which is in
good agreement with the majority of significant monosomies in diploid RPE-1 cells
(8.00, 13.02, 10.78, 10.51 and 13.95 %, respectively; *p<0.05). Chromosome 4
marginally failed significance (p=0.064) due to a large variation between
experiments. Of note, chromosomes 8 and 15 were very stable and lost at rates
comparable to that of untreated control cells (3.41 and 3.46%, respectively).
These data support the hypothesis that patterns of aneuploidy arising following DNA
replication stress in diploid and aneuploid populations, derived from the same cell
type, are recurrent and may be caused by inherent of properties of individual
chromosomes. Additionally, the rates of aneuploidy following cellular stress were
elevated by the presence of an additional chromosome 12, corroborating a similar
observation following nocodazole wash-out (section 6.2.5), and the literature336.
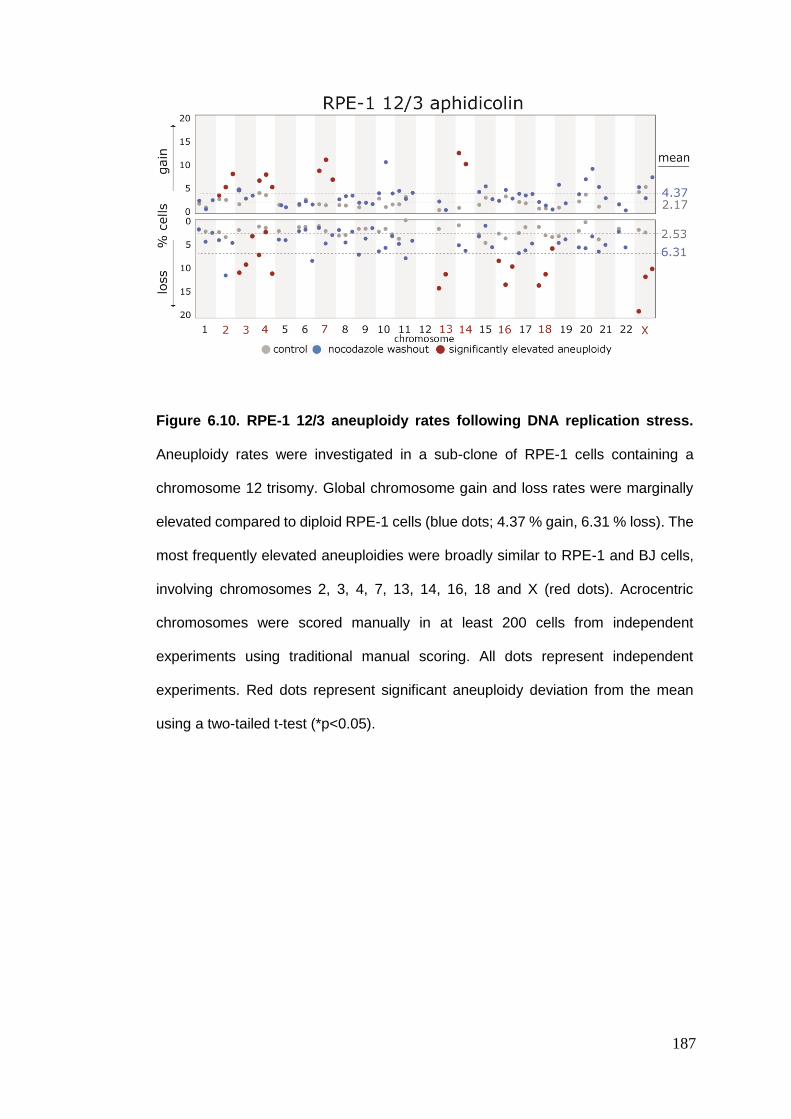
187
Figure 6.10. RPE-1 12/3 aneuploidy rates following DNA replication stress.
Aneuploidy rates were investigated in a sub-clone of RPE-1 cells containing a
chromosome 12 trisomy. Global chromosome gain and loss rates were marginally
elevated compared to diploid RPE-1 cells (blue dots; 4.37 % gain, 6.31 % loss). The
most frequently elevated aneuploidies were broadly similar to RPE-1 and BJ cells,
involving chromosomes 2, 3, 4, 7, 13, 14, 16, 18 and X (red dots). Acrocentric
chromosomes were scored manually in at least 200 cells from independent
experiments using traditional manual scoring. All dots represent independent
experiments. Red dots represent significant aneuploidy deviation from the mean
using a two-tailed t-test (*p<0.05).
188
6.4. Aneuploidy rates following centromere protein A
depletion
The centromere protein A (CENP-A), a specialised histone H3 variant, is known to
play a role in specifying the centromere of human chromosomes, is important for
down-stream assembly of kinetochore components and therefore important for the
faithful segregation of chromosomes (figure 6.11a)404. It is currently unclear whether
certain chromosomes are more vulnerable to the loss of centromere specification
and fidelity. One important concept here is the idea of centromere strength – the
notion that stability of chromosome attachment to the mitotic spindle is proportional
to the recruitment of kinetochore components291. A critical limiting factor for
kinetochore recruitment to centromeres is CENP-A, as CENP-A levels determine
CENP-B recruitment which in-turn acts as a scaffold for the inner centromere
complex405–407. Moreover, CENP-A levels are proportional to chromosome size.
Therefore, I wanted to ask whether patterns of chromosome missegregation could
be observed following CENP-A depletion408.
189
6.4.1. An inducible CENP-A depletion system
To assess the role of CENP-A, and therefore centromere size and strength, in faithful
chromosome segregation, I obtained cell lines with an inducible degradation motif-
tagged CENP-A from a collaborator which were previously characterised409. These
cell lines were derived from diploid RPE-1 cells, already described in this chapter
(section 6.2.1); and DLD1 cells, a human colorectal carcinoma cell line. In each cell
line, both alleles of CENP-A had been replaced with CENP-A mutants tagged with
an auxin-inducible degradation (AID) domain and a GFP fluorophore (figure 6.11b).
It was previously shown that CENP-A degradation following addition of auxin was
rapid, with a half-life of 16 minutes409. However, CENP-A already established at
centromeres was protected from degradation until the next cell cycle when CENP-A
is unloaded from the centromere. Therefore to completely remove all CENP-A, a
total auxin treatment time of 48 hours was necessary to allow cells to proceed
through one complete round of cell division in the absence of CENP-A.
To test whether I could observe complete CENP-A degradation in my hands, RPE-
1-CENPA-AID-GFP and DLD1-CENPA-AID-GFP cells were treated with auxin for
48 hours. CENP-A-GFP was easily visualised in untreated cells by fluorescence
microscopy and could be observed as punctate GFP spots (figure 6.11c; control).
As expected, CENP-A was completely depleted by 48 hours in the presence of auxin
in both RPE-1 and DLD1 cell lines (figure 6.11c; +48h IAA). These data
demonstrate that these cell lines are capable of a complete and expeditious
degradation of the CENP-A protein and can therefore be used to determine the rates
of chromosome missegregation following centromere and kinetochore assembly
disruption.
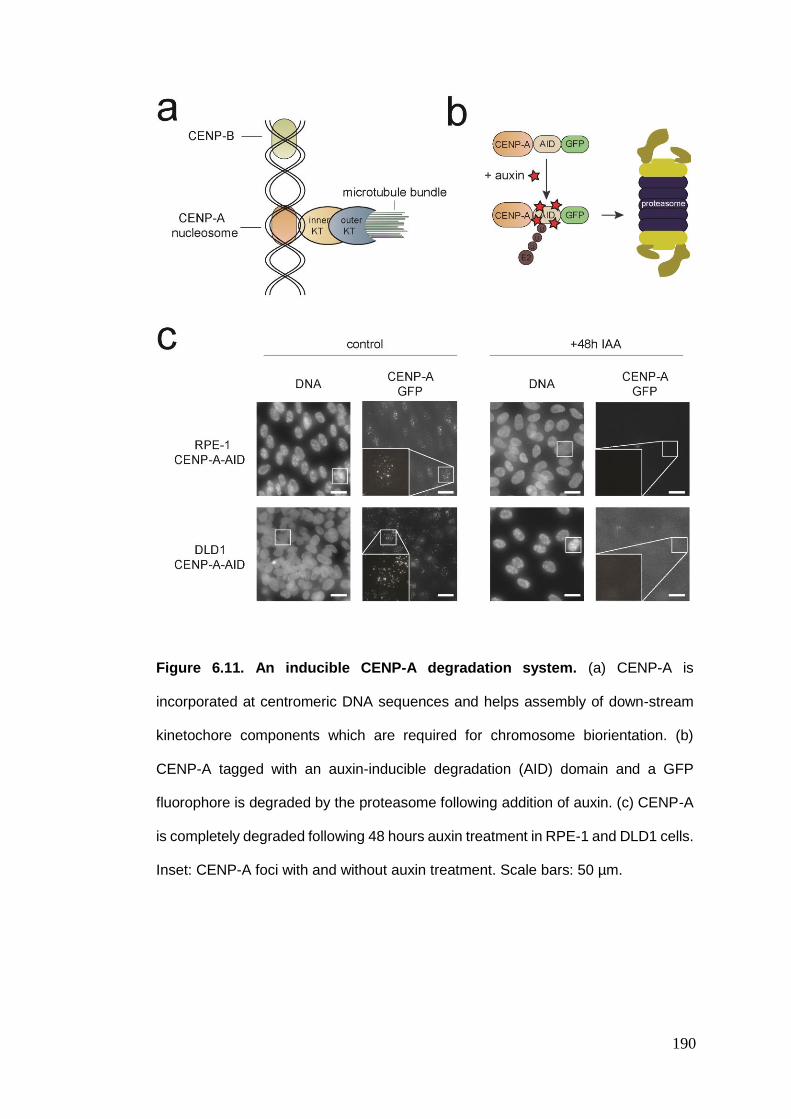
190
Figure 6.11. An inducible CENP-A degradation system. (a) CENP-A is
incorporated at centromeric DNA sequences and helps assembly of down-stream
kinetochore components which are required for chromosome biorientation. (b)
CENP-A tagged with an auxin-inducible degradation (AID) domain and a GFP
fluorophore is degraded by the proteasome following addition of auxin. (c) CENP-A
is completely degraded following 48 hours auxin treatment in RPE-1 and DLD1 cells.
Inset: CENP-A foci with and without auxin treatment. Scale bars: 50 µm.
191
6.4.2. RPE-1 aneuploidy rates following CENP-A depletion
RPE-1-CENP-A-AID cells were used to determine whether differences in
centromeric CENP-A generates aneuploidy patterns following CENP-A depletion.
First, the mean rate of chromosome gain and loss were determined in unperturbed
cells and found to be marginally lower in control RPE-1-CENP-A-AID cells compared
to control parental RPE-1 cells, although this did not reach significance (figure 6.12;
grey dots; 0.82% vs. 1.03 % and 1.26 % vs. 1.83 %, respectively).
RPE-1-CENP-A-AID cells were treated with auxin for 48 hours to remove CENP-A.
As expected, chromosome missegregation was elevated following CENP-A removal
(figure 6.12; blue and red dots). There was a range of chromosome loss rates
across all chromosomes tested. However, chromosomes 4, 9, 15, 16 and X were
missegregating significantly more frequently than the mean (8.85, 6.61, 7.97, 7.90
and 8.21 %, respectively; *p<0.05). Additionally, global chromosome gain (1.29 %)
was not as high as would be expected given the monosomy rates across the
population (4.68 %). Across all chromosomes, trisomy rates higher than the mean
of the untreated control cells was not observed, suggesting that trisomic cells may
undergo apoptosis before 48 hours and are therefore undetectable. One way to test
this would be to assess cell death at this time point.
These data suggest that the loss of CENP-A at the centromere, which is an indirect
measure of centromere strength, generates chromosome-specific missegregation
patterns. Furthermore, variations in centromere length, and thus CENP-A, between
chromosomes may determine the rates of chromosome missegregation when the
fidelity of kinetochore assembly is compromised.
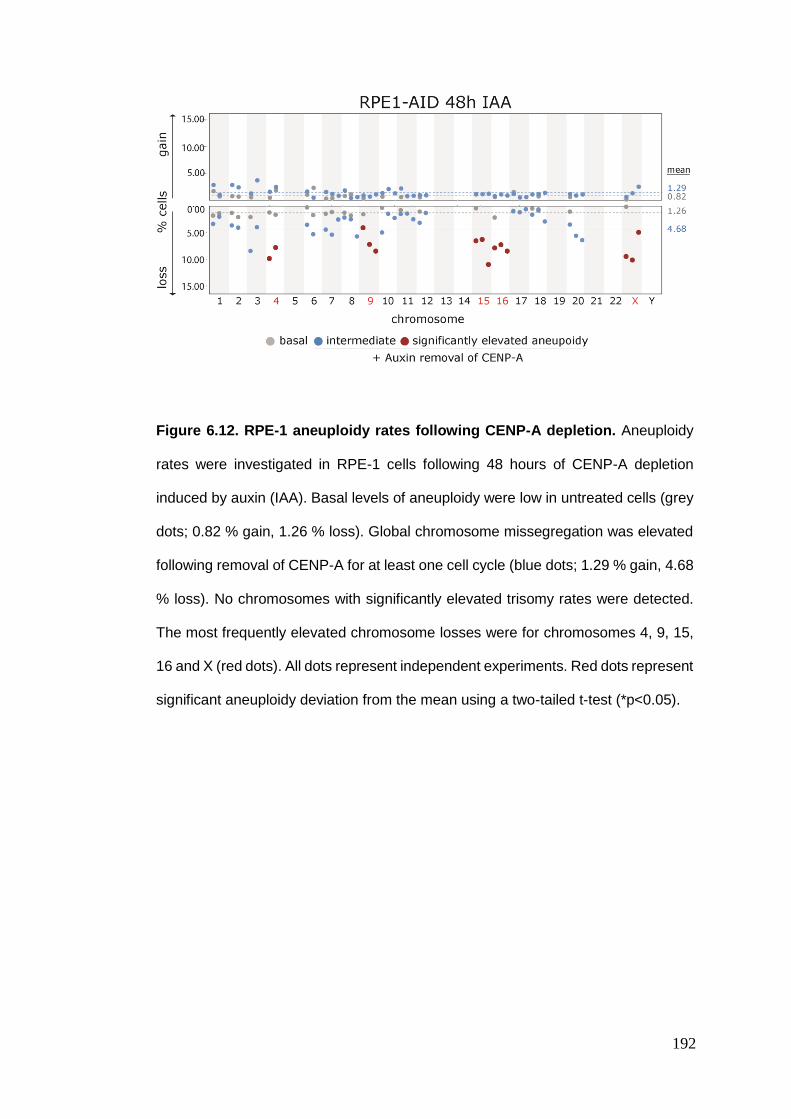
192
Figure 6.12. RPE-1 aneuploidy rates following CENP-A depletion. Aneuploidy
rates were investigated in RPE-1 cells following 48 hours of CENP-A depletion
induced by auxin (IAA). Basal levels of aneuploidy were low in untreated cells (grey
dots; 0.82 % gain, 1.26 % loss). Global chromosome missegregation was elevated
following removal of CENP-A for at least one cell cycle (blue dots; 1.29 % gain, 4.68
% loss). No chromosomes with significantly elevated trisomy rates were detected.
The most frequently elevated chromosome losses were for chromosomes 4, 9, 15,
16 and X (red dots). All dots represent independent experiments. Red dots represent
significant aneuploidy deviation from the mean using a two-tailed t-test (*p<0.05).
193
6.4.3. DLD1 aneuploidy rates following CENP-A depletion
A transformed, chromosomally-stable colorectal carcinoma cell line, DLD1, was
used to determine whether the patterns of chromosome loss observed following
CENP-A depletion in RPE-1 cells were cell line-specific. Similarly to RPE-1 cells,
DLD1 cells had both endogenous alleles of CENP-A replaced with AID-tagged
mutants.
First, the mean rate of chromosome gain and loss were determined and found to be
marginally higher in untreated DLD1-CENPA-AID cells compared to untreated RPE-
1-CENPA-AID cells, but this did not reach significance (figure 6.13; grey dots; 1.10
% vs. 0.82% and 1.97 % vs. 1.26 %, respectively).
DLD1-1-CENP-A-AID cells were treated with auxin for 48 hours to remove CENP-
A. As expected, chromosome missegregation was elevated following CENP-A
removal (figure 6.13; blue and red dots). Mean chromosome loss rates were similar
to those observed in RPE-1 cells following CENP-A removal (4.61 % vs. 4.68 %),
however average chromosome gain rates were significantly greater (1.82 % vs. 1.29
%; *p<0.05). Strikingly, chromosomes 1, 6, 7 and 18 were missegregating above the
mean across independent experiments which corresponded to a complete non-
overlapping of aneuploidy-prone chromosomes between the cell lines (figure 6.13;
red dots; 5.77, 6.97, 8.32 and 5.45 %, respectively; *p<0.05). Additionally, global
chromosome gain was also not as high as would be expected given the monosomy
rates across the population in DLD1 cells, similarly to RPE-1 cells (1.82 %).
These data suggest that chromosome missegregation rates following a
destabilisation of the centromere and/or kinetochore are cell line dependent.
Alternatively, they may highlight intrinsic differences in centromere fidelity between
transformed and non-transformed cell types.
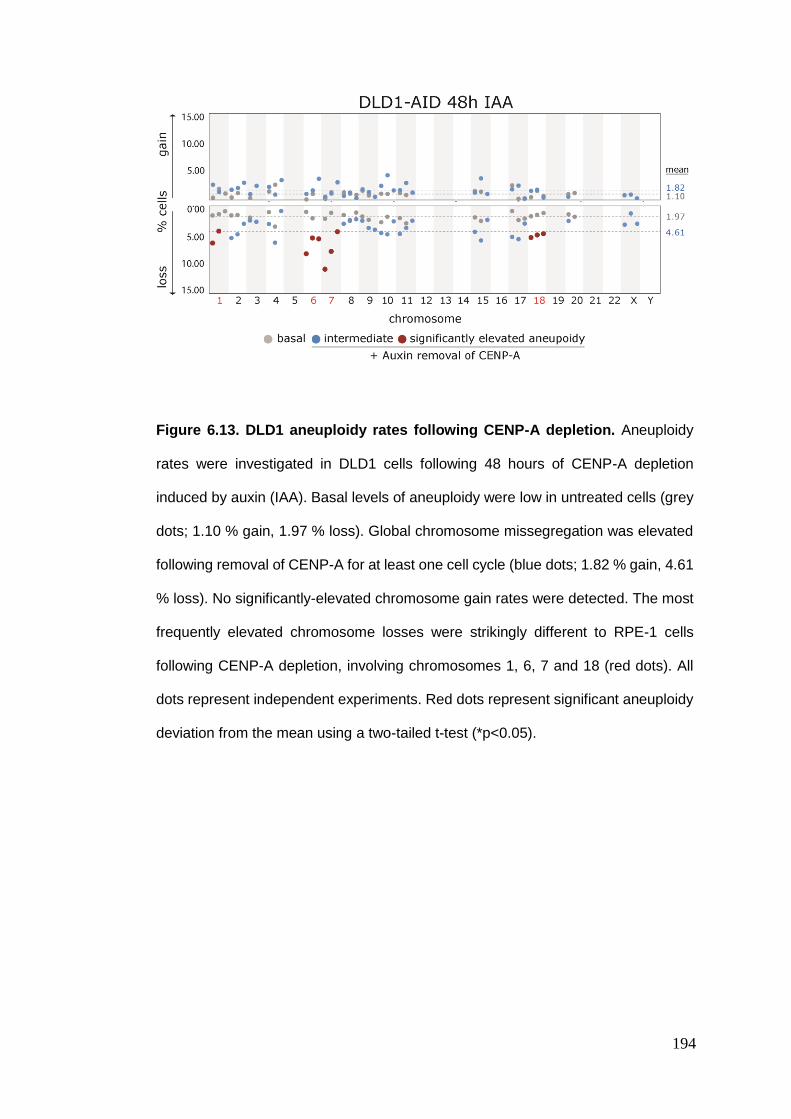
194
Figure 6.13. DLD1 aneuploidy rates following CENP-A depletion. Aneuploidy
rates were investigated in DLD1 cells following 48 hours of CENP-A depletion
induced by auxin (IAA). Basal levels of aneuploidy were low in untreated cells (grey
dots; 1.10 % gain, 1.97 % loss). Global chromosome missegregation was elevated
following removal of CENP-A for at least one cell cycle (blue dots; 1.82 % gain, 4.61
% loss). No significantly-elevated chromosome gain rates were detected. The most
frequently elevated chromosome losses were strikingly different to RPE-1 cells
following CENP-A depletion, involving chromosomes 1, 6, 7 and 18 (red dots). All
dots represent independent experiments. Red dots represent significant aneuploidy
deviation from the mean using a two-tailed t-test (*p<0.05).
195
6.5. Summary
I have implemented a high-throughput approach to determine individual-
chromosome aneuploidy rates in unperturbed cells and reported how these rates
change in response to a variety of cellular stresses. The discovery that individual
chromosomes missegregate with different frequencies following nocodazole wash-
out is a novel observation with high biological significance due to the importance of
merotely in human disease and the ubiquitous nature of nocodazole in the study of
aneuploidy. Importantly, this phenomenon was not cell-line specific, as a small
subset of chromosomes behaved similarly in cell lines derived from different tissues
of origin.
Moreover, individual chromosomes were missegregated with significantly elevated
frequencies following replication stress, revealing that particular chromosomes are
intrinsically vulnerable and others are contingent on the underlying mechanism
inducing aneuploidy.
Furthermore, I have demonstrated that CENP-A-dependent centromere
specification sensitises a small number of chromosomes to CENP-A depletion.
Strikingly, aneuploidy patterns observed in the absence of CENP-A were not
recurrent between RPE-1 and DLD1 cells, exposing a previously-unrecognised
potential for cell line-dependent variation in CENP-A levels at individual
centromeres.

196
7. Visualising individual
chromosome dynamics
during mitosis
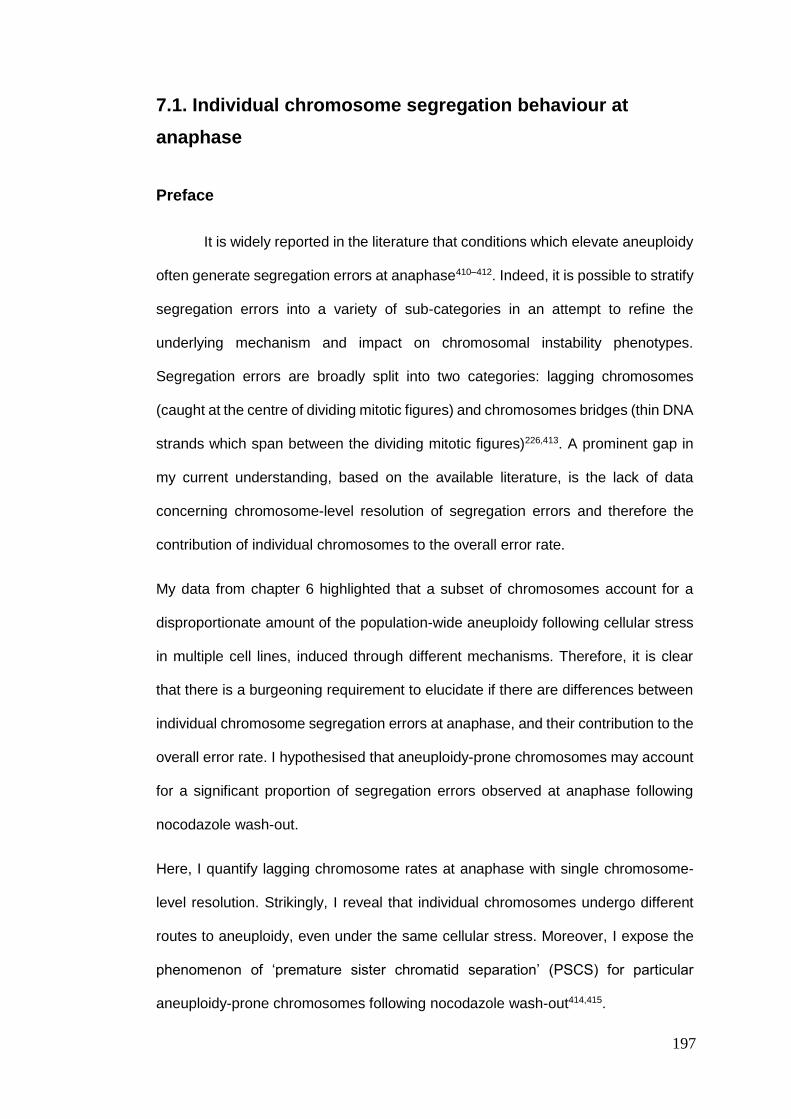
197
7.1. Individual chromosome segregation behaviour at
anaphase
Preface
It is widely reported in the literature that conditions which elevate aneuploidy
often generate segregation errors at anaphase410–412. Indeed, it is possible to stratify
segregation errors into a variety of sub-categories in an attempt to refine the
underlying mechanism and impact on chromosomal instability phenotypes.
Segregation errors are broadly split into two categories: lagging chromosomes
(caught at the centre of dividing mitotic figures) and chromosomes bridges (thin DNA
strands which span between the dividing mitotic figures)226,413. A prominent gap in
my current understanding, based on the available literature, is the lack of data
concerning chromosome-level resolution of segregation errors and therefore the
contribution of individual chromosomes to the overall error rate.
My data from chapter 6 highlighted that a subset of chromosomes account for a
disproportionate amount of the population-wide aneuploidy following cellular stress
in multiple cell lines, induced through different mechanisms. Therefore, it is clear
that there is a burgeoning requirement to elucidate if there are differences between
individual chromosome segregation errors at anaphase, and their contribution to the
overall error rate. I hypothesised that aneuploidy-prone chromosomes may account
for a significant proportion of segregation errors observed at anaphase following
nocodazole wash-out.
Here, I quantify lagging chromosome rates at anaphase with single chromosome-
level resolution. Strikingly, I reveal that individual chromosomes undergo different
routes to aneuploidy, even under the same cellular stress. Moreover, I expose the
phenomenon of ‘premature sister chromatid separation’ (PSCS) for particular
aneuploidy-prone chromosomes following nocodazole wash-out414,415.
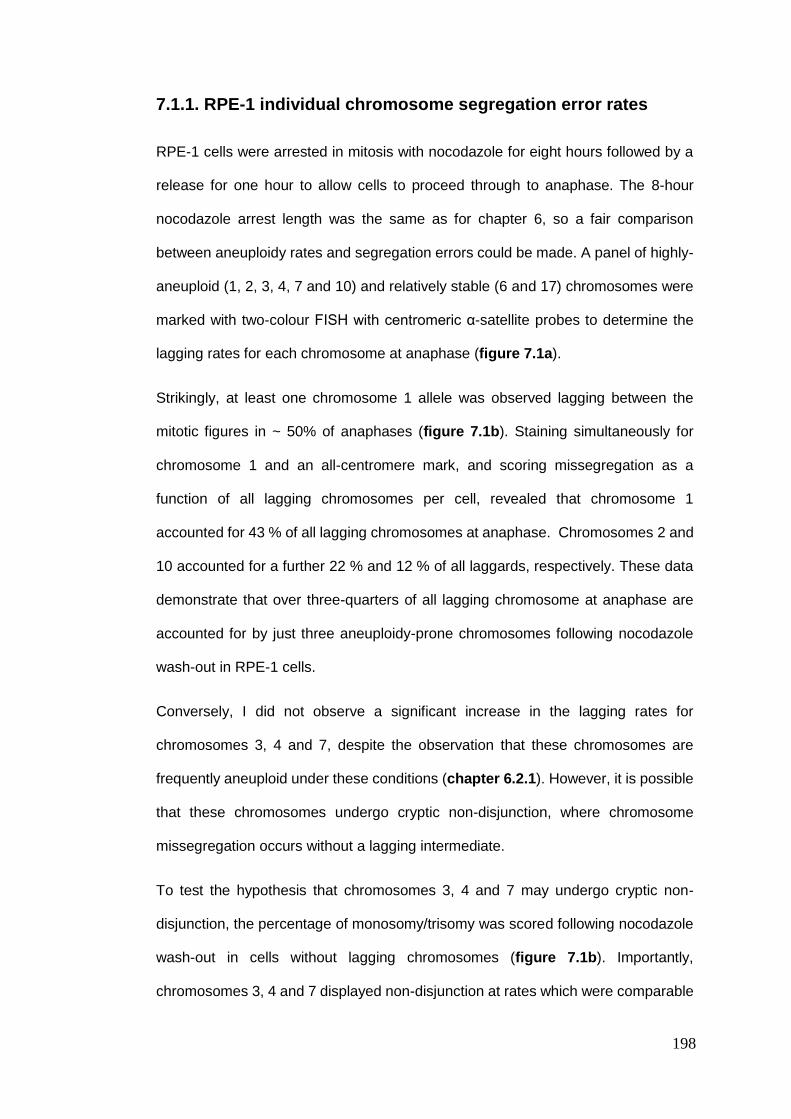
198
7.1.1. RPE-1 individual chromosome segregation error rates
RPE-1 cells were arrested in mitosis with nocodazole for eight hours followed by a
release for one hour to allow cells to proceed through to anaphase. The 8-hour
nocodazole arrest length was the same as for chapter 6, so a fair comparison
between aneuploidy rates and segregation errors could be made. A panel of highly-
aneuploid (1, 2, 3, 4, 7 and 10) and relatively stable (6 and 17) chromosomes were
marked with two-colour FISH with centromeric α-satellite probes to determine the
lagging rates for each chromosome at anaphase (figure 7.1a).
Strikingly, at least one chromosome 1 allele was observed lagging between the
mitotic figures in ~ 50% of anaphases (figure 7.1b). Staining simultaneously for
chromosome 1 and an all-centromere mark, and scoring missegregation as a
function of all lagging chromosomes per cell, revealed that chromosome 1
accounted for 43 % of all lagging chromosomes at anaphase. Chromosomes 2 and
10 accounted for a further 22 % and 12 % of all laggards, respectively. These data
demonstrate that over three-quarters of all lagging chromosome at anaphase are
accounted for by just three aneuploidy-prone chromosomes following nocodazole
wash-out in RPE-1 cells.
Conversely, I did not observe a significant increase in the lagging rates for
chromosomes 3, 4 and 7, despite the observation that these chromosomes are
frequently aneuploid under these conditions (chapter 6.2.1). However, it is possible
that these chromosomes undergo cryptic non-disjunction, where chromosome
missegregation occurs without a lagging intermediate.
To test the hypothesis that chromosomes 3, 4 and 7 may undergo cryptic non-
disjunction, the percentage of monosomy/trisomy was scored following nocodazole
wash-out in cells without lagging chromosomes (figure 7.1b). Importantly,
chromosomes 3, 4 and 7 displayed non-disjunction at rates which were comparable
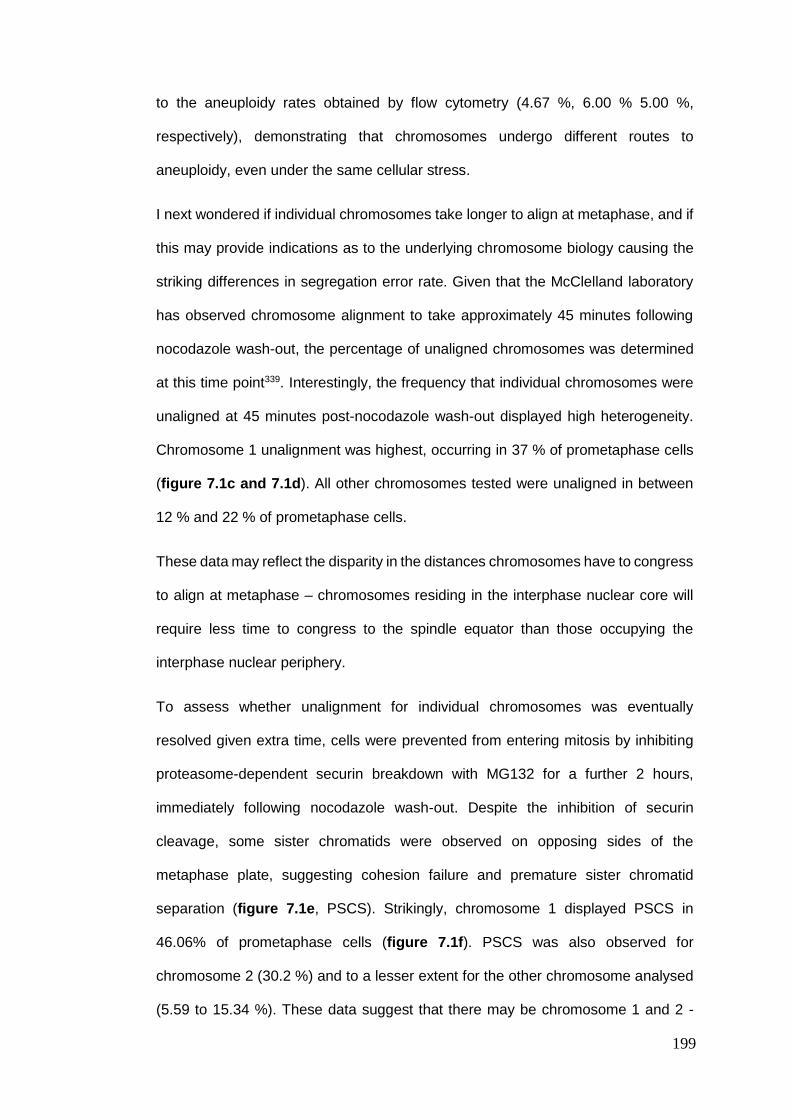
199
to the aneuploidy rates obtained by flow cytometry (4.67 %, 6.00 % 5.00 %,
respectively), demonstrating that chromosomes undergo different routes to
aneuploidy, even under the same cellular stress.
I next wondered if individual chromosomes take longer to align at metaphase, and if
this may provide indications as to the underlying chromosome biology causing the
striking differences in segregation error rate. Given that the McClelland laboratory
has observed chromosome alignment to take approximately 45 minutes following
nocodazole wash-out, the percentage of unaligned chromosomes was determined
at this time point339. Interestingly, the frequency that individual chromosomes were
unaligned at 45 minutes post-nocodazole wash-out displayed high heterogeneity.
Chromosome 1 unalignment was highest, occurring in 37 % of prometaphase cells
(figure 7.1c and 7.1d). All other chromosomes tested were unaligned in between
12 % and 22 % of prometaphase cells.
These data may reflect the disparity in the distances chromosomes have to congress
to align at metaphase – chromosomes residing in the interphase nuclear core will
require less time to congress to the spindle equator than those occupying the
interphase nuclear periphery.
To assess whether unalignment for individual chromosomes was eventually
resolved given extra time, cells were prevented from entering mitosis by inhibiting
proteasome-dependent securin breakdown with MG132 for a further 2 hours,
immediately following nocodazole wash-out. Despite the inhibition of securin
cleavage, some sister chromatids were observed on opposing sides of the
metaphase plate, suggesting cohesion failure and premature sister chromatid
separation (figure 7.1e, PSCS). Strikingly, chromosome 1 displayed PSCS in
46.06% of prometaphase cells (figure 7.1f). PSCS was also observed for
chromosome 2 (30.2 %) and to a lesser extent for the other chromosome analysed
(5.59 to 15.34 %). These data suggest that there may be chromosome 1 and 2 -
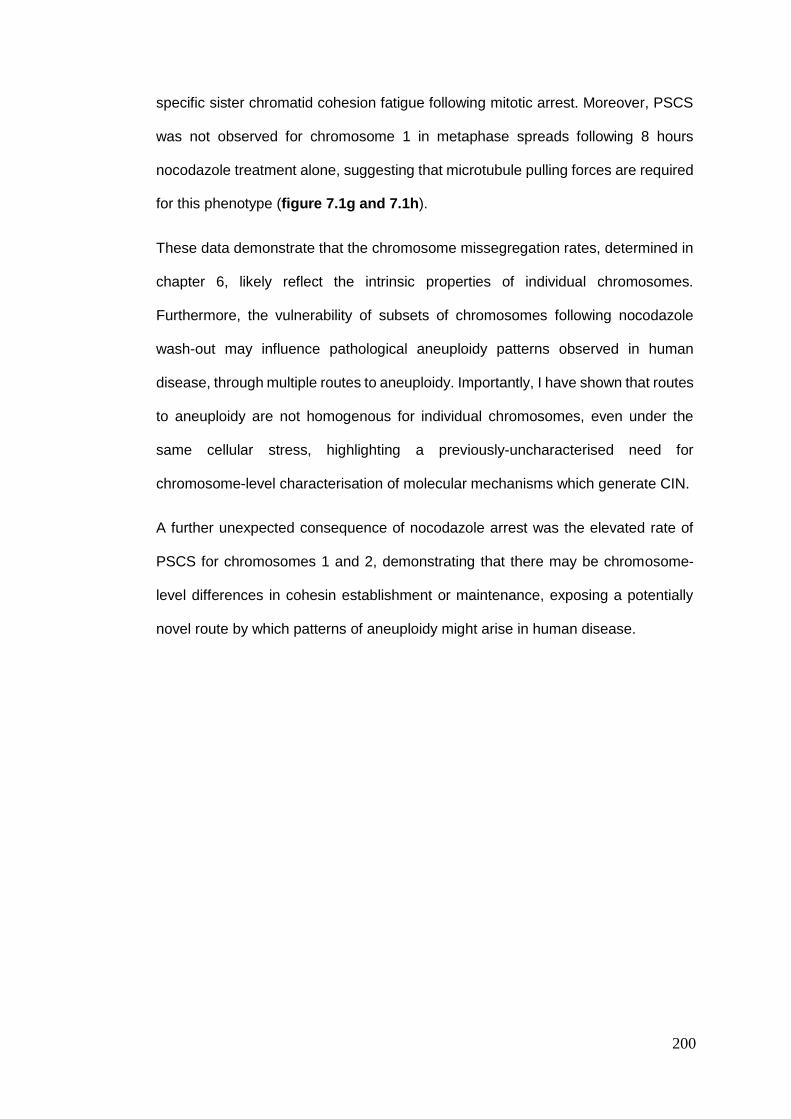
200
specific sister chromatid cohesion fatigue following mitotic arrest. Moreover, PSCS
was not observed for chromosome 1 in metaphase spreads following 8 hours
nocodazole treatment alone, suggesting that microtubule pulling forces are required
for this phenotype (figure 7.1g and 7.1h).
These data demonstrate that the chromosome missegregation rates, determined in
chapter 6, likely reflect the intrinsic properties of individual chromosomes.
Furthermore, the vulnerability of subsets of chromosomes following nocodazole
wash-out may influence pathological aneuploidy patterns observed in human
disease, through multiple routes to aneuploidy. Importantly, I have shown that routes
to aneuploidy are not homogenous for individual chromosomes, even under the
same cellular stress, highlighting a previously-uncharacterised need for
chromosome-level characterisation of molecular mechanisms which generate CIN.
A further unexpected consequence of nocodazole arrest was the elevated rate of
PSCS for chromosomes 1 and 2, demonstrating that there may be chromosome-
level differences in cohesin establishment or maintenance, exposing a potentially
novel route by which patterns of aneuploidy might arise in human disease.
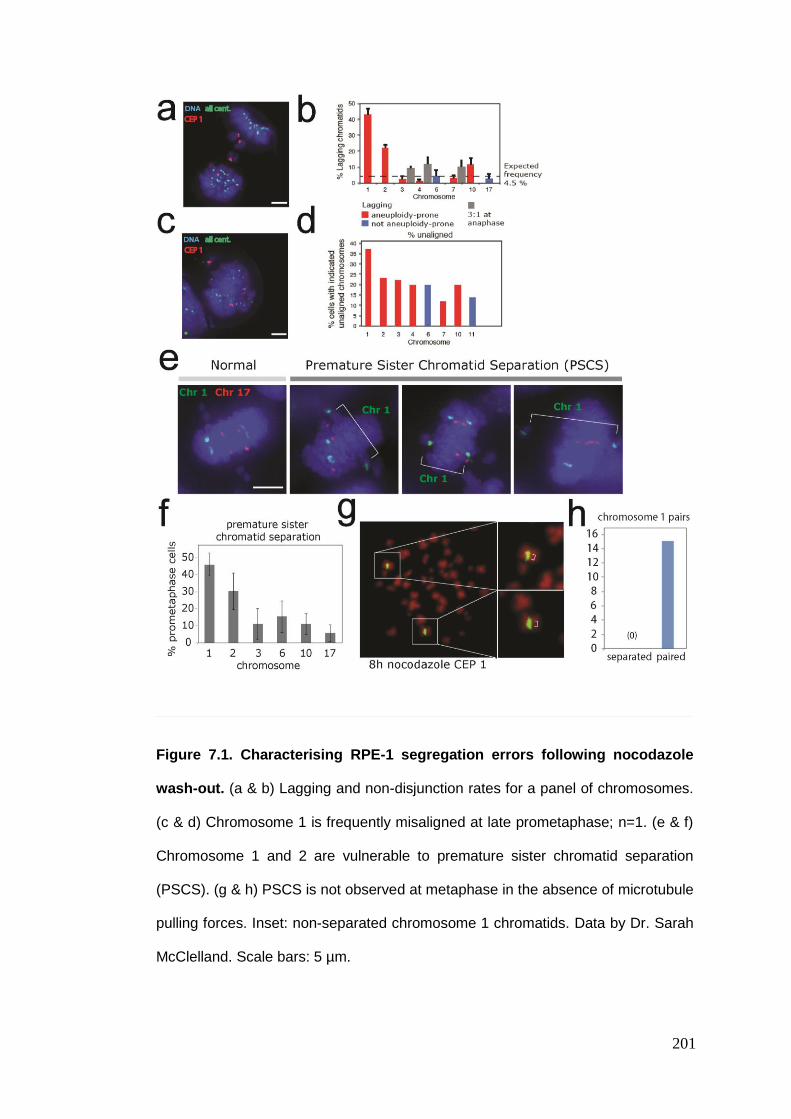
201
Figure 7.1. Characterising RPE-1 segregation errors following nocodazole
wash-out. (a & b) Lagging and non-disjunction rates for a panel of chromosomes.
(c & d) Chromosome 1 is frequently misaligned at late prometaphase; n=1. (e & f)
Chromosome 1 and 2 are vulnerable to premature sister chromatid separation
(PSCS). (g & h) PSCS is not observed at metaphase in the absence of microtubule
pulling forces. Inset: non-separated chromosome 1 chromatids. Data by Dr. Sarah
McClelland. Scale bars: 5 µm.
202
7.2. Metaphase chromosome territories
Preface
It is known that chromosomes occupy well-defined territories in the
interphase nucleus67,416. What is less clear, is whether the spatial arrangement of
chromosomes during interphase gives rise to similar patterns in the metaphase plate
as cells proceed to sister chromatid alignment at the spindle equator. Early work
demonstrated the potential for non-random arrangement of chromosomes in
metaphase spreads417,418. However, this approach is subject to significant artefacts
due to experimental reproducibility and subtle fluid mechanic disturbances as
chromosomes settle onto the solid glass support – thus obscuring the true
arrangement. Moreover, assessing the arrangement of chromosomes in the
unperturbed metaphase plate has the additional advantage of enabling the
elucidation of sister chromatid geometry.
I hypothesised that if patterns of chromosome alignment at metaphase were
observed, they may be able to explain chromosome missegregation behaviour – it
is possible that there are regions of the metaphase plate which are more prone to
chromosome missegregation.
The geometry of individual metaphase sister chromatid pairs (including relative
metaphase position, inter-centromere distance, inter-homologue distance and inter-
centromere angle) are currently unknown. Determining these parameters at
metaphase may reveal differences in underlying chromosome biology which could
explain the non-random chromosome missegregation patterns observed in chapter
6.
203
7.2.1. The geometry of metaphase chromosomes
Given that interphase chromosome territories are subtle, I anticipated the same
would be true at metaphase64,419. Determining the geometry of sister chromatid pairs
in the metaphase plate would therefore necessitate the precise analysis of hundreds
of metaphase chromosomes stained for specific centromeres by FISH with α-
satellite probes. Manual geometric measurements of such large image sets using
the image analysis program, ImageJ, can be labour-intensive and prone to analysis
artefacts introduced by human error. To circumvent the issues associated with
manual measurements, I developed a macro plugin for ImageJ which elucidates
chromatid geometry, regardless of the orientation of the metaphase plate in the
image (chapter 10.1.2). Using this novel approach, I undertook the first systematic
and high-throughput assessment of metaphase chromosome arrangement to test
whether specific chromosomes occupy preferred domains.
The metaphase plate region was defined by best-fit ellipse analysis of DAPI-stained
DNA. The metaphase measurements defined both the major and minor axis length
as well as the rotation of the plate around the ellipse centre from 0 to 180 degrees
(figure 7.2a). The ellipse centre served an important function as a reference to which
the normalised positions of sister chromatids could be radially mapped. Coordinates
for the centre of individual centromere signals were expressed as the distance from
the ellipse centre in both x and y dimensions (∆x and ∆y, respectively).
To calculate the relative metaphase position, chromatids were mapped as the radial
distance from the ellipse centre when aligned on the major axis, to standardise the
positions in the plate (figure 7.2b). To achieve this, standard trigonometric functions
were applied to the ∆x and ∆y coordinates (for proofs, see Materials and Methods,
chapter 3.8). These formulae accounted for the positioning of sister chromatids
relative to the major and minor axes, as well as the orientation of the metaphase

204
plate ellipse. To further account for metaphase orientation and length variation,
relative chromatid positions were expressed as the normalised radial distance from
the centre of the ellipse (figure 7.2b).
The angle (θ1) between sister chromatids pairs was calculated as the deviation from
parallel to the major axis, where [θ1 = 0] represents parallel chromatid alignment
(figure 7.2c). Furthermore, inter-centromere distance and inter-homologue distance
were calculated from the hypotenuse length between centromere pairs and relative
distance on the major axis, respectively.
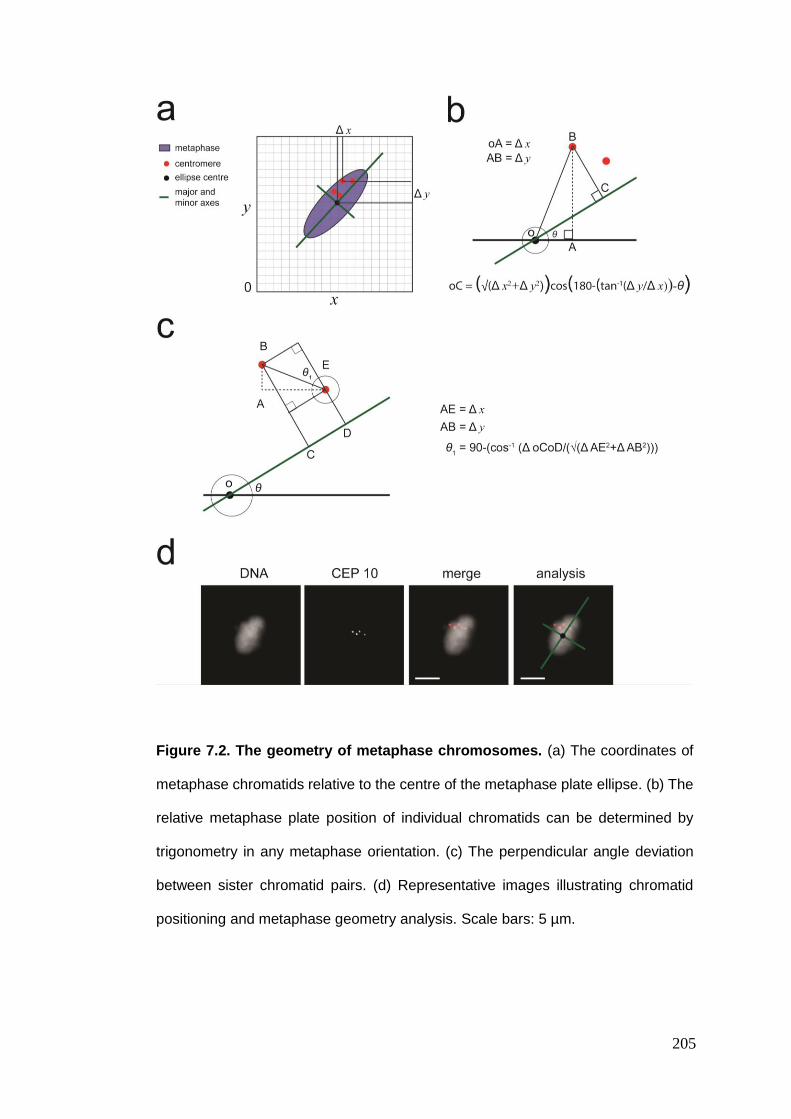
205
Figure 7.2. The geometry of metaphase chromosomes. (a) The coordinates of
metaphase chromatids relative to the centre of the metaphase plate ellipse. (b) The
relative metaphase plate position of individual chromatids can be determined by
trigonometry in any metaphase orientation. (c) The perpendicular angle deviation
between sister chromatid pairs. (d) Representative images illustrating chromatid
positioning and metaphase geometry analysis. Scale bars: 5 µm.
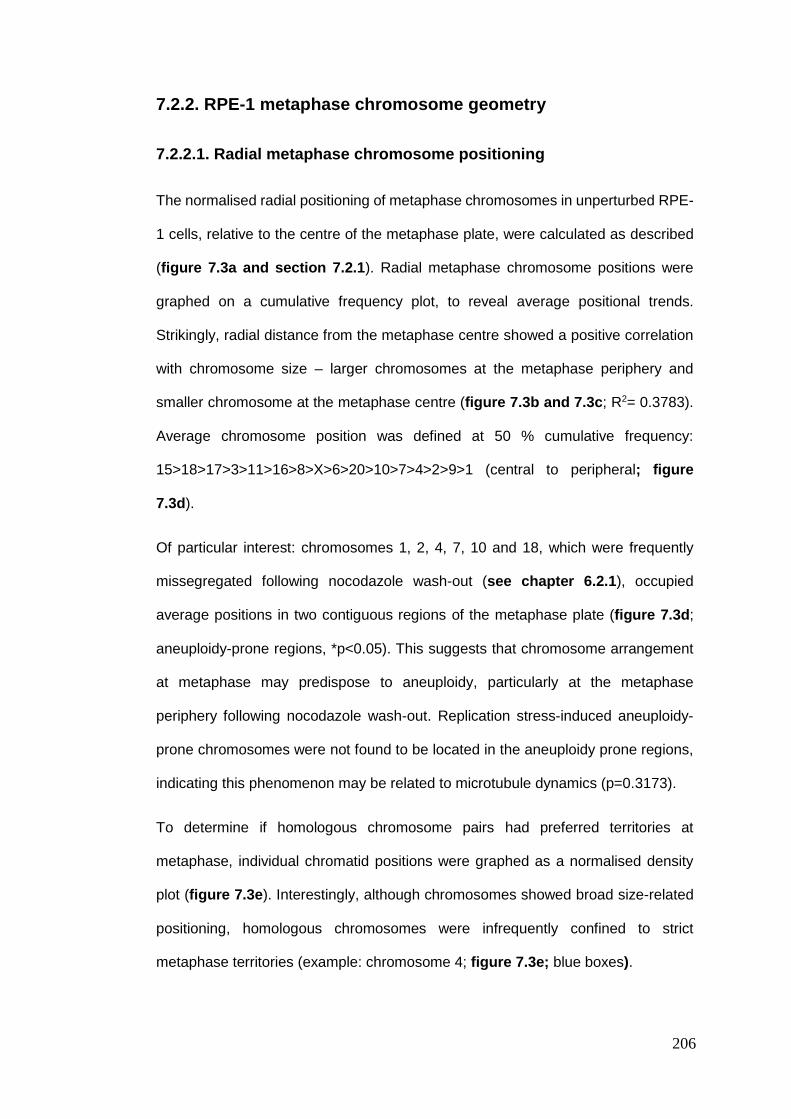
206
7.2.2. RPE-1 metaphase chromosome geometry
7.2.2.1. Radial metaphase chromosome positioning
The normalised radial positioning of metaphase chromosomes in unperturbed RPE-
1 cells, relative to the centre of the metaphase plate, were calculated as described
(figure 7.3a and section 7.2.1). Radial metaphase chromosome positions were
graphed on a cumulative frequency plot, to reveal average positional trends.
Strikingly, radial distance from the metaphase centre showed a positive correlation
with chromosome size – larger chromosomes at the metaphase periphery and
smaller chromosome at the metaphase centre (figure 7.3b and 7.3c; R2= 0.3783).
Average chromosome position was defined at 50 % cumulative frequency:
15>18>17>3>11>16>8>X>6>20>10>7>4>2>9>1 (central to peripheral; figure
7.3d).
Of particular interest: chromosomes 1, 2, 4, 7, 10 and 18, which were frequently
missegregated following nocodazole wash-out (see chapter 6.2.1), occupied
average positions in two contiguous regions of the metaphase plate (figure 7.3d;
aneuploidy-prone regions, *p<0.05). This suggests that chromosome arrangement
at metaphase may predispose to aneuploidy, particularly at the metaphase
periphery following nocodazole wash-out. Replication stress-induced aneuploidy-
prone chromosomes were not found to be located in the aneuploidy prone regions,
indicating this phenomenon may be related to microtubule dynamics (p=0.3173).
To determine if homologous chromosome pairs had preferred territories at
metaphase, individual chromatid positions were graphed as a normalised density
plot (figure 7.3e). Interestingly, although chromosomes showed broad size-related
positioning, homologous chromosomes were infrequently confined to strict
metaphase territories (example: chromosome 4; figure 7.3e; blue boxes).
207
Figure 7.3. The radial positioning of metaphase chromosomes in RPE-1 cells.
(a) Radial metaphase position can be expressed in metaphase length. (b)
Cumulative frequency of metaphase positions reveals a size-dependent positioning
phenomenon. (c) Chromosome size is correllated with radial metaphase position
(R2=0.3783). (d) Average chromosome position with aneuploidy-prone regions.
Nocodazole-induced aneuploidy-prone significance by chi-squared *p<0.05 (0.
0117). (e) Individual chromsomes occupy a range of positions at metaphase. Blue
boxes: example of chromosome 4 territories. Red arrows: significantly elevated
aneuploidy in nocodazole wash-out. n=2820 from three independent experiments.
208
7.2.2.2. Inter-homologue distance
Given that chromosomes broadly exhibited size-dependent positioning at
metaphase, I hypothesised that there may be a tendency for homologous
chromosomes pairs to be spatially separated from one another by a regular
distance, and this could contribute to the positioning phenomenon (figure 7.4a). To
test this hypothesis, the distance between homologous chromosome pairs along the
major metaphase axis was enumerated as a function of total metaphase distance,
to account for variability in overall metaphase plate length. Strikingly, most
homologous chromosomes were usually found within 25 % of the metaphase plate
length from one another, irrespective of overall position (figure 7.4b). This was not
true for chromosomes 1, 2 and 17 where chromosomes were frequently found
beyond this distance. Excluding these three chromosomes, it was rare to find
homologous chromosomes separated by greater than 50 % of the metaphase plate
length.
The chromosome spacing phenomenon is most easily conceptualised using
chromosome 4 as an example. The distribution of chromosome 4 at metaphase was
broadly restricted to two readily-identifiable metaphase regions, [0.13-0.17] and
[0.46-0.54], of the normalised radial distance from the metaphase centre (figure
7.3e; blue boxes). However, the spacing of chromosome 4 homologs was
infrequently greater than 0.08 (8 %) of the metaphase plate length (figure 7.4b,
chromosome 4). This suggests that chromosome 4 homologs congress to the same
region of the spindle equator, thereby establishing territories in one of two regions
in the majority of instances.
These data demonstrate that there may be mechanisms which govern the relative
spacing of homologous chromosomes pairs – possibly as a result of interphase
chromosome territory preservation through to metaphase.
209
7.2.2.3. Inter-centromere distance
The distance between centromeric signals of sister chromatid pairs can be used as
a surrogate measure of cohesion. To investigate if particular chromosomes were
more vulnerable to cohesion weakening (but not complete PSCS, described in
chapter 7.1.1) at metaphase, and therefore increased missegregation at anaphase,
inter-centromere distance was measured as described above (chapter 7.2.1). The
mean inter-centromeric distance in untreated RPE-1 cells was 1.84 µm – less than
the 2 µm limit defined for faithful sister chromatid cohesion (figure 7.4c) 256.
Conversely, the inter-centromeric distance for chromosomes 3, 9 and 18 were
significantly greater than the mean, suggesting that some chromosomes may be
more prone to weakened cohesion at metaphase (*p<0.05). This is interesting as
chromosomes 3 and 18 were observed missegregating at significantly higher
frequencies in this cell line following nocodazole wash-out, suggesting that cohesion
weakening at metaphase may be compounded by a global increase in merotely after
nocodazole wash-out.
Moreover, the average position of chromosomes 9 and 18 were found in the
peripheral, aneuploidy-prone regions at metaphase. It is therefore a possibility that,
in addition to the intrinsic properties of individual chromosomes, sister chromatid
cohesin strength is influenced by the relative position occupied at metaphase. For
chromosome X, no chromatids were separated by a large enough distance to be
analysed, because of sister centromere signal overlapping.
One important consideration for the experiments described above is that, in my
hands, the FISH signals of centromeric α-satellite probes are not as accurate for
determining cohesion as immunofluorescent inter-kinetochore distances analysis.
One explanation is that there may be incomplete probe binding or subtle differences
between signals on sister chromatid pairs, even within the same metaphase plate.

210
Therefore, my data may be prone to artefacts introduced by differences in probe
hybridisation. My image analysis tool finds the Gaussian-fitted centre point of
fluorescent signals and measures the distance between non-overlapping signals. In
this way, the inter-centromere distances defined here are more useful for inferring
general weakening of centromeric cohesion rather than the de facto distance
between sister centromeres.
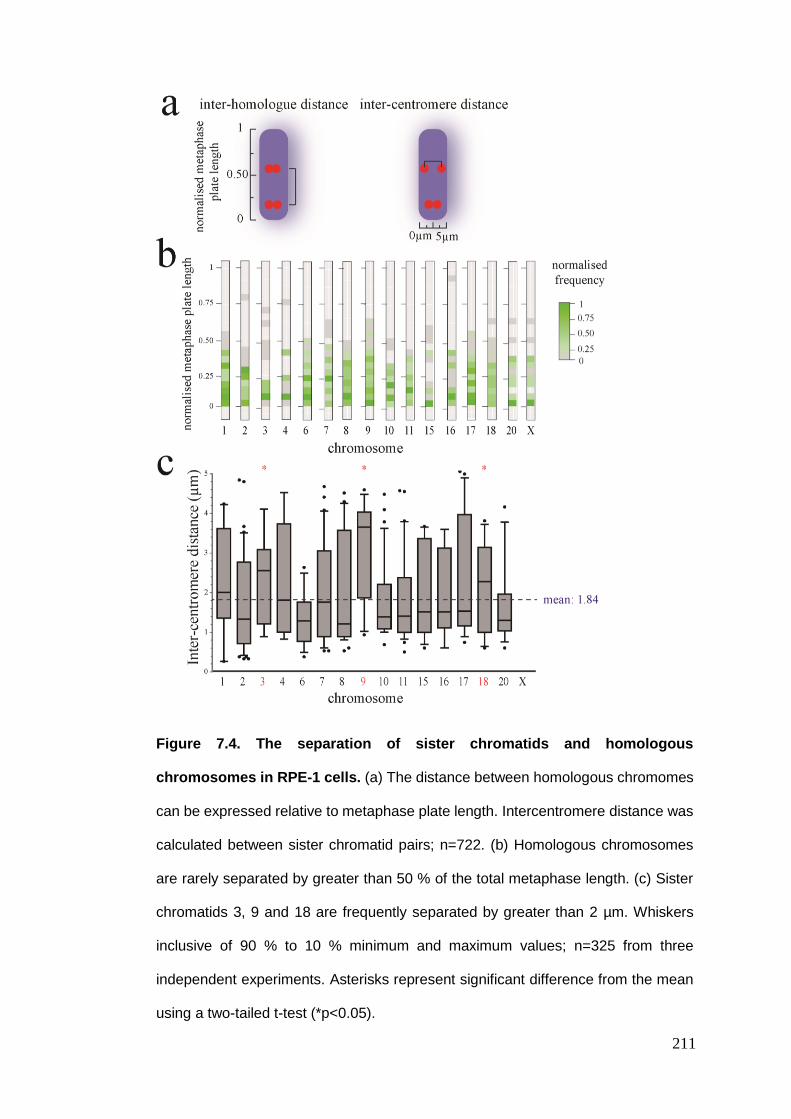
211
Figure 7.4. The separation of sister chromatids and homologous
chromosomes in RPE-1 cells. (a) The distance between homologous chromomes
can be expressed relative to metaphase plate length. Intercentromere distance was
calculated between sister chromatid pairs; n=722. (b) Homologous chromosomes
are rarely separated by greater than 50 % of the total metaphase length. (c) Sister
chromatids 3, 9 and 18 are frequently separated by greater than 2 µm. Whiskers
inclusive of 90 % to 10 % minimum and maximum values; n=325 from three
independent experiments. Asterisks represent significant difference from the mean
using a two-tailed t-test (*p<0.05).
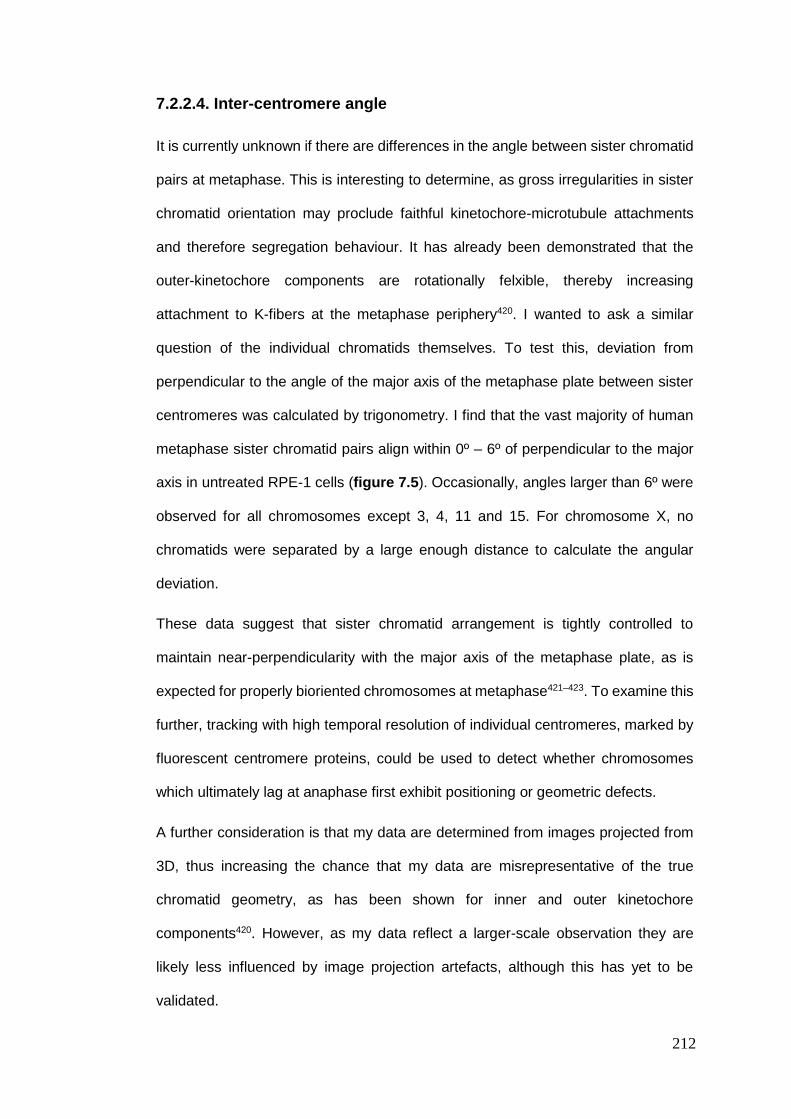
212
7.2.2.4. Inter-centromere angle
It is currently unknown if there are differences in the angle between sister chromatid
pairs at metaphase. This is interesting to determine, as gross irregularities in sister
chromatid orientation may proclude faithful kinetochore-microtubule attachments
and therefore segregation behaviour. It has already been demonstrated that the
outer-kinetochore components are rotationally felxible, thereby increasing
attachment to K-fibers at the metaphase periphery420. I wanted to ask a similar
question of the individual chromatids themselves. To test this, deviation from
perpendicular to the angle of the major axis of the metaphase plate between sister
centromeres was calculated by trigonometry. I find that the vast majority of human
metaphase sister chromatid pairs align within 0º – 6º of perpendicular to the major
axis in untreated RPE-1 cells (figure 7.5). Occasionally, angles larger than 6º were
observed for all chromosomes except 3, 4, 11 and 15. For chromosome X, no
chromatids were separated by a large enough distance to calculate the angular
deviation.
These data suggest that sister chromatid arrangement is tightly controlled to
maintain near-perpendicularity with the major axis of the metaphase plate, as is
expected for properly bioriented chromosomes at metaphase421–423. To examine this
further, tracking with high temporal resolution of individual centromeres, marked by
fluorescent centromere proteins, could be used to detect whether chromosomes
which ultimately lag at anaphase first exhibit positioning or geometric defects.
A further consideration is that my data are determined from images projected from
3D, thus increasing the chance that my data are misrepresentative of the true
chromatid geometry, as has been shown for inner and outer kinetochore
components420. However, as my data reflect a larger-scale observation they are
likely less influenced by image projection artefacts, although this has yet to be
validated.
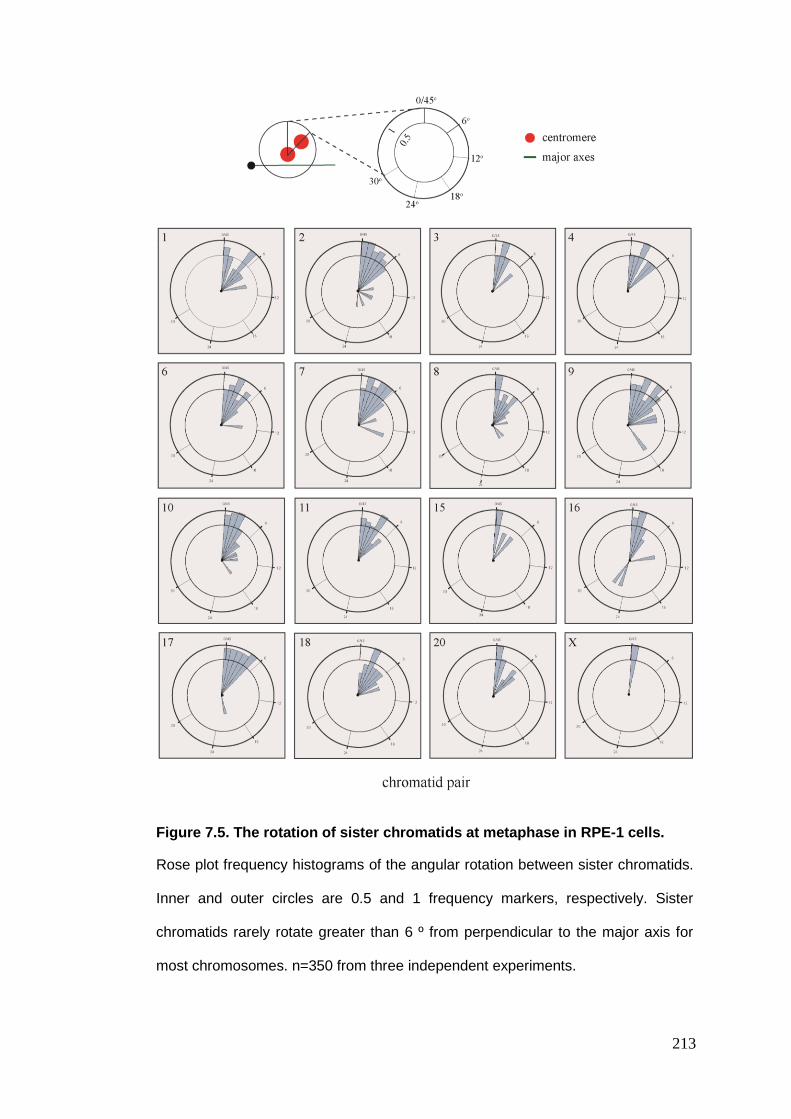
213
Figure 7.5. The rotation of sister chromatids at metaphase in RPE-1 cells.
Rose plot frequency histograms of the angular rotation between sister chromatids.
Inner and outer circles are 0.5 and 1 frequency markers, respectively. Sister
chromatids rarely rotate greater than 6 º from perpendicular to the major axis for
most chromosomes. n=350 from three independent experiments.
214
7.2.3. BJ metaphase chromosome geometry
7.2.3.1. Radial metaphase chromosome positioning
To determine if size-dependent chromosome positioning applied broadly across
multiple cell lines, BJ metaphase chromosome positions were determined as
previously described (chapter 7.2.1). Similarly to the observation in RPE-1 cells, the
average chromosome position at metaphase correlated with chromosome size
(figure 7.6b and 7.6c; R2=0.7537). The average chromosome position was defined
at 50 % cumulative frequency, with chromosomes ordered as follows (central to
peripheral): 18>20>16>15>11>10>8>17>X>6>4>7>3>9>2>1(figure 7.6a).
The most notable differences in chromosome positioning between cell lines was for
chromosomes 3 and 20, found predominantly at the metaphase centre and
periphery, respectively, in RPE-1 cells. This is important because chromosomes 18
and 20 were highly aneuploid following nocodazole in BJ cells (chapter 6.2.2),
suggesting that central metaphase positioning may also contribute to the propensity
of chromosomes to missegregate in addition to metaphase periphery vulnerabilities
(figure 7.6b; aneuploidy-prone regions). In both nocodazole wash-out and
replication stress, aneuploidy-prone chromosomes were found significantly more
frequently in the aneuploidy-prone metaphase regions, confirming that regions of
the metaphase plate are vulnerable to missegregation across cell lines (*p<0.05).
Analysis of individual chromosomes revealed a distribution throughout the
metaphase plate which correlated with chromosome size but not individual
chromosome territories (figure 7.6c). Chromosome positions were similar to, but not
indistinguishable from, those observed in RPE-1 cells. For example, chromosome
16 positioning was discreet in RPE-1 cells but continuous in BJ cells. Additionally,
chromosome 4 was more evenly distributed than in RPE-1 cells.

215
These data therefore highlight that chromosome arrangement at metaphase is
broadly size-dependent but individual chromosomes are not restricted to particular
domains. Furthermore, chromosome positioning at metaphase may predispose to
aneuploidy of particular chromosomes, potentially by compounding the effects of
other intrinsic chromosome characteristics, such as cohesion weakening and
kinetochore-microtubule stability.
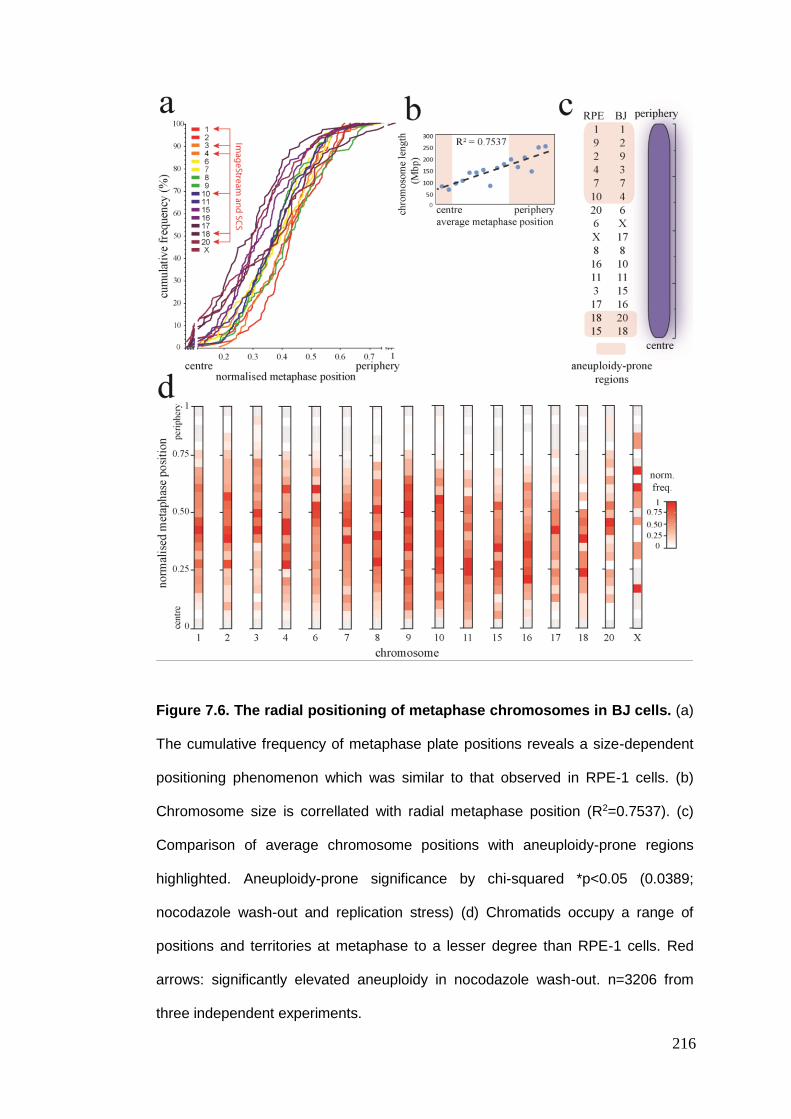
216
Figure 7.6. The radial positioning of metaphase chromosomes in BJ cells. (a)
The cumulative frequency of metaphase plate positions reveals a size-dependent
positioning phenomenon which was similar to that observed in RPE-1 cells. (b)
Chromosome size is correllated with radial metaphase position (R2=0.7537). (c)
Comparison of average chromosome positions with aneuploidy-prone regions
highlighted. Aneuploidy-prone significance by chi-squared *p<0.05 (0.0389;
nocodazole wash-out and replication stress) (d) Chromatids occupy a range of
positions and territories at metaphase to a lesser degree than RPE-1 cells. Red
arrows: significantly elevated aneuploidy in nocodazole wash-out. n=3206 from
three independent experiments.
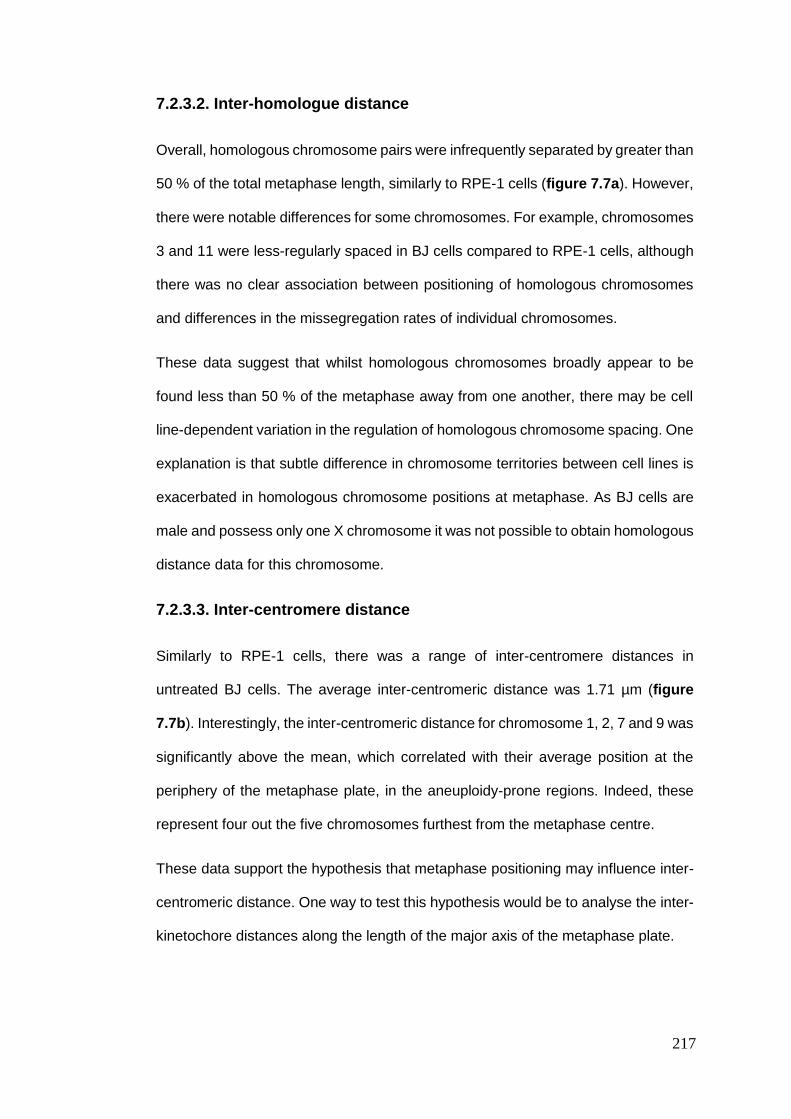
217
7.2.3.2. Inter-homologue distance
Overall, homologous chromosome pairs were infrequently separated by greater than
50 % of the total metaphase length, similarly to RPE-1 cells (figure 7.7a). However,
there were notable differences for some chromosomes. For example, chromosomes
3 and 11 were less-regularly spaced in BJ cells compared to RPE-1 cells, although
there was no clear association between positioning of homologous chromosomes
and differences in the missegregation rates of individual chromosomes.
These data suggest that whilst homologous chromosomes broadly appear to be
found less than 50 % of the metaphase away from one another, there may be cell
line-dependent variation in the regulation of homologous chromosome spacing. One
explanation is that subtle difference in chromosome territories between cell lines is
exacerbated in homologous chromosome positions at metaphase. As BJ cells are
male and possess only one X chromosome it was not possible to obtain homologous
distance data for this chromosome.
7.2.3.3. Inter-centromere distance
Similarly to RPE-1 cells, there was a range of inter-centromere distances in
untreated BJ cells. The average inter-centromeric distance was 1.71 µm (figure
7.7b). Interestingly, the inter-centromeric distance for chromosome 1, 2, 7 and 9 was
significantly above the mean, which correlated with their average position at the
periphery of the metaphase plate, in the aneuploidy-prone regions. Indeed, these
represent four out the five chromosomes furthest from the metaphase centre.
These data support the hypothesis that metaphase positioning may influence inter-
centromeric distance. One way to test this hypothesis would be to analyse the inter-
kinetochore distances along the length of the major axis of the metaphase plate.
218
Figure 7.7. The separation of sister chromatids and homologous
chromosomes in BJ cells. (a) Homologous chromosomes are rarely separated by
greater than 50 % of the total metaphase length. Similar patterns are observed
between BJ and RPE-1 cells; n=821. (b) Sister chromatids 1, 2, 7 and 9 are
frequently separated by greater than 2 µm. Whiskers inclusive of 90 % to 10 %
minimum and maximum values. n=463 from three independent experiments.
Asterisks represent significant difference from the mean using a two-tailed t-test
(*p<0.05).
219
7.2.3.4. Inter-centromere angle
The angle between sister chromatid pairs were similar to those observed in RPE-1
cells, with the majority of chromatid pairs exhibiting an angular deviation of less than
6º (figure 7.8). There was no obvious correlation between inter-centromere distance
and the angular deviation, suggesting that sister chromatid alignment is tightly
coordinated regardless of centromeric cohesion. However, angles greater than 6 º
were not observed for chromosomes 16, 18 and 20 which, on average, occupy the
most central metaphase positions in BJ cells. Of particular note, angles greater than
20 º were observed for chromosomes 1, 2 and 9 which occupy positions at the
equatorial periphery.
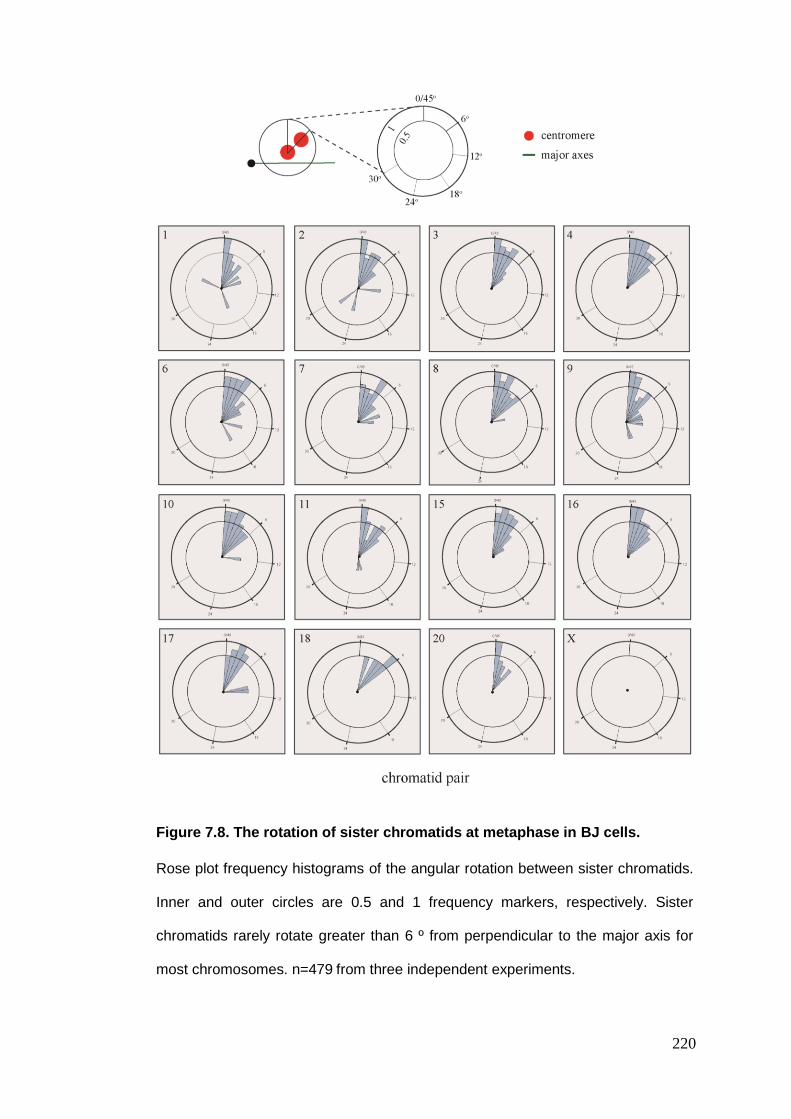
220
Figure 7.8. The rotation of sister chromatids at metaphase in BJ cells.
Rose plot frequency histograms of the angular rotation between sister chromatids.
Inner and outer circles are 0.5 and 1 frequency markers, respectively. Sister
chromatids rarely rotate greater than 6 º from perpendicular to the major axis for
most chromosomes. n=479 from three independent experiments.
221
7.2.4. RPE-1 metaphase chromosome geometry post-nocodazole
Condensed chromosomes congress to the spindle equator during prometaphase by
microtubule-dependent translocation424–426. It is currently unknown how metaphase
positioning might be affected by an 8 hour period in the absence of microtubules, as
is the case for nocodazole wash-out. One hypothesis is that chromosome position
may be altered by Brownian motion of chromosomes during this period of
microtubule absence. Additionally, I wanted to determine whether aneuploidy-prone
chromosomes remained clustered at discrete metaphase regions, as previously
observed in unperturbed RPE-1 and BJ cells. To answer these questions, the
position of metaphase chromosome were analysed 45 minutes after release from
an 8-hour nocodazole arrest, to allow time for chromosomes to congress to the
spindle equator.
7.2.4.1. Radial metaphase chromosome positioning
The radial positioning of metaphase chromosomes in RPE-1 cells post-nocodazole
arrest, relative to the centre of the metaphase plate, were calculated as described
above. The relative chromosome positions were plotted as cumulative frequency
along the metaphase axis, to reveal general positional preferences. Interestingly,
size-dependent chromosome position at metaphase was observed, with
chromosome order being similar to that reported in untreated RPE-1 and BJ cells
(figure 7.9a and 7.9b). Chromosomes of intermediate size were arranged in
accordance with their size throughout the plate. Average chromosomes
arrangements were defined centrally to peripherally in the following order:
18>16>15>17>11>8>6>X>10>20>4>9>7>2>3>1 (figure 7.9c). In agreement with
the data without nocodazole arrest, aneuploidy-prone chromosome are located
significantly more frequently in the aneuploidy-prone metaphase regions (*p<0.05).
222
Furthermore, the position of individual chromatids was plotted as a density plot and
revealed similar patterns to those observed for untreated RPE-1 and BJ cells (figure
7.9d). Of special interest, chromosome 1 – highly missegregated following
nocodazole wash-out – was observed in a diffuse pattern relative that observed in
untreated RPE-1 cells (figure 7.9d; blue boxes cf. figure 7.3e; chromosome 1). It is
possible that the premature loss of sister chromatid cohesion (PSCS; chapter 7.1.1)
may result in two phenotypes: one in which the sister chromatids are separated and
remain uncongressed; the other where PSCS still occurs but individual sisters
congress to a number of metaphase geographies in a stochastic manner. This could
account for the diffuse pattern of chromosome 1 positions observed at metaphase
following nocodazole wash-out.
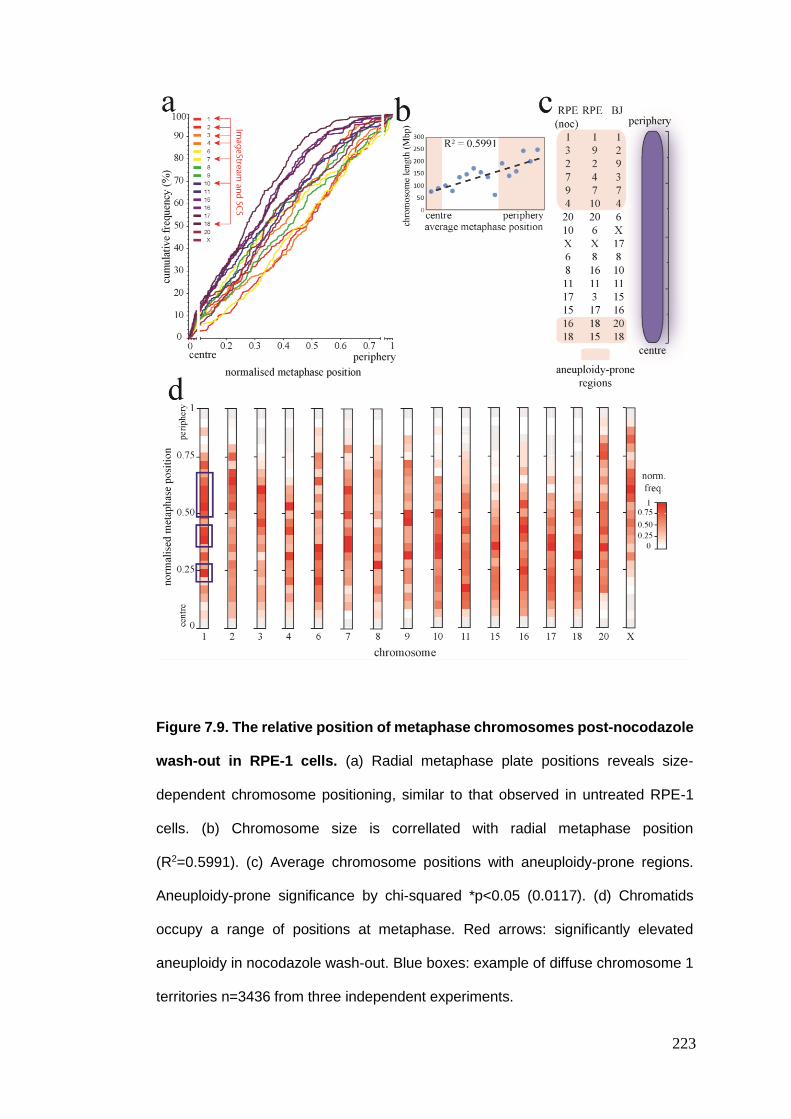
223
Figure 7.9. The relative position of metaphase chromosomes post-nocodazole
wash-out in RPE-1 cells. (a) Radial metaphase plate positions reveals size-
dependent chromosome positioning, similar to that observed in untreated RPE-1
cells. (b) Chromosome size is correllated with radial metaphase position
(R2=0.5991). (c) Average chromosome positions with aneuploidy-prone regions.
Aneuploidy-prone significance by chi-squared *p<0.05 (0.0117). (d) Chromatids
occupy a range of positions at metaphase. Red arrows: significantly elevated
aneuploidy in nocodazole wash-out. Blue boxes: example of diffuse chromosome 1
territories n=3436 from three independent experiments.
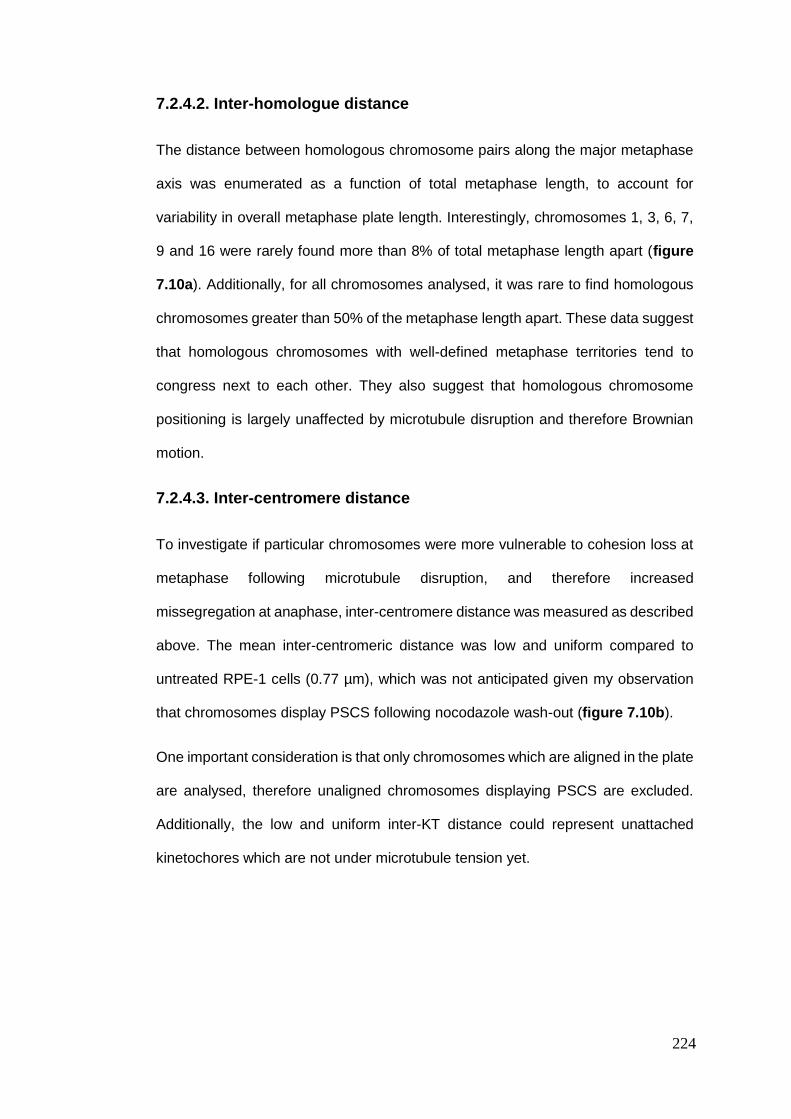
224
7.2.4.2. Inter-homologue distance
The distance between homologous chromosome pairs along the major metaphase
axis was enumerated as a function of total metaphase length, to account for
variability in overall metaphase plate length. Interestingly, chromosomes 1, 3, 6, 7,
9 and 16 were rarely found more than 8% of total metaphase length apart (figure
7.10a). Additionally, for all chromosomes analysed, it was rare to find homologous
chromosomes greater than 50% of the metaphase length apart. These data suggest
that homologous chromosomes with well-defined metaphase territories tend to
congress next to each other. They also suggest that homologous chromosome
positioning is largely unaffected by microtubule disruption and therefore Brownian
motion.
7.2.4.3. Inter-centromere distance
To investigate if particular chromosomes were more vulnerable to cohesion loss at
metaphase following microtubule disruption, and therefore increased
missegregation at anaphase, inter-centromere distance was measured as described
above. The mean inter-centromeric distance was low and uniform compared to
untreated RPE-1 cells (0.77 µm), which was not anticipated given my observation
that chromosomes display PSCS following nocodazole wash-out (figure 7.10b).
One important consideration is that only chromosomes which are aligned in the plate
are analysed, therefore unaligned chromosomes displaying PSCS are excluded.
Additionally, the low and uniform inter-KT distance could represent unattached
kinetochores which are not under microtubule tension yet.
225
Figure 7.10. The separation of sister chromatids and homologous
chromosomes in RPE-1 cells post-nococodazole wash-out. (a) Homologous
chromosomes are rarely separated by greater than 50 % of the total metaphase
length. Similar patterns are observed between treated and untreated RPE-1 cells;
n=663. (b) Average sister chromatid separation did not exceed 1 µm for any
chromosome. Whiskers inclusive of 90 % to 10 % minimum and maximum values.
No significant deviation from the mean was observed with a two-tailed t-test. n=1335
from three independent experiments.
226
7.2.4.4. Inter-centromere angle
The deviation from perpendicular to the angle of the major axis of the metaphase
plate was calculated by trigonometry as previously described. I find that most human
metaphase sister chromatid pairs align within 0º – 6º of perpendicular to the major
axis in RPE-1 cells following nocodazole wash-out, in-line with those aboserved for
both untreated RPE-1 and BJ cells (figure 7.11). Occasionally, angles larger than
6º were observed for all chromosomes except 6, 17 and 20. Suprisngly,
chromosomes 3, 4, 8 and 16 had an increased number of chromosomes which
deviated by more than 6º, and chromosome 1 infrequently had sister chromatids that
deviated by as much as 36º. These data suggest that sister chromatid arrangement
is tightly controlled to maintain near-perpendicularity with the major axis of the
metaphase plate.
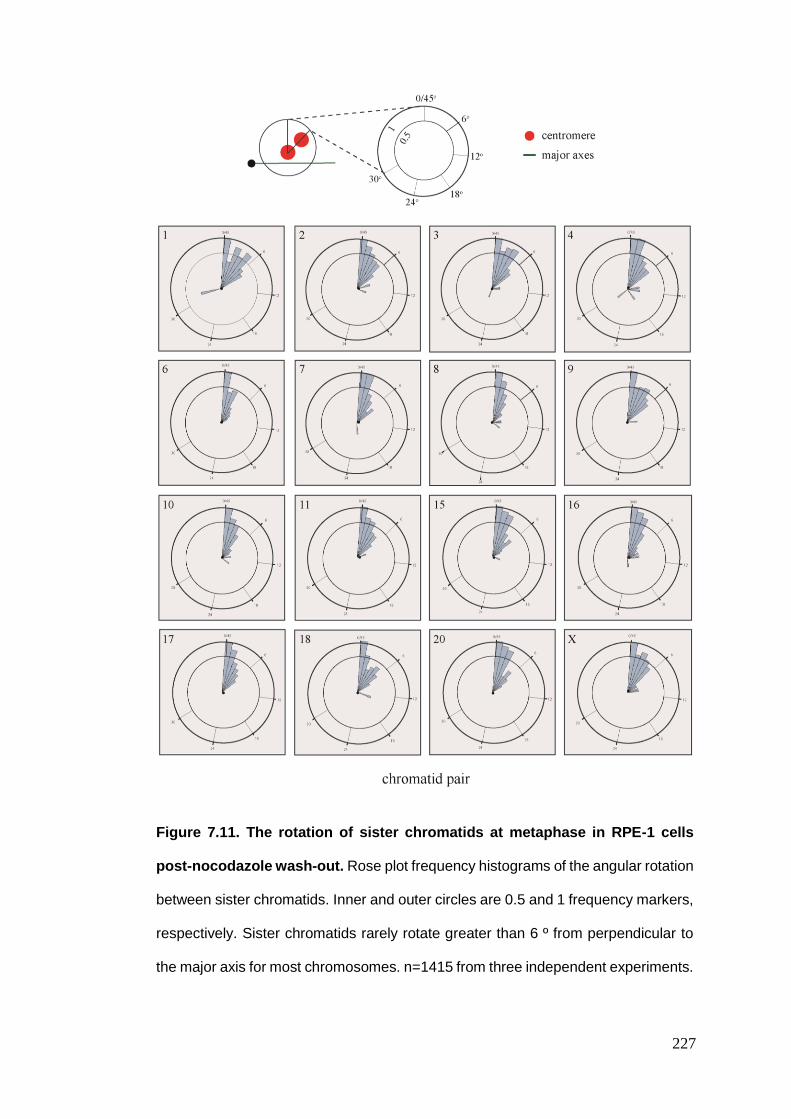
227
Figure 7.11. The rotation of sister chromatids at metaphase in RPE-1 cells
post-nocodazole wash-out. Rose plot frequency histograms of the angular rotation
between sister chromatids. Inner and outer circles are 0.5 and 1 frequency markers,
respectively. Sister chromatids rarely rotate greater than 6 º from perpendicular to
the major axis for most chromosomes. n=1415 from three independent experiments.
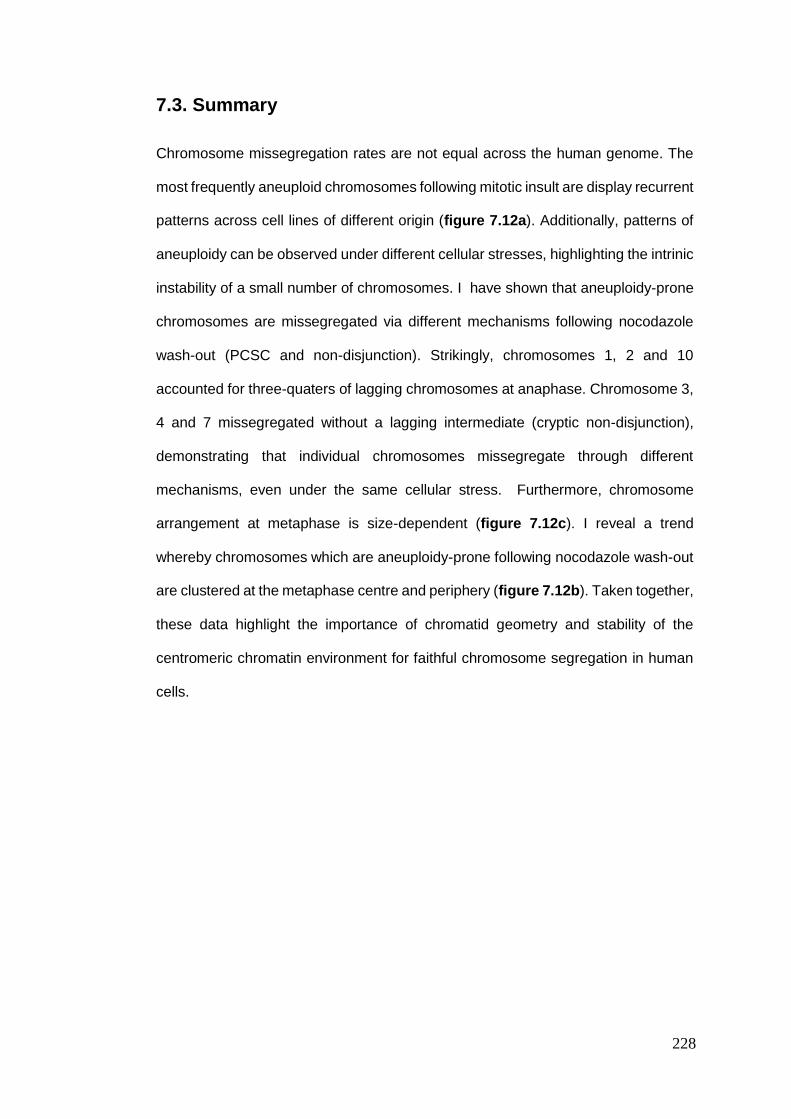
228
7.3. Summary
Chromosome missegregation rates are not equal across the human genome. The
most frequently aneuploid chromosomes following mitotic insult are display recurrent
patterns across cell lines of different origin (figure 7.12a). Additionally, patterns of
aneuploidy can be observed under different cellular stresses, highlighting the intrinic
instability of a small number of chromosomes. I have shown that aneuploidy-prone
chromosomes are missegregated via different mechanisms following nocodazole
wash-out (PCSC and non-disjunction). Strikingly, chromosomes 1, 2 and 10
accounted for three-quaters of lagging chromosomes at anaphase. Chromosome 3,
4 and 7 missegregated without a lagging intermediate (cryptic non-disjunction),
demonstrating that individual chromosomes missegregate through different
mechanisms, even under the same cellular stress. Furthermore, chromosome
arrangement at metaphase is size-dependent (figure 7.12c). I reveal a trend
whereby chromosomes which are aneuploidy-prone following nocodazole wash-out
are clustered at the metaphase centre and periphery (figure 7.12b). Taken together,
these data highlight the importance of chromatid geometry and stability of the
centromeric chromatin environment for faithful chromosome segregation in human
cells.
229
Figure 7.12. Chromosome missegregation and positioning summary. (a) There
are recurrent patterns of aneuploidy across cell lines and cellular stresses. (b)
Anupoidy-prone chromosomes are frequently found in discreet metaphase
territories. (c) Overview of size-dependent metaphase chromosome positioning
across cell lines and stresses.

230
8. Discussion
231
8.1. Overview
The early responses to aneuploidy in human cells, and the missegregation rates of
individual human chromosomes, are poorly characterised. In part, these important
questions have remained unanswered due to technical limitations obscuring the
resolution of early aneuploidy responses, and the lack of appropriate technologies
to accurately assess de novo aneuploidy rates for single chromosomes.
In this thesis, I have demonstrated it is possible to isolate aneuploid cells as early
as 12 hours following the missegregation of a single chromosome using a novel
strategy. Isolation of monosomic cells with this system has revealed some of the
transcriptional responses that occur immediately following chromosome
missegregation in human cells. Most notably, the expression of the pro-apoptotic
BCL2-family proteins and up-stream p53-interacting proteins, MDM2 and p300, are
significantly upregulated.
Additionally, I have implemented an image cytometry-based method for determining
the missegregation rates of individual human chromosomes in a high-throughput
manner. Using this system I have shown that certain chromosomes are more prone
to missegregation, across multiple cell lines and stresses. Furthermore, I have
started to elucidate the important contribution of centromere integrity to chromosome
missegregation rates.
Finally I have, for the first time, shown that chromosome arrangement in the
unperturbed metaphase plate is non-random, with certain chromosomes having a
preference for alignment in average territories at the spindle equator. This has
revealed the existence of aneuploidy-prone regions which are subject to high rates
of chromosome missegregation. Taken together, these data have important
implications for understanding the recurrent patterns of aneuploidy observed in
human disease.
232
Following the development of a drug-inducible chromosome missegregation
strategy and aneuploidy reporter cell line I was able to isolate a population of cells
enriched for monosomic cells. However, there are some important issues which are
likely obscuring the aneuploidy responses. Firstly, the monosomy 6 rate in the
EGFP-negative population after FACS was only 74.9 %, implying that I have a ~ 25
% contamination of non-monosomic cells which may be cloaking some of the earliest
responses. Moreover, the preparation of samples by FISH following FACS is a harsh
procedure which may be introducing artefacts, as a 75 % monosomy should be have
detectable by SNP array.
Furthermore, it is a possibility that some cells transiently dysregulate the dsEGFP
gene following mitotic arrest, thus appearing EGFP-negative, despite remaining
diploid. This is supported by the observation in the literature that gene transcription
is down-regulated globally as cells enter mitosis427–429. Therefore, a fraction of the
EGFP-negative population, which are in-fact diploid, may simply not have started to
express dsEGFP in the subsequent G1.
Additionally, the presence of EGFP-negative cells arrested in G1, but still alive (and
not in apoptosis) at 24 hours post-nocodazole, suggests that some cells in this
population may have arrested for aneuploidy-independent reasons. One such
possibility may be as a result of unavoidable FACS-induced cellular stress. This is
supported by the observation that the percentage of EGFP-negative diploid cells is
similar to that percentage of cells not in apoptosis at the 24 hour time-point (~ 32 %
alive vs. ~ 20 % diploid).
An alternative strategy to elevate chromosome missegregation, which is currently
under development in the McClelland laboratory, is to induce the specific
missegregation of single chromosomes without the need for a mitotic arrest. One
advantage of such system would abrogate any effects of nocodazole wash-out
which are not manifesting solely as DNA damage. This would more faithfully
233
recapitulate the missegregation of chromosomes following merotely and therefore a
fairer comparison of the early transcriptional responses to aneuploidy.
Interestingly, at 12 hours following EGFP loss, I did not detect a change in the
expression of p53. This suggests that p53-mediated cell cycle arrest in the earliest
stages of the aneuploidy response is entirely due to translocation of p53 into the
nucleus rather than an increase in p53 transcription, resembling a global DNA
damage response phenotype430–432. In support of this, I observed the transcriptional
upregulation of MDM2, a known repressor of p53 activity. This is important as it is
known that stabilisation of p53 in the nucleus activates transcription of MDM2,
thereby providing a regulatory negative-feedback loop on p53 activity; the greater
the p53 stabilisation in the nucleus, the higher MDM2 transcription and, in-turn, p53
inhibition433,434.
There was also significant upregulation of the DNA-damage response protein ATM.
This is important as it is known that ATM activates p53 by phosphorylation on serine
15, causing translocation to the nucleus435,436. ATM also phosphorylates Chk2,
which together form the ATM-Chk2 DNA damage response pathway172,197.
Interestingly, I did not observe an increase in transcription of CHK2, suggesting that
ATM acts independently of the ATM/ATR DNA damage response pathway in
response to aneuploidy. These data demonstrate that nascent aneuploid cells
stabilise p53 in the nucleus through ATM-dependent phosphorylation; in agreement
the p53-mediated cell cycle arrest observed in the literature176,177,431.
It has already been shown that apoptosis induction is increased when the expression
of two regulators of apoptosis are perturbed, namely BCL6 and BCL2437. Confirming
the literature, I also observed a significant increase in expression of the pro-
apoptotic protein Bcl6 and downregulation of Bcl2. Additionally, Bcl2 has been
shown to inhibit the pro-apoptotic Bax/Bak1 complex, and therefore downregulation
of Bcl2 would expect to increase the fidelity of Bax/Bak1-mediated apoptosis438.
234
Finally, I observed an upregulation of BCL2L11, encoding the protein BIM, which
diminishes the activity of Bcl-xL, an anti-apoptotic protein which inhibits p53438,439.
These data suggest that chromosome missegregation leads to apoptosis through
transcriptional upregulation of pro-apoptotic proteins, and simultaneously
upregulating proteins that inhibit pro-survival Bcl2-family members (fig. 8.1c).
Following nocodazole wash-out, I observed unequal rates of individual
chromosome missegregation between transformed and untransformed cell lines
(Table 8.1). It is already known that chromosome 1 has a large region of
pericentromeric heterochromatin and is frequently missegregated following
hypomethylating treatments440,441. This suggests that changes in centromeric and/or
pericentromeric integrity may influence chromosome missegregation rates. This is
supported by my observation that chromosome 1 was frequently observed with
premature sister chromatid separation (PSCS) at metaphase which suggests that
chromosome 1 is vulnerable to the disruption of centromeric cohesin following a
prolonged mitotic arrest. This phenomenon has been previously reported in the
literature, however it has not been associated with specific chromosomes442.
This raises an important question: do individual chromosomes displaying PSCS
evade the spindle assembly checkpoint (SAC)? If so, they may be frequently
missegregated and contribute to the high aneuploidy rate observed for particular
chromosomes. In support of this hypothesis, it has recently been shown that
premature sister chromatid separation does not elicit a robust SAC response,
followed by abnormal mitotic exit after a short delay443. Moreover, there is mounting
evidence that aneuploidy in human disease is linked to cohesin complex
malfunction, in some instances443,444. The mechanistic basis for chromosome-
specific cohesion loss is still unclear, given that there is little evidence of a correlation
235
between chromosome length and centromere size, which would dictate levels of
centromeric cohesin.
The idea that cohesion defects may predispose to aneuploidy of individual
chromosomes is supported by the observation that weakened sister chromatid
cohesion is prevalent in ageing oocytes, indicating that age-related pathological
aneuploidies may be caused by intrinsic properties of individual chromosomes445.
Further supporting this hypothesis, it has been observed that nearly two-thirds of
failed-fertilised oocytes display chromatid abnormalities, with the most frequent
aneuploidies involving chromosome 1, 4, 16 and 22446,447. Strikingly, chromosome 1
aneuploidy in oocytes is common (15.8 %) but not related to maternal age, indicating
that chromosome 1 is particularly vulnerable to missegregation in meiosis I,
independent of age-related replication stress448.
A further explanation for the non-random lagging chromosome and PSCS rates is
related to centromeric Aurora B levels. It is known that Aurora B is recruited to
centromeres where it participates in the removal of the cohesin complex and
destabilises merotelic kinetochore-microtubule attachments449–454. Therefore,
reduced centromeric cohesin on vulnerable chromosomes would reduce the
capacity for Aurora B-dependent erroneous attachment correction. This may
promote elevated rates of merotely for subsets of chromosomes with weakened
cohesion, thereby generating high rates of lagging chromosomes at anaphase. In
some cases, where biorientation is achieved, microtubule tension in the absence of
merotely may overwhelm centromeric cohesin forces for particular chromosomes,
especially chromosomes 1 and 2, promoting the PSCS phenotype (fig. 8.1a). This
is important because it highlights how chromosome-level differences in intrinsic
routes to aneuploidy may obscure the conventional assessment of segregation error
rates, depending upon whether the observer is scoring lagging, bridges or non-
disjunction rates, and for which chromosome(s).
236
Remarkably, when RPE-1 cells are released from nocodazole following p53
knockdown, there is significant chromothripsis for chromosomes 1, 2, 3, 4, 9, 16, 18
and 20 which are trapped in micronuclei455. The only chromosome subject to loss in
micronuclei following p53 knock-down alone was chromosome 1. These data are in
striking agreement with the unequal missegregation, and segregation error, rates
observed in both RPE-1 and BJ cells in my hands. Taken together, this implies that
the increased merotely present in cancer cells may perpetuate the instability of a
select few chromosomes through illicit chromothripsis in micronuclei.
Additionally, I observed chromosome-level differences between merotely and
replication stress. For example, chromosome 16 was missegregated at high rates
following replication stress, but not in nocodazole wash-out. This is in support of the
literature in which the replication stress fragile sites, FRA3B and FRA16D have been
shown to predispose chromosomes 3 and 16 to high rates of non-disjunction
following replication stress456,457. Furthermore, previous data have described age-
related chromosome-specific aneuploidies arising in the ageing mouse brain457. Of
particular interest, chromosome 18 was missegregated at high frequency,
suggesting that chromosome 18 may be particularly vulnerable to age-related
replication stress and contributes to CIN in ageing cells.
One possibility linking the similar patterns between stresses is that structural
rearrangements which perturb faithful attachment to the mitotic spindle, such as
those which disrupt centromeric integrity, may account for some of the observed
aneuploidy rates. Moreover, it has been shown that replication stress-induced DNA
bridges are subject to down-stream DNA damage through breakage-fusion-bridge
(BFB) cycles410,458,459. Patterns of aneuploidy following replication stress may
therefore represent a subset of chromosomes which are most vulnerable to
illegitimate centromere rearrangements caused by BFB cycles in the preceding cell
cycle.
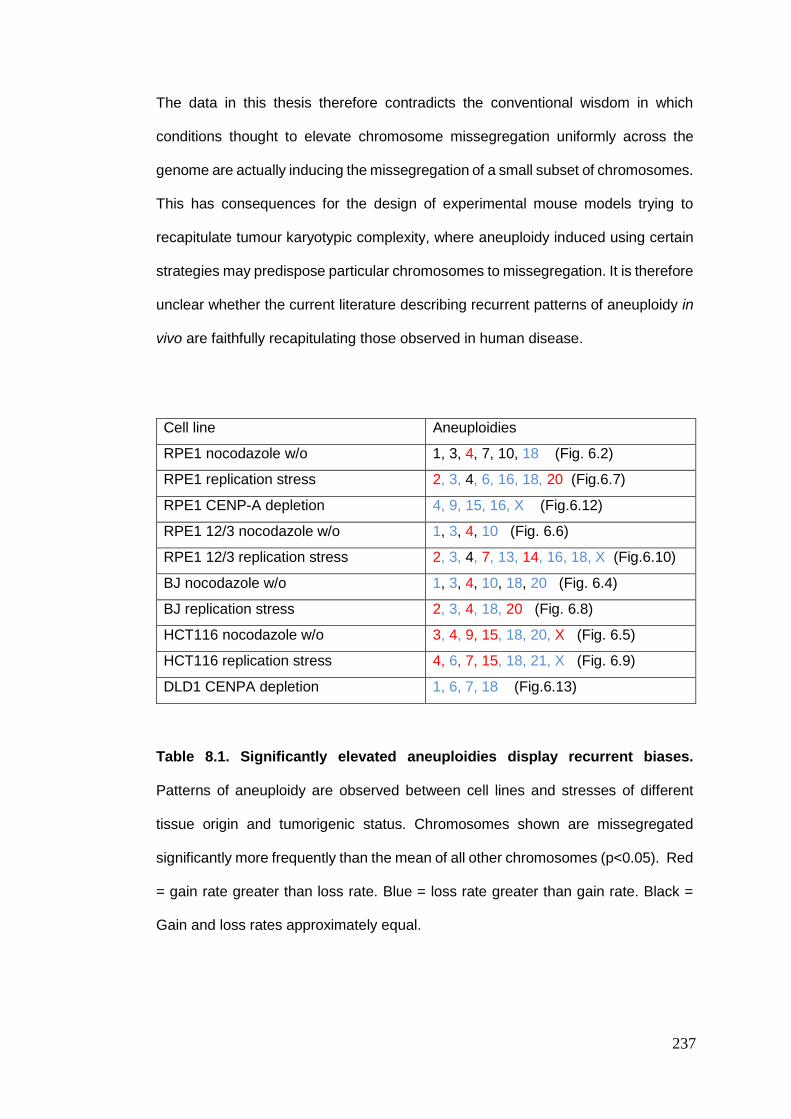
237
The data in this thesis therefore contradicts the conventional wisdom in which
conditions thought to elevate chromosome missegregation uniformly across the
genome are actually inducing the missegregation of a small subset of chromosomes.
This has consequences for the design of experimental mouse models trying to
recapitulate tumour karyotypic complexity, where aneuploidy induced using certain
strategies may predispose particular chromosomes to missegregation. It is therefore
unclear whether the current literature describing recurrent patterns of aneuploidy in
vivo are faithfully recapitulating those observed in human disease.
Cell line Aneuploidies
RPE1 nocodazole w/o 1, 3, 4, 7, 10, 18 (Fig. 6.2)
RPE1 replication stress 2, 3, 4, 6, 16, 18, 20 (Fig.6.7)
RPE1 CENP-A depletion 4, 9, 15, 16, X (Fig.6.12)
RPE1 12/3 nocodazole w/o 1, 3, 4, 10 (Fig. 6.6)
RPE1 12/3 replication stress 2, 3, 4, 7, 13, 14, 16, 18, X (Fig.6.10)
BJ nocodazole w/o 1, 3, 4, 10, 18, 20 (Fig. 6.4)
BJ replication stress 2, 3, 4, 18, 20 (Fig. 6.8)
HCT116 nocodazole w/o 3, 4, 9, 15, 18, 20, X (Fig. 6.5)
HCT116 replication stress 4, 6, 7, 15, 18, 21, X (Fig. 6.9)
DLD1 CENPA depletion 1, 6, 7, 18 (Fig.6.13)
Table 8.1. Significantly elevated aneuploidies display recurrent biases.
Patterns of aneuploidy are observed between cell lines and stresses of different
tissue origin and tumorigenic status. Chromosomes shown are missegregated
significantly more frequently than the mean of all other chromosomes (p<0.05). Red
= gain rate greater than loss rate. Blue = loss rate greater than gain rate. Black =
Gain and loss rates approximately equal.
238
The highly-repetitive α-satellite DNA of human centromeres contains an
element which is important for centromere integrity, the CENP-B box. CENP-B
boxes, together with the N-terminal domains of CENP-A, recruit CENP-B to
centromeres. In humans, it has already been shown that CENP-B fulfils at least two
roles at the centromere including establishing neocentromeres and inhibiting
multiple centromere formation460. In agreement with these data, abolition of CENP-
A reduces centromeric CENP-B levels by >50 %461. CENP-A is also known to be
important for the stability of the centromere and faithful segregation of
chromosomes. In this way, CENP-A can be used as a surrogate measure of
centromere strength.
Following CENP-A depletion I revealed distinct patterns of aneuploidy in RPE-1 and
DLD1 cells, suggesting that certain chromosomes are more contingent on
centromere viability for faithful segregation behaviour. In support of this hypothesis,
recent data have described the role of CENP-A in protecting against illegitimate
centromere rearrangements462. This suggests that patterns of chromosome
missegregation in the absence of CENP-A are, in-part, reflected by the intrinsic
susceptibility of individual centromeres to structural aberrations. Furthermore,
super-resolution microscopy of α-satellite DNA has revealed the existence of a
CENP-A-dependent mechanism for preventing promiscuous α-satellite
rearrangements34,462. It is therefore likely that patterns of aneuploidy in CENP-A
depleted cells are also defined by the integrity of the base pair sequence in addition
to down-stream assembly of kinetochore components. One important consideration
is that CENP-A might not be totally depleted, leaving just enough to assemble a
functional kinetochore. This would explain why global aneuploidy is not as high as
would be expected following complete CENP-A removal.
Chromosome missegregation in the absence of CENP-A was variable between
RPE-1 and DLD1 cells, which is surprising as α-satellite array length polymorphisms
239
have not been shown to be significantly different between cell types. It is known,
however, that CENP-A levels are proportional to chromosome size408.
Surprisingly, I did not observe size-dependent patterns of chromosome loss
following CENP-A depletion in either cell line, suggesting that the maintenance of
chromatin architecture, described above, are likely the primary driver of
chromosome missegregation in the absence of CENP-A. In agreement with this
hypothesis, under-condensation of centromeric chromatin and high rates of
aneuploidy have been observed following hypomethylation treatment with 5-
azacytidine, specifically for chromosomes 1, 9, 15 and 16463,464. Importantly, I also
observed elevated rates of missegregation for chromosomes 9, 15 and 16 when
CENP-A is depleted in RPE-1 cells, suggesting that CENP-A may dictate
centromeric chromatin environments which are required for faithful segregation of a
subset of chromosomes. I had already observed high rates of chromosome 1
missegregation under other cellular stresses (nocodazole and replication stress) but
did not report a similar phenotype in the absence of CENP-A. Therefore,
chromosome 1 may be less susceptible to centromere integrity defects than aberrant
kinetochore-microtubule attachments and structural rearrangements.
Given that centromeric α-satellite sequence length is likely to vary at each
centromere, it is plausible that less aneuploidy-prone chromosomes have reduced
dependence on CENP-A-mediated centromere specification. The pattern of
chromosome missegregation in DLD1 cells depleted of CENP-A is surprising, given
the absence of shared aneuploidy-prone chromosomes compared to RPE-1 cells.
To understand these data more fully would require further karyotype analysis and
characterisation of CENP-A levels in DLD1 cells to ask if there are differences in
centromeric CENP-A establishment, maintenance or function between RPE-1 and
DLD1 cells, specifically.
240
It is pertinent that I observed a size-dependent chromosome positioning
phenomenon at metaphase. Strikingly, large chromosomes congressed to the
periphery of the spindle equator whereas smaller chromosome were generally
located towards to centre of the spindle equator. This phenotype had already been
reported in human interphase and prophase cells and therefore highlights the
maintenance of chromosome arrangement during congression to the spindle
equator465,466.
Importantly, I observed similar positioning patterns for both RPE-1 and BJ cells,
indicating that metaphase chromosome positioning is conserved and may influence
pathological aneuploidy patterns observed in human disease. Indeed, the average
position of chromosomes at metaphase correlated with their likelihood to
missegregate under cellular stress.
This suggests that chromosomes may missegregate depending on where they are
located in the metaphase plate, possibly due to a transient deviation from bipolar
spindle geometry, and complexity of kinetochore-microtubule dynamics, which has
been observed to generate CIN in cancer cells242,467. This is supported by the recent
discovery that peripherally-located sister kinetochores are rotationally flexible420.
Although kinetochore flexibility was shown to broadly aid attachment to microtubule
K-fibres, it is plausible the metaphase periphery represents a region of elevated
instability following microtubule disruption with nocodazole. These data are further
supported by the notion that centrally-located chromosomes are captured by
microtubules in early prophase, therefore achieving rapid biorientation in most
cases, while chromosomes at either pole display increased propensity to become
mono-oriented and merotelically attached to microtubules468–470. My data are in
agreement with this observation given that size-dependent chromosome positioning
at metaphase increases the mass of DNA at the spindle equator poles, therefore
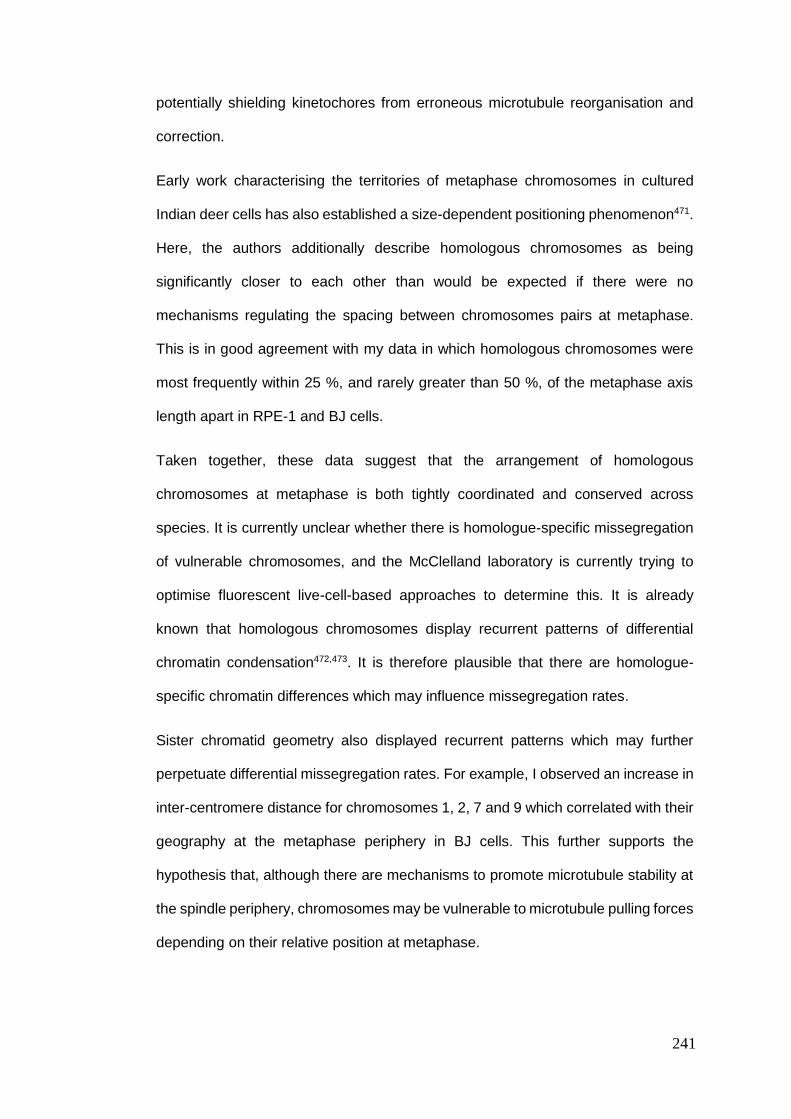
241
potentially shielding kinetochores from erroneous microtubule reorganisation and
correction.
Early work characterising the territories of metaphase chromosomes in cultured
Indian deer cells has also established a size-dependent positioning phenomenon471.
Here, the authors additionally describe homologous chromosomes as being
significantly closer to each other than would be expected if there were no
mechanisms regulating the spacing between chromosomes pairs at metaphase.
This is in good agreement with my data in which homologous chromosomes were
most frequently within 25 %, and rarely greater than 50 %, of the metaphase axis
length apart in RPE-1 and BJ cells.
Taken together, these data suggest that the arrangement of homologous
chromosomes at metaphase is both tightly coordinated and conserved across
species. It is currently unclear whether there is homologue-specific missegregation
of vulnerable chromosomes, and the McClelland laboratory is currently trying to
optimise fluorescent live-cell-based approaches to determine this. It is already
known that homologous chromosomes display recurrent patterns of differential
chromatin condensation472,473. It is therefore plausible that there are homologue-
specific chromatin differences which may influence missegregation rates.
Sister chromatid geometry also displayed recurrent patterns which may further
perpetuate differential missegregation rates. For example, I observed an increase in
inter-centromere distance for chromosomes 1, 2, 7 and 9 which correlated with their
geography at the metaphase periphery in BJ cells. This further supports the
hypothesis that, although there are mechanisms to promote microtubule stability at
the spindle periphery, chromosomes may be vulnerable to microtubule pulling forces
depending on their relative position at metaphase.
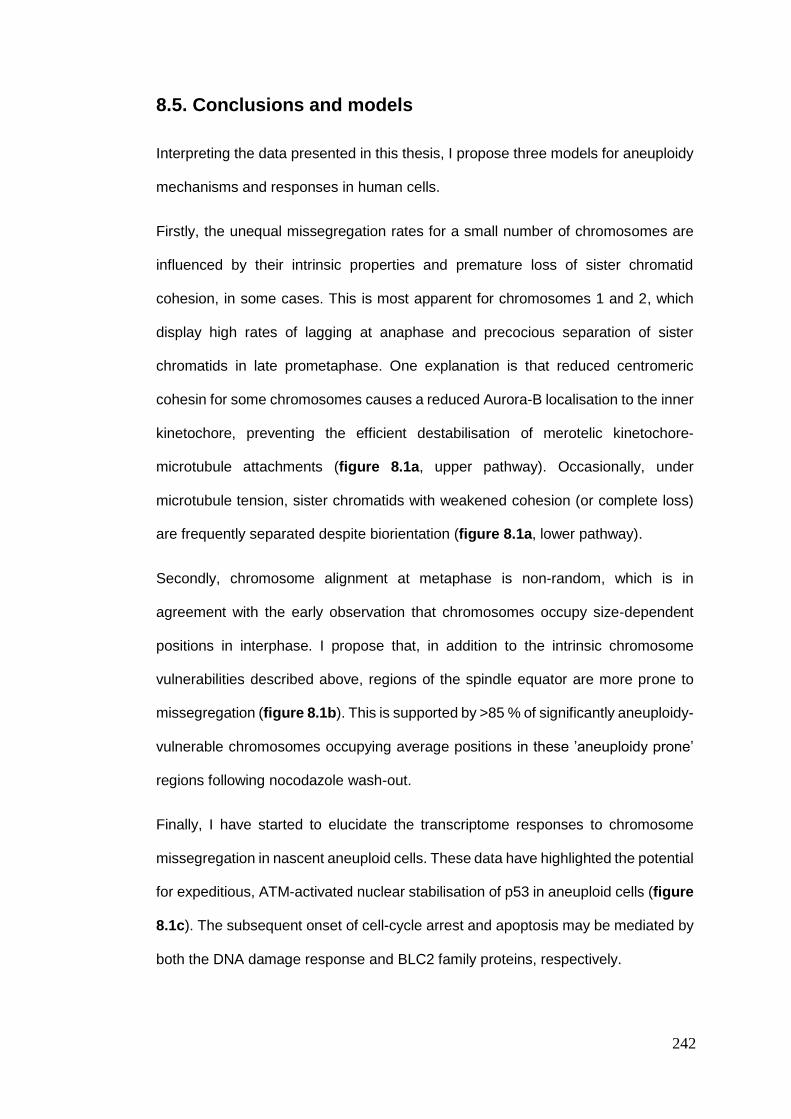
242
8.5. Conclusions and models
Interpreting the data presented in this thesis, I propose three models for aneuploidy
mechanisms and responses in human cells.
Firstly, the unequal missegregation rates for a small number of chromosomes are
influenced by their intrinsic properties and premature loss of sister chromatid
cohesion, in some cases. This is most apparent for chromosomes 1 and 2, which
display high rates of lagging at anaphase and precocious separation of sister
chromatids in late prometaphase. One explanation is that reduced centromeric
cohesin for some chromosomes causes a reduced Aurora-B localisation to the inner
kinetochore, preventing the efficient destabilisation of merotelic kinetochore-
microtubule attachments (figure 8.1a, upper pathway). Occasionally, under
microtubule tension, sister chromatids with weakened cohesion (or complete loss)
are frequently separated despite biorientation (figure 8.1a, lower pathway).
Secondly, chromosome alignment at metaphase is non-random, which is in
agreement with the early observation that chromosomes occupy size-dependent
positions in interphase. I propose that, in addition to the intrinsic chromosome
vulnerabilities described above, regions of the spindle equator are more prone to
missegregation (figure 8.1b). This is supported by >85 % of significantly aneuploidy-
vulnerable chromosomes occupying average positions in these ’aneuploidy prone’
regions following nocodazole wash-out.
Finally, I have started to elucidate the transcriptome responses to chromosome
missegregation in nascent aneuploid cells. These data have highlighted the potential
for expeditious, ATM-activated nuclear stabilisation of p53 in aneuploid cells (figure
8.1c). The subsequent onset of cell-cycle arrest and apoptosis may be mediated by
both the DNA damage response and BLC2 family proteins, respectively.
243
Figure 8.1. Models for aneuploidy mechanisms and responses in human cells.
(a) Model for how lower cohesin levels at centromeres of chromosomes 1 and 2 may
promote both the failure to destabliise merotelic attachments by deregulation of the
ICS (upper pathway) and complete separation of sisters during artificially extended
metaphase (lower pathway). (b) Model for how chromosome position at metaphase
elevates missegregation of aneuploidy-prone chromosomes in particular regions of
the spindle equator. (c) Cell cycle arrest and apoptosis in nascent aneuploid cells
are likely induced by ATM and p53-dependent mechanisms.
244
9. References
1. Bayani JM, Squire JA. Applications of SKY in cancer cytogenetics. Cancer
Invest. 2002;20(3):373-386. doi:10.1081/CNV-120001183.
2. Rensen FB, Kristensen IB, Grymer F, Jakobsen A. DNA-index and
stereological estimation of nuclear volume in primary and metastatic
malignant melanomas: A comparative study with analysis of heterogeneity.
APMIS. 1990;98(1-6):61-70. doi:10.1111/j.1699-0463.1990.tb01003.x.
3. Vogelmann J, Valeri A, Guillou E, Cuvier O, Nollmann M. Roles of chromatin
insulator proteins in higher-order chromatin organization and transcription
regulation. Nucleus. 2011;2(5):358-369. doi:10.4161/nucl.2.5.17860.
4. Wu C. Chromatin Remodeling and the Control of Gene Expression. J Biol
Chem. 1997;272(45):28171-28174. doi:10.1074/jbc.272.45.28171.
5. Richmond TJ, Finch JT, Rushton B, Rhodes D, Klug A. Structure of the
nucleosome core particle at 7 a resolution. Nature. 1984;311(5986):532-537.
doi:10.1038/311532a0.
6. Xiao B, Freedman BS, Miller KE, Heald R, Marko JF. Histone H1 compacts
DNA under force and during chromatin assembly. Mol Biol Cell.
2012;23(24):4864-4871. doi:10.1091/mbc.e12-07-0518.
7. Mario-Ramirez L, Kann MG, Shoemaker BA, Landsman D. Histone structure
and nucleosome stability. Expert Rev Proteomics. 2005;2(5):719-729.
doi:10.1586/14789450.2.5.719.
8. Li B, Carey M, Workman JL. The Role of Chromatin during Transcription.
Cell. 2007;128(4):707-719. doi:10.1016/j.cell.2007.01.015.
9. Yu X, Lin J, Zack DJ, Qian J. Identification of tissue-specific cis-regulatory
modules based on interactions between transcription factors. BMC
Bioinformatics. 2007;8(1):437. doi:10.1186/1471-2105-8-437.
10. Tirosh I, Barkai N. Two strategies for gene regulation by promoter
nucleosomes. Genome Res. 2008;18(7):1084-1091.
doi:10.1101/gr.076059.108.
245
11. Field Y, Kaplan N, Fondufe-Mittendorf Y, et al. Distinct Modes of Regulation
by Chromatin Encoded through Nucleosome Positioning Signals. PLoS
Comput Biol. 2008;4(11):e1000216. doi:10.1371/journal.pcbi.1000216.
12. Radman-Livaja M, Rando OJ. Nucleosome positioning: How is it
established, and why does it matter? Dev Biol. 2010;339(2):258-266.
doi:10.1016/j.ydbio.2009.06.012.
13. Struhl K, Segal E. Determinants of nucleosome positioning. Nat Struct Mol
Biol. 2013;20(3):267-273. doi:10.1038/nsmb.2506.
14. Bai L, Ondracka A, Cross F. Multiple Sequence-Specific Factors Generate
the Nucleosome-Depleted Region on CLN2 Promoter. Mol Cell.
2011;42(4):465-476. doi:10.1016/j.molcel.2011.03.028.
15. Segal E, Widom J. Poly(dA:dT) tracts: major determinants of nucleosome
organization. Curr Opin Struct Biol. 2009;19(1):65-71.
doi:10.1016/j.sbi.2009.01.004.
16. Segal E, Fondufe-Mittendorf Y, Chen L, et al. A genomic code for
nucleosome positioning. Nature. 2006;442(7104):772-778.
doi:10.1038/nature04979.
17. Lowary PT, Widom J. New DNA sequence rules for high affinity binding to
histone octamer and sequence-directed nucleosome positioning. J Mol Biol.
1998;276(1):19-42. doi:10.1006/jmbi.1997.1494.
18. Cao X-Q, Zeng J, Yan H. Structural property of regulatory elements in
human promoters. Phys Rev E. 2008;77(4).
doi:10.1103/physreve.77.041908.
19. Becker PB, Herz W. ATP-Dependent Nucleosome Remodeling. Annu Rev
Biochem. 2002;71(1):247-273.
doi:10.1146/annurev.biochem.71.110601.135400.
20. Struhl K. Naturally occurring poly(dA-dT) sequences are upstream promoter
elements for constitutive transcription in yeast. Proc Natl Acad Sci.
1985;82(24):8419-8423. doi:10.1073/pnas.82.24.8419.
21. Yella VR, Bansal M. DNA structural features of eukaryotic TATA-containing
and TATA-less promoters. FEBS Open Bio. 2017;7(3):324-334.
doi:10.1002/2211-5463.12166.
246
22. Martinez-Campa C, Politis P, Moreau J-L, et al. Precise Nucleosome
Positioning and the TATA Box Dictate Requirements for the Histone H4 Tail
and the Bromodomain Factor Bdf1. Mol Cell. 2004;15(1):69-81.
doi:10.1016/j.molcel.2004.05.022.
23. Longst G, Bonte EJ, Corona DF V, Becker PB. Nucleosome Movement by
CHRAC and ISWI without Disruption or trans-Displacement of the Histone
Octamer. Cell. 1999;97(7):843-852. doi:10.1016/s0092-8674(00)80797-7.
24. Whitehouse I, Flaus A, Owen-Hughes T. Catalytic nucleosome mobilisation
mediated by the SWI/SNF complex. Biochem Soc Trans. 1999;27(3):A96.1-
A96. doi:10.1042/bst027a096.
25. Mizuguchi G. ATP-Driven Exchange of Histone H2AZ Variant Catalyzed by
SWR1 Chromatin Remodeling Complex. Science (80- ).
2004;303(5656):343-348. doi:10.1126/science.1090701.
26. Westhorpe FG, Straight AF. Functions of the centromere and kinetochore in
chromosome segregation. Curr Opin Cell Biol. 2013;25(3):334-340.
doi:10.1016/j.ceb.2013.02.001.
27. Antonin W, Neumann H. Chromosome condensation and decondensation
during mitosis. Curr Opin Cell Biol. 2016;40:15-22.
doi:10.1016/j.ceb.2016.01.013.
28. Ris H, Witt PL. Structure of the mammalian kinetochore. Chromosoma.
1981;82(2):153-170. doi:10.1007/bf00286101.
29. Gascoigne KE, Takeuchi K, Suzuki A, Hori T, Fukagawa T, Cheeseman IM.
Induced ectopic kinetochore assembly bypasses the requirement for CENP-
A nucleosomes. Cell. 2011;145(3):410-422. doi:10.1016/j.cell.2011.03.031.
30. Shelby RD, Vafa O, Sullivan KF. Assembly of CENP-A into Centromeric
Chromatin Requires a Cooperative Array of Nucleosomal DNA Contact
Sites. J Cell Biol. 1997;136(3):501-513. doi:10.1083/jcb.136.3.501.
31. Nechemia-Arbely Y, Fachinetti D, Cleveland DW. Replicating centromeric
chromatin: Spatial and temporal control of CENP-A assembly. Exp Cell Res.
2012;318(12):1353-1360. doi:10.1016/j.yexcr.2012.04.007.
247
32. Sullivan KF. A solid foundation: functional specialization of centromeric
chromatin. Curr Opin Genet Dev. 2001;11(2):182-188. doi:10.1016/s0959-
437x(00)00177-5.
33. Shelby RD, Monier K, Sullivan KF. Chromatin Assembly at Kinetochores Is
Uncoupled from DNA Replication. J Cell Biol. 2000;151(5):1113-1118.
doi:10.1083/jcb.151.5.1113.
34. Black BE, Foltz DR, Chakravarthy S, Luger K, Woods VL, Cleveland DW.
Structural determinants for generating centromeric chromatin. Nature.
2004;430(6999):578-582. doi:10.1038/nature02766.
35. Ikeno M, Masumoto H, Okazaki T. Distribution of CENP-B boxes reflected in
CREST centromere antigenic sites on long-range a-satellite DNA arrays of
human chromosome 21. Hum Mol Genet. 1994;3(8):1245-1257.
doi:10.1093/hmg/3.8.1245.
36. Kitagawa K, Masumoto H, Ikeda M, Okazaki T. Analysis of protein-DNA and
protein-protein interactions of centromere protein B (CENP-B) and properties
of the DNA-CENP-B complex in the cell cycle. Mol Cell Biol.
1995;15(3):1602-1612. doi:10.1128/mcb.15.3.1602.
37. Tanaka Y, Tachiwana H, Yoda K, et al. Human Centromere Protein B
Induces Translational Positioning of Nucleosomes on a-Satellite Sequences.
J Biol Chem. 2005;280(50):41609-41618. doi:10.1074/jbc.m509666200.
38. Sugimoto K, Yata H, Muro Y, Himeno M. Human Centromere Protein C
(CENP-C) Is a DNA-Binding Protein Which Possesses a Novel DNA-Binding
Motif1. J Biochem. 1994;116(4):877-881.
doi:10.1093/oxfordjournals.jbchem.a124610.
39. Allshire RC, Karpen GH. Epigenetic regulation of centromeric chromatin: old
dogs, new tricks? Nat Rev Genet. 2008;9(12):923-937. doi:10.1038/nrg2466.
40. Brown WRA, Thomas G, Lee NCO, et al. Kinetochore assembly and
heterochromatin formation occur autonomously inSchizosaccharomyces
pombe. Proc Natl Acad Sci. 2014;111(5):1903-1908.
doi:10.1073/pnas.1216934111.
248
41. Boyarchuk E, Filipescu D, Vassias I, Cantaloube S, Almouzni G. The histone
variant composition of centromeres is controlled by the pericentric
heterochromatin state during the cell cycle. J Cell Sci. 2014;127(15):3347-
3359. doi:10.1242/jcs.148189.
42. Zhang W, Lee H-R, Koo D-H, Jiang J. Epigenetic Modification of
Centromeric Chromatin: Hypomethylation of DNA Sequences in the CENH3-
Associated Chromatin in Arabidopsis thaliana and Maize. PLANT CELL
ONLINE. 2008;20(1):25-34. doi:10.1105/tpc.107.057083.
43. Zheng Y-L, Hu N, Sun Q, Wang C, Taylor PR. Telomere Attrition in Cancer
Cells and Telomere Length in Tumor Stroma Cells Predict Chromosome
Instability in Esophageal Squamous Cell Carcinoma: A Genome-Wide
Analysis. Cancer Res. 2009;69(4):1604-1614. doi:10.1158/0008-5472.can-
08-3028.
44. Palm W, de Lange T. How Shelterin Protects Mammalian Telomeres. Annu
Rev Genet. 2008;42(1):301-334.
doi:10.1146/annurev.genet.41.110306.130350.
45. Diede SJ, Gottschling DE. Telomerase-Mediated Telomere Addition In Vivo
Requires DNA Primase and DNA Polymerases a and d. Cell.
1999;99(7):723-733. doi:10.1016/s0092-8674(00)81670-0.
46. Garvik B, Carson M, Hartwell L. Single-stranded DNA arising at telomeres in
cdc13 mutants may constitute a specific signal for the RAD9 checkpoint. Mol
Cell Biol. 1995;15(11):6128-6138. doi:10.1128/mcb.15.11.6128.
47. Lipps HJ, Rhodes D. G-quadruplex structures: in vivo evidence and function.
Trends Cell Biol. 2009;19(8):414-422. doi:10.1016/j.tcb.2009.05.002.
48. Zhao Y, Hoshiyama H, Shay JW, Wright WE. Quantitative telomeric
overhang determination using a double-strand specific nuclease. Nucleic
Acids Res. 2007;36(3):e14-e14. doi:10.1093/nar/gkm1063.
49. Bianchi A, Shore D. How Telomerase Reaches Its End: Mechanism of
Telomerase Regulation by the Telomeric Complex. Mol Cell.
2008;31(2):153-165. doi:10.1016/j.molcel.2008.06.013.
249
50. Zhao Y, Sfeir AJ, Zou Y, et al. Telomere Extension Occurs at Most
Chromosome Ends and Is Uncoupled from Fill-In in Human Cancer Cells. J
End-to-End-testing. 2009;138(3):463-475. doi:10.1016/s9999-
9994(09)20385-0.
51. Riethman H, Ambrosini A, Paul S. Human subtelomere structure and
variation. Chromosom Res. 2005;13(5):505-515. doi:10.1007/s10577-005-
0998-1.
52. Riethman H. Mapping and Initial Analysis of Human Subtelomeric Sequence
Assemblies. Genome Res. 2003;14(1):18-28. doi:10.1101/gr.1245004.
53. Luo K. Rap1-Sir4 binding independent of other Sir, yKu, or histone
interactions initiates the assembly of telomeric heterochromatin in yeast.
Genes Dev. 2002;16(12):1528-1539. doi:10.1101/gad.988802.
54. Tutton S, Azzam GA, Stong N, et al. Subtelomeric p53 binding prevents
accumulation of DNA damage at human telomeres. EMBO J.
2015;35(2):193-207. doi:10.15252/embj.201490880.
55. Marvin ME, Griffin CD, Eyre DE, Barton DBH, Louis EJ. In Saccharomyces
cerevisiae, yKu and Subtelomeric Core X Sequences Repress Homologous
Recombination Near Telomeres as Part of the Same Pathway. Genetics.
2009;183(2):441-451. doi:10.1534/genetics.109.106674.
56. Croft JA, Bridger JM, Boyle S, Perry P, Teague P, Bickmore WA.
Differences in the Localization and Morphology of Chromosomes in the
Human Nucleus. J Cell Biol. 1999;145(6):1119-1131.
doi:10.1083/jcb.145.6.1119.
57. Neusser M, Schubel V, Koch A, Cremer T, Muller S. Evolutionarily
conserved, cell type and species-specific higher order chromatin
arrangements in interphase nuclei of primates. Chromosoma.
2007;116(3):307-320. doi:10.1007/s00412-007-0099-3.
58. Ganai N, Sengupta S, Menon GI. Chromosome positioning from activity-
based segregation. Nucleic Acids Res. 2014;42(7):4145-4159.
doi:10.1093/nar/gkt1417.
59. Stanislav Kozubek. Spatial arrangement of the human genome, its possible
functional role. Atlas Genet Cytogenet Oncol Haematol. 2006;10(1):40-55.
http://atlasgeneticsoncology.org/Deep/SpatialArrangGenomID20051.html.
250
60. Cornforth MN, Greulich-Bode KM, Loucas BD, et al. Chromosomes are
predominantly located randomly with respect to each other in interphase
human cells. J Cell Biol. 2002;159(2):237-244. doi:10.1083/jcb.200206009.
61. Chuang C-H, Belmont AS. Moving chromatin within the interphase nucleus-
controlled transitions? Semin Cell Dev Biol. 2007;18(5):698-706.
doi:10.1016/j.semcdb.2007.08.012.
62. Abney JR, Cutler B, Fillbach ML, Axelrod D, Scalettar BA. Chromatin
dynamics in interphase nuclei and its implications for nuclear structure. J
Cell Biol. 1997;137(7):1459-1468. doi:10.1083/jcb.137.7.1459.
63. Levi V, Ruan Q, Plutz M, Belmont AS, Gratton E. Chromatin dynamics in
interphase cells revealed by tracking in a two-photon excitation microscope.
Biophys J. 2005;89(6):4275-4285. doi:10.1529/biophysj.105.066670.
64. Branco MR, Pombo A. Intermingling of Chromosome Territories in
Interphase Suggests Role in Translocations and Transcription-Dependent
Associations. PLoS Biol. 2006;4(5):e138. doi:10.1371/journal.pbio.0040138.
65. Zhang Y, McCord R, Ho Y-J, et al. Spatial Organization of the Mouse
Genome and Its Role in Recurrent Chromosomal Translocations. Cell.
2012;148(5):908-921. doi:10.1016/j.cell.2012.02.002.
66. Tanabe H, Muller S, Neusser M, et al. Evolutionary conservation of
chromosome territory arrangements in cell nuclei from higher primates. Proc
Natl Acad Sci. 2002;99(7):4424-4429. doi:10.1073/pnas.072618599.
67. Manvelyan M, Hunstig F, Mrasek K, et al. Position of chromosomes 18, 19,
21 and 22 in 3D-preserved interphase nuclei of human and gorilla and white
hand gibbon. Mol Cytogenet. 2008;1(1):9. doi:10.1186/1755-8166-1-9.
68. Kalhor R, Tjong H, Jayathilaka N, Alber F, Chen L. Genome architectures
revealed by tethered chromosome conformation capture and population-
based modeling. Nat Biotechnol. 2011;30(1):90-98. doi:10.1038/nbt.2057.
69. Tolhuis B, Blom M, Kerkhoven RM, et al. Interactions among polycomb
domains are guided by chromosome architecture. PLoS Genet. 2011;7(3).
doi:10.1371/journal.pgen.1001343.
251
70. Hakim O, Sung MH, Voss TC, et al. Diverse gene reprogramming events
occur in the same spatial clusters of distal regulatory elements. Genome
Res. 2011;21(5):697-706. doi:10.1101/gr.111153.110.
71. Morey C, Kress C, Bickmore WA. Lack of bystander activation shows that
localization exterior to chromosome territories is not sufficient to up-regulate
gene expression. Genome Res. 2009;19(7):1184-1194.
doi:10.1101/gr.089045.108.
72. Franke M, Ibrahim DM, Andrey G, et al. Formation of new chromatin
domains determines pathogenicity of genomic duplications. Nature.
2016;538(7624):265-269. doi:10.1038/nature19800.
73. Yaffe E, Tanay A. Probabilistic modeling of Hi-C contact maps eliminates
systematic biases to characterize global chromosomal architecture. Nat
Genet. 2011;43(11):1059-1065. doi:10.1038/ng.947.
74. Desprat R, Thierry-Mieg D, Lailler N, et al. Predictable dynamic program of
timing of DNA replication in human cells. Genome Res. 2009;19(12):2288-
2299. doi:10.1101/gr.094060.109.
75. O’Keefe RT, Henderson SC, Spector DL. Dynamic organization of DNA
replication in mammalian cell nuclei: Spatially and temporally defined
replication of chromosome-specific ??-satellite DNA sequences. J Cell Biol.
1992;116(5):1095-1110. doi:10.1083/jcb.116.5.1095.
76. Mekhail K, Moazed D. The nuclear envelope in genome organization,
expression and stability. Nat Rev Mol Cell Biol. 2010;11(5):317-328.
doi:10.1038/nrm2894.
77. Gonzalez-Suarez I, Gonzalo S. Nurturing the genome: A-type lamins
preserve genomic stability. Nucleus. 2010;1(2):129-135.
doi:10.4161/nucl.1.2.10797.
78. Steensel B van, Henikoff S. Identification of in vivo DNA targets of chromatin
proteins using tethered Dam methyltransferase. Nat Biotechnol.
2000;18(4):424-428. doi:10.1038/74487.
79. Pickersgill H, Kalverda B, de Wit E, Talhout W, Fornerod M, van Steensel B.
Characterization of the Drosophila melanogaster genome at the nuclear
lamina. Nat Genet. 2006;38(9):1005-1014. doi:10.1038/ng1852.
252
80. Csink AK, Henikoff S. Genetic modification of heterochromatic association
and nuclear organization in Drosophila. Nature. 1996;381(6582):529-531.
doi:10.1038/381529a0.
81. Casolari JM, Brown CR, Komili S, West J, Hieronymus H, Silver PA.
Genome-Wide Localization of the Nuclear Transport Machinery Couples
Transcriptional Status and Nuclear Organization. Cell. 2004;117(4):427-439.
doi:10.1016/s0092-8674(04)00448-9.
82. Brown CR, Kennedy CJ, Delmar VA, Forbes DJ, Silver PA. Global histone
acetylation induces functional genomic reorganization at mammalian nuclear
pore complexes. Genes Dev. 2008;22(5):627-639.
doi:10.1101/gad.1632708.
83. Sung P, Klein H. Mechanism of homologous recombination: mediators and
helicases take on regulatory functions. Nat Rev Mol Cell Biol.
2006;7(10):739-750. doi:10.1038/nrm2008.
84. Mekhail K, Seebacher J, Gygi SP, Moazed D. Role for perinuclear
chromosome tethering in maintenance of genome stability. Nature.
2008;456(7222):667-670. doi:10.1038/nature07460.
85. Torres-Rosell J, Sunjevaric I, De Piccoli G, et al. The Smc5-Smc6 complex
and SUMO modification of Rad52 regulates recombinational repair at the
ribosomal gene locus. Nat Cell Biol. 2007;9(8):923-931.
doi:10.1038/ncb1619.
86. Taddei A, Gasser SM. Repairing subtelomeric DSBs at the nuclear
periphery. Trends Cell Biol. 2006;16(5):225-228.
doi:10.1016/j.tcb.2006.03.005.
87. Bupp JM, Martin AE, Stensrud ES, Jaspersen SL. Telomere anchoring at the
nuclear periphery requires the budding yeast Sad1-UNC-84 domain protein
Mps3. J Cell Biol. 2007;179(5):845-854. doi:10.1083/jcb.200706040.
88. Taddei A, Van Houwe G, Nagai S, Erb L, Van Nimwegen E, Gasser SM. The
functional importance of telomere clustering: Global changes in gene
expression result from SIR factor dispersion. Genome Res. 2009;19(4):611-
625. doi:10.1101/gr.083881.108.
253
89. Nagai S, Dubrana K, Tsai-Pflugfelder M, et al. Functional Targeting of DNA
Damage to a Nuclear Pore-Associated SUMO-Dependent Ubiquitin Ligase.
Science (80- ). 2008;322(5901):597-602. doi:10.1126/science.1162790.
90. Capell BC, Collins FS. Human laminopathies: nuclei gone genetically awry.
Nat Rev Genet. 2006;7(12):940-952. doi:10.1038/nrg1906.
91. Andres V, Gonzalez JM. Role of A-type lamins in signaling, transcription,
and chromatin organization. J Cell Biol. 2009;187(7):945-957.
doi:10.1083/jcb.200904124.
92. Lamm N, Ben-David U, Golan-Lev T, Storchova Z, Benvenisty N, Kerem B.
Genomic Instability in Human Pluripotent Stem Cells Arises from Replicative
Stress and Chromosome Condensation Defects. Cell Stem Cell.
2016;18(2):253-261. doi:10.1016/j.stem.2015.11.003.
93. Coschi CH, Martens AL, Ritchie K, et al. Mitotic chromosome condensation
mediated by the retinoblastoma protein is tumor-suppressive. Genes Dev.
2010;24(13):1351-1363. doi:10.1101/gad.1917610.
94. Jeppsson K, Kanno T, Shirahige K, Sjogren C. The maintenance of
chromosome structure: positioning and functioning of SMC complexes. Nat
Rev Mol Cell Biol. 2014;15(9):601-614. doi:10.1038/nrm3857.
95. Gruber S, Haering CH, Nasmyth K. Chromosomal Cohesin Forms a Ring.
Cell. 2003;112(6):765-777. doi:10.1016/s0092-8674(03)00162-4.
96. Nasmyth K, Uhlmann F, Lottspeich F. Sister-chromatid separation at
anaphase onset is promoted by cleavage of the cohesin subunit Scc1.
Nature. 1999;400(6739):37-42. doi:10.1038/21831.
97. Cuylen S, Metz J, Haering CH. Condensin structures chromosomal DNA
through topological links. Nat Struct Mol Biol. 2011;18(8):894-901.
doi:10.1038/nsmb.2087.
98. Kimura K, Hirano T. ATP-Dependent Positive Supercoiling of DNA by 13S
Condensin: A Biochemical Implication for Chromosome Condensation. Cell.
1997;90(4):625-634. doi:10.1016/s0092-8674(00)80524-3.
99. Strick TR, Kawaguchi T, Hirano T. Real-Time Detection of Single-Molecule
DNA Compaction by Condensin I. Curr Biol. 2004;14(10):874-880.
doi:10.1016/j.cub.2004.04.038.
254
100. Maeshima K, Laemmli UK. A Two-Step Scaffolding Model for Mitotic
Chromosome Assembly. Dev Cell. 2003;4(4):467-480. doi:10.1016/s1534-
5807(03)00092-3.
101. Bembenek J, Verbrugghe KC, Khanikar J, Csankovszki G, Chan R.
Condensin and the Spindle Midzone Prevent Cytokinesis Failure Induced by
Chromatin Bridges in C. elegans Embryos. Curr Biol. 2013;23(11):937-946.
doi:10.1016/j.cub.2013.04.028.
102. Amaral N, Vendrell A, Funaya C, et al. The Aurora-B-dependent NoCut
checkpoint prevents damage of anaphase bridges after DNA replication
stress. Nat Cell Biol. 2016;18(5):516-526. doi:10.1038/ncb3343.
103. Martin CA, Murray JE, Carroll P, et al. Mutations in genes encoding
condensin complex proteins cause microcephaly through decatenation
failure at mitosis. Genes Dev. 2016;30(19):2158-2172.
doi:10.1101/gad.286351.116.
104. Wignall SM, Deehan R, Maresca TJ, Heald R. The condensin complex is
required for proper spindle assembly and chromosome segregation
inXenopusegg extracts. J Cell Biol. 2003;161(6):1041-1051.
doi:10.1083/jcb.200303185.
105. Stear JH. Characterization of HCP-6, a C. elegans protein required to
prevent chromosome twisting and merotelic attachment. Genes Dev.
2002;16(12):1498-1508. doi:10.1101/gad.989102.
106. Hagstrom KA. C. elegans condensin promotes mitotic chromosome
architecture, centromere organization, and sister chromatid segregation
during mitosis and meiosis. Genes Dev. 2002;16(6):729-742.
doi:10.1101/gad.968302.
107. Guacci V. Sister chromatid cohesion: the cohesin cleavage model does not
ring true. Genes to Cells. 2007;12(6):693-708. doi:10.1111/j.1365-
2443.2007.01093.x.
108. Zheng G, Yu H. Regulation of sister chromatid cohesion during the mitotic
cell cycle. Sci China Life Sci. 2015;58(11):1089-1098. doi:10.1007/s11427-
015-4956-7.
255
109. Sun Y, Kucej M, Fan H-Y, Yu H, Sun Q-Y, Zou H. Separase Is Recruited to
Mitotic Chromosomes to Dissolve Sister Chromatid Cohesion in a DNA-
Dependent Manner. Cell. 2009;137(1):123-132.
doi:10.1016/j.cell.2009.01.040.
110. Hauf S. Cohesin Cleavage by Separase Required for Anaphase and
Cytokinesis in Human Cells. Science (80- ). 2001;293(5533):1320-1323.
doi:10.1126/science.1061376.
111. Peters J-M, Tedeschi A, Schmitz J. The cohesin complex and its roles in
chromosome biology. Genes Dev. 2008;22(22):3089-3114.
doi:10.1101/gad.1724308.
112. Gerlich D, Koch B, Dupeux F, Peters J-M, Ellenberg J. Live-Cell Imaging
Reveals a Stable Cohesin-Chromatin Interaction after but Not before DNA
Replication. Curr Biol. 2006;16(15):1571-1578.
doi:10.1016/j.cub.2006.06.068.
113. Yeh E, Haase J, Paliulis L V, et al. Pericentric Chromatin Is Organized into
an Intramolecular Loop in Mitosis. Curr Biol. 2008;18(2):81-90.
doi:10.1016/j.cub.2007.12.019.
114. Arumugam P, Gruber S, Tanaka K, Haering CH, Mechtler K, Nasmyth K.
ATP Hydrolysis Is Required for Cohesin’s Association with Chromosomes.
Curr Biol. 2003;13(22):1941-1953. doi:10.1016/j.cub.2003.10.036.
115. Arumugam P, Nishino T, Haering CH, Gruber S, Nasmyth K. Cohesin’s
ATPase Activity Is Stimulated by the C-Terminal Winged-Helix Domain of Its
Kleisin Subunit. Curr Biol. 2006;16(20):1998-2008.
doi:10.1016/j.cub.2006.09.002.
116. Seitan VC, Banks P, Laval S, et al. Metazoan Scc4 homologs link sister
chromatid cohesion to cell and axon migration guidance. PLoS Biol.
2006;4(8):1411-1425. doi:10.1371/journal.pbio.0040242.
117. Watrin E, Schleiffer A, Tanaka K, Eisenhaber F, Nasmyth K, Peters JM.
Human Scc4 Is Required for Cohesin Binding to Chromatin, Sister-
Chromatid Cohesion, and Mitotic Progression. Curr Biol. 2006;16(9):863-
874. doi:10.1016/j.cub.2006.03.049.
256
118. Gillespie PJ, Hirano T. Scc2 Couples Replication Licensing to Sister
Chromatid Cohesion in Xenopus Egg Extracts. Curr Biol. 2004;14(17):1598-
1603. doi:10.1016/j.cub.2004.07.053.
119. Bernard P, Drogat J, Maure J-F, et al. A Screen for Cohesion Mutants
Uncovers Ssl3, the Fission Yeast Counterpart of the Cohesin Loading Factor
Scc4. Curr Biol. 2006;16(9):875-881. doi:10.1016/j.cub.2006.03.037.
120. Michaelis C, Ciosk R, Nasmyth K. Cohesins: Chromosomal Proteins that
Prevent Premature Separation of Sister Chromatids. Cell. 1997;91(1):35-45.
doi:10.1016/s0092-8674(01)80007-6.
121. Jeppsson K, Carlborg KK, Nakato R, et al. The Chromosomal Association of
the Smc5/6 Complex Depends on Cohesion and Predicts the Level of Sister
Chromatid Entanglement. PLoS Genet. 2014;10(10).
doi:10.1371/journal.pgen.1004680.
122. Cortes-Ledesma F, Aguilera A. Double-strand breaks arising by replication
through a nick are repaired by cohesin-dependent sister-chromatid
exchange. EMBO Rep. 2006;7(9):919-926. doi:10.1038/sj.embor.7400774.
123. Takahashi TS, Yiu P, Chou MF, Gygi S, Walter JC. Recruitment of Xenopus
Scc2 and cohesin to chromatin requires the pre-replication complex. Nat Cell
Biol. 2004;6(10):991-996. doi:10.1038/ncb1177.
124. Takahashi TS, Basu A, Bermudez V, Hurwitz J, Walter JC. Cdc7-Drf1 kinase
links chromosome cohesion to the initiation of DNA replication in Xenopus
egg extracts. Genes Dev. 2008;22(14):1894-1905.
doi:10.1101/gad.1683308.
125. Hauf S, Roitinger E, Koch B, Dittrich CM, Mechtler K, Peters J-M.
Dissociation of Cohesin from Chromosome Arms and Loss of Arm Cohesion
during Early Mitosis Depends on Phosphorylation of SA2. PLoS Biol.
2005;3(3):e69. doi:10.1371/journal.pbio.0030069.
126. Gandhi R, Gillespie PJ, Hirano T. Human Wapl Is a Cohesin-Binding Protein
that Promotes Sister-Chromatid Resolution in Mitotic Prophase. Curr Biol.
2006;16(24):2406-2417. doi:10.1016/j.cub.2006.10.061.
127. Kueng S, Hegemann B, Peters BH, et al. Wapl Controls the Dynamic
Association of Cohesin with Chromatin. Cell. 2006;127(5):955-967.
doi:10.1016/j.cell.2006.09.040.
257
128. Salic A, Waters JC, Mitchison TJ. Vertebrate Shugoshin Links Sister
Centromere Cohesion and Kinetochore Microtubule Stability in Mitosis. Cell.
2004;118(5):567-578. doi:10.1016/j.cell.2004.08.016.
129. McGuinness BE, Hirota T, Kudo NR, Peters J-M, Nasmyth K. Shugoshin
Prevents Dissociation of Cohesin from Centromeres During Mitosis in
Vertebrate Cells. PLoS Biol. 2005;3(3):e86.
doi:10.1371/journal.pbio.0030086.
130. Uhlmann F, Wernic D, Poupart M-A, Koonin E V, Nasmyth K. Cleavage of
Cohesin by the CD Clan Protease Separin Triggers Anaphase in Yeast. Cell.
2000;103(3):375-386. doi:10.1016/s0092-8674(00)00130-6.
131. Stemmann O, Zou H, Gerber SA, Gygi SP, Kirschner MW. Dual Inhibition of
Sister Chromatid Separation at Metaphase. Cell. 2001;107(6):715-726.
doi:10.1016/s0092-8674(01)00603-1.
132. Huang X, Andreu-Vieyra C V, York JP, et al. Inhibitory Phosphorylation of
Separase Is Essential for Genome Stability and Viability of Murine
Embryonic Germ Cells. PLoS Biol. 2008;6(1):e15.
doi:10.1371/journal.pbio.0060015.
133. Huang X, Andreu-Vieyra C V, Wang M, Cooney AJ, Matzuk MM, Zhang P.
Preimplantation Mouse Embryos Depend on Inhibitory Phosphorylation of
Separase To Prevent Chromosome Missegregation. Mol Cell Biol.
2009;29(6):1498-1505. doi:10.1128/mcb.01778-08.
134. Musacchio A, Salmon ED. The spindle-assembly checkpoint in space and
time. Nat Rev Mol Cell Biol. 2007;8(5):379-393. doi:10.1038/nrm2163.
135. Ellermeier C, Smith GR. Cohesins are required for meiotic DNA breakage
and recombination in Schizosaccharomyces pombe. Proc Natl Acad Sci U S
A. 2005;102(31):10952-10957. doi:10.1073/pnas.0504805102.
136. Strom L, Lindroos HB, Shirahige K, Sjogren C. Postreplicative Recruitment
of Cohesin to Double-Strand Breaks Is Required for DNA Repair. Mol Cell.
2004;16(6):1003-1015. doi:10.1016/j.molcel.2004.11.026.
137. Onal E, Arbel-Eden A, Sattler U, et al. DNA Damage Response Pathway
Uses Histone Modification to Assemble a Double-Strand Break-Specific
Cohesin Domain. Mol Cell. 2004;16(6):991-1002.
doi:10.1016/j.molcel.2004.11.027.
258
138. Petronczki M, Siomos MF, Nasmyth K. Un Menage et Quatre. Cell.
2003;112(4):423-440. doi:10.1016/s0092-8674(03)00083-7.
139. Bannister LA, Reinholdt LG, Munroe RJ, Schimenti JC. Positional cloning
and characterization of mousemei8, a disrupted allele of the meiotic
cohesinRec8. genesis. 2004;40(3):184-194. doi:10.1002/gene.20085.
140. Houtgraaf JH, Versmissen J, van der Giessen WJ. A concise review of DNA
damage checkpoints and repair in mammalian cells. Cardiovasc
Revascularization Med. 2006;7(3):165-172.
doi:10.1016/j.carrev.2006.02.002.
141. Ciccia A, Elledge SJ. The DNA Damage Response: Making It Safe to Play
with Knives. Mol Cell. 2010;40(2):179-204.
doi:10.1016/j.molcel.2010.09.019.
142. Jiang G, Sancar A. Recruitment of DNA Damage Checkpoint Proteins to
Damage in Transcribed and Nontranscribed Sequences. Mol Cell Biol.
2005;26(1):39-49. doi:10.1128/mcb.26.1.39-49.2006.
143. Zhou B-BS, Chaturvedi P, Spring K, et al. Caffeine Abolishes the
Mammalian G2/M DNA Damage Checkpoint by Inhibiting Ataxia-
Telangiectasia-mutated Kinase Activity. J Biol Chem. 2000;275(14):10342-
10348. doi:10.1074/jbc.275.14.10342.
144. Ganem NJ, Pellman D. Linking abnormal mitosis to the acquisition of DNA
damage. J Cell Biol. 2012;199(6):871-881. doi:10.1083/jcb.201210040.
145. Ohashi A, Ohori M, Iwai K, et al. Aneuploidy generates proteotoxic stress
and DNA damage concurrently with p53-mediated post-mitotic apoptosis in
SAC-impaired cells. Nat Commun. 2015;6:7668. doi:10.1038/ncomms8668.
146. Blank HM, Sheltzer JM, Meehl CM, Amon A. Mitotic entry in the presence of
DNA damage is a widespread property of aneuploidy in yeast. Mol Biol Cell.
2015;26(8):1440-1451. doi:10.1091/mbc.e14-10-1442.
147. McNamee LM, Brodsky MH. p53-Independent Apoptosis Limits DNA
Damage-Induced Aneuploidy. Genetics. 2009;182(2):423-435.
doi:10.1534/genetics.109.102327.
259
148. McCullough AK, Dodson ML, Lloyd RS. Initiation of Base Excision Repair:
Glycosylase Mechanisms and Structures. Annu Rev Biochem.
1999;68(1):255-285. doi:10.1146/annurev.biochem.68.1.255.
149. Matsumoto Y, Kim K. Excision of deoxyribose phosphate residues by DNA
polymerase beta during DNA repair. Science (80- ). 1995;269(5224):699-
702. doi:10.1126/science.7624801.
150. Roberts RJ, Cheng X. Base Flipping. Annu Rev Biochem. 1998;67(1):181-
198. doi:10.1146/annurev.biochem.67.1.181.
151. Mol CD, Parikh SS, Putnam CD, Lo TP, Tainer JA. DNA repair mechanisms
for the recognition and removal of damaged DNA bases. Annu Rev Biophys
Biomol Struct. 1999;28(1):101-128. doi:10.1146/annurev.biophys.28.1.101.
152. Canitrot Y, Cazaux C, Frechet M, et al. Overexpression of DNA polymerase
B in cell results in a mutator phenotype and a decreased sensitivity to
anticancer drugs. Proc Natl Acad Sci. 1998;95(21):12586-12590.
doi:10.1073/pnas.95.21.12586.
153. Sancar A. DNA Excision Repair. Annu Rev Biochem. 1996;65(1):43-81.
doi:10.1146/annurev.bi.65.070196.000355.
154. Mu D, Park C-H, Matsunaga T, Hsu DS, Reardon JT, Sancar A.
Reconstitution of Human DNA Repair Excision Nuclease in a Highly Defined
System. J Biol Chem. 1995;270(6):2415-2418. doi:10.1074/jbc.270.6.2415.
155. Staresincic L, Fagbemi AF, Enzlin JH, et al. Coordination of dual incision
and repair synthesis in human nucleotide excision repair. EMBO J.
2009;28(8):1111-1120. doi:10.1038/emboj.2009.49.
156. Branum ME, Reardon JT, Sancar A. DNA Repair Excision Nuclease Attacks
Undamaged DNA. J Biol Chem. 2001;276(27):25421-25426.
doi:10.1074/jbc.m101032200.
157. Howlett N. Nucleotide excision repair deficiency causes elevated levels of
chromosome gain in Saccharomyces cerevisiae. DNA Repair (Amst).
2004;3(2):127-134. doi:10.1016/j.dnarep.2003.10.003.
158. Jackson SP, Jeggo P a. DNA double-strand break repair and V(D)J
recombination: involvement of DNA-PK. Trends Biochem Sci.
1995;20(10):412-415. http://www.ncbi.nlm.nih.gov/pubmed/8533154.
260
159. Lieber MR. Pathological and Physiological Double-Strand Breaks. Am J
Pathol. 1998;153(5):1323-1332. doi:10.1016/s0002-9440(10)65716-1.
160. Murakami H, Keeney S. Regulating the formation of DNA double-strand
breaks in meiosis. Genes Dev. 2008;22(3):286-292.
doi:10.1101/gad.1642308.
161. Sung P. Catalysis of ATP-dependent homologous DNA pairing and strand
exchange by yeast RAD51 protein. Science (80- ). 1994;265(5176):1241-
1243. doi:10.1126/science.8066464.
162. Nick McElhinny SA, Snowden CM, McCarville J, Ramsden DA. Ku recruits
the XRCC4-ligase IV complex to DNA ends. Mol Cell Biol. 2000;20(9):2996-
3003. doi:10.1128/MCB.20.9.2996-3003.2000.
163. Lakhani SR, Jacquemier J, Sloane JP, et al. Multifactorial analysis of
differences between sporadic breast cancers and cancers involving BRCA1
and BRCA2 mutations. J Natl Cancer Inst. 1998;90(15):1138-1145.
doi:10.1093/jnci/90.15.1138.
164. Yarden RI, Pardo-Reoyo S, Sgagias M, Cowan KH, Brody LC. BRCA1
regulates the G2/M checkpoint by activating Chk1 kinase upon DNA
damage. Nat Genet. 2002;30(3):285-289. doi:10.1038/ng837.
165. Bessho T, Mu D, Sancar A. Initiation of DNA interstrand cross-link repair in
humans: the nucleotide excision repair system makes dual incisions 5’ to the
cross-linked base and removes a 22- to 28-nucleotide-long damage-free
strand. Mol Cell Biol. 1997;17(12):6822-6830. doi:10.1128/mcb.17.12.6822.
166. De Silva IU, McHugh PJ, Clingen PH, Hartley JA. Defining the Roles of
Nucleotide Excision Repair and Recombination in the Repair of DNA
Interstrand Cross-Links in Mammalian Cells. Mol Cell Biol.
2000;20(21):7980-7990. doi:10.1128/MCB.20.21.7980-7990.2000.
167. Vermeulen,K.,Van Bockstaele,D.R.,Berneman ZN, Vermeulen K, Van
Bockstaele DR, Berneman ZN. The cell cycle:a review of
regulation,deregulation and therapeutic targets in cancer. Cell Prolif.
2003;36(3):131-149. doi:10.1306/74D715D2-2B21-11D7-
8648000102C1865D.
261
168. Hochegger H, Takeda S, Hunt T. Cyclin-dependent kinases and cell-cycle
transitions: does one fit all? Nat Rev Mol Cell Biol. 2008;9(11):910-916.
doi:10.1038/nrm2510.
169. Deng C-X. BRCA1: cell cycle checkpoint, genetic instability, DNA damage
response and cancer evolution. Nucleic Acids Res. 2006;34(5):1416-1426.
doi:10.1093/nar/gkl010.
170. Laiho M, Latonen L. Cell cycle control, DNA damage checkpoints and
cancer. Ann Med. 2003;35(6):391-397. doi:10.1080/07853890310014605.
171. Hyka-Nouspikel N, Desmarais J, Gokhale PJ, et al. Deficient DNA Damage
Response and Cell Cycle Checkpoints Lead to Accumulation of Point
Mutations in Human Embryonic Stem Cells. Stem Cells. 2012;30(9):1901-
1910. doi:10.1002/stem.1177.
172. Bartek J, Lukas J. Chk1 and Chk2 kinases in checkpoint control and cancer.
Cancer Cell. 2003;3(5):421-429. doi:10.1016/s1535-6108(03)00110-7.
173. Holland AJ, Cleveland DW. Boveri revisited: chromosomal instability,
aneuploidy and tumorigenesis. Nat Rev Mol Cell Biol. 2009;10(7):478-487.
doi:10.1038/nrm2718.
174. Donzelli M, Draetta GF. Regulating mammalian checkpoints through Cdc25
inactivation. EMBO Rep. 2003;4(7):671-677.
doi:10.1038/sj.embor.embor887.
175. Bartek J, Lukas J. Mammalian G1- and S-phase checkpoints in response to
DNA damage. Curr Opin Cell Biol. 2001;13(6):738-747. doi:10.1016/s0955-
0674(00)00280-5.
176. Banin S. Enhanced Phosphorylation of p53 by ATM in Response to DNA
Damage. Science (80- ). 1998;281(5383):1674-1677.
doi:10.1126/science.281.5383.1674.
177. Canman CE. Activation of the ATM Kinase by Ionizing Radiation and
Phosphorylation of p53. Science (80- ). 1998;281(5383):1677-1679.
doi:10.1126/science.281.5383.1677.
262
178. Skladanowski A, Bozko P, Sabisz M. DNA Structure and Integrity
Checkpoints during the Cell Cycle and Their Role in Drug Targeting and
Sensitivity of Tumor Cells to Anticancer Treatment. Chem Rev.
2009;109(7):2951-2973. doi:10.1021/cr900026u.
179. Ehrlich LA, Yang-Iott K, Bassing CH. Tcrδ translocations that delete the
Bcl11b haploinsufficient tumor suppressor gene promote atm-deficient T cell
acute lymphoblastic leukemia. Cell Cycle. 2014;13(19):3076-3082.
doi:10.4161/15384101.2014.949144.
180. Li M, Fang X, Baker DJ, et al. The ATM – p53 pathway suppresses
aneuploidy- induced tumorigenesis. Pnas. 2010;107(32):14188-14193.
doi:10.1073/pnas.1005960107/-
/DCSupplemental.www.pnas.org/cgi/doi/10.1073/pnas.1005960107.
181. Campomenosi P, Assereto P, Bogliolo M, et al. p53 mutations and DNA
ploidy in colorectal adenocarcinomas. Anal Cell Pathol. 1998;17(1):1-12.
182. Williams BR, Prabhu VR, Hunter KE, et al. Aneuploidy Affects Proliferation
and Spontaneous Immortalization in Mammalian Cells. Science (80- ).
2008;322(5902):703-709. doi:10.1126/science.1160058.
183. Toledo F, Wahl GM. Regulating the p53 pathway: in vitro hypotheses, in vivo
veritas. Nat Rev Cancer. 2006;6(12):909-923. doi:10.1038/nrc2012.
184. Brush GS. Phosphorylation of the replication protein A large subunit in the
Saccharomyces cerevisiae checkpoint response. Nucleic Acids Res.
2000;28(19):3725-3732. doi:10.1093/nar/28.19.3725.
185. Gitig DM, Koff A. Cdk Pathway: Cyclin-Dependent Kinases and Cyclin-
Dependent Kinase Inhibitors. Mol Biotechnol. 2001;19(2):179-188.
doi:10.1385/mb:19:2:179.
186. Heffernan TP, Simpson DA, Frank AR, et al. An ATR- and Chk1-Dependent
S Checkpoint Inhibits Replicon Initiation following UVC-Induced DNA
Damage. Mol Cell Biol. 2002;22(24):8552-8561.
doi:10.1128/mcb.22.24.8552-8561.2002.
187. Kim S-T. Involvement of the cohesin protein, Smc1, in Atm-dependent and
independent responses to DNA damage. Genes Dev. 2002;16(5):560-570.
doi:10.1101/gad.970602.
263
188. Ouchi M, Ouchi T. Regulation of ATM/DNA-PKcs Phosphorylation by
BRCA1-Associated BAAT1. Genes Cancer. 2010;1(12):1211-1214.
doi:10.1177/1947601911404222.
189. Unsal-Kacmaz K, Makhov AM, Griffith JD, Sancar A. Preferential binding of
ATR protein to UV-damaged DNA. Proc Natl Acad Sci. 2002;99(10):6673-
6678. doi:10.1073/pnas.102167799.
190. Hekmat-Nejad M, You Z, Yee M, Newport JW, Cimprich KA. Xenopus ATR
is a replication-dependent chromatin-binding protein required for the DNA
replication checkpoint. Curr Biol. 2000;10(24):1565-1573.
doi:10.1016/s0960-9822(00)00855-1.
191. Costanzo V, Shechter D, Lupardus PJ, Cimprich KA, Gottesman M, Gautier
J. An ATR- and Cdc7-Dependent DNA Damage Checkpoint that Inhibits
Initiation of DNA Replication. Mol Cell. 2003;11(1):203-213.
doi:10.1016/s1097-2765(02)00799-2.
192. Osborn AJ, Elledge SJ, Zou L. Checking on the fork: the DNA-replication
stress-response pathway. Trends Cell Biol. 2002;12(11):509-516.
doi:10.1016/s0962-8924(02)02380-2.
193. Ii M, Brill SJ. Roles of SGS1, MUS81, and RAD51 in the repair of lagging-
strand replication defects in Saccharomyces cerevisiae. Curr Genet.
2005;48(4):213-225. doi:10.1007/s00294-005-0014-5.
194. Sogo JM. Fork Reversal and ssDNA Accumulation at Stalled Replication
Forks Owing to Checkpoint Defects. Science (80- ). 2002;297(5581):599-
602. doi:10.1126/science.1074023.
195. Liberi G. Rad51-dependent DNA structures accumulate at damaged
replication forks in sgs1 mutants defective in the yeast ortholog of BLM
RecQ helicase. Genes Dev. 2005;19(3):339-350. doi:10.1101/gad.322605.
196. Casper AM, Nghiem P, Arlt MF, Glover TW. ATR Regulates Fragile Site
Stability. Cell. 2002;111(6):779-789. doi:10.1016/s0092-8674(02)01113-3.
197. Abraham RT. Cell cycle checkpoint signaling through the ATM and ATR
kinases. Genes Dev. 2001;15(17):2177-2196. doi:10.1101/gad.914401.
264
198. Sorensen CS, Syljuosen RG, Falck J, et al. Chk1 regulates the S phase
checkpoint by coupling the physiological turnover and ionizing radiation-
induced accelerated proteolysis of Cdc25A. Cancer Cell. 2003;3(3):247-258.
doi:10.1016/s1535-6108(03)00048-5.
199. Gong X, Liu A, Ming X, Deng P, Jiang Y. UV-induced interaction between
p38 MAPK and p53 serves as a molecular switch in determining cell fate.
FEBS Lett. 2010;584(23):4711-4716. doi:10.1016/j.febslet.2010.10.057.
200. Warmerdam DO, Brinkman EK, Marteijn J a, Medema RH, Kanaar R, Smits
V a J. UV-induced G2 checkpoint depends on p38 MAPK and minimal
activation of ATR-Chk1 pathway. J Cell Sci. 2013;126(Pt 9):1923-1930.
doi:10.1242/jcs.118265.
201. Champeris Tsaniras S, Kanellakis N, Symeonidou IE, Nikolopoulou P,
Lygerou Z, Taraviras S. Lice;nsing of DNA replication, cancer, pluripotency
and differentiation: An interlinked world? Semin Cell Dev Biol. 2014;30:174-
180. doi:10.1016/j.semcdb.2014.03.013.
202. Blow JJ, Hodgson B. Replication licensing Origin licensing: defining the
proliferative state? Trends Cell Biol. 2002;12(2):72-78. doi:10.1016/s0962-
8924(01)02203-6.
203. Fragkos M, Ganier O, Coulombe P, Michali M. DNA replication origin
activation in space and time. Nat Rev Mol Cell Biol. 2015;16(6):360-374.
doi:10.1038/nrm4002.
204. Nishitani H, Lygerou Z. Control of DNA replication licensing in a cell cycle.
Genes to Cells. 2002;7(6):523-534. doi:10.1046/j.1365-2443.2002.00544.x.
205. Beresova L, Vesela E, Chamrad I, et al. Role of DNA Repair Factor
Xeroderma Pigmentosum Protein Group C in Response to Replication
Stress As Revealed by DNA Fragile Site Affinity Chromatography and
Quantitative Proteomics. J Proteome Res. 2016;15(12):4505-4517.
doi:10.1021/acs.jproteome.6b00622.
206. Kanu N, Cerone MA, Goh G, et al. DNA replication stress mediates
APOBEC3 family mutagenesis in breast cancer. Genome Biol.
2016;17(1):185. doi:10.1186/s13059-016-1042-9.
265
207. Mazouzi A, Velimezi G, Loizou JI. DNA replication stress: Causes, resolution
and disease. Exp Cell Res. 2014;329(1):85-93.
doi:10.1016/j.yexcr.2014.09.030.
208. Ward IM, Minn K, Chen J. UV-induced Ataxia-telangiectasia-mutated and
Rad3-related (ATR) Activation Requires Replication Stress. J Biol Chem.
2004;279(11):9677-9680. doi:10.1074/jbc.c300554200.
209. Marechal A, Zou L. DNA Damage Sensing by the ATM and ATR Kinases.
Cold Spring Harb Perspect Biol. 2013;5(9):a012716-a012716.
doi:10.1101/cshperspect.a012716.
210. Flynn RL, Zou L. ATR: a master conductor of cellular responses to DNA
replication stress. Trends Biochem Sci. 2011;36(3):133-140.
doi:10.1016/j.tibs.2010.09.005.
211. Barlow JH, Faryabi RB, Callén E, et al. Identification of early replicating
fragile sites that contribute to genome instability. Cell. 2013;152(3):620-632.
doi:10.1016/j.cell.2013.01.006.
212. Bermejo R, Capra T, Jossen R, et al. The replication checkpoint protects
fork stability by releasing transcribed genes from nuclear pores. Cell.
2011;146(2):233-246. doi:10.1016/j.cell.2011.06.033.
213. Aguilera A, Garcia-Muse T. R Loops: From Transcription Byproducts to
Threats to Genome Stability. Mol Cell. 2012;46(2):115-124.
doi:10.1016/j.molcel.2012.04.009.
214. Bermejo R, Capra T, Gonzalez-Huici V, et al. Genome-Organizing Factors
Top2 and Hmo1 Prevent Chromosome Fragility at Sites of S phase
Transcription. Cell. 2009;138(5):870-884. doi:10.1016/j.cell.2009.06.022.
215. Tuduri S, Crabbé L, Conti C, et al. Topoisomerase I suppresses genomic
instability by preventing interference between replication and transcription.
Nat Cell Biol. 2009;11(11):1315-1324. doi:10.1038/ncb1984.
216. Ragland RL, Patel S, Rivard RS, et al. RNF4 and PLK1 are required for
replication fork collapse in ATR-deficient cells. Genes Dev.
2013;27(20):2259-2273. doi:10.1101/gad.223180.113.
266
217. Tercero JA, Diffley JFX. Regulation of DNA replication fork progression
through damaged DNA by the Mec1/Rad53 checkpoint. Nature.
2001;412(6846):553-557. doi:10.1038/35087607.
218. Hanada K, Budzowska M, Davies SL, et al. The structure-specific
endonuclease Mus81 contributes to replication restart by generating double-
strand DNA breaks. Nat Struct Mol Biol. 2007;14(11):1096-1104.
doi:10.1038/nsmb1313.
219. Chanoux RA, Yin B, Urtishak KA, Asare A, Bassing CH, Brown EJ. ATR and
H2AX Cooperate in Maintaining Genome Stability under Replication Stress.
J Biol Chem. 2008;284(9):5994-6003. doi:10.1074/jbc.m806739200.
220. Betous R, Mason AC, Rambo RP, et al. SMARCAL1 catalyzes fork
regression and Holliday junction migration to maintain genome stability
during DNA replication. Genes Dev. 2012;26(2):151-162.
doi:10.1101/gad.178459.111.
221. Kim Y, Kipreos ET. Cdt1 degradation to prevent DNA re-replication:
conserved and non-conserved pathways. Cell Div. 2007;2(1):18.
doi:10.1186/1747-1028-2-18.
222. Wohlschlegel JA. Inhibition of Eukaryotic DNA Replication by Geminin
Binding to Cdt1. Science (80- ). 2000;290(5500):2309-2312.
doi:10.1126/science.290.5500.2309.
223. Liontos M, Koutsami M, Sideridou M, et al. Deregulated overexpression of
hCdt1 and hCdc6 promotes malignant behavior. Cancer Res.
2007;67(22):10899-10909. doi:10.1158/0008-5472.CAN-07-2837.
224. Li A, Blow JJ. Cdt1 downregulation by proteolysis and geminin inhibition
prevents DNA re-replication in Xenopus. EMBO J. 2004;24(2):395-404.
doi:10.1038/sj.emboj.7600520.
225. Davidson IF, Li A, Blow JJ. Deregulated Replication Licensing Causes DNA
Fragmentation Consistent with Head-to-Tail Fork Collision. Mol Cell.
2006;24(3):433-443. doi:10.1016/j.molcel.2006.09.010.
226. Burrell R a, McClelland SE, Endesfelder D, et al. Replication stress links
structural and numerical cancer chromosomal instability. Nature.
2013;494(7438):492-496. doi:10.1038/nature11935.
267
227. Smith L, Liu SJ, Goodrich L, et al. Duplication of ATR inhibits MyoD, induces
aneuploidy and eliminates radiation-induced G1 arrest. Nat Genet.
1998;19(1):39-46. doi:10.1038/ng0598-39.
228. Abdel-Fatah TMA, Middleton FK, Arora A, et al. Untangling the ATR-CHEK1
network for prognostication, prediction and therapeutic target validation in
breast cancer. Mol Oncol. 2015;9(3):569. doi:10.1016/j.molonc.2014.10.013.
229. Murga M, Campaner S, Lopez-Contreras AJ, et al. Exploiting oncogene-
induced replicative stress for the selective killing of Myc-driven tumors. Nat
Struct Mol Biol. 2011;18(12):1331-1335. doi:10.1038/nsmb.2189.
230. Gilad O, Nabet BY, Ragland RL, et al. Combining ATR Suppression with
Oncogenic Ras Synergistically Increases Genomic Instability, Causing
Synthetic Lethality or Tumorigenesis in a Dosage-Dependent Manner.
Cancer Res. 2010;70(23):9693-9702. doi:10.1158/0008-5472.can-10-2286.
231. Koniaras K, Cuddihy a R, Christopoulos H, Hogg a, O’Connell MJ.
Inhibition of Chk1-dependent G2 DNA damage checkpoint radiosensitizes
p53 mutant human cells. Oncogene. 2001;20(51):7453-7463.
doi:10.1038/sj.onc.1204942.
232. Lopez-Contreras AJ, Gutierrez-Martinez P, Specks J, Rodrigo-Perez S,
Fernandez-Capetillo O. An extra allele of Chk1 limits oncogene-induced
replicative stress and promotes transformation. J Exp Med.
2012;209(3):455-461. doi:10.1084/jem.20112147.
233. Lara-Gonzalez P, Westhorpe F, Taylor S. The Spindle Assembly
Checkpoint. Curr Biol. 2012;22(22):R966-R980.
doi:10.1016/j.cub.2012.10.006.
234. Gregan J, Polakova S, Zhang L, Tolic-Norrelykke IM, Cimini D. Merotelic
kinetochore attachment: causes and effects. Trends Cell Biol.
2011;21(6):374-381. doi:10.1016/j.tcb.2011.01.003.
235. Cimini D, Howell B, Maddox P, Khodjakov A, Degrassi F, Salmon ED.
Merotelic Kinetochore Orientation Is a Major Mechanism of Aneuploidy in
Mitotic Mammalian Tissue Cells. J Cell Biol. 2001;153(3):517-528.
doi:10.1083/jcb.153.3.517.
268
236. Thompson SL, Compton D a. Examining the link between chromosomal
instability and aneuploidy in human cells. J Cell Biol. 2008;180(4):665-672.
doi:10.1083/jcb.200712029.
237. Hanks S, Coleman K, Reid S, et al. Constitutional aneuploidy and cancer
predisposition caused by biallelic mutations in BUB1B. Nat Genet.
2004;36(11):1159-1161. doi:10.1038/ng1449.
238. Cahill DP, da Costa LT, Carson-Walter EB, Kinzler KW, Vogelstein B,
Lengauer C. Characterization of MAD2B and other mitotic spindle
checkpoint genes. Genomics. 1999;58(2):181-187.
doi:10.1006/geno.1999.5831.
239. Haruta M, Matsumoto Y, Izumi H, et al. Combined BubR1 protein down-
regulation and RASSF1A hypermethylation in Wilms tumors with diverse
cytogenetic changes. Mol Carcinog. 2008;47(9):660-666.
doi:10.1002/mc.20412.
240. Fu J, Bian M, Jiang Q, Zhang C. Roles of Aurora Kinases in Mitosis and
Tumorigenesis. Mol Cancer Res. 2007;5(1):1-10. doi:10.1158/1541-
7786.mcr-06-0208.
241. Ganem NJ, Godinho SA, Pellman D. A mechanism linking extra
centrosomes to chromosomal instability. Nature. 2009;460(7252):278-282.
doi:10.1038/nature08136.
242. Silkworth WT, Nardi IK, Scholl LM, Cimini D. Multipolar Spindle Pole
Coalescence Is a Major Source of Kinetochore Mis-Attachment and
Chromosome Mis-Segregation in Cancer Cells. PLoS One. 2009;4(8):e6564.
doi:10.1371/journal.pone.0006564.
243. Bakhoum SF, Thompson SL, Manning AL, Compton DA. Genome stability is
ensured by temporal control of kinetochore-microtubule dynamics. Nat Cell
Biol. 2008;11(1):27-35. doi:10.1038/ncb1809.
244. Kumar A, Rajendran V, Sethumadhavan R, Purohit R. Evidence of
Colorectal Cancer-Associated Mutation in MCAK: A Computational Report.
Cell Biochem Biophys. 2013;67(3):837-851. doi:10.1007/s12013-013-9572-
1.
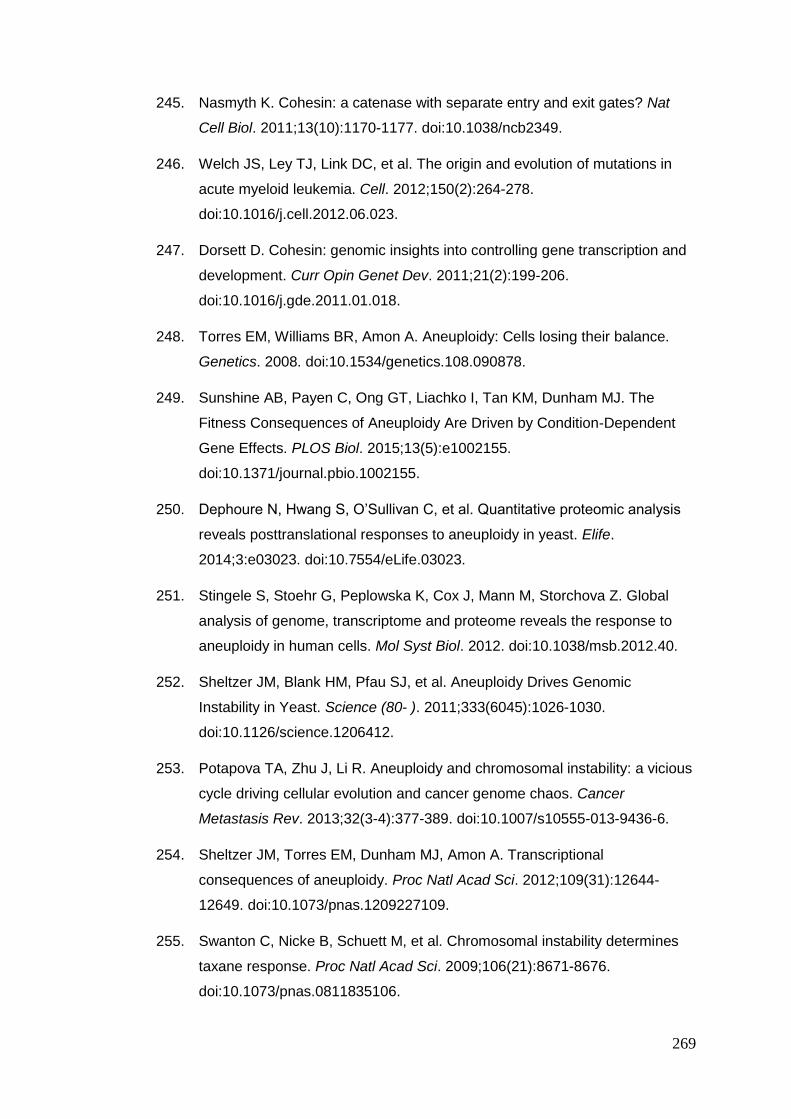
269
245. Nasmyth K. Cohesin: a catenase with separate entry and exit gates? Nat
Cell Biol. 2011;13(10):1170-1177. doi:10.1038/ncb2349.
246. Welch JS, Ley TJ, Link DC, et al. The origin and evolution of mutations in
acute myeloid leukemia. Cell. 2012;150(2):264-278.
doi:10.1016/j.cell.2012.06.023.
247. Dorsett D. Cohesin: genomic insights into controlling gene transcription and
development. Curr Opin Genet Dev. 2011;21(2):199-206.
doi:10.1016/j.gde.2011.01.018.
248. Torres EM, Williams BR, Amon A. Aneuploidy: Cells losing their balance.
Genetics. 2008. doi:10.1534/genetics.108.090878.
249. Sunshine AB, Payen C, Ong GT, Liachko I, Tan KM, Dunham MJ. The
Fitness Consequences of Aneuploidy Are Driven by Condition-Dependent
Gene Effects. PLOS Biol. 2015;13(5):e1002155.
doi:10.1371/journal.pbio.1002155.
250. Dephoure N, Hwang S, O’Sullivan C, et al. Quantitative proteomic analysis
reveals posttranslational responses to aneuploidy in yeast. Elife.
2014;3:e03023. doi:10.7554/eLife.03023.
251. Stingele S, Stoehr G, Peplowska K, Cox J, Mann M, Storchova Z. Global
analysis of genome, transcriptome and proteome reveals the response to
aneuploidy in human cells. Mol Syst Biol. 2012. doi:10.1038/msb.2012.40.
252. Sheltzer JM, Blank HM, Pfau SJ, et al. Aneuploidy Drives Genomic
Instability in Yeast. Science (80- ). 2011;333(6045):1026-1030.
doi:10.1126/science.1206412.
253. Potapova TA, Zhu J, Li R. Aneuploidy and chromosomal instability: a vicious
cycle driving cellular evolution and cancer genome chaos. Cancer
Metastasis Rev. 2013;32(3-4):377-389. doi:10.1007/s10555-013-9436-6.
254. Sheltzer JM, Torres EM, Dunham MJ, Amon A. Transcriptional
consequences of aneuploidy. Proc Natl Acad Sci. 2012;109(31):12644-
12649. doi:10.1073/pnas.1209227109.
255. Swanton C, Nicke B, Schuett M, et al. Chromosomal instability determines
taxane response. Proc Natl Acad Sci. 2009;106(21):8671-8676.
doi:10.1073/pnas.0811835106.
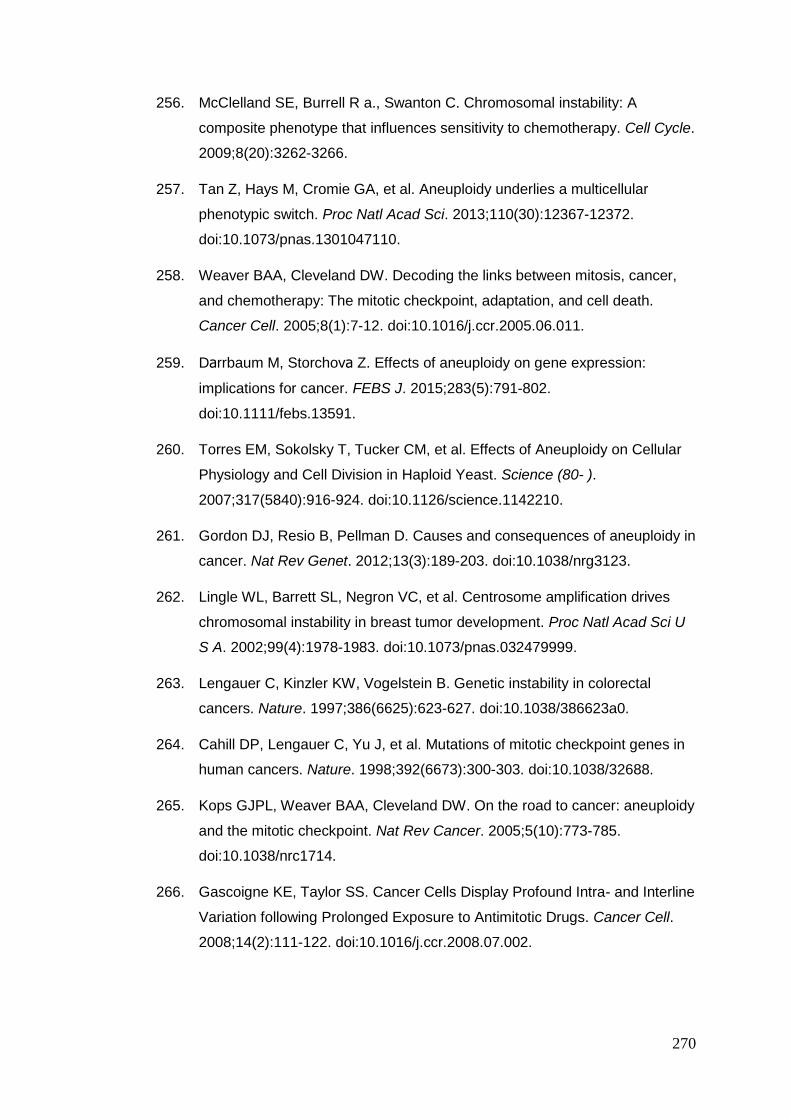
270
256. McClelland SE, Burrell R a., Swanton C. Chromosomal instability: A
composite phenotype that influences sensitivity to chemotherapy. Cell Cycle.
2009;8(20):3262-3266.
257. Tan Z, Hays M, Cromie GA, et al. Aneuploidy underlies a multicellular
phenotypic switch. Proc Natl Acad Sci. 2013;110(30):12367-12372.
doi:10.1073/pnas.1301047110.
258. Weaver BAA, Cleveland DW. Decoding the links between mitosis, cancer,
and chemotherapy: The mitotic checkpoint, adaptation, and cell death.
Cancer Cell. 2005;8(1):7-12. doi:10.1016/j.ccr.2005.06.011.
259. Darrbaum M, Storchova Z. Effects of aneuploidy on gene expression:
implications for cancer. FEBS J. 2015;283(5):791-802.
doi:10.1111/febs.13591.
260. Torres EM, Sokolsky T, Tucker CM, et al. Effects of Aneuploidy on Cellular
Physiology and Cell Division in Haploid Yeast. Science (80- ).
2007;317(5840):916-924. doi:10.1126/science.1142210.
261. Gordon DJ, Resio B, Pellman D. Causes and consequences of aneuploidy in
cancer. Nat Rev Genet. 2012;13(3):189-203. doi:10.1038/nrg3123.
262. Lingle WL, Barrett SL, Negron VC, et al. Centrosome amplification drives
chromosomal instability in breast tumor development. Proc Natl Acad Sci U
S A. 2002;99(4):1978-1983. doi:10.1073/pnas.032479999.
263. Lengauer C, Kinzler KW, Vogelstein B. Genetic instability in colorectal
cancers. Nature. 1997;386(6625):623-627. doi:10.1038/386623a0.
264. Cahill DP, Lengauer C, Yu J, et al. Mutations of mitotic checkpoint genes in
human cancers. Nature. 1998;392(6673):300-303. doi:10.1038/32688.
265. Kops GJPL, Weaver BAA, Cleveland DW. On the road to cancer: aneuploidy
and the mitotic checkpoint. Nat Rev Cancer. 2005;5(10):773-785.
doi:10.1038/nrc1714.
266. Gascoigne KE, Taylor SS. Cancer Cells Display Profound Intra- and Interline
Variation following Prolonged Exposure to Antimitotic Drugs. Cancer Cell.
2008;14(2):111-122. doi:10.1016/j.ccr.2008.07.002.
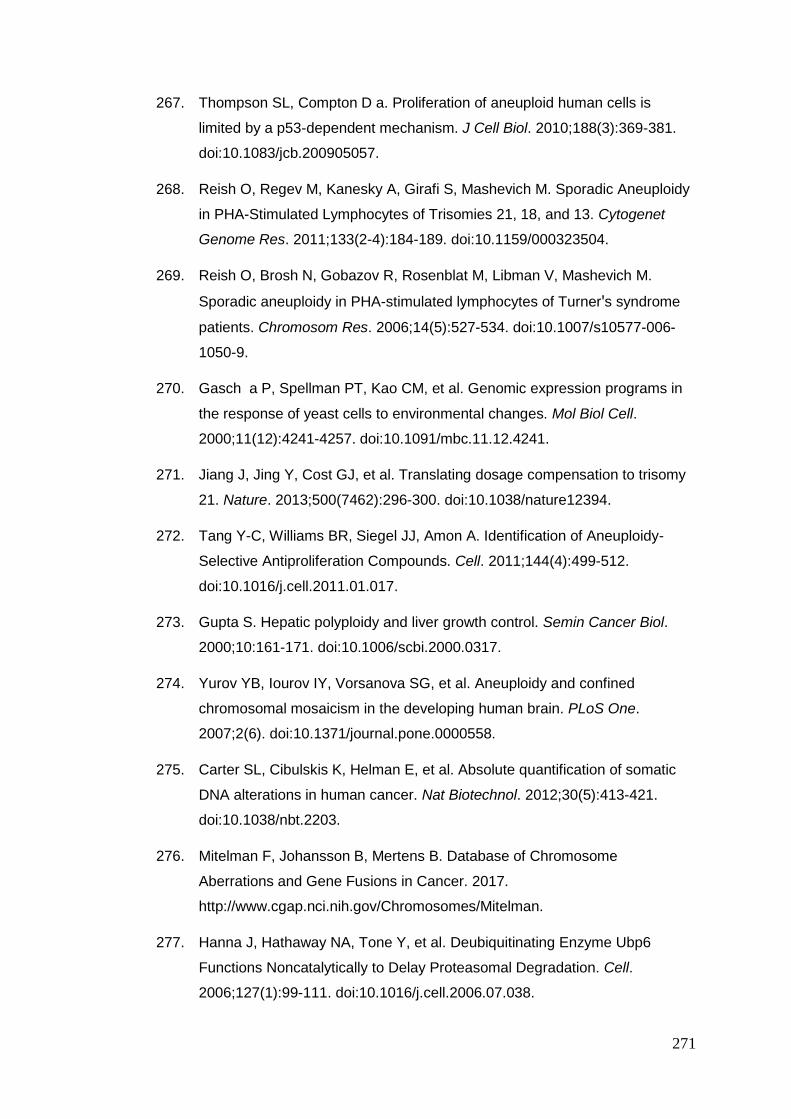
271
267. Thompson SL, Compton D a. Proliferation of aneuploid human cells is
limited by a p53-dependent mechanism. J Cell Biol. 2010;188(3):369-381.
doi:10.1083/jcb.200905057.
268. Reish O, Regev M, Kanesky A, Girafi S, Mashevich M. Sporadic Aneuploidy
in PHA-Stimulated Lymphocytes of Trisomies 21, 18, and 13. Cytogenet
Genome Res. 2011;133(2-4):184-189. doi:10.1159/000323504.
269. Reish O, Brosh N, Gobazov R, Rosenblat M, Libman V, Mashevich M.
Sporadic aneuploidy in PHA-stimulated lymphocytes of Turner's syndrome
patients. Chromosom Res. 2006;14(5):527-534. doi:10.1007/s10577-006-
1050-9.
270. Gasch a P, Spellman PT, Kao CM, et al. Genomic expression programs in
the response of yeast cells to environmental changes. Mol Biol Cell.
2000;11(12):4241-4257. doi:10.1091/mbc.11.12.4241.
271. Jiang J, Jing Y, Cost GJ, et al. Translating dosage compensation to trisomy
21. Nature. 2013;500(7462):296-300. doi:10.1038/nature12394.
272. Tang Y-C, Williams BR, Siegel JJ, Amon A. Identification of Aneuploidy-
Selective Antiproliferation Compounds. Cell. 2011;144(4):499-512.
doi:10.1016/j.cell.2011.01.017.
273. Gupta S. Hepatic polyploidy and liver growth control. Semin Cancer Biol.
2000;10:161-171. doi:10.1006/scbi.2000.0317.
274. Yurov YB, Iourov IY, Vorsanova SG, et al. Aneuploidy and confined
chromosomal mosaicism in the developing human brain. PLoS One.
2007;2(6). doi:10.1371/journal.pone.0000558.
275. Carter SL, Cibulskis K, Helman E, et al. Absolute quantification of somatic
DNA alterations in human cancer. Nat Biotechnol. 2012;30(5):413-421.
doi:10.1038/nbt.2203.
276. Mitelman F, Johansson B, Mertens B. Database of Chromosome
Aberrations and Gene Fusions in Cancer. 2017.
http://www.cgap.nci.nih.gov/Chromosomes/Mitelman.
277. Hanna J, Hathaway NA, Tone Y, et al. Deubiquitinating Enzyme Ubp6
Functions Noncatalytically to Delay Proteasomal Degradation. Cell.
2006;127(1):99-111. doi:10.1016/j.cell.2006.07.038.
272
278. Peth A, Besche HC, Goldberg AL. Ubiquitinated Proteins Activate the
Proteasome by Binding to Usp14/Ubp6, which Causes 20S Gate Opening.
Mol Cell. 2009;36(5):794-804. doi:10.1016/j.molcel.2009.11.015.
279. Tomasini R, Mak TW, Melino G. The impact of p53 and p73 on aneuploidy
and cancer. Trends Cell Biol. 2008;18(5):244-252.
doi:10.1016/j.tcb.2008.03.003.
280. Donner EM, Preston RJ. The relationship between p53 status, DNA repair
and chromatid aberration induction in G2 mouse embryo fibroblast cells
treated with bleomycin. Carcinogenesis. 1996;17(5):1161-1165.
doi:10.1093/carcin/17.5.1161.
281. GOEPFERT TM. Progesterone facilitates chromosome instability
(aneuploidy) in p53 null normal mammary epithelial cells. FASEB J.
2000;14(14):2221-2229. doi:10.1096/fj.00-0165com.
282. McGranahan N, Burrell RA, Endesfelder D, Novelli MR, Swanton C. Cancer
chromosomal instability: therapeutic and diagnostic challenges. EMBO Rep.
2012;13(6):528-538. doi:10.1038/embor.2012.61.
283. Giam M, Rancati G. Aneuploidy and chromosomal instability in cancer: a
jackpot to chaos. Cell Div. 2015;10(1). doi:10.1186/s13008-015-0009-7.
284. Komarova NL, Wodarz D. The optimal rate of chromosome loss for the
inactivation of tumor suppressor genes in cancer. Proc Natl Acad Sci.
2004;101(18):7017-7021. doi:10.1073/pnas.0401943101.
285. P??rez de Castro I, de C??rcer G, Malumbres M. A census of mitotic cancer
genes: New insights into tumor cell biology and cancer therapy.
Carcinogenesis. 2007;28(5):899-912. doi:10.1093/carcin/bgm019.
286. Sotillo R, Hernando E, Diaz-Rodriguez E, et al. Mad2 Overexpression
Promotes Aneuploidy and Tumorigenesis in Mice. Cancer Cell.
2007;11(1):9-23. doi:10.1016/j.ccr.2006.10.019.
287. Sotillo R, Schvartzman J-M, Socci ND, Benezra R. Mad2-induced
chromosome instability leads to lung tumour relapse after oncogene
withdrawal. Nature. 2010;464(7287):436-440. doi:10.1038/nature08803.
273
288. Hernando E, Nahlé Z, Juan G, et al. Rb inactivation promotes genomic
instability by uncoupling cell cycle progression from mitotic control. Nature.
2004;430(7001):797-802. doi:10.1038/nature02820.
289. Duijf PHG, Schultz N, Benezra R. Cancer cells preferentially lose small
chromosomes. Int J Cancer. 2012;132(10):2316-2326.
doi:10.1002/ijc.27924.
290. Kaur A, Singh A, Kaur S, Singh J. Karyotypic findings in chronic myeloid
leukemia cases undergoing treatment. Indian J Hum Genet. 2012;18(1):66.
doi:10.4103/0971-6866.96654.
291. Chmital L, Gabriel S, Mitsainas G, et al. Centromere Strength Provides the
Cell Biological Basis for Meiotic Drive and Karyotype Evolution in Mice. Curr
Biol. 2014;24(19):2295-2300. doi:10.1016/j.cub.2014.08.017.
292. Martin RH, Ko E, Rademaker A. Distribution of aneuploidy in human
gametes: Comparison between human sperm and oocytes. Am J Med
Genet. 1991;39(3):321-331. doi:10.1002/ajmg.1320390315.
293. Pellestor F. Differential distribution of aneuploidy in human gametes
according to their sex. Hum Reprod. 1991;6(9):1252-1258.
doi:10.1093/oxfordjournals.humrep.a137522.
294. Goldacre MJ, Wotton CJ, Seagroatt V, Yeates D. Cancers and immune
related diseases associated with Down’s syndrome: a record linkage study.
Arch Dis Child. 2004;89(11):1014-1017. doi:10.1136/adc.2003.046219.
295. Xavier AC, Ge Y, Taub JW. Down Syndrome and Malignancies: A Unique
Clinical Relationship. J Mol Diagnostics. 2009;11(5):371-380.
doi:10.2353/jmoldx.2009.080132.
296. Jefford CE, Irminger-Finger I. Mechanisms of chromosome instability in
cancers. Crit Rev Oncol Hematol. 2006;59(1):1-14.
doi:10.1016/j.critrevonc.2006.02.005.
297. Pino MS, Chung DC. The Chromosomal Instability Pathway in Colon
Cancer. Gastroenterology. 2010;138(6):2059-2072.
doi:10.1053/j.gastro.2009.12.065.
274
298. Kops GJPL, Foltz DR, Cleveland DW. Lethality to human cancer cells
through massive chromosome loss by inhibition of the mitotic checkpoint.
Proc Natl Acad Sci. 2004;101(23):8699-8704.
doi:10.1073/pnas.0401142101.
299. Satg?? D, Sommelet D, Geneix A, Nishi M, Malet P, Vekemans M. A tumor
profile in Down syndrome. Am J Med Genet. 1998;78(3):207-216.
doi:10.1002/(SICI)1096-8628(19980707)78:3<207::AID-AJMG1>3.0.CO;2-
M.
300. Baek K, Zaslavsky A, Lynch RC, et al. Down syndrome suppression of tumor
growth and the role of the calcineurin inhibitor DSCR1. Nature.
2009;459(7250):1126-1130. doi:10.1038/nature08062.Down.
301. Weaver BAA, Silk AD, Montagna C, Verdier-Pinard P, Cleveland DW.
Aneuploidy Acts Both Oncogenically and as a Tumor Suppressor. Cancer
Cell. 2007;11(1):25-36. doi:10.1016/j.ccr.2006.12.003.
302. Gartner EM, Silverman P, Simon M, et al. A phase II study of 17-allylamino-
17-demethoxygeldanamycin in metastatic or locally advanced, unresectable
breast cancer. Breast Cancer Res Treat. 2011;131(3):933-937.
doi:10.1007/s10549-011-1866-7.
303. Heath EI, Hillman DW, Vaishampayan U, et al. A Phase II trial of 17-
allylamino-17-demethoxygeldanamycin in patients with hormone-refractory
metastatic prostate cancer. Clin Cancer Res. 2008;14(23):7940-7946.
doi:10.1158/1078-0432.CCR-08-0221.
304. Kwon M, Godinho SA, Chandhok NS, et al. Mechanisms to suppress
multipolar divisions in cancer cells with extra centrosomes. Genes Dev.
2008;22(16):2189-2203. doi:10.1101/gad.1700908.
305. Kantarjian HM, Padmanabhan S, Stock W, et al. Phase I/II multicenter study
to assess the safety, tolerability, pharmacokinetics and pharmacodynamics
of AZD4877 in patients with refractory acute myeloid leukemia. Invest New
Drugs. 2012;30(3):1107-1115. doi:10.1007/s10637-011-9660-2.
306. Infante JR, Kurzrock R, Spratlin J, et al. A Phase i study to assess the
safety, tolerability, and pharmacokinetics of AZD4877, an intravenous Eg5
inhibitor in patients with advanced solid tumors. Cancer Chemother
Pharmacol. 2012;69(1):165-172. doi:10.1007/s00280-011-1667-z.
275
307. Kallioniemi A. CGH microarrays and cancer. Curr Opin Biotechnol.
2008;19(1):36-40. doi:10.1016/j.copbio.2007.11.004.
308. Pinkel D, Albertson DG. Array comparative genomic hybridization and its
applications in cancer. Nat Genet. 2005;37(6s):S11-S17.
doi:10.1038/ng1569.
309. Shinawi M, Cheung SW. The array CGH and its clinical applications. Drug
Discov Today. 2008;13(17-18):760-770. doi:10.1016/j.drudis.2008.06.007.
310. Ligon AH, Beaudet AL, Shaffer LG. Simultaneous, Multilocus FISH Analysis
for Detection of Microdeletions in the Diagnostic Evaluation of
Developmental Delay and Mental Retardation. Am J Hum Genet.
1997;61(1):51-59. doi:10.1086/513904.
311. Speicher MR, Carter NP. The new cytogenetics: blurring the boundaries with
molecular biology. Nat Rev Genet. 2005;6(10):782-792.
doi:10.1038/nrg1692.
312. Knouse KA, Wu J, Whittaker CA, Amon A. Single cell sequencing reveals
low levels of aneuploidy across mammalian tissues. Proc Natl Acad Sci.
2014;111(37):13409-13414. doi:10.1073/pnas.1415287111.
313. Falconer E, Hills M, Naumann U, et al. DNA template strand sequencing of
single-cells maps genomic rearrangements at high resolution. Nat Methods.
2012;9(11):1107-1112. doi:10.1038/nmeth.2206.
314. Bakker B, Taudt A, Belderbos ME, et al. Single-cell sequencing reveals
karyotype heterogeneity in murine and human malignancies. Genome Biol.
2016;17(1):115. doi:10.1186/s13059-016-0971-7.
315. Dong X, Zhang L, Milholland B, et al. Accurate identification of single-
nucleotide variants in whole-genome-amplified single cells. Nat Methods.
2017;14(5):491-493. doi:10.1038/nmeth.4227.
316. Van Loo P, Voet T. Single cell analysis of cancer genomes. Curr Opin Genet
Dev. 2014;24:82-91. doi:10.1016/j.gde.2013.12.004.
317. Korbel J, Campbell P. Criteria for Inference of Chromothripsis in Cancer
Genomes. Cell. 2013;152(6):1226-1236. doi:10.1016/j.cell.2013.02.023.
276
318. Macaulay IC, Voet T. Single Cell Genomics: Advances and Future
Perspectives. PLoS Genet. 2014;10(1):e1004126.
doi:10.1371/journal.pgen.1004126.
319. Blanco R, Rengifo CE, Cedeño M, Frómeta M, Rengifo E. Flow Cytometric
Measurement of Aneuploid DNA Content Correlates with High S-Phase
Fraction and Poor Prognosis in Patients with Non-Small-Cell Lung Cancer.
ISRN Biomarkers. 2013;2013:1-8. doi:10.1155/2013/354123.
320. Abad M, Ciudad J, Rincon MR, et al. DNA Aneuploidy by Flow Cytometry Is
an Independent Prognostic Factor in Gastric Cancer. Anal Cell Pathol.
1998;16(4):223-231. doi:10.1155/1998/158243.
321. Frankfurt OS, Slocum HK, Rustum YM, et al. Flow cytometric analysis of
DNA aneuploidy in primary and metastatic human solid tumors,. Cytometry.
1984;5(1):71-80. doi:10.1002/cyto.990050111.
322. van den Ingh HF, Griffioen G, Cornelisse CJ. Flow cytometric detection of
aneuploidy in colorectal adenomas. Cancer Res. 1985;45(JULY):3392-3397.
323. Jensen RH. Chromomycin A3 as a fluorescent probe for flow cytometry of
human gynecologic samples. J Histochem Cytochem. 1977;25(7):573-579.
doi:10.1177/25.7.70448.
324. Pozarowski P, Darzynkiewicz Z. Analysis of cell cycle by flow cytometry.
Methods Mol Biol. 2004;281:301-311. doi:10.1385/1-59259-811-0:301.
325. Minderman H, Humphrey K, Arcadi JK, et al. Image cytometry-based
detection of aneuploidy by fluorescence in situ hybridization in suspension.
Cytom Part A. 2012;81A(9):776-784. doi:10.1002/cyto.a.22101.
326. Carter NP. Bivariate chromosome analysis using a commercial flow
cytometer. Methods Mol Biol. 1994;29:187-204.
327. Dey P. Aneuploidy and malignancy: an unsolved equation. J Clin Pathol.
2004;57(12):1245-1249. doi:10.1136/jcp.2004.018952.
328. Howe B, Umrigar A, Tsien F. Chromosome Preparation From Cultured Cells.
J Vis Exp. 2014;(83). doi:10.3791/50203.
329. WILKINSHAUG L, SANDSTROM M, WEREMOWICZ S. Fluorescence in
situ hybridization for the detection of aneuploidy from archived fetal cells.
Obstet Gynecol. 1996;88(4):684-687. doi:10.1016/0029-7844(96)00277-3.
277
330. Das K, Tan P. Molecular cytogenetics: recent developments and
applications in cancer. Clin Genet. 2013;84(4):315-325.
doi:10.1111/cge.12229.
331. Monzon FA. Guidance for Fluorescence in Situ Hybridization Testing in
Hematologic Disorders. Yearb Pathol Lab Med. 2008;2008:295-296.
doi:10.1016/s1077-9108(08)70716-3.
332. Iourov IY, Soloviev I V, Vorsanova SG, Monakhov V V, Yurov YB. An
Approach for Quantitative Assessment of Fluorescence In Situ Hybridization
(FISH) Signals for Applied Human Molecular Cytogenetics. J Histochem
Cytochem. 2005;53(3):401-408. doi:10.1369/jhc.4a6419.2005.
333. Carter NP. Cytogenetic analysis by chromosome painting. Cytometry.
1994;18(1):2-10. doi:10.1002/cyto.990180103.
334. Ried T. Chromosome painting: a useful art. Hum Mol Genet.
1998;7(10):1619-1626. doi:10.1093/hmg/7.10.1619.
335. KRAKER WJ, BORELL TJ, SCHAD CR, et al. Fluorescent In Situ
Hybridization: Use of Whole Chromosome Paint Probes to Identify
Unbalanced Chromosome Translocations. Mayo Clin Proc. 1992;67(7):658-
662. doi:10.1016/s0025-6196(12)60721-6.
336. Passerini V, Ozeri-Galai E, de Pagter MS, et al. The presence of extra
chromosomes leads to genomic instability. Nat Commun. 2016;7:10754.
doi:10.1038/ncomms10754.
337. Thompson SL, Compton DA. Proliferation of aneuploid human cells is limited
by a p53-dependent mechanism. J Cell Biol. 2010;188(3):369-381.
doi:10.1083/jcb.200905057.
338. Knutsen T, Padilla-Nash HM, Wangsa D, et al. Definitive molecular
cytogenetic characterization of 15 colorectal cancer cell lines. Genes,
Chromosom Cancer. 2009:NA-NA. doi:10.1002/gcc.20730.
339. McClelland SE, Tamura N. Personal communication. 2017.
340. Kelder T, Pico AR, Hanspers K, Van Iersel MP, Evelo C, Conklin BR. Mining
biological pathways using WikiPathways web services. PLoS One.
2009;4(7). doi:10.1371/journal.pone.0006447.
278
341. Pfau SJ, Silberman RE, Knouse KA, Amon A. Aneuploidy impairs
hematopoietic stem cell fitness and is selected against in regenerating
tissues in vivo. Genes Dev. 2016;30(12):1395-1408.
doi:10.1101/gad.278820.116.
342. Deutschbauer AM. Mechanisms of Haploinsufficiency Revealed by Genome-
Wide Profiling in Yeast. Genetics. 2005;169(4):1915-1925.
doi:10.1534/genetics.104.036871.
343. Thompson SL, Compton DA. Examining the link between chromosomal
instability and aneuploidy in human cells. J Cell Biol. 2008;180(4):665-672.
doi:10.1083/jcb.200712029.
344. Shapiro E, Biezuner T, Linnarsson S. Single-cell sequencing-based
technologies will revolutionize whole-organism science. Nat Rev Genet.
2013;14(9):618-630. doi:10.1038/nrg3542.
345. Vasquez RJ, Howell B, Yvon AM, Wadsworth P, Cassimeris L. Nanomolar
concentrations of nocodazole alter microtubule dynamic instability in vivo
and in vitro. Mol Biol Cell. 1997;8(6):973-985. doi:10.1091/mbc.8.6.973.
346. Zimmermann FK, Mayer VW, Scheel I. Induction of aneuploidy by
oncodazole (nocodazole), an anti-tubulin agent, and acetone. Mutat Res
Lett. 1984;141(1):15-18. doi:10.1016/0165-7992(84)90030-7.
347. Mayer VW, Goin CJ. Aneuploidy induced by nocodazole or ethyl acetate is
suppressed by dimethyl sulfoxide. Mutat Res Toxicol. 1987;187(1):31-35.
doi:10.1016/0165-1218(87)90073-5.
348. Fenech M. The Cytokinesis-Block Micronucleus Technique and Its
Application to Genotoxicity Studies in Human Populations. Environ Health
Perspect. 1993;101:101. doi:10.2307/3431708.
349. Fenech M, Kirsch-Volders M, Natarajan AT, et al. Molecular mechanisms of
micronucleus, nucleoplasmic bridge and nuclear bud formation in
mammalian and human cells. Mutagenesis. 2010;26(1):125-132.
doi:10.1093/mutage/geq052.
350. Dalton WB, Nandan MO, Moore RT, Yang VW. Human Cancer Cells
Commonly Acquire DNA Damage during Mitotic Arrest. Cancer Res.
2007;67(24):11487-11492. doi:10.1158/0008-5472.can-07-5162.
279
351. Uetake Y, Sluder G. Prolonged Prometaphase Blocks Daughter Cell
Proliferation Despite Normal Completion of Mitosis. Curr Biol.
2010;20(18):1666-1671. doi:10.1016/j.cub.2010.08.018.
352. Orth JD, Loewer A, Lahav G, Mitchison TJ. Prolonged mitotic arrest triggers
partial activation of apoptosis, resulting in DNA damage and p53 induction.
Mol Biol Cell. 2011;23(4):567-576. doi:10.1091/mbc.e11-09-0781.
353. Vassilev LT. Cell cycle synchronization at the G2/M phase border by
reversible inhibition of CDK1. Cell Cycle. 2006;5(November):2555-2556.
doi:10.4161/cc.5.22.3463.
354. Vassilev LT, Tovar C, Chen S, et al. Selective small-molecule inhibitor
reveals critical mitotic functions of human CDK1. Proc Natl Acad Sci.
2006;103(28):10660-10665. doi:10.1073/pnas.0600447103.
355. Mah L-J, El-Osta a, Karagiannis TC. gammaH2AX: a sensitive molecular
marker of DNA damage and repair. Leuk Off J Leuk Soc Am Leuk Res
Fund, UK. 2010;24(4):679-686. doi:10.1038/leu.2010.6.
356. Podhorecka M, Skladanowski A, Bozko P. H2AX Phosphorylation: Its Role in
DNA Damage Response and Cancer Therapy. J Nucleic Acids.
2010;2010:1-9. doi:10.4061/2010/920161.
357. Mariotti LG, Pirovano G, Savage KI, et al. Use of the ?-H2AX Assay to
Investigate DNA Repair Dynamics Following Multiple Radiation Exposures.
PLoS One. 2013;8(11):e79541. doi:10.1371/journal.pone.0079541.
358. Giunta S, Belotserkovskaya R, Jackson SP. DNA damage signaling in
response to double-strand breaks during mitosis. J Cell Biol.
2010;190(2):197-207. doi:10.1083/jcb.200911156.
359. Branzei D, Foiani M. Regulation of DNA repair throughout the cell cycle. Nat
Rev Mol Cell Biol. 2008;9(4):297-308. doi:10.1038/nrm2351.
360. Kaye JA, Melo JA, Cheung SK, Vaze MB, Haber JE, Toczyski DP. DNA
Breaks Promote Genomic Instability by Impeding Proper Chromosome
Segregation. Curr Biol. 2004;14(23):2096-2106.
doi:10.1016/j.cub.2004.10.051.
280
361. Thompson SL, Compton DA. Chromosome missegregation in human cells
arises through specific types of kinetochore-microtubule attachment errors.
Proc Natl Acad Sci. 2011;108(44):17974-17978.
doi:10.1073/pnas.1109720108.
362. Wang Z-B, Schatten H, Sun Q-Y. Why is Chromosome Segregation Error in
Oocytes Increased With Maternal Aging? Physiology. 2011;26(5):314-325.
doi:10.1152/physiol.00020.2011.
363. Kleyman M, Kabeche L, Compton DA. STAG2 promotes error correction in
mitosis by regulating kinetochore-microtubule attachments. J Cell Sci.
2014;127(19):4225-4233. doi:10.1242/jcs.151613.
364. Kumari G, Ulrich T, Krause M, Finkernagel F, Gaubatz S. Induction of
p21CIP1 Protein and Cell Cycle Arrest after Inhibition of Aurora B Kinase Is
Attributed to Aneuploidy and Reactive Oxygen Species. J Biol Chem.
2014;289(23):16072-16084. doi:10.1074/jbc.m114.555060.
365. Shen KC, Heng H, Wang Y, et al. ATM and p21 Cooperate to Suppress
Aneuploidy and Subsequent Tumor Development. Cancer Res.
2005;65(19):8747-8753. doi:10.1158/0008-5472.can-05-1471.
366. Fenech M, Kirsch-Volders M, Natarajan a. T, et al. Molecular mechanisms
of micronucleus, nucleoplasmic bridge and nuclear bud formation in
mammalian and human cells. Mutagenesis. 2011;26(1):125-132.
doi:10.1093/mutage/geq052.
367. Li X, Zhao X, Fang Y, et al. Generation of Destabilized Green Fluorescent
Protein as a Transcription Reporter. J Biol Chem. 1998;273(52):34970-
34975. doi:10.1074/jbc.273.52.34970.
368. Ward WW, Bokman SH. Reversible denaturation of Aequorea green-
fluorescent protein: physical separation and characterization of the renatured
protein. Biochemistry. 1982;21(19):4535-4540. doi:10.1021/bi00262a003.
369. Cubitt AB, Heim R, Adams SR, Boyd AE, Gross LA, Tsien RY.
Understanding, improving and using green fluorescent proteins. Trends
Biochem Sci. 1995;20(11):448-455. doi:10.1016/s0968-0004(00)89099-4.
281
370. Franke CA, Rice CM, Strauss JH, Hruby DE. Neomycin resistance as a
dominant selectable marker for selection and isolation of vaccinia virus
recombinants. Mol Cell Biol. 1985;5(8):1918-1924.
doi:10.1128/mcb.5.8.1918.
371. Kisselev AF, Goldberg AL. Proteasome inhibitors: from research tools to
drug candidates. Chem Biol. 2001;8(8):739-758. doi:10.1016/s1074-
5521(01)00056-4.
372. Schneider-Poetsch T, Ju J, Eyler DE, et al. Inhibition of eukaryotic
translation elongation by cycloheximide and lactimidomycin. Nat Chem Biol.
2010;6(3):209-217. doi:10.1038/nchembio.304.
373. Cummings BS, Schnellmann RG. Measurement of Cell Death in Mammalian
Cells. Curr Protoc Pharmacol. 2004. doi:10.1002/0471141755.ph1208s25.
374. LaFramboise T. Single nucleotide polymorphism arrays: a decade of
biological, computational and technological advances. Nucleic Acids Res.
2009;37(13):4181-4193. doi:10.1093/nar/gkp552.
375. Gryfe R, Gallinger S. Microsatellite instability, mismatch repair deficiency,
and colorectal cancer. Surgery. 2001;130(1):17-20.
doi:10.1067/msy.2001.112738.
376. Potapova TA, Unruh JR, Box AC, et al. Karyotyping human and mouse cells
using probes from single-sorted chromosomes and open source software.
Biotechniques. 2015;59(6). doi:10.2144/000114362.
377. Prestel M, Feller C, Becker PB. Dosage compensation and the global re-
balancing of aneuploid genomes. Genome Biol. 2010;11(8):216.
doi:10.1186/gb-2010-11-8-216.
378. Hose J, Yong CM, Sardi M, Wang Z, Newton MA, Gasch AP. Correction:
Dosage compensation can buffer copy-number variation in wild yeast. Elife.
2016;5. doi:10.7554/elife.15743.
379. Margolis RL, Lohez OD, Andreassen PR. G1 tetraploidy checkpoint and the
suppression of tumorigenesis. J Cell Biochem. 2003;88(4):673-683.
doi:10.1002/jcb.10411.
282
380. Lohez OD, Reynaud C, Borel F, Andreassen PR, Margolis RL. Arrest of
mammalian fibroblasts in G1 in response to actin inhibition is dependent on
retinoblastoma pocket proteins but not on p53. J Cell Biol. 2003;161(1):67-
77. doi:10.1083/jcb.200208140.
381. Niwa O, Tange Y, Kurabayashi A. Growth arrest and chromosome instability
in aneuploid yeast. Yeast. 2006;23(13):937-950. doi:10.1002/yea.1411.
382. Santaguida S, Richardson A, Iyer DR, et al. Chromosome Mis-segregation
Generates Cell-Cycle-Arrested Cells with Complex Karyotypes that Are
Eliminated by the Immune System. Dev Cell. 2017;41(6):638-651.e5.
doi:10.1016/j.devcel.2017.05.022.
383. Elmore S. Apoptosis: A Review of Programmed Cell Death. Toxicol Pathol.
2007;35(4):495-516. doi:10.1080/01926230701320337.
384. Davoli T, Xu A, Mengwasser K, et al. Cumulative Haploinsufficiency and
Triplosensitivity Drive Aneuploidy Patterns and Shape the Cancer Genome.
Cell. 2013;155(4):948-962. doi:10.1016/j.cell.2013.10.011.
385. Flintoft L. Cancer genomics: Explaining aneuploidy patterns. Nat Rev Genet.
2013;14(12):825. doi:10.1038/nrg3634.
386. Bakker B, van den Bos H, Lansdorp PM, Foijer F. How to count
chromosomes in a cell: An overview of current and novel technologies.
BioEssays. 2015;37(5):570-577. doi:10.1002/bies.201400218.
387. Shaffer LG, Bui T-H. Molecular cytogenetic and rapid aneuploidy detection
methods in prenatal diagnosis. Am J Med Genet Part C Semin Med Genet.
2007;145C(1):87-98. doi:10.1002/ajmg.c.30114.
388. Weissenberg R. Concurrent use of flow cytometry and fluorescence in-situ
hybridization techniques for detecting faulty meiosis in a human sperm
sample. Mol Hum Reprod. 1998;4(1):61-66. doi:10.1093/molehr/4.1.61.
389. Kay DB, Cambier JL, Wheeless LL. Imaging in flow. J Histochem Cytochem.
1979;27(1):329-334. doi:10.1177/27.1.374597.
390. Cambier JL, Kay DB, Wheeless LL. A multidimensional slit-scan flow
system. J Histochem Cytochem. 1979;27(1):321-324.
doi:10.1177/27.1.374595.
283
391. Basiji DA, Ortyn WE, Liang L, Venkatachalam V, Morrissey P. Cellular
Image Analysis and Imaging by Flow Cytometry. Clin Lab Med.
2007;27(3):653-670. doi:10.1016/j.cll.2007.05.008.
392. Compton DA. Mechanisms of aneuploidy. Curr Opin Cell Biol.
2011;23(1):109-113. doi:10.1016/j.ceb.2010.08.007.
393. Tanaka K, Hirota T. Chromosome segregation machinery and cancer.
Cancer Sci. 2009;100(7):1158-1165. doi:10.1111/j.1349-7006.2009.01178.x.
394. Taylor SS, McKeon F. Kinetochore Localization of Murine Bub1 Is Required
for Normal Mitotic Timing and Checkpoint Response to Spindle Damage.
Cell. 1997;89(5):727-735. doi:10.1016/s0092-8674(00)80255-x.
395. Gorbsky GJ, Chen R-H, Murray AW. Microinjection of Antibody to Mad2
Protein into Mammalian Cells in Mitosis Induces Premature Anaphase. J
Cell Biol. 1998;141(5):1193-1205. doi:10.1083/jcb.141.5.1193.
396. Abrieu A, Magnaghi-Jaulin L, Kahana JA, et al. Mps1 Is a Kinetochore-
Associated Kinase Essential for the Vertebrate Mitotic Checkpoint. Cell.
2001;106(1):83-93. doi:10.1016/s0092-8674(01)00410-x.
397. Burhans WC, Weinberger M. DNA replication stress, genome instability and
aging. Nucleic Acids Res. 2007;35(22):7545-7556.
doi:10.1093/nar/gkm1059.
398. Gaillard H, Garcia-Muse T, Aguilera A. Replication stress and cancer. Nat
Rev Cancer. 2015;15(5):276-289. doi:10.1038/nrc3916.
399. Brambati A, Colosio A, Zardoni L, Galanti L, Liberi G. Replication and
transcription on a collision course: eukaryotic regulation mechanisms and
implications for DNA stability. Front Genet. 2015;6.
doi:10.3389/fgene.2015.00166.
400. Helmrich A, Ballarino M, Tora L. Collisions between Replication and
Transcription Complexes Cause Common Fragile Site Instability at the
Longest Human Genes. Mol Cell. 2011;44(6):966-977.
doi:10.1016/j.molcel.2011.10.013.
401. Liu B, Alberts B. Head-on collision between a DNA replication apparatus and
RNA polymerase transcription complex. Science (80- ).
1995;267(5201):1131-1137. doi:10.1126/science.7855590.
284
402. Hou C, Li L, Qin Z, Corces V. Gene Density, Transcription, and Insulators
Contribute to the Partition of the Drosophila Genome into Physical Domains.
Mol Cell. 2012;48(3):471-484. doi:10.1016/j.molcel.2012.08.031.
403. Spadari S, Sala F, Pedrali-Noy G. Aphidicolin: a specific inhibitor of nuclear
DNA replication in eukaryotes. Trends Biochem Sci. 1982;7(1):29-32.
doi:10.1016/0968-0004(82)90061-5.
404. Regnier V, Vagnarelli P, Fukagawa T, et al. CENP-A Is Required for
Accurate Chromosome Segregation and Sustained Kinetochore Association
of BubR1. Mol Cell Biol. 2005;25(10):3967-3981.
doi:10.1128/mcb.25.10.3967-3981.2005.
405. Hori T, Shang W-H, Takeuchi K, Fukagawa T. The CCAN recruits CENP-A
to the centromere and forms the structural core for kinetochore assembly. J
Cell Biol. 2012;200(1):45-60. doi:10.1083/jcb.201210106.
406. Orthaus S, Biskup C, Hoffmann B, et al. Assembly of the Inner Kinetochore
Proteins CENP-A and CENP-B in Living Human Cells. ChemBioChem.
2008;9(1):77-92. doi:10.1002/cbic.200700358.
407. Guse A, Carroll CW, Moree B, Fuller CJ, Straight AF. In vitro centromere
and kinetochore assembly on defined chromatin templates. Nature.
2011;477(7364):354-358. doi:10.1038/nature10379.
408. Irvine D V, Amor DJ, Perry J, et al. Chromosome size and origin as
determinants of the level of CENP-A incorporation into human centromeres.
Chromosom Res. 2004;12(8):805-815. doi:10.1007/s10577-005-5377-4.
409. Holland AJ, Fachinetti D, Han JS, Cleveland DW. Inducible, reversible
system for the rapid and complete degradation of proteins in mammalian
cells. Proc Natl Acad Sci. 2012;109(49):E3350-E3357.
doi:10.1073/pnas.1216880109.
410. Janssen A, van der Burg M, Szuhai K, Kops GJ, Medema RH. Chromosome
segregation errors as a cause of DNA damage and structural chromosome
aberrations. Science (80- ). 2011;333(6051):1895-1898.
doi:10.1126/science.1210214.
411. Potapova T, Gorbsky G. The Consequences of Chromosome Segregation
Errors in Mitosis and Meiosis. Biology (Basel). 2017;6(1):12.
doi:10.3390/biology6010012.
285
412. Nakagawa S, FitzHarris G. Intrinsically Defective Microtubule Dynamics
Contribute to Age-Related Chromosome Segregation Errors in Mouse
Oocyte Meiosis-I. Curr Biol. 2017;27(7):1040-1047.
doi:10.1016/j.cub.2017.02.025.
413. El-Labban A, Arteta C, Zisserman A, Bird AW, Hyman A. Mitotic phase
based detection of chromosome segregation errors in embryonic stem cells.
2013 IEEE 10th Int Symp Biomed Imaging. 2013.
doi:10.1109/isbi.2013.6556619.
414. Hoque MT, Ishikawa F. Cohesin Defects Lead to Premature Sister
Chromatid Separation, Kinetochore Dysfunction, and Spindle-assembly
Checkpoint Activation. J Biol Chem. 2002;277(44):42306-42314.
doi:10.1074/jbc.m206836200.
415. Cohen-Fix O. Sister chromatid separation: Falling apart at the seams. Curr
Biol. 2000;10(22):R816-R819. doi:10.1016/s0960-9822(00)00799-5.
416. Wang S, Su J-H, Beliveau BJ, et al. Spatial organization of chromatin
domains and compartments in single chromosomes. Science (80- ).
2016;353(6299):598-602. doi:10.1126/science.aaf8084.
417. Hoo JJ, Cramer H. On the position of chromosomes in prepared mitosis
figures of human fibroblasts. Humangenetik. 1971;13(2):166-170.
doi:10.1007/bf00295800.
418. Juricek D. Non-random chromosome distribution in radial metaphases from
the Chinese hamster. Chromosoma. 1975;50(3). doi:10.1007/bf00283474.
419. Cremer T, Cremer M. Chromosome Territories. Cold Spring Harb Perspect
Biol. 2010;2(3):a003889-a003889. doi:10.1101/cshperspect.a003889.
420. Smith CA, McAinsh AD, Burroughs NJ. Human kinetochores are swivel
joints that mediate microtubule attachments. Elife. 2016;5.
doi:10.7554/elife.16159.
421. Liang Z, Zickler D, Prentiss M, et al. Chromosomes Progress to Metaphase
in Multiple Discrete Steps via Global Compaction/Expansion Cycles. Cell.
2015;161(5):1124-1137. doi:10.1016/j.cell.2015.04.030.
286
422. Gillego I, Castro-Hartmann P, Caravaca JM, Caio S, Daban J-R. Dense
chromatin plates in metaphase chromosomes. Eur Biophys J.
2009;38(4):503-522. doi:10.1007/s00249-008-0401-1.
423. Fernandez P, Maier M, Lindauer M, Kuffer C, Storchova Z, Bausch AR.
Mitotic Spindle Orients Perpendicular to the Forces Imposed by Dynamic
Shear. PLoS One. 2011;6(12):e28965. doi:10.1371/journal.pone.0028965.
424. Gardner MK, Bouck DC, Paliulis L V., et al. Chromosome Congression by
Kinesin-5 Motor-Mediated Disassembly of Longer Kinetochore Microtubules.
Cell. 2008;135(5):894-906. doi:10.1016/j.cell.2008.09.046.
425. Stumpff J, Wordeman L. Chromosome Congression: The Kinesin-8-Step
Path to Alignment. Curr Biol. 2007;17(9):R326-R328.
doi:10.1016/j.cub.2007.03.013.
426. Wandke C, Barisic M, Sigl R, et al. Human chromokinesins promote
chromosome congression and spindle microtubule dynamics during mitosis.
J Cell Biol. 2012;198(5):847-863. doi:10.1083/jcb.201110060.
427. Tanenbaum ME, Stern-Ginossar N, Weissman JS, Vale RD. Regulation of
mRNA translation during mitosis. Elife. 2015;4. doi:10.7554/elife.07957.
428. Halley-Stott RP, Jullien J, Pasque V, Gurdon J. Mitosis Gives a Brief
Window of Opportunity for a Change in Gene Transcription. PLoS Biol.
2014;12(7):e1001914. doi:10.1371/journal.pbio.1001914.
429. Parsons GG, Spencer CA. Mitotic repression of RNA polymerase II
transcription is accompanied by release of transcription elongation
complexes. Mol Cell Biol. 1997;17(10):5791-5802.
doi:10.1128/mcb.17.10.5791.
430. Lakin ND, Jackson SP. Regulation of p53 in response to DNA damage.
Oncogene. 1999;18(53):7644-7655. doi:10.1038/sj.onc.1203015.
431. Cheng Q, Chen J. Mechanism of p53 stabilization by ATM after DNA
damage. Cell Cycle. 2010;9(3):472-478. doi:10.4161/cc.9.3.10556.
432. Boehme KA, Kulikov R, Blattner C. p53 stabilization in response to DNA
damage requires Akt/PKB and DNA-PK. Proc Natl Acad Sci.
2008;105(22):7785-7790. doi:10.1073/pnas.0703423105.
287
433. Ard PG, Chatterjee C, Kunjibettu S, Adside LR, Gralinski LE, McMahon SB.
Transcriptional Regulation of the mdm2 Oncogene by p53 Requires TRRAP
Acetyltransferase Complexes. Mol Cell Biol. 2002;22(16):5650-5661.
doi:10.1128/mcb.22.16.5650-5661.2002.
434. Manfredi JJ. The Mdm2-p53 relationship evolves: Mdm2 swings both ways
as an oncogene and a tumor suppressor. Genes Dev. 2010;24(15):1580-
1589. doi:10.1101/gad.1941710.
435. Lambert PF, Kashanchi F, Radonovich MF, Shiekhattar R, Brady JN.
Phosphorylation of p53 Serine 15 Increases Interaction with CBP. J Biol
Chem. 1998;273(49):33048-33053. doi:10.1074/jbc.273.49.33048.
436. Loughery J, Cox M, Smith LM, Meek DW. Critical role for p53-serine 15
phosphorylation in stimulating transactivation at p53-responsive promoters.
Nucleic Acids Res. 2014;42(12):7666-7680. doi:10.1093/nar/gku501.
437. Bai M, Agnantis NJ, Skyrlas A, et al. Increased Expression of the bcl6 and
CD10 Proteins Is Associated with Increased Apoptosis and Proliferation in
Diffuse Large B-Cell Lymphomas. Mod Pathol. 2003;16(5):471-480.
doi:10.1097/01.mp.0000067684.78221.6e.
438. Yang E, Zha J, Jockel J, Boise LH, Thompson CB, Korsmeyer SJ. Bad, a
heterodimeric partner for Bcl-xL and Bcl-2, displaces bax and promotes cell
death. Cell. 1995;80(2):285-291. doi:10.1016/0092-8674(95)90411-5.
439. O’Connor L, Strasser A, O’Reilly LA, et al. Bim: A novel member of the Bcl-2
family that promotes apoptosis. EMBO J. 1998;17(2):384-395.
doi:10.1093/emboj/17.2.384.
440. Hernandez R, Frady A, Zhang X-Y, Varela M, Ehrlich M. Preferential
induction of chromosome 1 multibranched figures and whole-arm deletions
in a human pro-B cell line treated with 5-azacytidine or 5-azadeoxycytidine.
Cytogenet Genome Res. 1997;76(3-4):196-201. doi:10.1159/000134548.
441. Lavia P, Ferraro M, Micheli A, Olivieri G. Effect of 5-azacytidine (5-azaC) on
the induction of chromatid aberrations (CA) and sister-chromatid exchanges
(SCE). Mutat Res Mol Mech Mutagen. 1985;149(3):463-467.
doi:10.1016/0027-5107(85)90164-2.
288
442. Stevens D, Gassmann R, Oegema K, Desai A. Uncoordinated Loss of
Chromatid Cohesion Is a Common Outcome of Extended Metaphase Arrest.
PLoS One. 2011;6(8):e22969. doi:10.1371/journal.pone.0022969.
443. Mirkovic M, Hutter L, Novak B, Oliveira R. Premature Sister Chromatid
Separation Is Poorly Detected by the Spindle Assembly Checkpoint as a
Result of System-Level Feedback. Cell Rep. 2015;13(3):469-478.
doi:10.1016/j.celrep.2015.09.020.
444. Losada A. Cohesin in cancer: chromosome segregation and beyond. Nat
Rev Cancer. 2014;14(6):389-393. doi:10.1038/nrc3743.
445. Chiang T, Duncan FE, Schindler K, Schultz RM, Lampson MA. Weakened
Centromere Cohesion Is the Primary Cause of Age-Related Aneuploidy in
Oocytes. Biol Reprod. 2010;83(Suppl_1):9. doi:10.1093/biolreprod/83.s1.9.
446. Gutierrez-Mateo C. Aneuploidy study of human oocytes first polar body
comparative genomic hybridization and metaphase II fluorescence in situ
hybridization analysis. Hum Reprod. 2004;19(12):2859-2868.
doi:10.1093/humrep/deh515.
447. Munne S. Preimplantation genetic diagnosis of numerical and structural
chromosome abnormalities. Reprod Biomed Online. 2002;4(2):183-196.
doi:10.1016/s1472-6483(10)61938-4.
448. Weier JF, Weier H-UG, Nureddin A, Pedersen RA, Racowsky C. Aneuploidy
involving chromosome 1 in failed-fertilized human oocytes is unrelated to
maternal age. J Assist Reprod Genet. 2005;22(7-8):285-293.
doi:10.1007/s10815-005-5999-7.
449. Nishiyama T, Sykora MM, Huis In ’t Veld PJ, Mechtler K, Peters J-M. Aurora
B and Cdk1 mediate Wapl activation and release of acetylated cohesin from
chromosomes by phosphorylating Sororin. Proc Natl Acad Sci U S A.
2013;110(33):13404-13409. doi:10.1073/pnas.1305020110.
450. Tanno Y, Kitajima TS, Honda T, Ando Y, Ishiguro K -i., Watanabe Y.
Phosphorylation of mammalian Sgo2 by Aurora B recruits PP2A and MCAK
to centromeres. Genes Dev. 2010;24(19):2169-2179.
doi:10.1101/gad.1945310.
289
451. Kim H-S, Kim S-H, Park H-Y, et al. Functional interplay between Aurora B
kinase and Ssu72 phosphatase regulates sister chromatid cohesion. Nat
Commun. 2013;4. doi:10.1038/ncomms3631.
452. Dai J, Sullivan BA, Higgins JMG. Regulation of Mitotic Chromosome
Cohesion by Haspin and Aurora B. Dev Cell. 2006;11(5):741-750.
doi:10.1016/j.devcel.2006.09.018.
453. Knowlton AL, Lan W, Stukenberg PT. Aurora B Is Enriched at Merotelic
Attachment Sites, Where It Regulates MCAK. Curr Biol. 2006;16(17):1705-
1710. doi:10.1016/j.cub.2006.07.057.
454. Cimini D. Detection and Correction of Merotelic Kinetochore Orientation by
Aurora B and its Partners. Cell Cycle. 2007;6(13):1558-1564.
doi:10.4161/cc.6.13.4452.
455. Zhang C-Z, Spektor A, Cornils H, et al. Chromothripsis from DNA damage in
micronuclei. Nature. 2015;522(7555):179-184. doi:10.1038/nature14493.
456. Minocherhomji S, Ying S, Bjerregaard VA, et al. Replication stress activates
DNA repair synthesis in mitosis. Nature. 2015;528(7581):286-290.
doi:10.1038/nature16139.
457. Faggioli F, Wang T, Vijg J, Montagna C. Chromosome-specific accumulation
of aneuploidy in the aging mouse brain. Hum Mol Genet. 2012;21(24):5246-
5253. doi:10.1093/hmg/dds375.
458. Gisselsson D, Pettersson L, Höglund M, et al. Chromosomal breakage-
fusion-bridge events cause genetic intratumor heterogeneity. Proc Natl Acad
Sci U S A. 2000;97(10):5357-5362. doi:10.1073/pnas.090013497.
459. Hu L, Filippakis H, Huang H, Yen TJ, Gjoerup O V. Replication Stress and
Mitotic Dysfunction in Cells Expressing Simian Virus 40 Large T Antigen. J
Virol. 2013;87(24):13179-13192. doi:10.1128/jvi.02224-13.
460. Okada T, Ohzeki J, Nakano M, et al. CENP-B Controls Centromere
Formation Depending on the Chromatin Context. Cell. 2007;131(7):1287-
1300. doi:10.1016/j.cell.2007.10.045.
461. Fachinetti D, Han JS, McMahon MA, et al. DNA Sequence-Specific Binding
of CENP-B Enhances the Fidelity of Human Centromere Function. Dev Cell.
2015;33(3):314-327. doi:10.1016/j.devcel.2015.03.020.
290
462. Giunta S, Funabiki H. Integrity of the human centromere DNA repeats is
protected by CENP-A, CENP-C, and CENP-T. Proc Natl Acad Sci.
2017;114(8):1928-1933. doi:10.1073/pnas.1615133114.
463. Mart?nez P, Bouza C, Vi?as A, S?nchez L. Differential digestion of the
centromeric heterochromatic regions of the 5-azacytidine-decondensed
human chromosomes 1, 9, 15, and 16 by NdeII and Sau3AI restriction
endonucleases. Genetica. 1995;96(3):235-238. doi:10.1007/bf01439577.
464. Prada D, Gonzalez R, Sanchez L, Castro C, Fabian E, Herrera LA. Satellite
2 demethylation induced by 5-azacytidine is associated with missegregation
of chromosomes 1 and 16 in human somatic cells. Mutat Res Mol Mech
Mutagen. 2012;729(1-2):100-105. doi:10.1016/j.mrfmmm.2011.10.007.
465. Chen B, Yusuf M, Hashimoto T, Estandarte AK, Thompson G, Robinson I.
Three-dimensional positioning and structure of chromosomes in a human
prophase nucleus. Sci Adv. 2017;3(7):e1602231.
doi:10.1126/sciadv.1602231.
466. Cremer M, Kopper K, Wagler B, et al. Inheritance of gene density-related
higher order chromatin arrangements in normal and tumor cell nuclei. J Cell
Biol. 2003;162(5):809-820. doi:10.1083/jcb.200304096.
467. Bakhoum SF, Genovese G, Compton DA. Deviant Kinetochore Microtubule
Dynamics Underlie Chromosomal Instability. Curr Biol. 2009;19(22):1937-
1942. doi:10.1016/j.cub.2009.09.055.
468. Magidson V, O’Connell CB, Lončarek J, Paul R, Mogilner A, Khodjakov A.
The spatial arrangement of chromosomes during prometaphase facilitates
spindle assembly. Cell. 2011;146(4):555-567.
doi:10.1016/j.cell.2011.07.012.
469. Paul R, Wollman R, Silkworth WT, Nardi IK, Cimini D, Mogilner A. Computer
simulations predict that chromosome movements and rotations accelerate
mitotic spindle assembly without compromising accuracy. Proc Natl Acad
Sci. 2009;106(37):15708-15713. doi:10.1073/pnas.0908261106.
470. Levesque AA, Compton DA. The chromokinesin Kid is necessary for
chromosome arm orientation and oscillation, but not congression, on mitotic
spindles. J Cell Biol. 2001;154(6):1135-1146. doi:10.1083/jcb.200106093.
291
471. Heneen WK, Nichols WW. Nonrandom arrangement of metaphase
chromosomes in cultured cells of the Indian deer, Muntiacus muntjak.
Cytogenet Genome Res. 1972;11(3):153-164. doi:10.1159/000130185.
472. Khan WA, Rogan PK, Knoll JHM. Localized, non-random differences in
chromatin accessibility between homologous metaphase chromosomes. Mol
Cytogenet. 2014;7(1). doi:10.1186/s13039-014-0070-y.
473. SCHNEIDERMAN LJ, SMITH CAB. Non-Random Distribution of Certain
Homologous Pairs of Normal Human Chromosomes in Metaphase. Nature.
1962;195(4847):1229-1230. doi:10.1038/1951229a0.

292
10. Appendix
293
10.1. Macros and programming scripts
10.1.1. Fluorescence intensity within the nucleus – ImageJ macro
{
dir = getDirectory("image");
processedDir=dir + "\Text Data\\";
File.makeDirectory(processedDir);
title = getTitle();
dotIndex = indexOf(title, ".");
title1 = substring(title, 0, dotIndex);
setBatchMode('false');
run("Set Measurements...", "mean redirect=None decimal=3");
selectWindow(title);
run("Z Project...", "start=1 stop=50 projection=[Max Intensity]");
selectWindow(title);
run("Z Project...", "start=51 stop=100 projection=[Max Intensity]");
selectWindow(title);
run("Z Project...", "start=101 stop=150 projection=[Max Intensity]");
selectWindow("MAX_"+title);
setAutoThreshold("Default dark");
//run("Threshold...");
run("Analyze Particles...", "size=100-Infinity add");
name = title + " - Cell Identification";
saveAs("Tiff", processedDir +name);
selectWindow("MAX_"+title1+"-1.dv");
run("Show Overlay");
roiManager("Multi Measure");
run("Input/Output...", "jpeg=85 gif=-1 file=.txt use_file save_column");
name = title + " p21" + ".txt";
saveAs("Results", processedDir +name);
selectWindow("MAX_"+title1+"-2.dv");
run("Show Overlay");
roiManager("Multi Measure");
294
run("Input/Output...", "jpeg=85 gif=-1 file=.txt use_file save_column");
name = title + " p53" + ".txt";
saveAs("Results", processedDir +name);
selectWindow("Results");
run("Close");
selectWindow("ROI Manager");
run("Close");
run("Close All");
}
295
10.1.2. Metaphase plate positioning – ImageJ macro
{
title = getTitle();
dotIndex = indexOf(title, ".");
title1 = substring(title, 0, dotIndex);
run("Set Measurements...", "centroid fit invert redirect=None decimal=3");
selectWindow(title);
run("Z Project...", "projection=[Standard Deviation]");
run("Split Channels");
selectWindow("C1-STD_"+title);
setAutoThreshold("Default dark");
setOption("BlackBackground", false);
run("Convert to Mask");
run("Analyze Particles...", "size=50-Infinity pixel circularity=0.00-1.00 show=Overlay exclude clear add");
selectWindow("C2-STD_"+title);
setAutoThreshold("Intermodes dark");
setOption("BlackBackground", false);
run("Convert to Mask");
roiManager("Select", 0);
run("Find Maxima...", "noise=10 output=[Point Selection] light");
roiManager("Add");
array1 = newArray("0");;
for (i=1;i<roiManager("count");i++){
array1 = Array.concat(array1,i);
}
roiManager("select", array1);
roiManager("Measure");
selectWindow("C3-STD_"+title);
setAutoThreshold("Intermodes dark");
setOption("BlackBackground", false);
run("Convert to Mask");
roiManager("Select", 0);

296
run("Find Maxima...", "noise=10 output=[Point Selection] light");
roiManager("Add");
array2 = newArray("0");;
for (i=1;i<roiManager("count");i++){
array2 = Array.concat(array2,i);
}
roiManager("select", array2);
roiManager("Measure");
}
297
10.1.3. Metaphase plate positioning – R script
install.packages("ggplot2")
library(ggplot2)
setwd(" ") # set working directory for analysis file
df <- read.table(" ", # point to analysis file (.txt)
header = TRUE, fill = TRUE)
ggplot(df, aes(x = chromosome, y = angle)) + geom_bin2d() +
scale_fill_gradient(low = "white", high = "red")
10.1.4. Sister chromatid angle rose plot – R script
install.packages("ggplot2")
library(ggplot2)
setwd(" ") # set working directory for analysis file
df <- read.table(" ", # point to analysis file (.txt)
header = TRUE, fill = TRUE)
ggplot(df, aes(x = angle, y = frequency)) +
coord_polar(theta = "x", direction = 1) +
geom_bar(stat = "identity", width=1, fill="slategray3", colour="black") +
scale_x_continuous(limits = c(0,45), breaks = seq(0, 360, 60)) +
scale_y_sqrt(breaks = seq(0,6)) +
theme(panel.grid.major = element_blank())
10.1.5. Inter-homologue distance – R script
install.packages("ggplot2")
library(ggplot2)
setwd(" ") # set working directory for analysis file
df <- read.table(" ", # point to analysis file (.txt)
header = TRUE, fill = TRUE)
ggplot(df, aes(x = chromosome, y = distance)) + geom_bin2d(bins=23) +ylim(0,1) +
scale_fill_gradient(low = "light grey", high = "green")
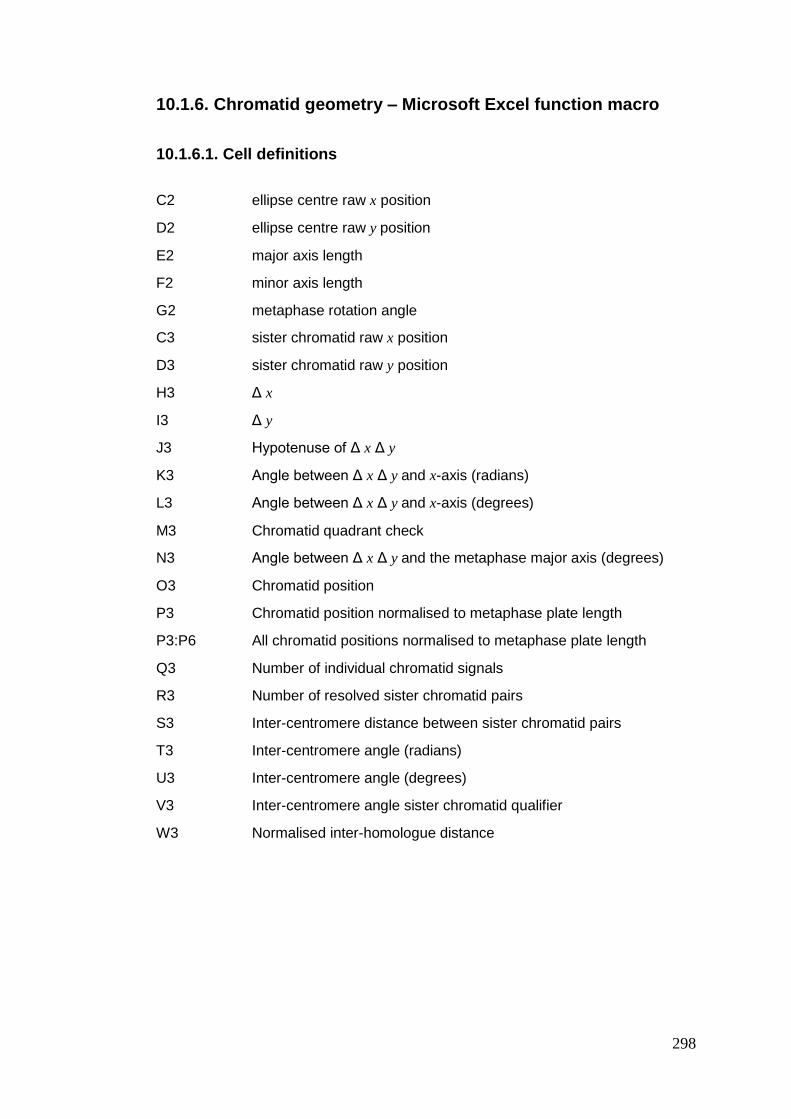
298
10.1.6. Chromatid geometry – Microsoft Excel function macro
10.1.6.1. Cell definitions
C2 ellipse centre raw x position
D2 ellipse centre raw y position
E2 major axis length
F2 minor axis length
G2 metaphase rotation angle
C3 sister chromatid raw x position
D3 sister chromatid raw y position
H3 Δ x
I3 Δ y
J3 Hypotenuse of Δ x Δ y
K3 Angle between Δ x Δ y and x-axis (radians)
L3 Angle between Δ x Δ y and x-axis (degrees)
M3 Chromatid quadrant check
N3 Angle between Δ x Δ y and the metaphase major axis (degrees)
O3 Chromatid position
P3 Chromatid position normalised to metaphase plate length
P3:P6 All chromatid positions normalised to metaphase plate length
Q3 Number of individual chromatid signals
R3 Number of resolved sister chromatid pairs
S3 Inter-centromere distance between sister chromatid pairs
T3 Inter-centromere angle (radians)
U3 Inter-centromere angle (degrees)
V3 Inter-centromere angle sister chromatid qualifier
W3 Normalised inter-homologue distance
299
10.1.6.2. Cell functions
H3 =(C3-C2)
I3 =(D3-D2)
J3 =(SQRT((I3^2)+(H3^2)))
K3 =(ABS(ATAN(I3/H3)))
L3 =(K3*(180/3.14159265358979))
M3 =IF(G2<0, (G2+180), G2)
N3 =IF(M3>90, (IF((180-M3-L3)<0, ABS(180-M3-L3), (IF(AND((H3>=0), (I3>=0)), (M3-L3), (180-M3-L3))))), (IF(L3<M3, SUM(M3-L3), SUM((L3-M3)))))
O3 =ABS((J3*(COS(N3*(3.14159265359/180)))))
P3 =(O3/(E2/2))
Q3 =COUNT(P3:P6)
R3 =IF(Q3=4,2,(IF(Q3=3,2,(IF(Q3=2,0,IF(Q3=1,0,0))))))
S3 =IF(Q3=1,0,IF(Q3=2,0,IF(Q3=4,IF(SUM(LARGE(P3:P6,1)-LARGE(P3:P6,2))<0.1,(SQRT((((INDEX(H3:H6,MATCH(LARGE(P3:P6,1),(P3:P6),0)))-(INDEX(H3:H6,MATCH(LARGE(P3:P6,2),(P3:P6),0))))^2)+(((INDEX(I3:I6,MATCH(LARGE(P3:P6,1),(P3:P6),0)))-(INDEX(I3:I6,MATCH(LARGE(P3:P6,2),(P3:P6),0))))^2))),0),(IF(Q3=3,IF(SUM(LARGE(P3:P6,1)-LARGE(P3:P6,2))<0.1,(SQRT((((INDEX(H3:H6,MATCH(LARGE(P3:P6,1),(P3:P6),0)))-(INDEX(H3:H6,MATCH(LARGE(P3:P6,2),(P3:P6),0))))^2)+(((INDEX(I3:I6,MATCH(LARGE(P3:P6,1),(P3:P6),0)))-(INDEX(I3:I6,MATCH(LARGE(P3:P6,2),(P3:P6),0))))^2))), SQRT((((INDEX(H3:H6,MATCH(LARGE(P3:P6,2),(P3:P6),0)))-(INDEX(H3:H6,MATCH(LARGE(P3:P6,3),(P3:P6),0))))^2)+(((INDEX(I3:I6,MATCH(LARGE(P3:P6,2),(P3:P6),0)))-(INDEX(I3:I6,MATCH(LARGE(P3:P6,3),(P3:P6),0))))^2))),0)))))
T3 =IF(Q3=1,0,IF(Q3=2,0,IF(Q3=4,IF(SUM(LARGE(P3:P6,1)-LARGE(P3:P6,2))<0.1,(ABS(ACOS(((LARGE(P3:P6,1)-(LARGE(P3:P6,2))))))),0), IF(Q3=3,IF(SUM(LARGE(P3:P6,1)-LARGE(P3:P6,2))<0.1,(ABS(ACOS(((LARGE(P3:P6,1)-(LARGE(P3:P6,2))))))), (ABS(ACOS(((LARGE(P3:P6,2)-(LARGE(P3:P6,3)))))))),0))))
U3 =(T3*(180/3.14159265358979))
V3 =IF(AND(Q3>=3, U3>0),(90-U3),0)
W3 =IF(Q3=2, (ABS(P3-P4)), 0)