Live-Cell Chromosome Dynamics and Outcome of X Chromosome Pairing Events during ES Cell...
12
Live-Cell Chromosome Dynamics and Outcome of X Chromosome Pairing Events during ES Cell Differentiation Osamu Masui, 1,2,3,9 Isabelle Bonnet, 1,2,3 Patricia Le Baccon, 1,4 Isabel Brito, 1,5,6 Tim Pollex, 1,2,3 Niall Murphy, 1,2,3 Philippe Hupe ´, 1,5,6,7 Emmanuel Barillot, 1,5,6 Andrew S. Belmont, 8 and Edith Heard 1,2,3, * 1 Institut Curie, 26 rue d’Ulm, Paris F-75248, France 2 CNRS UMR3215, Paris F-75248, France 3 INSERM U934, Paris F-75248, France 4 CNRS UMR218, Paris F-75248, France 5 INSERM U900, Paris F-75248, France 6 Mines ParisTech, Fontainebleau F-77300, France 7 CNRS UMR144, Paris F-75248, France 8 Department of Cell and Developmental Biology, University of Illinois, 601 South Goodwin Avenue, Urbana, IL 61801, USA 9 Present address: Research Centre for Allergy and Immunology, RIKEN Yokohama Institute, 1-7-22, Suehiro-cho, Tsurumi, Yokohama, Kanagawa 230-0045, Japan *Correspondence: [email protected] DOI 10.1016/j.cell.2011.03.032 SUMMARY Random X inactivation represents a paradigm for monoallelic gene regulation during early ES cell differentiation. In mice, the choice of X chromosome to inactivate in XX cells is ensured by monoallelic regulation of Xist RNA via its antisense transcription unit Tsix/Xite. Homologous pairing events have been proposed to underlie asymmetric Tsix expres- sion, but direct evidence has been lacking owing to their dynamic and transient nature. Here we investi- gate the live-cell dynamics and outcome of Tsix pair- ing in differentiating mouse ES cells. We find an over- all increase in genome dynamics including the Xics during early differentiation. During pairing, however, Xic loci show markedly reduced movements. Upon separation, Tsix expression becomes transiently monoallelic, providing a window of opportunity for monoallelic Xist upregulation. Our findings reveal the spatiotemporal choreography of the X chromo- somes during early differentiation and indicate a direct role for pairing in facilitating symmetry- breaking and monoallelic regulation of Xist during random X inactivation. INTRODUCTION X chromosome inactivation (XCI) ensures equal levels of X-linked gene products in females (XX) and males (XY) (Lyon, 1961). XCI is initiated during early development via upregulation of the non- coding Xist transcript, which coats one X chromosome in cis and triggers its silencing. Once established, XCI is then main- tained through propagation of epigenetic marks during cell divi- sions. A remarkable feature of XCI is that two identical chromo- somes become differentially expressed in the same nucleoplasm. Germline imprinting provides one way of achieving asymmetric expression (see Okamoto and Heard, 2009 for review). However, in most eutherians, and in postimplantation mouse embryos, XCI is random, with either the paternal or maternal X being silenced (Lyon, 1961). Random monoallelic gene expression has also been reported to occur at some auto- somal loci, with potentially important implications for develop- ment and disease (Gimelbrant et al., 2007). In the case of random XCI, the X-inactivation center (Xic), which includes the Xist gene and its antisense transcript Tsix, controls the initiation of this process (see Navarro and Avner, 2010 for review). XCI takes place during the earliest stages of embryonic stem (ES) cell differentiation, at a time when other important developmental decisions are also being made. In undifferentiated female ES cells, Xist and Tsix are expressed at low levels, but upon differentiation, Xist becomes upregulated and Tsix downregulated on one of the two X chromosomes (Lee et al., 1999; Debrand et al., 1999). Consistent with this inverse expression pattern, Tsix and its enhancer Xite (Lee et al., 1999; Lee and Lu, 1999, Sado et al., 2001; Ogawa and Lee, 2003) are known to repress Xist in cis. Understanding how Xist becomes asymmetrically upregulated during early differentiation is thus central to our understanding of how the two X chromosomes become differentially expressed during random XCI. Activation of Xist during ES cell differentia- tion depends on downregulation of pluripotency factors such as Oct4, Nanog, and Sox2 (Navarro et al., 2008), as well as the presence of XX-dosage-sensitive competence of sensing factors, such as the X-linked Rnf12 protein (Jonkers et al., 2009), and possibly other loci (Xpr) or noncoding transcripts (Jpx, Ftx) located 5 0 to Xist (Augui et al., 2007; Tian et al., 2010; Chureau et al., 2011). However, these sensing mechanisms do not readily explain why only one of the two Xist alleles is Cell 145, 447–458, April 29, 2011 ª2011 Elsevier Inc. 447
-
Upload
independent -
Category
Documents
-
view
1 -
download
0
Transcript of Live-Cell Chromosome Dynamics and Outcome of X Chromosome Pairing Events during ES Cell...

Live-Cell Chromosome Dynamics andOutcome of X Chromosome PairingEvents during ES Cell DifferentiationOsamu Masui,1,2,3,9 Isabelle Bonnet,1,2,3 Patricia Le Baccon,1,4 Isabel Brito,1,5,6 Tim Pollex,1,2,3 Niall Murphy,1,2,3
Philippe Hupe,1,5,6,7 Emmanuel Barillot,1,5,6 Andrew S. Belmont,8 and Edith Heard1,2,3,*1Institut Curie, 26 rue d’Ulm, Paris F-75248, France2CNRS UMR3215, Paris F-75248, France3INSERM U934, Paris F-75248, France4CNRS UMR218, Paris F-75248, France5INSERM U900, Paris F-75248, France6Mines ParisTech, Fontainebleau F-77300, France7CNRS UMR144, Paris F-75248, France8Department of Cell and Developmental Biology, University of Illinois, 601 South Goodwin Avenue, Urbana, IL 61801, USA9Present address: Research Centre for Allergy and Immunology, RIKEN Yokohama Institute, 1-7-22, Suehiro-cho, Tsurumi, Yokohama,
Kanagawa 230-0045, Japan*Correspondence: [email protected]
DOI 10.1016/j.cell.2011.03.032
SUMMARY
Random X inactivation represents a paradigm formonoallelic gene regulation during early ES celldifferentiation. In mice, the choice of X chromosometo inactivate in XX cells is ensured by monoallelicregulation of Xist RNA via its antisense transcriptionunit Tsix/Xite. Homologous pairing events havebeen proposed to underlie asymmetric Tsix expres-sion, but direct evidence has been lacking owing totheir dynamic and transient nature. Here we investi-gate the live-cell dynamics and outcome of Tsix pair-ing in differentiatingmouse ES cells. We find an over-all increase in genome dynamics including the Xicsduring early differentiation. During pairing, however,Xic loci show markedly reduced movements. Uponseparation, Tsix expression becomes transientlymonoallelic, providing a window of opportunity formonoallelic Xist upregulation. Our findings revealthe spatiotemporal choreography of the X chromo-somes during early differentiation and indicatea direct role for pairing in facilitating symmetry-breaking and monoallelic regulation of Xist duringrandom X inactivation.
INTRODUCTION
X chromosome inactivation (XCI) ensures equal levels of X-linked
gene products in females (XX) andmales (XY) (Lyon, 1961). XCI is
initiated during early development via upregulation of the non-
coding Xist transcript, which coats one X chromosome in cis
and triggers its silencing. Once established, XCI is then main-
tained through propagation of epigenetic marks during cell divi-
sions. A remarkable feature of XCI is that two identical chromo-
somes become differentially expressed in the same
nucleoplasm. Germline imprinting provides one way of achieving
asymmetric expression (see Okamoto and Heard, 2009 for
review). However, in most eutherians, and in postimplantation
mouse embryos, XCI is random, with either the paternal or
maternal X being silenced (Lyon, 1961). Random monoallelic
gene expression has also been reported to occur at some auto-
somal loci, with potentially important implications for develop-
ment and disease (Gimelbrant et al., 2007).
In the case of random XCI, the X-inactivation center (Xic),
which includes the Xist gene and its antisense transcript Tsix,
controls the initiation of this process (see Navarro and Avner,
2010 for review). XCI takes place during the earliest stages of
embryonic stem (ES) cell differentiation, at a time when other
important developmental decisions are also being made. In
undifferentiated female ES cells, Xist and Tsix are expressed at
low levels, but upon differentiation, Xist becomes upregulated
and Tsix downregulated on one of the two X chromosomes
(Lee et al., 1999; Debrand et al., 1999). Consistent with this
inverse expression pattern, Tsix and its enhancer Xite (Lee
et al., 1999; Lee and Lu, 1999, Sado et al., 2001; Ogawa and
Lee, 2003) are known to repress Xist in cis.
Understanding how Xist becomes asymmetrically upregulated
during early differentiation is thus central to our understanding of
how the two X chromosomes become differentially expressed
during random XCI. Activation of Xist during ES cell differentia-
tion depends on downregulation of pluripotency factors such
as Oct4, Nanog, and Sox2 (Navarro et al., 2008), as well as the
presence of XX-dosage-sensitive competence of sensing
factors, such as the X-linked Rnf12 protein (Jonkers et al.,
2009), and possibly other loci (Xpr) or noncoding transcripts
(Jpx, Ftx) located 50 to Xist (Augui et al., 2007; Tian et al., 2010;
Chureau et al., 2011). However, these sensing mechanisms do
not readily explain why only one of the two Xist alleles is
Cell 145, 447–458, April 29, 2011 ª2011 Elsevier Inc. 447
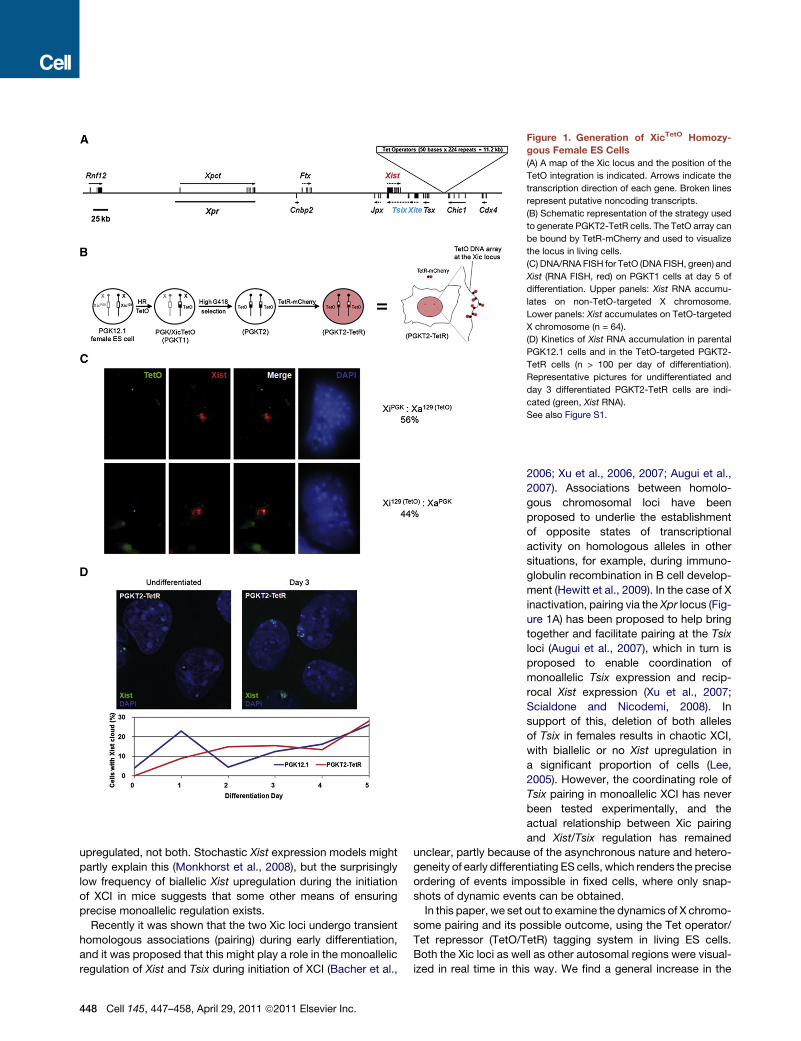
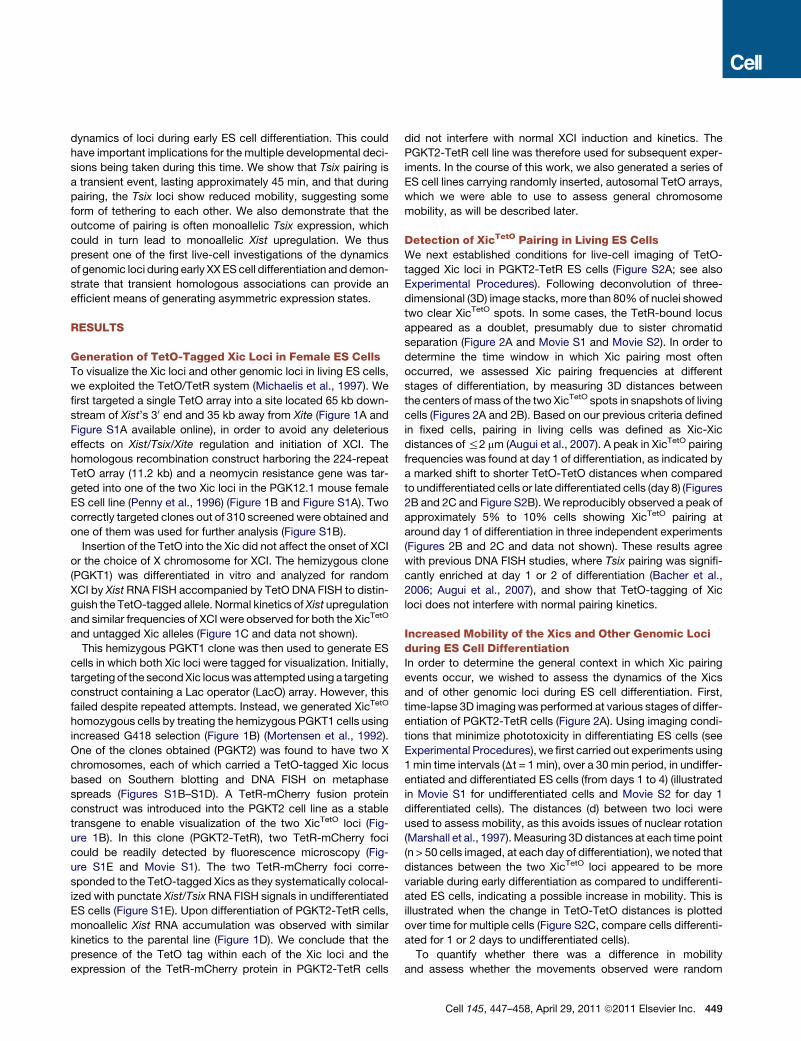
Figure 1. Generation of XicTetO Homozy-
gous Female ES Cells
(A) A map of the Xic locus and the position of the
TetO integration is indicated. Arrows indicate the
transcription direction of each gene. Broken lines
represent putative noncoding transcripts.
(B) Schematic representation of the strategy used
to generate PGKT2-TetR cells. The TetO array can
be bound by TetR-mCherry and used to visualize
the locus in living cells.
(C) DNA/RNA FISH for TetO (DNA FISH, green) and
Xist (RNA FISH, red) on PGKT1 cells at day 5 of
differentiation. Upper panels: Xist RNA accumu-
lates on non-TetO-targeted X chromosome.
Lower panels: Xist accumulates on TetO-targeted
X chromosome (n = 64).
(D) Kinetics of Xist RNA accumulation in parental
PGK12.1 cells and in the TetO-targeted PGKT2-
TetR cells (n > 100 per day of differentiation).
Representative pictures for undifferentiated and
day 3 differentiated PGKT2-TetR cells are indi-
cated (green, Xist RNA).
See also Figure S1.
upregulated, not both. Stochastic Xist expression models might
partly explain this (Monkhorst et al., 2008), but the surprisingly
low frequency of biallelic Xist upregulation during the initiation
of XCI in mice suggests that some other means of ensuring
precise monoallelic regulation exists.
Recently it was shown that the two Xic loci undergo transient
homologous associations (pairing) during early differentiation,
and it was proposed that this might play a role in the monoallelic
regulation of Xist and Tsix during initiation of XCI (Bacher et al.,
448 Cell 145, 447–458, April 29, 2011 ª2011 Elsevier Inc.
2006; Xu et al., 2006, 2007; Augui et al.,
2007). Associations between homolo-
gous chromosomal loci have been
proposed to underlie the establishment
of opposite states of transcriptional
activity on homologous alleles in other
situations, for example, during immuno-
globulin recombination in B cell develop-
ment (Hewitt et al., 2009). In the case of X
inactivation, pairing via the Xpr locus (Fig-
ure 1A) has been proposed to help bring
together and facilitate pairing at the Tsix
loci (Augui et al., 2007), which in turn is
proposed to enable coordination of
monoallelic Tsix expression and recip-
rocal Xist expression (Xu et al., 2007;
Scialdone and Nicodemi, 2008). In
support of this, deletion of both alleles
of Tsix in females results in chaotic XCI,
with biallelic or no Xist upregulation in
a significant proportion of cells (Lee,
2005). However, the coordinating role of
Tsix pairing in monoallelic XCI has never
been tested experimentally, and the
actual relationship between Xic pairing
and Xist/Tsix regulation has remained
unclear, partly because of the asynchronous nature and hetero-
geneity of early differentiating ES cells, which renders the precise
ordering of events impossible in fixed cells, where only snap-
shots of dynamic events can be obtained.
In this paper, we set out to examine the dynamics of X chromo-
some pairing and its possible outcome, using the Tet operator/
Tet repressor (TetO/TetR) tagging system in living ES cells.
Both the Xic loci as well as other autosomal regions were visual-
ized in real time in this way. We find a general increase in the
dynamics of loci during early ES cell differentiation. This could
have important implications for the multiple developmental deci-
sions being taken during this time. We show that Tsix pairing is
a transient event, lasting approximately 45 min, and that during
pairing, the Tsix loci show reduced mobility, suggesting some
form of tethering to each other. We also demonstrate that the
outcome of pairing is often monoallelic Tsix expression, which
could in turn lead to monoallelic Xist upregulation. We thus
present one of the first live-cell investigations of the dynamics
of genomic loci during early XXES cell differentiation anddemon-
strate that transient homologous associations can provide an
efficient means of generating asymmetric expression states.
RESULTS
Generation of TetO-Tagged Xic Loci in Female ES CellsTo visualize the Xic loci and other genomic loci in living ES cells,
we exploited the TetO/TetR system (Michaelis et al., 1997). We
first targeted a single TetO array into a site located 65 kb down-
stream of Xist’s 30 end and 35 kb away from Xite (Figure 1A and
Figure S1A available online), in order to avoid any deleterious
effects on Xist/Tsix/Xite regulation and initiation of XCI. The
homologous recombination construct harboring the 224-repeat
TetO array (11.2 kb) and a neomycin resistance gene was tar-
geted into one of the two Xic loci in the PGK12.1 mouse female
ES cell line (Penny et al., 1996) (Figure 1B and Figure S1A). Two
correctly targeted clones out of 310 screened were obtained and
one of them was used for further analysis (Figure S1B).
Insertion of the TetO into the Xic did not affect the onset of XCI
or the choice of X chromosome for XCI. The hemizygous clone
(PGKT1) was differentiated in vitro and analyzed for random
XCI by Xist RNA FISH accompanied by TetO DNA FISH to distin-
guish the TetO-tagged allele. Normal kinetics ofXist upregulation
and similar frequencies of XCI were observed for both the XicTetO
and untagged Xic alleles (Figure 1C and data not shown).
This hemizygous PGKT1 clone was then used to generate ES
cells in which both Xic loci were tagged for visualization. Initially,
targeting of the secondXic locuswas attempted using a targeting
construct containing a Lac operator (LacO) array. However, this
failed despite repeated attempts. Instead, we generated XicTetO
homozygous cells by treating the hemizygous PGKT1 cells using
increased G418 selection (Figure 1B) (Mortensen et al., 1992).
One of the clones obtained (PGKT2) was found to have two X
chromosomes, each of which carried a TetO-tagged Xic locus
based on Southern blotting and DNA FISH on metaphase
spreads (Figures S1B–S1D). A TetR-mCherry fusion protein
construct was introduced into the PGKT2 cell line as a stable
transgene to enable visualization of the two XicTetO loci (Fig-
ure 1B). In this clone (PGKT2-TetR), two TetR-mCherry foci
could be readily detected by fluorescence microscopy (Fig-
ure S1E and Movie S1). The two TetR-mCherry foci corre-
sponded to the TetO-tagged Xics as they systematically colocal-
ized with punctate Xist/Tsix RNA FISH signals in undifferentiated
ES cells (Figure S1E). Upon differentiation of PGKT2-TetR cells,
monoallelic Xist RNA accumulation was observed with similar
kinetics to the parental line (Figure 1D). We conclude that the
presence of the TetO tag within each of the Xic loci and the
expression of the TetR-mCherry protein in PGKT2-TetR cells
did not interfere with normal XCI induction and kinetics. The
PGKT2-TetR cell line was therefore used for subsequent exper-
iments. In the course of this work, we also generated a series of
ES cell lines carrying randomly inserted, autosomal TetO arrays,
which we were able to use to assess general chromosome
mobility, as will be described later.
Detection of XicTetO Pairing in Living ES CellsWe next established conditions for live-cell imaging of TetO-
tagged Xic loci in PGKT2-TetR ES cells (Figure S2A; see also
Experimental Procedures). Following deconvolution of three-
dimensional (3D) image stacks, more than 80%of nuclei showed
two clear XicTetO spots. In some cases, the TetR-bound locus
appeared as a doublet, presumably due to sister chromatid
separation (Figure 2A and Movie S1 and Movie S2). In order to
determine the time window in which Xic pairing most often
occurred, we assessed Xic pairing frequencies at different
stages of differentiation, by measuring 3D distances between
the centers ofmass of the two XicTetO spots in snapshots of living
cells (Figures 2A and 2B). Based on our previous criteria defined
in fixed cells, pairing in living cells was defined as Xic-Xic
distances of%2 mm (Augui et al., 2007). A peak in XicTetO pairing
frequencies was found at day 1 of differentiation, as indicated by
a marked shift to shorter TetO-TetO distances when compared
to undifferentiated cells or late differentiated cells (day 8) (Figures
2B and 2C and Figure S2B). We reproducibly observed a peak of
approximately 5% to 10% cells showing XicTetO pairing at
around day 1 of differentiation in three independent experiments
(Figures 2B and 2C and data not shown). These results agree
with previous DNA FISH studies, where Tsix pairing was signifi-
cantly enriched at day 1 or 2 of differentiation (Bacher et al.,
2006; Augui et al., 2007), and show that TetO-tagging of Xic
loci does not interfere with normal pairing kinetics.
Increased Mobility of the Xics and Other Genomic Lociduring ES Cell DifferentiationIn order to determine the general context in which Xic pairing
events occur, we wished to assess the dynamics of the Xics
and of other genomic loci during ES cell differentiation. First,
time-lapse 3D imagingwas performed at various stages of differ-
entiation of PGKT2-TetR cells (Figure 2A). Using imaging condi-
tions that minimize phototoxicity in differentiating ES cells (see
Experimental Procedures), we first carried out experiments using
1 min time intervals (Dt = 1 min), over a 30min period, in undiffer-
entiated and differentiated ES cells (from days 1 to 4) (illustrated
in Movie S1 for undifferentiated cells and Movie S2 for day 1
differentiated cells). The distances (d) between two loci were
used to assess mobility, as this avoids issues of nuclear rotation
(Marshall et al., 1997).Measuring 3Ddistances at each time point
(n > 50 cells imaged, at each day of differentiation), we noted that
distances between the two XicTetO loci appeared to be more
variable during early differentiation as compared to undifferenti-
ated ES cells, indicating a possible increase in mobility. This is
illustrated when the change in TetO-TetO distances is plotted
over time for multiple cells (Figure S2C, compare cells differenti-
ated for 1 or 2 days to undifferentiated cells).
To quantify whether there was a difference in mobility
and assess whether the movements observed were random
Cell 145, 447–458, April 29, 2011 ª2011 Elsevier Inc. 449
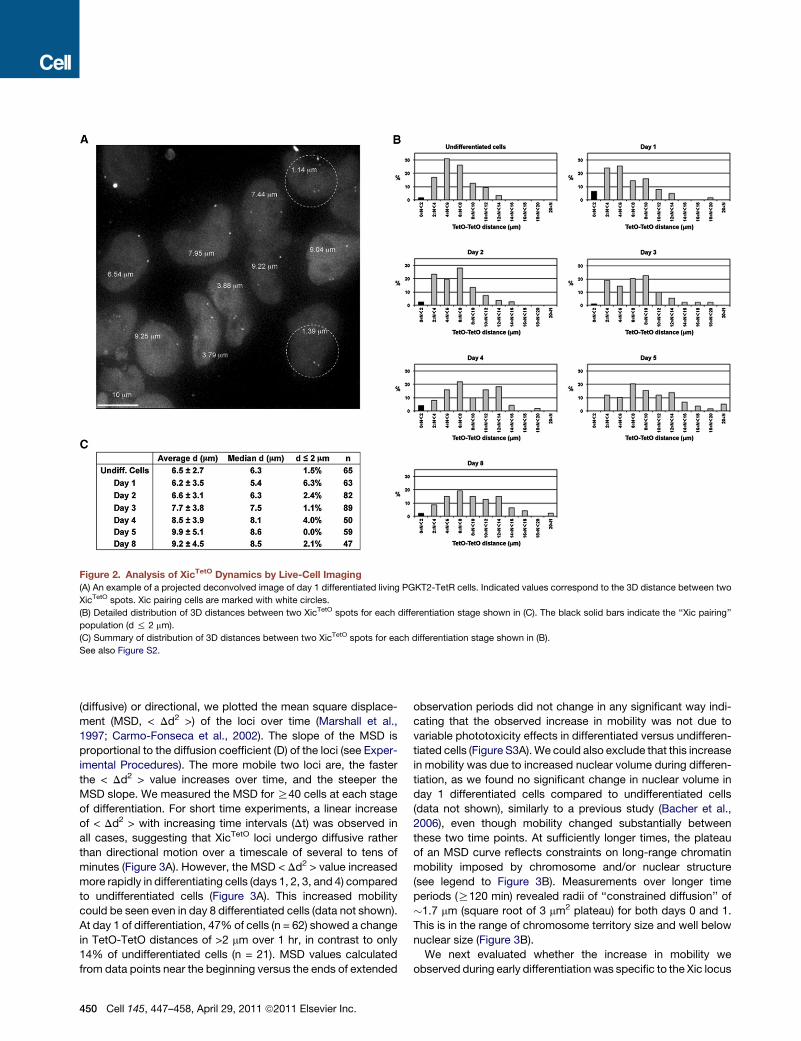
Figure 2. Analysis of XicTetO Dynamics by Live-Cell Imaging
(A) An example of a projected deconvolved image of day 1 differentiated living PGKT2-TetR cells. Indicated values correspond to the 3D distance between two
XicTetO spots. Xic pairing cells are marked with white circles.
(B) Detailed distribution of 3D distances between two XicTetO spots for each differentiation stage shown in (C). The black solid bars indicate the ‘‘Xic pairing’’
population (d % 2 mm).
(C) Summary of distribution of 3D distances between two XicTetO spots for each differentiation stage shown in (B).
See also Figure S2.
(diffusive) or directional, we plotted the mean square displace-
ment (MSD, < Dd2 >) of the loci over time (Marshall et al.,
1997; Carmo-Fonseca et al., 2002). The slope of the MSD is
proportional to the diffusion coefficient (D) of the loci (see Exper-
imental Procedures). The more mobile two loci are, the faster
the < Dd2 > value increases over time, and the steeper the
MSD slope. We measured the MSD for R40 cells at each stage
of differentiation. For short time experiments, a linear increase
of < Dd2 > with increasing time intervals (Dt) was observed in
all cases, suggesting that XicTetO loci undergo diffusive rather
than directional motion over a timescale of several to tens of
minutes (Figure 3A). However, the MSD < Dd2 > value increased
more rapidly in differentiating cells (days 1, 2, 3, and 4) compared
to undifferentiated cells (Figure 3A). This increased mobility
could be seen even in day 8 differentiated cells (data not shown).
At day 1 of differentiation, 47% of cells (n = 62) showed a change
in TetO-TetO distances of >2 mm over 1 hr, in contrast to only
14% of undifferentiated cells (n = 21). MSD values calculated
from data points near the beginning versus the ends of extended
450 Cell 145, 447–458, April 29, 2011 ª2011 Elsevier Inc.
observation periods did not change in any significant way indi-
cating that the observed increase in mobility was not due to
variable phototoxicity effects in differentiated versus undifferen-
tiated cells (Figure S3A).We could also exclude that this increase
in mobility was due to increased nuclear volume during differen-
tiation, as we found no significant change in nuclear volume in
day 1 differentiated cells compared to undifferentiated cells
(data not shown), similarly to a previous study (Bacher et al.,
2006), even though mobility changed substantially between
these two time points. At sufficiently longer times, the plateau
of an MSD curve reflects constraints on long-range chromatin
mobility imposed by chromosome and/or nuclear structure
(see legend to Figure 3B). Measurements over longer time
periods (R120 min) revealed radii of ‘‘constrained diffusion’’ of
�1.7 mm (square root of 3 mm2 plateau) for both days 0 and 1.
This is in the range of chromosome territory size and well below
nuclear size (Figure 3B).
We next evaluated whether the increase in mobility we
observed during early differentiation was specific to the Xic locus
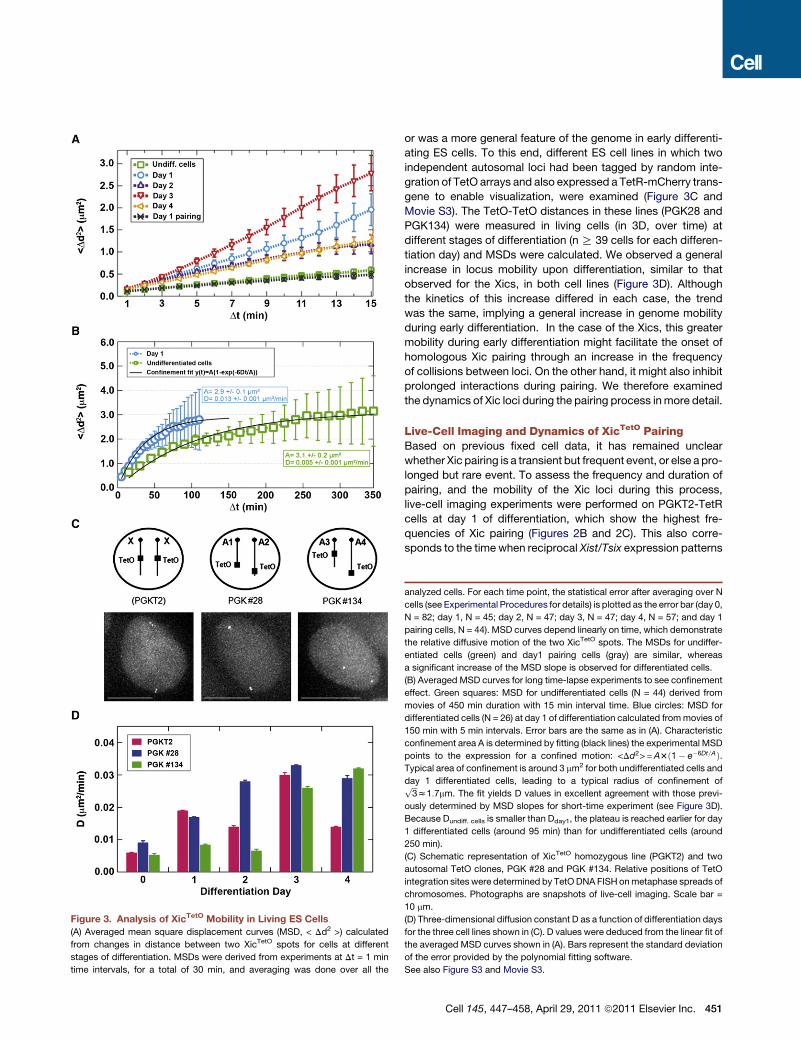
Figure 3. Analysis of XicTetO Mobility in Living ES Cells
(A) Averaged mean square displacement curves (MSD, < Dd2 >) calculated
from changes in distance between two XicTetO spots for cells at different
stages of differentiation. MSDs were derived from experiments at Dt = 1 min
time intervals, for a total of 30 min, and averaging was done over all the
or was a more general feature of the genome in early differenti-
ating ES cells. To this end, different ES cell lines in which two
independent autosomal loci had been tagged by random inte-
gration of TetO arrays and also expressed a TetR-mCherry trans-
gene to enable visualization, were examined (Figure 3C and
Movie S3). The TetO-TetO distances in these lines (PGK28 and
PGK134) were measured in living cells (in 3D, over time) at
different stages of differentiation (n R 39 cells for each differen-
tiation day) and MSDs were calculated. We observed a general
increase in locus mobility upon differentiation, similar to that
observed for the Xics, in both cell lines (Figure 3D). Although
the kinetics of this increase differed in each case, the trend
was the same, implying a general increase in genome mobility
during early differentiation. In the case of the Xics, this greater
mobility during early differentiation might facilitate the onset of
homologous Xic pairing through an increase in the frequency
of collisions between loci. On the other hand, it might also inhibit
prolonged interactions during pairing. We therefore examined
the dynamics of Xic loci during the pairing process inmore detail.
Live-Cell Imaging and Dynamics of XicTetO PairingBased on previous fixed cell data, it has remained unclear
whether Xic pairing is a transient but frequent event, or else a pro-
longed but rare event. To assess the frequency and duration of
pairing, and the mobility of the Xic loci during this process,
live-cell imaging experiments were performed on PGKT2-TetR
cells at day 1 of differentiation, which show the highest fre-
quencies of Xic pairing (Figures 2B and 2C). This also corre-
sponds to the time when reciprocal Xist/Tsix expression patterns
analyzed cells. For each time point, the statistical error after averaging over N
cells (see Experimental Procedures for details) is plotted as the error bar (day 0,
N = 82; day 1, N = 45; day 2, N = 47; day 3, N = 47; day 4, N = 57; and day 1
pairing cells, N = 44). MSD curves depend linearly on time, which demonstrate
the relative diffusive motion of the two XicTetO spots. The MSDs for undiffer-
entiated cells (green) and day1 pairing cells (gray) are similar, whereas
a significant increase of the MSD slope is observed for differentiated cells.
(B) Averaged MSD curves for long time-lapse experiments to see confinement
effect. Green squares: MSD for undifferentiated cells (N = 44) derived from
movies of 450 min duration with 15 min interval time. Blue circles: MSD for
differentiated cells (N = 26) at day 1 of differentiation calculated frommovies of
150 min with 5 min intervals. Error bars are the same as in (A). Characteristic
confinement area A is determined by fitting (black lines) the experimental MSD
points to the expression for a confined motion: <Dd2>=A3ð1� e�6Dt=AÞ.Typical area of confinement is around 3 mm2 for both undifferentiated cells and
day 1 differentiated cells, leading to a typical radius of confinement offfiffiffi
3p
z1:7mm. The fit yields D values in excellent agreement with those previ-
ously determined by MSD slopes for short-time experiment (see Figure 3D).
Because Dundiff. cells is smaller than Dday1, the plateau is reached earlier for day
1 differentiated cells (around 95 min) than for undifferentiated cells (around
250 min).
(C) Schematic representation of XicTetO homozygous line (PGKT2) and two
autosomal TetO clones, PGK #28 and PGK #134. Relative positions of TetO
integration sites were determined by TetODNA FISH onmetaphase spreads of
chromosomes. Photographs are snapshots of live-cell imaging. Scale bar =
10 mm.
(D) Three-dimensional diffusion constant D as a function of differentiation days
for the three cell lines shown in (C). D values were deduced from the linear fit of
the averaged MSD curves shown in (A). Bars represent the standard deviation
of the error provided by the polynomial fitting software.
See also Figure S3 and Movie S3.
Cell 145, 447–458, April 29, 2011 ª2011 Elsevier Inc. 451
are first seen. Time-lapse imaging was performed on cells for
30min periods, with 1min intervals. We noted that in themajority
of cells where Xic pairing (distances% 2 mm) was detected, both
XicTetO loci showed separated sister chromatids (84.1%, n = 44)
in at least one frame of the 30 min time-lapse movie. Repeated
overlap and separation between sister chromatids could be
seen on the minute timescale (for example, Movie S1and Movie
S4). The detection of sister chromatids at both loci implies that
DNA replication must have been completed prior to Xic pairing.
Indeed, this is consistent with our previous DNA FISH studies
on FACS-sorted cells (Augui et al., 2007), where we found that
pairing occurs in S phase after Xic DNA replication. To assess
Xic mobility during pairing, we calculated the MSD of the loci in
cells displaying Xic distances of less than 2 mm. As shown in Fig-
ure 3A and Figure S3B, XicTetO loci in cells where pairing is
ongoing have a remarkably reduced range of movement
compared to the total population at day 1 of differentiation.
Thus, once the two Xics encounter each other and pairing initi-
ates, the loci become restrained, even in the context of a general
increase in mobility during early differentiation. The reduced
mobility of the loci observed during pairing would suggest that
they may be tethered either to each other or to a common
nuclear compartment that provides an additional restraint to
that of each polymer to its chromosome.
We also assessed whether XicTetO loci ever showed complete
overlap (i.e., d = 0 mm) during the course of pairing (i.e., d %
2 mm). In experiments where 1 min time intervals were used
during imaging, the loci did show occasional complete overlap
(6.8%, n = 44), although this lasted for only a few minutes at
a time (Figure 4A and Movie S4) and was not seen in all cells.
Given the transient nature of the overlap, it may actually occur
more frequently but would not be captured with the imaging
intervals we used.
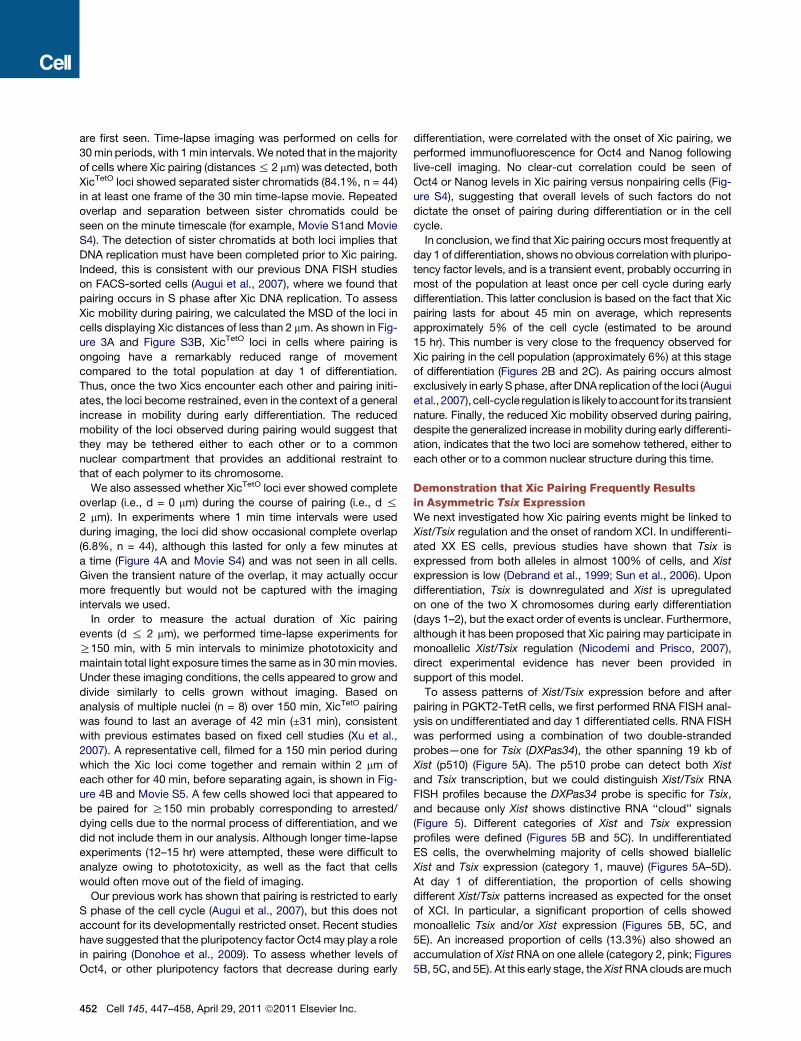
In order to measure the actual duration of Xic pairing
events (d % 2 mm), we performed time-lapse experiments for
R150 min, with 5 min intervals to minimize phototoxicity and
maintain total light exposure times the same as in 30minmovies.
Under these imaging conditions, the cells appeared to grow and
divide similarly to cells grown without imaging. Based on
analysis of multiple nuclei (n = 8) over 150 min, XicTetO pairing
was found to last an average of 42 min (±31 min), consistent
with previous estimates based on fixed cell studies (Xu et al.,
2007). A representative cell, filmed for a 150 min period during
which the Xic loci come together and remain within 2 mm of
each other for 40 min, before separating again, is shown in Fig-
ure 4B and Movie S5. A few cells showed loci that appeared to
be paired for R150 min probably corresponding to arrested/
dying cells due to the normal process of differentiation, and we
did not include them in our analysis. Although longer time-lapse
experiments (12–15 hr) were attempted, these were difficult to
analyze owing to phototoxicity, as well as the fact that cells
would often move out of the field of imaging.
Our previous work has shown that pairing is restricted to early
S phase of the cell cycle (Augui et al., 2007), but this does not
account for its developmentally restricted onset. Recent studies
have suggested that the pluripotency factor Oct4 may play a role
in pairing (Donohoe et al., 2009). To assess whether levels of
Oct4, or other pluripotency factors that decrease during early
452 Cell 145, 447–458, April 29, 2011 ª2011 Elsevier Inc.
differentiation, were correlated with the onset of Xic pairing, we
performed immunofluorescence for Oct4 and Nanog following
live-cell imaging. No clear-cut correlation could be seen of
Oct4 or Nanog levels in Xic pairing versus nonpairing cells (Fig-
ure S4), suggesting that overall levels of such factors do not
dictate the onset of pairing during differentiation or in the cell
cycle.
In conclusion, we find that Xic pairing occursmost frequently at
day 1 of differentiation, shows no obvious correlation with pluripo-
tency factor levels, and is a transient event, probably occurring in
most of the population at least once per cell cycle during early
differentiation. This latter conclusion is based on the fact that Xic
pairing lasts for about 45 min on average, which represents
approximately 5% of the cell cycle (estimated to be around
15 hr). This number is very close to the frequency observed for
Xic pairing in the cell population (approximately 6%) at this stage
of differentiation (Figures 2B and 2C). As pairing occurs almost
exclusively in early S phase, after DNA replication of the loci (Augui
etal., 2007), cell-cycle regulation is likely toaccount for its transient
nature. Finally, the reduced Xic mobility observed during pairing,
despite the generalized increase inmobility during early differenti-
ation, indicates that the two loci are somehow tethered, either to
each other or to a common nuclear structure during this time.
Demonstration that Xic Pairing Frequently Resultsin Asymmetric Tsix ExpressionWe next investigated how Xic pairing events might be linked to
Xist/Tsix regulation and the onset of random XCI. In undifferenti-
ated XX ES cells, previous studies have shown that Tsix is
expressed from both alleles in almost 100% of cells, and Xist
expression is low (Debrand et al., 1999; Sun et al., 2006). Upon
differentiation, Tsix is downregulated and Xist is upregulated
on one of the two X chromosomes during early differentiation
(days 1–2), but the exact order of events is unclear. Furthermore,
although it has been proposed that Xic pairing may participate in
monoallelic Xist/Tsix regulation (Nicodemi and Prisco, 2007),
direct experimental evidence has never been provided in
support of this model.
To assess patterns of Xist/Tsix expression before and after
pairing in PGKT2-TetR cells, we first performed RNA FISH anal-
ysis on undifferentiated and day 1 differentiated cells. RNA FISH
was performed using a combination of two double-stranded
probes—one for Tsix (DXPas34), the other spanning 19 kb of
Xist (p510) (Figure 5A). The p510 probe can detect both Xist
and Tsix transcription, but we could distinguish Xist/Tsix RNA
FISH profiles because the DXPas34 probe is specific for Tsix,
and because only Xist shows distinctive RNA ‘‘cloud’’ signals
(Figure 5). Different categories of Xist and Tsix expression
profiles were defined (Figures 5B and 5C). In undifferentiated
ES cells, the overwhelming majority of cells showed biallelic
Xist and Tsix expression (category 1, mauve) (Figures 5A–5D).
At day 1 of differentiation, the proportion of cells showing
different Xist/Tsix patterns increased as expected for the onset
of XCI. In particular, a significant proportion of cells showed
monoallelic Tsix and/or Xist expression (Figures 5B, 5C, and
5E). An increased proportion of cells (13.3%) also showed an
accumulation of Xist RNA on one allele (category 2, pink; Figures
5B, 5C, and 5E). At this early stage, theXistRNA clouds aremuch
Figure 4. Time-Lapse Live-Cell Imaging of Xic
Pairing Events in Early Differentiating ES Cells
(A) Representative snapshots of a day 1 differentiated
PGKT2-TetR cell imaged over 30 min period at 1 min time
intervals. Note that the two XicTetO loci show complete
overlap at the 21 min time point. Open circles: Xic pairing
(d % 2 mm). Scale bar = 10 mm. The whole movie is
available as Movie S4.
(B) A representative image of a day 1 differentiated
PGKT2-TetR cell imaged over 150 min at 5 min intervals.
Note that the two XicTetO loci show pairing (%2 mm, open
circle) for 40 min (from the 55 min to the 95 min time
points), and they show closest proximity at the 75min time
point. Scale bar = 10 mm. See also Movie S5.
Cell 145, 447–458, April 29, 2011 ª2011 Elsevier Inc. 453
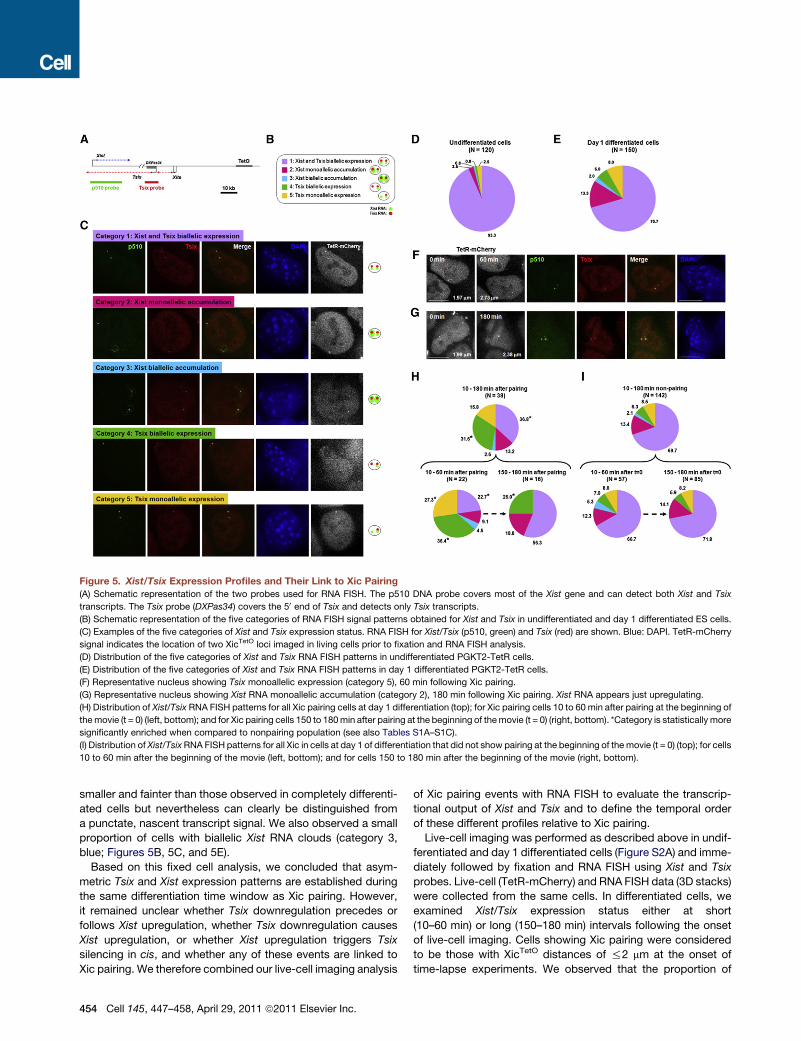
Figure 5. Xist/Tsix Expression Profiles and Their Link to Xic Pairing
(A) Schematic representation of the two probes used for RNA FISH. The p510 DNA probe covers most of the Xist gene and can detect both Xist and Tsix
transcripts. The Tsix probe (DXPas34) covers the 50 end of Tsix and detects only Tsix transcripts.
(B) Schematic representation of the five categories of RNA FISH signal patterns obtained for Xist and Tsix in undifferentiated and day 1 differentiated ES cells.
(C) Examples of the five categories of Xist and Tsix expression status. RNA FISH for Xist/Tsix (p510, green) and Tsix (red) are shown. Blue: DAPI. TetR-mCherry
signal indicates the location of two XicTetO loci imaged in living cells prior to fixation and RNA FISH analysis.
(D) Distribution of the five categories of Xist and Tsix RNA FISH patterns in undifferentiated PGKT2-TetR cells.
(E) Distribution of the five categories of Xist and Tsix RNA FISH patterns in day 1 differentiated PGKT2-TetR cells.
(F) Representative nucleus showing Tsix monoallelic expression (category 5), 60 min following Xic pairing.
(G) Representative nucleus showing Xist RNA monoallelic accumulation (category 2), 180 min following Xic pairing. Xist RNA appears just upregulating.
(H) Distribution of Xist/Tsix RNA FISH patterns for all Xic pairing cells at day 1 differentiation (top); for Xic pairing cells 10 to 60 min after pairing at the beginning of
themovie (t = 0) (left, bottom); and for Xic pairing cells 150 to 180min after pairing at the beginning of themovie (t = 0) (right, bottom). *Category is statistically more
significantly enriched when compared to nonpairing population (see also Tables S1A–S1C).
(I) Distribution of Xist/TsixRNA FISH patterns for all Xic in cells at day 1 of differentiation that did not show pairing at the beginning of the movie (t = 0) (top); for cells
10 to 60 min after the beginning of the movie (left, bottom); and for cells 150 to 180 min after the beginning of the movie (right, bottom).
smaller and fainter than those observed in completely differenti-
ated cells but nevertheless can clearly be distinguished from
a punctate, nascent transcript signal. We also observed a small
proportion of cells with biallelic Xist RNA clouds (category 3,
blue; Figures 5B, 5C, and 5E).
Based on this fixed cell analysis, we concluded that asym-
metric Tsix and Xist expression patterns are established during
the same differentiation time window as Xic pairing. However,
it remained unclear whether Tsix downregulation precedes or
follows Xist upregulation, whether Tsix downregulation causes
Xist upregulation, or whether Xist upregulation triggers Tsix
silencing in cis, and whether any of these events are linked to
Xic pairing. We therefore combined our live-cell imaging analysis
454 Cell 145, 447–458, April 29, 2011 ª2011 Elsevier Inc.
of Xic pairing events with RNA FISH to evaluate the transcrip-
tional output of Xist and Tsix and to define the temporal order
of these different profiles relative to Xic pairing.
Live-cell imaging was performed as described above in undif-
ferentiated and day 1 differentiated cells (Figure S2A) and imme-
diately followed by fixation and RNA FISH using Xist and Tsix
probes. Live-cell (TetR-mCherry) and RNA FISH data (3D stacks)
were collected from the same cells. In differentiated cells, we
examined Xist/Tsix expression status either at short
(10–60 min) or long (150–180 min) intervals following the onset
of live-cell imaging. Cells showing Xic pairing were considered
to be those with XicTetO distances of %2 mm at the onset of
time-lapse experiments. We observed that the proportion of
cells showing monoallelic Tsix expression (category 5, yellow)
was higher in cells that had undergone pairing than in those
that had not shown pairing (Figures 5E, 5H, and 5I; Table S1A).
Moreover, monoallelic Tsix expression was found to be signifi-
cantly enriched in cells at short (10–60min) intervals after pairing,
as compared to the cells that had not shown pairing ( p = 0.0083)
(Figures 5C, 5F, 5H, and 5I; Table S1B). The proportion of
category 2 (pink) cells with monoallelic Xist RNA accumulation
also increased after Xic pairing, but only at later intervals (150–
180 min) after pairing (Figures 5C, 5G, and 5H; Table S1C).
Tsix, on the other hand, had returned to a biallelic expression
state (category 2) at these later time intervals when increased
Xist RNA upregulation is seen (Figure 5G). Thus, Tsix expression
on one of the two alleles is extinguished transiently after pairing
(10–60 min), but the silent Tsix allele is re-expressed 1–2 hr later.
In summary, our findings combine real-time visualization of Xic
pairing with analysis of Xist/Tsix expression status to define the
precise order and potential causality of events at this critical
decision-making time during XCI. We reveal dynamic changes
in Xist/Tsix expression patterns following transient Xic interac-
tions, with one of the two Tsix alleles being frequently silenced
immediately (0–60 min) after pairing. The loss of Tsix-mediated
repression on one allele may allow monoallelic Xist upregulation
on that allele, as indicated by the increase in monoallelic Xist
RNA accumulation observed subsequently (1–2 hr after pairing).
By this time, however, the transiently silenced Tsix allele is re-ex-
pressed on the allele that has started to accumulate Xist RNA.
Nevertheless, in cells that upregulate Xist, Tsix will eventually
become silenced in cis. It should be noted that the transient
Tsix asymmetry induced by Xic pairing may sometimes be
unproductive as some cells revert to biallelic expression of Tsix
with no Xist upregulation 1–2 hr later. However, as Xic pairing
can occur not only at day 1 of differentiation but also at later
time points (Augui et al., 2007; Xu et al., 2007), there would be
an opportunity at the next cell cycle to establish an asymmetric
Tsix/Xist expression profile. In conclusion, our findings demon-
strate that Tsix pairing provides a potential window of opportu-
nity for transient, asymmetric Tsix expression, which in turn
could enable monoallelic Xist upregulation in cis and could
thus be a key event in the choice step during XCI initiation.
DISCUSSION
Inter- and intrachromosomal interactions in the nucleus have
been increasingly linked to gene regulation and/or the coordina-
tion of gene expression (for reviews see Williams et al., 2010 and
Schoenfelder et al., 2010). Knowledge of the exact outcome of
such trans-associations, at the level of gene expression, has
been lacking, however, as studies so far were performed only
in fixed cells, which can only provide snapshots and do not allow
precise ordering of dynamic events. Here, we describe the
in vivo dynamics and outcome of homologous trans-interactions
that occur between the two Tsix loci on X chromosomes during
the initiation of XCI in differentiating female ES cells. This study
provides one of the first in vivo spatiotemporal analyses of chro-
mosomal dynamics and homologous chromosomal interactions
in ES cells. Our data support the hypothesis that pairing at the Xic
loci can facilitate the establishment of asymmetric expression
patterns. We also demonstrate that such events occur in the
context of increasing genome dynamics during early differentia-
tion. Live-cell imaging of the Xics and of other, autosomal loci
that we present here provides important insights into locus
mobility in ES cells and their early differentiated derivatives.
The mobility of loci that we found in undifferentiated ES cells
(�0.01 mm2/min) is in fact similar to values previously observed
for loci in transformed human cell lines (�0.008 mm2/min) (Chubb
et al., 2002). The motion we detected for the Xic loci in ES cells
corresponded to constrained diffusion, with a radius of con-
straint of �1.7 mm, which could correspond to the degree of
constraint in a chromosome territory. Indeed, the Xic has been
previously shown not to loop out of its territory to any significant
extent (Augui et al., 2007). In the course of our analyses, we
observed no signs of significant directional long-range move-
ments, such as those described following induction by transcrip-
tional activators in somatic cells (Chuang et al., 2006). However,
we did find an increase in locus mobility during early differentia-
tion. The mobility reached after 1–3 days of differentiation
approximates to the ‘‘rapid’’ motion observed following induc-
tion of specific loci by transcriptional activators (Chuang et al.,
2006). This increase in locus mobility may be a general charac-
teristic of the early differentiating ES cell genome, as we
observed a similar increase for all loci examined. Intriguingly,
chromatin dynamics (histone exchange) has been reported to
decrease during differentiation of ES cells (Meshorer et al.,
2006). However, chromosome dynamics, which is a different
(though possibly related) phenomenon than chromatin
dynamics, had not so far been evaluated. Our results open up
the possibility that increasing dynamics of genomic loci may
accompany, or even participate in, the changes in gene activity
underlying lineage-specific decisions in differentiating ES cells.
This would be consistent with the recent proposal that chromo-
some position and configuration change during differentiation
(Rajapakse et al., 2009). The increased mobility of genomic loci
that we have detected may reflect active chromatin-remodeling
movements within the nucleus, as has been reported in yeast
nuclei (Gartenberg et al., 2004), and/or be symptomatic of
increased cytoskeletal movements, which could impose move-
ment and deformation on the nuclear envelope and its contents.
Whatever the underlying cause of increased Xic mobility
during early differentiation, we believe that this might facilitate
the onset of pairing by increasing the frequency of collisions
between loci and/or with different nuclear compartments (Fig-
ure 6). However, once they have collided, the Xic loci remain
tethered to each other (or to a specific nuclear compartment)
as there is a marked decrease in mobility during pairing. Such
tethering could occur via specific sequences in the Xic, or via
association with a common nuclear compartment. So far, none
of the nuclear compartments we have examined, such as
nucleoli, the nuclear envelope, or replication foci, appear to be
specific sites of Xic pairing (Bacher et al., 2006; Augui et al.,
2007; and O.M., N.M., and E.H., unpublished data). Although
DNA-binding factors, such as CTCF and Oct4, have been impli-
cated in pairing (Xu et al., 2007; Donohoe et al., 2009), the
ubiquitous nature of their binding is unlikely to explain the spec-
ificity of Xic pairing. Xic elements such as the Xpr locus may
facilitate such specificity. Unlike Tsix, Xpr can pair autonomously
Cell 145, 447–458, April 29, 2011 ª2011 Elsevier Inc. 455
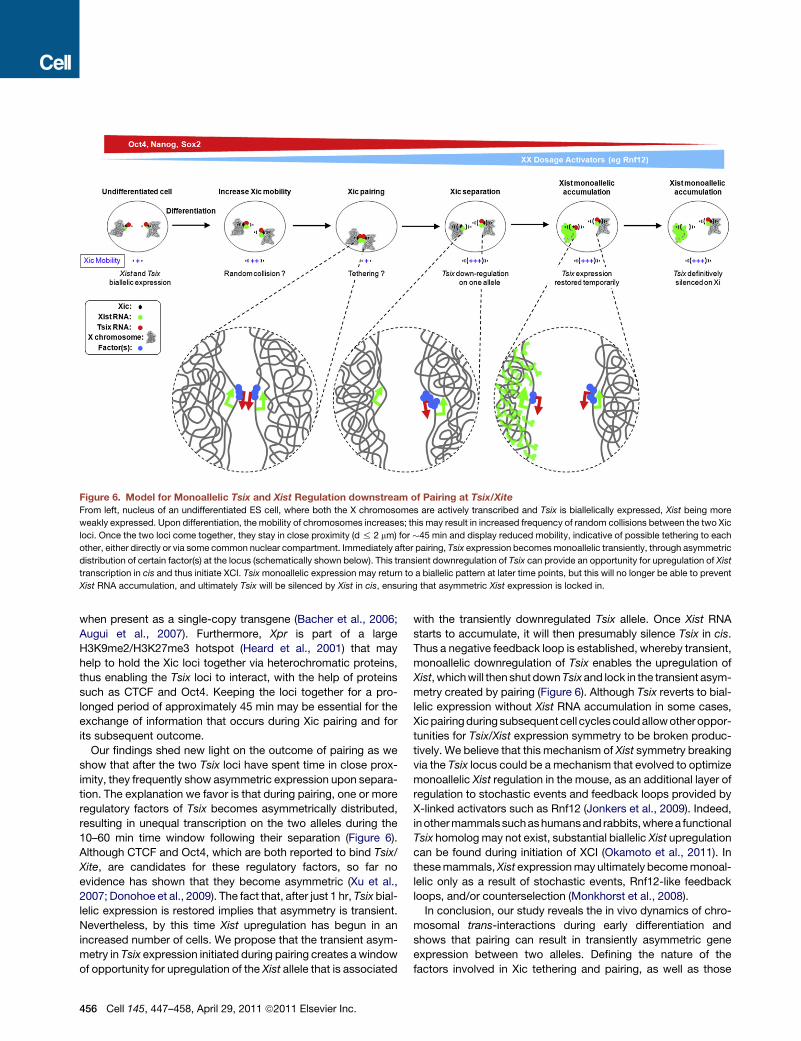
Figure 6. Model for Monoallelic Tsix and Xist Regulation downstream of Pairing at Tsix/Xite
From left, nucleus of an undifferentiated ES cell, where both the X chromosomes are actively transcribed and Tsix is biallelically expressed, Xist being more
weakly expressed. Upon differentiation, the mobility of chromosomes increases; this may result in increased frequency of random collisions between the two Xic
loci. Once the two loci come together, they stay in close proximity (d % 2 mm) for �45 min and display reduced mobility, indicative of possible tethering to each
other, either directly or via some common nuclear compartment. Immediately after pairing, Tsix expression becomesmonoallelic transiently, through asymmetric
distribution of certain factor(s) at the locus (schematically shown below). This transient downregulation of Tsix can provide an opportunity for upregulation of Xist
transcription in cis and thus initiate XCI. Tsixmonoallelic expression may return to a biallelic pattern at later time points, but this will no longer be able to prevent
Xist RNA accumulation, and ultimately Tsix will be silenced by Xist in cis, ensuring that asymmetric Xist expression is locked in.
when present as a single-copy transgene (Bacher et al., 2006;
Augui et al., 2007). Furthermore, Xpr is part of a large
H3K9me2/H3K27me3 hotspot (Heard et al., 2001) that may
help to hold the Xic loci together via heterochromatic proteins,
thus enabling the Tsix loci to interact, with the help of proteins
such as CTCF and Oct4. Keeping the loci together for a pro-
longed period of approximately 45 min may be essential for the
exchange of information that occurs during Xic pairing and for
its subsequent outcome.
Our findings shed new light on the outcome of pairing as we
show that after the two Tsix loci have spent time in close prox-
imity, they frequently show asymmetric expression upon separa-
tion. The explanation we favor is that during pairing, one or more
regulatory factors of Tsix becomes asymmetrically distributed,
resulting in unequal transcription on the two alleles during the
10–60 min time window following their separation (Figure 6).
Although CTCF and Oct4, which are both reported to bind Tsix/
Xite, are candidates for these regulatory factors, so far no
evidence has shown that they become asymmetric (Xu et al.,
2007; Donohoe et al., 2009). The fact that, after just 1 hr, Tsix bial-
lelic expression is restored implies that asymmetry is transient.
Nevertheless, by this time Xist upregulation has begun in an
increased number of cells. We propose that the transient asym-
metry in Tsix expression initiated during pairing creates a window
of opportunity for upregulation of the Xist allele that is associated
456 Cell 145, 447–458, April 29, 2011 ª2011 Elsevier Inc.
with the transiently downregulated Tsix allele. Once Xist RNA
starts to accumulate, it will then presumably silence Tsix in cis.
Thus a negative feedback loop is established, whereby transient,
monoallelic downregulation of Tsix enables the upregulation of
Xist, whichwill thenshut downTsixand lock in the transient asym-
metry created by pairing (Figure 6). Although Tsix reverts to bial-
lelic expression without Xist RNA accumulation in some cases,
Xicpairingduring subsequent cell cyclescouldallowotheroppor-
tunities for Tsix/Xist expression symmetry to be broken produc-
tively. We believe that this mechanism of Xist symmetry breaking
via the Tsix locus could be amechanism that evolved to optimize
monoallelic Xist regulation in the mouse, as an additional layer of
regulation to stochastic events and feedback loops provided by
X-linked activators such as Rnf12 (Jonkers et al., 2009). Indeed,
inothermammals suchashumansand rabbits,wherea functional
Tsix homologmay not exist, substantial biallelic Xist upregulation
can be found during initiation of XCI (Okamoto et al., 2011). In
thesemammals,Xist expressionmay ultimately becomemonoal-
lelic only as a result of stochastic events, Rnf12-like feedback
loops, and/or counterselection (Monkhorst et al., 2008).
In conclusion, our study reveals the in vivo dynamics of chro-
mosomal trans-interactions during early differentiation and
shows that pairing can result in transiently asymmetric gene
expression between two alleles. Defining the nature of the
factors involved in Xic tethering and pairing, as well as those
that are exchanged and become transiently asymmetrically
distributed after pairing has occurred, represents the next
challenge. It will also be of interest to assess the degree to which
trans-interactions participate in establishing asymmetric gene
expression at loci other than the Xic, both in the context of
random monoallelic gene expression (for review, see Ohlsson,
2007), as well as for nonhomologous loci when developmental
decisions are being taken, and mutually exclusive expression
patterns may sometimes be required.
EXPERIMENTAL PROCEDURES
Cell Culture
Feeder-independent PGK12.1 mouse female ES cells were a gift from Neil
Brockdorff (Penny et al., 1996), and their culture has previously been described
in detail (Bacher et al., 2006; Augui et al., 2007). Briefly, ES cells were cultured
in DMEM with 15% FCS, 1000 U/ml LIF, and Penicillin-Streptomycin
(GIBCO) in 8% CO2. ES cells were grown on gelatin-coated glass coverslips.
Differentiation was induced in the presence of all-trans-retinoic acid, as
described previously (Rougeulle et al., 2004).
Plasmids and Constructs
To generate a targeting plasmid pSPO2/FAB/TetO for homologous recombi-
nation, two homology arms were PCR-amplified from mouse genomic DNA
with the primers (FA arm primers, 169 and 4756B; FB arm primers, 4756A
and 910B) as previously described (Clerc and Avner, 1998) and inserted into
the pSPO2 plasmid. The primer sequences are as follows: 169, 50-CATGA
GCTTTGCATCTAGGG-30; 4756B, 50-TGCCAGGACTTTGGAACA-30; 4756A, 50-CAAAGCCACACGGTTCAA-30; 910B, 50-ATTCAACTGCAAGTGAAT-30. Two
hundred and twenty-four copies of a TetO DNA array and Neomycin-resistant
cassette flankedwith loxP sequences were inserted between two homologous
arms. Plasmids were amplified with MaxStbl2-competent E. coli (Invitrogen).
N-terminal of mCherry open reading frame (ORF) was fused with the
C-terminal of TetR ORF on pBluescript plasmid (Stratagene), then the c-Myc
NLS sequence was inserted between two ORFs to generate TetR-NLS-
mCherry ORF. The TetR-NLS-mCherry ORF was inserted into the pBROAD3
expression plasmid (Invivogen) to generate pBROAD3/TetR-mycNLS-
mCherry. mCherry cDNA was a gift from Roger Tsien.
Gene Targeting and Southern Blotting
PGK12.1 cells were electroporated with NotI-linearized pSPO2/FAB/TetO
plasmid and selected with Neomycin (0.3 mg/ml). Colonies were picked and
screened by Southern blotting, using standard protocols. Briefly, extracted
genomic DNA was digested with PstI, then resolved on a 0.6% agarose gel.
The resolved DNA was transfered to Positive TM Membrane (Qbiogen) and
probed with 32P-labeled FD-1/2 DNA probe (generated with PCR primers
FD1 and FD2) to distinguish wild-type (WT) allele and targeted allele. The
primer sequences are as follows: FD1, 50-GCCAGGGTTGGGTCTTGAAC-30;FD2, 50-CCGACCCGACTGAGGAGTTT-30.In order to generate homozygous XicTetO cells, one of the heterozygous
XicTetO clones identified was treated with increased dosage of G418 (30 mg/
ml) for 1 week. Colonies were picked and assessed by Southern blotting for
the presence of the targeted allele but the absence of the WT allele. Clones
were further analyzed by DNA FISH on metaphase spreads to confirm karyo-
type, XicTetOXicTetO status, and chromosome integrity. The pBROAD3/TetR-
mycNLS-mCherry-expressing construct was transfected into PGKT2 cells
and selected with Hygromycin B, using standard transfection and selection
procedures (see Augui et al., 2007).
Live-Cell Imaging
PGKT2 cells expressing the TetR-mCherry transgene were seeded at 53 104
cells/cm2 on gridded-glass-bottom dishes (Matsunami Inc.) or on 12 mm
coverslips in a 6-well plate for 1 or 2 days before differentiation was initiated.
All images were acquired with 60 ms exposure time and 1003/1.4 objective
with 0.3 mm intervals between planes by the DeltaVision system (API). Total
exposure time was kept less than 100 s to avoid excess phototoxicity. All
images were deconvolved and analyzed with softWoRx software (API).
Toxicity was assessed using various conditions of imaging and by assessing
cell morphology and viability after several hours.
Mean Square Displacement Analysis
Three-dimensional manual tracking of distance between the two loci was per-
formed using the ‘‘measure distance’’ tool in softWoRx software. MSD
calculation was carried out using Matlab (mathworks, http://www.
mathworks.com/). Assuming that chromatin motion is modeled as a random
walk (Marshall et al., 1997), the relative mobility of the loci can be determined
by plotting their mean square displacement (MSD or < Dd2 > where Dd = d(t+
Dt)-d(t)) as a function of increasing time intervals Dt (d is the distance between
the two loci at each time point). Free diffusion (unconstrained motion) gives
a linear relationship between MSD and time intervals, whereas in the case of
constrained diffusion, the MSD will reach a ‘‘plateau.’’ According to Qian
et al. (1991), the statistical errors related to MSD computation quickly become
large whenDt becomes large: as a result, MSD curves should be based only on
early time points (the first quarter of all time points). Error bars in individual
MSD curves were calculated using the appropriate statistical approach
(Saxton, 1997). Slopes k of individual MSD curves were obtained by a least-
square linear fitting of the first quarter of points. Three-dimensional diffusion
constant D were then determined k = 6D, as our analyses were done in 3D.
To make the analysis more robust (i.e., to circumvent the statistical variance
inherent to individual cells), we averaged all individual MSDs over all the indi-
vidual runs recorded for a given differentiation stage. After averaging over
N individuals’ MSDs, the error bar is thus reduced by a factor of about 1=ffiffiffiffi
Np
.
Immunofluorescence and RNA and DNA FISH
Immunofluorescence, RNA FISH, and DNA FISHwere performed as described
previously (http://www.epigenome-noe.net/WWW/researchtools/protocol.
php?protid=3 and Augui et al., 2007). The Xist probe was the p510 plasmid
(Rougeulle et al., 1994) and the Tsix probe was theDXPas34 plasmid (Debrand
et al., 1999). The bacterial artificial chromosomes (BACs) used as probes for
certain regions of Xic were as described previously (Augui et al., 2007).
SUPPLEMENTAL INFORMATION
Supplemental Information includes Extended Experimental Procedures, four
figures, one table, and five movies and can be found with this article online
at doi:10.1016/j.cell.2011.03.032.
ACKNOWLEDGMENTS
We thank members of the Heard laboratory and John Sedat for helpful discus-
sions; Michele Guggiari, Christel Picard, Matt Plutz, and Patricia Diaban-
gouaya for technical assistance; Yohanns Bellaiche, Francois Graner, and
Jennifer Chow for helpful advice and for critical reading of the manuscript.
We thank Olivier Renaud and Olivier Leroy (PICT@BDD imaging facility), as
well as Sebastian Huart for assistancewith image analysis. This work was sup-
ported by the Human Frontier Science Program to E.H. and A.S.B.; the EU FP7
program HEROIC IP; ANR and FRM funding, and an ERC Advanced Investi-
gator Award to E.H.; and the FRM to I. Bonnet (postdoc grant n�
SPF20080512397).
Received: November 5, 2010
Revised: February 23, 2011
Accepted: March 18, 2011
Published: April 28, 2011
REFERENCES
Augui, S., Filion, G.J., Huart, S., Nora, E., Guggiari, M., Maresca, M., Stewart,
A.F., and Heard, E. (2007). Sensing X chromosome pairs before X inactivation
via a novel X-pairing region of the Xic. Science 318, 1632–1636.
Cell 145, 447–458, April 29, 2011 ª2011 Elsevier Inc. 457
Bacher, C.P., Guggiari, M., Brors, B., Augui, S., Clerc, P., Avner, P., Eils, R.,
and Heard, E. (2006). Transient colocalization of X-inactivation centres accom-
panies the initiation of X inactivation. Nat. Cell Biol. 8, 293–299.
Carmo-Fonseca, M., Platani, M., and Swedlow, J.R. (2002). Macromolecular
mobility inside the cell nucleus. Trends Cell Biol. 12, 491–495.
Chuang, C.H., Carpenter, A.E., Fuchsova, B., Johnson, T., de Lanerolle, P.,
and Belmont, A.S. (2006). Long-range directional movement of an interphase
chromosome site. Curr. Biol. 16, 825–831.
Chubb, J.R., Boyle, S., Perry, P., and Bickmore, W.A. (2002). Chromatin
motion is constrained by association with nuclear compartments in human
cells. Curr. Biol. 12, 439–445.
Chureau, C., Chantalat, S., Romito, A., Galvani, A., Duret, L., Avner, P., and
Rougeulle, C. (2011). Ftx is a non-coding RNA which affects Xist expression
and chromatin structure within the X-inactivation center region. Hum. Mol.
Genet. 20, 705–718.
Clerc, P., and Avner, P. (1998). Role of the region 30 to Xist exon 6 in the count-
ing process of X-chromosome inactivation. Nat. Genet. 19, 249–253.
Debrand, E., Chureau, C., Arnaud, D., Avner, P., and Heard, E. (1999). Func-
tional analysis of the DXPas34 locus, a 30 regulator of Xist expression. Mol.
Cell. Biol. 19, 8513–8525.
Donohoe, M.E., Silva, S.S., Pinter, S.F., Xu, N., and Lee, J.T. (2009). The plu-
ripotency factor Oct4 interacts with Ctcf and also controls X-chromosome
pairing and counting. Nature 460, 128–132.
Gartenberg, M.R., Neumann, F.R., Laroche, T., Blaszczyk, M., and Gasser,
S.M. (2004). Sir-mediated repression can occur independently of chromo-
somal and subnuclear contexts. Cell 119, 955–967.
Gimelbrant, A., Hutchinson, J.N., Thompson, B.R., and Chess, A. (2007).
Widespread monoallelic expression on human autosomes. Science 318,
1136–1140.
Heard, E., Rougeulle, C., Arnaud, D., Avner, P., Allis, C.D., and Spector, D.L.
(2001). Methylation of histone H3 at Lys-9 is an early mark on the X chromo-
some during X inactivation. Cell 107, 727–738.
Hewitt, S.L., Yin, B., Ji, Y., Chaumeil, J., Marszalek, K., Tenthorey, J., Salva-
giotto, G., Steinel, N., Ramsey, L.B., Ghysdael, J., et al. (2009). RAG-1 and
ATM coordinate monoallelic recombination and nuclear positioning of immu-
noglobulin loci. Nat. Immunol. 10, 655–664.
Jonkers, I., Barakat, T.S., Achame, E.M., Monkhorst, K., Kenter, A., Rent-
meester, E., Grosveld, F., Grootegoed, J.A., and Gribnau, J. (2009). RNF12
is an X-encoded dose-dependent activator of X chromosome inactivation.
Cell 139, 999–1011.
Lee, J.T. (2005). Regulation of X-chromosome counting by Tsix and Xite
sequences. Science 309, 768–771.
Lee, J.T., and Lu, N. (1999). Targeted mutagenesis of Tsix leads to nonrandom
X inactivation. Cell 99, 47–57.
Lee, J.T., Davidow, L.S., andWarshawsky, D. (1999). Tsix, a gene antisense to
Xist at the X-inactivation centre. Nat. Genet. 21, 400–404.
Lyon, M.F. (1961). Gene action in the X-chromosome of the mouse (Mus mus-
culus L.). Nature 190, 372–373.
Marshall, W.F., Straight, A., Marko, J.F., Swedlow, J., Dernburg, A., Belmont,
A., Murray, A.W., Agard, D.A., and Sedat, J.W. (1997). Interphase chromo-
somes undergo constrained diffusional motion in living cells. Curr. Biol. 7,
930–939.
Meshorer, E., Yellajoshula, D., George, E., Scambler, P.J., Brown, D.T., and
Misteli, T. (2006). Hyperdynamic plasticity of chromatin proteins in pluripotent
embryonic stem cells. Dev. Cell 10, 105–116.
Michaelis, C., Ciosk, R., and Nasmyth, K. (1997). Cohesins: chromosomal
proteins that prevent premature separation of sister chromatids. Cell 91,
35–45.
Monkhorst, K., Jonkers, I., Rentmeester, E., Grosveld, F., and Gribnau, J.
(2008). X inactivation counting and choice is a stochastic process: evidence
for involvement of an X-linked activator. Cell 132, 410–421.
458 Cell 145, 447–458, April 29, 2011 ª2011 Elsevier Inc.
Mortensen, R.M., Conner, D.A., Chao, S., Geisterfer-Lowrance, A.A., and
Seidman, J.G. (1992). Production of homozygous mutant ES cells with a single
targeting construct. Mol. Cell. Biol. 12, 2391–2395.
Navarro, P., and Avner, P. (2010). An embryonic story: analysis of the gene
regulative network controlling Xist expression in mouse embryonic stem cells.
Bioessays 32, 581–588.
Navarro, P., Chambers, I., Karwacki-Neisius, V., Chureau, C., Morey, C., Rou-
geulle, C., and Avner, P. (2008). Molecular coupling of Xist regulation and plu-
ripotency. Science 321, 1693–1695.
Nicodemi, M., and Prisco, A. (2007). Symmetry-breaking model for X-chromo-
some inactivation. Phys. Rev. Lett. 98, 108104–108114.
Ogawa, Y., and Lee, J.T. (2003). Xite X-inactivation intergenic transcription
elements that regulate the probability of choice. Mol. Cell 11, 731–743.
Ohlsson, R. (2007). Genetics. Widespread monoallelic expression. Science
318, 1077–1078.
Okamoto, I., and Heard, E. (2009). Lessons from comparative analysis of
X-chromosome inactivation in mammals. Chromosome Res. 17, 659–669.
Okamoto, I., Patrat, C., Thepot, D., Peynot, N., Fauque, P., Daniel, N., Diaban-
gouya, P., Wolf, J.P., Renard, J.P., Duranthon, V., and Heard, E. (2011). Euthe-
rian mammals use diverse strategies to initiate X-chromosome inactivation
during development. Nature. Published online April 6 2011. 10.1038/
nature09872.
Penny, G.D., Kay, G.F., Sheardown, S.A., Rastan, S., and Brockdorff, N.
(1996). Requirement for Xist in X chromosome inactivation. Nature 379,
131–137.
Qian, H., Sheetz, M.P., and Elson, E.L. (1991). Single particle tracking. Analysis
of diffusion and flow in two-dimensional systems. Biophys. J. 60, 910–921.
Rajapakse, I., Perlman, M.D., Scalzo, D., Kooperberg, C., Groudine, M., and
Kosak, S.T. (2009). The emergence of lineage-specific chromosomal topolo-
gies from coordinate gene regulation. Proc. Natl. Acad. Sci. USA 106, 6679–
6684.
Rougeulle, C., Colleaux, L., Dujon, B., and Avner, P. (1994). Generation and
characterization of an ordered lambda clone array for the 460-kb region
surrounding the murine Xist sequence. Mamm. Genome 5, 416–423.
Rougeulle, C., Chaumeil, J., Sarma, K., Allis, C.D., Reinberg, D., Avner, P., and
Heard, E. (2004). Differential histone H3 Lys-9 and Lys-27 methylation profiles
on the X chromosome. Mol. Cell. Biol. 24, 5475–5484.
Sado, T., Wang, Z., Sasaki, H., and Li, E. (2001). Regulation of imprinted
X-chromosome inactivation in mice by Tsix. Development 128, 1275–1286.
Saxton, M.J. (1997). Single-particle tracking: the distribution of diffusion coef-
ficients. Biophys. J. 72, 1744–1753.
Schoenfelder, S., Clay, I., and Fraser, P. (2010). The transcriptional interac-
tome: gene expression in 3D. Curr. Opin. Genet. Dev. 20, 127–133.
Scialdone, A., and Nicodemi, M. (2008). Mechanics and dynamics of X-chro-
mosome pairing at X inactivation. PLoS Comput. Biol. 4, e1000244.
Sun, B.K., Deaton, A.M., and Lee, J.T. (2006). A transient heterochromatic
state in Xist preempts X inactivation choice without RNA stabilization. Mol.
Cell 21, 617–628.
Tian, D., Sun, S., and Lee, J.T. (2010). The long noncoding RNA, Jpx is a
molecular switch for X chromosome inactivation. Cell 143, 390–403.
Williams, A., Spilianakis, C.G., and Flavell, R.A. (2010). Interchromosomal
association and gene regulation in trans. Trends Genet. 26, 188–197.
Xu, N., Tsai, C.L., and Lee, J.T. (2006). Transient homologous chromosome
pairing marks the onset of X inactivation. Science 311, 1149–1152.
Xu, N., Donohoe, M.E., Silva, S.S., and Lee, J.T. (2007). Evidence that homol-
ogous X-chromosome pairing requires transcription and Ctcf protein. Nat.
Genet. 39, 1390–1396.