Analysis of Food Pairing in Regional Cuisines of India - PLOS
17
RESEARCH ARTICLE Analysis of Food Pairing in Regional Cuisines of India Anupam Jain 1☯ , Rakhi N K 2☯ , Ganesh Bagler 2 * 1 Center for System Science, Indian Institute of Technology Jodhpur, Jodhpur, Rajasthan, India, 2 Center for Biologically Inspired System Science, Indian Institute of Technology Jodhpur, Jodhpur, Rajasthan, India ☯ These authors contributed equally to this work. * [email protected]; [email protected] Abstract Any national cuisine is a sum total of its variety of regional cuisines, which are the cultural and historical identifiers of their respective regions. India is home to a number of regional cuisines that showcase its culinary diversity. Here, we study recipes from eight different regional cuisines of India spanning various geographies and climates. We investigate the phenomenon of food pairing which examines compatibility of two ingredients in a recipe in terms of their shared flavor compounds. Food pairing was enumerated at the level of cui- sine, recipes as well as ingredient pairs by quantifying flavor sharing between pairs of ingre- dients. Our results indicate that each regional cuisine follows negative food pairing pattern; more the extent of flavor sharing between two ingredients, lesser their co-occurrence in that cuisine. We find that frequency of ingredient usage is central in rendering the characteristic food pairing in each of these cuisines. Spice and dairy emerged as the most significant ingredient classes responsible for the biased pattern of food pairing. Interestingly while indi- vidual spices contribute to negative food pairing, dairy products on the other hand tend to deviate food pairing towards positive side. Our data analytical study highlighting statistical properties of the regional cuisines, brings out their culinary fingerprints that could be used to design algorithms for generating novel recipes and recipe recommender systems. It forms a basis for exploring possible causal connection between diet and health as well as prospec- tion of therapeutic molecules from food ingredients. Our study also provides insights as to how big data can change the way we look at food. Introduction Cooking is a unique trait humans possess and is believed to be a major cause of increased brain size [ 1– 3]. While cooking encompasses an array of food processing techniques [ 4], cuisine is an organized series of food preparation procedures intended to create tasty and healthy food. India has a unique blend of culturally and climatically diverse regional cuisines. Its culinary history dates back to the early Indus valley civilization [ 5– 7]. Indian dietary practices are deeply rooted in notions of disease prevention and promotion of health. PLOS ONE | DOI:10.1371/journal.pone.0139539 October 2, 2015 1 / 17 a11111 OPEN ACCESS Citation: Jain A, N K R, Bagler G (2015) Analysis of Food Pairing in Regional Cuisines of India. PLoS ONE 10(10): e0139539. doi:10.1371/journal. pone.0139539 Editor: Zi-Ke Zhang, Hangzhou Normal University, CHINA Received: April 24, 2015 Accepted: September 1, 2015 Published: October 2, 2015 Copyright: © 2015 Jain et al. This is an open access article distributed under the terms of the Creative Commons Attribution License, which permits unrestricted use, distribution, and reproduction in any medium, provided the original author and source are credited. Data Availability Statement: All relevant data are within the paper and its Supporting Information files. Funding: G.B. acknowledges the seed grant support from Indian Institute of Technology Jodhpur 298 (IITJ/ SEED/2014/0003). A.J. and R.N.K. thank the Ministry of Human Resource 299 Development, Government of India as well as Indian Institute of Technology Jodhpur 300 for scholarship and Junior Research Fellowship, respectively. The funders had no role in study design, data collection and analysis, decision to publish, or preparation of the manuscript. Competing Interests: The authors have declared that no competing interests exist.
-
Upload
khangminh22 -
Category
Documents
-
view
1 -
download
0
Transcript of Analysis of Food Pairing in Regional Cuisines of India - PLOS

RESEARCH ARTICLE
Analysis of Food Pairing in Regional Cuisinesof IndiaAnupam Jain1☯, Rakhi N K2☯, Ganesh Bagler2*
1Center for System Science, Indian Institute of Technology Jodhpur, Jodhpur, Rajasthan, India, 2 Center forBiologically Inspired System Science, Indian Institute of Technology Jodhpur, Jodhpur, Rajasthan, India
☯ These authors contributed equally to this work.* [email protected]; [email protected]
AbstractAny national cuisine is a sum total of its variety of regional cuisines, which are the cultural
and historical identifiers of their respective regions. India is home to a number of regional
cuisines that showcase its culinary diversity. Here, we study recipes from eight different
regional cuisines of India spanning various geographies and climates. We investigate the
phenomenon of food pairing which examines compatibility of two ingredients in a recipe in
terms of their shared flavor compounds. Food pairing was enumerated at the level of cui-
sine, recipes as well as ingredient pairs by quantifying flavor sharing between pairs of ingre-
dients. Our results indicate that each regional cuisine follows negative food pairing pattern;
more the extent of flavor sharing between two ingredients, lesser their co-occurrence in that
cuisine. We find that frequency of ingredient usage is central in rendering the characteristic
food pairing in each of these cuisines. Spice and dairy emerged as the most significant
ingredient classes responsible for the biased pattern of food pairing. Interestingly while indi-
vidual spices contribute to negative food pairing, dairy products on the other hand tend to
deviate food pairing towards positive side. Our data analytical study highlighting statistical
properties of the regional cuisines, brings out their culinary fingerprints that could be used to
design algorithms for generating novel recipes and recipe recommender systems. It forms a
basis for exploring possible causal connection between diet and health as well as prospec-
tion of therapeutic molecules from food ingredients. Our study also provides insights as to
how big data can change the way we look at food.
IntroductionCooking is a unique trait humans possess and is believed to be a major cause of increased brainsize [1–3]. While cooking encompasses an array of food processing techniques [4], cuisine isan organized series of food preparation procedures intended to create tasty and healthy food.India has a unique blend of culturally and climatically diverse regional cuisines. Its culinaryhistory dates back to the early Indus valley civilization [5–7]. Indian dietary practices aredeeply rooted in notions of disease prevention and promotion of health.
PLOSONE | DOI:10.1371/journal.pone.0139539 October 2, 2015 1 / 17
a11111
OPEN ACCESS
Citation: Jain A, N K R, Bagler G (2015) Analysis ofFood Pairing in Regional Cuisines of India. PLoSONE 10(10): e0139539. doi:10.1371/journal.pone.0139539
Editor: Zi-Ke Zhang, Hangzhou Normal University,CHINA
Received: April 24, 2015
Accepted: September 1, 2015
Published: October 2, 2015
Copyright: © 2015 Jain et al. This is an open accessarticle distributed under the terms of the CreativeCommons Attribution License, which permitsunrestricted use, distribution, and reproduction in anymedium, provided the original author and source arecredited.
Data Availability Statement: All relevant data arewithin the paper and its Supporting Information files.
Funding: G.B. acknowledges the seed grant supportfrom Indian Institute of Technology Jodhpur 298 (IITJ/SEED/2014/0003). A.J. and R.N.K. thank the Ministryof Human Resource 299 Development, Governmentof India as well as Indian Institute of TechnologyJodhpur 300 for scholarship and Junior ResearchFellowship, respectively. The funders had no role instudy design, data collection and analysis, decision topublish, or preparation of the manuscript.
Competing Interests: The authors have declaredthat no competing interests exist.

Food perception involving olfactory and gustatory mechanisms is the primary influence forfood preferences in humans. These preferences are also determined by a variety of factors suchas culture, climate geography and genetics, leading to emergence of regional cuisines [4, 8–12].Food pairing is the idea that ingredients having similar flavor constitution may taste well in arecipe. Chef Blumenthal was the first to propose this idea, which in this study we term as posi-tive food pairing [13]. Studies by Ahn et al found that North American, Latin American andSouthern European recipes follow this food pairing pattern where as certain others like NorthKorean cuisine and Eastern European cuisines do not [14, 15]. Our previous study of food pair-ing in Indian cuisine revealed a strong negative food pairing pattern in its recipes [16].
Knowing that each of the regional cuisines have their own identity, the question we seek toanswer in this paper is whether the negative food pairing pattern in Indian cuisine is a consis-tent trend observed across all of the regional cuisines or an averaging effect. Towards answeringthis question, we investigated eight geographically and culturally prominent regional cuisinesviz. Bengali, Gujarati, Jain, Maharashtrian, Mughlai, Punjabi, Rajasthani and South Indian.The pattern of food pairing was studied at the level of cuisine, recipes and ingredient pairs.Such a multi-tiered study of these cuisines provided a thorough understanding of its character-istics in terms of ingredient usage pattern. We further identified the features that contribute tofood pairing, thereby revealing the role of ingredients and ingredient categories in determiningfood pairing of the regional cuisines.
Availability of large datasets in the form of cookery blogs and recipe repositories hasprompted the use of big data analytical techniques in food science and has led to the emergenceof computational gastronomy. This field has made advances through many recent studies [14,15, 17, 18] which is changing the overall outlook of culinary science in recent years. Our studyis an offshoot of this approach. We use statistical and computational models to analyse foodpairing in the regional cuisines. Our study reveals the characteristic signature of each Indianregional cuisines by looking at the recipe and ingredient level statistics of the cuisine.
Results and DiscussionDetails of recipes, ingredients, and their corresponding flavor compounds constitute the pri-mary data required for study of food pairing in a cuisine. Much of this is documented in theform of books and recently through online recipe sources. We obtained the Indian cuisine reci-pes data S1 Dataset from one of the popular cookery websites TarlaDalal.com [19]. The flavorprofiles of ingredients were compiled using previously published data [15] and through exten-sive literature survey S2 Dataset. Table 1 lists details of recipes and ingredients in each of theregional cuisines.
The ingredients belonged to following 15 categories: spice, vegetable, fruit, plant derivative,nut/seed, cereal/crop, dairy, plant, pulse, herb, meat, fish/seafood, beverage, animal product,and flower. Category-wise ingredient statistics of regional cuisines is provided in S1 Table.
Statistics of recipe size and ingredient frequencyWe started with investigation of preliminary statistics of regional cuisines. All the eightregional cuisines under consideration showed bounded recipe-size distribution (Fig 1). Whilemost cuisines followed uni-modal distribution, Mughlai cuisine showed a strong bimodal dis-tribution and had recipes with large sizes when compared with the rest. This could be an indi-cation of the fact that Mughlai is derivative of a royal cuisine. To understand the ingredientusage pattern, we ranked ingredients according to decreasing usage frequency within each cui-sine. As shown in Fig 2, all cuisines showed strikingly similar ingredient usage profile reflectingthe pattern of Indian cuisine (Fig 2, inset). While indicating a generic culinary growth
Analysis of Food Pairing in Regional Cuisines of India
PLOS ONE | DOI:10.1371/journal.pone.0139539 October 2, 2015 2 / 17

Table 1. Statistics of regional cuisines.
Cuisine Recipe count Ingredient count
Bengali 156 102
Gujarati 392 112
Jain 447 138
Maharashtrian 130 93
Mughlai 179 105
Punjabi 1013 152
Rajasthani 126 78
South Indian 474 114
Recipes of size � 2 were considered for the purpose of flavor analysis.
doi:10.1371/journal.pone.0139539.t001
Fig 1. Recipe size distributions. Plot of probability of finding a recipe of size s in the cuisine. Consistent with other cuisines, the distributions are bounded.Mughlai and Punjabi cuisines have recipes of large sizes compared to other cuisines.
doi:10.1371/journal.pone.0139539.g001
Analysis of Food Pairing in Regional Cuisines of India
PLOS ONE | DOI:10.1371/journal.pone.0139539 October 2, 2015 3 / 17

mechanism, the distributions also show that certain ingredients are excessively used in cuisinesdepicting their inherent ‘fitness’ or popularity within the cuisine.
Food pairing hypothesisFood pairing hypothesis is a popular notion in culinary science. It asserts that two ingredientssharing common flavor compounds taste well when used together in a recipe. This hypothesishas been confirmed for a few cuisines such as North American, Western European and LatinAmerican [15]. In contrast, Korean and Southern European cuisines have been shown to devi-ate from positive food pairing. Our previous study of food pairing in Indian cuisine at the levelof cuisine, sub-cuisines, recipes and ingredient pairs has shown that it is characterized with astrong negative food pairing [16]. We quantify food pairing with the help of flavor profiles of
Fig 2. Frequency-Rank distributions. Ingredients ranked as per their frequency of use in the cuisine. Higher the occurrence, better the rank of theingredient. All the cuisines have similar ingredient distribution profile indicating generic culinary growth mechanism. Inset shows the ingredient frequency-rank distribution for the whole Indian cuisine.
doi:10.1371/journal.pone.0139539.g002
Analysis of Food Pairing in Regional Cuisines of India
PLOS ONE | DOI:10.1371/journal.pone.0139539 October 2, 2015 4 / 17

ingredients. Flavor profile represents a set of volatile chemical compounds that render thecharacteristic taste and smell to the ingredient. Starting with the flavor profiles of each of the
ingredients, average food pairing of a recipe (NRs ) as well as that of the cuisine (Ns) was com-
puted as illustrated in Fig 3. The extent of deviation of Ns of the cuisine, when compared to
that of a ‘random cuisine’measures the bias in food pairing. The higher/lower the value of Ns
from that of its random counterpart the more positive/negative the food pairing is.
Regional cuisines of India exhibit negative food pairingWe found that all regional cuisines are invariantly characterized by average food pairing lesserthan expected by chance. This characteristic negative food pairing, however, varied in its extentacross cuisines. Mughlai cuisine, for example, displayed the least inclination towards negative
pairing (DNs ¼ NMughlai
s � NRand
s ¼ �0:758 and Z-score of -10.232). Whereas, Maharashtrian
cuisine showed the most negative food pairing (DNs ¼ NMaharashtrian
s � NRand
s ¼ �4:523 and Z-score of -52.047). Fig 4 depicts the generic food pairing pattern observed across regional cui-sines of India. We found that the negative food pairing is independent of recipe size as shownin Fig 5. This indicates that the bias in food pairing is not an artifact of averaging over recipesof all sizes and is a quintessential feature of all regional cuisines of India. Note that, across cui-sines, majority of recipes are in the size-range of around 3 to 12. Hence the significance of foodpairing statistics is relevant below the recipe size cut-off of* 12.
We further investigated for possible factors that could explain negative food pairing patternobserved in regional cuisines. We created randomized controls for each regional cuisine toexplore different aspects that may contribute to the bias in food pairing. In the first control, fre-quency of occurrence of each ingredient was preserved at the cuisine level (‘Ingredient fre-quency’). In the second control, category composition of each recipe was preserved(‘Ingredient category’). A third composite control was created by preserving both categorycomposition of each recipe as well as frequency of occurrence of ingredients (‘Category+ Frequency’).
Interestingly, ingredient frequency came out to be a critical factor that could explain the
observed bias in food pairing as reflected in Ns (Fig 4). The pattern of food pairing across dif-ferent size-range of recipes is also consistent with this observation (Fig 5). On the contrary, cat-egory composition itself turned out to be irrelevant and led to food pairing that was similar tothat of a randomized cuisine. Further, the control implementing a composite model featuringboth the above aspects recreated food pairing observed in regional cuisines. Thus frequency ofoccurrence of ingredients emerged as the most central aspect which is critical for rendering thecharacteristic food pairing.
Food pairing at recipe levelLooking into the food pairing at recipe level, we analyzed the nature of distribution of foodpairing among recipes (NR
s ). Our analysis showed that the negative ΔNs observed for cuisineswas not an averaging effect. The NR
s values tend to follow exponential distribution, indicatingthat number of recipes exponentially decays with increasing NR
s . To address the noise due tosmall size of cuisines, we computed cumulative distribution (Pð� NR
s Þ) as depicted in Fig 6.The nature of cumulative distribution for an exponential probability distribution function
(PðNRs Þ / e�aNR
s ) would be of the following form:
Pð� NRs Þ ¼ aþ k� a
1þ e�aNRs
ð1Þ
Analysis of Food Pairing in Regional Cuisines of India
PLOS ONE | DOI:10.1371/journal.pone.0139539 October 2, 2015 5 / 17
Analysis of Food Pairing in Regional Cuisines of India
PLOS ONE | DOI:10.1371/journal.pone.0139539 October 2, 2015 6 / 17

We found that all regional cuisines show a strong bias towards recipes of low NRs values as
observed in Fig 6. For each regional cuisine, the bias was accentuated in comparison to corre-sponding random cuisines as reflected in the exponents shown in S2 Table. Once again Mugh-lai cuisine emerged as an outlier, as the nature of its NR
s distribution did not indicate a clear
distinction from that of its random control. Consistent with the observation made with Ns andΔNs statistics (Figs 4 and 5), we found that controlling for frequency of occurrence of ingredi-ents reproduces the nature of NR
s distribution across all regional cuisines (barring the Mughlaicuisine). This further highlights the role of ingredient frequency as a key factor in specifyingfood pairing at the level of recipes as well.
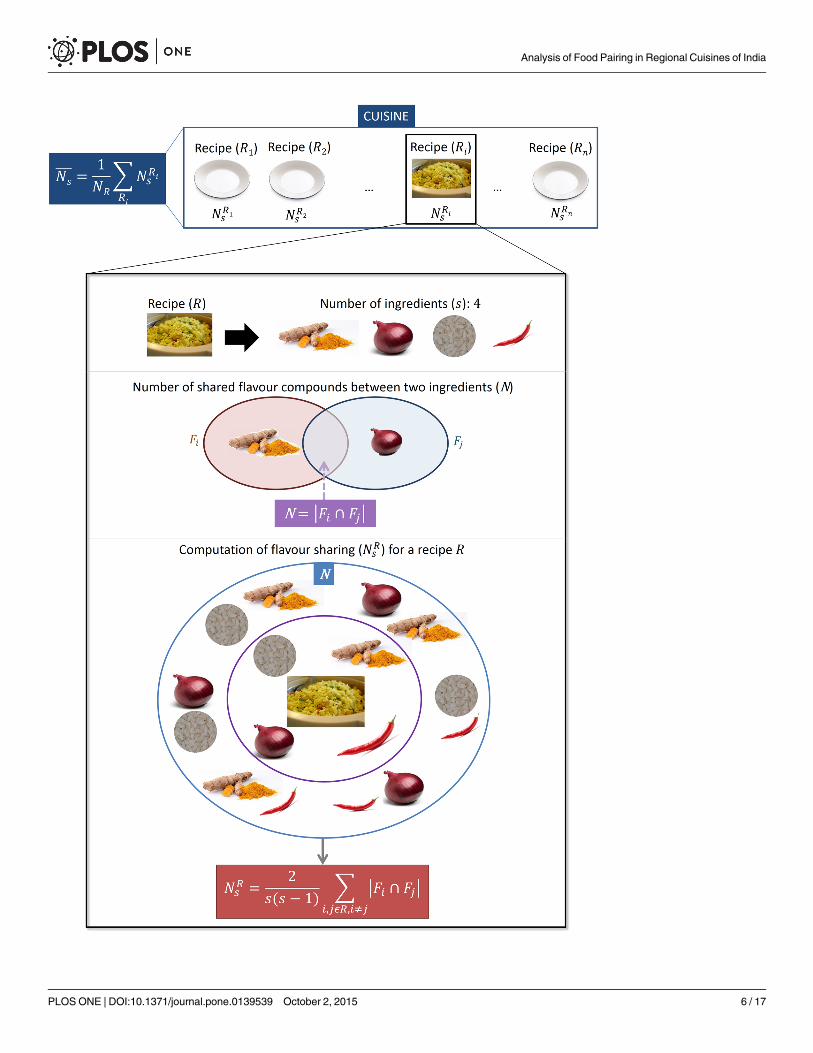
Fig 3. Schematic for calculation of ‘averageNs’ (Ns). Illustration of procedure for calculating the averageNs for a given cuisine. Beginning with anindividual recipe, average Ns of the recipe (NR
s ) was calculated. AveragingNRs over all the recipes returned Ns of the cuisine.
doi:10.1371/journal.pone.0139539.g003
Fig 4. ΔNs and its statistical significance. The variation in ΔNs for regional cuisines and corresponding random controls signifying the extent of bias in foodpairing. Statistical significance of ΔNs is shown in terms of Z-score. ‘Regional cuisine’ refers to each of the eight cuisines analyzed; ‘Ingredient frequency’refers to the frequency controlled random cuisine; ‘Ingredient category’ refers to ingredient category controlling random cuisine; and ‘Category + Frequency’refers to random control preserving both ingredient frequency and category. Among all regional cuisines, Mughlai cuisine showed least negative food paring(ΔNs = −0.758) while Maharashtrian cuisine had most negative food pairing (ΔNs = −4.523).
doi:10.1371/journal.pone.0139539.g004
Analysis of Food Pairing in Regional Cuisines of India
PLOS ONE | DOI:10.1371/journal.pone.0139539 October 2, 2015 7 / 17

Food pairing at the level of ingredient pairsBeyond the level of cuisine and recipes, the bias in food pairing can be studied at the level ofingredient pairs. We computed co-occurrence of ingredients in the cuisine for increasing valueof flavor profile overlap (N). We found that the fraction of pairs of ingredients with a certainoverlap of flavor profiles (f(N)) followed a power law distribution f(N)/ N−γ (Fig 7). This indi-cates that higher the extent of flavor overlap between a pair of ingredients, the lesser is its usagein these cuisines. S3 Table lists the γ values for each of the regional cuisines.
Contribution of individual ingredients towards food pairingFor each of the regional cuisines we calculated the contribution of ingredients (χi) towards thefood pairing pattern S3 Dataset. For an ingredient whose presence in the cuisine does not leadto any bias, the value of χi is expected to be around zero. With increasing role in biasing foodpairing towards positive (negative) side, χi is expected to be proportionately higher (lower). Fig8 shows the distribution of ingredient contribution (χi) and its frequency of occurrence, foreach regional cuisine. Ingredients that make significant contribution towards food pairingcould be located, in either positive or negative side, away from the neutral vertical axis around
Fig 5. Variation in averageNs and its statistical significance. Change inNs with varying recipe size cut-offs reveals the nature of food pairing across thespectrum of recipe sizes. TheNs values for regional cuisines were consistently on the lower side compared to their random counterparts. Category controlledrandom cuisine displayed averageNs variation close to that of the ‘Random control’. Frequency controlled as well as ‘Category + Frequency’ controlledrandom cuisines, on the other hand, displayed averageNs variations close to that of the real-world cuisine.
doi:10.1371/journal.pone.0139539.g005
Analysis of Food Pairing in Regional Cuisines of India
PLOS ONE | DOI:10.1371/journal.pone.0139539 October 2, 2015 8 / 17

χi = 0. Significantly, spices were consistently present towards the negative side, while milk andcertain dairy products were present on the positive side across cuisines. Prominently amongthe spices, cayenne consistently contributed to the negative food pairing of all regional cuisines.Certain ingredients appeared to be ambivalent in their contribution to food pairing. While car-damom contributed to the positive food pairing in Gujarati, Mughlai, Rajasthani, and SouthIndian cuisines, it added to negative food pairing in Maharashtrian cuisine. Green bell peppertends to contribute to negative food pairing across the cuisines except in the case of Rajasthanicuisine. Details of χi values of prominent ingredients for each regional cuisine are presented inS4 Table.
Role of ingredient categories in food pairingAs discussed earlier, the random cuisine where only category composition of recipes was con-served, tends to have food pairing similar to that of the ‘Random control’ (Figs 4 and 5). This
Fig 6. Cumulative probability distribution of NRs values for regional cuisines and their random controls. Cumulative distribution ofNR
s indicates theprobability of finding a recipe having food pairing less than or equal to NR
s . The data of regional cuisines as well as those of their controls were fitted with asigmoid equation indicating that the PðNR
s Þ values fall exponentially. The exponent α Eq (1) refers to the rate of decay; larger the αmore prominent is thenegative food pairing in recipes of a cuisine. As evident from S2 Table, NR
s distribution of the controls based on ‘Ingredient Frequency’ as well as ‘Category+ Frequency’ displayed recipe level food pairing similar to real-world cuisines. On the other hand, as also observed at the level of cuisine (Figs 4 and 5), boththe ‘Random Control’ as well as ‘Ingredient Category’ control deviate significantly.
doi:10.1371/journal.pone.0139539.g006
Analysis of Food Pairing in Regional Cuisines of India
PLOS ONE | DOI:10.1371/journal.pone.0139539 October 2, 2015 9 / 17

raises the question whether ingredient category has any role in determining food pairing pat-tern of the cuisine. Towards answering this question, we created random cuisines wherein werandomized ingredients within one category, while preserving the category and frequency dis-tribution for rest of the ingredients. The extent of contribution of an ingredient categorytowards the observed food pairing in the cuisine is represented by DNcat
s . Fig 9 depicts signifi-cance of ingredient categories towards food pairing of each regional cuisine. Interestingly, thepattern of category contributions presents itself as a ‘culinary fingerprint’ of the cuisine.
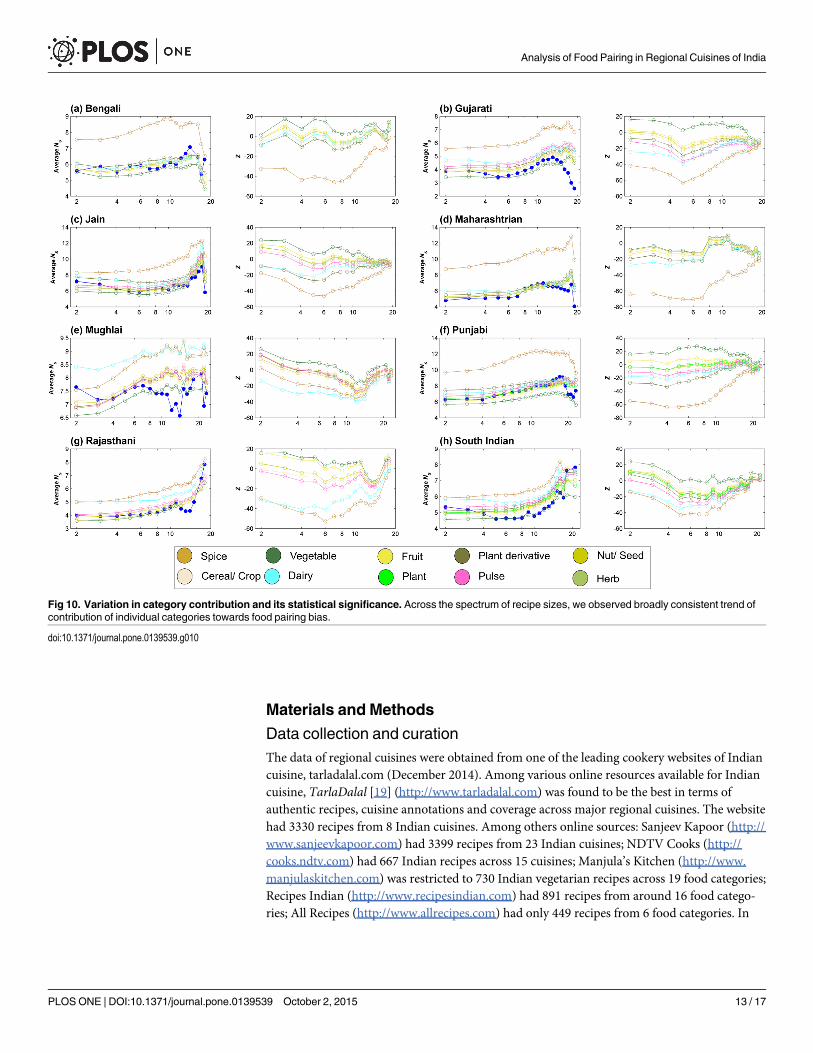
The ‘spice’ category was the most significant contributor to negative food pairing across cui-sines with the exception of Mughlai cuisine. Another category which consistently contributedto negative food pairing was ‘dairy’. On the other hand, ‘vegetable’ and ‘fruit’ categories tend tobias most cuisines towards positive food pairing. Compared to the above-mentioned categories,‘nut/seed’, ‘cereal/crop’, ‘pulse’ and ‘plant derivative’ did not show any consistent trend. ‘Plant’and ‘herb’ categories, sparsely represented in cuisines, tend to tilt the food pairing towards pos-itive side. In Mughlai cuisine all ingredient categories, except ‘dairy’, tend to contribute towardspositive food pairing. This could be a reflection of the meagre negative food pairing observedfor the cuisine (Fig 4). Above observations were found to be consistent across the spectrum ofrecipe sizes (Fig 10).
Fig 7. Co-occurrence of ingredients with increasing extent of flavor profile overlap. Fraction of ingredient pair occurrence (f(N)) with a certain extent offlavor profile overlap (N) was computed to assess the nature of food pairing at the level of ingredient pairs. Generically across the cuisines it was observedthat, the occurrences of ingredient pairs dropped as a power law with increasing extent of flavor profile sharing. This further ascertained negative food pairingpattern in regional cuisines, beyond the coarse-grained levels of cuisine and recipes.
doi:10.1371/journal.pone.0139539.g007
Analysis of Food Pairing in Regional Cuisines of India
PLOS ONE | DOI:10.1371/journal.pone.0139539 October 2, 2015 10 / 17

ConclusionsWith the help of data analytical techniques we have shown that food pairing in major Indianregional cuisines follow a consistent trend. We analyzed the reason behind this characteristicpattern and found that spices, individually and as a category, play a crucial role in renderingthe negative food pairing to the cuisines. The use of spices as a part of diet dates back to ancientIndus civilization of Indian subcontinent [5–7]. They also find mention in Ayurvedic textssuch as Charaka Samhita and Bhaavprakash Nighantu [20–23]. Trikatu, an Ayurvedic formu-lation prescribed routinely for a variety of diseases, is a combination of spices viz., long pepper,black pepper and ginger [24]. Historically spices have served several purposes such as coloringand flavoring agents, preservatives and additives. They also serve as anti-oxidants, anti-inflam-matory, chemopreventive, antimutagenic and detoxifying agents [23, 25]. One of the strongesthypothesis proposed to explain the use of spices is the antimicrobial hypothesis, which suggeststhat spices are primarily used due to their activity against food spoilage bacteria [9, 26]. A fewof the most antimicrobial spices [27] are commonly used in Indian cuisines. Our recent studieshave shown the beneficial role of capsaicin, an active component in cayenne which was
Fig 8. Contribution of ingredients (χi) towards flavor pairing. For all eight regional cuisines we calculated the χi value of ingredients that indicates theircontribution to flavor pairing pattern of the cuisine and plotted them against their frequency of appearance. Size of circles are proportional to frequency ofingredients. Across cuisines, prominent negative contributors largely comprised of spices, whereas a few dairy products consistently appeared on thepositive side.
doi:10.1371/journal.pone.0139539.g008
Analysis of Food Pairing in Regional Cuisines of India
PLOS ONE | DOI:10.1371/journal.pone.0139539 October 2, 2015 11 / 17

revealed to be the most prominent ingredient in consistently rendering the negative food pair-ing in all regional cuisines [28]. The importance of spices in Indian regional cuisines is alsohighlighted by the fact that these cuisines have many derived ingredients (such as garammasala, ginger garlic paste etc.) that are spice combinations. The key role of spices in renderingcharacteristic food pairing in Indian cuisines and the fact that they are known to be of thera-peutic potential, provide a basis for exploring possible causal connection between diet andhealth as well as prospection of therapeutic molecules from food ingredients. Flavor pairinghas been used as a basic principle in algorithm design for both recipe recommendation andnovel recipe generation, thereby enabling computational systems to enter the creative domainof cooking and suggesting recipes [17, 18]. In such algorithms, candidate recipes are generatedbased on existing domain knowledge and flavor pairing plays a crucial role while selecting thebest among these candidates [18].
Fig 9. Contribution of individual categories (DNcats ) towards food pairing bias and its statistical significance.Randomizing ingredients within a certain
category provides an insight into their contribution towards bias in food pairing. Spice and dairy category showed up as prominent categories contributing tothe negative food pairing of regional cuisines.
doi:10.1371/journal.pone.0139539.g009
Analysis of Food Pairing in Regional Cuisines of India
PLOS ONE | DOI:10.1371/journal.pone.0139539 October 2, 2015 12 / 17
Materials and Methods
Data collection and curationThe data of regional cuisines were obtained from one of the leading cookery websites of Indiancuisine, tarladalal.com (December 2014). Among various online resources available for Indiancuisine, TarlaDalal [19] (http://www.tarladalal.com) was found to be the best in terms ofauthentic recipes, cuisine annotations and coverage across major regional cuisines. The websitehad 3330 recipes from 8 Indian cuisines. Among others online sources: Sanjeev Kapoor (http://www.sanjeevkapoor.com) had 3399 recipes from 23 Indian cuisines; NDTV Cooks (http://cooks.ndtv.com) had 667 Indian recipes across 15 cuisines; Manjula’s Kitchen (http://www.manjulaskitchen.com) was restricted to 730 Indian vegetarian recipes across 19 food categories;Recipes Indian (http://www.recipesindian.com) had 891 recipes from around 16 food catego-ries; All Recipes (http://www.allrecipes.com) had only 449 recipes from 6 food categories. In
Fig 10. Variation in category contribution and its statistical significance. Across the spectrum of recipe sizes, we observed broadly consistent trend ofcontribution of individual categories towards food pairing bias.
doi:10.1371/journal.pone.0139539.g010
Analysis of Food Pairing in Regional Cuisines of India
PLOS ONE | DOI:10.1371/journal.pone.0139539 October 2, 2015 13 / 17

comparison to these sources, Tarladalal.com was identified as a best recipe source of Indiancuisine.
The data of 3330 recipes and 588 ingredients were curated for redundancy in names and todrop recipes with only one ingredient. These ingredients belonged to 17 categories. Ingredientsof ‘snack’ and ‘additive’ categories, for which no flavor compounds could be determined, wereremoved. The ingredients were further aliased to 339 source ingredients out of which we coulddetermine flavor profiles for 194 of them. Aliasing involves mapping ingredients to their sourceingredient. For example ‘chopped potato’ and ‘mashed potato’ were aliased to ‘potato’. Thefinal data comprised of 2543 recipes and 194 ingredients belonging to 15 categories. The statis-tics of regional cuisines, their recipes and ingredient counts is provided in Table 1.
The data of flavor compounds were obtained from Ahn et. al. [15], Fenaroli’s Handbook ofFlavor Compounds [29] and extensive literature search. All the flavor profiles were crosschecked with those in 6th edition (latest) of Fenaroli’s Handbook of Flavor Compounds [29]for consistency of names. Chemical Abstract Service numbers were used as unique identifiersof flavor molecules.
Flavor sharingFlavor sharing was computed for each pair of ingredients that co-occur in recipes in terms ofnumber of shared compounds N = jFi \ Fjj. Further, the average number of shared compoundsin a recipe NR
s having s ingredients was calculated (Eq (2)).
NRs ¼ 2
sðs� 1ÞX
i;j2R;i6¼j
jFi \ Fjj ð2Þ
where Fi represents the flavor profile of ingredient i and R represents a recipe.For a cuisine with NR recipes, we then calculated the average flavor sharing of the cuisine
Ncuisine
s ð¼ SRNRs
NRÞ. Fig 3 illustrates this procedure graphically. We compared average Ns of the cui-
sine with that of corresponding randomized cuisine (Fig 4) by calculating
DNsð¼ Ncuisine
s � NRand
s ), where cuisine and Rand indicate the regional cuisine and correspond-ing ‘random cuisine’ respectively.
A total of four random controls were created viz. ‘Random control’, ‘Ingredient frequency’,‘Ingredient category’ and ‘Category + Frequency’. While in all random cuisines recipe size dis-tribution of the original cuisine was preserved, ‘Random control’ implemented uniform selec-tion of ingredients (1 set of 10,000 recipes for each regional cuisine); ‘Ingredient frequency’control was created while maintaining the ingredient usage frequency distribution (1 set of10,000 recipes for each regional cuisine); ‘Ingredient category’ control was created by random-izing ingredient usage in recipes with ingredients belonging to same categories, thus maintain-ing the category composition of recipes (8 sets of recipes for a total of> 10,000 recipes for eachregional cuisine); and ‘Category + Frequency’ control preserved both the ingredient categoriesin recipes as well as frequency of overall ingredient usage within the cuisine (8 sets of recipesfor a total of> 10,000 recipes for each regional cuisine).
The statistical significance of Ns and ΔNs was measured with corresponding Z-scores givenby Eq (3).
Z ¼ ffiffiffiffiffiffiffiffiffiffiNRand
p ðNcuisine
s � NRand
s ÞsRand
; ð3Þ
where NRand and σRand represent the number of recipes in randomized cuisine and standarddeviation of NR
s values for randomized cuisine respectively.
Analysis of Food Pairing in Regional Cuisines of India
PLOS ONE | DOI:10.1371/journal.pone.0139539 October 2, 2015 14 / 17

Ingredient contributionFor every regional cuisine, the contribution (χi) of each ingredient i was calculated [15] usingEq (4).
wi ¼1
NR
Xi2R
2
nðn� 1ÞX
j 6¼iðj;i2RÞjFi \ Fjj
!� 2fi
NRhniSj2c fjjFi \ Fjj
Sj2c fj
!ð4Þ
Here, fi is the frequency of occurrence of ingredient i.χi values reflect the extent of an ingredient’s contribution towards positive or negative food
pairing of the cuisine.
Uniqueness of ingredient categoryDespite significant flavor sharing within each category of ingredients, the uniqueness of eachcategory, by virtue of combination of its ingredients with other ingredients, was enumerated byintra-category randomization. The average food pairing of such cuisine, randomized for a cate-gory, was compared with that of the original cuisine. Such category-randomized cuisines werecreated only for major categories (having 5 or more ingredients) within each regional cuisine.
The deviation in Ncat
s , that reflects the relevance of unique placements of ingredients of cat, wascalculated using Eq (5).
DNcats ¼ N
cat
s � Ncuisine
s ; 8s � 2 ð5Þ
Here, cat stands for an ingredient category and s represents recipe size. The statistical signifi-cance was again calculated using Z-score.
Supporting InformationS1 Table. Distribution of ingredients across categories. Number of ingredients in each cate-gory for all regional cuisines.(PDF)
S2 Table. Exponents (α) of Sigmoid fits for PðNRs Þ vs NR
s distribution. Exponents (α) forregional cuisines and their random controls.(PDF)
S3 Table. Power law exponents (γ) for f(N) vs N distribution. Power law exponents (γ) of allregional cuisines.(PDF)
S4 Table. Ingredients contributing significantly to food pairing. Details of top 10 ingredi-ents contributing to positive and negative food pairing in each of the regional cuisines.(PDF)
S1 Dataset. Recipes in Indian Subcuisine and their corresponding ingredients. Recipe idand aliased ingredient name.(XLSX)
S2 Dataset. Flavor compound present in ingredients. Flavor compounds in each ingredientand their corresponding CAS number.(XLSX)
Analysis of Food Pairing in Regional Cuisines of India
PLOS ONE | DOI:10.1371/journal.pone.0139539 October 2, 2015 15 / 17

S3 Dataset. Contribution of each Ingredient towards food pairing and its frequency ofoccurrence. Frequency of occurrence and corresponding χi values of ingredients.(XLSX)
AcknowledgmentsG.B. acknowledges the seed grant support from Indian Institute of Technology Jodhpur (IITJ/SEED/2014/0003). A.J. and R.N.K. thank the Ministry of Human Resource Development, Gov-ernment of India as well as Indian Institute of Technology Jodhpur for scholarship and JuniorResearch Fellowship, respectively. The funders had no role in study design, data collection andanalysis, decision to publish, or preparation of the manuscript.
Author ContributionsConceived and designed the experiments: GB. Performed the experiments: AJ RNK GB. Ana-lyzed the data: GB AJ RNK. Wrote the paper: GB AJ RNK.
References1. Navarrete A, Schaik CPV, Isler K. Energetics and the evolution of human brain size. Nature. 2011;
480:91–93. doi: 10.1038/nature10629 PMID: 22080949
2. Richard Wrangham. Catching fire: how cooking made us human. Basic Books; 2009.
3. Fonseca-Azevedo K, Herculano-Houzel S. Metabolic constraint imposes tradeoff between body sizeand number of brain neurons in human evolution. Proceedings of the National Academy of Sciences ofthe United States of America. 2012 Nov; 109(45):18571–6. doi: 10.1073/pnas.1206390109 PMID:23090991
4. Pollan M. Cooked: A Natural History of Transformation. Penguin Books; 2014.
5. Weber S, Kashyap A, Mounce L. Archaeobotany at Farmana: new insights into Harappan plant usestrategies. In: Shinde V, Osada T, Kumar M, editors. Excavations at Farmana, District Rohtak, Hary-ana, India. Kyoto: Nakanish Printing; 2011. p. 808–823. Available: http://anthro.vancouver.wsu.edu/media/PDF/archaeobotany_at_Farmana_2011.pdf
6. Kashyap A, SteveW. Harappan plant use revealed by starch grains from Farmana. Antiquity. 2010; 84(326). Available: http://antiquity.ac.uk/projgall/kashyap326/
7. Lawler A. The Ingredients for a 4000-Year-Old Proto-Curry. Science. 2012; 337(6092):288. doi: 10.1126/science.337.6092.288-a
8. Appadurai A. How to Make a National Cuisine: Cookbooks in Contemporary India. Comparative Stud-ies in Society and History. 2009 Jun; 30(01):3–24. doi: 10.1017/S0010417500015024
9. Sherman PW, Billing J. Darwinian Gastronomy: Why we use spices. Spices taste good because theyare good for us. Bioscience. 1999; 49(6):453–463. doi: 10.2307/1313553
10. Zhu YX, Huang J, Zhang ZK, Zhang QM, Zhou T, Ahn YY. Geography and similarity of regional cuisinesin China. PloS one. 2013 Jan; 8(11):e79161. doi: 10.1371/journal.pone.0079161 PMID: 24260166
11. Birch LL. Development of food preferences. Annual Review of Nutrition. 1999; 19:41–62. doi: 10.1146/annurev.nutr.19.1.41 PMID: 10448516
12. Ventura AK, Worobey J. Early influences on the development of food preferences. Current biology: CB.2013 May; 23(9):R401–8. doi: 10.1016/j.cub.2013.02.037 PMID: 23660363
13. Blumenthal H. The big fat duck cookbook. Bloomsbury Publishing PLC; 2008.
14. Ahnert SE. Network analysis and data mining in food science: the emergence of computational gastron-omy. Flavour. 2013; 2(4):1–4. Available: http://www.flavourjournal.com/content/2/1/4
15. Ahn YY, Ahnert SE, Bagrow JP, Barabási AL. Flavor network and the principles of food pairing. Scien-tific reports. 2011 Jan; 1:196. doi: 10.1038/srep00196
16. Jain A, Rakhi N, Bagler G. Spices form the basis of food pairing in Indian cuisine. arXiv:150203815.2015;p. 1–30. Available: arxiv:1502.03815. Accessed 2 June 2015.
17. Varshney LR, Pinel F, Varshney KR, Bhattacharjya D, Schoergendorfer A, Chee YM. A Big DataApproach to Computational Creativity. 2013 Nov;(October 2013):1–16. Available: arxiv:1311.1213.Accessed 2 June 2015.
Analysis of Food Pairing in Regional Cuisines of India
PLOS ONE | DOI:10.1371/journal.pone.0139539 October 2, 2015 16 / 17

18. Teng CY, Lin YR, Adamic LA. Recipe recommendation using ingredient networks; 2012. Available:arxiv:1111.3919v3. Accessed 2 June 2015.
19. Dalal T. Tarladalal.com; 2014. Available: http://www.tarladalal.com/ Accessed 1 February 2015.
20. Atridevji Gupt. Swami Agnivesha’s Charaka Samhita. 2nd ed. Banaras: Bhargav Pustakalay; 1948.
21. Valiathan MS. The Legacy of Caraka. Universities Press; 2010.
22. Pande GS, Chunekar KC. Bhavprakash Nighantu. Varanasi: Chaukhambha Bharti Academy; 2002.
23. Tapsell LC, Hemphill I, Cobiac L, Sullivan DR, Fenech M, Patch CS, et al. Health benefits of herbs andspices: the past, the present, the future. Medical Journal of Australia. 2006; 185(4):S1–S24.
24. Johri RK, Zutshi U. An Ayurvedic formulation ‘Trikatu’ and its constituents. Journal of Ethnopharmacol-ogy. 1992 Sep; 37(2):85–91. doi: 10.1016/0378-8741(92)90067-2 PMID: 1434692
25. Krishnaswamy K. Traditional Indian spices and their health significance. Asia Pacific journal of clinicalnutrition. 2008 Jan; 17 Suppl 1:265–268. PMID: 18296352
26. Billing J, Sherman PW. Antimicrobial functions of spices: why some like it hot. The Quarterly review ofbiology. 1998 Mar; 73(1):3–49. doi: 10.1086/420058 PMID: 9586227
27. Rakshit M, Ramalingam C. Screening and Comparision of Antibacterial Activity of Indian Spices. Jour-nal of Experimental Sciences. 2010; 1(7):33–36.
28. Perumal S, Dubey K, Badhwar R, George KJ, Sharma RK, Bagler G, et al. Capsaicin inhibits collagenfibril formation and increases the stability of collagen fibers.; 2014.
29. Burdock GA. Fenaroli’s Handbook of Flavor Ingredients. 6th ed. CRC Press; 2010.
Analysis of Food Pairing in Regional Cuisines of India
PLOS ONE | DOI:10.1371/journal.pone.0139539 October 2, 2015 17 / 17