Novel Method for Pairing Wood Samples in Choice Tests
7
Novel Method for Pairing Wood Samples in Choice Tests Sebastian Oberst 1 *, Theodore A. Evans 2 , Joseph C. S. Lai 1 1 Acoustics & Vibration Unit, School of Engineering and Information Technology, The University of New South Wales, Canberra, Australia, 2 Department of Biological Sciences, National University of Singapore, Singapore Abstract Choice tests are a standard method to determine preferences in bio-assays, e.g. for food types and food additives such as bait attractants and toxicants. Choice between food additives can be determined only when the food substrate is sufficiently homogeneous. This is difficult to achieve for wood eating organisms as wood is a highly variable biological material, even within a tree species due to the age of the tree (e.g. sapwood vs. heartwood), and components therein (sugar, starch, cellulose and lignin). The current practice to minimise variation is to use wood from the same tree, yet the variation can still be large and the quantity of wood from one tree may be insufficient. We used wood samples of identical volume from multiple sources, measured three physical properties (dry weight, moisture absorption and reflected light intensity), then ranked and clustered the samples using fuzzy c-means clustering. A reverse analysis of the clustered samples found a high correlation between their physical properties and their source of origin. This suggested approach allows a quantifiable, consistent, repeatable, simple and quick method to maximize control over similarity of wood used in choice tests. Citation: Oberst S, Evans TA, Lai JCS (2014) Novel Method for Pairing Wood Samples in Choice Tests. PLoS ONE 9(2): e88835. doi:10.1371/journal.pone.0088835 Editor: Lee A. Newsom, The Pennsylvania State University, United States of America Received May 15, 2013; Accepted January 13, 2014; Published February 14, 2014 Copyright: ß 2014 Oberst et al. This is an open-access article distributed under the terms of the Creative Commons Attribution License, which permits unrestricted use, distribution, and reproduction in any medium, provided the original author and source are credited. Funding: This research was supported under Australian Research Council’s Discovery Projects funding scheme (project number DP110102564). The funders had no role in study design, data collection and analysis, decision to publish, or preparation of the manuscript. Competing Interests: The authors have declared that no competing interests exist. * E-mail: [email protected] Introduction Choice-tests are perhaps the most common experimental method used to determine preferences of insects, especially for food. A simple ISI search for papers on ‘choice tests’ to determine food preferences of insects found around 600 papers from the past decade. One common use of food choice tests is to determine food additives (e.g. bait substrates, attractants, toxicants) for pest control applications, e.g. for cockroaches [1,2], moths [3], ants [4,5] and termites [6]. Choice-tests for food additives in artificial foods are straightfor- ward as the base food matrix is identical across the choices under test. Those for food additives in natural foods are more problematic as the natural foods are often highly variable, thus the palatability of the base matrix may confound the effect of the food additive. Wood is such a variable food, not just between tree species but within any one tree species, owing to the age of the fibre, the horizontal (sapwood versus heartwood) and vertical position within the stem as well as ecological (e.g. growth site and conditions: natural vs. plantation, growth rate) and functional (e.g. stems vs. branches, reaction wood formed in leaning stems and branches and juvenile vs. mature growth) variations [7,8,9,10]. Such variation has been demonstrated to affect termite consump- tion of wood, especially due to the age of a tree [11,12,13]. Other factors identified include moisture [14,15] or previous termite attack [16]. Hence the interpretation of wood loss in choice experiments [17,18,19,20,21] may not be straight forward because wood consumption may have differed due to inter-sample palatability as well. Attempts to reduce this natural variation have used sequentially cut wood [22,23,24]; however, there is variation in the wood quality within logs cut from the same tree [25,26], owing to growth increment variation, for example. Complicating this limitation is unknown provenance, when wood for laboratory experiments on termites may have been sourced from retailers. This is most problematic for large experiments that require more wood samples than one retail sourced cut length of timber can provide. A simple, consistent, repeatable method to characterise wood using easy to measure physical properties would reduce the variability within samples for choice tests, and thus increase confidence in results. The aim of this paper is to test the similarity of wood samples cut sequentially from different Pinus radiata sources, by applying fuzzy c-means clustering [27,28], to three simple measurements of physical properties: dry weight, moisture absorption and reflected light intensity. Fuzziness in the algorithm allows selecting wood pieces from different clusters which accounts therefore for the uncertainty of material properties that are not measured. Materials and Methods Physical Properties of Wood The wood used was plantation grown P. radiata, cut as veneer into sheets (ca. 1250 mm6 25 mm6 1 mm), from a retailer; thus the source trees were unknown. Veneer discs (60 mm ) were punched from each sheet and were given a unique identification code, which included the original sheet from which the samples were cut (hence ‘sheet membership’). Only undamaged veneer discs without knotholes and obvious fungal attack were chosen. Two sets of veneer discs were prepared, for which the veneer was most likely from different trees or even different geographical PLOS ONE | www.plosone.org 1 February 2014 | Volume 9 | Issue 2 | e88835
Transcript of Novel Method for Pairing Wood Samples in Choice Tests

Novel Method for Pairing Wood Samples in Choice TestsSebastian Oberst1*, Theodore A. Evans2, Joseph C. S. Lai1
1 Acoustics & Vibration Unit, School of Engineering and Information Technology, The University of New South Wales, Canberra, Australia, 2 Department of Biological
Sciences, National University of Singapore, Singapore
Abstract
Choice tests are a standard method to determine preferences in bio-assays, e.g. for food types and food additives such asbait attractants and toxicants. Choice between food additives can be determined only when the food substrate issufficiently homogeneous. This is difficult to achieve for wood eating organisms as wood is a highly variable biologicalmaterial, even within a tree species due to the age of the tree (e.g. sapwood vs. heartwood), and components therein(sugar, starch, cellulose and lignin). The current practice to minimise variation is to use wood from the same tree, yet thevariation can still be large and the quantity of wood from one tree may be insufficient. We used wood samples of identicalvolume from multiple sources, measured three physical properties (dry weight, moisture absorption and reflected lightintensity), then ranked and clustered the samples using fuzzy c-means clustering. A reverse analysis of the clustered samplesfound a high correlation between their physical properties and their source of origin. This suggested approach allows aquantifiable, consistent, repeatable, simple and quick method to maximize control over similarity of wood used in choicetests.
Citation: Oberst S, Evans TA, Lai JCS (2014) Novel Method for Pairing Wood Samples in Choice Tests. PLoS ONE 9(2): e88835. doi:10.1371/journal.pone.0088835
Editor: Lee A. Newsom, The Pennsylvania State University, United States of America
Received May 15, 2013; Accepted January 13, 2014; Published February 14, 2014
Copyright: � 2014 Oberst et al. This is an open-access article distributed under the terms of the Creative Commons Attribution License, which permitsunrestricted use, distribution, and reproduction in any medium, provided the original author and source are credited.
Funding: This research was supported under Australian Research Council’s Discovery Projects funding scheme (project number DP110102564). The funders hadno role in study design, data collection and analysis, decision to publish, or preparation of the manuscript.
Competing Interests: The authors have declared that no competing interests exist.
* E-mail: [email protected]
Introduction
Choice-tests are perhaps the most common experimental
method used to determine preferences of insects, especially for
food. A simple ISI search for papers on ‘choice tests’ to determine
food preferences of insects found around 600 papers from the past
decade. One common use of food choice tests is to determine food
additives (e.g. bait substrates, attractants, toxicants) for pest control
applications, e.g. for cockroaches [1,2], moths [3], ants [4,5] and
termites [6].
Choice-tests for food additives in artificial foods are straightfor-
ward as the base food matrix is identical across the choices under
test. Those for food additives in natural foods are more
problematic as the natural foods are often highly variable, thus
the palatability of the base matrix may confound the effect of the
food additive. Wood is such a variable food, not just between tree
species but within any one tree species, owing to the age of the
fibre, the horizontal (sapwood versus heartwood) and vertical
position within the stem as well as ecological (e.g. growth site and
conditions: natural vs. plantation, growth rate) and functional (e.g.
stems vs. branches, reaction wood formed in leaning stems and
branches and juvenile vs. mature growth) variations [7,8,9,10].
Such variation has been demonstrated to affect termite consump-
tion of wood, especially due to the age of a tree [11,12,13]. Other
factors identified include moisture [14,15] or previous termite
attack [16].
Hence the interpretation of wood loss in choice experiments
[17,18,19,20,21] may not be straight forward because wood
consumption may have differed due to inter-sample palatability as
well. Attempts to reduce this natural variation have used
sequentially cut wood [22,23,24]; however, there is variation in
the wood quality within logs cut from the same tree [25,26], owing
to growth increment variation, for example. Complicating this
limitation is unknown provenance, when wood for laboratory
experiments on termites may have been sourced from retailers.
This is most problematic for large experiments that require more
wood samples than one retail sourced cut length of timber can
provide.
A simple, consistent, repeatable method to characterise wood
using easy to measure physical properties would reduce the
variability within samples for choice tests, and thus increase
confidence in results. The aim of this paper is to test the similarity
of wood samples cut sequentially from different Pinus radiata
sources, by applying fuzzy c-means clustering [27,28], to three simple
measurements of physical properties: dry weight, moisture
absorption and reflected light intensity. Fuzziness in the algorithm
allows selecting wood pieces from different clusters which accounts
therefore for the uncertainty of material properties that are not
measured.
Materials and Methods
Physical Properties of WoodThe wood used was plantation grown P. radiata, cut as veneer
into sheets (ca. 1250 mm625 mm61 mm), from a retailer; thus
the source trees were unknown. Veneer discs (60 mm ) were
punched from each sheet and were given a unique identification
code, which included the original sheet from which the samples
were cut (hence ‘sheet membership’). Only undamaged veneer
discs without knotholes and obvious fungal attack were chosen.
Two sets of veneer discs were prepared, for which the veneer
was most likely from different trees or even different geographical
PLOS ONE | www.plosone.org 1 February 2014 | Volume 9 | Issue 2 | e88835
locations. In any case the two sets represented a variation in sets
for the statistical analysis: for the Small Set, N = 505 discs were cut
from 10 sheets; and for the Large Set, N = 1417 discs were cut
from 22 sheets. For both sets three physical properties were
measured. (1) The dry weight was recorded after discs were held
for 7 hrs at 105uC in a drying oven (4 hrs for weight to be
stabilised). (2) The moisture absorption was recorded as a
percentage of the dry weight, with the oven dried veneer discs
kept for 4 days at 28uC and 80% RH, calculated as (wet weight –
dry weight)/dry weight6100. All weights were measured to four
significant figures (AEA 250 g, Adam Equipment Co Ltd, Milton
Keynes, UK). (3) The brightness was recorded as the mode-
skewness of the reflected light (pixel intensity (I) distribution) from
digital photographs (166061200 pixels) taken with a tripod
mounted camera (m tough 12 MP, Olympus). Flash was not used
to avoid 50 Hz flickering; instead constant lighting was provided
by six arrays of white LED packages (ea. 2563 mm LEDs, avg.
I = 5 cd (ea.), peak wavelength at 465 nm). The mode skewness of
the reflected light calculated as (mean - mode)/standard deviation
[29] was used as an estimate of the ratio of early- and late wood in
the sapwood to heartwood, as the former is pale (negative mode
skewness) and the latter is dark.
Photographs of 2 MP were found sufficient as distributions of
photographs with higher resolutions (3 or 5 MP) did not show
different results in distribution parameters but increased the
computational load from 8 hrs to 1 and 3 days respectively.
Images were processed from 16 bit colour depth to 8 bit (gray) and
a cut-off pixel intensity of 60 was selected from plotting sorted
veneer intensities over pixels for all discs; pixels with I ,60
represented black background and were discarded. The intensity
distribution and its mode-skewness were calculated for each veneer
disc. Signal processing and optimisation was performed in Matlab
R2012 and the statistical analyses were performed with RStudio
0.97.332 and R x64.2.13.1.
Determination of SimilarityThe analysis process had three steps. Step 1 calculated fuzzy c-
means derived from the measured physical properties only; in
other words the origin of the veneer discs was not known. Step 2
used the known origin of the veneer discs, here termed ‘sheet
membership’, to search for neighbouring veneer discs. Step 3 from
fuzzy c-means derived clusters, uniform distributions was assigned
to sheet membership in each cluster found in the experimental
data with the same length (referred to as ‘experimental uniform
data’). This ‘experimental uniform data’ was benchmarked against
a hypergeometric distribution, thus allowing the effectiveness of
fuzzy c-means clustering to find similar veneer discs to be assessed.
The hypergeometric distribution describes a process equivalent to
drawing balls from an urn but without replacement [30]. For this
purpose the clustered groups were subsequently degraded in order
to benchmark the clustering algorithm by comparing the effect of
having completely randomised draws and the effect of the size of
the population on the sorting quality of the fuzzy c-means
clustering. Benchmarks with respect to neighbourhood size and
the significance of the performance of the clustering algorithm
with respect to medians calculated were discussed.
ClusteringA statistical cluster analysis used optimised subsets to group
elements. Fuzziness was implemented to take the uncertainty into
account, e.g. by assigning one veneer disc to several clusters.
Fuzziness also implies that the method approximates ‘‘non-crisp’’
(not optimal) values [28].
The fuzzy c-means clustering algorithm [28] was implemented
in Matlab R2012, and based on minimising the cost function
[27,28]
minfJmg~XN
i~1
XC
j~1
umij d DD xi{ci DD2 ,1 ƒ m v? ð1Þ
with m.1 being the fuzzifier (default m = 2), xi the ith vector of
dimension d, uij the element of the partition matrix of the veneer
disc xi in a cluster j describing the membership grade, and with
||.||2 as the Euclidean distance between the vector ([R3) and its
cluster centre to be evaluated (cj is the number of clusters). Fuzzy c-
means clustering iteratively approximated the mean centroid of
each cluster, from which a membership value for each veneer disc
was calculated based on the strength of the association between the
element and the centroid. A list of veneer discs from each cluster
was sorted in descending membership order; the closer the
membership to 1, the more the veneer disc belongs to the cluster.
In order to partition each cluster in one set with unique
membership and one fuzzy set, a second distance function was
applied to sub-cluster veneer discs in subsets of lower membership
(uij ,0.5) into a fuzzy region.
Sorting Quality and StatisticsThe fuzzy c-means algorithm gives clusters which are optimised
according to their material properties and are characterised by (1)
a sequence of veneer discs, (2) sheet memberships of veneer discs
and (3) number of veneer discs in the cluster (referred to as cluster
length). The accuracy of the assignment of veneer discs into similar
groups using fuzzy c-means clustering process was tested by
comparing these groups with sheet membership.
Veneer discs were mapped using their descending membership
grade order in each cluster list, which created a spiral in a 3-
dimensional veneer disc property space, starting from a region
with unique cluster membership, and ending in a fuzzy region.
The clustering can therefore be seen as a mapping from the 3-
dimensional space onto a 1-dimensional subspace of membership
grades.
Fi(X § 1) ~XN
k1½DDli{lkzj DD~0,Vj~1,2,:::,i� ð2Þ
Equation (2) gives a Euclidean distance as an argument of the
indicator (or characteristic) function 1½:� [ f0,1g [29]. The indica-
tor function searched for neighbouring veneer discs from the same
sheet, which were then given a value of one, all others assigned
zero. The percentage of successful neighbour searches relative to
the population’s vector length was calculated for each neighbour-
hood size. From the centroid, the optimisation procedure moved
iteratively outwards, such that the neighbourhood size was
successively increased, by checking first direct neighbours, then
second neighbours and so on. The percentage of neighbours was
subsequently interpreted as the probability of encountering at least
one neighbour of the same sheet Fi(X § 1) for discrete
neighbourhood widths k v i [ f1,2,:::,10g , k = i. This was com-
pared to 8 averages of bootstrapped uniform data of clusters of the
same length and all sheet memberships as the experimental data
and a hypergeomeric distribution (n = 8000 draws).
In order to find out the influence of the cluster length obtained
by fuzzy c-means clustering, the probabilities to encounter
neighbours were benchmarked against bootstrapped uniform
distributions of sheet membership, first for clusters with the same
Novel Method for Pairing Wood Samples
PLOS ONE | www.plosone.org 2 February 2014 | Volume 9 | Issue 2 | e88835
length as the experimental data and then for clusters with identical
length.
Thus the order of sheet membership was randomised so that the
membership matrix (i.e. the list) for each cluster was not sorted.
This corresponded to theoretical sets of identical weighted values,
hence reduced the dependency of the measured wood properties,
which led to the degradation of results obtained by the
optimisation algorithm. For clusters with identical lengths, the
bootstrapped averaged samples (8 repeats) for the Small Set had a
total number of 360 veneer disc samples per sheet (10 sheets with
n = 36 veneer discs each) and for the Large Set 506 veneer discs (22
sheets, n = 23 veneer discs each).
Distribution (Lilliefors-test) and significance tests (Student’s t-
test or Fisher’s one-way ANOVA) were used to determine whether
differences in the probability in encountering at least one direct
neighbour were statistically significant for the ‘experimental
uniform data’.
Results
Physical Properties of WoodThe physical properties of veneer discs are plotted in Figure 1,
with vertical lines separating veneer discs from different sheets The
average dry weight was 1:24+ 0:12 g (the Small Set) and
1:23+ 0:12 (the Large Set); the average moisture absorption was
12:26+ 1:88% (the Small Set) and 12:19+ 0:88% (the Large
Set); and the average mode-skewness was 0:312+ 0:165 (the
Small Set) and 1:24+ 0:12{0:085+ 0:392 (the Large Set). A
randomly drawn two sample homoscedastic t-test showed that for
weight and moisture absorption, the hypothesis that the property’s
means are equal could not be rejected (df = 1750, p = 0.990 and
p = 0.885), while for the skewness this could not be assumed
(df = 1750, p = 0). The confidence intervals (ci) on the difference
between the means did contain zero for dry weight and moisture
(ci = [20.0044, 0.0042] and ci = [20.0059, 0.0038]) but not for the
mode skewness (ci = [0.2269,0.2426]).
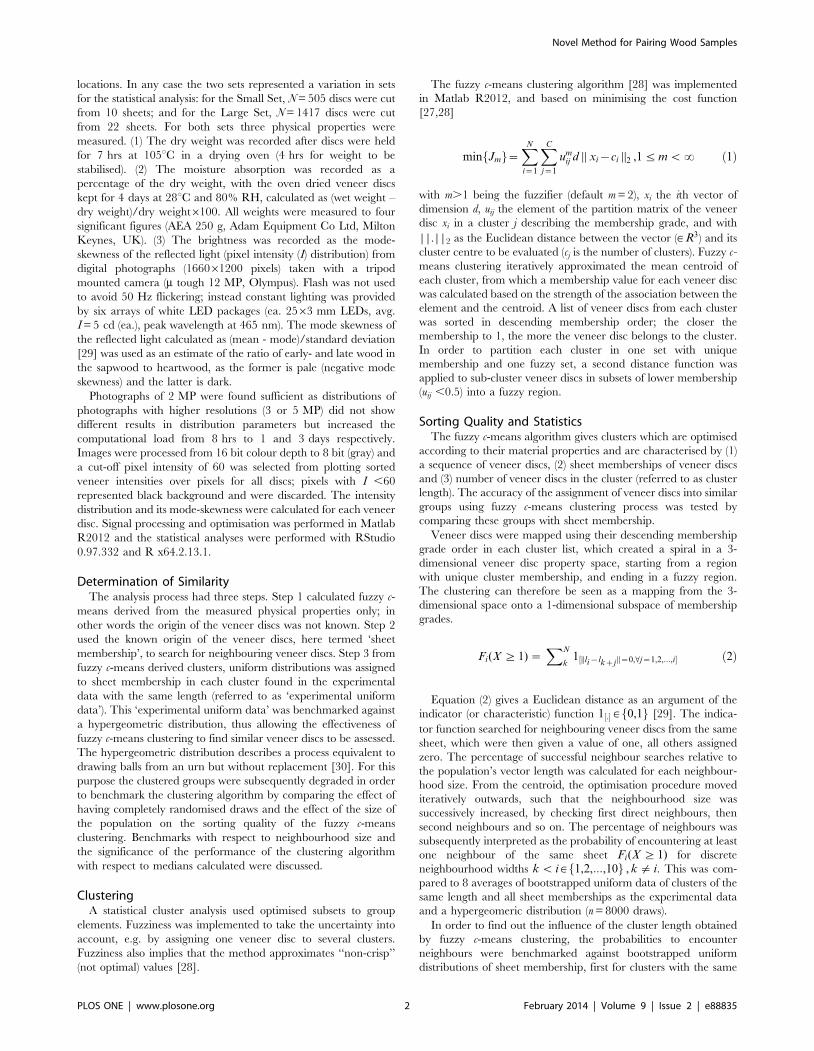
ClusteringFor the Small Set (Figure 2A) all cluster centres were in regions
of negative mode-skewness, which indicated that most of the wood
veneer had more bright (early wood) than dark (late wood) regions
[31]. The cost function was minimised to 3.5 after 15 iterations.
For the Large Set (Figure 2B) the inner parts of the six clusters
(unique membership) are depicted together with their centres,
surrounded by elements with weaker membership which could
belong to more than one cluster (in gray). The cost function
converged after 15 iterations to a lower value, about 2.9.
Therefore, it was easier to distinguish clusters for data from the
Large Set than for the Small Set, where differences between
measurements were larger with also a smaller value of the cost
function. For the Large Set four of the six centres were in regions
of negative skewness, indicating that most of the wood veneer had
more bright (early wood) than dark (late wood) regions.
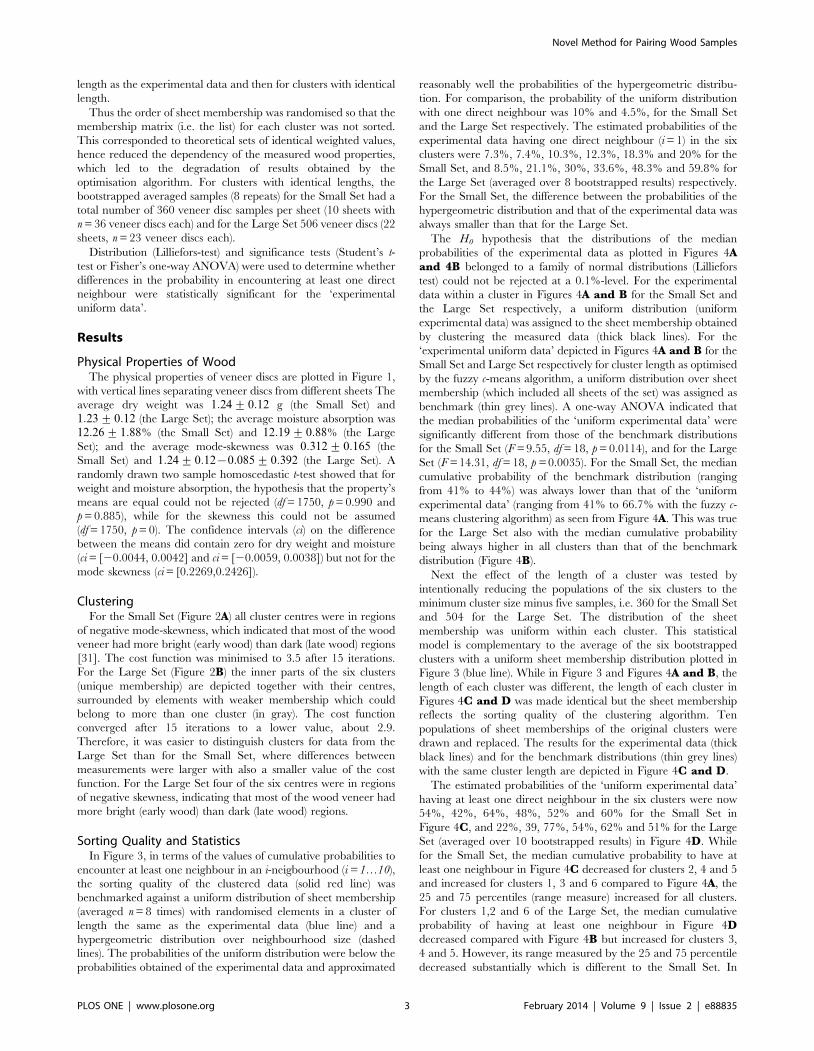
Sorting Quality and StatisticsIn Figure 3, in terms of the values of cumulative probabilities to
encounter at least one neighbour in an i-neigbourhood (i = 1…10),
the sorting quality of the clustered data (solid red line) was
benchmarked against a uniform distribution of sheet membership
(averaged n = 8 times) with randomised elements in a cluster of
length the same as the experimental data (blue line) and a
hypergeometric distribution over neighbourhood size (dashed
lines). The probabilities of the uniform distribution were below the
probabilities obtained of the experimental data and approximated
reasonably well the probabilities of the hypergeometric distribu-
tion. For comparison, the probability of the uniform distribution
with one direct neighbour was 10% and 4.5%, for the Small Set
and the Large Set respectively. The estimated probabilities of the
experimental data having one direct neighbour (i = 1) in the six
clusters were 7.3%, 7.4%, 10.3%, 12.3%, 18.3% and 20% for the
Small Set, and 8.5%, 21.1%, 30%, 33.6%, 48.3% and 59.8% for
the Large Set (averaged over 8 bootstrapped results) respectively.
For the Small Set, the difference between the probabilities of the
hypergeometric distribution and that of the experimental data was
always smaller than that for the Large Set.
The H0 hypothesis that the distributions of the median
probabilities of the experimental data as plotted in Figures 4Aand 4B belonged to a family of normal distributions (Lilliefors
test) could not be rejected at a 0.1%-level. For the experimental
data within a cluster in Figures 4A and B for the Small Set and
the Large Set respectively, a uniform distribution (uniform
experimental data) was assigned to the sheet membership obtained
by clustering the measured data (thick black lines). For the
‘experimental uniform data’ depicted in Figures 4A and B for the
Small Set and Large Set respectively for cluster length as optimised
by the fuzzy c-means algorithm, a uniform distribution over sheet
membership (which included all sheets of the set) was assigned as
benchmark (thin grey lines). A one-way ANOVA indicated that
the median probabilities of the ‘uniform experimental data’ were
significantly different from those of the benchmark distributions
for the Small Set (F = 9.55, df = 18, p = 0.0114), and for the Large
Set (F = 14.31, df = 18, p = 0.0035). For the Small Set, the median
cumulative probability of the benchmark distribution (ranging
from 41% to 44%) was always lower than that of the ‘uniform
experimental data’ (ranging from 41% to 66.7% with the fuzzy c-
means clustering algorithm) as seen from Figure 4A. This was true
for the Large Set also with the median cumulative probability
being always higher in all clusters than that of the benchmark
distribution (Figure 4B).
Next the effect of the length of a cluster was tested by
intentionally reducing the populations of the six clusters to the
minimum cluster size minus five samples, i.e. 360 for the Small Set
and 504 for the Large Set. The distribution of the sheet
membership was uniform within each cluster. This statistical
model is complementary to the average of the six bootstrapped
clusters with a uniform sheet membership distribution plotted in
Figure 3 (blue line). While in Figure 3 and Figures 4A and B, the
length of each cluster was different, the length of each cluster in
Figures 4C and D was made identical but the sheet membership
reflects the sorting quality of the clustering algorithm. Ten
populations of sheet memberships of the original clusters were
drawn and replaced. The results for the experimental data (thick
black lines) and for the benchmark distributions (thin grey lines)
with the same cluster length are depicted in Figure 4C and D.
The estimated probabilities of the ‘uniform experimental data’
having at least one direct neighbour in the six clusters were now
54%, 42%, 64%, 48%, 52% and 60% for the Small Set in
Figure 4C, and 22%, 39, 77%, 54%, 62% and 51% for the Large
Set (averaged over 10 bootstrapped results) in Figure 4D. While
for the Small Set, the median cumulative probability to have at
least one neighbour in Figure 4C decreased for clusters 2, 4 and 5
and increased for clusters 1, 3 and 6 compared to Figure 4A, the
25 and 75 percentiles (range measure) increased for all clusters.
For clusters 1,2 and 6 of the Large Set, the median cumulative
probability of having at least one neighbour in Figure 4Ddecreased compared with Figure 4B but increased for clusters 3,
4 and 5. However, its range measured by the 25 and 75 percentile
decreased substantially which is different to the Small Set. In
Novel Method for Pairing Wood Samples
PLOS ONE | www.plosone.org 3 February 2014 | Volume 9 | Issue 2 | e88835

Figure 1. Veneer disc properties of dry weight (A & B), moisture absorption (C & D) and mode-skewness of pixel intensity (E & F) forthe Small Set (N = 505) and the Large Set (N = 1417); vertical lines indicate different source sheets.doi:10.1371/journal.pone.0088835.g001
Novel Method for Pairing Wood Samples
PLOS ONE | www.plosone.org 4 February 2014 | Volume 9 | Issue 2 | e88835
Figure 2. The six clusters formed of dry weight, moisture absorption and mode skewness obtained by fuzzy c-means optimisationalgorithm; A Small Set and B Large Set. Large red markers are the cluster centres; medium black and yellow dots are members of only onecluster; small grey dots are members of more than one cluster.doi:10.1371/journal.pone.0088835.g002
Figure 3. Cumulative probabilities of having at least one discrete neighbour in a neighbourhood i = 1…10; A Small Set and B LargeSet. Solid red lines are the original distribution optimised with fuzzy c-clustering; solid blue line is the average (n = 8) of the six bootstrapped clusters(same length as the original cluster length but bootstrapped over a uniform distribution of sheet membership of all sheets); dotted grey lines are thehypergeometric (analytical) cumulative density functions.doi:10.1371/journal.pone.0088835.g003
Novel Method for Pairing Wood Samples
PLOS ONE | www.plosone.org 5 February 2014 | Volume 9 | Issue 2 | e88835

comparison, for both the Small Set and the Large Set depicted in
Figure 4C and D the probability to obtain at least one neighbour
using a benchmark distribution was always lower.
Discussion
Although the difference between the Small and Large Set for
the mode skewness of the reflected light intensity was statistically
significant, it was not true for the other two properties (dry weight
and moisture absorption) and the assignment to the original sheets
of veneer with respect to one set was not obvious to visual
inspection (c.f. Figure 1). However, the clustering algorithm was
able to place the veneer discs into clusters that match their original
source veneer sheets by using just the three measurements of
physical properties. Within clusters, each veneer disc could be
matched to its nearest neighbour by a threshold probability for the
closest pair to be used in choice experiments.
The results for the Large Set indicated a higher probability to
encounter at least one neighbour and hence it was more likely for
the wood of the same sheet to have the same membership grade in
the clusters obtained by fuzzy c-means clustering (Figure 3). The
Small Set was more difficult to cluster, as reflected by a 20.6%
higher cost function, owing to the smaller sample size and little
variation in the mode skewness of the reflected light intensity (c.f.
Figure 2). However, the clustering algorithm is robust enough to
enable clusters to be formed even under these limitations.
Figures 4A and B show that for both the Small and Large Sets,
even when the sheet membership of each cluster was randomized
with a uniform distribution of sheet membership (‘uniform
experimental data’), there was a high correlation between the
veneer discs and the sheets from which they were cut. This
observation was also true even when the length of each cluster was
made identical (‘balanced’ analysis) within the Small Set and the
Large Set (Figures 4C and D). As only three simple measured
physical properties were used here, the power of the clustering
algorithm could be improved to enable more precise matches by
including additional physical properties such as damping, resonant
frequencies.
The standard approach of pairing matched wood samples
contains ‘‘uncontrolled variations’’ which may significantly influ-
ence the outcomes of choice experiments. Results here show that
when the wood source or species is unknown, the fuzzy c-means
clustering will give higher confidence in pairing matched wood
samples. When the wood source and species is known, the same
process will give a more precise match. The fuzzy c-means
clustering process allows a greater potential to control the least
controlled variable in bio-assay type experiments so that results
can be attributed more confidently to the applied treatments under
test, such as food additives.
Author Contributions
Analyzed the data: SO. Contributed reagents/materials/analysis tools: SO
TAE JCSL. Wrote the paper: SO JCSL TAE.
Figure 4. Box plots for the six clusters showing the cumulative probability to obtain at least one same sheet with respect to theneighbourhood function;+are outliers. Bootstrapped (n = 8) ‘uniform experimental data’ based on the original distribution (thick black lines)benchmarked against uniform distributions (n = 8) with the length of each cluster the same as the experimental data: A Small Set (N = 505) and BLarge Set (N = 1417); and with identical cluster length for each set: C Small Set (N = 360) and D Large Set (N = 506).doi:10.1371/journal.pone.0088835.g004
Novel Method for Pairing Wood Samples
PLOS ONE | www.plosone.org 6 February 2014 | Volume 9 | Issue 2 | e88835

References
1. Strong C, Koehler P, Patterson R (1993) Oral toxicity and repellency of borates
to German cockroaches (Dictyoptera: Blattellidae) Journal of Economic
Entomology 86(5): 1458–1463.
2. Gore C, Schal C (2004), Gene expression and tissue distribution of the major
human allergen Bla g 1 in the German cockroach, Blattella germanica L.
(Dictyoptera: Blattellidae), Journal of Medical Entomology 41(5): 953–960.
3. Farrar R Jr, Ridgway RL (1994) Comparative studies of the effects of nutrient-
based phagostimulants on six Lepidopterous insect pests, Journal of Economic
Entomology 87(1): 44–52.
4. Rust M, Reierson D, Klotz J (2004) Delayed toxicity as a critical factor in the
efficacy of aqueous baits for controlling argentine ants (Hymenoptera:
Formicidae), Journal of Economic Entomology 97(3): 1017–1024.
5. Bluethgen N, Fiedler K (2004) Competition for composition; lessons from
nectar-feeding ant communities, Ecology 85(6): 1479–1485.
6. Chen J, Henderson G (1996) Determination of feeding preference of Formosan
subterranean termite (Coptotermes formosanus Shiraki) for some amino acid
additives, Journal of Chemical Ecology 22: 2359–2369.
7. Zobel BJ, Van Buijtenen J (1989) Wood variation - its causes and control,
Springer Verlag: Berlin.
8. Taylor G (2002) Populus: Arabidopsis for forestry. Do we need a model tree?,
Annals of Botany 90(6): 681–689.
9. Bucur V (2006) Acoustics of wood, Springer-Verlag Berlin Heidelberg.
10. Bowyer J, Shmulsky R, Haygreen J (2007) Forest products and wood science: an
introduction, Iowa State Univ. Press: Ames, Iowa.
11. Rudman P (1967) The causes of natural durability in timber. Pt. XXI The anti-
termitic activity of some fatty acids, esters and alcohols, Holzforschung 21(1): 24.
12. Rudman P, Gay F (1963) Causes of natural durability in timber. X. Deterrent
properties of some three-ringed carboxylic and heterocyclic substances to the
subterranean termite, Nasutitermes exitiosus. C.S.I.R.O. Div. Forest Prod.,
Melbourne, Holzforschung 17: 2125.
13. Lukmandaru G, Takahashi K (2008) Variation in the natural termite resistance
of teak (Tectona grandis Linn. fil.) wood as a function of tree age, Annals of Forest
Science 65: 708–708.
14. Delaplane K, La Face J (1989) Preference of the Formosa subterranean termite
(Isoptera: Rhinotermitidae) for wood damaged by conspecifics, Journal of
Economic Entomology 82(4): 1363–1366.
15. Gautam B, Henderson G (2011) Relative humidity preference and survival of
starved formosan subterranean termites (Isoptera: Rhinotermitidae) at various
temperature and relative humidity conditions’, Environmental Entomology
40(5): 1232–1238.
16. Delaplane K, La Fage J (1989) Preference for moist wood by the Formosan
subterranean termite (Isoptera: Rhinotermitidae), Journal of Economic Ento-mology 82(1): 95–100.
17. Lenz M (1985) Variability of vigour between colonies of Coptotermes acinaciformis
(Froggatt) (Isoptera: Rhinotermitidae) and its implications for laboratory
experimentation, Bulletin of Entomological Research 75: 13–21.
18. Waller D, La Fage J (1987) Food quality and foraging response by thesubterranean termite Coptotermes formosanus Shiraki (Isoptera: Rhinotermitidae),
Bulletin of Entomological Research 77: 417–42.19. Sornnuwat Y, Vongkaluang C, Yoshimura T, Tsunoda K, Takahashi M (1995)
Wood consumption and survival of the subterranean termite, Coptotermes gestroi
Wasmann using the Japanese standardized testing method and the modifiedwood block test in bottle, Wood Research: Bulletin of the wood research institute
Kyoto university 82: 8–13.20. Peters B, Fitzgerald C (1997) Susceptibility of softwood blocks to damage by
subterranean termites (Isoptera: Rhinotermitidae, Mastotermitidae), Materialund Organismen 31: 293–312.
21. Inta R, Lai JCS, Fu EW, Evans TA (2007) Termites live in a material world:
exploration of their ability to differentiate between food sources, Journal of TheRoyal Society Interface, 4(15): 735–744.
22. Lenz M (1994) Nourishment and evolution of insect societies, Westview Press,Boulder and Oxford and IBH Publ., New Delhi, chapter Food resources, colony
growth and caste development in wood feeding termites, 159–209.
23. Evans TA, Lai JCS, Toledano E, McDowall L, Rakotonarivo S et al. (2005)Termites assess wood size by using vibration signals, Proceedings of the National
Academy of Science, 102(10): 3732–3737.24. Evans TA, Inta R, Lai JCS, Prueger S, Foo NW et al. (2009) Termites eavesdrop
to avoid competitors, Proceedings of the Royal Society B: Biological Sciences276(1675): 4035–4041.
25. Cartwright KSG (1941) The variability in resistance to decay of the heartwood
of home-grown Western Red Cedar, Forestry 15(1): 65–75.26. Gominho J, Fernandez J, Pereira H (2001), Cynara cardunculus L. a new fibre crop
for pulp and paper production, Industrial Crops and Products 13(1), 1–10.27. Bezdek JC (1981) Pattern Recognition with Fuzzy Objective Function
Algorithms, Plenum Press, New York, NY.
28. Pal N, Bezdek J (1995) On cluster validity for the fuzzy c-means model, IEEETransactions on Fuzzy Systems, 3(3): 370–379.
29. Kennedy JF, Keeping ES (1962) Mathematics of Statistics, Pt.1, 3rd ed.,Princeton, NJ: Van Nostrand, p.101.
30. Kay S (2012) Intuitive Probability and Random Processes using MATLAB,Springer, New York.
31. Ilic J (1990) Hardwood Identification, CSIRO Australia.
Novel Method for Pairing Wood Samples
PLOS ONE | www.plosone.org 7 February 2014 | Volume 9 | Issue 2 | e88835