Products of wood smolder and their relation to wood-burning ...
96
A 11 IDS 7Ab3E7 NBSIR 88-3767 MBS PUBLICATIONS Products of Wood Smolder and Their Relation to Wood-Burning Stoves T. Ohiemiller W. Shaub U.S. DEPARTMENT OF COMMERCE National Bureau of Standards National Engineering Laboratory Center for Fire Research Gaithersburg, MD 20899 May 1988 Sponsored by: — QC U.S. Department of Energy 100 Washington, DC 20585 . U56 #88 1988
-
Upload
khangminh22 -
Category
Documents
-
view
2 -
download
0
Transcript of Products of wood smolder and their relation to wood-burning ...

A 11 IDS 7 A b 3 E 7
NBSIR 88-3767
MBS
PUBLICATIONS
Products of Wood Smolder andTheir Relation to Wood-BurningStoves
T. Ohiemiller
W. Shaub
U.S. DEPARTMENT OF COMMERCENational Bureau of Standards
National Engineering Laboratory
Center for Fire Research
Gaithersburg, MD 20899
May 1988
Sponsored by: —QCU.S. Department of Energy 100Washington, DC 20585
. U56
#88
1988


NBSIR 88-3767
PRODUCTS OF WOOD SMOLDER ANDTHEIR RELATION TO WOOD-BURNINGSTOVES
Research Information CenterNational Bureau of StandardsGaithersburg, Maryland 20899
NBsreu^ " c"
,
ojrc*'
Mo.
I
T. Ohlemiller
W. Shaub
U.S. DEPARTMENT OF COMMERCENational Bureau of Standards
National Engineering Laboratory
Center for Fire Research
Gaithersburg, MD 20899
May 1988
Sponsored by:
U.S. Department of Energy
Washington, DC 20585
U.S. DEPARTMENT OF COMMERCE, C. William Verity, Secretary
NATIONAL BUREAU OF STANDARDS, Ernest Ambler, Director

I

TABLE OF CONTENTS
Page
List of Tables IV
List of Figures V
Abstract 1
1. INTRODUCTION 2
2. EXPERIMENTAL APPARATUS AND PROCEDURE 4
2 . 1 Sample Configuration 4
2.2 Wood Combustion Chamber 5
2.3 Associated Equipment 6
2.4 Test Procedure 8
2 . 5 Condensate Analyses 10
3. WOOD SMOLDER: RESULTS AND DISCUSSION 11
3 . 1 Overall Behavior of Wood Smolder 11
3 . 2 Effect of Varying Air Flow Rate onOverall Behavior 13
3.3 Composition of the Evolved Products 18
3.4 Condensate Fingerprints 24
3.5 Rate of Heat Release . . . 26
3.6 Temperature Profiles: Implications forHeat Transfer 28
3.7 Gas Phase Pyrolysis and Oxidation Kinetics 32
4. CONCLUSIONS 1 37
5. ACKNOWLEDGEMENTS 38
6. REFERENCES 39
7. APPENDIX A 44
8. APPENDIX B 53
iii

LIST OF TABLES
Page
Table 1. Normalized Area Percentage of Some TarComponents 42
Table 2. Summary of Rate Constant Data 43
i
iv

LIST OF FIGURES
Page
Figure 1. Wood sample configuration and dimensions. Actualorientation of sample in wood combustion chamber is
same as that shown here 56
Figure 2. Schematic of wood combustion chamber with sample inplace. Windows at indicated positions on frontplate protrude outward away from the U- channel in thesample 57
Figure 3. Schematic of flow system supporting the woodcombustion chamber 58
Figure 4. Arrangement of thermocouple insertion points on the topside of the wood combustion chamber. These same spacingsare assumed to hold at the actual depth of thethermocouple junctions 59
Figure 5 (a) . Post- ignition smolder propagation rate as a function ofair flow along the U-channel for white pine. Thecross-hatching indicates the approximate position ofthe borders for extinction and for flaming 60
Figure 5 (b) . Post- ignition smolder propagation rate as a functionof air flow along the U-channel for red oak. The linewith the arrows indicates that in the two tests at orto the right of the line, flaming eventually developed 61
Figure 6. Maximum temperature on the interior surface of theU-channel as a function of air flow for red oak andwhite pine 62
Figure 7. Post- ignition weight loss rate for red oak and whitepine as a function of air flow in the U-channel 63
Figure 8. Apparent equivalence ratio of the wood smolder processaveraged over all test time subsequent to igniterremoval. This is shown for both red oak and whitepine as a function of air flow 64
Figure 9. Mass of wood gasified per mass of oxygen consumedaveraged over all test time subsequent to igniterremoval. This is shown for red oak and white pineas a function of air flow 65
Figure 10. Composition of the exhaust gases from a test of redoak at 13.3 cm/sec air velocity 66
Figure 11. Composition of the exhaust gases from a test of white
v

pine at 13.6 cm/sec air velocity 67
Figure 12. Composition of the exhaust gases from a test ofwhite pine at 15.3 cm/sec air velocity 68
Figure 13. Composition of the exhaust gases from a test ofwhite pine at 23.0 cm/sec air velocity. Flameserupted at the time indicated by the verticalline and the test was terminated 69
Figure 14. Composition of the exhaust gases from a test ofwhite pine. The air flow velocity was cut abruptlyat the time indicated by the vertical line from22.2 to 14.4 cm/sec. The flow was cut becauseflaming appeared imminent ' 70
Figure 15. Composition of the exhaust gases from a test ofwhite pine. The air flow decayed slowly through-out the post ignition period from a starting valueof 21.2 cm/sec to a final value of 17.4 cm/sec. Thedecay was caused by narrowing of a point in theexhaust line due to charred deposits 71
Figure 16. Composition of the exhaust gases from a test ofwhite pine at an air flow velocity of 8.7 cm/sec.The smoldering was virtually extinguished at thetime the test was terminated 72
Figure 17. Composition of the exhaust gases from a test ofred oak at an air velocity of 22.2 cm/sec. Flameserupted at the three points indicated. The firsttwo flaming episodes were terminated in seconds bycutting the air flow to the chamber; it was resumedwithin minutes 73
Figure 18. Composition of the exhaust gases from a test ofred oak at an air velocity of 10.4 cm/sec 74
Figure 19. Composition of the exhaust gases from a test ofred oak at an air velocity of 18.7 cm/sec. The testwas terminated when flames erupted *. 75
Figure 20. Average composition of products from the surface ofthe wood for the post- ignition period. Data forwhite pine as a function of air flow velocity 76
Figure 21. Average composition of products from the surfaceof the wood for the post- ignition period. Datafor red oak as a function of air flow velocity 77
Figure 22. Average yield of products from unit mass of
vi

gasified wood for post- ignition period. Data forwhite pine as a function of air flow velocity . .
.
Figure 23. Average yield of products from unit mass ofgasified wood for the post- ignition period. Datafor red oak as a function of air flow velocity .'.
Figure 24. Estimated, post- ignition period, average rate ofheat release as a function of air flow velocity.Data for red oak and white pine
Figure 25. Cross-sectional profiles of red oak at two airflow velocities with superimposed isotherms.Point at which maximum temperature was firstreached is also indicated. Note also the gaps atmid- depth due to shrinkage of the two pieces ofwood making up the bottom of the U- channel
Figure 26. Calculated profiles of three principal heattransfer modes for raising temperature of woodahead of the point at which the maximum surfacetemperature is achieved. Profiles are shown fortwo air flow velocities, superimposed on a cross-section of the base of the U- channel. Thequantities in parentheses are the integralsunder the curves and they pertain to a onecentimeter width of the channel periphery
Figure 27. Predicted (1/e) lifetimes of selected species inwood tar as a function of temperature. Predic-tions are for pyrolytic and oxidative degradation
78
79
80
81
82
83
vii

'
-
.

PRODUCTS OF WOOD SMOLDERAND THEIR RELATION TO WOOD-BURNING STOVES
T. J. Ohlemiller and W. Shaub
Abstract
The smoldering combustion of solid wood is a process pertinent to both fire
safety and to the generation of air pollutants in wood burning stoves;
fundamental aspects of this process are examined here in order to provide
insights into both of these problem areas. The wood configuration employed
here was designed to permit self -sustained smolder with visual access. The
sample was in the form of a U-shaped channel 74 cm long with 6.4 cm thick
walls . This sample was contained in a steel chamber which confined incoming
air to flow along the interior of the channel. Smoldering was initiated on
the interior surface of the upstream end of this channel and it propagated in
the same direction as the airflow (forward smolder) . Tests were conducted
with both red oak and white pine and both woods behaved quite similarly. In
separate tests the air flow velocity (referred to the initial cross section of
the channel) was varied from about 9 to 22 cm/sec. At the low end of this
range, the smoldering process was prone to extinction; at the high end it was
increasingly likely to transition into flaming combustion. The smolder
velocity, peak temperature, rate of heat and product evolution all increased
over this flow range in- an essentially linear manner. Analysis of the
temperature profiles in the wood pointed to a dominance of radiative transfer
in the smolder propagation process at low air flow rates and roughly equal
roles for radiation and convection at higher flow rates. The principal
species in the tar evolved from smoldering wood resemble, in large degree,
those from previous forced wood gasification experiments and those obtained
from a wood stove operated in a smoldering mode. This reinforces the previous
conclusion that air pollutants arise directly from wood smolder and change
little in passing through the firebox of a stove. Estimates of the kinetic
rates of destruction of several of these species by pyrolysis and by oxidation
further reinforce this idea. These same estimates imply that pollutant
1
species generated in a smoldering mode cannot be destroyed without either a
drastic re-design of the wood stove or the use of some form of afterburner.
1. INTRODUCTION
This report is a sequel to a previous publication entitled "Products of Wood
Gasification" [1] . Both that and the present report address the gasification
of wood in an attempt to shed light both on the fundamentals of wood
combustion and on the origins of the pollutant species that are emitted from
wood-burning stoves. In the previous study, the non- flaming gasification of
wood was examined in a highly idealized configuration -- the samples were 4
cm. cubes irradiated on one face. The effects of the large number of
parameters in that problem were examined one by one. Thus the effects of heat
flux and duration, ambient oxygen level, wood grain orientation, wood type and
moisture content, and sample thickness were all examined. For realistic
ranges of each of these variables taken individually, the changes in the
proportions of the various products (both gaseous and liquid) were rather
limited, being generally in the range of a factor of two or three.
The condensible products formed in that study were "fingerprinted" by means of
capillary gas chromatography. These fingerprints showed substantial
similarity to those from condensible products captured in the exhaust stack of
a wood stove operated in a smoldering mode (inlet air cut down to the point
that flames were absent and the only combustion was due to surface oxidation
of the wood char) . This mode is frequently used to produce extended burns
from a single load of wood and it produces copious air pollution. The
fingerprint comparison just noted suggests that the origin of most of these
air pollutants is at and below the wood surface during its gasification and
that little further chemical change occurs in the stove before these species
exit the stack (for this smoldering mode of burning). That, in turn, implies
that the pollution problem is inherent in the use of wood in the smolder mode;
only some post-smolder intervention (e.g., an after-burner) would help to
eliminate the pollutants.
2

The previous results are all based on the use of forced gasification (due to
the externally applied heat flux) and an essentially one -dimensional heat flow
geometry. This is a potentially deceptive over-simplification of the actual
behavior of wood in a fire or in a wood stove. In these real-world cases, the
smolder zone is multi -dimensional and it spreads outward from a limited
portion of the fuel where it began. Furthermore, it does so in a self-
sustaining manner that does not require some external heat input. Since this
produces a different temperature distribution and a different blend of
pyrolysis and oxidation regions, one might well expect that the product
distribution could differ from that seen in the one - dimens ional,forced
gasification cases. Examining this issue is one motivation for the present
work.
A second motivation for studying the self-sustained smolder case is that it
contains within it a relation between the rate of air supply and the rate of
wood gasification which is of use in estimating the rate of pollutant or
toxicant emission from this mode of combustion. This relation will be applied
here in estimating the feasibility of . destroying the pollutants from wood
stoves by gas phase reactions.
In estimating the feasibility of destroying pollutant species by gas phase
reactions, one needs estimates of the relevant rate processes. These
estimates have been obtained here by the methods of chemical kinetics
.
A third motivation for studying the self - sustained smolder of solid wood is
that, despite its relevance to both wood stoves and to fire safety, it has not
been examined before in any quantitative detail. For the purposes of fire
safety hazard assessment, one needs, at a minimum, the rate of heat release
from the smoldering wood and the rate of toxicant generation (principally CO)
.
However, one would also like to have some insights into the factors which
control the rate of smolder spread over the wood. All of these points will be
addressed in varying degree.
3
2. EXPERIMENTAL APPARATUS AND PROCEDURE
2.1 Sample Configuration
There is no standard configuration for wood being burned in a wood stove. Any
geometry that attempts to closely mimic a pile of split logs is clearly going
to introduce complexities that only serve to make interpretation more
difficult. The objective here is a simple geometry with which it is easy to
interpret the behavior of a spreading, self-sustaining smolder reaction wave.
A single flat slab of wood which is thermally thick (actual thickness greater
than the depth of a thermal wave originating at the slab surface) will not
sustain smoldering combustion unless an external heat flux supplements the
heat from wood char oxidation. Preliminary experiments established that this
external heat flux needs to be greater than about 1 W/cm2. Although a flat
slab geometry would certainly be desirable for its simplicity, it is not
practical for the present case. The added heat flux would have to irradiate
only the active reaction zone; this would require that it move with the
spreading reaction zone at a rate whose value would be hard to pin down.
Instead of trying to impose a moving heat source, it is better to choose a
geometry which produces its own; this assures truly self-sustaining smolder
spread. Two flat slabs of wood with an air gap between them have been used
in the past [2]
.
Smoldering on each interior slab face provides the
sustaining flux for the face opposite. However, unless the air gap is wide,
this configuration provides limited visual access to the smolder zone.
The configuration that was used here is shown in Figure 1. It is a flat
bottom U-shaped channel; smoldering spreads along all three interior surfaces
of the U. This approximates a closed channel which is sometimes used as an
idealization of the flow passages through a burning bed of fuel particles
[3,4]; the geometry used here then can be viewed as an idealization of that
occurring in a wood stove with a fuel load on a grate and an air flow coming
up through the grate into the bottom of the fuel bed. An observer looking
into the open side of the U has a good view of the smolder behavior on the
4

bottom of the U and an oblique view of the other two surfaces. The original
intent was to exploit this direct view of the bottom of the U by using an
imaging infrared radiometer to track the surface temperature distribution
there. This proved to be impractical due to obscuring window deposits.
However, the bottom of the U remained a natural focus for assessing the
behavior of the smolder spread process.
Note that the sides of the U channel each consist of two pieces of wood 3.2 cm
thick. Full thickness (6.4 cm) wood was not available in either of the two
wood types used (white pine and red oak) . The two pieces were glued together
(Titebond Wood Glue, Franklin Chemical Industries) 1 and further held by a
small number of wood screws, especially near the end to be ignited. The three
composite side pieces were similarly glued and screwed together to form the U
channel shown in Figure 1. There was some tendency for the U channel to
attempt to warp during a test in such a way as to partly close the open side
of the U; this was prevented by placing a series of four rigid steel spacers
in this open side at intervals along the channel.
The height- to -width ratio of the U channel is such that, if the long sidewalls
were uniformly hot, the radiation from them would produce an essentially
uniform flux over the lateral expanse of the bottom of the U. Preliminary
tests indicated that, at least for the igniter size used here, the noted ratio
could not be decreased much below the value used here without precluding
smolder propagation but this subject deserves further study in the future.
2.2 Wood Combustion Chamber
The wood sample was enclosed in a combustion chamber in order to provide for
control of the flow of air and combustion products; Figure 2 shows a schematic
of this chamber. The actual orientation of the sample was the same as that
1 In order to adequately describe equipment,
it is occasionally necessaryto identify commercial products by manufacturer's name. In no instance does
such identification imply endorsement by the National Bureau of Standards nordoes it imply that the particular product or equipment is necessarily the bestavailable for that purpose.
5
shown in Figure 1. The walls are 1.27 cm steel and they form an enclosure
only slightly larger than the wood sample itself. Any gaps (above and below
as well as toward the open end of the U) were filled with layers of ceramic
fiber insulation wrapped in aluminum foil; thus the outer surfaces of the long
sides of the U were backed by 1.3 cm of insulation while the bottom of the U
had no insulation. Flow was thereby constrained to pass only along the
interior of the U channel.
A controlled flow of air at ambient temperature entered the left end of the
chamber in Figure 2 through a 1.26 cm ID pipe fitting; no attempt was made to
condition the air stream with regard to turbulence. However, instead of
simply entering as an axial jet, the air was deflected by a plate in front of
the pipe opening into four streams tangential to the end plate of the chamber.
This caused mild turbulence in a stream that would otherwise be judged to be
laminar from the Reynolds number in the U channel
.
The chamber has a series of five Vycor windows set in water-cooled frames
which provide visual access to the interior of the U channel. As noted above,
these had a definite tendency to become coated with condensate during the
course of a test but this generally did not preclude visually following the
glowing combustion zone.
For the tests reported here, the igniter was always placed at the upstream end
of the U channel, producing smolder spread in the same direction as the air
flow. This is called forward smolder. (Other cases will be examined in the
future.) The igniter consisted of a set of three separately controlled
electrical heaters, each spaced about 6 mm from an interior surface of the U
channel. They were each operated from a separate constant temperature
controller. They heated a length of the channel of about 12 cm.
2.3 Associated Equipment
Exhaust gases exited from the right end of the chamber as seen in Figure 2.
The collector cone at that end and the subsequent transfer lines were heated
as shown schematically in Figure 3; the lines could not be kept isothermal but
6

were generally in the range from 150 to 200° C. This was not sufficient to
preclude some deposition of heavy tars which subsequently formed a thin char
coating on the interior of all the stainless steel transfer lines. This
appeared to represent a very minor loss mechanism for products on a weight
basis though it could represent species of interest for air pollution studies.
The somewhat complex arrangement of plumbing downstream of the wood chamber
reflects two factors: 1) it was not feasible to push flow through the chamber
while the igniter was in place; instead it was pulled through by the pump
indicated in Figure 3; 2) it was not desirable to send the exhaust flow
through the gas analyzers continuously, thus they were sampled intermittently.
In light of these there were two flow paths used most of the time. During
ignition all exhaust flow went through the pump (Air-Vac TD 260 air driven
venturi pump) . The inlet closure plate was removed from the left end of the
chamber and room air was drawn onto the U channel. There was no super-
atmospheric pressure in the chamber to force gases into the analyzers so no
gas analyses could be done during the ignition interval. After ignition, the
left closure plate was installed and the indicated components fed laboratory
air to the chamber. The internal pressure in the chamber was thus slightly
elevated (1.02 to 1.06 atm.). The main flow path was then through the water
cooled heat exchanger indicated schematically in the lower right area of
Figure 3. This device was utilized merely to lessen the load of condensate
going into the laboratory exhaust system. At intervals the full flow from the
chamber was switched from the heat exchanger path to the path with a large
condenser coil (surrounded by a dry ice/ethanol slush at -72°C) followed by a
filter and a dry gas test meter (Singer DTM-115 or DTM-325) for volumetric
flow measurement. This permitted sampling of the condensate for later gas
chromatographic fingerprinting and also for assessing its mass flow rate. The
dry gas test meter results, together with separate determination of the
average molecular weight of the gas, permitted calculation of the total mass
flow rate from the wood chamber. At other times, part of the flow was
diverted, again through a condensate trap and a filter, to a set of gas
analyzers. These included a Beckman polarographic oxygen analyzer, an
Infrared Industries Model 702 C0/C02
analyzer and a Beckman Model 402 total
hydrocarbon analyzer. The oxygen analyzer was calibrated with room air before
7

each measurement; the other two analyzers were calibrated before each smolder
test
.
In addition to product analyses,information was obtained on the internal
temperature profiles in the wood as the smolder reaction zone moved past the
region of measurement. Nine thermocouples ( chrome1/alumel in 1.02 mm dia.
stainless steel sheaths) were embedded in the bottom of the U-shaped wood
channel. Their junctions were on the centerline of this piece and they
penetrated the wood from the side which is on top in Figure 1. They were
arrayed in three groups of three thermocouples as diagrammed in Figure 4.
Since the thermocouples had to penetrate about 10 cm of wood, from the chamber
wall inward, special precautions were taken to assure that the junctions ended
up spaced the same as the entry points as shown in Figure 4. A 7 . 5 cm long
drill guide was used to orient a 3 mm dia. pilot drill that stopped about 2.5
cm short of the intended depth of the thermocouple junction. The remaining
depth was then drilled just slightly larger in diameter than the thermocouple
sheath to assure its good contact with the wood. The thermocouple outputs
were recorded at ten minute intervals by a datalogger.
The design of the experiment include following the weight of the sample inside
of the chamber by means of weighing both together. The chamber is an order of
magnitude heavier than the sample but a highly sensitive balance was obtained
to overcome this problem. Unfortunately, the total weight somewhat exceeded
the balance capacity and it was necessary to displace some of the weight onto
a pivot point (through which the inlet and exhaust lines for the chamber
passed) . The arrangement proved to be unworkable since thermal expansion of
the exhaust line caused a varying force on the balance comparable to the
sample weight loss. There was no opportunity to correct this arrangement
during the course of the present experiments and so the balance provided no
useful data; this will be corrected in future tests.
2.4 Test Procedure
The U channel was assembled typically a few days before a test from wood that
had spent one or mord months in conditioned storage (50 ± 5% R. H. at
8
23 ± 2°C) . The wood itself was originally kiln-dried; both the white pine and
red oak used were knot free.
After the sample was inserted in the chamber, the transfer lines were brought
up to temperature. Since the collector cone at the end of the chamber was
also heated, this caused some pre-heating of the right end of the sample. The
smolder reaction zone never got more than about halfway along the U channel
during a test so this remote preheating should have had little effect.
When the lines were adequately heated, the igniter was brought up to
temperature over a period of a few minutes. The igniter temperature was
typically 450°C for white pine and 500°C for red oak. Higher temperatures
might well have accelerated the ignition process but they run the risk of
flaming ignition as well. Ignition was, in fact, quite slow requiring about
lh hours for white pine and about three hours for red oak. The air flow
during this time was in the same range for all of the tests, 90 (+5, -10)
g/min. Because the balance system did not work, the weight loss from the
sample at the end of the ignition period could not be determined directly; *it
was estimated from the fact that the volume of wood consumed at this point was
about the same in all cases
.
After the igniter was removed, the inlet end of the chamber was sealed and the
incoming air flow was set at the desired value. The intent was always to hold
it constant from this point onward but there were occasional complications.
In two cases, gradual accumulation of charred residue in the smallest diameter
region of the exhaust gas transfer line caused a slow decay in the flow rate.
In a few other cases near the borderline for transition from smoldering to
flaming, the flow was deliberately cut back when it appeared that flaming was
imminent due to bright, localized glowing of the char. In all but one case
the flow was restored to its original level within a few minutes.
The rate of spread of the smolder reaction zone after ignition was quite slow,
even in high air flow cases. Thus it was possible to follow its progress for
up to seven additional hours and still have the reaction front move less than
2/3 of the way along the U channel. In general this post- ignition time was
9
made as long as feasible in order to lessen the relative role of the ignition
period in the overall sample weight loss. Visual observations were recorded
as to the position of the leading edge of the smolder front and, where
possible, the length of the glowing char oxidation zone.
Up to three condensate samples were taken during the post- ignition smolder
period. Typically, a substantially greater number of permanent gas analyses
were made in this same time period. The maximum quantity of condensate that
could be captured in the cold trap was sometimes severely limited by a
tendency for ice to block flow through the trap; this will be fixed in future
tests
.
Smoldering was terminated by replacing the air flow with pure nitrogen. The
sample was removed from the chamber the next day and weighed to determine
total weight loss (ignition plus post- ignition)
.
Time limitations precluded an extensive series of tests; ten fully
instrumented runs were made after nine preliminary runs that explored the
necessary sample configuration, minimum air flow and ignition conditions.
2.5 Condensate Analyses
Ethanol was used to flush the condensate from the glass cold trap. This
mixture was then analyzed in two ways. The first involved capillary gas
chromatography to obtain fingerprints that could be compared with those from
the previous test configurations [1]
.
For this reason the analyses were done
in, as nearly as possible, the exact same manner. The same type of column
was used (J & W DB-1701, although it was necessary to replace it with a new
unit) together with the same carrier flow and temperature programming. The
fingerprints thus obtained consisted of the chart produced by a Hewlett
Packard 3390A Chromatographic Integrator. This chart is a record, about six
feet in length, of the pattern of peak elution from the column over a period
of two hours. The peak pattern contains features due to relative retention
times and characteristic peak shapes that make it possible to compare
fingerprints with those obtained previously without a need to repeat any of
10

the mass spectral analyses that were reported before [1]
.
It is worth
repeating an observation made in the previous work. The majority of the
condensible organic species in the cold trap are not volatile enough to come
through the chromatograph column, evidently because they have polymerized. It
was previously estimated that the about 80% by mass does not elute from the
column.
The second chromatographic analysis on the condensate from the cold trap was
intended to quantify the amount of condensible organic species (tar) in the
trap. This was done indirectly by analyzing for the two well-defined
components in the mixture, ethanol and water on a modified Porapak QS column.
In spite of some improvements in technique such as the use of a surfactant to
homogenize the tar/ethanol/water mixture, the results of these analyses had
very poor reproducibility. This was due in large part to the small fraction
of tar in the mixture which made its determination by difference less
accurate
.
3. WOOD SMOLDER: RESULTS AND DISCUSSION
3.1 Overall Behavior of Wood Smolder
The igniter and, subsequently, the smolder process the igniter induced first
pyrolyzed the wood to a char then oxidized that char so that only a fluffy,
gray-white ash remained. Typically the igniter was removed when this ash was
beginning to form on a front about 2h to 3 cm downstream from the end of the
igniter; the wood around the igniter was gasified to an estimated average
depth of about 2h cm at this point. If the igniter was removed too soon, the
smolder process extinguished within a few minutes. This happened occasionally
and the igniter was simply put back into place and left for another half hour
or so
.
After the igniter was removed and the air flow was set at the desired value,
the progress of the smolder front in the downstream direction was noted at
intervals. The same sequence noted above was occurring, now stretched
longitudinally along the length of the U channel -- heat from the char
11
oxidation zone upstream was fed downstream where it dried, pyrolyzed and
charred the wood, then induced the oxidation of the char leaving only an ash
residue. The progress of this complex reaction zone was basically steady, i.
e., the smolder velocity on the inner surface of the U channel was constant on
average. The leading edge of the char oxidation zone was not flat or even,
typically, because of the random disturbances introduced by shrinkage cracks
in the wood. However, plots of the position of the leading edge of the ash or
glowing zone as a function of time over the course of a several hour burn gave
rather good straight lines for most tests. This constant average rate of
movement has been seen in other two-dimensional, forward smolder processes
[5,6] but it was less expected here because the thermal wave in the solid
phase is very long (longer than the sample) and the total distance burned over
the entire test duration is short compared to this thermal length. Evidently
the wood is, in effect, evenly pre -heated over the length burned here. It
will be seen later that the progress of the char oxidation front is not
limited by the disappearance of oxygen and, instead, appears to be limited by
the rate of heat transfer to the unburned wood.
The char oxidation zone extended upstream for a substantial distance from its
leading edge; it was of the order of 20 cm long and probably varied with the
air flow rate but good data on this are not available. It was over the length
of this char oxidation zone that the channel cross section opened up
considerably. This zone was terminated on the upstream end by quenching,
particularly at the bottom of the U with its lack of insulation behind the
wood. Typically, more than a centimeter of charred and uncharred wood were
left when the reaction ceased on the upstream end. Because of the varying
channel cross section in the reaction zone, all flow velocities given below
are referred to the original U channel dimensions (with the gas at room
temperature)
.
As noted above, the wood cracked randomly as it charred, though the cracks
were oriented predominantly either along the longitudinal axis of the channel
or transverse to it, presumably due to the wood grain orientation. The cracks
did not seem to play a major role in the propagation process except, perhaps
at very low air flow velocities. There the char reaction seemed to move
12

preferentially in the cracks, possibly because they afforded a lesser
radiative heat loss rate. Shrinkage of the wood also caused separation of the
two pieces which made up each side of the U channel. Again this did not seem
to play a significant role for propagation under most conditions. It provided
more crevices for the smolder to hide in at low air velocities. It may have
played some role also in the development of flaming at high air flow
velocities. The transition to flaming seemed to be associated with the
development, over a period of several minutes, of regions of the char (several
centimeters in longitudinal extent) which became hotter (as determined by
their brighter glow) than surrounding regions of the char. This could have
been facilitated by oxygen penetration into the gap between the two layers of
wood causing heating from both sides for the innermost layer; there are no
data to confirm this speculation more directly.
3.2 EFFECT OF VARYING AIR FLOW RATE ON OVERALL BEHAVIOR
Smolder propagation rate . The air inflow rate was varied from the extinction
limit to the flaming limit, a range which proved to be rather narrow for the
present wood chamber configuration. Figure 5 shows the variation of the
surface smolder propagation rate with air flow rate between these limits. As
expected, the smolder spread rate increases with increased air flow into the
upstream end of the U channel. This is consistent with the behavior of
forward smolder in other configurations [4,5]. The increased flow of air
accelerates the rate of transfer of oxygen to the wood char surface on the
interior of the U channel. This, in turn, increases the rate of char
oxidation at and below the surface. The attendant increase in the rate of
heat evolution in the surface region raises its temperature thereby increasing
the rate of heat transfer to unburned portions of the wood downstream and this
causes the smolder front to move downstream more rapidly. Figure 6 shows that
the char surface temperature does indeed increase substantially with increased
air flow rate. These temperatures were the peak values seen by the initially
submerged thermocouples (the shallowest in Figure 4) ;the thermocouples
penetrated the char surface when it receded due to char consumption.
13

The smolder spread rates for white pine and red oak are essentially equal for
a given air flow rate. The least squares lines fitted to each set of data
points differ, as seen in Figure 5, but, in view of the data scatter, these
lines cannot be said to be significantly different. The data in Figure 7
derive from a different measurement, that of weight loss averaged over the
post- ignition period2. The average weight loss rate for red oak is 1.6 to 1.8
times greater than for white pine. This is consistent with essentially equal
smolder propagation rates if one factors in the fact that red oak is about 1.6
times more dense than white pine. Given this density difference, however,
equality of smolder spread rates is unexpected. In one -dimensional forward
smolder through a permeable bed of wood fibers, Ohlemiller and Lucca [7] found
the propagation rate of the char oxidation zone to be limited by oxygen
consumption and char oxidation stoichiometry. If the same mechanism applied
here, it would imply that the spread rate over oak would be about 40% slower
than that of white pine. On the other hand, Ohlemiller [6] found that the
rate of heat transfer to the unburned fuel can play a direct role in the
propagation rate for two-dimensional smolder of permeable fuel layers. With
this in mind, one notes that the thermal conductivity of wood is proportional
to density [8] and then expects that oak might propagate smolder faster than
white pine. It will be seen below that heat transfer plays a central role
here but that conduction through the wood does not; thus the equal propagation
rates can be rationalized.
Flaming limit . Transition to flaming combustion was encountered at about the
same air flow velocity (20 to 25 cm/sec) for both types of wood. The
transition process was unpredictable as to its time of occurrence. It appears
that it becomes an increasingly likely event as one approaches the upper end
of the air flow range in Figure 5. Thus it will occur earlier in a test when
the flow rate is 25 cm/sec than when it is 20 cm/sec.
2 The sample weight was only measured before and after a test. The weightloss during ignition was estimated from the observation that the volume of
wood gasified at the end of the ignition period was approximately the same
from test to test. The weight of this wood volume (approx. 1000 cm3) was
subtracted from the total weight loss to estimate post- ignition weight loss.
14

As noted previously, the transition process (i.e., the initiation of flaming
in the gas phase) was typically associated with localized regions of greater
than average char surface temperature. Transition to flaming has three
requirements: (1) a local gaseous mixture of fuel and oxygen that is above the
flammability limit at the local temperature; (2) a heat source within this gas
mixture sufficiently hot to ignite the gases; (3) if the flame is to be
sustained beyond a momentary flash, a continuing source of fuel gases, usually
assured by heat feedback from the flame to the solid fuel surface. If the
local temperature and the gas mixture volume are sufficient, self heating can
replace the extra heat source called for in (2)
.
In the present complex
configuration, (3) could possibly be met by a combination of gases generated
by smoldering and by flaming.
It seems quite probable that the cracks in the char provided local spots which
favored the build-up of greater than average concentrations of flammable gases
since they would be subject to lesser mass transfer rates than regions of the
char surface forming the interior walls of the U channel. In this regard, it
is pertinent to address what is known about the concentration of flammable
gases in the U channel. Gas analyses were done only on the average
composition leaving the channel; these are discussed in greater detail below.
For now it is relevant to note that the average CO concentration in the
exhaust gas was in the range from 2 to 3%; the total hydrocarbon concentration
was in the range from h. to 1%. At room temperature the lower flammability
limit of CO is 12.5% [8]. The total hydrocarbons were not analyzed in the
current work but in the previous tests with the same woods they were found to
consist largely of methane, ethane and ethylene [1]. The lower flammability
limits for these species at room temperature range from just under 3% to about
6% [8]
.
The lower flammability limit decreases very slowly with increasing
temperature; e.g., that of ethane drops from about 3% at room temperature to
just under 2% at 550°C [8]. As will be seen below, there is some oxygen
depletion along the length of the U channel; again this has only a small
effect on the lower flammability limit [8]. On the basis of CO and total
hydrocarbons, then, the average gas composition is not flammable for any of
the test conditions.
15

There is another potentially significant source of fuel vapors, the
condensible material denoted as tar previously. This constituted about 5% of
the exhaust gas mass. If all of this material was in the gas phase in the
same locale as the other two fuels, it would almost certainly make a flammable
gas mixture. The most likely place for this to occur, however, is in the
pyrolysis zone downstream of the char oxidation zone; here the temperatures
are too low to ignite the mixture
.
In any event, it is clear that the hydrocarbons alone do not need a great deal
of concentration enhancement above the exhaust level average to be within
their lower flammability limit. They are undoubtedly significantly more
concentrated in the boundary layer near the char surface and in cracks in the
char. Thus, in the absence of direct local measurements, one can still make
the reasonable inference that flammable mixtures exist at many points along
the hot char surface. If so, the factor limiting the appearance of flaming is
the temperature; the char must get hot enough in a region adjacent to one of
these flammable mixtures to ignite it. Momentary flash ignitions were not
observed so evidently requirement (3) above is readily met, though it is not
clear just how. Direct sampling of the gases within the U channel is needed
to test the ideas expressed here.
If temperature is the controlling variable in transition to flaming with wood
in this configuration, one might expect some apparatus dependence for the air
velocity at which the transition occurs. The temperature achieved for a given
rate of heat generation (corresponding to a given rate of air inflow) is
somewhat dependent on the rate of heat loss which, in turn, depends on
apparatus design. It is interesting to note that Alexopoulos and Drysdale
obtained comparable air flow velocities for transition to flaming with forward
smolder upward in an insulated chimney lined with wood-based fiber board [9]
.
Evidently the critical air velocity value does not vary rapidly with heat loss
conditions
.
Extinction limit . The lower limit to smolder propagation, extinction, was
only actually seen with white pine. The smoldering in the lowest air flow
case for red oak in Figure 5 was clearly quite weak, however. Interestingly,
16

the extinction with white pine occurred after the sample had smoldered for
about six hours beyond the end of the ignition interval. Form the propagation
rate in Figure 5(a), it is apparent that, even in this time, the smolder front
moved only a few centimeters downstream. The preponderant smolder process
then was inward penetration into the wood and it was probably stopped by
quenching when the remaining thickness of wood could no longer provide
sufficient insulation. This suggests that this lower limit could probably be
extended somewhat by using thicker wood walls and providing more external
insulation for them.
Effective fuel to air ratio . The ratio between the rate of wood gasification
and the rate of air inflow is a parameter one needs in order to estimate the
rate of evolution of pollutant species from wood smolder. This parameter is
configuration dependent since it affected both by the degree of contact
between the wood and the air and also by their relative directions of
movement. This last refers to the issue of whether the air flows in the same
direction as the smolder front moves (as it does here),the opposite
direction, or some combination of the two plus transverse flow as well; these
concepts are essentially the same as those embodied in the idea of updraft,
downdraft or crossdraft burning modes in a wood stove [10] . For the two
simpler cases (flow strictly with or against the direction of smolder
propagation) as they occur in a bed of porous fuel,
it has been shown that
this fuel to air ratio differs considerably [7]. Configuration dependence has
not yet been investigated in the present context but the result just noted
implies that caution is necessary in using the present result for other
configurations. Where data are available for wood stoves, this ratio has been
found to vary by at least a factor of four [11].
Figure 8 shows the results obtained here for the ratio of post- ignition weight
loss rate to average air inflow rate. Given the scatter in the oak data, it
cannot be said that this ratio changes significantly with air flow velocity.
The ratio once again shows more red oak being gasified with the ratio for the
two woods being approximately in the ratio of their densities. The values of
the fuel to air ratio obtained here fall at the high end of the range seen for
wood stoves [11] . In wood stoves operated with a very limited air supply rate
17

(where one might expect a predominance of smoldering) the ratio tended to be
lower than the range seen here; there it varied from 0.04 to 0.10 [11]. The
stove tests used 5 by 10 cm and 10 by 10 cm oak brands stacked in the fire
box; the air flow was apparently a crossdraft.
As will be seen below, oxygen consumption was not complete in the
configuration used here. When the fuel consumption data are recomputed on the
basis of the oxygen actually consumed, one obtains the results in Figure 9.
Again more red oak was gasified relative to white pine in approximately the
ratio of the density of the two woods. These comparisons between the two
woods in all cases suggest that the smolder zone moved down the U channel
gasifying the two woods at an equal volumetric rate (for a given air inflow
rate) independent of wood type.
The data in Figure 9 reflect the incompleteness of the wood oxidation in the
present smoldering combustion mode. Stoichiometric oxidation of the two woods
requires that the ratio in Figure 9 be in the range 0.5 to 0.7; these
stoichiometric values are based on pitch pine and white oak, the closest woods
for which elemental compositions were available [12]. It is this high degree
of incompleteness which makes this combustion mode so polluting. This is
reflected also in the composition of the evolved gases which is examined
below.
3.3 Composition of the Evolved Products
Time -dependent composition of the gases. Figures 10 through 19 show the
variation of the major products with time from post- ignition to the end of
each test.
The first point to note is that, in all of the tests, there was a considerable
amount of oxygen passing along the entire length of the sample without being
consumed. The reason for this is basically the same as it is in many wood
stoves; the contact between the incoming air stream and the hot char surface
is not sufficient. For the present configuration one can readily calculate
that an oxygen molecule entering the reaction zone on the centerline of the U
18

channel will convect more than the full length of this zone before it can
diffuse laterally to the char wall. The original intent was to run the air
flow sufficiently slowly that there would be time for this diffusion but this
called for air flow rates below the extinction level in this apparatus
.
A more subtle point concerning the remaining oxygen has to do with the failure
of the reaction zone length to grow sufficiently to consume all of that
oxygen. If there is plenty of oxygen in the gas at the leading front of the
reaction zone, one might expect the front to move downstream until it consumes
all available oxygen and then move onward only at the rate at which completion
of fuel consumption on the upstream end of the reaction zone permits; this is
what happens in forward smolder through a permeable fuel bed [7]
.
Channel configurations with flow and reaction zone movement in the same
direction have been studied in the context of coal and oil shale gasification
[13,14] and in the context of flame propagation in fuel-lined ducts [15]. In
the first two contexts, complete consumption of oxygen appears to be typical,
at least for the conditions described in these references. For fuel -lined
ducts with flaming combustion, cases were seen in which oxygen consumption was
small and in which the consumption was total; however, in the case of small
oxygen consumption, the fire either died out eventually or accelerated to a
case of total oxygen consumption. Roberts and Clough [15] presented a
simplified analysis of the energy conservation in the duct which implied that
two propagation rates are possible but the lower rate, which leaves residual
oxygen, is unstable; the solution achieved depends on the vigor of the
ignition process. The assumptions in this model do not fit the present
problem well. De Ris [16] suggested that the cases of incomplete oxygen
consumption were the result of flow stratification in which a layer of cooler,
oxygen- containing gas flowed along the bottom of the duct and escaped
reaction. In the absence of flow and oxygen profiles within the U channel, it
is not certain if such behavior is pertinent here, but it seems doubtful. No
stratification of the smoke flow was noted during the tests. Furthermore, the
reaction front on the bottom of the channel did not lag behind other portions
.
It seems more likely that the rate of heat transfer to the unburned fuel
downstream of the char oxidation zone in the present configuration was not
19

enough to permit a sufficient extension of the reaction zone so that all
oxygen could be consumed; this will be examined further below.
Another point to be noted about the time -dependent gas composition data in
Figures 10 to 19 is that, in most cases, the composition is very nearly
steady. This goes along with the previous observation that the rate of
propagation was essentially constant. There are two notable exceptions, the
tests in Figure 17 and Figure 19; in both cases the air flow rate was in the
region of the flaming limit. The decaying oxygen penetration of the reaction
zone suggests that the length of the zone was increasing toward the zero
penetration case discussed above; unfortunately, confirming data on the length
of the reaction zone as a function of time for these cases are not available.
The rate of propagation of the reaction front was not accelerating in either
case; it was as steady, on average, as other cases of slower air flow rate.
For the reaction zone length to grow longer, however, it is only necessary for
the rate of longitudinal movement of the smolder front to increase relative to
the rate of lateral penetration of the front into the wood. These two rates,
which are the orthogonal components of the smolder velocity vector normal to
the isotherms in the solid, may not have reached a steady balance in these two
cases. This is a situation which could be illuminated by a two-dimensional
smolder propagation model which is not available at present.
Also note that in Figures 17 and 19 there is a an increase in the ratio of C02
to CO with increasing time. This is small but evidently real; for example, in
Figure 19 the ratio goes from the range 2.4 - 2.6 up to 3.0. This could
reflect increased flow time available for gas phase CO oxidation to C02
as the
smolder zone lengthened. The residence time (flow time) is about one second
in these cases and the peak gas phase temperature is about 650° C.
Extrapolation of Dryer's [16] kinetics for the homogeneous oxidation of 'wet'
CO indicates that some oxidation is possible in these conditions. The
characteristic blue flame indicating rapid CO oxidation was not seen here.
The heterogeneous reduction of C02
to form CO evidently requires somewhat
higher temperatures to be appreciable for the times available here [17].
Definitive characterization of the behavior of these gases for this particular
20

system would require sampling of the composition of the gas phase along the
length of the U channel.
Time-averaged compositions . Comparisons with the results of our previous,
small scale, forced gasification study of these same two woods is most readily
done on the basis of the average composition of the evolved products. The
current results are given in Figures 20 and 21 for white pine and red oak,
respectively. They are expressed there as fractions of the total product mass
in the post- ignition period. The scatter in both of these Figures is such
that no real trends with air flow rate can be said to exist. This is in spite
of a 200° C range in surface temperatures for the air flow range indicated
(Fig. 6). The closest analog to the present series of experiments in the
previous small scale forced gasification experiments is that in which the
incident heat flux to the surface was varied. Increasing the heat flux there
from 2.5 to 6.9 W/cm2
caused the peak surface temperature to go from about
550° C to about 750° C [18] . For the most part, the variation in the fractional
distribution of evolved products over this flux range was not strong but there
were significant increases in the fractions of both CO and C02
. These
increases were mainly in the range of 50% but for red oak the increase was
markedly stronger for CO. These comparisons between the two types of
experiments are rather strained because the forced gasification tests were
highly transient in nature and much shorter in time scale (10-15 min.); this
biases the products toward those formed early at lower temperatures than the
above peak surface values would indicate. This is particularly evident in the
case of water which comprised 40 to 60% of the evolved products in the forced
gasification experiments and only 20 to 30% of the products here. The wood
samples in both test series were equilibrated to the same ambient conditions
so that their water contents were quite comparable.
The actual origins of the various major products shown in Figures 20 and 21 is
not completely clear. If the char were a pure pyrolytic graphite, its
oxidation in the present temperature range would yield only C02 [19]
.
The
char formed from cellulose contains amorphous carbon as well as significant
amounts of hydrogen and oxygen [20]
;
this is very likely also true of the char
contributed here by the hemi-cellulose and lignin components of the woods.
21
Oxidation of cellulosic char yields equal amounts of both CO and C02
in the
absence of inorganic ash; differing ash components alter this ratio
appreciably [21] . The previous forced gasification experiments were performed
in nitrogen as well as air; those results imply that in the current tests the
majority of the CO. and C02
arises from char oxidation. The remainder comes
both from pyrolysis of the wood components (particularly holocellulose) and
from secondary degradation of the tar components
.
Degradation of wood tar was studied by Boroson [22] . Tar generated by
pyrolysis of the components of wood can undergo two classes of reaction as it
passes out through the bulk of the sample (through the char layer typically on
the sample exterior) and into the surrounding gas phase. The first class
comprises homogeneous pyrolytic reactions, probably unimolecular in nature.;
the second class comprises heterogeneous reactions between the tar components
and the char surface over which they pass as they exit the sample. The
homogeneous reactions typically convert a fraction of the tar to gases, the
major one being CO. The fraction converted is dependent on temperature and,
at a given temperature, is essentially fixed after about one second
(particularly at temperatures above 600° C) . The homogeneous reactions are
very fast and affect only a fixed fraction of the tar independent of times
longer than a few milliseconds and independent of temperature, at least in the
range from 400 to 600° C. The fraction of tar undergoing this heterogeneous
reaction was estimated to be about 1/3. The products were mainly CO, C02
and
char.
In the context of the present experiments, Boroson' s results imply that
anywhere from zero to 50% (over the temperature range in Figure 6) of the
initial tar generated within the pyrolysis zone of the wood was degraded by
homogeneous pyrolysis. One can estimate that it takes 0(1-10 sec) for the
gases generated within the sample to pass through the char layer; the
subsequent time in the gas phase passing along the length of the reaction zone
in the U channel is 0 (1 sec)
.
Thus essentially all of the homogeneous
degradation of the initial tar occurs within the sample. The same holds true,
of course, for the heterogeneous degradation. The combined degree of
22

degradation of initial tar thus varies from 1/3 to about 5/6, based on
Boroson's results applied to the present context.
There is a discrepancy between the above inferences based on Boroson's results
and the results in Figures 20 and 21. Those Figures show a quantity of
surviving tar that is both substantial in amount and constant with air flow
(and, therefore, temperature). The above arguments imply that the amount of
tar should decrease by about a factor of two as from the lowest to the highest
air flow rate. Tar determinations were not very accurate (standard deviation
about ±50%) so this could mask any such trend. On the other hand, since CO,
in particular, is a major product of the tar degradation, one should see a
substantial increase in its weight fraction with increasing air flow rate; the
CO analyses are believed to be quite accurate. The reason for this
discrepancy is not known.
Figures 22 and 23 show the post- ignition average product information in a
different manner, i.e., on the basis of mass of product generated per unit
mass of wood gasified. This is the form that is most useful for determining
the rate of evolution of toxic or pollutant species from smoldering wood in
other contexts where the behavior 5 of wood might be expected to be similar.
Note that the sum of the products for any given flow condition need not add up
to one even though one gram of wood went into generating them; oxygen from the
inflowing air is also incorporated in the products. The average summation of
the product masses was , in fact, 1.17 grams per gram of wood gasified; the
average deviation is rather large, 0.12. This variability reflects a varying
mass balance on the system. The principal errors are believed to reside in
the determination of the total mass flow out of the chamber as a function of
time and in the estimate of the amount of wood gasified during the ignition
process. In addition, as noted previously, the tar fraction values used here
have a ±50% uncertainty. The water values are the average of those determined
from the water transducer in the exhaust line and the water content of the
condensate trap; these typically were about 20% apart. Given these
uncertainties and the evident scatter in the data, it is again not possible to
say that the products vary in any significant way with air inflow rate.
23

Similarly, one cannot assert that the products from the two different types of
wood are significantly different.
The weight ratio of C02
to CO in the previous, forced gasification experiments
was in the range from 1.5 - 2.5 to 1. Here it is about 3 to 1 . In stove
burns done in the first year of this program, the ratio was substantially
higher, from 6-9 to 1 [23]; this approaches the value of 10 to 1 seen for
flaming combustion in a free-standing fireplace [24] so one cannot rule out
the role of flaming combustion in those early stove burns. It seems probable
that CO oxidation to C02
in the gas phase is the reason that the numbers here
and in stove burns exceed those seen in the forced gasification experiments.
This comparison also implies that such oxidation is considerably less in the
present configuration than it is in a wood stove operated in a slow burning
mode [23]
.
3.4 Condensate Fingerprints
This subject was pursued much more extensively in our previous work [1] where
an effort was made to identify many of the species eluted through a capillary
gas chromatographic column. Time constraints severely limited the follow-up
work with the present condensates (tar) seen in the cold trap. The goal here
was only to compare the patterns of species quantity and retention time
(i.e., the "fingerprint") that one gets as an output from the chromatograph.
Even this presents some technical difficulties, especially in the first 10% or
so of the fingerprint where solvent pooling effects 3 lead to non-reproducible
retention times.
For white pine, visual matching of the fingerprints indicates a strong degree
of similarity between those obtained here and those obtained in the forced
gasification experiments. It appears that nearly all of the same components
are present in the two types of condensates but there are a small number of
3 The solvent carrying the tar onto the chromatographic column condensesto a liquid at the front end of the column. This liquid spreads unevenly and
irreproducibly under the influence of the column carrier gas causing a
variable initial distribution of the tars on the front end of the column.
24

exceptions among the larger peaks, most of which are unidentified. One which
has been identified is levoglucosan, a primary product of cellulose
degradation. In the forced gasification tests, it was nearly always one of
the prominent species in the tar; here its presence could not be confirmed.
Changes in the relative proportions of the eluted species with method of
generation are harder to judge precisely. Table 1 shows some data along these
lines for eight of the major species in the eluted condensate. Since it is
not possible to assure that one is injecting exactly the same total mass of
tar onto the chromatograph column with each different sample,the area
percentage numbers presented there have normalized by the area of one of the
most reproducible peaks, that for creosol. The area percentages shown in the
Table are calculated after both methanol, the solvent in the previous tests,
and ethanol, the solvent in the present tests, have been subtracted out. Area
percentages are only an approximate indication of mass concentration in the
tar because detector response factors are not included.
Table 1 shows normalized area percentages for the condensate from the base
case of forced gasification and for low and high air flow cases of self-
sustained smolder (present work) . For white pine one sees there variability
in the tars from the present tests of as much as a factor of two to three.
This may not be significant, since that degree of variability was seen in the
previous tests repeated under identical conditions. Acetic acid was
problematical probably because it occurs in the first ten percent of the
fingerprint, that most affected by solvent pooling disturbances; it was highly
variable and thus was omitted. For the other species, between the base case
for forced gasification and the present results, one sees variations of up to
a factor of five (furaldehyde and phenol) . Comparable variations appear to be
present in other unidentified peaks. This implies that the chemical history
of the tars in the two types of experiments differs significantly.
Unfortunately there is not enough information available to indicate the source
of these differences. Experiments similar to those of Boroson [22], but with
tar analyses, are needed to clarify this point.
25

The same qualitative statement about visual matching of fingerprints between
the previous and present results holds for red oak, although here there may be
more species where the proportions are different between the two types of
test. This is not so apparent from Table 1 where the basic story about
relative proportions appears to be about the same as for white pine.
Interestingly, the visual match between fingerprints obtained here and those
obtained from a wood burning stove (for mixed oak species) in the previous
study [1] is as good as or better than that noted previously between the wood
stove and the forced gasification results. This reinforces the tentative
conclusion arrived at previously that there is very little gas phase chemistry
occurring in a wood stove when it is operating in a smoldering mode (referred
to previously as an "overnight" mode of operation) . Again this implies that
the pollutant species escaping from the stack of a wood stove operated in this
manner arise directly from the wood smolder process in the condensed phase and
then pass through the firebox and up the stack without much alteration. The
gas phase kinetics discussion below tends to reinforce this idea further.
3.5 Rate of Heat Release
The rate at which smoldering combustion releases heat is of interest both in
the context of wood burning stoves and in the context of fire safety; in the
latter, one needs the heat release rate in order to predict the transport of
combustion products in the buoyant plume which rises above an unconfined
combustion source [25]
.
The present experiment did not include any means for
directly measuring the heat evolved from the wood smolder process,but this is
not always necessary. For flaming fires, it has been shown that one can
accurately estimate the rate of heat of release from the rate of oxygen
consumption; the two are related by a factor (13.1 kJ of heat per gram of
oxygen consumed) which is nearly constant for most organic materials of
interest [26]. This technique has not been previously applied to smoldering
combustion and, indeed, it is not completely clear how accurately it can be
applied. Smoldering is characterized by incomplete combustion; this is
apparent in the Figures just discussed. Huggett [26] has shown that the above
factor converting oxygen consumption to heat release can apply with reasonable
accuracy not only when C02
and H20 are the combustion products but also when
26

partial oxidation products (alcohols, aldehydes acids) are formed. The
accuracy is less when alcohols and aldehydes are products, however; the
absolute error depends on the quantities of each but it only approaches 20%
when these are the only products. Here there is a. very complex and ill-
defined mixture of tars being generated, some of which are undoubtedly
partially oxidized; one can only assume, on the basis of Hugget's
calculations, that they are not a major source of error.
A further factor to consider is the formation of CO; its heat evolution per
gram of oxygen consumed is only 6.9 kJ/g. In the present experiment, not all
of the CO comes from oxidation; some is generated directly by pyrolysis of the
wood or tar. A direct measure of this pyrolytic fraction is not available; in
the previous forced gasification experiments it was about one -fourth of the
total CO.
The results shown in Figure 24 are average heat release rates over the post-
ignition period. It has been assumed there that all CO comes from oxidation
and that all oxygen consumed in partial oxidation of tar components yielded
the full heat release characteristic of C02
formation. As expected, the rate
of heat release increases with increased oxygen inflow. What is not expected
is that the two types of wood are indistinguishable. Recall that Figure 7
showed the rate of mass loss for red oak to be higher than that for white pine
by a factor about equal to their density ratios (1.6). Figures 22 and 23 show
the product distributions for the two woods to be about the same. Then red
oak should be generating oxidized products at about 1.6 times the rate for
white pine and therefore should be generating more heat in about the same
ratio. If this is the case, it is hidden by the considerable data scatter in
Figure 24.
To estimate the rate of heat release from forward smolder a different mass of
solid wood, one could presumably scale directly with area of wood likely to be
involved in the manner here. In practice this could be difficult to estimate
but one could at least get an order of magnitude estimate. The same scaling
would apply, as a zeroth approximation, for the rate of species generation.
27

3.6 Temperature Profiles; Implications for Heat Transfer
The set of nine thermocouples imbedded in the wood that formed the base of the
U channel provided sufficient information that one can infer the approximate
thermal profiles in the wood. Figure 25 shows such profiles for red oak at
low and high air flow velocities. The isotherm patterns are shown
superimposed on top of tracings of the wood as seen in cross-section; the
plane shown bisects the base of the U channel. The positions of the isotherms
have been determined by linear spatial interpolation between the nine
instantaneous temperatures at nine known locations. The resulting pattern was
shifted longitudinally so that the 300° C isotherm sits on top of the
approximate demarcation "line” between charred and uncharred wood. (This is
actually not sharp enough to be termed a true line.) Note the crack between
the two pieces of wood which form the base of the U; the crack does not appear
to have much effect on the isotherms. One can also see the irregular
regression of the surface caused by both by shrinkage of the wood as it
charred and by conversion of some of that char to ash (not shown) . It is
apparent from the top of Figure 25 that the reaction zone, in progressing from
left to right past the fixed thermocouple positions, will eventually expose
them to the surface of the oxidizing char and then to the free space within
the enlarging U channel. Thus the peak value of the char surface temperature
can be measured by the imbedded thermocouples. The isotherms have also been
extrapolated to the surface to provide an approximate measure of the surface
temperature distribution ahead of the maximum value.
A striking aspect of the isotherms is their very acute angle with respect to
the interior surface of the U channel. This implies that the heat transfer in
the wood is nearly normal to the channel surface; that in turn implies that
heat conduction through the wood plays a minor role in driving the reaction
zone forward along the U channel.
It is possible to use the above information to do a more quantitative
assessment of the relative contributions of the various modes on heat transfer
in this smolder propagation process. This could facilitate extending the
present results to other situations.
28

Three modes of heat transfer are considered: conduction through the wood in
the longitudinal direction, convection by the gas flow along the interior of
the U channel, and radiation along the interior cavity of the channel. Kanury
and Blackshear [27], on the basis of measurements on cellulose cylinders,
suggested that an additional mode of preheating is condensation of water and
pyrolysis vapors moving down the temperature gradient in the porous structure
of the condensed phase. Such movement would be essentially longitudinal in
the present grain orientation. Our previous data (Figures 22 and 23) show
that the quantities of tar and water are comparable; however, water, with its
high heat of vaporization, is expected to be the more significant component in
this regard. In fact the temperature data obtained in the present tests show
only a water plateau. This tends to be most pronounced near the outer surface
of the base of the U channel, probably because of the lack of thermal
insulation there. It does not appear that neglect of this has an appreciable
impact on the calculations that follow. Water condensation could also help to
preheat the inner surface of the channel, supplementing the convection and
radiation discussed below. However, the water condensation front is well
downstream of the region to be considered here; tar condensation is neglected
because it does not appear to be significant.
The longitudinal heat conduction flux through the wood is readily estimated
from the temperature profiles shown in Figure 25. This will be done in the
plane where the peak surface temperature is just reached. One needs to
compute, as a function of depth below the inner surface of the channel, the
value of the following expression.
-k(T) dT/dx
Here k(T) is the temperature -dependent thermal conductivity of the wood; the
second term is the temperature gradient in the longitudinal direction. The
gradient in the plane of interest is estimated from the temperature profiles.
Thermal conductivity data are not available above 100° C; the linear
temperature dependence below this temperature is extrapolated for the present
purpose [27]; thus, for red oak, along the grain, one has:
29

k(T) = 0.0039 (T/300),W/cm°C
The results, which are shown in Figure 26, are discussed below.
The convective heat flux from the gas flowing along the channel to the wall
(downstream of the peak temperature point) is more difficult to estimate
because a direct measure of the gas temperature is not available. It will be
assumed that the gas acts as a plug flow which is initially all at the peak
temperature of the charred wood surface. Since it is quite unlikely that the
gas over the whole channel cross section gets to this temperature, this will
yield an over estimate of the convective heat flux. Given this assumption,
one can calculate the temperature of the gas as it proceeds downstream from
the initial peak temperature plane by solving the following differential
energy balance equation:
dTG/dx = -hAw [ TG"Tw(x )]
This simply expresses the assertion that the gas temperature decays as it
loses heat to the wall by convection. Here m^ is the mass flow rate of the
gas, CG is the heat capacity of the gas, TG is the gas temperature, h is the
convective heat transfer coefficient, is the channel sidewall area per unit
length of channel (the open side of the channel, which has about 14% of its
side wall area, is assumed adiabatic for lack of better information; there are
recirculation zones between the channel and the windows along the open side
which make this a reasonable approximation),Tw (x) is the temperature
distribution along the channel wall obtained in Figure 25 by extrapolating the
in-depth profiles to the surface as shown; these surface temperatures results
are well- fitted by a straight line or a parabola. The above equation can then
be solved analytically for TG . The resulting expression is used to calculate
the convective heat flux to the wall:
h [Tg (x) -Tw (x)
]
This profile along the longitudinal direction is also shown in Figure 26.
30

Estimation of the radiative flux from the sidewalls of the U channel to the
base of the U requires certain assumptions also. The principal assumptions
are that the temperature profile of the sidewalls is the same as that
determined from Figure 25 for the base of the U and also that, once the peak
surface temperature is achieved on the surface, the surface remains at that
temperature for all points upstream (up to the other end of the char oxidation
zone) . Visual observations of the glowing of the channel walls suggest that
these assumptions are reasonable but they have not been quantitatively
checked. It is also assumed that the walls remain flat throughout the
isothermal region whereas they actually curve irregularly outward as the char
is gasified by oxidation; this assumption is less of an approximation at the
higher air flows
.
With the preceding assumptions one can show that the longitudinal distribution
of radiant flux along the centerline of the base of the U channel is given by:
q_ n (x) = 2aT (F-F')+RAD w , max
Za\
'A
max[Tw(x')n 2 2
L i+(x-x')2 2 2
Z +a +(x-x')dx'
Here a is the Stefan-Boltzmann constant, Tw MAX is the peak wall temperature,
F is the radiative view factor from the isothermal portion of the sidewall to
a point on the axis of the U channel base, F' is a correction to the preceding
view factor when the point on the axis of the U channel base is beyond the < end
of the isothermal portion of the sidewall, Z is the half-width of the U
channel, Tw (x') is the linear or parabolic fit to the surface temperature in
the non- isothermal region, x' MAX is the maximum downstream position to which
the integration of the flux from the non- isothermal sidewall region is taken,
x is the longitudinal coordinate, x' is a dummy longitudinal coordinate of
integration. The view factors F and F',which have the same functional form,
are obtained from a standard reference [28]:
F = (1/2*) [arctan(b/i) - (i/(a2 + i
2)%
) arctan(b/(a2 +i 2)* ) ]
Here b is the length of the isothermal sidewall region and a is the height of
the sidewalls.
31

The necessary integration in the above equation is best done numerically. The
resulting longitudinal profiles of radiative flux along the central axis of
the base of the U channel are shown in Figure 26
.
Figure 26 shows calculated results for a high and a low air inflow velocity.
The flux distributions are shown superimposed on a cross-sectional plane
through the central axis of the base of the U channel; the starting point at
the left of the Figure corresponds to the point where the surface temperature
first reaches its maximum value and the distributions stretch downstream from
that point. Also shown in the Figure are the integrals of the areas under
these profiles which measure the total heat transferred to the wood by each
mode per unit width of the wall. It is immediately clear that conduction heat
transfer downstream through the wood is a minor contributor to the overall
wood heat-up process. This helps explain how the two different kinds of wood,
with their differing thermal conductivities, can have essentially the same
smolder propagation velocity. One has to be more cautious in assessing the
relative importance of the other two heat transfer modes; there are
significant approximations in these numbers which are difficult to quantify.
It is probable that both convection and conduction have been somewhat
overestimated, given the assumptions noted above. It is probably reasonable
to conclude that radiation is dominant at low flow velocities and that the two
modes are comparable at high flow velocities. This is not necessarily what
one might expect, however, and this issue is worth revisiting when more solid
data are available on surface and gas temperatures in the U channel. This
issue is worth pursuing because it makes inferences about other configurations
and sample dimensions possible. For example, if radiation is the dominant
heat transfer mode, to a first approximation, smolder will propagate just as
fast against the air flow as with it. These issues will be examined in future
tests
.
3.7 Gas Phase Pyrolysis and Oxidation Kinetics
A further goal of the present study is to estimate the conditions of
temperature, time and oxygen level required to destroy the various species
evolved from wood burning. Such results could give the wood stove designer
32

target conditions which his design must shoot for in order to assure minimal
air pollution.
Attempt at direct measurement . The original intent in this study was to
perform experimental measurements of the rates of gas phase thermal pyrolysis
and oxidation for about half a dozen of the species most prominent in the cold
trap condensate. A laminar flow reactor was constructed for this purpose;
such devices are relatively simple and inexpensive, which probably accounts
for their continuing popularity for making measurements such as those planned
here. Such reactors are typically constructed of small diameter tubes (in the
present case, 1 mm and 2 mm ID) to assure good temperature uniformity over the
tube cross section (this is necessary with highly exothermic oxidation
reactions) . The tube surface is heated uniformly to some desired temperature
and the gas mixture of interest is passed through the tube at a measured flow
rate so that the residence time is well-defined. The composition of the
products leaving the reactor is then analyzed; from various series of such
experiments one can infer the kinetic rate parameters for the degradation of
the compound of interest.
Since the reactor tube is small in diameter, the gas molecules have a
significant probability of striking the wall one or more times during their
passage through the tube. In order to minimize the probability that such wall
collisions would result in catalysis, the wall was made from pure gold, a
material noted for its inertness in many contexts. When it became apparent
that the wall was in fact causing heterogeneous reactions despite the use of
gold, the reactor was designed to accept two different diameters of tube so
that, in principle, the homogeneous and heterogeneous contributions to a
measured net change in the concentration of the species of interest could be
separated; only the homogeneous contribution is pertinent to the present
study. Further tests with this double tube reactor revealed unexpected
complexity, however: pyrolytic reactions appeared to be accelerated by the
wall while oxidative reactions were retarded. This raised the question of the
separability of the two modes of reaction (wall vs. gas phase); it was quite
possible that they were interacting in a non-linear manner. In view of these
complications,the limited time and the availability of an alternative means
33

to estimate the kinetic rate parameters, this experimental effort was
terminated.
Prediction of the rate parameters. The rate of disappearance of a chemical
species in an isothermal, well-mixed system containing oxygen is the result of
two parallel modes of chemical change, thermal pyrolysis and oxidative attack.
The first process is unimolecular under the conditions here and thus depends
only on the concentration of the species of interest. The second process is
potentially the result of attack by a variety of radical species on the target
molecule and there are, therefore, several further parallel paths that depend
both on the concentration of the target molecule and on the concentration of
the attacking radical (bimolecular reactions). Thus one can write for the net
rate of disappearance of the target molecule:
d[M]/dt = -ku [M] - [MJSk^ [RJi
where [M] is the concentration of the target molecule (mol/liter), t is time,
ku is the rate constant for unimolecular decomposition,i
is the rate
constant for the ith reaction that involves attack by radical Ri
. Rearranging
this slightly, one sees that the rate of disappearance of the target molecule
is characterized by a time constant r expressed as follows:
r = l/{ku + SkbJRJ}i
In an isothermal flow, this is the time for the concentration of the target
molecule to decay to 1/e of its initial value. In the absence of oxygen, only
the first term in the denominator applies since only unimolecular
decomposition occurs. In the presence of oxygen both terms apply.
For the present purpose of estimating the rate of disappearance of pollutant
species in the gas phase of a wood burning stove, one can assume that the
principal oxidizing radical in all cases is the hydroxyl radical [29, 30].
One then needs an expression for the concentration of this radical as a
34

function of temperature. The following applies within about a factor of three
for a wide range of fuel -air mixture ratios [30]
:
[OH] = 10' 1 7 exp( -17600/T) (mol/liter)
where T is the absolute temperature in Kelvins. This is an equilibrium value
of OH concentration established by various rapid elementary reactions in the
radical pool.
In order to proceed further and estimate the net rate of target molecule
disappearance, one needs estimates also for the rate constants. Data for ku
and kbi were obtained from the literature or were developed by estimation
techniques described in Appendix A of this report. These data are summarized
for the selected compounds reported in Table 2. The species there include
several identified in our previous study together with a selection of relevant
aromatic species. For each chemical compound, the selected values for the
rate constants, ku and kbi ,together with computed values for (0H) EQ were
incorporated into the above equations to develop values for r. These computed
values for each selected compound are shown in Figure 27, in which the
predicted time- temperature degradation behavior of these compounds is
illustrated for 63% decomposition, the so-called "l/e M degree of degradation.
Corresponding degradation behavior for any other degree of decomposition can
be obtained by recomputing r for each temperature for pyrolysis or oxidation
according to the expression,
r = k“ 1 ln(l/(l-a)
)
In the equation above, a is the degree of decomposition which can be specified
by dividing the percent of decomposition by 100.
Figure 27 shows separately the temperature -dependent time to destroy a target
molecule by either pyrolysis or oxidation. Note that the requisite oxidation
conditions for all of the species fall within a band that is about one order
of magnitude wide; the pyrolysis conditions vary much more widely with the
35

chemical identity of the species. Except at high temperatures, oxidation is
predicted to be the primary path of destruction.
Also indicated in Figure 27 is the approximate domain of time and temperature
in which one can expect typical woodburning stoves to operate if the air
supply is somewhat restricted. The upper temperatures certainly include
flaming combustion; the lowest temperatures pertain to the pure smoldering
mode examined in this study. The residence times are estimated from stove
volume and typical air flow rates. It is worth noting that for this range of
residence times the predicted temperatures necessary to oxidize the various
pollutant species are in approximate agreement with the rule of thumb
sometimes used by stove designers (1100°F - 870 K; ref. 31).
It should be quite clear from Figure 27 that the temperature- time domain of
operation of a wood stove, especially in the smoldering mode, is far from that
necessary for effective destruction of the pollutant species generated by the
wood burning process. On this Figure, the only realistic way to move in order
to achieve pollutant destruction is upward in temperature, since the
horizontal scale is logarithmic. To do this one needs to get all of the gas
in the stove essentially up to the same temperature as the actively oxidizing
char surface. With the usual random arrangement of wood logs in the firebox,
there is simply not enough contact between the gas and the solid phases to
approach this thermal equilibrium. Such contact requires re-sizing of the
fuel down to small chunks, forming a packed bed through which all of the
incoming air flow must pass. However, there are problems with using a packed
bed fuel configuration. If the air moves through the bed in the same
direction as the propagating smolder oxidation zone (forward smolder), the
gases must pass through cooler regions of the fuel bed where they will emerge
contaminated with pyrolysis vapors. If the air moves in the opposite
direction (reverse smolder),there is a tendency for the smolder reaction zone
to be incomplete in its consumption of the solid [7]
.
Pre-heating the air is
of some help in boosting the emerging gas temperature [31], but extensive pre-
heating requires significant re-design of the woodstove.
36

The conclusion which the preceding discussion rather insistently points to is
that effective elimination of pollutants generated in a woodstove operated in
a smoldering mode requires either some drastic re-design of the stove (not
envisioned above) or the use of some form of afterburner on the exhaust.
Given the large gap in Figure 27 between the typical operating conditions for
smoldering and the estimated requisite conditions for pollutant destruction,
it is unlikely that refinements in the estimates of the latter would alter
this conclusion.
3.8 Conclusions
In the apparatus used here, the forward spread of smolder over solid wood was
self-sustaining only over a rather narrow range of air inflow rates. The
lower limit is probably extendable by further thermal insulation around the
sample and/or by the use of thicker wood; the upper limit, due to the
transition to flaming, is probably more inherent in the behavior of wood and
thus is probably independent of the apparatus design.
Both red oak and white pine behave in a similar manner in this forward smolder
mode and it appears that the smolder process tends to sweep out a constant
volume of wood as a function of time, independent of the wood properties. The
minor role for heat conduction through the wood in causing smolder to
propagate is one reason for this; the equal temperatures” achieved on the
oxidizing char surface is the other. The latter fact evidently reflects equal
amounts of heat evolved per gram of oxygen reaching the char surface of either
wood. The essentially linear increase in smolder velocity, surface
temperature,rate of heat and product release with increases in air inflow
rate also reflect a pivotal role for the rate of oxygen supply to the
oxidizing char surface. However, the failure of the char oxidation zone to
grow to the point where it was long enough to consume all incoming oxygen
implies that oxygen supply rate has a less than total control over the rate of
smolder propagation. This is in contrast to the complete dominance oxygen
supply rate has in one -dimensional forward smolder through a packed fuel bed.
In the present configuration, the failure to consume all oxygen points to a
key role for downstream heat transfer rate in the propagation process. This
37

heat transfer was seen to be dominated by radiation, at least at low air flow
rates; at higher flow rates convection appears to be equally important.
The major products of the wood smolder process appear to be essentially the
same here, in the previous forced gasification experiments and in a wood stove
operated in a smoldering mode. The ratio of CO to C02
does vary among these
various gasification circumstances and this appears to reflect varying degrees
of CO oxidation. This oxidation appears to be the only significant change
that occurs to the products evolved from smoldering wood as they pass through
a wood stove. Estimates of the kinetic rate parameters for the oxidation and
pyrolysis of several of the species in the tar confirm that they are not
subject to destruction at the combination of temperatures and times
encountered in conventional wood stoves. Gas phase destruction is possible
only at higher temperatures and these are probably achievable only through
thee use of an auxiliary heat source such as an afterburner, if a stove is to
be operated in a smoldering mode.
Acknowledgements
Mr. Scott Dolan provided extensive assistance in setting up and performing the
experiments as well as in the chromatographic analyses. This work was
supported in part by the Department of Energy, Office of Buildings and
Community Systems, under Contract No. DE-AI01- 76PR06010
.
38

REFERENCES
[1] Ohlemiller, T.,Kashiwagi
,T. and Werner, K.
,"Products of Wood
Gasification", National Bureau of Standards NBSIR 85-3127, April 1985 .
[2] Ohlemiller, T. and Rogers, F.,"Smoldering Combustion Studies of Rigid
Cellular Plastics", Princeton University Department of Mechanical and
Aerospace Engineering Report No. 1432, May, 1979 (Final report to the
Products Research Committee)
.
[3] Thring, M. W.,The Science of Flames and Furnaces . Chapman and Hall
,
London (1952) p. 134 ff.
[4] Spalding, D., Some Fundamentals of Combustion . Butterworths,London
(1955) p. 98 ff.
[5] Palmer, K.,Combust. Flame 1, (1957) 129.
[6] Ohlemiller, T.,"Forced Smolder Propagation and the Transition to
Flaming in Cellulosic Insulation", National Bureau of Standards NBSIR
85-3212, October 1985.
[7] Ohlemiller, T. and Lucca, D.,Combust. Flame 54, (1983) 131.
[8] Zabetakis,M. , "Flammability Characteristics of Combustible Gases and
Vapors", Bureau of Mines Bulletin 627 (1965).
[9] Alexopoulos,
S. and Drysdale, D., University of Edinburgh, private
communication, 1987.
[10]
Cooke, M.,Allen, J., and Hall, R.
,"Characterization of Emissions from
Residential Wood Combustion Sources", in Residential Solid Fuels.
Environmental Impacts and Solutions . Cooper, J. and Malek, D. (editors),
Oregon Graduate Center, Beaverton, Oregon (1982), 139.
39
[11] Anon., "Residential Wood Heater Test Report", Phase II, Volume I,
Tennessee Valley Authority, Energy Use Test Facility, CHattanooga,
Tenn.,August 1983.
[12] Tillman D.,Rossi, A., and Kitto, W.
,Wood Combustion: Principles
Processes and Economics . Academic Press, New York (1981), p.43.
[13] Magnani, C. and Farouq-Ali, S., Soc. Petroleum Eng. J. . October, 1975,
p.425.
[14] Krukovskii, V., Pitin, R. and Farberov, I., "Underground Processing of
Fuels", translated from Russian and published by the Israel Program for
Scientific Translations, Jerusalem .Israel (1963), p. 91 ;available
from the Federal Scientific and Technical Information Clearinghouse,
Washington, D.C.
[15] Roberts, A. and Clough, G.,Combust. Flame 11 . (1967), p.365.
[16] Dryer, F.,"High temperature oxidation of carbon monoxide and methane in
a turbulent flow reactor",Princeton University Aerospace and Mechanical
Sciences Dept. Report No. T-1034 (1972).
[17] Laurendeau, N.,Prog. Energy Combust. Sci. 4, (1978), p. 221.
[18] Kashiwagi. T.,Ohlemiller, T. and Werner, K.
,Combust. Flame 69, (1987),
p. 331.
[19] Ahmed, S. and Beck, M.,Carbon 23 . (1985), p.513.
[20] Degroot, W. and Shafizadeh, F.,Carbon 21, (1983), p.61.
[21] Shafizadeh, F.,Bradbury, A., Degroot, W. and Aanerud, T.
,Ind. Eng.
Chem. . Prod. Res. Dev. 21, (1982) p.97.
[22] Boroson, M.,"Secondary reactions of tars from pyrolysis of sweet gum
40
hardwood", Ph. D. thesis, Dept, of Chemical Engineering Massachusetts
Institute of Technology, May, 1987.
[23] Gann, R.,"Comparison of principal combustion products from a wood stove
as a function of height in the chimney", Fiscal Year 1982 Final Report
from the National Bureau of Standards on DOE Project No. 133a,DE-A01
- 76PR06010,October 1982.
[24] Muhlbaier, J., "A characterization of emissions from wood-burning
fireplaces", in Residential Solid Fuels , ibid, p.164.
[25] McCaffrey, B.,"Purely Buoyant Diffusion Flames: Some Experimental
Results", National Bureau of Standards NBSIR 79-1910, October 1979.
[26] Huggett, C., Fire and Materials 4. (1980), p.61.
[27] Kanury, A. and Blackshear, P.,Combust. Sci. Technol, 1, (1970), p.339.
[28] Eckert, E. and Drake, R.,Analysis of Heat and Mass Transfer .
McGraw-Hill, New York, (1972), p.622.
[29] Benson, S. Twenty-First Symposium (International) on Combustion (1986),
proceedings in press.
[30] Tsang, W. and Shaub,W.
,"Chemical processes in the incineration of
hazardous materials", in Detoxication of Hazardous Waste . (J. Exner,
ed.), Ann Arbor Science, Ann Arbor Michigan (1982), p.41.
[31] Dobson, L.,"High-tech non-catalytic woodstove design considerations",
in Proceedings of the International Conference on Residential Wood
Energy, Reno, Nevada, March, 1986.
41
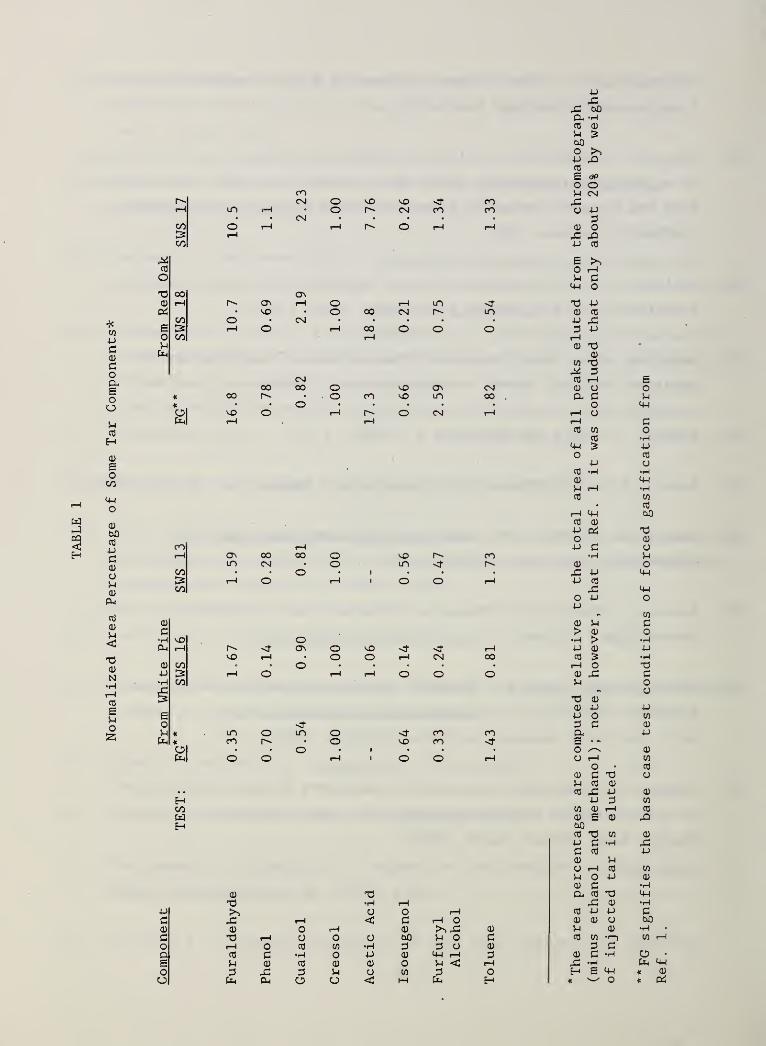
Normalized
Area
Percentage
of
Some
Tar
Components*
bOOPdEo
co pr^ CM o NO VO CO 42f—
i
m p • o CM CO CO O• • CM O • • • •
co o p rH o 1“
1
p d£2 t—
1
42CO P
Ed Oo P
4-1
G 00 ONd f—
1
ON P o I—
1
m G• VO o 00 CM r^ m d
00 o • CM • • • • • P£ rH o f—
1
00 O o o 3O CO rP iPP dCP
co
4«S
CM d00 00 o VO ON CM d
* 00 • o CO VO m 00 . a* • • o • • • • •
e> VX) o r—l o CM »P ?pip fH i—
i
rP
HcoWH
P42 bOCh Pd dP S
OO
d CO
d4-1 £OP
d *Pa>
P Pd
d G CP d G 4-J
G •P Ip 42 d •HP a o rH d p P G(2 42 T“^ < G P o d d a bOd d O 1—1 d >n42 d p d •p •
C G r—
1
O o o bO P O G d co •'“> CO rPo iP o d CO •H 3 3 O d 3 GO d c •p o p d 4-J P 3 d G •iH o •
E P d d d d O P < r—l 42 P4-i
IP po 25 42 3 p o CO 3 o H E * du CP CP O o < ip IP H o * 0d
o •
(D C T3p d a;
d 42 pp 3
co a) i—
i
a) £ a)
bOd d «P C PG dd PO P dPOPd C
EOP4-1
coppdo•p4-1
•HCO
dP 4-1 bOd dp c6 Go d
co p p C Op ON 00 00 o vO r^ CO p Pin CM • o in <± d O
CO • • o • i • • 42 P 4-1
£2 P o rH l o O rH p dCO 42 4-1
O P OP
at CO
d d p Cc > d o,
0H VO o •p > •HCP f—
1
r»* ON o vX> •sl- r—l p d pNO p • o O ip CM 00 d £ •p
d CO • • o • • • • • P o Gp £2 p o rH rH o o o d 42 C*tH CO p o
•V O3 G d
d p PE P o CO
o 3 C dp « m o m o •o CO CO a pIP * CO • o VO CO Eo • • o • i • • • O dCp o o rH i o o rH O P CO
do
a>co
d42
a>
42Pco
d•fH
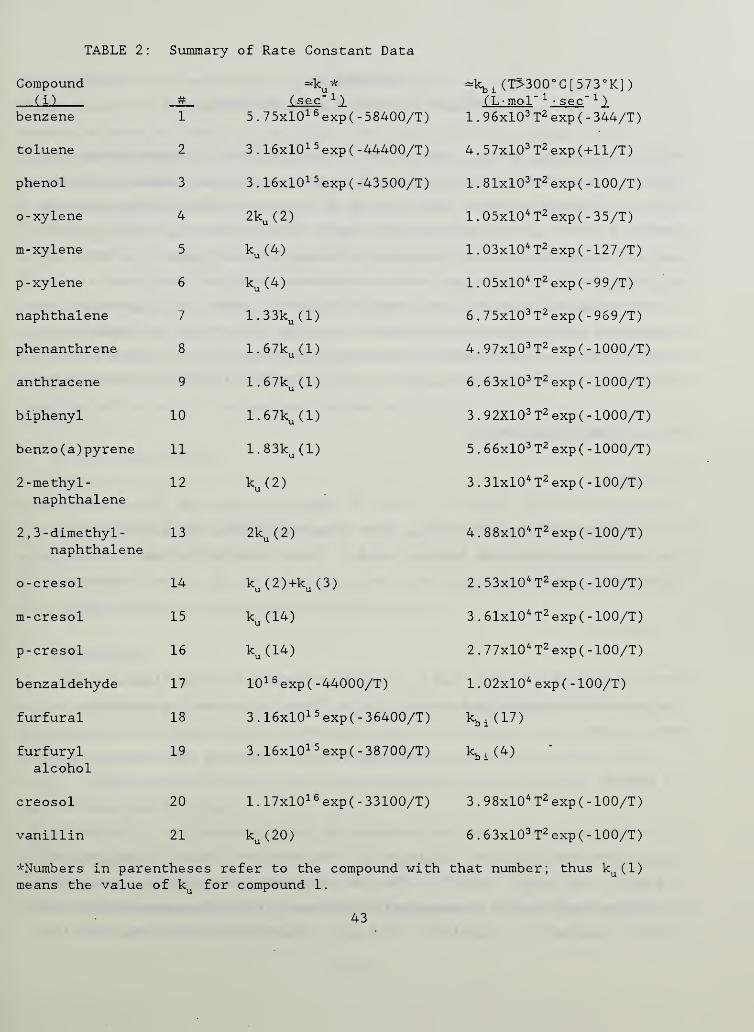
TABLE 2: Summary of Rate Constant Data
Compoundm #benzene 1
toluene 2
phenol 3
o- xylene 4
m-xylene 5
p -xylene 6
naphthalene 7
phenanthrene 8
anthracene 9
biphenyl 10
benzo (a) pyrene 11
2 -me thy1-
naphthalene12
2 , 3 - dimethyl
-
naphthalene13
o-cresol 14
m-cresol 15
p-cresol 16
benzaldehyde 17
furfural 18
furfurylalcohol
19
creosol 20
vanillin 21
U( sec
5 . 75X10 1
6
exp ( - 58400/T)
3 . 16X10 1
5
exp ( -44400/T)
3 . 16X10 1
5
exp ( -43500/T)
2ku ( 2
)
ku (4)
ku (4)
1 • 33ku (1)
1 • 67ku (1)
1.67ku (l)
1.67ku (l)
1 • 83ku (1)
ku (2)
2ku (2)
ku ( 2 ) +ku ( 3
)
ku d4)
ku (14)
10 1
6
exp( -44000/T)
3 . 16X10 1
5
exp( - 36400/T)
3 . 16xl015 exp(-38700/T)
1 . 17x10 1
6
exp ( - 33100/T)
ku (20)
-kbi (T>300°C[573°K]
)
(L-mol " 1• sec ' 1
1 . 9 6xl0 3 T 2 exp ( - 344/T)
4 . 57xl0 3 T2 exp (+11/T)
1 . 81xl0 3 T2 exp ( - 100/T)
1 . 05xl0 4 T2 exp ( - 35/T)
1 . 03xl0 4 T2 exp( -127/T)
1 . 05xl0 4 T2 exp ( - 9 9/T
)
6 . 75xl0 3 T 2 exp ( - 969/T)
4 . 97xl0 3 T2 exp ( - 1000/T)
6 . 63xl0 3 T2 exp ( - 1000/T)
3 . 92X10 3 T2 exp ( - 1000/T)
5 . 66xl0 3 T2 exp ( - 1000/T)
3 . 31xl0 4 T2 exp (- 100/T)
4 . 88xl0 4 T2 exp (- 100/T)
2 . 53xl0 4 T2 exp ( - 100/T)
3 . 61xl0 4 T2 exp (- 100/T)
2 . 77xl0 4 T2 exp (- 100/T)
1.02xl0 4 exp (- 100/T)
kt, i(17)
kbiW*
3 . 98xl0 4 T2 exp ( -100/T)
6 . 63xl0 3 T2 exp ( - 100/T)
^Numbers in parentheses refer to the compound with that number; thus ku (1)
means the value of ku for compound 1.
43
APPENDIX A
ESTIMATION OF KINETIC RATE CONSTANTS
Rate constants, ku and Kbi ,were either determined from literature reports or
developed by estimation methods for the twenty one organic compounds listed in
Table 2 of the main report. The details of the development of these data are
described below. It is unlikely that errors in estimating ku and kbi would
lead to conclusions contrary to those developed in this report. An order of
magnitude error in estimating the rate constants would not result in a
corresponding shift in the time- temperature curves, such that they would
overlap the smoldering wood-burning stove domain illustrated in Figure 27 of
the main report. Care should of course be exercised in utilizing the
estimated rate constants for purposes other than that intended in this study.
Rate Constant Development:
1 . Benzene
Rate constants for both ku and k^ihave been reported in the literature for
the temperature domain of interest (1,2). These reported values are used
without modification.
2 . Toluene
Rate constants for both ku and kbi have been reported in the literature for
the temperature domain of interest (2,3). These values are used without
modification.
3 . Phenol
A rate constant for ku has been reported in the literature (4)
.
This value is
used without modification. Atkinson (2) has reported a value for kbi at 298 K
(2. 83x10" 11 cm3 -molec" 1• sec" 1
) . The low temperature mechanism is dominated by
an addition reaction to form a complex which can either decompose back to the
original reactants or stabilize. At higher temperatures additional reactions
44
are possible, e.g., metathesis (hydrogen abstraction) or elimination
(displacement of hydrogen). Available evidence, based on other reaction
systems appears to favor the metathesis reaction (see for example the work of
Madronich and Felder (5) . Examination of rate constants for hydroxyl radical
reaction with other substituted benzene compounds (2) at T=298 K and at T=1000
K (e.g., data for toluene, o-xylene, m-xylene, p-xylene (2)) suggests that
(1000)/!^ i (298) has a value of the order of 1 and that Ea/R has a value of the
order of 100 K. Using these suggested relationships based upon examination of
literature data, and Atkinson's formulation for an expression describing the
temperature dependence of kbi ,(AT2 exp ( -b/T) ) ,
it can be shown that
kh i-(3 . 0x10” 1
7
exp( -100/T)xT2) ) cm3 -molec" 1
• sec" 1 is an estimate for reaction
of hydroxyl radical with phenol at higher temperatures than about 450 K. The
lower temperature cutoff is approximate and reflects the complex nature of the
reaction mechanism at intermediate temperatures (2)
.
4. o-
,
m-
,
and p-xylene
An estimate for ku for these compounds is that ku is about twice that reported
for toluene, since, in the former cases, each compound has two methyl group
substituents and, in the latter case, toluene has one methyl substituent.
Rate constants for kbi for each compound have been reported in the literature
(2)
.
These values are used without modification.
5 . Naphthalene
An estimate for ku for naphthalene is that ku is -1 . 3xku (benzene) . The rough
adjustment is to allow for the differing number of hydrogen atoms. More
refined estimates are possible but are unnecessary for the purposes of this
study. A rate constant for kbi has been reported in the literature (2) and is
used without modification.
6 . Phenanthrene
An estimate for phenanthrene is that ku =l . 6 7ku (benzene) . The adjustment
45

follows the reasoning given for estimation of ku (naphthalene) . A rough
estimate for khi can be made as follows:
Using reported ionization potentials for benzene (IP=9.24 eV) and napthalene
(1=8 .15 eV) (6) plus kbi values for these compounds for at T=1000 K (2,7), a
plot of log10 kbi (1000 K) versus IP can be constructed. It has been observed
(2) that such linear plots result for homogeneous series of compounds. Then
using the reported value of IP=7.86 eV (7) for phenanthrene,an estimated
value for kbi (1000 K) for phenanthrene can be derived from such a plot. This
is found to be k^i=4 . 99x10" 12 cm3 -molec" 1
• sec -
1
. For unsubstituted aromatic
compounds it appears that as an estimate, E/R - 1000 K, and using a fitting
function (2) of AT2 e-b/T,a value for A can be found, A=8 . 25x10" 1
8
cm3 -molec'
1• sec -
1
• deg-
2
. The rate constant expression that can be constructed from this
analysis (see Table 2 of main text) can be used to check the literature value
reported for kbi (phenanthrene) at T=748 K (2.2xl0-2 cm3 -molec" 1• sec -
1
(2)
.
The calculated value found from the estimated expression is found to agree
well with the literature value, the former being found to be±(phenanthrene
,
estimated)=2 . 4x10" 1
2
cm3 -molec -
1
• sec" 1• . The estimated expression for k^
iwas
assumed useful without modification for T > 600 K. Below this approximate
temperature range, competition with other reaction channels causes increasing
uncertainties in the use of this expression.
7 . Anthracene
An estimate for anthracene is the ku is -1 . 6 7ku (benzene) . The adjustment
follows the reasoning given for estimation of ku (naphthalene) . A value for
kbi has been estimated according to the method outlined for phenanthrene. In
making this estimate a value of IP=7.41 eV was used for anthracene (6).
8
.
Biphenyl
An estimate for biphenyl is that ku is -1 . 6 7ku (benzene) . The adjustment
follows the reasoning given for estimation of ku (naphthalene) . A value for
kbi has been estimated according to the method outlined for phenanthrene. In
46

making this estimate a value of IP=8.27 eV was used for the biphenyl molecule
( 6 ).
9. Benzo (a) pyrene
An estimate for benzo (a) pyrene is that ku is «1 . 8 3ku (benzene) . The adjustment
follows the reasoning given for estimation of ku (naphthalene) . A value for
kbi has been estimated according to the method outlined for phenanthrene . In
making this estimate a value of 7.63 eV was used for the IP of benzo (a) pyrene
(6). The value required for kbi at T=298 K which is required in the
calculation method outlined above was obtained from a plot of log^lc^ at
T=298K versus IP for benzene and naphthalene, resulting in a value at T=298 K
of kjji(benzo (a) pyrene) = 3. 16x10' 11 cm3 -molec" 1
• sec' 1. The IP used for
benfco (a) pyrene in the calculations is an average of three reported values:
7.56, 7.60 and 7.73 eV (6)
.
10. 2 -methyl naphthalene
An estimated value for ku is ku — ku (toluene), since both compounds have one
methyl group from which a hydrogen atom can be eliminated. A value fori
was derived using the reasoning applied in developing a value for kbi (phenol).
In making the estimate, a value of 'khi (2-methyl naphthalene)= 5.23X10' 11 cm3-
molec' 1• sec" 1 at T=295 K was utilized (2).
11 . 2,3- dimethyl naphthalene
An estimated value for ku is ku - 2ku (toluene) . The reasoning for this
estimate follows that for o -xylene. A value for kbi was derived using the
reasoning applied in developing a value for kbi (phenol). In making the
estimate a value oft (2 , 3-dimethyl naphthalene)= 7 . 68x10' 1
1
• cm3 -molec" 1 sec'
1 at T=295 K was utilized (2)
.
12. o-
,
m-
,
p-cresol
47

Since the cresols each have one methyl and one hydroxyl substituent groups
having approximately comparable elimination rate constants, following the
reasoning applied to the xylenes, an estimated value of ku
for the cresols is
ku — ku (toluene) + ku (phenol) . Estimated values for k^iwere derived using
the reasoning applied in developing a value for kbi (phenol). In making the
estimates for kbi at T=298 K, the values used were 4.0xl0-11,5.7xl0-11 and
4.4xl0_11 respectively for the ortho-, meta- and para-cresol isomers (2).
13 . Benzaldehyde
The activation energy for ku can be estimated from a calculation of heat of
reaction estimated from thermodynamic parameters abstracted from the
literature (3,8) in which it is assumed that a hydrogen atom is eliminated
from the formyl substituent rather than from the aromatic ring. This pathway
is favored by the formatioh of the resulting resonance stabilized radical (9)
.
A pre- exponential factor of 10+16 sec" 1 is estimated (13). An estimated value
for kbi was derived using the reasoning applied in developing a value for
kbi (phenol). In making the estimate a value for kbi of 1.6xl0_11
cm3 -molec" 1• sec" 1 at T=298 K was used (10).
14 . Furfural
An approximate lower limit for the activation energy for kuwas estimated by
first examining differences in the heats of reaction calculated (3,8) for
elimination of OH from (CH3)0H and the compound (C
6H
5)CH
20H, respectively.
The difference in heats of reaction was taken as an approximate aromatic ring
stabilization energy correction factor. This correction factor (also
derivable from comparison of methane and toluene) was applied to an estimated
heat of reaction for hydrogen atom elimination from formaldehyde to obtain the
activation energy for hydrogen atom elimination from the formyl group
substituent in furfural. This activation energy may be an underestimate, a
higher value being derived assuming Ea
for ku (furfural) is equal to the
activation energy associated with the unimolecular dissociation of
benzaldehyde . Again, however, this difference in estimates has no effect upon
the possibility of overlap in the time- temperature curves shown in Figure 27
and discussed in this report. The pre -exponential factor was assumed to be
48

slightly less for furfural than for benzaldehyde (5)
.
An approximate estimate
for kbi (furfural) is that it is approximately equal to kj^i(benzaldehyde)
,the
two molecules having the same substituent group attached.
15. Furfuryl alcohol
The activation energy for ku was assumed comparable to the activation energy
for hydroxyl radical elimination from (C6H5)CH
2OH. For the latter reaction,
the bond dissociation energy is about 77 kcal per mole (8)
.
The pre-
exponential factor was set similarly to that for furfural. The bimolecular
rate constant was assumed equivalent to that for phenol by analogy to the
comparison between kbi for benzaldehyde and furfural.
16 . Creosol
The rate constant for ku is assumed equivalent to that for the molecule
(C6H5)0-CH
3for the indicated carbon-oxygen bond rupture. The latter rate
constant has been derived in a shock tube study (11) . An estimated value for
kbi was derived using the reasoning applied in developing a value for
khi (phenol). In making the kbi estimate, a value for kbi (creosol) at T=298 K
had to be derived. This was calculated according to the procedural method
developed and described by Zetzsch (10). As discussed in Atkinson's report,
the rate constant can be expressed by Zetzsch' s method as,
l°gi 0 kbi(298)= -11.64-1.31 ScrJ
In the equation above, substituent constants, cr+,are selected which produce
the largest negative value for the substituent constant summation term, Za+.
The values of a+ used for estimating kbi (creosol) were taken from Zetzsch'
s
paper except for a+ of the m-hydroxyl group, a+ - 0.01, which was found by
comparing values for ct+ for m-
,p-amino, p-hydroxy then interpolating between
substituent values for the amino- and methoxy- group values using the known
value of a+ for p-hydroxy (12)
.
17. Vanillin
49
The rate constant, ku ,for vanillin was assumed equivalent to that for
creosol, the same bond undergoing rupture. An estimated value for;was
derived using the reasoning applied in developing a value for kbi (phenol). As
with creosol, in making the k^ estimate, a value for k^L(vanillin) at T=298 K
had to be derived. As with creosol, Zetzsch's method was applied (2,10), with
a+ substituent constants obtained from reports of Brown and Okamoto (12) and
Zetzsch (10), except for a+ for the formyl substituent, - 0.46, which was
estimated by making comparisons, as was done for creosol.
50
REFERENCES. APPENDIX A
[1] Hsu, D.S.Y., Lin, C.Y. and Lin, M.-C., 20th Symposium (International)
Combustion . The Combustion Institute, Pittsburgh, PA, pp623-630 (1984)
[2] Atkinson, R.,Chem . Rev . 85 . 69-201 (1985); and references cited
therein.
[3] Benson, S.W. and O'Neal, H.E., Kinetic Data on Gas Phase Unimolecular
Reactions . NSRDS -NBS - 21 ,National Bureau of Standards, Washington, D.C
(1970)
.
[4] Shaub,W.M. and Tsang, W.
,Environ. Sci. Tech. 17 . 721-730 (1983).
[5] Madronich, S. and Felder, W.,J . Phvs . Chem . 89 . 3556-3561 (1985).
[6] Rosenstock, H.M.,Draxl, K.
,Steiner, B.W. and Herron, J.T., J . Phvs
.
Chem. Ref. Data 6 (Suppl. No. 1), (1977).
[7] Biermann, H.W._, MacLeod, H. Atkinson, R.,Winer, A.M. and Pitts,
J.N.Jr., Environ. Sci. Tech. 19 . 244-248 (1985).
[8] Benson, S.W., Thermochemical Kinetics . John Wiley (1976).
[9] Stein, S.E., Center for Chemical Physics, NBS, private communication
(1986)
.
[10] Zetzsch, C., Abstract A-ll (p29) in: 15th Informal Conf. on
Photochemistry . Stanford, CA, June 27-July 1 (1982).
[11] Hsu, D.S.Y., private communication
[12] Brown, H.C. and Okamoto, Y.,
J. Amer. Chem. Soc. 80, 4979-4987 (1958).
on
51

[13] Tsang, W. and Shaub,
W. in: Exner, J.H. (editor), Detoxication of
Hazardous Waste . Ann Arbor Science, Ann Arbor (1982).
52
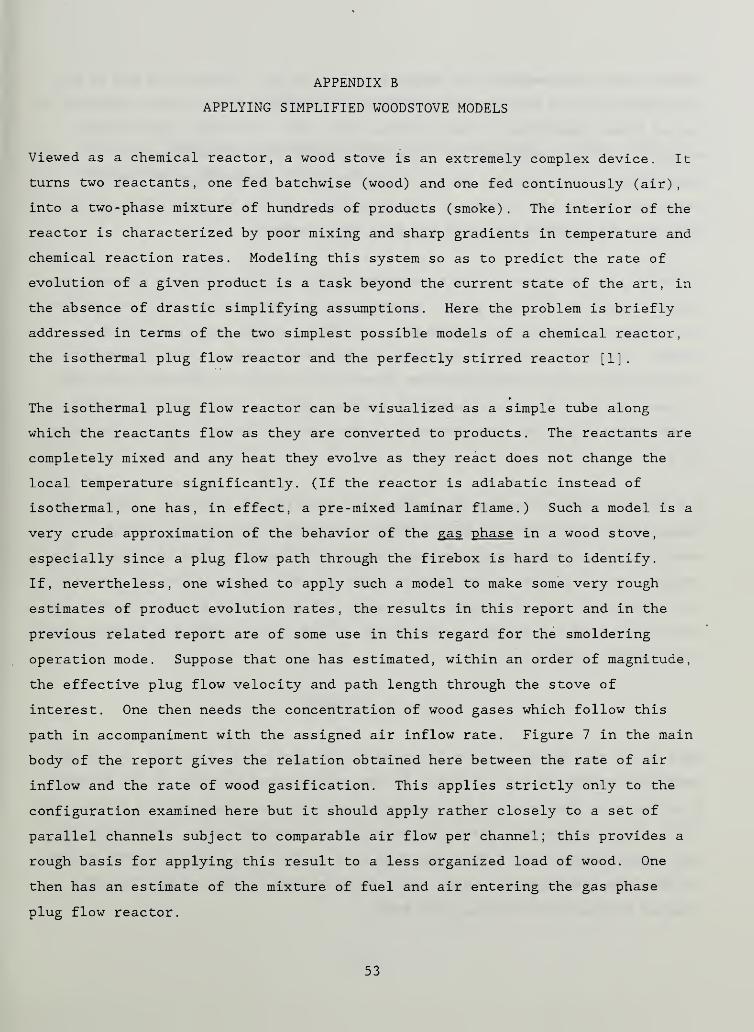
APPENDIX B
APPLYING SIMPLIFIED WOODSTOVE MODELS
Viewed as a chemical reactor, a wood stove is an extremely complex device. It
turns two reactants, one fed batchwise (wood) and one fed continuously (air),
into a two -phase mixture of hundreds of products (smoke) . The interior of the
reactor is characterized by poor mixing and sharp gradients in temperature and
chemical reaction rates. Modeling this system so as to predict the rate of
evolution of a given product is a task beyond the current state of the art, in
the absence of drastic simplifying assumptions. Here the problem is briefly
addressed in terms of the two simplest possible models of a chemical reactor,
the isothermal plug flow reactor and the perfectly stirred reactor [1]
.
The isothermal plug flow reactor can be visualized as a simple tube along
which the reactants flow as they are converted to products . The reactants are
completely mixed and any heat they evolve as they react does not change the
local temperature significantly. (If the reactor is adiabatic instead of
isothermal, one has, in effect, a pre-mixed laminar flame.) Such a model is a
very crude approximation of the behavior of the gas phase in a wood stove,
especially since a plug flow path through the firebox is hard to identify.
If, nevertheless, one wished to apply such a model to make some very rough
estimates of product evolution rates, the results in this report and in the
previous related report are of some use in this regard for the smoldering
operation mode. Suppose that one has estimated, within an order of magnitude,
the effective plug flow velocity and path length through the stove of
interest. One then needs the concentration of wood gases which follow this
path in accompaniment with the assigned air inflow rate. Figure 7 in the main
body of the report gives the relation obtained here between the rate of air
inflow and the rate of wood gasification. This applies strictly only to the
configuration examined here but it should apply rather closely to a set of
parallel channels subject to comparable air flow per channel; this provides a
rough basis for applying this result to a less organized load of wood. One
then has an estimate of the mixture of fuel and air entering the gas phase
plug flow reactor.
53

Suppose that the component of interest is in the tar. Figures 20 and 21 give
an estimate of the fraction of gasified wood which is tar; if the component is
one of those identified in the previous work (ref. 1 in main body of this
report),the data accompanying Figure 18 of that report (see also the
discussion of that Figure) provide an estimate of the fraction of that
component in the tar. Thus one has an estimate of the concentration of the
component of interest entering the plug flow reactor.
To calculate the amount of this component which survives passage through this
reactor requires that one pick a temperature for the reactor and then utilize
the estimated kinetic rate parameters in Table 2 of the main body of this
report. For the estimated time that the gas will spend at this temperature
and the net pyrolytic and oxidative kinetic rate constant obtained from Table
2, one then gets the fraction of the species which is destroyed by plugging
these numbers into the last equation in Section 3.7 and solving for the value
of a
.
A perfectly stirred reactor is another idealization of reality. Here it is
assumed that the reactants mix instantly throughout the reactor volume;
composition and temperature are thus uniform throughout. The reactants, on
average, spend a time in the reactor equal to the reactor volume divided by
the volumetric flow rate of the reactants. From a simple species balance one
can show the change in the concentration of the reactant between entering and
exiting the reactor is [1]
:
AY = (Vr /F) -RR(T)
Here AY is the change in mass fraction of the species of interest, VR is the
estimated volume of the gas phase in the well-stirred portion of the firebox,
F is the mass flow rate of the reactants into the gas phase of the firebox and
RR(T) is the volumetric rate of consumption of reactant mass, obtainable at
any chosen temperature T from the rate data in Table 2. Thus the application
of this simplified model, using the data developed in this study, is quite
similar to that for the plug flow model.
54

References , Appendix B
[1] Smith, J., Chemical Engineering Kinetics . Second edition, McGraw-Hill
Book Company, New York (1970), Chapter 3
55

e*02
56
Figure
1.
Wood
sample
configuration
and
dimensions.
Actual
orientation
of
sample
in
wood
combustion
chamber
is
same
as
that
shown
here.
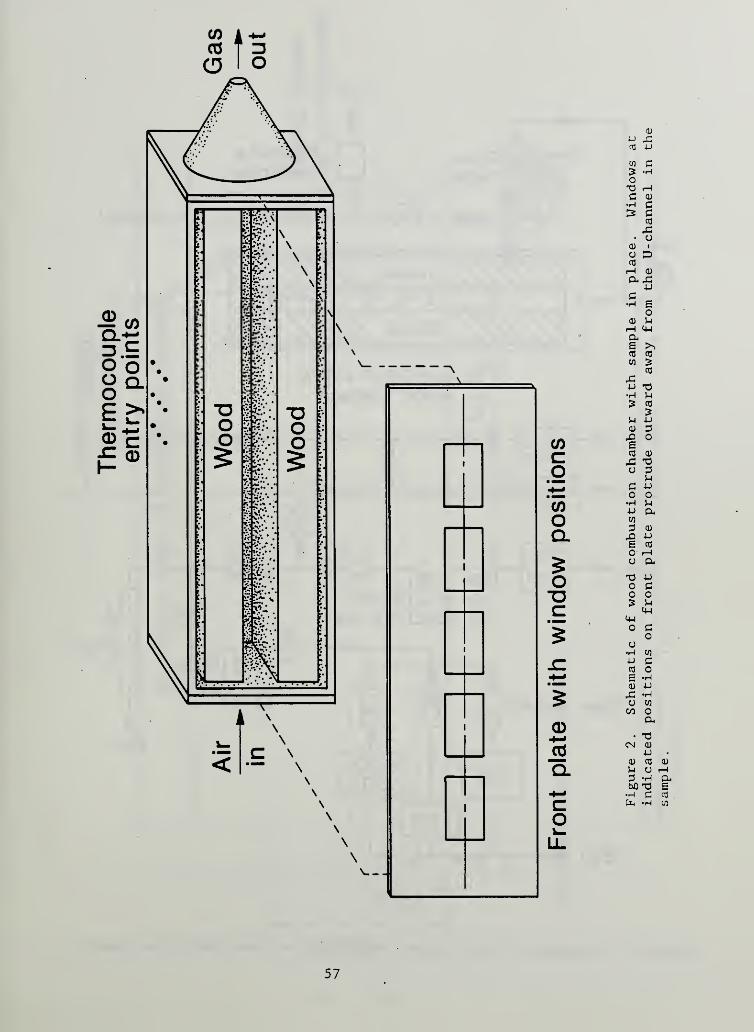
Thermocouple
entry
points
57
Figure
2.
Schematic
of
wood
combustion
chamber
with
sample
in
place.
Windows
at
indicated
positions
on
front
plate
protrude
outward
away
from
the
U-
channel
in
the
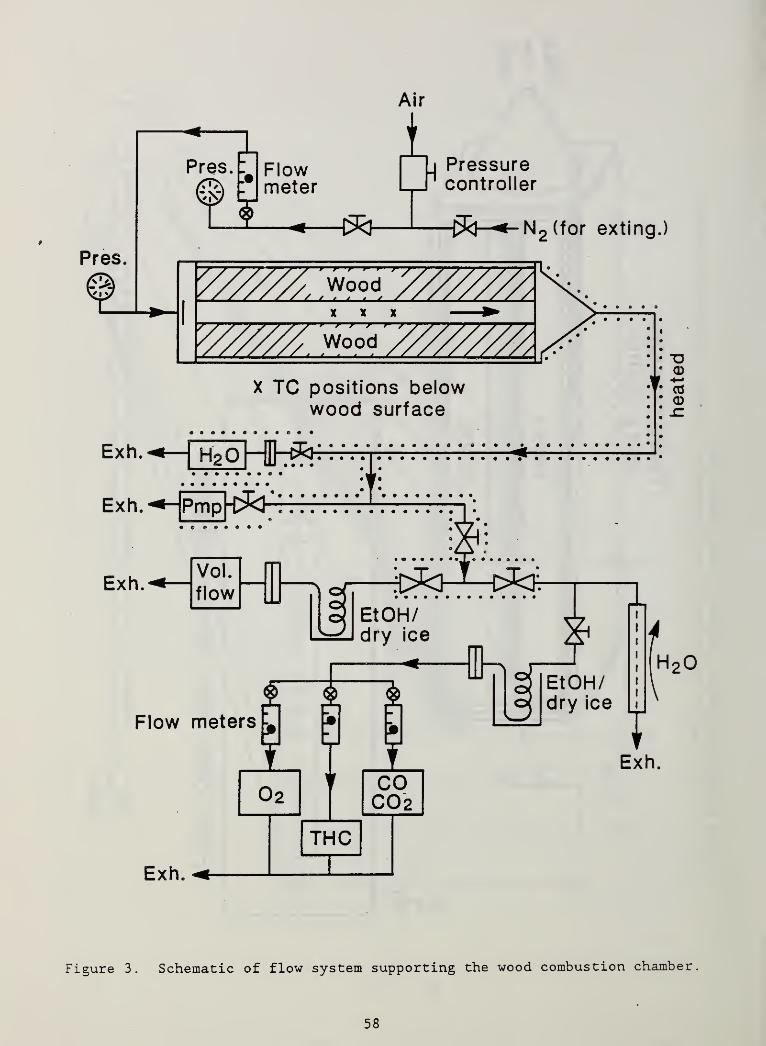
Air
Figure 3. Schematic of flow system supporting the wood combustion chamber.
58
heated

00 cc
_Q (-
OT3 I
O D
co
©
E
Ec
0)co'©
c©E"O
<
59
Figure
4.
Arangement
of
thermocouple
insertion
points
on
the
top
side
of
the
wood
combustion
chamber.
These
same
spacings
are
assumed
to
hold
at
the
actual
depth
of
the
thermocouple
junctions.

0
RIR VELOCITY (CM/SEC)5 10 15 20
RIR INFLOH RRTE (G/MIN)
Figure 5(a). Post- ignition smolder propagation rate as a function of air flow along
the U-channel for white pine. The cross-hatching indicates the approximate position
of the borders for extinction and for flaming.
60

RIR VELOCITY (CM/SEC)0 5 10 15 20
Figure 5(b). Post- ignition smolder propagation rate as a function of air flow alongthe U- channel for red oak. The line with the arrows indicates that in the two testsat or to the right of the line, flaming eventually developed.
61

0
AIR VELOCITY (CM/SEC)
RIR INFLOW RATE (G/MIN)
Figure 6. Maximum temperature on the interior surface of the U-channel as a functionof air flow for red oak and white pine.
62

AVERAGE
AIR
VELOCITY
IN
UNBURNED
CHANNEL
(cm/s)
CM CM
LHCD
O
i_n
^r
Orvj
(uiuj/ 6) 3iyy ssoi 1HDI3M 3Ddy3AA
63
AVERAGE
AIR
INELOW
RATE
(g/min)
Figure
7.
Post-
ignition
weight
loss
rate
for
unction
of
air
flow
in
the
U-channel.

o o o
LDOJ
OOJ
LD
O
LD
O
V)
\ECJ
>-
h-I—
l
uo_ju>
0-_lLu
1—
i
CE
M013NI did 6 / Q3 I J I SdD QOOM 6
*3S-i c<U CO
>O
cO
o<U
b£) T30) a>
J-l S-i
0)
> pCCO p»
oco XIco
<d S-i
o oo 4-1
S-i
a5-1 Oa) A-o co
i—!
0 co
s •rH
0)
CO
TJ •rH
0 x:o H
<u .
,c r—
H
•P cd
>4-i oo s
a)
o 5-1
•rH Stp 5-1 0CO 0) fHS-i •P 4-1
•rH
a> C 5-i
o b£> •rH
c •rH cO
a)
r"H o 4-1
cd 4-> 0>•H •P C3 c 0cr a) •H<u 3 •P
cr oP a) cC co 3a) A 4-1
P 3(0 co cO
aa a) CO
< e cO
•t—i
u (!)
CaD AJ •rH
CO a<0 as
u 4-> a>
3 -U&0 fH *rH
•rH r—< r;
(JH Cd 5
64

Q3WnSN0D2
0 6 / QBIJISbD dOOM 6
65
OJ OJ
oor\-
OOCD
Ooin
oo^r
oom
ooru
oo
o
Ld21hH
H
r/. 3wnnoA) NomsoduoD sud
66
Figure
10.
Composition
of
the
exhaust
gases
from
a
test
of
red
oak
at
13.3
cm/sec
air
velocity.

ooin
oo^r
oom
oopj
oo
opj pj
LdZi—
i
h-
o: 3wnnoA) Noiiisodwco sud
VO
<u o}-i a;
3 wbO \•H Sfa O
67
11.
Composition
of
the
exhaust
gases
from
a
test
of
white
pine
at
13.
air
velocity.

OJ OJ
oom
oo'^r
OOm
ooOJ
oo
o
U211—
1
I
—
co
(X 3WniOA) NO I 1 I SOdWOO SUD
68
Figure
12.
Composition
of
the
exhaust
gases
from
a
test
of
white
pine
at
15.
cm/sec
air
velocity.

OJ OJ
ooLD
OOr
oom
oooj
oo
o
Ld21i—
1
h-
r/. 3wnnoA) NomsodwoD sud
P CO
bO\ T3•h E Cfc o m
69
re
13.
Composition
of
the
exhaust
gases
from
a
test
of
white
pine
at
23.0
ec
air
velocity.
Flames
erupted
at
the
time
indicated
by
the
vertical
line
the
test
was
terminated.

OJ OJ
OOin
oorr
OOm
ooru
oo
o
Ldrf—
i
f-
(X 3WniOA) NO 1 1 1 SOdMOD SUD
. 70
Figure
14,
Composition
of
the
exhaust
gases
from
a
test
of
white
pine.
The
air
flow
velocity
was
cut
t
abruptly
at
the
time
indicated
by
the
vertical
line
from
22.2
to
14.4
cm/sec.
The
flow
was
cut
because
flaming
appeared
imminent.

ooin
oo"d-
Oom
OoPJ
oo
opj pj
Ld
h-
(X 3WmOA) NOIlISOdWOD SUD
71
Figure
15.
Composition
of
the
exhaust
gases
from
a
test
of
white
pine.
The
air
flow
decayed
slowly
through-out
the
post
ignition
period
from
a
starting
value
of
21.2
cm/sec
to
a
final
value
of
17.4
cm/sec.
The
decay
was
caused
by
narrowing
of
a
point
in
the
exhaust
line
due
to
charred
deposits.

ooLD
OO^r
oom
oooj
OO
o
LJ
h-
inC\J
oC\J
i_n in
(X dWHlOA ) NOIlISOdWOD SdD
72
Figure
16.
Composition
of
the
exhaust
gases
from
a
test
of
white
pine
at
an
air
flow
velocity
of
8.7
cm/sec.
The
smoldering
was
virtually
extinguished
at
the
time
the
test
was
terminated.

C\J OJ
ooLH
OO^r
OOm
oopj
o
Ld
H
(X 3WniOA) NOIlISOdNOD SLID
4-1
CO
5-1
•rH
4-4 CD
5-i X•i—l a) 4Jcd XH O3 4Jcd
• £4-> Ocd a) rH
4J 4-1
X cd
cd o 5-1
0 •1—
1
•rH
T) cd
T3 3CD •r4 CD
5-1 XCO 4J
4-1 4J
O c bO•rH 3
4-> o •HCO a, 4->
<D 4J4-> CD 3
<u ocd 5-i
x:S u X305-1 a) CO
4-1 x: T34J 3
CO O<D 4-> Oco Cd <D
cd CO
bO X5<u 3
4J 4-> •rH
to (O,
3 3 -acd S-i <D
X <D 4->
X cd
a) CO 3CD •rH
a) e EX cd 5-4
4J t—
i
CD
Cti 4J4-1
O CD
5-1
3 o <D
O <D £•r4 CO
4-1 \ CO
•H E <D
CO O T30 O0- CM CO
e • •rH
o CM P«u CM CD
4-1 bO• O 3
•Hi—t E
4-> cd
a) •rH T—
1
u o 44,
3 obO i—i O•H CD 5 ,
ptH > 4-1
5-1
Cl)
Xecd
xu o
73
resumed
within

OJ OJ
ooPs-
ooLO
ooin
ooKT
oom
oopj
oo
o
Ld
h-
(y. 3wnnoA) Nomsodnod sudW3 r-l
•H <U
^ >
74
ure
18.
Composition
of
the
exhaust
gases
from
a
test
of
red
oak
at
an
air
ocity
of
10.4
cm/sec.

o
PJ OJ
U1—
1
h-
(y. 3UniOA) NOIlISOdNOD SdDtlO r-
1
•h a)
>
75
,ure
19.
Composition
of
the
exhaust
gases
from
a
test
of
red
oak
at
an
air
ocity
of
18.7
cm/sec.
The
test
was
terminated
when
flames
erupted.
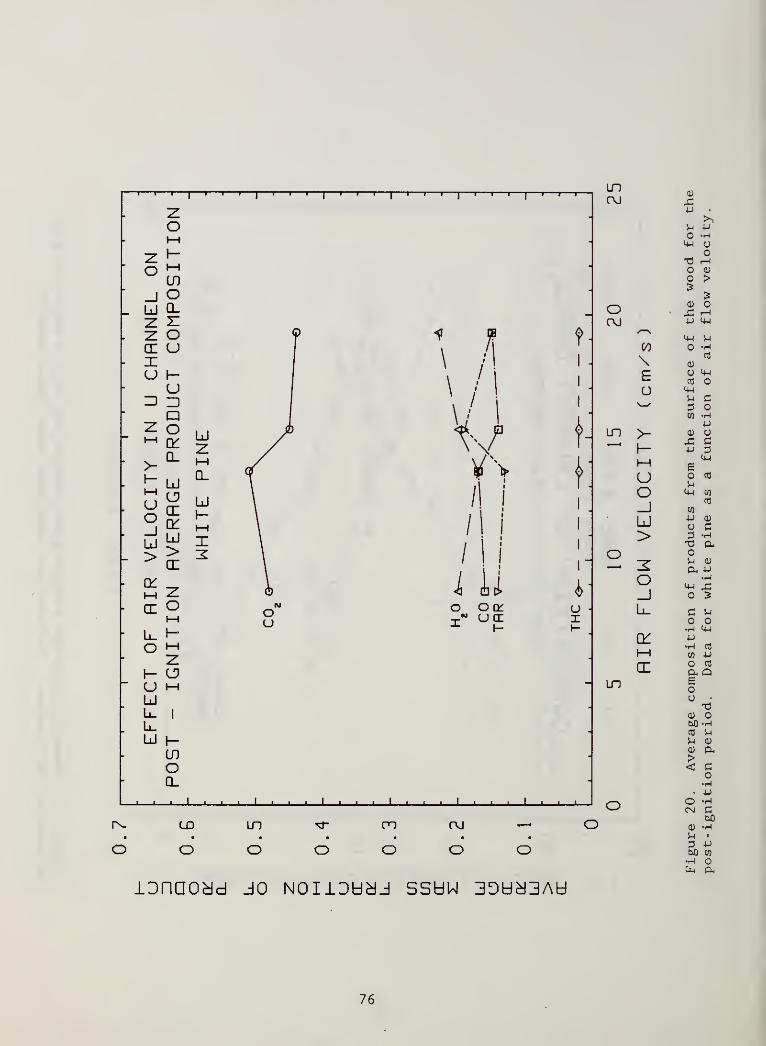
o o o o o o o
LDOJ
oOJ
in
o
in
o
V)
\Eo
>\—I—
I
uo_iu>
o_lL_
O'i—
i
c
r
lonaodd jo NoiioudJ sshw JDUdJAU
76
Figure
20.
Average
composition
of
products
from
the
surface
of
the
wood
for
the
post-
ignition
period.
Data
for
white
pine
as
a
function
of
air
flow
velocity.

• ••••••o o o o o o o
LDOJ
Orvj
LD
o
LD
o
V)
\Eu
>-
H1—
I
UO_JU>
o_lLi_
O'i—
i
CC
lDnQOdd JO NOIlOddJ SSUW JDUdJAd
77
Figure
21.
Average
composition
of
products
from
the
surface
of
the
wood
for
the
post-
ignition
period.
Data
for
red
oak
as
a
function
of
air
flow
velocity.

inpj
opj
in
in
V)
\ECJ
>h-I—
I
uo_Ju>
o_J
CKi—i
CE
woa5-i
O •
u•r^
o oo o5 r~
i
a>
TO ><D
•H4-1 o*r-\ r—
<
w 4-1
co
bO 5-1
•rd
4-1 CO
O4-1
W 0wcO cs 0
•H4J 4->
•H Oc c3 3
4-1
£o CO
5-i
4-1 MCO
W4J a)
a C3 •r-
1
aOS-i <D
a 4->
•fH
4-! fiO
T3 5-i
r-t 0a> 4-1
•fH
CO
4J
0) cO
bO QcO
5-1 •
a)
> O< •rH
u0)
P-
O O
CM GO
Q) .i-l
5-1 4J
3 •<-!
b0 C•H b0Cj-i *h
Q3i JisdD qoom jo whidD/ionaodd jo swujo
78

\Ea
>-
Hi—
i
Uo_lLd>
O_lLl.
CKI—
I
CL
o o o o o o o
QBIJISblD QOOM JO WHJD/lDnQOJd JO SWbdD
79
Figure
23.
Average
yield
of
products
from
unit
mass
of
gasified
wood
for
the
post-
ignition
period.
Data
for
red
oak
as
a
function
of
air
flow
velocity.

Wcd
<u
Wcd
<D
r—
I
0)
5-i
Pcd •
(D 0)
X P
a<4-1
oa)
<u pP *Hcd x5-j 5
CD T>ttf) ccd cd
5-i
CD X> cd
cd o
- T3t3 a;
O 5-1
u<u
CL cw
C cd
O P•i-i cd
P Q•rH
cClO .
•P• pp -1-1
w oo oCL i—
I
CD
- >
CD £p ocd iPe <p
•I—
I
P uW *Pw cd
CN
(D
p3
4-J
o
co
#ppo
b£> p•P 3(Jh 4-1
( SllbJM )
3SLJJ“l3d 1U3H JO JldJ JDdJJAU
80

CROSS-SECTIONAL PROFILES OF WOOD WITHSUPERIMPOSED ISOTHERMS
10.4 cm/s
Air flow
22.2 cm/s
Air flow
it
CD
1
Figure 25. Cross-sectional profiles of red oak at two air flow velocities withsuperimposed isotherms. Point at which maximum temperature was first reached is alsoindicated. Note also the gaps at mi'd-depth due to shrinkage of the two pieces ofwood making up the bottom of the U- channel.
81
-1/2
cm

HEAT TRANSFER TO WOOD IN FORWARD SMOLDER
Air velocity=22.2 cm/sTotal heat=48 watts
Radiation(27 watts)
Convection(20 watts)
HEAT 0.5FLUX
Wood \
-
Conduction(1.2 watts)50cm
Air velocity=10.4 cm/sTotal heat=13.6 watts
Radiation (11 watts)
HEAT 0.5FLUX
Convection(2 watts)
50cmConduction (0.6 watts)
Figure 26. Calculated profiles of three principal heat transfer modes for raisingtemperature of wood ahead of the point at which the maximum surface temperature is
achieved. Profiles are shown for two air flow velocities, superimposed on a cross-section of the base of the U-channel. The quantities in parentheses are the integralsunder the curves and they pertain to a one centimeter width of the channel periphery.
82

PREDICTED
LIFETIMES
OF
SELECTED
SPECIES
(>l) 3dniVH3dW31
co•rH
4->
cd
X3cd
cd }-i
bO
Pm 4->
CM
<U
U3
<4-4
O
co•rH
4-)
otxO C•H 3Cti 4-4
83
LOGARITHM
OF
TIME
(sec)
TO
DECAY
TO
(1/e)
OF
INITIAL
CONCENTRATION
NBS-114A (REV. 2 »ac)
U.S. DEPT. OF COMM.
BIBLIOGRAPHIC DATASHEET (See instructions)
1. PUBLICATION ORREPORT NO.
NBSIR-88/3767
2. Performing Organ. Report No. 3. Publication Date
May 1988
4. TITLE AND SUBTITLE
Products of Wood Smolder and Their Relation to Wood~Burning Stoves
5. AUTHOR(S)
Thomas J. Ohlemiller and Walter Shaub
6. PERFORMING ORGANIZATION (If joint or other than N BS, see in struction s) 7. Contract/Grant No.
NATIONAL BUREAU OF STANDARDS -
U.S. DEPARTMENT OF COMMERCEGAITHERSBURG, MD 20899
9.
SPONSORING ORGANIZATION NAME AND COMPLETE ADDRESS (Street. City. State, ZIP)
. Type of Report& Period Covered
U.S. Department of EnergyWashington, D.C. 20585
10.
SUPPLEMENTARY NOTES
| |Document describes a computer program; 5F-IB5, FIPS Software Summary* is attached.
11. ABSTRACT (A 200-word or 'tess factual summary of most significant information. If document includes a significantbi bliography or literature survey, mention it hei&)
The smoldering combustion of solid wood is a process pertinent to both fire
safety and to the generation of air pollutants in wood burning stoves. The
wood sample was in the form of a U-shaped channel 74 cm long with 6.4 cm thick
walls. Smoldering propagated in the same direction as the airflow (forward
smolder) . Tests were conducted with both red oak and white pine and both
woods behaved quite similarly. In separate tests the air flow velocity was
varied from about 9 to 22 cm/sec. At the low end of this range, the
smoldering process was prone to extinction; at the high end it was
increasingly likely to transition into flaming combustion. The smolder
velocity, peak temperature, rate of heat and product evolution all increased
over this flow range in an essentially linear manner. Analysis of the
temperature profiles in the wood pointed to a dominance of radiative transfer
in the smolder propagation process at low air flow rates and roughly equal
roles for radiation and convection at higher flow rates. The principal
species in the tar evolved from smoldering wood resemble, in large degree,
those from previous forced wood gasification experiments and those obtained
from a wood stove operated in a smoldering mode. Estimates of the kinetic
rates of destruction of several of these species by pyrolysis and by oxidation
point to a need for some additional heat source if these species are to be
destroyed by gao phas e proc e s ses —12. KEY WORDS (Six to twelve entries; alphabetical order; capitalize only proper names; and separate key words by semicolon s)
air pollution; combustion product sr ‘smoke; smoldering combustion; wood; wood stoves
13. AVAILABILITY 14. NO. OFPRINTED PAGES
(X1Unlimited
| |For Official Distribution. Do Not Release to NTIS
I 1 Order From Superintendent of Documents, U.S. Government Printing Office, Washington, D.C.
91
15. Price20402.
2fX1 Order From National Technical Information Service (NTIS), Springfield, VA. 22161 13.95