WOOD-STAVE PIPES
159
K U N G L. T E K N I S K A H O G S K O L A N S HANDLINGAR TRA NSACT IO NS O F T HC ROYAL I NSTITUTE O F TECHN OLOGY STO C K H O L M, SW E DE N Nr 3J 1950 BULL ETI N NO 2J OF THE INSTIT UTION OF HYDRAULICS UDC 627.84 626.82 621.643.26 WOOD-STAVE PIPES BY STIG REGNELL STOCKIIOLM .\lJ. HNltlK Ll.'Wl'AHL DOK.RANDEL I DiTRillUTIO
-
Upload
khangminh22 -
Category
Documents
-
view
4 -
download
0
Transcript of WOOD-STAVE PIPES

K U N G L. T E K N I S K A H O G S K O L A N S
HANDLINGAR
TRA NSACT IO NS O F T HC ROYAL I NSTITUTE O F TECHN OLOGY
ST O C K H O L M, SW E DE N
Nr 3J 1950
BULL ETI N NO 2J OF
THE I NSTIT UTION OF HYDRAULICS
UDC 627.84
626.82
621.643.26
WOOD-STAVE PIPES
B Y
STIG REGNELL
STOCKIIOLM
.\lJ. HJJNltlK Ll.'W:;l'AHLti DOK.RANDEL I Dil:iTRillUTIO!'i

Forteckning over Kungl. Tekniska Hogskolans Handlingar:
1. Liat of Publ�ation11 of Me111bt!r8 of the Staff of The Royal l-11atitul1 of
Technology, Stockholm. 270 a. 1947. Kr. 14: -. 2. NYLANDER, IfENRU.: 'och HOLST, HANEi, �Vagra 1tnder11okningar rorandr
akivor och lioga balkar av ai>mcrad bctong. 66 a. 1046. Kr. 2: -. (Meddelanden fran Institutionen for By�adsstatik).
3. NEovrus, GosTA, New 1tlethoda of Filter DBllign by �Uea118 of Frrq11rncy
Tran11formation11. 41 s. 1946. Kr. 2: -. 4. 1£ELulTRoM, NILS, On Dilltillate11 from Wood. 15 s. 1947. Kr. 1: -.5. SAWJELSSON, OLOF, Reinigung von Wasser durch Auaflockung. 15 d, 1047.
Kr. 1:-. 6. HAI.LEN, ERIK, Some Units in the Giorgi System a11d the C'. G. S. Sy«trin.
44 s. 1947. Kr. 2: 50. 7. BXCKSTRO!II, MATTS, A Peculiar Thermodynamical Analogy. 12 s. 1947.
Kr. 1:-. 8. WERTHEN, HANS, and NILSl!ON, BJORN, An Automatic Impedance .,'\feta.
95 s. 1947. Kr. 4: 50. 9. EoGWERTZ, SroGE, Theory of Elasticity for i'hin Circular Oyli11drical
Shells. 26 s. 1947. Kr. 2: -. 10. NroRDSON, FltlTHIOF I. N., Buckling of Conical Shells Subjected to Unifor114
External Lateral PresBure. 23 s. 1947. Kr. 1: 50. 11. FonssBLAD, LARS, Effects of Wind, Wave11, and Current on Floatiny
Timber. 75 s. 1947. Kr. 3: 50. 12. li,\LLEN, ERIK, Iterated Sine and CoBine Integral;,. 6 s. 1947. Kr. 1: -.13. HAI.LEN, ERIK, On Antenna Impedance11. 18 s. 1947. Kr. 2: -. 14. THAM, PERCY, Photoyrammetric Orientation Data and Determination of
their Accuracy. 38 s. 1947. Kr. 2: 50. 15. MALMQUIST, LARS, Ttmperature MeasuremtntB in High-Velocity Ga11
Streama. 54 s. 1948. Kr. 3: -. 16. BJERHAMMAR, Arum, A Method of Combined Centring and Lc.velliny for
Surveying InBtrumenta Equvpped with Optical Plumb Indicator11. 32 e.
1948. Kr. 2: -. 17. MciRTSELL, STURE, On Accuracy of Sieve Analyses Made by J1Iear,,, of
Sieving Machine11. 45 s. 1948. Kr. 3: -. 18. WEIDU,I.:L, W., Wave11 in C01npre11Bible Media. I. Basic Equations. II.
Plane Continuous Waves. 38 s. 1948. Kr. 3: -. 19. M,u.111Low, G., Thermal Ageing Proptrtie11 of Celluloae Inaulatfog Mawri.au.
67 s. 1948. Kr. 3: -. 20. JOHANSSON, C. H., Theoretical Invutigation of the Effect of apilla1·y
Suction on Trana/er of Moillture in Hygroscopic Matcriala. 16 s. 1948. Kr. 2:-.
21. HELLSTROM, NILS, On Distillates from Fir Stumpa. Part I. Fir Tar and Oils from Fir Tar. Part II. Neutra.l Substances Present in Fir Tar and Oils from Fir Tar. 54 s. 1948. Kr. 3: 50.
22. ALFVEN, H., LINDBERG, L., MALMl'oRS, K. G., WALLMARK, T., andAsTROM, E., Theory and Applicationa of TrochotroM. 106 s. 1948. Kr. 6:-.
Foru. Ii om,l. J.rlfB ,wa.

K U N G L. T E K N I S K A H O G S K O L A N S
HANDLIN GAR
TRANSACT I O NS O F T H E ROYAL INST I T U TE O F TEC HN OLOOY
STO CKH OLM, SWEDEN
Nr 33
BULLETIN NO 23 OF
THE INSTITU TION OF HYDRAUL ICS
1950
UDC 627.84
626.82
621.643.26
WOOD-STAVE PIPES
BY
STIG REGNELL
Gl)TEBORG 1950
ELANDERS BOKTRYCKERI AKTIEBOLAG

Acknowledgements
This treatise is based on the thesis for the degree of >>teknologie
licentiat>>, i. e. Lie. Eng. submitted by the Author to the Royal Institute of Technology, Stockholm, in February, 1947.
Many valuable contributions to the public discussion of the thesis have been made by Professor B. HELLSTROM, Professor F. 0DQVIST, and �Ir. E. BLOMQVIST. Moreover, Professor HELLSTROM has helped the Author to draw up the programme of this investigation, and has followed its execution from beginning to end. Mr. K. J. SuNDQVIST has checked some of the mathematical calculations. The companies
mentioned in this treatise have kindly assisted the Author in carrying out the necessary measurements, and have furnished useful information. The Author wishes to express his gratitude to all those who have aided him.
Finally, the Author wishes to acknowledge his indebtedness to the Royal Academy of Engineering Sciences, the Royal Institute of
Technology, and the Boxholms AB for financial support.

I. Preface
·wood pipes have probably been employed for conveying waterfrom time immemorial, but they seem not to have been put to any
important uses until the rise of large cities. The water supply system in London is the most renowned installation of this kind. The deve
lopment of this system began on a small scale as early as in the 13th
century, and at that time the pipes were made of lead. In the 17th century, pipes made of hollow trunks of trees began to come into use, and after that the water supply system gradually increased to a
considerable size. For a period of time, one of the private water supply companies in London, the New River Company, operated wood pipe water mains exceeding 640 km in total length, see Fig. 1.
Fig. 1. An old wuter main in London. The construction of these mains was begun in the 17th century. The pipes were made of bored tree trunks. Several pipes were connected in purullel in order to increase the currying capacity of the main. (Reproduced . from u publication of the Metropolitan Water Board entitled •The ,v ater
Supply of Londom (67).)

6
Fig. 2. Boring of pine trunk pipes for water mains in Sweden, Province of Viistergotland, in 1945. The same method of manufacture was used as early as at the beginning of the 19th century, when wood pipes of this type were common in this part of the country. (This photograph has been published in the Viistra Sveriges
Lantmannatidning).
In Sweden, the most famous installation of this type was the water supply system in Gothenburg (30). A water main between Kalleback
and Gothenburg was built of wood in 1787, and was inaugurated by King Gustaf III. Towards the end of the 1860ies, the Gotenburg water supply system had been developed to an extent that it fed 15 public hydrants and 15 service mains connected to private estates. It is surprising that this old type of wood pipes should have continued to exist in our time. In Germany, where the first recorded use of bored trunks of trees as pi,pes dates back to the 13th century, the old methods were put in practice again during the Second World
War (5). The reason was presumably a shortage of cast iron pipes. In Sweden, too, bored wood pipes are still manufactured, although, of course, on a small scale and frequently for special purposes, e.g. for conveying acids in the wood pulp industry. Fig. 2 shows .that
primitive tools are employed in the manufacture of these pipes.

Fig. 3 a.
7
Fig. 3b.
Fig. 3. Wood-stave pipe carried on concrete cradles. a. General arrangement. b. Pipe at Rydo. Diameter 2. 5 m. Distance between
supports 3. 3 m.
Nowadays, owing to the requirements in respect of higher resistance to the internal water pressure, and in view of the need for greater
carrying capacity, i. e. larger diameters, this old type of wood pipe has been almost completely superseded by wood-stave pipes1} which began to come into use in some North-American towns in the 1880ies2}.
As early as in 1910, wood-stave pipe systems were used in Denver,
1) A wood-stave pipe is made up of separate staves which are held together by
steel bands so as to form a circular pipe. 1) It is reported that a wood-stave pipe has been constructed in Finland by the
Tervakoski Company in 1860 (88).

8
Fig. 4 a.
Fig. 4 b.
Fig. 4. Wood-stave pipe provided with ring stiffeners at the supports. a. General arrangement. b. Pipe at Lindesniis. This pipe was construc�ed inHl21, and was at that time the first pipe with ringstiffeners. Diameter 1. i m. Distance bet" een supports4. O m. Ring stiffeners made of 40 X 80 >< Ci mm steelangles at each supports. Supports made of natural stone.
Colo., and in Tacoma, "\¥ash., totalling more than 160 km and 60 km respectively. Since that time, development has made rapid strides, and wood-stave pipes are now employed for various uses. In sanitary water engineering, use is mostly made of machine-banded pipes of relatively small diameter, whereas the wood-stave pipes used in water power engineering are armoured with special steel bands, and are made in diameters of up to 5 m.
Although wood-stave pipes have been built and generally used for so many years, their operating characteristics have long been unascertained in several important respects. Furthermore, in spite of
the fact that numerous methods of design have been suggested, it has not been possible to draw up reliable rules for designing wood-

Fig. 5n.
9
Fig. 5b.
Fig. 5. ·wood-stave pipe carried on a bed of broken stone. a. General arrangement. b. Two pipes at the Sikfors Hydro.Electric Station, which have been in operation 30 years. Diameter 3.2 m.
Cf. Fig. 13.
stave pipes so as to take into account the moments and the forces due to swelling of the wood.
In order to collect experience regarding the operating characteristics of wood-stave pipes, the Swedish Water Power Association has
circulated a questionnaire to most users of these pipes in Sweden in the autumn of 1941. The answers to this questionnaire have supplied a good deal of valuable information on decay and freezing of wood
stave pipes. The results of this investigation have recently been
published (78). The design of wood-stave pipes should take into account the
mechanical strength, the operating conditions, and the economic factors. The strength calculations include the general design of the

10
pipe, in which distinction is made between pipes carried on supports and pipes laid on beds (see Figs. 3 to 5), and the design of some individual components, such as bands, shoes, staves, etc. With respect to operating conditions, the design takes into consideration such factors as decay of wood, freezing, loss of head, etc. Finally, with respect to economic factors, the design comprises the determination of the most economic diameter and construction of the pipe.
All these factors are dealt with to some extent in this paper, but special attention is given to strength. In the last chapter, a description is given of the various types of wood-stave pipes used in Sweden at the present time.

II. Stren�th
A. Introduction
A wood-stave pipe shall be designed so as to afford adequate safety against failure on account of the loads and forcee to which it is submitted.
The stresses due to the internal pressure above atmospheric are independent of the method of support of the pipe, whereas the stresses due to the weigh�s of the pipe shell and the water vary according to whether the pipe is carried on supports or on a bed. The stresses due to the weights are of importance in comparison with the stresses caused by the internal pressure in those cases where the internal pressure is small in relation to the diameter of the pipe, and in those cases where the diameter of the pipe is large. Consequently, according to the well-known model law, if a given pipe were linearly enlarged in all parts in a given ratio, the stresses at homologous points would increase in the same ratio, i.e. the enlargement factor. Generally, however, the thickness of the pipe wall does not increase in proportion to the enlargement factor, and remains relatively small when the diameter of the pipe is large.
In normal cases, wood-stave pipes are carried on supports. This applies to 90 per cent of the wood-stave pipes used in Sweden. When the diameter of the pipe is very large, it is difficult to design the supports so that they should be satisfactory from an economic point of view, since the distance between the supports must be relatively small in order that the stresses and deformations should not become too great. For this reason, large pipes are often supported on beddings which are usually made of gravel or coarse broken stone reaching to half the height of the pipe. Since embedded pipes are supported continuously, the stress problem is reduced to a plane at right angles to the longitudinal axis of the pipe. In this case, the moment acting on the wall and the deformation ( distorting the cross section of the pipe from a circle into an oval) are of importance in the design of the pipe.

12
Compressive stresses in the staves are caused by tightening of the bands and by swelling of the wood. In some cases, where the bands are weak and the thickness of the staves is great, the force due to swelling of the wood can become predominant in comparison with the other forces. The external forces due to the reactions at the supports must also be taken into account.
This chapter deals with the general design of pipes carried on supports and embedded pipes, and with the design of some of their components. The stresses due to swelling of the wood have been made the subject of a special investigation (see p. 47). Since the
stresses in embedded pipes are most difficult to find by calculation, these stresses have been determined by theoretical calculations and by measurements made on four pipes which are among the largest used in Sweden.
B. Loads and Forces
A wood-stave pipe is acted upon by the following forces:
1. Internal pressure above atmospheric due to the liquid flowing in thepipe. This pressure is taken to be equal to the pressure of theliquid at the crown of the pipe (if the surface of the liquid is on alevel with the crown of the pipe, i. e. if there is no head over thepipe, the internal pressure exerted on the pipe is zero).
2. External pressure due to reactions at the supports and to the loadcaused by the earth covering the pipe.
3. Forces due to weights.
a. Weight of the liquid.b. Weight of the pipe shell.
4. Comvressive stresses in the staves.
The internal vressure causes only normal forces in the wall of the pipe, and these forces are taken by the bands.
The stresses due to the external pressure are dependent on the method of support. When the pipes are covered with earth, these
stresses are dependent on the properties of the covering material and on the method of bedding.
The weights cause stresses in the pipe, which are difficult to calculate. The effect of the weight of the pipe shell is relatively insignificant in comparison with the effect of the weight of the liquid. For embedded

13
pipes, according to FEDERHOFER (21), the ratio of the moments in the wall of the pipe due to the weight of the wall and the weight of
2G the liquid is - For an ordinary wood-stave pipe, this ratio
yr
does not exceed I to 10, and the weight of the pipe may therefore generally be disregarded. The stresses due to the weight of the liquid vary according to whether the pipe is carried on supports or embedded,
and are of great importance in the design. A special type of stresses due to the weight of the liquid is produced when the pipe is not
completely filled. The comvressive stresses in the staves are caused by tightening of
the bands and by swelling of the wood. In an embedded pipe, no moments occur in the vertical plane
passing through the longitudinal axis of the pipe, and it is therefore only the moments in the plane at right angles to this axis that are to be considered.
C. General
1. Normal Forces
The normal forces acting in the transverse plane are taken by the
steel bands. The internal pressure gives rise to the normal force + y Hr. The compressive stress in the staves produces the normal
force + pd. These normal forces are independent of whether thepipe is carried on supports or embedded, and are equal at all pointson the circumference of the pipe.
The weights of the liquid and the pipe shell cause normal forces which are dependent on whether the pipe is carried on supports or embedded, and which are not equal at different points on the circumference of the pipe. The effect of the weight of the pipe shell is insignificant, and can generally be disregarded.
2. Moments
The moments which occur in I:}, wood-stave pipe act either in the vertical plane passing through the longitudinal axis of the tube or in a plane at right angles to this axis.
If the pipe is carried on supports, both these moments are of importance. The moments acting in the transverse plane can be

14
eliminated by using an appropriate method of support, cradles or ring stiffeners. In that case, the supports must be designed for this
purpose.
D. Wood-Stave Pipes Carried on Supports
1. Introduction
The design of pipes carried on supports had been dealt with by
several authors on the assumption that the wall of the pipe is homo
geneous and that its deformations are elastic. As early as in 1880,
BACH (2) deduced some formulae for calculating the stresses in a
thick-walled pipe acting in a plane at right angles to the longitudinal
axis of the pipe. These formulae seem to be mostly applicable to
concrete pipes. The stresses occurring .in thin-walled pipes under
various conditions of loading have been dealt with by FoRCHHEIMER
(23) and by FROHLICH (28). Subsequently, KARLSSON (46, 47) evolved
a method of carrying the pipes by means of ring s·biffeners fitted at
each support. This method was based on the theories advanced by
FROHLICH. According to HoKERBERG (44), the moments acting on
these ring stiffeners ·can be reduced if the stiffeners are supported at
two points which are located slightly outside the pip� shell instead
of being situated right at the shell. The calculation of stresses in
the vertical plane passing through the longitudinal axis of the pipe
seems to have been of little interest. However, THOMA (93) has
deduced a relatively simply formula for computing these stresses
on the assumption that the pipe is homogeneous. When the internal
water pressure in the pipe becomes so low that the water level sinks
below the crown of the pipe, we are confronted with an intricate
stress problem. The solution of this problem has been dealt with
from a mathematical point of view by WESTERBERG (96), SAMSIOE
(81), ANzELIUS and FAXEN (1).
Strictly speaking, most of the methods of design mentioned in the
introduction to this section are applicable only to pipes having
homogeneous walls, e.g. iron or concrete pipes. A wood-stave pipe
cannot be regarded as homogeneous, and hence we revert to the old
question of whether the separate staves can transmit shearing forces by friction. As long as the staves do not move in relation to one
another, the pipe shell can be considered to be homogeneous in the
calculation of stresses. On this assumption, the load-carrying capacity

15
of the pipe is determined by the maximum shearing stress. The wall of the pipe is generally so thin that it is assumed not to be able to withstand any moments, and the stresses can be calculated from THOMA's formula (93). This method of stress calculation will be· referred to as the >>membrane method>> in what follows.
When the force due to friction between the staves is exceeded, the weight of the pipe must be carried jointly by the separate staves.1)On some occasions, the ability of the staves to take care of shearing stresses seems to be momentarily eliminated. This is proved by the fact that water is sometimes ejected from the joints between the staves when the pipe is subjected to water hammer. On such occasions, the pipe acts as a regular pile of staves. The method of stress calculation described in what follows, which is based on this assumption, will be termed the >>stave pile method>>.
2. Membrane Method
If the pipe is continuously supported at several points, and is provided with cradles or ring stiffeners at the supports, we obtain the following normal forces and stresses by means of the membrane method.
I. Weight of Water.
N <p = y r2 ( l + cos rp)
y (L2 ) Oz = 2 d 12 - z2 cos rp
2. Weight of Pipe Shell.
N <p = Gr cos rp
Oz = !!__ (L2 - z2) cos rprd 12
2Gz = -
d-sinrp
(1)
(2)
(3)
(4)
(5)
(6)
In the above formulae, Oz denotes the tensile stress in the wood staves in a direction parallel to the longitudinal axis of the pipe.
1) See SAMSIOE (80).

16
The most heavily stressed cross section is located at a support where the moment reaches a maximum. This value is approximate since Poisson's ratio has been put equal to zero.
As the shearing stress cannot exceed that value which corresponds to the stress due to friction between two adjacent staves, this stress determines the choice of the thickness of staves and the distance between the supports.
It follows from Eqs. (3) and (6) that the maximum shearing stress occurs at the supports, and is given by
yrL(
2G) r = --- 1+-
111 2 d yr (7)
I£ f is the coefficient of friction between two staves moving in parallel to the wood fibres, and if p is the compressive stress in the �urface of contact between staves, then we have 1:
111 = fp. If we
2 G •
neglect the weight of the pipe shell expressed by the term --, we yr obtain the maximum distance between the supports
2df Lin
= - - Pyr (8)
At a low estimate, the coefficient of friction may be taken to be 1/4, and the maximum distance between the supports is
dp L =--
m 2 yr (9)
The compressive stress in the surface of contact between the staves can be caused by the force due to tightening of the bands or by the force due to swelling of the wood, or by the simultaneous action of both these forces. As will be shown on p. 47, the force due to swelling of the wood can be about 10 kg per cm2
• However, stress measurements indicate that the swelling force in an old wood-stave pipe is very small. The maximum distances between the supports given in Table 1 and Fig. 6 for various values of the diameter of pipe and the thickness of staves have been calculated from the above formula on the, assumption that the swelling force is 10 kg per cm2
•

17
TABLE 1. 11'Iaximum Distance between Supports, in m for Pipes l'arying in Dia
meter and in Thickness of Staves. 111:embra.ne :Method.
The maximum distance has been calculated on the assumption that it is determined
by the maximum shearing stress. No safety factor is included in the values of the
maximum distance given in this table.
Diameter of Pipe l\foximum Distance between Pipe Supports, in m
Thickness of Staves, in mm
m 50 I 75 I 100
1 5.0 7.5 -2 " .
-·.> 3.8 5.o
3 1. i 2.5 3.:l
4 - l.O " --·n
fi I - - 2.u
3. Stave Pile Method
The stave pile method is based on the following assumptions. The pipe is supposed to be continuously supported at several points and to be provided with cradles or ring stiffeners at the supports. Furthermore, it is assumed that the staves can transmit only normal forces, but no frictional forces. Finally, it is assumed that the pipe is distorted in a vertical plane only, and that the deflections of all staves in the same vertical cross section are equal. In other words, this means that the cross section of the pipe remains unchanged during deformation. Then the maximum stress in the separate staves will occur in those staves which stand on their edge, i.e. in the staves forming the sides of the pipe. According to the detailed calculations given in Appendix A, we obtain I. Weight of Water.
a
( b2 + 2 d2 ) = y r2 I + b2 + d2 cos <p
yr L2 1
= -2 b d . cl2
3yrL
4 cl
1 + b2
1
(10)
(11)
(12)

18
2. Weight of Pipe Shell.b2 - cl2
N rp = G r b2 + d2 cos <p
a
r,
GL2 1 =bd·-d2
1 + b2
3 GL 1 ----•----
Spocm9 of Supporls m
8 \\
\ \ \\\ .
7
l I
' I 2 n I ' 3,1
\\ \ \ 1l5 6
\' �\
"31
:\.J J
\ ,r \ 'i I '2, \ ,,
5
' I � \ �II.I \
2.2 " \ ........ I',..."
4
� \
;� ... 3'
\ ......... '
r,,... -....', ', 3
' � r::,....
........
', 2
' ' ----
0 0 ! 2 J 4
� ,<?• .... _ 3;;-.... _ ?.:
:2 � -I-I
Ii
� -... 4�7' 51 -
13�6'
--2l<S'
-
5 6 m
/nlemol Diameter
(13)
(14)
(15)
Fig. 6. Variation in spacing of supports with internal diameter, thickness of staves, and width of staves for wood-stave pipes carried on cradles or in ring stiifem,rs. The full.line curves refer to the distance between the supports calculated from the formula suggested in this paper (stave pile method), This formula results in a factor of safety of about 3. The dash-line curves refer to the maximum distance between the supports computed by means of the membrane method. No factor of safety is
included. Furthermore, the diagram shows empirical values taken from Table 3. The values represented by dots refer· to those pipes which have proved to be fully satisfactory in operation. The values represented by crosses refer to those pipes which had to be reinforced, or which have been heavily deformed. The figures at each dot or cross
indicate the thickness of staves in inches a.ft.er planing.

10 If we neglect the effect of the weight of the pipe shell, we candeduce from Eq. (11) a relatively simple expression for the maximumallowable distance between the supports
. L = v4 ab d ( !!___) s y D I+ b2 (16)
For a pipe filled with water, if we insert the maximum allowabletensile stress in bending of 60 kg per cm2, we obtain
L = 100 v24bcdc( d;) c D 1 + b2
C C
where all lengths are expressed in centimetres. (17)
The weight of the pipe shell can approximately be taken intoaccount by assuming that De
denotes the external diameter of the. pipe. It is seen from this formula that the maximum distance betweenthe supports is also dependent on the width of staves. On the assumption that the width of staves is normal,1) this formula gives thedistances between the supports represented in Table 2 and Fig. 6. TABLE 2. .Maximum Distance between Supports, in m for Pipes Varying in Dia
meter and in Thickness of Staves. Stave Pile Method.
This table is applicable to the widths of staves normally used in practice on the assumption that the maximum distance between the supports is determined by the tensile stress in bending in the staves. This stress has been taken to be 600 tons per m•. This value corresponds in round numbers to a safety factor of 3 referred to the ultimate strength.
Diameter of Pipe l\Iaxinium Distance between Pipe Supports, in m
Thickn_ess of Staves, in mm m iiO I 75 I 100
I I 1 4.3 5.0 -
2 3.0 4.2 5.4
3 2.a 3.4 4.4
4 - 3.o 3.8
5 I - - 3.4
l) Normal relations between the thickness and the width of staves are e. g.2 in. X 5 in., 3 in. X 6 in., and 4 in. X 7 in.

TABLE 3. Some Swedish Wood-Stave Pipes Carried on Cradles, Which Hewe Been Distorted into Oval Shape or Had to Be Reinforcecl
by �Mea11,Y of Intermediate Snp71orls, a11d Pipes Having Umtfually Large Distance between Supports. Comparison of Calculated ancl Actual Distances between Supports.
gNo. Locality
2
3 4 5 6
7
s
!)
IO 11 12
13
14
15 IO 17 18
IKnon Gideabrnk
Nain .. Ludvika . Semla Billsta II
Fagelfors
Loforsen. Flogfors . G ammelkroppa Hamrange . Billsta I ..
Svartestrom
Gopo. .. · ·
Strommen .. K varnedsforsen . Gisslefors Nilrsido.n . .
Thickness of Staves
mm
75
8!)
7:5
100
80
75
75
75
75
62
(i(j
61:i
71:i
7.)
iiO
50
7:5
50
I
Diameter of Pipe
1n
3.2
3.0
3.o3.0 3.0 2.s
2.4
2.3
2.0 2.0
l.8l.S
l.S
l.ll
l.2 l.2 0.0
0.0
I II
Actunl Distance
1 Distance between Supports I I Calculated by Means of
Stave Pile I Membrane l\lcthod Method
between Supports
m_l m m
4.4
3. 7
.;,o 3.0 6.o
4.r,
5.0
3.0 l:i.1 5.0 4.0 4.5
6.0
4.S
6.o
5.0 8.0
6.0
3.3
4.0
3.4
4.-l 3.;. 3.r,
3.S
3.0 4.2 3.u 3.4
4.0
4.4
4.;
3.0 3.0 6.3 4.5
2.4
2.1'
2.;;
3.4
2.7
') --· ·
3.1
3.3
3.8
3.1 3.1 3.o
4.2
4.;
4.2 4.2
I
8,3 5,0
Remarks
Provided with intermediate supports. Pipe demolished in l!l4 i.
Pipe distorted into oval shape. Provided with intermediate sup
ports. Provided with intermediate sup
ports.
Pipe distorted into oval shape.
Provided with intermediate supports.
Probably provided with intermediate supports.
Provided with ndditional steel bands.
I
l-.:1 0

21
4. Summary
On condition that friction between the staves is not eliminated,
and that the compressive stress in the surface of contact between
the staves is sufficiently high, the use of the membrane method may be considered justifiable. As has been pointed out in the above, the frictional force can be eliminated on account of water hammer.
Some investigations, which will be described further on, show that the compressive stress (the stress due to swelling of the wood) diminishes
in course of time, and can decrease to 2 or -3 kg per cm2 in 30 years old pipes. Consequently, the membrane method is not generally appli
cable, and the stave pile method is therefore to be recommended for the design of pipes carried on supports.
Both these methods of calculation have been applied to some wood-stave pipes existing in Sweden. Table 3 and Fig. 6 give the characteristics of some Swedish pipes carried on supports whose spacing is unusually large in comparison with the distances in general use.
It is seen that some of these pipes have been distorted in some way or other. In particular, the deformations have occurred in pipes exceed
ing 1.8 m in diameter, where the distance between the supports is 15 to 70 per cent greater than that calculated by means of the stave pile method and 25 to 100 per cent greater than that computed by
means of the membrane method. For pipes less than I. s m. in diameter, the actual distances between the supports did not exceed those calculated by means of these two methods by more than 50 and 40 per cent respectively. No drawbacks due to this large spacing of the supports have been reported.1) It seems that the stave pile method can be applied to pipes of any ordinary size, but when the diameter of the pipe is large, the safety factor obtained by means of this method may perhaps be inadequate with respect to deforma
tions. On the other hand, the membrane method, when applied to
large pipes, gives a distance between the supports which is smaller than the spacing of supports generally used for such pipes. The
Norwegian rules for wood-stave pipes give a formula for computing the distance between the supports, which is stated to be completely empirical. The distance between the supports calculated from this
1) This circumstance may possibly indicate that the use of the membrane method
is to a certain extent justifiable when the diameter of the pipe is small.
22
formula1) is slightly smaller than that obtained by means of the stave pile method, but the structure of these two formulae is fundamentally similar. Therefore, Norwegian experience also seems to confirm the correctness of the stave pile method.
Since the greatest stresses occur in the staves standing on the narrow edge, it is necessary to make sure that these staves, in particular, are of high quality and that they are as long as possible. The joints between the staves on the sides of the pipe should be locaj;ed at those points where they are subjected to the smallest moment, that is to say at a distance of about 0.2 L from the supports.
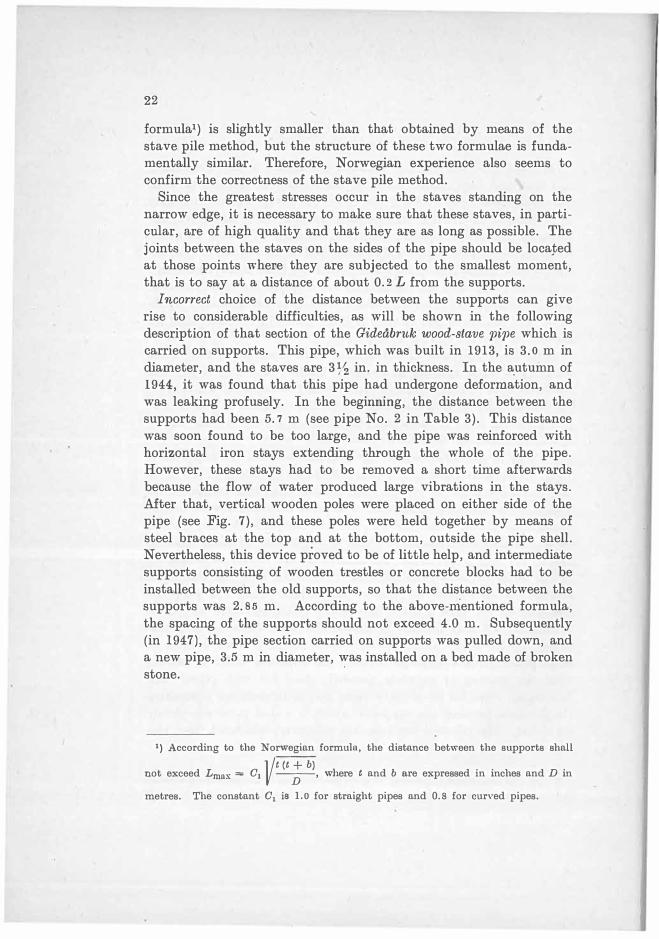
Incorrect choice of the distance between the supports can give rise to considerable difficulties, as will be shown in the following description of that section of the Gideabruk wood-stave pipe which is carried on supports. This pipe, which was built in 1913, is 3.0 m in diameter, and the staves are 3� in. in thickness. In the 8'.utumn of 1944:, it was found that this pipe had undergone deformation, and was leaking profusely. In the beginning, the distance between the supports had been 5. 7 m (see pipe No. 2 in Table 3). This distance was soon found to be too large, and the pipe was reinforced with horizontal iron stays extending through the whole of the pipe. However, these stays had to be removed a short time afterwards because the flow of water produced large vibrations in the stays. After that, vertical wooden poles were placed on either side of the pipe (see Fig. 7), and these poles were held together by means of steel braces at the top and at the bottom, outside the pipe shell. Nevertheless, this device proved to be of little help, and intermediate supports consisting of wooden trestles or concrete blocks had to be installed between the old supports, so that the distance between the supports was 2. 85 m. According to the above-mentioned formula, the spacing of the supports should not exceed 4.0 m. Subsequently (in 1947), the pipe section carried on supports was pulled down, and a new pipe, 3.5 m in diameter, was installed on a bed made of broken stone.
1) According to the Norwegian formula, the distance between the supports shallVt (t + b) not exceed Lmnx = 01 --D-, where t and b are expressed in inches and D in
metres. The constant 01 is l.O for straight pipes and 0.8 for curved pipes.

23
Fig. 7. Wood-stove pipe o.t the Gideabruk Hydro-Electric Station. As the distance between the supports was found to be too great, the pipe had to be reinforced, first by means of struts between the supports, and then by means of wooden poles placed in pairs on either side of the pipe and held together by means of steel braces at the top and at the bottom. The distance between the supports was originally 5. 7 m. The diameter of the pipe is 3 m. In 194 7, the section of the pipe curried on supports was pulled down, and was replaced by a new pipe
lo.id on 0, bed made of broken stone.
5. Moments Acting on Ring Stiffeners
At the present time, the supports used for wood-stave pipes consist
either of cradles or of ring stiffeners. Cradles are generally designed
so as to ensure adequate strength, particularly if they are made of
concrete, and the pipe retains its original circular shape. It is very
important to provide a sufficiently large surface of contact between
the cradle and the pipe, so that the reactions at the supports are
distributed over a large area, otherwise the wall of the pipe is liable
to be caved in and distorted. For pipes from 0. 5 to 3 m in diameter,
the Norwegian rules (71) recommend that the arc of contact between
the pipe and the support should not be less than 42 to 4 7 per cent
of the circumference.
The use of ring stiffeners for supporting wood-stave pipes has
been suggested by KARLSSON. For the first time, this method of
support was employed for the wood-stave pipe at Lindesnas (see

Fig. 4 b). According to KARLSSON (46, 47), the design of the ringstiffeners is based on the moment M
1 = 0.0I5PR (18)
Later, HOKERBERG ( 44) has shown that, if the points of support aremoved outward a distance of 0. 04 R, the moment is reduced to M
2 = o.010PR (19)These moments have been calculated on the assumption that thepipe acts as a homogeneous shell. The stave pile method givesslightly different values of the moments. The latter moments areprobably smaller, and the use of the formulae given in the aboveaffords additional safety. In general, however, the design of the pipe is not determined bythe moments because the width of the supporting ring must berelatively large in order to reduce the pressure exerted on the woodstaves to an allowable value.
6. Conclusions Regarding Wood-Stave Pipes Carried on Supports
It follows from the above that the steel bands for wood-stavepipes should be designed, so as to withstand the maximum normalforce acting at the bottom of the pipe (tp = 0) ( d2) b2-£l2
N0 = y Hr+ 1) d + 2 + b2 + d2 y r2 + b2 + d2 Gr (20)The distance between the supports should not exceed the valuegiven below
(16)Eq. (16) corresponds to a safety factor of about 3 referred to theultimate tensile strength in bending of the most heavily stressedstave. If the pipe is carried on cradles, the surface of contact betweenthe pipe and the cradle should be sufficiently large. If the pipeis carried in ring stiffeners, these rings should be designed so as towithstand the moments given by Eqs. (18) and (19).

E. Embedded Wood-Stave Pipes
I. Introduction
Large wood-stave pipes carried on supports are often subjected to
considerable stresses. In order to reduce the stresses, such pipes are
laid on continuous beds, usually made of stone, which reach to half
the height of the pipe. Since embedded pipes are supported conti
nuously, the moments and the normal forces can only occur in a
plane at right angles to the longitudinal axis of the pipe. If the
diameter of the pipe is small and the water pressure is high, the
design of an embedded wood-stave pipe is relatively simple since,
practically speaking, the wall of the pipe is submitted to normal forces alone. On the other hand, if the diameter of the pipe is large
and the water pressure is low, the design presents far more intricate
problems. The fundamental design formulae have been deduced by
BoussINESQ and FoRCHHEIMER (24).
2. FORCHHEIMER's Method of Design
The differential equation of a ring deduced by Boussr�ESQ is
d2 17 r2 M 11+-=--cl rp2 EI
(21)
Taking this equation as a starting-point, FoRCHHEIMER has cal
culated the forces and the moments acting on the ring, for various
Fig. 8. Soil reaction and moment distribution in an embedded pipe determined by FonCHHEIMER on the assumption that the pipe is filled with water, but is not
subjected to any internal pressure.

26
methods of support, on the assumption that the pipe is filled with water, but is not subjected to any internal pressure above atmospheric. The weight of the pipe shell has been neglected. The most interesting case is the pipe embedded in earth to half its height (see Fig. 8). In this case, FoRCHHEIMER has supposed that the soil reaction is directed at right angles to the surface of the pipe, and varies according to a cos cp law from a maximum value right under the pipe t.o zero at the surface of the ground. On this assumption, the external forces are symmetrical with respect to both the vertical axis and the horizontal axis passing through the centre of the pipe, and the mathematical treatment of this problem is relatively simple. Using the notations given in Fig. 8, we obtain the moment at the point cp,
-y rl
( 4
)1) J.Jtl
rp =
2 -;;- <p sin <p - cos <p ,
and for the characteristic points
M,,. = -0.137 yr3
.Llf 7r/2 =+0.149yr3
Mo =-0.137yr3
N" 0.500 y r2
N,,.,2 - 0.215 y r2
No - 0.500 y r2
3. SAMSIOE's Method of Design
(22)
(23)
(24)
(25)
(26)
(27)
FoRCHHEThrnR's method of design has been criticised by SAMSIOE (79) who has demonstrated that the pipe undergoes a considerabledeformation resulting in an elongation of its horizontal diameter.Consequently, the soil reaction increases in the neighbourhood ofthe surface of the ground, with the result that the moments becomesmaller. Therefore, SAMSIOE considers that the distribution of thesoil reaction in proportion to V cos cp corresponds more closely to the actual conditions (see Fig. 9). On this assumption, SAMSIOE calculates the moments and the normal forces as follows.
1) The moment is reckoned as positive if it tends to reduce the radius of curvature.

27
M,. =-0.1 03yr3 (28)
M,.12 = + 0. 103 yr3 (29)
N,. - 0.4 17yr2 (30)
Nrr12 - 0.2 15 y-r2 (31)
The action of the external forces produces a greater or smaller deformation of the pipe, and the moments are therefore reduced. The deformation of the pipe is expressed by the coefficient of distor-
Dh - D tion e = D v_ For the value of e = 0.12, which corresponds
e.g. to a deflection of 18 cm at the crown of a pipe 3 m in diameter,the following moments and normal forces are obtained according toSAMSIOE1)
Mrr = + 0. 080 y r3
Mrr12 --= - 0.085 y r3
ll\ - 0.370 y r2
N,.12 - 0.2 15 y r2
f. FEDERHOFER's Method of Design
(32)
(33)
(34)
(35)
It follows from the above that the deformation of the pipe gives rise to a considerable reduction of the moments. The deformation of the pipe has also been taken into account by FEDERHOFER (21), who has used FoRCHHEIMER's equations as a starting-point, but has arrived at a result which is slightly different from that obtained by earlier investigators.
Furthermore, FEDERHOFER pays regard to the effect of the weight of the pipe. For example, he shows that in a pipe 1. 6 m in diameter embedded in earth to half its height, the edge stress in the wall of the pipe on a level with the surface of the ground (this example deals with a steel pipe) increases from 394 kg per cm2 at an internal pressure of 20 m to 827 kg per cm2 at an internal pressure of O m. The application of FoRCHHEil\lER's formula to this example gives a stress of 352 kg per cm2
•
1) On account of the assumption referred to in the above, the forces acting on the
pipe are not symmetrical with respect to the horizontal axis passing through. the
centre of the pipe, contrary to the supposition made in FonCHHEillIER's method of
design.

28
Soil rt!oclion
f•O /0 20 JO 40 50 60 70 80 90 •
0 Jr/� Jr,h
Fig. 9. Distribution of soil reaction at right angles to wall of pipe (tp is the nnglo at the centre of the pipe).
a. Distribution assumed to be proportional to cos rp (FORCHHEI�IER).b. Distribution assumed to be proportional to l' cos rp (SAll!SIOE).
c. Distribution assumed to be proportional to 1 + cos tp (REC:NELL).
5. Method of Desi�n Advanced by the Author
It may be questioned whether the actual soil reaction close to the surface of the ground is not greater than the value computed on the assumption that the soil reaction is proportional to cos rp or V cos rp. A relatively greater soil reaction close to the surface of the ground is obtained when the soil reaction is taken to be propqrtional to 1 +cos <p. The distribution of soil reaction in accordance with these three assumptions is shown in Fig. 9. If we disregard the weight of the pipe shell, the last-mentioned assumption gives the following moments, normal forces, and shearing forces for a circular pipe
Mrr = - O.oso y r3 (36)
Mrr12 = + 0.065 y r3 (37)
Mo = - 0.040 y r3 (38)
Mmnx =+0.079yr3 (this point is located at a distance of 12 ° above the horizontal diameter) (39)
Nrr - 0.360yr2 ( 40)
Nrr12 - 0.215 y r2 ( 41)
No - 0.320yr2 ( 42)
Vn12 - 0.140yr2 ( 43)

29
Calculaf�d. mom�nf•
l�ig. 10. Moment distribution in an embedded wood-stave pipe determined on the nBBnmption that the soil reaction is proportional to 1 + cos rp. The pipe is supposed to be completely filled with water, but not to be subjected to any internal
pressure.
In this case, the load is not symmetrical with respect to both the vertical axis and the horizontal axis passing through the centre of the
pipe. Therefore, the maximum moment occurs slightly above the surface of the ground, and not on a level with this surface, see Fig. 10. The moments at the upper edge and at the surface of the ground are 58 and 44 per cent respectively of the values computed by means of FoRCHHEIMER's method, or 78 and 63 per cent respectively of those calculated by means of SAMSIOE's method. Of course, the moments are smaller in this case too, if the pipe is distorted into an oval shape. If we take into account the deformation of the pipe, and

30
if the coefficient of distortion is assumed to be e = 0.12, we obtain the following approximate moments
M11: = - o.o5s y r3
M11:12 = + 0.052 y r3
(44)
(45)
The moments become smaller if the pipe is allowed to undergo a deformation. When the pipe is emptied or filled, the soil reaction can happen to be still more concentrated at the sides of the pipe owing to the deformation of the pipe, and the moments can therefore become even smaller than in that case where the distribution of soil reaction
• is taken to be proportional to 1 + cos cp.
The moments calculated in the above occur when the pipe is filled with water, but is not subjected to a:p.y internal pressure. If the pipe is submitted to an internal pressure, however small, then a deformed pipe is subjected to considerable forces which tend to restore the pipe to its original shape and to counteract the moments. If we consider the above-mentioned pipe, 3 m in diameter, and if the coefficient of distortion is taken to be e = 0.12, then, even at an internal pressure of one metre, the stabilising moment is so great that it completely neutralises the deforming moment, that is to say, no moment occurs in the wall of the pipe, on condition that the amount of distortion has not changed during the increase in pressure.
6. Summary of Methods of Desi�n for Embedded
"'1'ood-Stave Pipes
It is of course difficult to determine the actual distribution of soil reaction. The pressure distribution is dependent on the magnitude of the internal pressure in the pipe. When ,the internal pressure is high, FoRCHHEIMER's assumption that the distribution of soil reaction is proportional to cos <p is probably most closely in agreement with reality. On the other hand, when the pipe is filled to the crown, it is probable that pressure distribution is approximately proportional to 1 + cos cp. FoRCHHEIMER's values of the normal forces should therefore be used in the design of pipes subjected to internal pressure.
a. Normal Forces.
For a circular wood-stave pipe embedded in stone to half its height, we obtain the following normal forces which must be taken by the bands

N,. =Hr+pd+0.50yr2
31
(46)
N,.12 =Hr+pd+0. 2I5 yr2 -0.5 nrG1) (47)
N0
=Hr+pd+0.50yr2 (48)
l The stress in the band is a B = N
F.
b. Moments.
For a circular pipe which is filled with water, but is not subjectedto any internal pressure, if we assume that the soil reaction is proportional to 1 + cos rp, we obtain the following moments in the wall of the pipe
Mrr = - 0.080 yr3 (49)
M,.,2 = + 0.065 yr3 (50)
Mo = - 0.040 yr3 (51)
Mmax = + 0.070 yr3 (52)
c. Design of Wood-Stav e Pipes for Operation 'ttnder Normal Conditions.
It has been demonstrated that a wood-stave pipe which is embeddedto half its height is in general permanently distorted into oval shape, with the result that the moments in the wall of the pipe computed on
the assumption that the pipe is circular are completely neutralised by the moments which are caused by the effect of the normal force due to deformation, even :i:f the internal pressure is very slight. Therefore, in designing a pipe for normal conditions of operation, it is generally
not necessary to take into account any moments whatever. The steel bands should be designed so as to be able to withstand the normal forces given by Eqs. (46) to (48).
d. Design of Wood-Stave Pipes for Operation under Emptying andFilling Conditions.
If the diameter of the pipe is relatively small in comparison withthe thickness of the staves, the moments which occur when the pipe
is being emptied and filled do not affect the design in view of the stiffness of the walls and the smallness of these moments.
1) The last term is an approximation of the influence of the shell weight. It is of no
importance when designing the pipe. It has been included in calculating the tensions
of the tens10ns of the tested pipes.
32
·when· the diameter of the pipe becomes greater, the momentsincrease as the third power of the diameter, whereas the stiffness of the walls changes very little. For this reason, the moments are of greater importance when the diameter of the pipe is large. A pipe which is submitted to a relatively low internal pressure in normal operation is usually so distorted that the moments in the wall are small while the pipe is being emptied or filled. A pipe which is submitted to a relatively high internal pressure in normal operation is closer to the circular shape, and is therefore subjected to greater moments when emptied or filled. According to the measurements on four large embedded pipes (D = 3. o to 3. 4 m) which are described in what follows, the normal force acting on the bands decreases continuously as the water pressure becomes smaller. Both at high and at low pressures, the observed values of the normal force acting on the bands are in good agreement with the values calculated from Eqs. ( 46) to ( 48) on the assumption that the moments are neglected. This shows that the normal force in the bands clue to the moments in the wall is of no importance in the design of the pipe. Of course, the deformation of the pipe causes a high edge stress in the bands. However, this stress does not affect the design, as may be inferred from the following discussion. Since the moments occur only occasionally and at a low internal pressure, it ought to be possible to allow a high stress, on condition that adequate safety is afforded against failure.
e. Discussion.
The moments in the wall of the pipe shall be sustained by the wood-staves in combination with the steel bands. A certain initial reaction moment is produced by the force due to swelling of the wood and by the tensile forces in the bands due to this force. A moment which exceeds this reaction moment causes a higher average tensile stress in the bands and a corresponding compressive stress in the wood staves and gives rise to bending of the bands and the wood wall of the pipe. A calculation made on the assumption that the bending of the bands is perfectly elastic shows· that considerable stresses are set up in the bands, and SAMSIOE has demonstrated in an example that, for a given pipe of large diameter, these stresses exceed the yield point stress of ordinary steel. On account of bending of the bands, the pipe will undergo deformation with the result that a condition of equilibrium will be reached, in which the initial moment due to the water pressure is neutralised by the reaction moment
I

33
which is produced during the deformation of the pipe by the effect of the normal force and by the moment due to the combined action of the bands and the staves. Since the pipe is emptied and filled on comparatively rare occasions, the allowable stresses on such occasions may be higher than under normal conditions. Even if the edge stresses in the bands may approach to the yield point stress when the water level is at the crown of the pipe, this fact in itself seems to be of secondary importance. The reason is that the safety providing against failure should be referred to the maximum average tensile stress in the bands, and not to the maximum edge stress. The edge stress can reach high values, but this stress results in bending of the bands and in deformation of the pipe. As the deformation is restricted on account. of the reaction moments due to the normal force, the edge stress is also limited. Since a pipe is emptied and filled at considerable intervals, the bands are not liable to fatigue. Moreover, the stress in the staves may probably exceed the maximum swelling stress or the yield point stress obtained under a static load for a short time, without causing any notable permanent deformations.
It is obvious that unduly large deformations of the wall of the pipe cannot be allowed for other reasons. When the crown of the pipe is deflected, the curvature of the pipe at the crown becomes increasingly flatter, and if the pipe is large, the wall of the pipe is exposed to the risk of buckling since the staves at the crown may tumble down. (See p. 54). This risk is particularly great if the water in the pipe is liable to surge when the pipe is emptied and filled.
F. Stress Measurements
I. Method of Testin�
As has been shown in the above, several formulae are available for the design of wood-stave pipes. In order to determine the stresses in the bands, measurements have been made on four of the largest embedded wood-stave pipes existing in Sweden, viz., the pipes at the _hydro-electric stations Sikfors on the river Pitealv, Harreselsfors on, the river Umealv, Gideabruk on the river Gidealv, and Aggfors on the river Indalsi:i.lven. All these pipes have been subjected to a more or less detailed examination according as the method of testing used for these measurements proved to be applicable. In connection with these tests, a questionnaire has been circulated in order to 3
•

34
collect information on operating experience, which is dealt with in Chapter III >>Operating Conditions>>.
Since the stress in the steel bands is a product of the strain and the modulus of elasticity, the general principle of the measurements consisted in determining the strain by observations made on the pipes and in determining the modulus of elasticity of the respective steel bands by means of laboratory tests. For the determination of the modulus of elasticity, the pipe owners have kindly supplied specimens of steel bands taken from the same lots which had been used in the construction of the pipes. For the Aggfors pipe, no steel bands were left elver, and the modulus of elasticity had therefore to be estimated.
The strain measurements were made by means of Huggenberger tensometers which were attached to several bands at various points on the circumference of the pipe (see Figs. 11 and 12). The water pressure was measured by means of a mercury manometer and by
Fig. 11. View of test set-up for strain measurements made on the wood-stave pipe at the Sikfors Hydro-Electric Station. The tensometers were attached to the bands at several points on the circumference of the pipe. The water pressure was measured by means of a mercury manometer which communicated with the water in the pipe through a rubber hose. At low pressures, the water level in the pipe was indi-
cated by a glass tube gauge.
I

- - ... ' .
. -". ;.1'9.... 1
35
Fig. 12. Strain measurements on the wood-stave pipe at the Aggfors Hydro-Eleetrie Station. Tensometers attached on the upper side of the pipe.
direct observation of the water level in a glass tube. After taking the tensometer readings, the shoes of the bands were loosened until the bands were entirely relieved from tension, and readings were taken again. Moreover, several readings were taken while loosening the shoes, in order to check the measurements. This precaution proved to be justifiable since the greatest error in the measurements was probably made while loosening the shoes. The reason was that the positions of the tensometers were easily disturbed when the band was lightly struck, e. g. with a wrench. In order to prevent the bands from twisting, they were held up by means of pipe tongs. Furthermore in some test or tests, the tensometer deflections were observed on all pipes at full pressure and while the pipe was empty.
The stresses in the steel bands were calculated from the tensometer deflections and the moduli of elasticity. The results are graphically represented in polar diagrams in Appendices B to E. These diagrams also show the stresses computed from Eqs. (46) to (48), in which the compressive stress in the staves has not been taken into account.
The tests made at Sikfors, Harrselsfors, Gideabruk, and Aggfors are described in the following sections.

36
2. Tests Made at Sikfors
The Sikfors Hydro-Electric Station is situated on the river Pitealv, and utilises a head of 14. 5 to 16. 6 m at a normal discharge of 50 m3
per sec. This plant was erected in 1912 and reconstructed in 1924. At the present time, it is equipped with two identical Francis genera
ting units having a turbine rating of 2 500 kW each. From an intake
located on the left bank of the river, the water flows through two wood-stave pipes, 470 m in length, to a surge tower which is situated quite close to the power station. The head over the crown of the
pipes varies in operation from about 5 Ill at the intake to about 9 m at the surge tower. The water is taken from a pool which is covered
with ice in the winter. Normally, the velocity of the water is 3.1 m
per sec, and the discharge is 25 m3 per sec per pipe. Originally, the
pipes were circular, 3. 2 m in inside diameter, and were embedded in
broken stone reaching to half their height. In the tests made in September 1944, the horizontal diameter was found to be
0
3.36 m
in the upper section of the left pipe (head of 4.87 m over the crown of the pipe) and 3.31 m in the lower section of this pipe (head of
8.12 m). Fig. 13 shows one of the pipes in process of construction in
1912. A view of the pipes in their present condition is shown in Fig.
5 b. The walls are made of continuous 3 in. wood staves which are stated not to be provided with tongue-and-grove joints- The
staves are held together by bands made of steel rods 31 mm in dia-
Fig. 13. One of the two wood-stave pipes at the Sikfors Hydro-Electric Station in process of construction in 1913. The diameter of the pipe is 3.2 ni. Cf. Fig. 5.

37
meter. The bands are spaced 60 cm in the upper section of the pipe and 35 cm in the lower section. Each band is tightened by means of an eccentric shoe made of open hearth steel. The shoes are fitted at the crown of the pipe, and are slightly displaced in relation to one another.
The first stress test (test No. 1) was made on a band in the upper section of the left pipe. Huggenberger tensometers wen� attached to both sides of the band at intervals between the surface of the ground and the crown of the pipe. The water pressure was measured by means of a mercury manometer. After taking the tensometer readings, the shoe was loosened by means of a wrench, while holding the band by means of pipe tongs. When the band was almost completely loosened, the pipe began to leak profusely, and the test had to be interrupted for fear that the pipe should fail. Tensometer readings were taken again. The modulus of elasticity was obtained from a tension test made on a band which was taken from the same lot as those used in the construction of the pipe. The difference between the stresses in the band under normal operating conditions and after loosening the band was calculated from the modulus of elasticity and the tensometer readings. The stress was also computed from Eqs. ( 46) to ( 48) without taking into account any no-load stresses,1) e.g. the stress caused by swelling of the wood. As may be seen fromAppendix B, the agreement between the observed and the calculatedstresses is fairly close. For the cross section of the pipe at Sikfors,a no-load stress of 1 kg per cm2 corresponds to a stress of 58 kg percm2 in tlie band. Since it was not certain that the band was completelyrelieved from stresses after loosening, this test cannot give anyconclusive evidence of the occurrence of swelling stresses. On thecontrary, it is to be noted that the observed stresses at two pointsare slightly lower than the calculated values. Furthermore, in viewof the slow movements of the tensometers during the last stage ofloosening, the stress in the band may be assumed to have decreasedto zero. The estimated no-load stress in the staves can scarcely behigher than 1 kg per cm.2
The tests Nos. 2 and 3 were made on a band in the lower sections
of the left pipe while it was being emptied and filled. The tenso-
1) The term mo-loud stress•> is used in what follows to designate that compressive
stress which occurs in the staves when the pipe does not carry any load, i. e. when
it is empty. The no-loud stress may be due either to swelling of the wood or to
tightening of the bands.

38
Fig. 14. The large wood-stave pipe at the Harrselsfors Hydro-Electric Station, 3.0 m in diameter. In view of the operating experience with the two older, smaller pipes (visible on the right), this pipe has been completely enclosed by plank walls
in order to protect it from freezing.
meters were fitted around the pipe at approximately the same intervals
as in the test No. 1. Readings were taken at an internal pressure of 9. o m, and then the pipe was slowly emptied, while observing the water pressure and the tensometer deflections, until the water level has sunk 35 cm below the crown of the pipe (this distance is reckoned from the inside of the staves at the crown). At this low pressure, the tensometer readings varied but slightly as the pressure was still
further reduced, and therefore it was not deemed necessary to empty the pipe still more, in order to obtain the values corresponding to the empty pipe. The tensometer were restored to zero, and the
pressure was increased again, while observing the tensometer deflec
tions. As has already been pointed out, the stresses in all tests were
calculated without taking into account any moments or any no-load stresses, e.g. the stress due to swelling of the wood. It is seen from Appendix B that the observed and the calculated stresses are in fairly close agreement in all tests. Hence it follows that the no-load stress was negligible.

39
3. Tests Made at Harrselsfors
The Harrselsfors Hydro-Electric Station, which is owned by the Vannas Power Co., is situated on the river Umealv, and utilises a head of 14. s m at a normal discharge of 37 m3 per sec. This station, which was built in 1916 to 1917, and was extended in 1923 to 1924 and in 1942 to 1943, is equipped with two Francis generating units having a turbine rating of 770 kW each, a Francis unit rated at 1100 kW, and a Francis unit rated at 1 840 kW. The three former units are connected to two wood-stave pipes, 2. o m in diameter and 280 cm in length. The 1 840 kW unit, which was installed in 1942 to 1943, is connected to a wood-stave pipe, 3.o m in diameter and 302 m in length. The water flows from a concrete intake on the right bank of the river (the dam does not run across the whole width of the river) through these wood-stave pipes to the surge towers (see fig. 14). The older part of the plant has not always operated satisfactorily. For instance, one of the wood-stave pipes failed in 1944 (cf. p. 66). The stress measurements were made on the new woodstave pipe. The characteristics of this pipe are given in what follows.
The pipe was. built in 1942. It has an inside diameter of 3. o m, and is embedded in broken stone reaching to about half its height. The wall of the pipe is made of continuous 3 in. staves which are stated not to be provided with tongue-and-groove joints. The pipe is equipped with bands made of steel rods, 22 mm in diameter, spaced 15 to 25 cm. Each band is tightened by means of two centric shoes which are fitted right above the surface of the ground on each side of the pipe. The head over the crown of the pipe varies from 0.5 to 7.o m. Under normal conditions, the velocity of the water is 2. 2 m per sec, and the discharge is 15. 5 m3 per sec.
Since it was in general very easy to loosen the shoes, nine testswere made on this pipe, and tensometer readings were taken before and after loosening the bands (tests Nos. 1 to 9). In the tests Nos. 6 to 7, the tensometer deflections were also observed before loosening the shoes both at full pressure and while the pipe was empty. The stresses were calculated from the modulus of elasticity which was obtained from laboratory tests by means of Eqs. (46) to (48) on the assumption that the no-load stress in the staves was zero. The stresses are shown in the polar diagrams in Appendix C. The results of the tests can be summarised as follows.

40
Test No. 1.
The observed stresses in the bands are approximately equal to the calculated values. The greatest difference (about 100 kg per cm2)
was observed at the crown of the pipe. If this difference were caused by the no-load stress alone, it would be equal to 2.5 kg per cm2
•
Test No. 2.
The observed stresses are approximately equal to the calculated values. Hence it follows that the no-load stress was negligible.
Test No. 3.
The observed stresses are higher than the calculated values. The
difference between them corresponds to a no-load stress of 4. 4 kg per cm2
•
Test No. 4.
The observed stresses are considerably higher than the calculated
values. The difference between them corresponds to a no-load stress of 8.0 kg per cm2
•
Test No. 5.
At the crown of the pipe, the observed stresses agree with thecalculated values, whereas the observed stresses on the side's areconsiderably higher than those obtained from the calculations.However, the dispersion of the measurements is great, and no great
importance should therefore be attached to this test. The meanvalue of the stresses observed on the sides of the pipe exceeds thecalculated value by 335 kg per cm2
• This difference corresponds toa no-load stress of 6. s kg per cm2
•
Test No. 6.
This test is of special interest since the stresses were measured at full pressure, on the empty pipe, and after loosening the bands. It is seen from the diagrams that the observed stresses are in very close
agreement with the calculated values. The observed values were obtained from the difference between the tensometer readings taken on the empty pipe and at full pressure. The difference between the tensometer readings ta.ken at full pressure and after loosening the
bands gives a slightly higher stress. This difference corresponds to

41
an actual no-load stress in the staves which varied from 1. 2 to 5. s kg per.cm2 and amounted to 3.0 kg per cm2 on the average.
Test No. 7.
This test was made in the same manner as the test No. 6. The agreement between the calculated and the observed stresses is very close. The no-load stress is lower than in the test No. 6. On the average, this stress is 2.3 kg. per cm2
•
Test No. 8.
The agreement between the calculated and the observed stresses is good for one side of the pipe, that is to say, the no-load stress is equal to zero. On the other side, some disturbance has probably occurred when the band was loosened since two values are unusually high, whereas the stresses at the crown of the pipe are low.
Test No. 9.
The agreement between the calculated and the observed stresses is close at the crown of the pipe and near the surf ace of the ground, but the stresses are remarkably high at some intermediate points. The mean value o! the no-load stress for all test points is 4. 3 kg per cm2
•
4. Tests Made at Gidei\bruk
The Gideabruk Hydro-Electric Station, which is owned by the Gidea and Husums Co., is situated on the river Gidealv, and utilises a head of 11.5 to 13.s m at a normal discharge of 22 m3 per sec. The station was built in 1913, and is equipped with three Francis generating units,having a turbine rating of 1 900 kW at a net head of 11 m each. The water flows from a concrete regulation dam through a canal, 165 min length, to a concrete intake, and then passes through a wood-stave pipe, 480 m in length, to a surge tower which is situated quite close to the station.
The characteristics of the wood-stave pipe are as follows. The pipe was originally circular, and its inside diameter was 3.0 m. The upper section (190 m in length) of the pipe is carried on supports, whereas the lower section is embedded in gravel to half its height. The horizontal diameter of the embedded section of the pipe was measured during the tests, and was found to vary from 3.22 to 3.16 m (the

42
Fig. 15. Embedded section of the wood-stave pipe at the Gideabruk Hydro-Electric Station, 3.2 m in diameter. This pipe has been in operation more than 30 years. The upper surface of the pipe is slightly damaged by decay. The shoes are of the
eccentric type.
head over the crown of the pipe was about 2. 6 m). The wall of the pipe is made of continuous wood staves, 89 mm in thickness. The pipe is provided with round steel bands, 25 mm in diam�ter, spaced 39 cm (on the greater part of the embedded section of the pipe). The cast iron shoes of an eccentric type are fitted at the crown of the pipe. The head over the crown of the pipe varies in operation from 2 m at the intake to 2.6 m at the surge tower. The normal velocity of the water is 3.1 m per sec. Cf. Fig. 15. ,
The shoes were very hard to loosen because they were rusty, and it was therefore difficult to obtain any reliable values from the stress measurements. Nevertheless, the shoes at the crown of the pipe were loosened in the tests Nos. 1 to 13. The tests Nos. 14 and 15 were made while emptying and filling the pipe, but the values obtained from these tests are not fully reliable since it was raining during the measurements. As the head was about the same in all tests, the stresses should also be approximately equal. On the other hand,
as will be seen from Appendix D, the results show considerable. differences between the tests. These differences are most clearly

43
visible in the polar diagram in Appendix D. On the average, however, the observed stresses seem to agree with the calculated values. This is also the case in the tests made while emptying and filling the pipe. According to the well-known. theory of swelling stresses (see p. 47), all stresses should have been equal, or should at least show a smaller .dispersion, and should have been much higher than the calculated values. As has been pointed out in the above, these measurements are relatively unreliable, but their number is so great that the mean value of the stresses ought nevertheless to give a fairly good result. In the Author's opinion, the great dispersion is largely due to the fact that the bands are tightened at regular intervals, and are therefore subjected to an initial stress of varying magnittide. In general, no swelling stress seems to be present.
5. Tests Made at Xggfors
The Aggfors Hydro-Electric Station is owned by the K.rangede Co., but has been leased to the .Aggfors Co. The station is situated on the river Indalsalven, and utilises a head of 13 to 13. 5 m at a normal discharge of 60 m3 per sec. The station was built in 1914 to 1915, and is mostly used for supplying power to woou pulp mill grinders. The generating plant comprises five Francis turbines directly coupled to grinders and having a total rating of 5 000 kW, and three Francis turbines coupled to electric generators and totalling 590 kW. The water passes through a canal, 180 m in length, to an intake and then flows through two wood-stave pipes, 115 m in length. These pipes unite in a single steel pipe which bridges over the left arm of the river, and is directly connected to the turbine installed in the pulp mill building, see Fig. 16. (The station was shut down in 1949).
The two wood-stave pipes were originally circular, with an inside diameter of 3.4 m, and were embedded in gravel and broken stone to half their height. The horizontal diameter measured in the tests was found to be 3.53 m. The walls of the pipe are made of continuous wood staves, 4 in. thick, held together by round steel bands, 37 mm in diameter, which are spaced 37 to 54 cm. The bands are tightened by means of eccentric cast iron shoes. The head over the crown of the pipe varies in operation from 3.2 m at the intake to 7.4 m at the connection to the steel pipe. The normal velocity of the water is 3. 7 m per sec.

44
Fig. 16. Two wood-stave pipes at the Aggfors Hydro-Electric Station after 3,1 years of operation. On account of the presence of shrubbery in the neighbourhood of the pipe and because of careless maintenance, the pipe has been damaged by decay, particularly in the longitudinal joints between the staves (cf. the two pipes
at Sikfors which are equally old, see Fig. 5).
The bands were difficult to loosen, and the pipes were in a bad condition. For these reasons, the stress measurements were made only while emptying and filling the pipes. The test No. 1 was carried out on the right pipe. The tensometer readings were taken when the pipe was in operation and after the pipe had been emptied. The difference in stress was calculated from the difference between the tensometer deflections. The test No. 2 was made in a similar manner. The tensometer readings were taken when the pipe was empty, when it was submitted to an internal pressure, and when it was empty again. The results of the tests are graphically represented in Appendix E. Since the bands were not loosened, it was not possible to measure the no load stress, if any. The diagram shows that the observed stresses are in fairly close agreement with the calculated values.

45
6. Summary
On account of numerous sources of errors, the results of the tests described abo_ve are not quite satisfactory. The Huggenberger tensometers, which were used in the tests, are difficult to handle in general, and in these tests in particular, since they had to be made ·under field conditions. The shoes were often affected with rust tosuch an extent that great difficulties were experienced in looseningthe nuts, and there was always the risk of disturbing the tensometers.Consequently, there can be errors in the individual tensometerreadings. On the whole, however, a reliable estimate of the resultscan be formed. The results of the tests can be summarised as follows.
In some tests, the tensometer readings were taken both at fullwater pressure and when the pipe was empty. From these tests wecan obtain those stresses in the bands which are caused by the externalforces alone (the water pressure and the weight), that is to say, thestresses which are not influenced by the no-load compressive stresses(due to swelling of the wood and to tightening of the bands), if any.In all tests carried out in this manner (2 tests at Sikfors, 2 tests atHarrselsfors, 2 tests at Gideabruk, and 2 tests at Aggfors), the stressescalculated from Eqs. ( 46) to ( 48) are in close agreement with theobserved values, as may be seen from the detailed description of thetests in the above and from Appendices B to E.
The actual stresses in the bands were measured by loosening theshoes (21 tests). This was possible in the tests made on two pipesonly. In the tests made at Sikfors, the shoes stuck fast so hard thatit was not possible to make more than one tests. At Harrselsfors,on the other hand, it was very easy to loosen the bands. Looseningof the bands was facilitated by the fact that each band was providedwith a shoe on either side of the pipe, close to the surface of the ground,in contradistinction to the bands on the other test sites. At Gideabruk, it proved possible to loosen 13 bands, although it cost muchtrouble, whereas the shoes at Aggfors were so rusty that the bandswere not to be moved. The results of these tests show considerablevariations of the stress in the bands, but these variations are probablyin part due to errors in measurements. The difference between theobserved and the calculated values has been expressed in terms ofthe corresponding no-load stress. According to the tests made atSikfors, the no-load stress should not exceed 1 kg per cm2
, whereasthe no-load stress at Harrselsfors varied from Oto 8 kg per cm2
, and

46
the mean value of this stress for 9 tests was 4 kg per cm2• The tests
made at Gideabruk were interesting in that the water pressure was nearly unchanged in all 13 tests, whereas the stress in the bands
was found to vary to a fairly large extent. Nevertheless, the mean value of the observed stresses agrees with the calculated value. In
general, the no-load stress seems to be insignificant, and its estimated
value does not exceed 4 kg per cm2 under normal conditions. The tests do not afford any information on the cause of the no
load stress (swelling of the wood or tightening of the bands), but
considering the large dispersion of the test results, there is every reason to believe that tightening of the bands has contributed to
the no-load stress more than swelling of the wood. According to the
results obtained from earlier tests (see p. 47), the no-load stress
should be constant, and should amount to about 10 kg per cm2,
irrespective of any initial stresses due to tightening of the bands by hand.
The following conclusions can be drawn from the tests described in
the above. 1. The observed stresses in the bands caused by the internal water
pressure and by the weight of the pipe and the water are in close agreement with the stresses calculated from Eqs. (46) to (48).
2. The no-load stress in the wood staves (caused either by tighten
ing of the bands or by swelling of the wood) is subject to variations
within wide limits, probably owing to differences in band tension.
The greatest no-load stress was observed on the most recently
constructed pipe, at Harrselsfors, and was found to be 5.8 kg per
cm2• On the average, the no-load stress varies from 2 to 3 kg per cm2
•
The swelling stress is of course still smaller, and is probably quite
negligible.
Fig. 17. Test set-up used by SAMSIOD
in 1915 for measuring the force due to swelling of the wood.
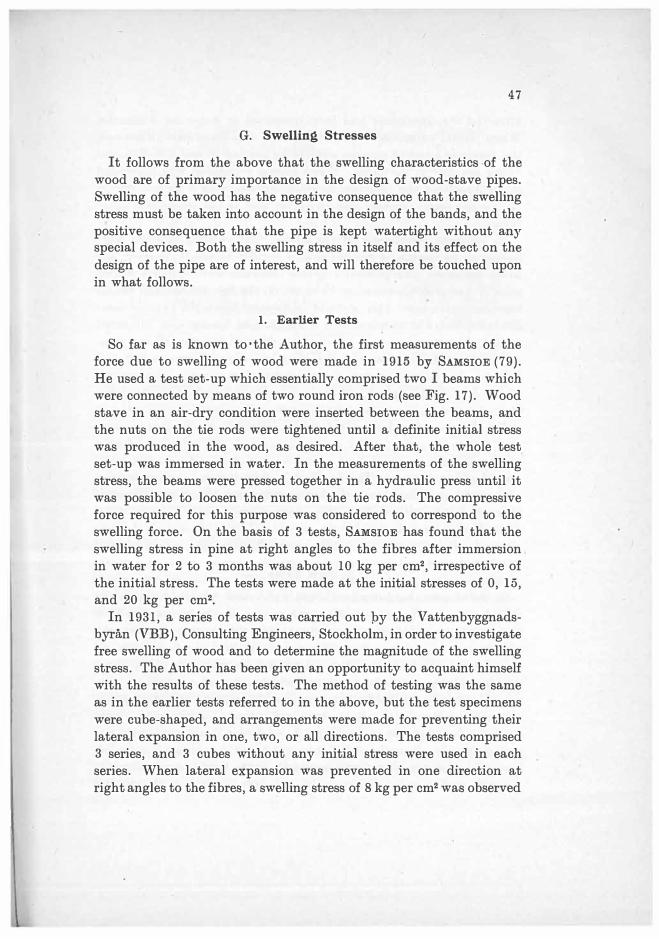
47
G. Swelling Stresses
It follows from the above that the swelling characteristics ,of the wood are of primary importance in the design of wood-stave pipes. Swelling of the wood has the negative consequence that the swelling stress must be taken into account in the design of the bands, and the positive consequence that the pipe is kept watertight without any special devices. Both the swelling stress in itself and its effect on the design of the pipe are of interest, and will therefore be touched upon in what follows.
1. Earlier Tests
So far as is known to·the Author, the first measurements of the force due to swelling of wood were made in 1915 by SAMSIOE (79). He used a test set-up which essentially comprised two I beams which were connected by means of two round iron rods (see Fig. 17). Wood stave in an air-dry condition were inserted between the beams, and the nuts on the tie rods were tightened until a definite initial stress was produced in the wood, as desired. After that, the whole test set-up was immersed in water. In the measurements of the swelling stress, the beams were pressed together in a hydraulic press until it was possible to loosen the nuts on the tie rods. The compressive force required for this purpose was considered to correspond to the swelling force. On the basis of 3 tests, SAMSIOE has found that the swelling stress in pine at right angles to the fibr�s after immersion in water for 2 to 3 months was about 10 kg per cm2, irrespective of the initial stress. The tests were made at the initial stresses of 0, 15, and 20 kg per cm2•
In 1931, a series of tests was carried out py the Vattenbyggnadsbyran (VBB), Consulting Engineers, Stockholm, in order to investigate free swelling of wood and to determine the magnitude of the swelling stress. The Author has been given an opportunity to acquaint himself with the results of these tests. The method of testing was the same as in the earlier tests referred to in the above, but the test specimens were cube-shaped, and arrangements were made for preventing their lateral expansion in one, two, or all directions. The tests comprised 3 series, and 3 cubes without any initial stress were used in each series. When lateral expansion was prevented in one direction at right angles to the fibres, a swelling stress of 8 kg per cm2 was observed

48
after the test specimens had been immersed in water for 5 months. When lateral expansion was prevented in two transverse directions,
the observed swelling stresses were 19 kg per cm2 in one direction and
17 kg per cm2 in the other. When lateral expansion was prevented
in all directions the observed swelling stresses were 8 kg per cm2 in
the longitudinal direction and 18 kg per cm2 in the transverse direc
tions.
In all tests · mentioned in the above, the swelling stresses were
measured by means of fundamentally similar methods, namely, the
wood specimen was pressed together between two opposite beams
until it was possible to loosen the nuts on the ties holding the beams
together. However, this method of testing seems to involve con
siderable errors in measurement since the test specimen is subjected
to deformation every time the measurements are made. Some mea
surements indicate that the deformations varied between 0. 5 and
0. !l mm. In order to produce these deformations alone, a compressive
stress of 1. 7 to 3.1 kg per cm2 in the wood is required, if the modulus
of elasticity is taken to be 1 000 kg per cm2•
The Norwegian rules for the design of wood-stave pipes assume
that the swelling stress is 7 to 10 kg per cm2• This figure is based
on the above-mentioned tests made by SAMSIOE and on some tests
carried out in Norway. The Norwegian swelling stress measurements
were made on pipes 1 m in diameter. For pine, spruce, and impreg
nated pine, the observed swelling stresses were 8.3, 6.5, and 7.6 kg per cm2 respectively.
2. New Tests
In the stress measurements on old wood-stave pipes referred to in
the above, the observed swelling stress was on the average only 2
to 3 kg per cm2• This seems to indicate that the swelling stress decre
ases in course of time. In order to provide further information on
the magnitude of the swelling stress and its variation with time,
the Author has started some tests which are still carried on. By
using a specially designed test set-up (see Figs. 18 and 19), the Author
has reduced the deformations during the stress measurements to a
negligible amount, which corresponds to a stress not exceeding 0.1
kg per cm2• It is seen from Figs. 18 and 19 that the stress is measured
by means of a spring-type pressure gauge. The load is applied to the
gauge by tightening a nut every time a reading is taken. The displa-

49
::, /(n,fe-eif9e m 9roove
Aboul 300mm
Fig. 1S. Test set-up used by REGNELL for meusuring the force due to swelling of the wood. Owing to improved control of the deformations of wood, this test set-up gives more reliable results than the type shown in Fig. 17. In principle, these
two test set-ups are similar.
cement of the lever with respect to the end stay is measured by means of a dial gauge. It is assumed that the load has been completely transmitted to the pressure gauge when the deflection of the dial
gauge begins to change. The lever is provided with a special spherical bearing and a knife-edge fulcrum. Since the length of the lever is known, the stress in the wood can be calculated. Two tests have been carried out up to now. The wood specimens used in both these tests were made of air-dry pine which was free from knots and had a moisture content of about 15 per cent. In the test No. 1, the initial stress was zero when the test specimen was immersed in water. In
the test No. 2, the initial stress was 6.5 kg per cm2• The test results
(see Fig. 20) show that the swelling stress in the test No. 1 reached amaximum of 9.4 kg per cm2 in 50 days, whereas the swelling stress
in the test No. 2 increased to a maximum of 10.o kg per cm2 in 14days. After that, the swelling stress gradually decreased in bothtest specimens. In the test No. 1, the swelling stress was 7.s kg percm2 after 7 months, while in the test No. 2, where the specimen wassubjected to an initial stress, the swelling stress was about 8 kg per
cm2 after 6 months. It may be approximately inferred from Fig. 204 .

50
Fig. 19. View of the test-up shown in Fig. 18 during the tests (removed from the water tank).
that the decrease of the swelling stress to a figure as low as 2 to 3 kg
per cm2 would probably take several years.
3. Conclusions Regarding Swelling Stresses
In order that a wood-stave pipe shall be watertight, and shall be
held together as a whole, it is necessary that the staves should be
subjected to a certain compressive stress which can be caused either
by swelling of the wood or by tightening of the bands. The results of
the tests made on old pipes indicate that the compressive stress in

.5wPllinf JfrPJJ, kf per cm1
20
18
16
/4
12
10
8
4
0
.'!".ffu"
/ V
0 1
:t0.9
..-[;)/' L.----
-<, ""/
......
4 6 8 10 20
51
,!�!..
--- .\... ';g,4 � .......... �
40 60 8IJ 100 200 4()(J 60011(1} IC¥XJ Tim� of 1111mt!rsicn m watw-, tltTys
Fig. 20. Stress due to swelling of pine samples tested in water. Preliminary results of tests which are not yet completed. On the whole, the method of testing reproduces the conditions in a wood-stave pipe made of staves 70 mm in thickness and provided with round bands, 20 mm in diameter, spaced 250 mm. The timber samples used for the two tests in process of execution were taken from the same stave which was made of common air-dry pine. The so.mple No. 1 wo.s immersed in water without tightening the nuts on the tie rods (tho.t is to say, the initial stress in the wood wo.s zero). The sample No. 2 was immersed in water after tightening the tie rods, o.nd the initial stress wo.s 6.4 kg per cm2
• After some 200 days, the nuts of the rods of the sample No. 1 were tightened, with the result that the compressive stress in the wood increased to 16,2 kg per cm•. Two years later the compressive stress
decreased to 7,8 kg per cm2•
the surface of contact between the staves may be low (2 to 3 kg
per cm2}, without giving rise to leakage. Therefore, a swelling stress
of 10 kg per cm2 seems to be unnecessarily high, so far as water
tightness is concerned, and it appears justifiable to take appropriate
measures in order to reduce the swelling stress. It has been usual of old to adjust the band tension during the construction of wood-stave
pipes so as to render the pipe watertight and to prevent the swelling
stress from becoming too high with respect to the bands. Fig. 21
shows that the expansion of unrestrained pine specimens at right angles to the fibres during swelling approximately reaches the maxi
mum value of 4 to 5 per cent after only 3 to 5 days. For a pipe of,
say, 2 m in diameter, this expansion corresponds to an elongation
of 30 cm on the circumference. The expansion clue to swelling is so

52
100
1: 80 � I.
� 60 .... � § .. 40
-!!?
20
0
5
14 ....
� �.3 i 112 ....
�1
f 2
'llme of immersion in woll'r, monfns
Fig. 21. Relation between the amount of swelling of unrestrained pine samples and the moisture content of originally air-dry pine immersed in water. Tests made by the Yattenbyggnadsbyrun (VBB), Consulting Engineers, Stockholm, at the
Government Testing Institution of Sweden in l!J32.
considerable that it is difficult to reduce the swelling stress in large pipes to the desired degree only by loosening the shoes. Therefore, it seems natural to reduce the swelling stress by using staves which have a certain initial moisture content and hence are slightly swollen from the outset, unless this is not possible for practical reasons. Even a moisture content of 30 per cent, as against the usual figure
of 15 to 20 per cent, will probably be sufficient to produce a substantial reduction of the swelling stress. Consequently, this problem deserves further investigation, especially as its solution may be expected to lead to a relatively large saving in band material.
The tests and measurements described in the above show that the swelling stress in originally air-dry pine staves reaches a maximum of about 10 kg per cm2 after immersion in water for not more than one month, and that the swelling stress considerably decreases in course of time. The magnitude of the swelling stress seems to be largely dependent on the initial moisture content of the wood prior to immersion in water. Therefore, it ought to be possible to reduce the swelling stress if the initial moisture content of the staves used for the construction of the pipe is increased to a certain degree .
•

53
H. Thickness of Staves
The following factors are to be considered in determining the requisite thickness of staves: I. The load-carrying ability of the pipe regarded as a beam between
supports.2. The strength of the staves submitted to internal pressure.3. The risk· of buckling due to external pressure.4. The risk of leakage.5. Internal wear.6. External decay.
1. Load-Carrying Ability of Pipe Regarded as a Beam between
Supports
According to the stave pile method proposed in the above, see Eq. (16), the load-carrying ability of the pipe regarded as a beam between supports should be taken into account in determining the thickness of staves.
2. Strength of Staves Submitted to Internal Pressure
If we imagine the staves to be continuously supported on the bands and to be submitted to an internal pressure, a bending stress will be produced in the staves, and this stress should not exceed the allowable value. The stickness of staves can be written
VH.cl = 0. 707 l -;; (53)
If the allowable stress in the staves is taken to be 600 tons per m2
we obtain
cl= 0.020 l VH; (54)
The value of the internal pressure to be inserted in this formula is its maximum value which also comprises a certain allowance for surges.

54
3. Risk of Buckling Due to External Pressure
When the pipe is subjected to an external pressure which can be
caused by partial vacuum in the interior of the pipe or by the earth covering, the pipe may be caved in or buckled. In order that the pipe shall be able to withstand any external pressure at all, the wall of. the
pipe must possess a certain stiffness. When a wood-stave pipe is exposed to buckling, which usually manifests itself in the collapse of the pipe at the crown, the stiffness of the walls is mostty determined
by the thickness of the staves, since the bands prevent buckling in the outward direction only. We can write
H ·t = �1 • E (_!,_)3 en
e (55)
where �1 is constant for a given method of support. We assume that the radius of curvature of the pipe wall has increased to the value e on account of permanent deformation. If we suppose that the pipe has been distorted into an elliptic shape and if we denote the coefficient of distortion by s, we obtain approximately
and consequently
(! = !!_ (1 + � s) 2 2
E ( d )a Hcrit = �2 ( 3 )a J5
1 +-- e2
(56)
(57)
Hence it follows that a small thickness of staves, a large diameter, and a deformation of the cross section of the pipe are unfavourable since they facilitate buckling of the wall. It is of interest to study the variation in the critical pressure with the dimensions of the pipe and
with the amount of distortion. If we assume that the coefficient of
distortion is maximum 0.2 for a large pipe, 4 min diameter, and that this coefficient varies in proportion to the diameter, we obtain the
values of the thickness of staves shown in Fig. 22. This diagram represents circular pipes and deformed pipes. If a pipe carried on supports is correctly constructed, it is fixed in a circular shape at

Extern(]/ pressvre
Herd tjm2
D=t.O
0 50
/
fOO 150 mm
Thickness of sfoves
55
Fig. 22. Variation in the external pressure due to buckling of wood-stave pipes with the diameter of the pipe and the thickness of staves. The full-line curves refer to circular pipes. The dash-line curves refer to permanently deformed pipes. The diameters of these pipes in their initial, circular shape are indicated in.the diagram. The horizontal dash-dot line represents the minimum value of the relative external
pressure to be used in the design of pipes.
the supports, and the possibility of deformation between the supports
is slight. Therefore, the curves for circular pipes (e = 0) can generally be used for pipes carried on supports.
Embedded pipes, on the other hand, are in general liable to defor
mation, and the thickness of the staves used. for pipes of this type must therefore be greater. Fig. 22 shows a horizontal line which represents a maximum of H
cr!t which has been found in practice
to be suitable under normal conditions in view of the possibility of
partial vacuum in the pipe. The surges occurring when a pipe is emptied are often likely to
produce dangerous vacuum. The pipes should therefore be emptied
slowly and very carefully. If there is reason to fear that the vacuum in the pipe can become considerable, arrangements should be made
for air supply by means of stand pipes or vacuum valves. At the Sikfors Hydro-Electric Station (D = 3.2 m, d = 0.0'i5 m),
the crown of the pipe has collapsed on two occasions while emptying the pipe. After a vacuum valve had been fitted at the most dangerous point, such accidents have not happened again. One of the most
known examples of pipes which have failed while being emptied is the pipe at Nymboida, Australia (D = 1 m, d = 0.020 m).

56
4. Risk of Leakage
Leakage through the wall of the pipe can be due to the following causes:
1. Percolation.2. Insufficient lateral contact between staves.3. Leaky end joints (see Section I >>Wood-Stave Joints>>).
a. Percolation.
About 1920, some American rules for the design of wood-stavepipes stipulated that in those cases where the internal pressure exceeded 24 m, the annual rings in the staves should be at right angles to the direction of pressure in order that the pipe should be watertight (59). Subsequent watertightness tests made by SEITZ (86) have shown that wood staves about 50 mm in thickness are practically watertight at pressures of up to 70 to 120 m, even if the annual rings are parallel to the direction of pressure. Knots and cracks are detrimental to watertightness.
b. Lateral Contact between Staves.
The lateral joints between the staves are rendered tight by thecompressive stress which is always present in the surface of contact between the staves. This compressive stress is caused partly by tightening of the bands and partly by swelling of the wood. In America, it is considered that the compressive stress between the staves should be at least 1. 5 times the internal water pressure or at least 8. 7 kg per cm2
•
The water pressure causes the stave wall ·to bulge between the bands, with the result that cracks are formed between the staves. These cracks ought to be closed owing to the elasticity of the staves at right angles to the fibres. According to the theory of strength of materials, the deflection in the middle between the bands is
178 = 384 E11
I (58)

57
The relative elongation in the tangential direction is �. As ther
resilience of the wood shall be greater than this value, we obtainthe condition
��_J_J_ r - E1_
and hence, in virtue of Eq. {58),E1 H; l4
p ::> --= - __ . -= E11 r 32 d3 ( 5!))
Consequently, the compressive stress between the staves shall beat least as high as that given by Eq. (50) in order to prevent leakagebetween the staves. According to SAMSIOE (79), El_ = 10 000 tonsper m2 under a static load. In the direction parallel to the fibres, thevalue of E may be assumed to be much higher, approximately En =1 000 000 tons per m2
• Thus, the ratio of these moduli of elasticityis of great importance. When the load is applied suddenly, i.e. in theevent of water hammer, the value of E 1_ will probably be considerablyhigher. The value of the ratio E 1_/E11 = 1/10 may be suggested asappropriate.
c. Amount of Leakage.Leakage in a wood-stave pipe is dependent on many factors.
Nevertheless, it may be of interest to know what amount of leakagemay generally be expected to occur in a wood-stave pipe. Some dataon leakage are tabulated below.
Source (notice)
E. N. R. (17) LEDOUX (54) CAMPBELL (9) ..
l\1Aum (62) ..
11\IAURY (65) .. SEITZ (87) .. . SPIES (88) ..
Leakage litres per
hour per m2
0.25
0.02
O.oo
0.33
0.01
0.25
0.45
0.80
0.50
Remarks
I AssumedUnder favourable conditions Observed
Observed after 1 day Observed after 133 days.
I Normal Favourable Based on German experiences

58
The above table shows that the opinions on this subject are rather divergent. However, it seems that the value of 0. 6 may be regarded as an appropriate mean value. In Sweden, the amount of leakage may be assumed to be slightly greater. For instance, in the tests made on the wood-stave pipe at the Stockvik Works, which was built in 1944 (D = 0. 75 m, L = 5 407 m, H = 55 111), the leakage was found to be 1. 2 litres per hour per m2
, and the leakage in the water supply main at Boden (D = 0.25 m, H = 60 111) was unusually high, 2.3 litres per hour per 1112 • On the basis of these figures, l.O litres per hour per m2 may be taken as an appropriate standard value of maximum allowable leakage.
When a pipe is covered with earth, there is the risk of deformations
which can give rise to leakage if the pipe is incorrectly constructed. Serious secondary damage can be caused by the water oozing through the leaks due to deformations. After that, the water leaking out of the pipe can give rise to serious erosion of the bedding material (98, 99). According to an American view, drains should therefore be provided at right angles to the pipe, so as to limit erosion of bedding material.
5. Internal Wear
Internal wear of wood-stave pipes is generally very slight. If the water flowing in the pipe is pure, there is practically no internal wear, and velocities of the water not exceeding 12 m per sec are not regarded as dangerous (7). According to Swedish experiences (78), considerable internal wear is extremely rare. One wood-stave pipe has been completely worn out in 22 years, and another pipe had to be lined with 25 mm thick staves on the inside. In some other pipes, the observed amount of wear varied from 3 to 20 mm. In the latter pipes, however, the velocity of the water did not exceed 2.4 m per sec. Waste water discharged from sulphite pulp mills seems to have a very unfavourable influence on wood-stave pipes. In the Norwegian rules for wood-stave pipes (71), it is stated that velocities of water
flow up to 2. 5 m per sec have occurred in Norwegian installations, · without causing any appreciable internal wear. Consequently, it
seems that internal wear does not require any increase of the thicknessof staves, apart from exceptional cases.

59
6. External Decay
If the pipe is properly constructed, external decay appears to the
rather insignificant, as will be seen in Chapter III. Therefore, it
seems that no increase of the thickness of staves is required in order
to allow for external decay.
I. "\Vood-Stave Joints
According to the method of jointing the st�ves, it is usual to
distinguish between three types of wood-stave pipes, viz., collar
type pipes, continuous stave pipes, and group stave pipes.
1. Collar Type Pipes
Collar type pipes are built up of abutting pipe units which are
made of staves of equal length without any joints. The joints between
the abutting ends of the pipe units are sealed by means of short
wood or iron collars which are fitted on the outside of the pipe so as
to cover the joints. The collars are usually made of wood and provided
with steel bands, just as the pipe itself (see Fig. 23). For small pipes,
up to 0. 5 m in diameter, use is sometimes made of a still simpler type
of joint by providing the abutting ends of the staves with tenon and
mortise joints (see Fig. 24). The mortised end is often provided
with additional bands. The collar type of pipe had been prevalent
until about 1910, but was gradually superseded in water power
-
Fig. 23. Wood-stave pipe with individual banded wood collars. This pipe is machine-banded, und the collars are fitted with bands and shoes of the ordinary type.
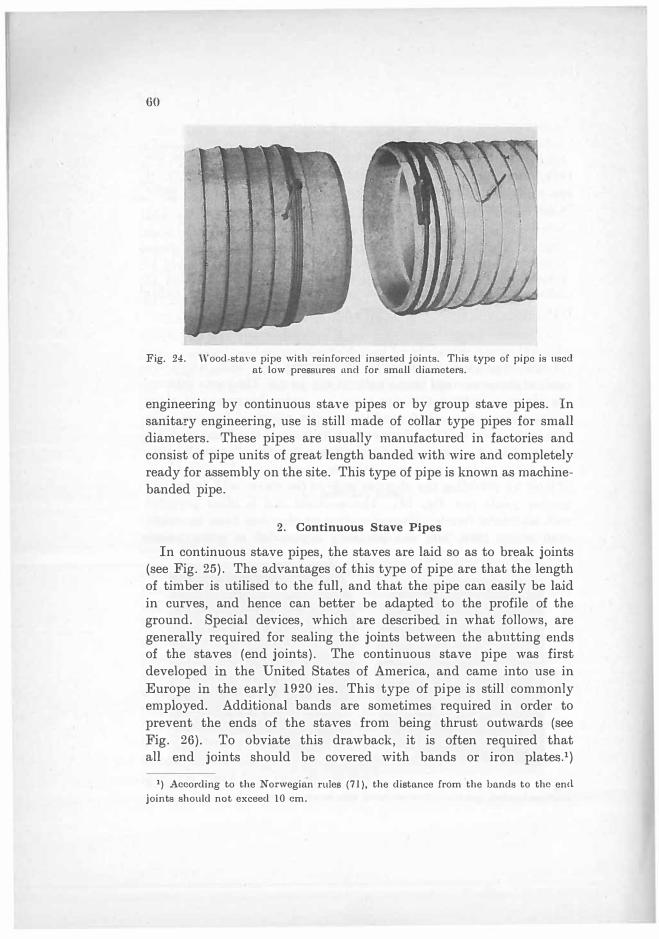
60
Fig. 24. Wood-stave pipe with reinforced inserted joints. This type of pipe is used at low pressures und for small diameters.
engineering by continuous stave pipes or by group stave pipes. In
sanitary engineering, use is still made of collar type pipes for small
diameters. These pipes are usually manufactured in factories and
consist of pipe units of great length banded with wire and completely
ready for assembly on the site. This type of pipe is known as machine
banded pipe.
2. Continuous Stave Pipes
In continuous stave pipes, the staves are laid so as to break joints
(see Fig. 25). The advantages of this type of pipe are that the length
of timber is utilised to the full, and that the pipe can easily be laid
in curves, and hence can better be adapted to the profile of the ground. Special devices, which are described in what follows, are
generally required for sealing the joints between the abutting ends of the staves (end joints). The continuous stave pipe was first
developed in the United States of America, and came into use in
Europe in the early 1920 ies. This type of pipe is still commonly
employed. Additional bands are sometimes required in order to
prevent the ends of the staves from being thrust outwards (see
Fig. 26). To obviate this drawback, it is often required that all end joints should be covered with bands or iron plates.1)
1) According to the Norwegian rules (71), the distance from the bands to the encl
joints should not exceed lO cm.

61
Fig. 25. Continuous stave pipe at Karlskoga in process of construction in 1945. Diameter 1.2 m. Length .300 m.
Under such conditions, use is made of >>group stave pipes>>, which are an intermediary type between collar joint pipes and continuous stave pipes.
3. Group Stave Pipes
Group stave pipes comprise two groups of staves of equal length. Every second stave belongs to the same group. Every stave in one
group is displaced by a given stave length with respect to the staves in the other group. Consequently, every second stave is jointed in the same cross section of the pipe. The end joints are covered with
a flat steel band which surrounds the pipe and is held in place by another steel ba,nd (see Figs. 46 and 49). This device supports the ends of the staves, and hence increases the tightness of the end joints. Group stave pipes have become increasingly common in Sweden and Norway during the past few years.

62
4. End Joints
As the amount of swelling of the wood in the longitudinal direction
is very small, the end joints are not as tight as the lateral joints between the staves. In continuous stave pipes, the end joints are not covered with collars or flat bands, and the staves have a tendency to bulge outwards, with the result that water can leak out through
the joints. If the end joints of a pipe become leaky, they can be
covered with iron plates on the outside of the pipe (see Fig. 5 b). Nowadays, the end joints are always provided with iron plates inserted in the ends of the staves, and these plates are generally
sufficient for effective prevention of leakage. However, the iron plates should not be too large, otherwise ice can easily be formed in
winter, and the staves can be damaged by freezing. According to
American practice, the iron plates are made of 1 1/2 in. by 1/8 in. (38 mm by 3 mm) galvanised hoop iron, and are inserted in slots
Fig. 26. Example showing a warped stave in a plain joint in one of the pipes at the Sikfors Hydro-Electric Station. The cause of wp,rping is the large distance between the bands and probably also the absence of metal plates inserted in the joints. The damage caused to the pipe was slight. The joints were effectively repaired by
means of iron plates and additional bands. See Fig. 5b, left tube.

63
A _J
-·
-,
SECTION A-A
Fig. 27. Connection between abutting ends of staves, using iron butt joint (National Tank and Pipe Company, U.S. A.).
sawn in the ends of the staves (see Figs. 46 and 48). When the bands
are tightened, the lateral joints between the staves are also rendered
watertight by the plates. Sometimes use is made of other, more effective joint seals of cast iron and sheet iron which cover the ends
of the staves both on the inside and on the outside (see Fig. 27). In• one of the largest wood-stave pipes in the United States, the old
joints fitted with ordinary iron plates are being successively improved by covering the abutting ends of the staves with plates both on the
inside and on the outside. Each pair of plates is connected by two
bolts passing through the joint. Effective sealing is ensured by
means of a rubber gasket placed between the plates and the staves.1)
1) The Author owes this information to the Utah Power and Light Co. The wood
stave pipe in question is installed at the Grace Hydro Plant, and is 3.4 m in diameter
and 6 700 m in length. The head varies from 6.4 m at the intake to 38 m at the
surge tower which is situated at the lower end of the pipe.

-64
J. Bands
Bands for wood-stave pipes are made either of round steel rods or flat steel bars. In Sweden, flat bands were used, as a rule, before 1910. The bands were generally tightened by driving wooden wedges between the band and the staves around the pipe. During the period from 1910 to 1920, flat bands were gradually superseded by round bands. The bands were threaded at the ends, and were provided with band couplings, usually called shoes, which made it possible to adjust the tension of the bands better than heretofore. During the yea.rs 1920 to 1938, the use of flat bands for wood-stave pipes has been practically abandoned. In the past few years, flat bands have begun to come into use again, but they were now provided with shoes. The reversion to flat bands was chiefly due to the wish to
reduce the pressure per unit surface between the bands and the staves. Furthermore, it was considered necessary to obviate the risk of local damage to the staves at the edges of flat bands, and the bands are therefore bevelled at the edges on that side which is in contact with the staves.
Since the staves are liable to decay if they are damaged, it is not
advisable to use too high contact pressures. The compressive stress between the bands and the staves is
(60)
According to a view held in the United States (11), this compressive stress should not exceed the allowable stress for wet wood. In calculating this stress, the width of the surface of contact <P is taken to be equal to half the diameter of the round band or the width of the flat band. For wet redwood, an allowable stress of 50 to 40 kg per crn2 is considered to be suitable when the diameter of the round band is 3/8 to 7 /8 in.
According to the Norwegian rules (71), the allowable stress for pine and spruce should not exceed 24 kg per cm2 in the case of thin flat bands (used for thread diameters below 5/8 in.) and 18 kg per cm2
in the case of thicker bands. For round bands, the following relation between the diameter of the band and the diameter of the pipe is given in the Norwegian rules.

65
Diameter of Band
IDiameter of Pipe
inches m
1/2 Not less than O.a
5/8 • • » O.o
3/4 • • » 1.3
7/8 II • II 1.8
1 • » II 2.4
K. Shoes
There are two types of shoes, viz., eccentric and centric.
The advantage of the eccentric shoes over the centric type, which
is used at the present time, is that the former apply tension to both ends of the band. Therefore, eccentric shoes are sometimes employed
on small wood-stave pipes at low·pressures (see Fig. 49). In general,
Fig. 28. Eccentric shoe shown after tension test in testing machine. This type of shoe is used on the pipe at the Sikfors Hydro-Electric Station. When the bands are tightened, the comers of the shoes often split off, and the shoes had therefore to be reinforced with U-shaped staples. When the shoes were tested without staples, the comers split off at a tensile force of 17 tons. When the shoes were fitted with staples, they proved able to withstand a tensile force of 30 tons, but the shoes were
considerably deformed.
5

66,
Fig. 29. Shoes used on the wood-stave pipe at the Aggfors Hydro-Electric Station. These shoes are of the eccentric type. The corners are split off at a few points.
eccentric shoes are not to be recommended since the bands are subjected not only to tensile stresses, but also to moments acting in the plane of the pipe.
At the Harrselsfors Hydro-Electric Station, eccentric shoes have caused trouble in connection with failure of the wood-stave pipe a few years ago. In brief, it occurred as follows. A sudden removal of the load caused a surge in the pipe. This surge was so violent that the clischarge pipe in the surge tower was crushed, and the water in the surge tower rose above the normal level. The high pressure caused failure of a shoe, with the result that the pipe burst open like a zip fastener over a length of about 5 m. Afterwards, it was found that the shoes have only become untwisted, and have slipped off the bands one by one. This pipe failure caused great damage to the hydro-electric station where the water rose I. 5 m above the floor level of the turbine room, and injured the alternator and other equipment. The wood-stave pipe at the Sikfors Hydro-Electric Station is also equipped with eccentric shoes. When the bands are

67
Fig. 30. Centric sheet steel shoes manufactured by the Boxholm3 AB, Boxholm, Sweden.
tightened, the corners of the shoes often split off, and the shoes must be reinforced with U-shaped staples. When the bands and shoes
fitted with staples were subjected to a tension test in a testing machine, it was found that the shoes were able to withstand a load of nearly 30 ton� (diameter of band 32 mm, tensile stress 3 800 kg per cm2)
without any damage other than the deformation of the staples. ,vhen the staples were removed, the shoes were able to withstand only slightly more than 17 tons, and the corners were split off (see Fig. 28). Consequently, owing to the low strength of the shoes (in their original condition, i. e. without staples), the maximum possible
stress in the bands was equal to no more than half the ultimate strength of the bands themselves.
Centric shoes were introduced in Europe about 1920, following the example of the United States. In the beginning, the shoes were made of cast steel, but nowadays they are often made of bent

68
sheet steel1) (see Figs 30 and 47). One end of the band is forged into a T shape, and can be hooked up in the shoe, while the other end is
threaded, "3o that the band can be tightened by means of a nut.
Fig. 31. Centric cast iron shoe manufactured by the National Tank and Pipe Company, U.S. A.
1) The Author has been informed that this type of shoe has been designed by the Vattenbyggnadsbyra.n (VBB), Consulting Engineers, Stockholm, and by the Boxholms AB, Boxholm.

III. Operating Conditions
In the design of wood-stave pipes, regard must be paid not only
to their strength, but also to operating conditions, e.g. decay,
freezing, and losses of head.
A. Decay
I. Previous Experience
The length of life of a wood-stave pipe is generally determined by
decay of wood, and it is therefore very important to examine the
influence of this factor. The first data on decay of wood-stave pipes
were collected in the United States as early as in 1913. According to
TIFFANY (94), the joints of wood collar type wood-stave pipes are
very easily exposed to decay because the collars are not thoroughly
saturated with moisture. The use of sheet iron collars is therefore
preferable. In particular, those pipes which are in operation during
a part of the year should be protected by a first-rate asphalt coating
which must also cover the bands and the collars at the joints. If the asphalt coating is inadequate, the pipe can decay very rapidly.
However, it is to be noted that the climate conditions in the United
States are entirely different from those in Sweden. During the warm
part of the year (the season of irrigation) from about April 1st to
November 1st, the climate in the United States is very dry nearly
desert-like; while the winter is relatively cold, and the amount of
precipitation, mostly rain, varies from 100 to 150 mm. The pipes are
generally operated during the dry season only, whereas they are empty
in the winter. As most American pipes are covered with earth, they
retain moisture quite well during the winter, and are thus kept from
decay. The length of life of such pipes, which are in operation during
the season of irrigation only, is estimated at about 20 years. In a contribution to the discussion on the paper by TIFFANY, CHANDLER

\
70
(10) agrees with the above-mentioned conclusions, and gives anaccount of further experience concerning a pipe which had beencompletely covered with earth at the beginning, but was subse
quently laid bare in some places by the wind. After 5 years ofoperation, the bared parts of the pipe and that part which was covered
with moist earth were found to be thoroughly sound, whereas anotherpart covered with dry earth had decayed to a considerable extent.After that, the whole pipe was laid on supports, and this was regardedas a very important improvement, not only in view of reduced decay,
but also because it became easier to inspect the pipe and to stop upleaks, if required.
A few years later, HENNY (34) published a comprehensive report on operating experience regarding some 80 wood-stave pipes in the
United States. As far as decay is concerned, HENNY gives the following figures for the life of pipes.
Non-I mpregna�ed Pipes.
Pine, non-covered pipes . . . . . . . . . . . Pine, pipes covered with watertight earth .
Pine, pipes covered with loose earth ....
Impregnated Pipes (generally with asphalt or tar).
Pine, pipes covered with watertight earth .
Pine, pipes covered with loose earth . . . . . . . .
12 to 20 years
20 years 4 to 7 years
25 years 15 to 20 years
It is stated that the life of non-impregnated wood-stave pipes made of American redwood and embedded in watertight earth or in sand can exceed 25 years. HENNY arrives at the conclusion that a non-covered pipe has a longer life than a pipe covered with loose earth, and that a pipe covered with watertight earth has a longer life than a non-covered pipe. A low water pressure has an unfavou
rable influence on the length of life, particularly if the pipe is made of pine staves. The use of wood-stave pipes is not considered to be suitable if the pipe is to be empty during comparatively long periods
of time. If the pipes are to be impregnated, this should be done thoroughly, and the penetration of tar and asphalt should be at least 1/16 in.
According to PARTRIDGE (74), the life of wood-stave pipes is dependent on the following factors:

71
1. Type of wood.2. Quality of timber.3. Method of drying.4. Impregnation.5. Diameter and spacing of bands.6. Design, construction, and workmanship.
In view of the varying requirements in the above-mentioned respects, PARTRIDGE proposes that wood-stave pipes should be divided into three standard classes denoted by A, B, and C. In Class A, for instance, the pipes shall be made of redwood only, and their life is estimated at about 25 years, or more. In Class B, use
can also be made of impregnated spruce, and the life is taken to be at least 10 years.
A subsequent investigation of 196 wood-stave pipes in the United States, which was carried out by the U.S. Reclamation Service (69), arrived on the whole at the same conclusions as those referred to in the above. Furthermore, the results of this investigation indicate a relation between decay and the age of the pipe. In the group of pipes less than 5 years old, 4. o per cent of the total number of pipes in this group have decayed, while the corresponding figure in the group 6 to 10 years was 15.3 per cent, and in the above 11 years, 24 per cent.
As has already been pointed out, American experience is not directly applicable to European conditions since the climates are quite different. In a paper published in 1921, Lunrn (59) remarks that the figures on the length of life of wood-stave pipes given in the above-mentioned American sources appear to be too small, considering some special American and German experiences. According to German experience, the life of a correctly designed and constructed wood-stave pipe, which is permanently filled with water under a h_ead of at least 6 m, may be expected to exceed 20 years. In Austria, a few years after the construction of wood-stave pipes in that country had been started in imitation of American models, it was realised that the life of these pipes could be much longer. This view was also based on American experience with wood-stave pipes which have become 50 to 60 and, in exceptional cases, even 100 years old (55). At about the same time, a far more optimistic opinion on the life of wood-stave pipes was expressed in a paper published in the United States (97). The author of this paper, BYRON WHITE, states that there are many

72
examples of non-impregnated pipes which have lasted 20 or 30 years
and longer, but on the other hand, there are also examples of pipes of similar types which began to decay after a few years. WHITE considers that the wood-stave pipes operated at low water pressures should preferably be completely non-covered, and should be provided with some kind of external protective coating, in order to prolong their life as much as possible.
In the Umted States, small thickness of staves is considered to be an advantage so far as decay is concerned, since the timber is thoroughly saturated with moisture, even if the pressure is low. In order to reduce the risk of decay and to achieve a saving in material at the same time, the thickness of staves in Germany has in some cases been reduced to 25 and 30 mm, although the internal pressure in the former case was as high as 80 m, and the pipe in the latter case was covered with earth to a height of 5 m above the crown (38). lithe timber used for the staves is of good quality, a thickness of 18 to 20 mm is regarded as adequate in order to ensure the watertightness of the pipe wall. In addition to impregnation with asphalt and tar or
creosote, which is commonly employed in the United States, particularly for machine-banded pipes, use has been made in Germany of impregnation with a cyanogen compound, especially for collar type
pipes. It is considered that the life of wood-stave pipes can reach about 35 years under favourable conditions, and at least 25 years under other conditions. When the pipe is to be embedded in earth, it is particularly important to make sure that the earth does not contain any humus or plant roots. In order to protect the pipe from surface water, which may contain putrefactive bacteria, the pipe should be surrounded by a filtering layer of earth, and the thickness of this layer above the crown of the pipe should not be less than 0.6 to O.s m.
So far as is known to the Author, no summary of results obtained from the operation of wood-stave pipes in Norway has been published.
However, some stipulations concerning staves are included in the Norwegian rules for wood-stave pipes issued in 1942. For instance,
it is stated that the pipe may be made either of pine staves or of
spruce staves, but not of both at the same time. The staves shall be
sawn from the lower part of the trunk, and shall not consist of loose, rapidly grown timber. In respect of planing it is stipulated that the
heartwood side should be turned inwards, otherwise the staves tend to warp so that the concave side faces outwards. The rules do not

73
contain any data on the life of wood-stave pipes, but the Author has been informed that the life of these pipes is nowadays considered in Norway to be approximately equal to that of steel pipes, that is to say from 40 to 50 years.
2. Recent Swedish Experience
In Sweden, a considerable number of wood-stave pipes are in use, but no operating results have been collected and published until quite recently (78). This publication is based on data concerning
213 pipes. A weak point in this investigation, just as in the previously mentioned American report published in 1921, is the fact that the degree of decay was estimated by the respective pipe owners or members of local staff. Accordingly, these estimates are of course greatly dependent on the qualifications of the persons in question and on their choice of terms. On the whole, however, the correctness of the final results can be relied upon, considering that the material collected for this investigation was very extensive.
Information as to decay has been furnished on 213 pipes, and it was found that 55 per cent of the pipes have decayed in a greater or smaller degree. Exceptionally heavy decay has been reported in
tlvmber al ppes 60 I/, Pi�s ,n serwu ,n 1941 Degree or rot
Cl O No rat Cl f Slight rot
50
40
JO
20
10
lil[iiJ 2 Oegree of' rot unknown • J Oeeprol
0 L.....JoL..-....L5....L6--/JJ..V-/LI-...J15L......L.,6-- .... 20-2.J..f--2L5...J26L..-....L
JO.....I.JI
--JJ..5-
36 .. _ .... 40 ....... 41--.... 45
-4 ... 5--50 ...... 51·-·ss-56--
60:iton
A� m 1941 1941-36 J5-JI J0-26 25-21 20-16 15-11 I0-06 05-01 l900-f89695-91 90-86 85-1881
YMr of construdion too [_8_, p
_,p_e
_
s
_
r"-m
-
ov-ed
__,,n
_f .. 9
4
_
1
.c
or
=e1.'1r_hc:
er::::L.....am,111....r=L......L=. _____ _ _ -·!!!mmmffl=-
16-20 21-25 ?6-JO 31-35 36-40 41-45 46-50 Yeor.s Age when removl!d
Fig. 32. Number of decayed wood-stave pipes claBSified according to age and degree of decay.

74
the case of 9 per cent of the total number of pipes. In general,. the pipes have not been subjected to any impregnation whatever. Fig. 32 shows a classification of the pipes according to their age and degree of decay. It is seen from this diagram that the percentage of pipes damaged by decay increases at a particularly high rate after the first 15 to 20 years of service, and finally reaches 90 to 100 per cent wlien the pipes are 45 years old or still older. On the other hand, the percentage of old pipes which have undergone exceptionally heavy decay is not very high. In the interval from 25 to 50 years, only 10 to 15 per cent of the pipes have decayed to a considerable extent. Moreover, these figures should be accepted with great reserve since the collected data include only those pipes of a definite age, e. g. 30 years, which are still in operation, but these data do notindicate the total number of pipes built 30 years ago. A classificationof the pipes removed in 1941 or earlier is given in the bottom diagramof Fig. 32, and this diagram can be regarded as fairly complete.
It follows from the above that the life of wood-stave pipes in Sweden, in so far as it is determined by decay, generally reaches 40 to 45 years, but does not exceed 45 years in normal cases. It is to be noted that the pipes in Sweden are usually not impregnated, contrary to American practice, but most of these pipes are filled with water the whole year. A comparison between pine and spruce staves has confirmed the above-mentioned view expressed in the Norwegian rules which stipulate that either pine or spruce may be used for staves, and that they should not be employed at the same time. It has been found that a thickness of staves up to 100 mm is not unfavourable and does not conduce to decay. The difference between Swedish and American results is probably due to the entirely different climatic conditions. Covering of wood-stave pipes with earth has proved to involve risks since the pipes can undergo considerable decay if the material used for covering is inappropriate. However, if the pipe is embedded in clay, the length of life can be expected to even longer than in those cases where the pipe is not covered at all.
At the present time, it is often considered in Sweden that the staves should be made of thoroughly impregnated timber, e.g. treated with Boliden Salt (an arsenic salt) under pressure and vacuum. No experience is so far available regarding this method of timber preservation, especially the influence of the salt on the bands and shoes, but there are reasons to believe that the life of the pipes which are

75
Fig. 33. Decayed part of the wood-stave pipe at the .Aggfors Hydro-Electric Station. This pipe is about 35 years old. The staves are decayed under the bands to a depth not exceeding one inch. In this case, decay is probably due to two causes, viz., first, leaves, and the like, accumulate in the corners between the bands and the staves, and second, the contact pressure between the bands and the staves is
unusually high.
made of staves impregnated by means of this method, and are correctly constructed in other respects, will be even longer than the above-mentioned figure of 45 years.
The Author has personally examined, some wood-stave pipes which are to be regarded as characteristic in some measure. This examination has given the following results.
Aggfors Hydro-Electric Station. Two wood-stave pipes embedded in gravel to half their height. Diameter 3.4 m. Thickness of staves 4 in.
Head 3.2 to 7.4 m. Built in 1914 to 1915. These pipes are in a very bad condition (1944), as may be seen
from Figs. 16, 29, and 33. The staves are more or less generally decayed in the longitudinal joints to a depth of about one inch. So are the wooden collars connecting both ends of the wood-stave pipes to the steel pipes. Large leaks occur in both pipes. Nevertheless,

'
76
the remaining internal part of the pipe wall, which is 4 in. thick, is sound, and continued use of the pipes is therefore not endangered. The pipes are provided with round bands, 37 mm in diameter, spaced 37 to 54 cm. According to American practice, the diameter of the bands in such a case should not exceed 7 /8 in., and the distance between the b�nds should not be greater than 20 cm. As may be seen from Fig. 33, the bands have pierced the wood, apparently cut through the fibres, and given rise to decay. In the Author's opinion, it is possible that the decay of these pipes was primarily initiated by leaves, and the like, which have accumulated in the corners between the bands and the staves, and have caused rot, and hence destruction of the fibres. The pipes are surrounded by abundant vegetation, and are covered by leaves, mosse, and dirt. Moreover, the pipes are carried on a gravel, bed, and it is therefore remarkable that they have proved to last as long as 30 years.
When the Morsil Power Station was built in 1949, both these pipes were pulled down. It was found that the degree of decay was less than had been expected. Decay was observed only in the surface of contact between the bands and the staves as well as in some longitudinal joints, but the depth of the decayed layer did not exceed about one inch.
Sikfors Hydro-Electric Station. Two wood-stave pipes embedded in broken stone to half their height. Diameter 3. 2 m. Thickness of staves 3 in. Head 4.o to 8.1 m. Built in 1912.
These pipes are in a very good condition, in spite of the fact that they are as old as 32 years (see Fig. 5 b). It is interesting to compare these pipes with the pipes at .Aggfors, which are in a bad state. The design data and the ages of these pipes are nearly equal. The diameter and the spacing of the bands are also of the same order of magnitude. At Sikfors, the bands are 31 mm in diameter, and the distance between them is 35 to 60 cm. A few isolated staves have decayed to a negligible degree. The steel bands have not pierced the wood, and no decay comparable to that of the Aggfors pipes has occurred in this case. This confirms the assumption that the bands on the .Aggfors pipes have cut through the fibres indirectly on account of decay. The reason why the pipes at Sikfors are in such a good condition, as compared with those at .Aggfors, is probably to be found in the careful maintenance of the former. The vegetation in the neigbourhood of the pipes is regularly cut down within a distance of several tens of metres on both sides of the pipes, the bed is permanently

77
kept free from plants and mould, and the bed material is occasionally washed. In contrast with the pipes at Aggfors, the Sikfors pipes exemplify the great importance of appropriate upkeep in preventing decay of wood-stave pipes.
Gideabruk Hydro-Electric Station. The pipe is partly carried on supports and partly embedded to half its height. Diameter 3. o m. Thickness of staves 3 1/2 in. Head 2.6 m. Built in 1913.
That section of the pipe which is embedded is in a relatively good condition, whereas the part carried on supports is in such a bad state that a complete reconstruction of the pipe is contemplated at the present time.1) The bad state of the pipe seems to be due to the fact that the pipe has been deformed because the distance between the supports has previously been too great (see Fig. 7). Decayed spots have been observed here and there at the crown of the pipe, but the depth of the decayed layer is very small (see Fig. 15).
Harrselsfors Hydro-Electric Station. This pipe, _3 m in diameter, was built as recently as in 1942, and is naturally in an excellent condition. The two older pipes are of greater interest in this connection. One of these pipes (2.0 m in diameter, head 10 m, built in 1916) has been covered with marshy earth in the 1920ies in order to provide heat insulation. In a few years, the pipe had decayed to such an extent that it proved necessary to remove the earth covering and to repair the pipe. At that time, the decayed layer of timber was 1 to 2 cm thick. This experience confirms the remarks made in the above -0oncerning the harmfulness of covering ·wood-stave pipes with dirty earth.
Karlsniis Hydro-Electric Station.2) Collar type pipe carried on supports. Diameter 2.20 m. Thickness of staves 3 in. Head 5.7 m. Built in 1899. The staves are slightly caved in at some supports. Wood specimens were taken from the wall by means of a core drill at several points along the pipe. Most staves were found to be perfectly sound. Decayed spots reaching to a depth of 1 cm were observed only in some joints between adjacent staves. Those staves which have been caved in were not decayed. On the other hand, the wedges
1) That part of the pipe which had been carried on supports was replaced in the
autumn of 194 7 by a new pipe, 3. 5 m in diameter, which was embedded in broken
.stone. 2) This station is situated on the river Ronnebyan, and is owned by the Kockums
Iron Works, Kallinge. The wood-stave pipe was examined by the Author in June,
1947.

78
under the bands and collars were decayed in several places. The fact that this pipe has decayed so little may be assumed to be largely due to careful maintenance. The pipe is coated with a mixture of asphalt and tar every year. At the same time, the wedges and the timber in the collar joints are overhauled and replaced, if required.
3. Conclusions Regarding Decay
Under Swedish conditions, the following conclusions can be drawn from operating experience regarding decay:
1. Type of TV ood. Pine or spruce staves ·can be used. However, thesetwo types of wood should not be employed in the same pipe.
2. Quality of Timber. It does not seem to be necessary to stipulatethe use of heartwood. On the other hand, it is advisable to makesure that the timber is not too loose and does not originate fromtrees which have grown too rapidly. The timber shall be freefrom knots passing through the whole thickness of the staves andfrom edge defects. It may possibly be recommendable to stipulatethat the staves shall be cut from the lower part of the trunk, inaccordance with the Norwegian rules.
3. Impregnation. Under Swedish climatic conditions, no impregnation is generally required for preservation of timber. Impregnation with aspalt and tar to a depth of 1/16 in., as practised in theUnited States, is of course effective, but expensive. Creosotehas proved to be a good preservative. Complete impregnation,e.g. with creosote or Boliden Salt (an arsenic salt), in vacuumand under pressure is perhaps a good method.
4. Design and Construction. In general, the pipes should be carriedon supports, and should be entirely non-covered. If the pipe isto be covered with earth, only a material that is free from humusand is relatively watertight, preferably clay, should be used, atleast in the immediate vicinity of the pipe. Earth beds reachingto half the height of the pipe should be avoided, but are nevertheless probably most suitable for large pipes from an economic pointof view. In that case, it seems that the bed should be made ofthoroughly drained, clean stone. The rule that vegetation, whichgives rise to contamination of the pipe and the bed material,should be cut down in the neighbourhood of the pipe, is applicableto all wood-stave pipes.

79
B. Freezing1)
A wood-stave pipe is less exposed to freezing than a steel pipe of
equal diameter and length, if located in the same place. This has been found in many cases both in Sweden and in other countries.
In one case, a 15 cm thick layer of ice has been observed in a steel
pipe, whereas no ice coating whatever was present in the wood-stave pipe connected to it. The danger of freezing is often the decisive
factor in determining whether non-covered pipes can be used at all. Steel pipes require often heat insulation in the form of earth covering,
while this insulation can frequently be completely dispensed with, or its thickness can be reduced, in the case of wood-stave pipes since
their walls are thicker and have a higher heat-insulating value. For
instance, a 0. 7 m thick earth covering has proved adequate for
insulating a wood-stave pipe, 9 300 m in length, used for water
supply to a town in Germany, whereas the calculated thickness of the earth covering for a steel pipe was 1. 5 m ( 83).
Freezing is dependent on many factors, and it is desirable to
elucidate their effects. To begin with, freezing should therefore be
considered from a theoretical point of view.
I. Theory of Freezing Process
a. Heat Transmission by Conduction and Convection.
The process of freezing is in a very high degree influenced by thetemperature of the water at the intake and the temperature of the
air. When the weather is cold, the water flowing in the pipe is conti
nuously cooled, and its temperature can become so low that an ice
layer is formed on the inside of the pipe. The heat transmitted from
the water through the pipe shell is k · (t - t11), where t = the tempe
rature of the wfJ,ter, t11
= the temperature of the air, and k = the coefficient of heat transfer through the wall of the pipe. The difference
in temperature is mostly due to external, non-controllable circum
stances. On the other hand, the coefficient of heat transfer can
be varied within fairly wide limits by various practical measures.
The total thermal resistance to heat transfer through the wall of
the pipe is equal to the sum of the thermal resistance of the wall and
the thermal r�sistances of the films on the outside and on the inside
1) This chapter is largely based on the investigation published by the Author in
tExperience Regarding Wood-Stave Pipes,> (78).

"
-....
80
of the wall. Saturation of the wood with water and freezing have a very unfavourable effect on the thermal resistance. The thermal resistance of saturated timber is 40 per cent, and that of saturated and frozen timber (at - 15° C) is 20 per cent, of the thermal resistance of timber in an air-dry condition.
The thermal resistances of the films on the outside and on the inside of the wall are dependent on the velocities of flow of the air and the water respectively. The external film resistance varies from 0.20 m2
•
00 · hour per kcal in the absence of wind to, say, 0.04 m2 •
00 · hour per kcal at a wind velocity of 5 m per sec. The internal film resistance is so small that its influence on the heat transfer can be disregarded. On the other hand, this resistance practically determines how and where an ice layer is formed in the pipe. The internal film resistance is about 0.001 m2
• 00 · hour per kcal at a velocity of
water flow of 2.o m per sec, and 0.004 m2 •
00 · hour per kcal at a velocity of 0. 2 m per sec.
b. Freezing of Pipes.
Freezing of pipes can be divided into three distinct phases, whichare subjected to mathematical treatment in Appendix F. The first phase is the cooling of the water, the second phase is characterised by the presence of a thin ice layer, and the third phase consists in the formation of a thick ice layer. The temperature drop LI t of the water passing through the pipe is
(a) directly proportional to the difference (t - tv) between the
temperature of the water and the temperature of the air, (b) directly proportional to the external area of the pipe L · n · D,
(c) inversely proportional to the thermal resistance m per unitsurface,
(d) inversely proportional to the rate of water flow Q. Consequently, we have
(t - tv) · L · n • D
LI t = const. Q m·
(61)
In order to reduce the rate of cooling when the length of the pipe and the rate of water flow are given, the diameter of the pipe D should therefore be as small as possible. However, a definite economical value of the diameter is required in view of the losses of head, and the choice of the diameter may consequently nec�ssitate a compromise.

81
If the velocity of water flow v is inserted in the expression for the temperature drop instead of the rate of water flow Q, we obtain
D
(t -tv) · 4 · LLI t = const.
D m· v ·
(62)
If we put v · L
= Va, which we call the >>specific velocity of water
flow>>, we get
(t - ty) · 4
L1 t = const. ----m • Va (63)
The specific velocity of water flow can be defined as that velocity which produces in an imaginary unit pipe, 1 m in diameter and 1 m in length, the same temperature drop as in the actual pipe at a given difference in temperature and a given thermal resistance of the wall. This concept is used in what follows for the sake of simplification.
According to the theory of cooling, the temperature in the pipe decreases along the pipe in conformity with a practically linear law. If the temperature at the intake is low, the temperature of the water in the pipe gradually approaches zero. It is interesting to note, however, that water begins to turn into ice at a temperature which is higher than the freezing point. This is due to the presence of a sudden bend in the temperature gradient line at the boundary surface between the water and the wall of the pipe. A similar, but greater bend occurs at the boundary surface between the wall and the air.
That temperature at which water only just begins to turn into ice will be termed >>the limit temperature>> in what follows. The limit temperature for various pipes, velocities of water flow, and weather conditions can readily be determined by means of Fig. 34, in which t/-t
y, i.e. the ratio of the limit temperature to the temperature of the
air is plotted as a function of the velocity of water flow for varying thickness of the wall in the presence and in the absence of wind. The curves shown in Fig. 34. have been calculated from the relations deduced in Appendix F.
The ice layer formed on the inside of the pipe acts to a certain extent as heat insulation. The thickness of the ice layer continues to increase �ntil equilibrium conditions are attained. Freezing of water liberates a considerable quantity of heat, and therefore takes 6

'
82
t
-�0,05
0,04
0,03
0,02
0,01
0,00
t-��.q:�::,,,..-¥=:=::::::::f} Wind
?""f====��;:J } Calm
f,O 2,0 J,O m/s Velocity of Waler Flow
t Fig.� 34. Temperature ratio - -1-,
V at the beginning of freezing plotted against velocity lof water flow, in metres per second, for varying thickneBB of pipe wall, in inches, and various wind conditions. The curves apply to a pipe diameter of 3 m. The values of the temperature ratio corresponding to a pipe diameter of l m amount to 70 per cent of those
given in the diagram.
a relatively long time. In most cases, the ice la,yer does not become very thick. In order to examine this aspect of the problem, a detailed calculation has been made for a definite pipe. The results of this calculation are represented in Fig. 35. It is found that the temperature in the pipe decreases linearly to the limit point of 0.47
° C. After that, the temperature curve asymptotically approaches zero as the distance from the intake becomes greater. Downstream of the limit point, the thickness of the ice layer increases at a relatively high rate, and reaches a value which is nearly constant over a long stretch in the lower section of the pipe. Within this stretch, the increase in thickness of the ice layer is constant, and is equal to 4. 5 cm per day. Right downstream of the limit point, at a distance of 900 m from the intake, the increase in thickness of the ice layer is very small. In this part of the pipe, the thickness of the ice layer relatively quickly approaches a value which characterises the state reached after an infinite time. The temperature of the water in a given cross section of the pipe is almost constant in the course of the whole process of freezing.
c. Heat Transmission by Radiation and Evaporation.
The above calculations have been cl:!,rried out on the assumptionthat heat transmission through a wall, in this case the wall of the pipe, is ·dependent only on the temperatures on both sides of the wall as well as on the total thermal resistance of the wall and the respective films. This assumption is commonly used in heat transfer calculations in building construction, but it is not quite in agreement with

Ubfer ft!mperofurt! •c
f.2 Wafl!r fempprafure of infakl!• l.2""--�.-----,----.-----,
0.4 �---li----j.l�--+---+--b,""""':-:-:+:r:1....:.:=r,11 20
Water fem erolllr. 1
o.2 (Proclico/� con-·�,-:;t��::::'.:t::::::::4�-:-=tMI 10' starrf fhroU1Jh011f 1 freezing penod) 1
l -,_-::;....--o,oL _ _.l __ J&::::::::=...L--..L::::==±===-U..L......J o
0 (000 2000 3000 m Distance from intake of ptpe
83
Fig. 35. Formation of ice in a wood-stave pipe. This diagram shows the results obtained by calculating the thickness of the ice layer and the temperature of the water along a wood-stave pipe at various instants after the beginning of freezing. The diagram shows that ice is formed only downstream of a definite point located at a distance of 900 m from the intake, and that the thickness of the ice layer increases at a relatively uniform rate throughout the greater part of the freezing section of the pipe. These results agree with many Swedish and foreign experiences. The water temperature is practically independent of the thickness of the ice layer, at least in this case. The calculations were made on the following assumptions, viz., air temperature -20° C, water temperature at intake + 1.2 ° C, windy weath!lr, anda constant water flow of 0.17 5 m• per second. The pipe was taken to be of the same type as the pipe at Holjebro. If a pipe is so long that the water is cooled down close to the freezing-point, and ice is formed in a comparatively long portion of the pipe, it does not matter whether the pipe is still longer; the thickness of the ice in the pipe at any given moment will at all events be approximately constant beyond
the frozen portion.
reality since the heat losses on the outside of the pipe are influenced by radiation and evaporation, although evaporation is generally of secondary importance. As a �ule, convection on the . outside of the pipe increases as radiation becomes smaller, and vice versa. Consequently, the sum of the quantities of heat transmitted by convection and by radiation remains roughly equal to the value obtained from the approximate calculation carried out in the preceding section, at least in the presence of wind. Heat radiation from the outside of the pipe is mostly dependent on the degree of cloudiness, but is also

•
84
affected, although to a smaller degree, by the difference in temperature between the radiating surface and the air. During clear nights, the quantity of heat emitted by radiation reaches a maximum, with the result that the temperature of the radiating surface can even be lower than that of the ambient air. The quantity of heat transmitted by evaporation increases as the temperatures of the surface and of the air become higher, and as the velocity of the wind becomes greater, but decreases as the relative humidity of the air increases. In the winter, when the temperature is low and the relative humidity of the air is high, the quantity of heat transmitted by evaporation is therefore very small. The quantity of heat emitted by radiation has been computed at 158 kcal per m2 per hour for a pipe made of l in. thick staves in the absence of wind when the sky is clear, and at 26 kcal per m2 per hour for a pipe made of 4 in. thick staves in the presence of wind when the sky is clouded. The quantity of heat transmitted by convection, just as that emitted by radiation, reaches a maximum (260 kcal per m2 per hour) for the l in. stave pipe, but under diametrically opposite weather conditions, i. e. in the presence of wind when the sky is cloudy. For the 4 in. stave pipe, the quantity of heat transmitted by convection decreases to 17 kcal per m2 per hour .in the absence of wind when the sky is clear. The quantity of heat transmitted by evaporation from the surface of a pipe which is frozen in the winter is insignificant, and may be taken not to exceed 4 per cent of the total amount of heat given off by the pipe. This figure is applicable on the assumption that the relative humidity of the air is 80 per cent, which corresponds to ordinary winter conditions. When the air is drier, the effect of evaporation is of course greater, but can nevertheless scarcely be supposed to be of any importance so long as the temperature of the air is low. Hence it follows that the quantity of heat removed from a 4 in. stave pipe in the absence of wind when the sky is clear is about the same as in the presence of wind when the sky is clouded. For the l in. stave pipe, on the other hand, the quantity of heat given off in the presence of wind when the sky is clouded is 43 per cent greater than in the absence of wind when the sky is clear, and about 13 per cent greater than the heat flow which is obtained from the ordinary approximate calculation which does not take into account the heat transmitted by radiation and evaporation. For a 4 in. stave pipe, the results of the ordinary simplified calculation are roughly in agreement with those of the exact calculation .

85
It follows from the above that the most dangerous case is met
with in the simultaneous presence of wind and cold weather, but this case is not frequent. In Sweden, it is reported that the velocity of wind on the five coldest days of a month is generally lower than the
monthly average. In any case, clear nights do not often occur at the same time as both windy and cold weather. As has already been
mentioned, freezing of a pipe takes several days, and it is scarcely probable that these severe conditions continue to exist during such
a long time.
2. Experience Regarding Freezing of Wood-Stave Pipes
Reference to experience concerning freezing of wood-stave pipes
and to rules for designing these pipes with due regard to freezing
are very scanty in the litterature (18, 50, 51, 52, 56, 59). In his
recent publication >>Experience Regarding Wood-Stave Pipes>> (78),
the Author has compared the theoretical conclusions in this respect with practical experience concerning 200 wood-stave pipes used in
Sweden. Only the most important final results of this investigation
are examined in what follows. Out of the total number of pipes
covered by this investigation, 27 per cent have frozen to a greater
or smaller extent. This shows that freezing is an important problem under Swedish climatic conditions.
In the statistical treatment of the material collected for the above
mentioned investigation, regard has been paid to the local variations
in the temperature of the water and the air by dividing the pipes
into groups according to favourable and unfavourable intake condi
tions and according to »northern» and >>southern>> climatic conditions.1),
No consideration has been given to the variations in the thermal
resistance due to differences in thickness of staves, seeing that this
thickness generally varied within very narrow limits, from 60 to 80
mm. The investigation has shown that the specific velocity of waterflow v
8 is a factor of paramount importance in determining whether
a pipe is liable to freezing. The material collected for the previously
mentioned investigation has been used as a basis for plotting the
1) The pipes situated in that region of Sweden where the mean temperature in
January is lower than -5° Care reckoned in the »Northern Climate Group,,, whereas
all other pipes are included in the »Southern Climate Group».

86
Percenf 09e of rrozen p!peS too--���,���-.,....--.�--.-�---.-�-.--,���
50
0
I : I \ ' : \ \ .
' : ,, I '• I I
' l ' ' � ' I � I
" \'
Southern dirndl e normal infdke conditions
/Northern c/imofe,unfovourobAinfoke condif ions
Norfhern cl/mole, nor mo/ infake condifions
.. ..
/0 20 40 80 200 400 800·/04
Specific velocify of wafer flow, m per sec
Fig. 30. Percentage of frozen wood-stave pipes as a function of specific velocity of water flow. This diagram is baaed on the material collected by the Swedish Water Power Association for an earlier investigation (78). The pipes are divided into three groups according to intake conditions and climatic conditions. In each group, the number of frozen pipes is expressed in per cent of the total number of pipes in which t he specific velocity of water flow is Jess than a certain definite value. For instance, in the group »Southern Climate•, 22 per cent of the total number of pipes in 1which the specific velocity of water flow is less than 0.004 m per sec have
frozen in operation.
diagram shown in Fig. 36 which represents the percentage of heavily frozen pipes in relation to the total number of pipes in which the
specific velocity of water flow is less than a certain definite value. This diagram has the character of a probability diagram showing the probability of freezing at various specific velocities of water flow. It is seen from Fig. 36 that the specific velocity of water flow should be higher than about 0.003 m per sec. under normal intake condi-

87
tions.1) Under unfavourable intake conditions, e.g. when the intake is situated close to an open stretch of rapids, there can be a risk of freezing even if the velocity of the water is high. In such cases, it is necessary to ensure that the water upstream of the intake can calm down in a pond which is covered with ice in the winter. Under very severe conditions, a considerable improvement can be achieved by regulating the bed profile of the watercourse upstream of the intake. Of course, it is also possible to increase the thermal resistance of the wall of the pipe. This should primarily be done by providing shelter from wind, e.g. by building a plank wall which completely surrounds the pipe. This view is confirmed by experiences concerning the pipes at Shawinigan,2) which are enclosed in a concrete shell, and at Harrselsfors, where no ice layer has been formed in the pipes since they were completely surrounded by a plank wall.
The formation of an ice layer provides additional safety against clogging of· the pipe by ice, first, because the ice constitutes a heatinsulating layer which progressively increases in thickness so long as the water continues to freeze, and second, because freezing involves a transformation of energy which is so considerable that it usually takes a long time until the ice layer reaches any notable thickness. In general, the thickness of the ice layer increases 25 to 50 mm per day.
These conclusions, which have been drawn from the diagram in Fig. 35 deduced by theoretical methods, are fully confirmed by experience relating to a pipe at Everett in the United States and
1) This value is applicable to non-insulated pipes made of staves about 75 mm (3 in.) in thickness. If the heat insulation of the pipe is substantially improved by special measures, e. g. by building o. plunk wall around the pipe, the conditions b1:come more favouruble. In that case, the velocity of water flow mo.y be lower than the value given in the above. The velocity of the water may be reduced to
0.13 L V=---Vs
111 D (64)
where 111 is the total thermal resistance (in m2 °C hour per kcal) of the wo.ll of the pipe and the heat insulation. In calculating this velocity, it is to be noted that the thermal resistance of wet timber is about 40 per cent of the resisto.nce of air-dry
timber. !) The two steel pipes at Shawinigan, 4.25 m in diameter and 180 m in length, are
heat-insulated by means of a thin concrete shell at a distan'Ce of 40 to 50 cm from the pipes. Experience shows that an ice layer, 30 to 40 cm in thickness, would have formed on the inside of the pipes if they had been operated at the full rate of water flow in the winter without this insulo.tion (52).

88
to the pipes at Holjebro and Skutskar in Sweden. Swedish experience
indicates that the risk of freezing can be reduced by locating the
intake at a considerable depth below the water level since the water
at a comparatively great depth is warmer, and is less mixed with
ice crystals (66, 73).
3. Summary Regarding Freezing of Wood-Stave Pipes
It follows from the above that it is often very difficult to estimate
the risk of freezing of wood-stave pipes. Under unfavourable intake
conditions, wood-stave pipes have frozen even when they were
appropriately constructed in other respects. Favourable intake
conditions, i. e. a high temperature of the water at the intake, can be
secured in several ways, e. g. by damming up the watercourse upstream
of the intake, so as to obtain smooth flow of water. It is vary impor
tant to ensure that the watercourse is covered with ice in the winter as soon as possible. In particular, the stretch of the watercourse
immediately upstream of the intake should flow smoothly, and should
be covered with ice. Furthermore, as the water in the surface layers
cools more quickly than in the deeper layers, it is advantageous to
place the intake at some depth below the water surface, so as to
obtain a higher water temperature in the winter.
TABLE 4. Relation between Minimum Velocity of Water Flow and Diameter of Pipe.
Diameter
of Pipe
m
Minimum Velocity of Wnter Flow, m per soc, nt Normal
Rnte of ,v nter l?low
Length of Pipe, m
200 I GOO I 1 000 I 2 000
O.o 1.5 3.0 (i,O
0.3 0.8 1.5 3.0
0.2 0.5 Lo 2.o
0.2 o .. r 0.8 1.5
l.O
2.o
��-'--�����-'-�����-'-�����-'-������
Under normal intake conditions in Sweden, the specific velocity
of water flow in non-insulated wood-stave pipes of normal wall
thickness should not be less than 0.003 m per sec. This implies that
the velocity of water flow should not be smaller than the values
given in Table 4 for various diameters and lengths of pipe.

89
The factors and practical measures which counteract freezing of wood-stave pipes can be summarised as follows.
1. Under normal intake conditions in Swedish climate, the specificvelocity of water flow in wood-stave pipes should be higher than 0.003 m per sec.
2. Unfavourable intake conditions should be avoided or improved.The water should preferably be drawn from a pond which is covered with ice in the winter. Immediately upstream of the intake, there should be no long stretches of rapids which are open in the winter. An improvement of intake conditions can also be achieved by regulation of the watercourse.
3. If open stretches of flowing water cannot be avoided, the intakeshould be placed at a depth of at least a few metres below the surface of the water. In that case, it is to be expected that the thickness of the ice layer in the pipe will be reduced since the concentration of ice particles in deep water is less than at the surface.
4. If an old pipe is to be reconstructed and provided with heatinsulation, it is in the first place advisable to equip the pipe with a shelter protecting it from wind. The shelter should completely enclose the pipe, and should be built at such a distance from the pipe as to permit inspection. If the empirical values given in the above indicate that a new pipe to be constructed may be expected to freeze to a considerable extent unless it is covered, the most radical solution is probably to cover the pipe with earth.

90
0. Losses of Head
1. Introduction
In the design of wood-stave pipes, it is necessary to take into
account the losses of head, e. g. losses in gates, entrance losses,
frictional losses, losses in bends and losses due to sudden expansion
and contraction, and sometimes also losses of velocity head, e. g.
at the inlet to the surge tower.
The loss of pressure head due to friction is dependent on the di
mensions of the pipe and the roughness of the internal surface of
the pipe. The coefficient of roughness of wood-stave pipes is general
lower than that of iron, steel, and concrete pipes. According to
SCOBEY (85), the carrying capacity of a wood-stave pipe is usually
15 per cent greater than that of a IO years old cast iron pipe or a
new riveted sheet steel pipe, and 25 per cent greater than that of a
20 years old cast iron pipe or a 10 years old riveted sheet steel pipe,
the dimensions and the head being equal. Consequently, at a given
rate of water flow, the frictional loss of head in a steel pipe, IO and
20 years old, is 30 and 60 per cent greater, respectively, than in a wood-stave pipe of equal dimensions. Furthermore, it is important
to note that the frictional loss of head in a steel pipe considerably
increases in the course of time. It is reported that the carrying
capacity of cast iron pipes, 0. 7 5 m in diameter, decreases to about
60 per cent after 40 years of service. At a given rate of water flow,
this implies that the frictional loss of head increases nearly three
times. In wood-stave pipes, on the other hand, the loss of head due
to friction is generally independent of the age of the pipe.
2. Formulae for Calculation of Frictional Loss of Head
Several formulae are available for the calculation of the frictional
loss of head. The most common of these formulae are given below.
I. CHEZY.
(65)

According to GANGUILLET and KuTTER,
1 0.00155 -;- + 23 +
I C = --�--------
( 0.00155
) n
1 + 23 + J VR
91
where n is the coefficient of roughness of the pipe, I is the frictional loss of head, and R is the hydraulic radius. For wood-stave pipes, according to HORTON (39), n varies from 0.010 to 0.013.
2. HAZEN and WILLIAMS.
V = C 0. 8 5 R0•03 J0·5,! (66)
For wood-stave pipes, c = 120 is regarded as an appropriate value (31).
3. SCOBEY.
4. MANNING.
V = 122 R0.05 J0,556
V = M R2/3 11,2
where M = - (n = KuTTER's coefficient given in the above). n
(67)
(68)
In spite of its intricate structure, Cmi:zy's formula, with the value of C calculated according to GANGUILLET and KuTTER, is very common in the United States, and its use is facilitated by alignment charts. As regards wood-stave pipes, HAZEN and ,VILLIAM's formula is based on inadequate and irregular test data (the value of c varied from 111 to 152), whereas ScoBEY's formula is based on very comprehensive tests, and seems, therefore, to be particularly suited to wood-stave pipes. The greatest advantage of MANNING's formula (63) is the fact that it can be used for calculating the frictional loss of head both in pipes and in open conduits, but the coefficient M is slightly dependent on the velocity of water flow and on the hydraulic radius. HELLSTROM (33) and FoRCHHEIMER (25) have pointed out that the exponent of I is greater than 0.50 as in lVlANNING's formula. As a general rule, this exponent varies inversely as the degree of

,
92
roughness. ScoBEY's formula appears to be most reliable, but it seems that MANNING'S formula is nevertheless to be preferred on account of its simple structure.
The valuable results obtained by ScoBEY ought to be applicable to MANNING'S formula if the value of the constant M is appropriately chosen. If we compare ScoBEY's final formula with MANNING'S equation, it can readily be demonstrated that
V0.101
M = 84 do.os2 (69)
Consequently, according to SCOBEY, when the velocity of �ater flow is 1 m per sec and the diameter of the pipe is 1 m, the corresponding value of M is 84. Moreover, it follows that M is approximately constant, so long as the value .of v/D is invariable. This is illustrated by Table 5.
TABLE 5. l'alues of M Resulting in the Same Frictional Loss of Head as ScoBEY's
Formula lVhen Inserted in MANNING'S Formula.
v/D I M I Per Cent I 0.5 80 94
l.O 84 100 2.o !ll 107 30 04 112
When the velocity of water flow (in m per sec) in a pipe is numerically equal to the diameter of the pipe (in m), that is to say when v/D = 1, ScoBEY's values correspond to M = 84 in MANNING'S formula.
For HAZEN and WILLIAMS' formula, it can similarly be shown that the corresponding value of M also increases as the ratio of v/D becomes greater. For v/D = 1, c = 120 corresponds to M = 81.
Concerning MANNING'S formula, it is furthermore important to note that, according to American practice, KUTTER's coefficient can
1 be used directly since M = -. Therefore, the limit values of n
n
given by HORTON (0.013 and 0.010) correspond to M = 77 and M = 100, according to the character of the internal surface of the pipe.
..

93
It follows from the above that the value of M is included in the
interval from 80 to 90 under normal operating conditions, according
to the unanimous opinion of ScoBEY, HAZEN and WILLIAMS, and
HORTON (KuTTER's coefficient).
3. Observed Frictional Loss of Head
In connection with the stress measurements described in Chapter II, the Author has obtained some data on the frictional loss of head
observed in the wood-stave pipes at Sikfors and Gideabruk. These data are briefly summarised in what follows.
Sikfors.
The frictional loss of head was determined by levelling the water
surface at two points, viz., close to the intake and at the surge tower.
The distance between these points was 441 m. At the velocity of
water flow of 3 m per sec, the observed frictional loss of head was
0.81 m corresponding to M = 81 (v/D was about 0.94). The water level in the surge tower has been observed by the staff of the hydroelectric station at various loads. The observed values have been re
duced so as to take into account the velocity head and the entrance loss.
It was found that the value of M varied from 78 at v = 1.4 m per sec. (v/D = 0.45) to 85 at v = 2.S m per sec (v/D = 0.9).
Gideabruk.
The Author has examined the results obtained from some measure
ments of the frictional loss of head which were conducted by Mr. E. RAMVALL, C. E. These measurements were made by levelling the
water surface at both ends of the pipe. The distance between these
points was 480 m. When the velocity of water flow v was 2 m per sec (v/D = 0. 7), M was 73, and at v = 3. 1 m (v/D = 1.0), M was 75.
Thus, the values of M were slightly lower than at Sikfors, probably
because the pipe was partly in a very bad condition.
4. Conclusions Regarding Loss of Head
On the whole, the results of the measurements made at Sikfors confirm the correctness of the values of the coefficient M in MAN
NING'S formula given above. On the other hand, the value of M
obtained from the measurements at Gideabruk was about 10 per

94
cent lower. This indicates that the value of M can be slightly below
normal when the pipe is in a bad condition from a hydraulic point
of view. From the above we can conclude that the value of M varies within
the approximate limits from 70 to 90 under normal conditions (v/D
between 0. 5 and 2. O). On the basis of this conclusion, Table 6 gives the probable values of M in relation to the ratio of the velocity of
water flow to the diameter of the pipe and the condition of the interior of the pipe from a hydraulic point of view.
TABLE 6. l\lANNING's Coefficient M for Wood-Stave Pip68.
MANNING'S Coefficient M v/D
Hydraulic Condition of Pipe Per Sec.
Bud I Normal I Good
0.5 71 76 81
l.O 75 80 85
2.0 81 87 92
3.0 84 90 95

IV. Economic Factors
A. General
Wood-stave pipes are generally more economical than sheet steel,
cast iron, and concrete pipes.
The advantages of wood-stave pipes are:
1. Low initial cost of wood-stave pipe.2. Low cost of transport.
3. Simple and rapid assembly.
4. Easy adaptation to the profile of the ground. Curved sections ofcontinuous stave pipes can be built without using any special devices.
5. The interior of wood-stave pipes is not liable to attack by adulte
rants, such as carbonic acid or other acids. In fact, these pipes
are specially used for conveying acids.6. Small frictional loss of head, and hence greater carrying capacity.
7. If correctly constructed, great length of life; practically as great
as that of sheet steel and cast iron pipes.8. Greater safety against freezing.
9. Insensitivity to temperature stresses.
The drawbacks of wood-stave pipes are:
1. Sensitivity to external pressure caused by earth covering or due
to surges.2. Greater leakage than in other pipes.3. Risk of decay.
4. Cannot be operated when half-filled (considering the danger of
decay).5. The earth used for covering embedded pipes should be relatively
watertight.
Most of the advantages and drawbacks enumerated above have
already been dealt with in this book. In what follows, we shall there
fore confine ourselves to some considerations concerning the eco
nomic factors to be taken into account in the design of wood-stave pipes.

96
Wood-stave pipes are naturally most economical at low water pressures, whereas iron and steel pipes ar� most advantageous when the pressure exceeds a certain definite limit value. This limit is of course dependent on the prices of iron and stee_l, but it increases as timber becomes cheaper in comparison with iron. The cost of transport is also of importance. In 1924, the economical limit pressure was about 60 to 70 m ( 4, 62). This figure was applicable to pipes from 0.5 to l.O in diameter. For larger diameters, the limit of head is lower .1) In general, a prefabricated wood-stave pipe ready for assembly is considerably cheaper than an iron or steel pipe (about 50 to 75 per cent of the cost of the latter). If the wood-stave pipe is completely finished, this difference is smaller.
In the design of wood-stave pipes, the diameter of the pipe should be determined so as to reduce the annual cost to a minimum, while taking into account the loss of head. This diameter, which is termed >>the most economical diameter>>, is generally larger for wood-stavepipes than for iron and steel pipes on account of the lower cost ofthe wood-stave pipes. The most economical diameter can be calculated as follows.
B. Calculation of Most Economical Diameter
If the initial cost of a wood-stave pipe is assumed to be a function of the diameter, the most economical diameter2) can be determined by purely mathematical methods. The problem is simplified if we assume that the initial cost is directly proportional to the diameter. Experience shows that this assumption is approximately in agreement with the actual conditions, at least so long as the head is not too high.
The annual cost k, in per cent, is taken to include depreciation, interest, and maintenance charges. The maintenance charge may be supposed to be 1 per cent.
1) The maximum head that is practically possible is much higher. According to
WHITE (97), this limit of head is about 75 m for a pipe 3.0 m in diameter, and is of
course higher for pi:,;ies of smaller diameter. 2) The length of the pipe is 11SSumed to be so great that the entrance losses, etc.,
are negligible in comparison with the frictional loss of head, and that the cost of the
intake, the surge tower, etc., is relatively independent of the diameter or is small
in comparison with the cost of the pipe.

97
a. The annual cost per metre of pipe is
(70)
b. If the loss of head is calculated from MANNING'S formula, theloss of power per metre is
82.4 Q3
8 QI =M2 D1613 = const. · Q3 kW per m (71)
If the rate of water flow is constant, it is directly inserted in the above formula. On the other hand, if the rate of water flow is variable, and is given by the values
Qi during the period of time Ti ,
Q2 during the period of time T2, etc.,
and if the total time of operation is Ti + T2 + ... = T101, then the
loss of power is
const. Qf T1 + Q� T2 + ....
Tiot
The following calculation is facilitated if we use a constant rate of water flow Qm which gives the same loss of power on the average during the period T101 • We obtain
----------
v Qf T1 + Q� T2 + ....Qm = Tiot
(72)
If the average price of power1) is w Swedish kronor per kW per year, the annual cost of the loss of power is
82,4 Q!, w
M2 D1013 Swedish kronor per m (73)
1) Special regard must sometimes be paid to the seasonal variations in the price
of power.

98
Consequently, the total annual cost A is the sum of the costs givenby Eqs. (70) and (73) le 82.4 Q:,,
A= 100 a D + w Mz n1013 (7 4)
Now the diameter D is to be determined so that A should be aminimum, that is to say, dA
-=0dD
By solving the above equation, we obtain the most economicaldiameter D in metres (44 000 w)3'10
D Qono= lcall12 111 (75)
From Eq. (71) we can also compute the corresponding velocity ofwater flow, i.e. the most economical velocity v in m per sec V _ n110 ( k a M2 )113- 21 300 w (76)
By inserting the mean value M = 80 in conformity with the foregoing chapter, we obtain ( W )3 10 D = 6, !l k a
Q�; 10
( k a)1 3 V = 0. 3 -;;; D119
(77)
(78)
Since the values of D are included within the range from 0. 2 5 m to5.o m, the term n119 does not vary considerably from unity. Fordesign purposes, we can put approximately
(79)

99
At a given rate of water flow, this velocity corresponds to a definite diameter of the pipe. If this diameter is known, the value of the velocity can be adjusted, if desired, through multiplication by the factor D1 i9 which is tabulated below.1) For instance, if the diameter of the pipe is 4 m, the approximate value of the velocity of water flow should be increased by 17 per cent.
C. Summary Regarding Economic Factors
It follows from the above that the most economical velocity of water flow is dependent on the annual cost le expressed in per cent of the initial cost of pipe,2) the factor a in the expression for the initial cost of pipe a · D Swedish kronor per metre, and the price of power w Swedish kronor per kW per year, but it is only slightly influenced by the diameter of the pipe. The value of a increases as the pressure head becomes greater. At the present time, the magnitude of a is of the order of 100 to 150 Swedish kronor per metre length of pipe per metre of diameter at low heads, but should be increased as the head becomes greater. The increase in a, expressed in per cent, is approximately equal to the increase in head, expressed in metres. If we assume that a is 150 and that the price of power is 50 Swedish kronor per kW per year, we obtain
3
Vappr = V 0. !l le (80)
If the pipe will be in use 40 years and if the rate of interest is 4 per cent, we get k = 6. I and vapp
r = 1. 7 7 m per sec. Hence we
1) The factor DI O varies with the diameter as follows
D in m . . . . . . . . . . . . . . . 0.25 0.5 1 2 3 4 5 6 D1/9 •........•.•..•.. 0.86 0.02 1.oo 1.os 1.13 l.li 1.20 1.22
2) The annual cost k, inclusive of 1 per cent maintenance charge, can be obtainedfrom the following table.
Rate of Annual Cost in Per Cent of Initial Cost
Interest Numbers of Years of Use of Pipe
Per Cent 10 I 20 I 30 I 40 I 50 I 60
3 12. i 7.7 6.1 5.3 4.9 4.6
4 13.3 8.4 6.8 6.1 5. 7 5.4' I
5 14.0 9.o 7.5 6.8 6.5 !
6.:1 -

,•
100
Ann1JOI cost, Swedish kronor per mt!'lrt! of p,pe
rrys 5oi--o,..,-,...¥=------+----:-----+-------; s
4
J
2
f
oL ___ _J_ __ i....__.I=:===�o
�o 4.o 5.0 6.o
D1omefer of pipe, m
Fig. 37. Ynriation in total cost per metre of wood-stave pipe, i. e. initial cost plus loss of head expressed in terms of cost of power, with diameter of pipe at rate of water flow of 38 m• per sec at specified prices of power nnd pipe materrnls. The
lowest total cost is obtained when tho diameter of the pipe is 4.5 m.
obtain the following relation between the most economical velocity of water flow and the diameter of the pipe
0.5 1 2 3 4 5 Diameter, m . . . . Velocity, m per sec l.ti5 1.77 1.0 1 2.00 2.07 2.12
On the other hand, if we have to design a pipe for a given rate of water flow, say 20 111
3 per sec, the procedure is as follows. vnppr = I. 7 7 m per sec, as given above.
20 Cross-sectional area = -
1-- = 11.3 m2
• Hence Dai,pr = 3.8 m .. 77
From the table in Footnote 2, p. 99, we obtain D;1�,r = 1. 1 6, and
therefore v = 1.16 • I. 7 7 = 2. o 6. This velocity corresponds to D = 3.5 m.
Fig. 37 gives an example showing the variation in total cost with the diameter of the pipe. It is seen from this diagram that the total cost curve is comparatively fiat in the neighbourhood of the minimum. Consequently, small errors in the determination of the diameter have no appreciable effect on the total cost.

101
The calculations carried out in this section are based on some
simplified assumptions regarding the prjce of power, MANNING'S
coefficient M ( = 80), and the cost of pipe. The price of power may of course be slightly higher or lower, but the value of 50 Swedish
kronor per kW per year seems to be an appropriate average for large
power companies at the present time. Small companies often sell power at a higher price. As has been shown on p. 94, MANNING's
coefficient may vary from 70 to 90. In other words, the possible variations in the most economical velocity of water flow calculated
on the assumption that M is equal to 80 do not exceed 10 per cent. After determining the most economical diameter, it is of course necessary to check the correctness of the assumed cost of pipe. For
this purpose, all those items of the initial cost which vary with the diameter must be calculated in detail. However, the method of design outlined in this section may be considered to be fully satis
factory for long pipes on the assumptions made in the above. The
result indicates the interesting circumstance that the most economical velocity of water flow in wood-stave pipes is more or less constant, irrespective of the diameter of the pipe.
After having made this economic calculation, it is furthermore necessary to take into consideration other factors influencing the
design, such as the risk of freezing, which may sometimes call for an increase of the velocity of water flow, and the surge conditions and internal wear, which determine the maximum allowable velocity.

•
•
•
' •
•
;
V. Modern Wood-Stave Pipes
In order to demonstrate the possibilities of wood-stave pipes at the present time and to illustrate the types used by various manufacturers, a description is given in this chapter of the following pipes .
A.
B. C.
D.
E.
F.
G.
H.
I.
J.
Pressure pipe at the Dammfallet Hydro-Electric Station. Pressure pipe at the Furudal Hydro-Ele�tric Station. Pressure pipe at the Kalltorp Hydro-Electric Station. Water supply main from Tisaren to the K varntorp Shale Oil
Plant. Water supply main from Nolby to the Stockvik Works. Water supply main of the Oskarstrom Sulphite Mills . Water supply main of the Alvenas Cellulose Wool Factory. Pressure pipe at the Torsby Hydro-Electric Station. Qroup stave pipe with covered end joints. Shoes, bands, and end joints manufactured by the Boxholm Co.,
Boxholm, Sweden, and the Skandinavisk Traeror A/S, Oslo, Norway.
IC ·wood-stave pipe manufactured by the AB Armeracle Traror, Gothenburg, Sweden.
A. Pressure Pipe at the Dammfallet Hydro-Electric Station
Manufacturer Owner: ... . Built in .. . Principal data .
"
Boxholms AB. Svenska Kullagerfabriken (SKF), Hofors. 1942 (Replaced an older pipe built in 1894). Length 650 m. Internal diameter 2. o 111. Head
4 to 34. 5 m, including an allowance of 50 per cent for surges. Non-covered, carried on supports, tista?ce from centre to centre 3. 2 m and 2.o m. Group stave type. Velocity of water flow 2. 4 m per sec.
•

Staves ...... .
Bands
Shoes ....... .
Supports ..... .
103
Fig. 38.
Pine heartwood staves, 2 1/2 in. by 6 in. (H3 mm by 150 mm}, with triangular tongue-andgroove joints. Heartwood side facing outwards. End joints provided with copper plates, 30 111111 by 3 mm, and covered with 2 mm thick tar board and flat iron hoops, 90 mm by 2. 5 mm, held together by 2 bands.
Two-part special rolled section bands, 24 mm by 12 111111. Distance from centre to centre 81 to 290 111111. Steel grade St 37. One part of the band is upset and threaded (B. S. W. 7/8 in.) over a length of 130 mm at both ends. The other part of the band is upset at both ends so as to form heads. The bands are coated with red lead paint.
Centric type. Made of 9. 5 111111 thick hot-bent sheet steel. Length 140 mm. Rust-proofed by tar treatment.
Concrete supports. Distance from centre to centre 3. 2 m in the straight section and 2. fl m in the curved section.

104
B. Pressure Pipe at the Furudal Hydro-Electric Station
Manufacturer Owner ... . Built in .. . Principal data .
Staves ...... .
Bands ...... .
Shoes ....... .
Supports ...
Boxholms AB. Korsnas Sagverks AB.
1943. Length 1 670 m. Internal diameter 2.4 m.
Head 14 m. (Static head). The greater part of the pipe, 1 640 m in length, is laid on a bed and covered with earth. The remaining section of the pipe is non-covered and carried
on supports. Group stave type. Velocity of water flow 1. 9 m per sec.
Pine staves of good quality, 2 1/2 in. by 7 in. (63 mm by 175 mm), with triangular tongueand-groove joints. Heartwood side facing outwards. Impregnated on the outside with a mixture of tar and creosote. End joints provided with copper plates, 26 mm by 2 mm, and covered with 2 mm thick tar board and flat iron hoops, 90 mm by 2. 5 mm, held together by 2 bands.
Round bands, 7/8 in. in diameter. Distance from centre to centre 250 mm. Steel grade St 44. The bands are upset so as to form a head at the one end, and are threaded at the other end.
Centric type. Made of 9. 5 mm thick hot-bent sheet steel. Length 250 mm. Rust-proofed by tar treatment.
Concrete supports. Distance from centre to centre 3. 15 m. Thickness 260 mm. The arc of contact between the pipe and the supports is equal to 40 per cent of the circumference of the pipe.

105
Fig. 39 u .
Fig. 39 b.

106
C. Pressure Pipe at the Kalltorp Hydro-Electric Station
Manufacturer Owner ... . Built in .. . Principal data .
Staves .....
Bands
AB Armerade Trari:ir. Sjuntorps AB, Sjuntorp. 1944 to 1945. Length 150 m. Internal diameter 1. o m. Head
5 to 18 m. Non-covered, carried on supports, distance from centre to centre 3.5 m. Conti-nuous stave type.
� Pine staves, 2 1/2 in. by 6 in. (63 mm by 150mm), with triangular tongue-and-groove joints. The timber is impregnated with Boliden Salt (an arsenic salt). End joints provided with galvanised iron plates, 25 mm by 2 mm.
Flat bands, cross-sectional area 2 cm2, distance
from centre to centre 143 mm. One end of the band is upset and threaded (B. S. V\
7
. 5/8 in.). The other encl is welded to the shoe. Coated with anti-corrosive paint.
Shoes ....... . Centric type. Made of 8 mm thick sheet steel. One end of the band is inserted in the shoe and fillet-welded.
Supports . . . . . . Concrete supports. Distance from centre to centre 3. 5 m.
•


108
D. Water Supply Main from Tisaren to the Kvarntorp Shale Oil
Plant
Manufacturer Owner ... . Built in .. . Principal data .
Staves ..... . .
Bands ...... .
Shoes .
Supports ..
Boxholms AB. Svenska Skifferolje AB. 1946. Length 11 940 m. Internal diameter O. o m.
Maximum head 40 m. One part of the pipe, 9 440 m in length, is non-coYered and carried on supports, distance from centre to centre 4.4 m. The other part, 2 500 m in length,
is laid on a bed and coYered with earth. Group stave type. Velocity of water flow
1.25 m per sec. Pine heartwood staves, 2 in. by 4 1/2 in. and 2
in. by 5 in. (50 mm by 113 mm and 50 mm by 125 mm), with triangular tongue-andgroove joints. Heartwood side facing outwards. End joints provided with galvanised sheet iron plates, 30 mm by 3 mm, and covered with 2 mm thick tar board and flat iron hoops, 75 mm by 2 mm, held together by 2 bands.
Special rolled section band , 16 mm by 8. 25 mm. Distance from centre to centre 59 to250 mm. Standard steel St 44. One endof the band is upset and threaded (B. S. W.5/8 in.) over a length of 110 mm. The otherend is upset so as to form a head. Rustproofed by tar treatment.
Centric type. Made of 7 mm thick hot-bent sheet steel. Length 130 mm. Rust-proofed by tar treatment.
Iron supports on concrete bases. Distance from centre to centre 4.4 m. Thickness 150 mm. The arc of contact between the pipeand the supports is equal to 40 per cent ofthe circumference of the pipe.

109

llO
E. Water Supply Main from Nolby to the Stockvik Works
Manufacturer Owner .... . Built in ... . Principal data .
Staves ...... .
Bands ...... .
Shoes .
Supports
Boxholms AB. Stockholms Superfosfat Fabriks AB. 1944. Length 5 407 m. Internal diameter 0. 7 5 m.
Head 55 m. Carried on supports, distance from centre to centre 4 m, and covered with earth. Group stave type. Velocity of water flow 1. 1 m per sec.
Pine heartwood staves, 2 in. by 4 1/2 in. (50 mm by 113 mm) and 2 in. by 5 in. (50 mm by 125 mm}, with triangular tongue-andgroove joints. Heartwood side facing outwards. End joints provided with stainless steel plates, 26 mm by 2 mm, and covered with 2 mm thick tar board and flat iron hoops, 80 mm by 2 mm, held together by 2 bands.
Special rolled section bands, 20 mm by 10. 5 mm. Distance from centre to centre 87 to
238 mm. Standard steel St 44. One end ofthe band is upset and threaded (B. S. "\V.3/4 in.) over a length of 120 mm. The otherend is upset so as to form a head. Rustproofed by tar treatment.
Centric type. Made of 11 mm thick hot-bend sheet steel. Length 150 mm. Rust-proofed by tar treatment.
Concrete supports. Distance from centre to
centre 4 m. Thickness 160 mm. The arc of contact between the pipe and the supports
is equal to 40 per cent of the circumference of the pipe.

11 l

112
F. Water Supply Main of the Oskarstrom Sulphite Mills
Manufacturer Owner .... Built in Principal datli .
Staves ...... .
Bands ...
•
Shoes ..
Supports
AB Armerade Traror. Oskarstrom Sulphite Mills AB. 1934. Length 280 m. Internal diameter 0. 9 m. Head
4 m. Non-covered, carried on supports, distance from centre to centre 1 m. Continuous stave pipe.
Pine staves, 2 1/2 in. by 6 in. (63 mm by 150 mm), with triangular tongue-and-groove joints. Encl joints provided with galvanised
iron plates, 25 mm by 2 mm. Coated with Inertol on the outside.
Round bands, 5/8 in. in diameter. Distance from centre to centre 300 mm. Both ends are threaded. Rust-proofed by tar treatment.
Eccentric type. Made of cast iron. Rustproofed by tar treatment.
Wood supports carried on steel beams. Distance from centre to centre 1 m.
Fig. 43.

113
G. Water Supply Main of the Alvenas Cellulose Wool Factory
Manufacturer Owner .... Built in . . . Principal data .
Staves ...... .
Bands ...... .
Shoes ....... .
8
AB Armerade Traror. AB Cellull. 1942 and 1943. Length 320 m. Internal diameter 0. 6 111. Head
20 m. This pipe is immersed in water. Continuous stave type.
Pine staves, 2 in. by 5 in. (50 nun by 125 mm), with triangular tongue-and-groove joints. End joints provided with galvanised iron plates, 25 mm by 2 mm.
Round bands, 5/8 in. in diameter, distance from centre to centre 150 mm. Both ends are threaded. Rust-proofed by tar treatment.
Eccentric type. Made of cast iron. Rustproofed by tar treatment.
Fig. 44.

114
H. Pressure Pipe at the Torsby Hydro-Electric Station
Manufacturer Owner ... . Built in .. . Principal data .
Staves ...... .
Bands ...... .
Shoes ....... .
Boxholms AB. Billeruds AB. 1940. Length 106 m. Internal diameter 2. o m. Head
7. 5 to 15 m, including an allowance of 50 per cent for surges. Non-covered, carried on supports, distance from centre to centre 3. 4 m. Group stave type. Velocity of water flow
2. o m per sec. Pine heartwood staves, 2 1/2 in. by 5 1/2 in.
(63 mm by 138 mm), with triangular tongueand-groove joints. Heartwood side facing outwards. Impregnated on the outside with a mixture of tar and Carbolineum (a carbolic acid product). End joints provided with copper plates, 30 mm by 3 mm, and covered with tar board, 2 mm in thickness, and flat iron hoops, 80 mm by 2.5 mm, held together by 2 bands.
Two-part special rolled section bands, 20 mm by 10.5 mm. Distance from centre to centre 100 mm. Steel grade St 44. One part of the band is upset and threaded (B. S. W. 3/4 in.) over a length of 100 mm at both ends. The other part of the band is upset at both ends so as to form heads. The bands are coated with red lead paint.
Centric type. Made of hot-bent 8 mm thick sheet steel. Length 125 mm. Rust-proofed by tar treatment. Concrete supports. Distance from centre to centre 3.4 m.

115
Fig. 45.

116
I. Group Stave Pipe with Covered End Joints
Manufacturer ...
Principal data .
Group joints . .
Staves ..... .
Bands ...... .
Shoes ....... .
Boxholms AB. Fig. 46 shows, a pipe sample
presented by the manufacturer to the Institu
tion of Hydraulic Engineering at the Royal Institute of Technology, Stockholm. This
pipe sample is used for instruction. Internal diameter 0. 6 m. Length of joint 1.1 m. Each group consists
of O staves. Pine heartwood staves, 42 mm by 115 mm,
with triangular tongue-and-groove joints. End joints provided with copper plates, 30 mm by 3 mm.
Special rolled section bands, 16 mm by 8 mm. One end of the band is upset and threaded
(B. S. W. 5/8 in.). The other end is upset so as to form a head. Rust-proofed by treatment.
Centric type. Made of hot-bent sheet steel.
Length 130 mm.
Fig. 46.

117
J. Shoes, Bands, and End Joints Manufactured by the Boxholms
AB, Boxholm, Sweden, and the Skandinavisk
Shoe.
Traeror A/S; Oslo, Norway
Upset and threaded
Nut����--. Washe������;:;;:l--./..!/J
Fig. 47.
End joint with flat iron hoop and special rolled section band.
Inserted copper phfe I
Fig. 48.

118
K. Wood-Stave Pipe Manufactured by the AB Armerade Traror,
Gothenbur�, Sweden
This example shows a wood-stave pipe for water supply systems. The pipe is supplied in prefabricated units from 7 to 9 m in length.
The pipe units are fitted together by means of group stave joints.
All end joints are covered with flat iron hoops held together by
ordinary round bands.
I
I
i
I i :
I
Cccenlric shoe
finished joint between two ports of grovp stun, pipi!
r F/ut iron hoop
�
Length of joint 60 cm_
' I
I
!
I I
I
I I
Cross secfion of stove
Fig. 49.
Section A-A
Enr/ of port of 9fJJI.P sfove/j,1pe, showing
projec ing stuw grovp
Al I
!II
ill I
Longifudinol section of joinf
ii
ll

VI. Appendices
APPJ£NDIX A
Design of Wood-Stave Pipes Carried on Supports
Application of the Stave Pile Method on the Assumption that the
Load-Carrying Capacity of the Pipe is Equal to the Siim of the Load
Carrying Capacities of the Separate Staves.
Fig. 50. Schematic cross section of pipe showing notations used in Appendix A.
We make the following assumptions. The pipe is carried on supports. The distances from centre to
centre of supports are equal. The pipe is acted upon by the weight 'of the water and the weight of the pipe shell only. The number of staves in a cross section of the pipe is denoted by n. No frictional forces act between the staves. The pipe is deformed in a vertical plane, and the deflections of all staves in the same cross section are equal. The staves are symmetrical with respect to both the horizontal and the vertical diameter of the pipe.
All staves are assumed to be equal in size. Their breadth is b and their thickness is d, see Fig. 50.
The principal moment of inertia of a separate stave is
db3 bd3
]max =
12och ]min =
12

120
For a stave at an angle <p with respect to the vertical diameter of the pipe, the moment of inertia is
I= ]max sin2 <p + Jmiu cos2 <p
or
I= I mnx ( sin2 <p + :: cos2 <p)
The moment of inertia of the whole cross section of the pipe 1s obtained by summing up the moments of inertia of n staves
n (
d2
) Jtotnl = I max f' sin2 <fn + b2 COS2 <p11
This expression becomes
1 ( d2 ) Jtotnl = 2 n Jmnx 1 + b2
or
The polar moment of inertia of a separate stave is
and hence
Jtotnl = 2 n ]pol
.1v.laxi1nu1n Bending Stress in Staves.
(81)
Since it has been assumed that the deformations of all staves in a cross section of the pipe are equal, it follows from the differential equation of a beam that the ratio M/1 in a given cross section of the pipe is constant. Consequently, the moment acting on the whole cross section is distributed among the separate staves in proportion to their respective moments of inertia. The load-carrying ability of the whole cross section is determined by the stress in the most

121
heavily strained staves, that is to say in those staves which have the greatest moment of inertia or, in other words, in the staves standing on the narrow edge, i.e. the staves on the sides of the pipe. If the moment acting on the cross section as a whole is denoted by ..ilftotui, the moment acting on the most heavily stressed stave is
Jmnx M= -[-Mlotaltotnl
If we disregard the fact that the staves are jointed, we can assume that the moment distribution in the pipe as a whole corresponds to that in a continuously supported beam. In that case, the maximum moment, which occurs at the supports, can be written
Mtotnl
r n D2 L;
48
By inserting the moment of inertia and the moment of resistance of the most heavily stressed stave, we obtain the maximum tensile stress in bending
a=
r DL; b2
48 Jpol
and hence the maximum distance between the supports
V4 a bd ( d2 )
La = yD 1 + b2
(82)
(83)
Since the ultimate tensile strength of wet timber is relatively low (it can be as low as 50 per cent of the strength in an air-dry state), the allowable stress for pine and spruce staves should not exceed 60 kg per cm2
• In that case, the factor of safety is about 3. This factor of safety makes an allowance for the fact that the staves are jointed, and that the structure is therefore slightly weakened. For a = 60 kg per cm2
, we obtain, with a sufficient degree of accuracy, an appropriate value of the distance between the supports
1/24 b0
de ( d�) L,. = 100 D" 1 + b� (84)

122
All lengths are expressed in centimetres. If the pipe is inclined ·at an angle a with respect to the horizontal
plane, the distance between the supports measured along the slope is Lc/V cos a according to SCHWERIN (84).
Normal Forces in Transverse Plane.1)
In the preceding section it has been assumed that the pipe is deformed in the vertical plane only. Consequently, the horizontal displacement is zero.
l. Weight of Water.The deflection of the pipe can be written
(85)
where k1 is a constant which is dependent on the distance between
the supports, etc. The radial displacement of a separate stave is
N q - --:;:
17 = k1 b
I = t5 cos cp
min
N ]min q - - = y n 1·2
-- cos cp r bJtotul
By inserting the values of Jm!n and Jtotnt, we obtain
N d2
q---:;: = y r b2 + a2 costp
The water pressure is
q = y r ( 1 + cos rp)
[ b2 +2a2 ] ·: N = r r2 1 +
b2 + d2 cos 'P
(86)
(87)
(88)
1) The calculations in this section were made in collaboration with K. J. SUND·
QUIST, C. E.

123
Hence we obtain the normal forces due to the weight of the water
d2 N-,.
2 = - y r _d_2_
+_b
_2
y r2
Y r2 [2 + d2
]d2 + b2
If b � d, we get
N ,...., y r2 ( 1 + cos rp)
2. Weight of Pipe Shell.
For the weight of the pipe shell, we obtain analogously
N d2
G cos <p - -;: = 2 G b2 + d2
cos <p
If b � d, we get
b2-d2 ·: N =Gr
b2 + d2 cos <p
N�Grcosrp
(89)
(90)
(91)
(92)
(93)
(94)
It is of interest to note that the normal forces calculated from Eqs. (92) and (94) on the assumption that b � d agree with those computed by THOMA (93) on the basis of the membrane theory, that is to say, on the assumption that the wall of the pipe cannot withstand any moments.

APPENDIX B
Stress l\1easurentents l\1ade at Sikfors
The following notations are used in the diagrams.
Observed stresses in the bands.
X Actual stress.
V Difference between stresses in the bands observed when the pipe was subjected to a certain pressure and after the pipe was emptied (i. e. not including the no-load stress).
Calculated stresses in the bands.
O Stress calculated on the assumption that the compressive stress pin the surface of the contact between the staves is zero.
The figures at the points marked with the above symbols express the stress in kg per cm2
•
When readings taken at different times and different pressures are reproduced in the same diagram, the points at which the stresses were observed at the same time are joined by dash lines.

SIKFORS.
Test No. I.
Head 4.87 rn.
Distance from centre to centre of bands 60. 5 cm.
125
The surface of the ground was on a level with the horizontal diameter
of the pipe.
Internal diameter of the pipe 3. 2 m.
NOTE. The test was interrupted after the band had been loosened
as much as possible. The pipe leaked profusely. It is probably
that the band was not completely relieved from stresses after
loosening, and the actual stresses may therefore be slightly higher
than the observed values.

126
SIKFORS.
Test No. 2. Varying heads, see below. Distance from centre to centre of bands 35. 5 cm. The surface of the ground was 0. 2 m below the horizontal diameter.
of the pipe. Internal diameter of pipe 3. 2 m. The readings were taken at the following heads A 9. 1 !l m,
B 3.84 m, C 1.5 to 1 m.
NOTE. The stresses observed at the crown of the pipe were remarkably high. This seems to be due to the fact that the tensometers were attached close to the shoe and on both sides of the band. The shoe was of the eccentric type. Therefore, it produced bending stresses in the band, and these stresses exerted a particularly strong influence on the nearest tensometer.

SIKFORS.
Test N�. 3, A and D.
Head 1.07 and 8.12 m.
Distance from centre to centre of bands 35. 5 cm.
127
The surface of the ground was 0. 2 m below the horizontal diameter of the pipe.
Internal diameter of pipe 3. 2 m. The readings were taken at the following heads A 1.07 m,
D 8.12 m.
Regarding the stresses observed at the crown of the pipe, see Test
No. 2, Note.

,,.
128
SIKFORS.
Test No. 3, B and C.
Head 9.19 and 1.3 to 1.5 m.
ff40 'v- -I
Distance from centre to centre of bands 35. 5 cm.
The surface of the ground was 0. 2 m below the horizontal diameter
of the pipe.
Internal diameter of pipe 3. 2 m.
The readings ware taken at the following heads B 1. 3 to 1. 5 m.
C 9.19
Regarding the stresses observed at the crown of the pipe, see Test
No. 2, Note.

APPENDIX C
Stress Measurements Made at Harrselsfors
Notations see appendix B.
HARRSELSFORS.
Test No. 1. Head 5. 78 m.
Distance from centre to centre of bands 19.5 cm. The surface of the ground was 0. 3 m below the horizontal diameter
of the pipe. Internal diameter of pipe 3. o m.
9

130
HARRSELSFORS.
Test No. 2. Head 5.50 m. Distance from centre to centre of bands 20. 2 cm. The surface of the ground was 0. 3 m below the horizontal diameter
of the pipe. Internal diameter of pipe 3. o m.

HARRSELSFORS.
Test No. 3. Head 3.02 m.
Distance from centre to centre of bands 20. o cm.
131
The surface of the ground was 0. 2 m below the horizontal diameter
of the pipe. Internal diameter of pipe 3. o m.

132
HARRSELSFORS.
Test No. 4.
Head 1.44 n1. Distance from centre to centre of bands 22. 3 cm.
The surface of the ground was 0. 2 m below the horizontal diameter of
the pipe.
Internal diameter of pipe 3. o m.

HARRSELSFORS.
Test No. 5. Head 0.57 m. Distance from centre to centre of bands 25. o cm.
133
The surface of the ground was 0. I m below the horizontal diameter of the pipe.
Internal diameter of pipe 3.0 m.
NOTE. When the band was tightened again after the test, the tensometers returned to approximately the same positions as at the beginning of the test.

134
HARRSELSFORS.
Test No'. ·6. Head 3.03 m.
Distance from centre of bands 20.o cm.
The surface of the ground was 0. 2 m below the horizontal diameter of the pipe.
Internal diameter of pipe 3. o m.

HARRSELSFORS.
Test No. 7.
Head 3.03 m. Distance from centre to centre of bands 20. o cm.
135
The surface of the ground was 0. 2 m below the horizontal diameter of the pipe.
Internal diameter of pipe 3. o m.

136
HARRSELSFORS.
Test No. 8.
Head 6.99 m.
Distance from centre to centre of bands 15. 3 cm.
The surface of the ground was 0. a m below the horizontal diameter
of the pipe.
Internal diameter of pipe 3. o m.

HARRSELFORS.
Test No. 9.
Head 7.03 m.
Distance from centre to centre of bands 16.0 cm.
137
The surface of the ground was 0. 3 m below the horizontal diameter
of the pipe.
Internal diameter of pipe 3. o m.

APPENDIX D
Stress Measurements Made at Gideabruk
Notations see appendix B.
GIDEABRUK.
Tests Nos. 1 to 13. Head 2.62 to 2.68 m. Distance from centre to centre of bands 38. 5 to 39. o cm. The surface of the ground was 0.1 m below the horizontal diameter
of the pipe. Internal diameter of pipe 3. o m.

r
The following pressures and calculated stresses were obtained.
Test No. 1
Test No. 2
Tests Nos.
. . . . . . . .. ...... . .
3 to 13 ....
At the crown At the surface Head
of the pipe of the ground
kg per cm• kg per cm• m
405 338 2.68
410 342 2.68
404 335 2.03
139
For lack of space, the magnitude of the observed stresses is not indicated by figures in the diagrams.
GIDEABRUK.
Tests Nos. 14 and 15. Head 2.35 m. Distance from centre to centre of bands 39. o cm. The surface of the ground was 0. 1 m below the horizontal diameter
of pipe. Internal diameter of pipe 3. o m.
NOTE. Since it was raining during these two tests, it is probable that the tensometers were slightly displaced, and the observed stress values are therefore uncertain.

APPBNDIX B
Stress Measurements Made at Xggfors
Notations see appendix B.
.AGGFORS.
Tests Nos. 1 and 2. Head 3.26 and 2.25 m. Distance from centre to centre of bands 53. o cm. The surface of the ground was 0. 2 m below the horizontal diameter
of the pipe. Internal diameter of pipe 3. 4 m. Test No. 1, head 3.26 m. Test No. 2, head 2.25 m.

•
APP�NDIX F
Theoretical Study of Freezing of Wood-Stave Pipes
In order to elucidate the problem of freezing of wood-stave pipes, it is very useful to make a purely theoretical study of this problem, even if the results of this study are not directly applicable in practice, since the problem comprises too many unknown factors.
Cooling without Freezing.
Consider a pipe with the internal diameter D and the wall thicknessd, see Fig. 51. The temperature of the water at the intake is t0_. The
outside temperature is tv. On account of the difference in temperl:),
ture between the outside and the inside of the wall of the pipe, heat
is transferred through the wall. Let t"' denote the temperature of the water at the distance x from the intake. As the water flows from x to x + dx, its temperature changes by the amount dt"' from t;,, to
t:,; + dt:,;. The ratio of the heat transmitted through the wall of a pipe to the
heat transmitted through a plane wall made of the same material,
having the same thickness d, and equal in surface to the internal d
surface of the piJ)e can approximately be expressed by / = 1 + D .
� vm.15
-to tx
1- X
I I 1dXI
• I '•
x "'dtx
a
d
, , , , , , • 0 .1,I, 0f-2d • I
Fig. 51. Schematic longitudinal section and cross section of pipe showing notations used in Appendix F.

•
142
If the coefficient of heat transmission through this plane wall is denoted by K kcal per m2 per 00 per hour (this coefficient includes the heat transmission by conduction through the timber wall as well as the heat transfer from the water to the timber wall and from the timber wall to the air}, and if the thermal resistance of the wall is
1 m m = K , then the thermal resistance of the pipe is /.
During the time when a water particle moves the distance dx, the quantity of heat W1, kcal, passes through the wall of the pipe. The velocity of water flow is v m per sec.
I � 1 W1 = -:;; · (t
y - tx) • n · D · dx · ---;; · 3 600 kcal (95)
During the same time, the heat contained in the water particle changes by the amount
n2 W = dt · n · - · dx · 1 000 kcal 2 X
4 (96)
The quantity of heat W2 which is given off by the water passes through the wall of the pipe into the air. Therefore, W1 = W2• By solving this equation, and by inserting the correlated values x = 0 and tx = t
0 for the upstream end of the pipe and x = L and tx = t
for the downstream end of the pipe, we obtain the relation
I v·D t-t11
--= 9· 105 • --- • ln--m L t0 -t11
Hence we compute the final temperature of the water t
(97)
(98)
Since the exponent of e is a small number, which is generally less than 0.1, the above expression can be written
( L f 1 )
t = (to - ty) • 1 -
V • D • --;:;; • 9 • 105 + ti/
•

or
L I I t = t0
- (t0 - ty) • V • jj · -:;;; · 9 . 105 -t0 - t
y . t0 - ty = to - (v. D) ( m ) = to - �
T . T. 9 -10s •
143
(99)
It follows from this equation that the difference between the initial temperature of the water and its temperature at the distance L,
metres, from the intake is directly proportional to the difference between the initial water temperature to and the outside temperature tu. Furthermore, the drop in water temperature is proportional to
the product v, · a, where
m (mi + m0 + my)
a= f · 9 · 105 =/
· 9 · 10s
In the above expression,
m0 = the thermal resistance of the timber wall = d/ l, where ). isthe thermal conductivity and d is the thickness of the wall,
m,. - the thermal resistance of the film between the water andthe wall,
my
= the thermal resistance of the film between the wall and theair.
The expression v,, which has the dimension of velocity, is dependent only on the size of the pipe and the velocity of water flow. The quantity v, can be called >>the specific velocity of water flow>>. The expression a is dependent on the thickness of the wall, the material of the wall, and the wind velocity. Moreover, it is also dependent -although, as a rule, to a slight extent - on the velocity of water flow, which influences mi.

144
Formation of Thin Ice Layer Inside Wood-Stave Pipes.
An ice layer can form on the inside of a wood-stave pipe, even if
the temperature of the water is above zero. The reason is the temperature difference across the water film on the inside of the pipe. Owing to this temperature difference, the temperature of the wall
may be below zero, while the temperature of the water is above zero. On the outside of the pipe, there is a similar temperature difference across the air film. The temperature gradients are given
by the difference between the air temperature t11
and the temperature
t. on the outside of the pipe wall, and between the temperature tv
on the inside of the wall and the temperature t of the water. Using
the thermal resistances my, mv, and mi, we obtain
t - t. t. - t. t, - ty
t - ty
T,V = --- = --- - - ------m; mv m
11 mi + m0 + mu
No ice forms on the inside surface of the wall if t. > 0 °, or if
(100)
(101)
If the internal thermal film resistance mi is high, the water temperature must be several degrees above zero in order to prevent freezing. If the internal surface of the pipe is smooth, mi is relatively small, and the risk of freezing is therefore slight. Consequently, a smooth internal surface of the pipe is favourable not only from a hydraulic point of view, but also because it reduces the danger of freezing.
When the water flows along the wall of pipe, the internal thermal
film resistance is dependent on the degree of roughness of the wall, the velocity of water flow, the diameter of the pipe, and the tempera
ture, see Fig. 52, but the variation in film resistance with the temperature is disregarded in this diagram, since this variation is very slight.
Fig. 52 shows that mi varies within the approximate limits from 0.001 at the velocity of water flow of 2 m per sec to 0.004 at the velocity of 0. 2 m per sec. The thermal film resistance m
y on the
outside of the pipe varies from 0.04 at a high wind velocity to 0.20
in the absence of wind. For frozen timber at a temperature of - 15° C, ). is 0. 8 (it is slightly lower at a higher temperature). Therefore, for
a wall thickness of, say, 50 mm, m11
= 0.06. Fig. 34 represents the limit value of the ratio t/ - t
11 at the beginning of freezing in accor-

Th,rmo/ film re,isfance m·°c·h/kcol 0,0040 r--r---..----,---,-----r--,
0 f 2 3 4 m;s Velocity of wafer flow
Fig. 52. Thermal film resistance mi = K{ between water and pipe
735 wall calculated from SOENNECKEN's formula Ki = no.3 · v0.6 (1 +
+ 0.014 t) kcal per m• per °C per hour. This formula haR been deduced for rough metal walls, but it may probably be applied to ice-covered walls without involving any serious errors. It is to be noted, however, that the value of· Ki for smooth walls is much lower. The diagram shows the variation in thermal film resistance with the velocity of water flow for the water temperature t = 0
and pipe diameter D = l.o m and 3.0 m.
145
dance with Eq. (101) as a function of the velocity of water flow v for
varying thickness of the pipe wall d in the presence and in the absence
of wind. For a pipe 3 m in diameter, made of 2 in. thick staves, at a
velocity of water flow of 2 m per sec in the presence of wind, we obtain t/-t
11 = 0.012. For t
11 = - 30° C, we get t = 0.36° C. If v
is 0. 20 m per sec, we get t/ - t11
= 0.040, and hence, for t11
= -
30° C, t = + 1. 20° C. For a wood-stave pipe 1 m in diameter, we obtain values which amount to 70 per cent of the above on account
of the variation in the thermal film resistance between the water
and the wall with the diameter of the pipe, cf. Fig. 52.
Formation of Thick Ice Layer Inside Wood-Stave Pipes.
The ice coating formed on the inside of a wood-stave pipe acts as a
heat-insulating layer, with the result that freezing gradually ceases
as the thickness of the ice layer approaches a definite value. If
10

,,
146
t0
= 0, and if the thermal conductivity of the ice is taken to be 1.55, this value can be computed from
---------
dice ' m.+mu+-l
,55
(102)
The thickness of the ice layer dice is reached in a pipe after a time which is, strictly speaking, infinitely long, at a given temperature of the water under gi"."en weather conditions.

VII. Summary
After a brief historical review, this treatise deals with the strength of wood-stave pipes, the operating conditions of these pipes, and the economic factors entering into their design. In order to demonstrate the possibilities of wood-stave pipes at the present time, a description is given of several pipes used in practice.
The strength problems are treated in Chapter II. The Author advances some design rules which are deduced from a new theory of wood-stave pipes carried on supports. The design of wood-stave pipes is discussed on the basis of stress measurements made in actual operation on pipes which were embedded to half their height. The results of tests carried on without interruption during more than three years are used to show that the swelling stress in a wood-stave pipe increases at a relatively high rate, and then slowly decreases in the course of time. Suggestions are made for the determination of the dimensions of staves and the selection of the type of joints, bands, and shoes.
Chapter III deals with decay, freezing, and losses of head. Some conclusions as to the life of wood-stave pipes and the appropriate measures for preventing decay are drawn from practical experience regarding decay of pipes in various countries. The section on freezing of wood-stave pipes is mostly based on a theory of freezing published by the Author in a previous paper. This theory has been verified by observations made on several frozen pipes. The Author suggests that Manning's formula should be used for calculating the losses of head, and proposes certain definite values of the coefficient M which are dependent on the character of the internal surface of the pipe and on the ratio of the velocity of water flow to the diameter of the pipe.
The advantages and drawbacks of wood-stave pipes are enumerated in Chapter IV, which also gives examples of economically designed pipes. Finally, several wood-stave pipes and their accessories made by various manufacturers are described in Chapter V.

VIII. References
The references in this list are arranged in the alphabetical order
according to the names of the authors. In those cases where the name
of the author is not indicated, the references are classified according
to the name of the review or the publisher.
The following abbreviations of titles of periodical publications
are used in this list.
A. S. C. E. Trans. E. u.M.E.N.R.
I. V. A. hand!. Schw. Bauz. SVKF pub!. Tekn. T. V. U. S. Dep. Agr. Bull.
W. u.W.Z. V.D.I. Z. ges. Turb. Z. Math. Mech. Z. 0. I. A. V.
American Society of Civil Engineers, Transactions. Elektrotechnik und Maschinenbau. Engineering News-Record.
Ingeniorsvetenskapsakademiens handlingar. Schweizerische Bauzeitung. Svenska vattenkraftforeningens publikationer. Teknisk Tidskrift, vii.g- och vattenbyggnadskonst. U. S. Department og Agriculture, Bulletin.
W asserkraft und W asserwirtschaft. Zeitschrift des Vereins Deutscher Ingenieure. Zeitschrift fur das gesamte Turbinenwesen. Zeitschrift fur angewandte Mathematik und Mechanik. Zeitschrift des Osterreichischen Ingenieur- und Architekten-Vereines.
1 . ANZELIUS, A., and FAXJ!:N, 0., Die Formii.nderungen eines Rohres, das zur Hii.lfte mit Wasser gefiillt ist. Arkiv for matematik, astronomi och fysik, Vol. 26 A, No. 7. Stockholm 1938.
2. BACH, C., Die Berechnung der Starke cylindrischer Gefii.sse. Z. V. D. I., 1880, Vol. 24, No. 6.
3. BARTELS, E. J., History of Wood Pipe and some Data on its Use .. American ,vood-Preservers Association, Proceedings 1921.
4. BAUMANN, D. A., Erfahnmgen mit dem Bau von Holzrohrleitungen. Wasserkraftjahrbuch 1924.
5. BECKER, A., and RUDY, H., Bohrung und Verlegung holzerner Rohre zu Leitungen und Brunnen. Die Strasse 1942, pp. 207-211.
6. BENEDICKS, C., Om issorpning ur fysikalisk synpunkt (On Eormation of Ice Sludge Considered in Its Physical Aspects). Tekn. T. V. 1911, No. 12.
7. BUNDBCHU, F., Druckrohrleitungen. Berlin 1929. 8. BURNEIJ, B., Trii.ror (Wood-Stave Pipes). SVKF pub!. 168, 1924, No. 11.

149
9. CAll1PBELL, J. L., Leakage from M\l,Chine Banded Wood Pipe. E. N. R., 1921, Vol. 86, No. 3.
10. CHANDLER, Discussion of TIFFANY's Paper. Eng. News 1913, Vol. 69, p. 635. 11. DAVIS, C. V., Handbook of Applied Hydraulics, New York 1942. 12. DEVIK, 0., Thermische und dynamische Bedingungen der Eisbildung in Wasser
laufen. Geof. Puhl., Vol. IX, No. 1, Oslo 1931. 13. DEVIX, 0., -Ober die Eisbildung eines Wa.sserlaufes und ihren Einfluss auf das
Lii.ngenprofil. Deutsche Wa.sserwirtsphaft 1933, Nos. 10 and 11. 14. EGGENBERGER, H., Die Energieversorgung der schweizerischen Bundesbahnen.
Wasserkra.ftjahrbuch 1927/28, p. 160. 15. ELECTRICAL WORLD 1939, Vol. 112, No. 27, Utah Power & Light Builds a
Big Wood-Pipe. 16. E. N. R. 2 Dec. 1915. Laying Wood-Stave Pipe to Replace Steel Pipe. 17. E. N. R. 12 Aug. 1920. Comparison of Wood Stave, Iron and Concrete Pipe. 18. E. N. R. 1925, Vol. 95, p. 1077. Freezing in Wood-Stave Pipe at Everett. 19. E. N. R. 21 Aug. 1947. Vertical Relief Wells Reduce Uplift on Sardis and
Fort Peck Dams. 20. ENG. NEWS 1915, p. 1210. Continuous Wire Winding for Wood Stave Pipe. 21. FEDER.HOFER, K., Zur strengen Berechnung liegender weiter Rohre. W. u. ,v.
1943, No. 10. 22. FoRCHHEIMER, PH., Berechnung des zulassigen Aussendruckes bei Ringen und
Rohren. Z. 0. I. A. V. 1899, No. 29. 23. FoRCHHEIMER, PH., Berechnung von Behaltern auf Winddruck. Z. 0. I. A. V.
1902, No. 18. 24. FORCHHEIMER, PH., Zur Festigkeit weiter Rohre. Z. 0. I. A. V. 1904, ·Nos. !l
and 10. 25. FoRCHHEIMER, PH., Der Durchfluss der Wasser <lurch Rohren und Graben,.
insbesondere <lurch Werkgraben grosser Abmessungen. Berlin 1923. 26. FosDICK, E. R., Tunnel �nd Penstock Tests at Chelan Station. A. S. C. E ..
Trans. 1936, Vol. 101, No. 1952. 27. FRAHER, TH., New Chittenden Plant of the Pittsford Power Co., Eng. News
1915, Vol. 74 p. 14. 28. FROHLICH, 0., Beitrag zur Berechnung weiter Rohre. Z. 0. I. A. V. 1010,.
No. 3. 29. GRANGE, F., Bidrag till kannedom om tubers berakning (Contribution to
Methods of Pipe Design), Tekn. T. V. 1918, No. 10. 30. GiiTEBORGS VATTENLEDNINGSVERK 1787-1937, Minnesskrift med anledning av
Goteborgs vattenledningsverks 150-ars jubileum (Commemorative Record Published on the Occasion of the 150th Anniversary of the Gothenburg: ·waterworks). Gothenburg 1937.
31. HAZEN-WU,LIAll!S, Hydraulic Tables. New York and London 1920. 32. HELLSTROM, B., Undersokning av stromningskol'fficienterna vid Haby kraft
verks nivatub (Investigation of Coefficients of Flow in Level Pressure Pipe at the Haby Hydro-Electric Station). Tekn. T. V. 1919, No. 2.
33. HELLSTROM, B., Om follforluster vid vattnets stromning i trii.- och betong-tuber (On Losses of Head during Flow oi ,vater through ,vood-Stave and Concrete Pipes). Tekn. T. V. 1925, No. 4.
34. HENNY, D. C., Report on Life of ·wood Pipe. Eng. News 26 Aug. 1915, Vol. 74.

150
35. HOLDER, L. E., Compact Tables for Manning's Formulas Simplify Hydraulic Computations. E. N. R. 21 March 1946.
36. v. HOLTEN, G., Neuere Fortschritte im Holzrohrbau. Die WaBSerkraft 1926, No. 13.
37. v. HOLTEN, G., Das Forchenbachwerk. Die Bautechnik, 28 Jan. 1927, No. 5. 38. v. HOLTEN, G., Erfahrungen mit Holzrohrleitungen. W. u. W. 1929, No. 6.39. HORTON, R. E., Eng. News 24 Febr. 1916, p. 373. 40. HOYER, F., Turbinenleitungen aus Holz. Schw. WaBBerwirtschaft 1923, No. 4. 41. HRuscmu, A., Die Berechnung von Druckrohrleitungen. E. u. M. 1922. 42. HRuscmu, A., Druckrohrleitungen der Wasserkraftwerke. Entwurf, Be
rechnung, Bau und Betrieb. Wien and Berlin 1929. 43. HRuscHKA, A., Die Berechnung von erdbedeckten nackgiebigen Druckrohr
leitungen. W. u. W. 1941, No. ll. 44. HoKERBERG, T., Ett bidrag till tubledningars hii.llfasthetsberii.kning (Cont
ribution to Design of Pipe Lines). Tekn. T. V. 1919, No. 3. 45. JAYNE, S. 0., Wood Pipe for Conveying Water for Irrigation. U. S. Dep. Agr.
Bull. No. 155. 46. KARLSSON, K. I., Till tubledningars hallfasthetsberakning (Note on Design of
Pipe Lines). Tekn. T. V. 1910, No. 4. 47. KARLss_oN, K. I., -Ober Schwerkraftspannungen in Rohrleitungen von grossen
Durchmessern und deren rationelle Konstruktion. Schw. Bauz. 2 Sept. 1922, Vol. 80, No. 10.
48. v. KARMAN, TH., -Ober die Formanderung diinnwandiger Rohre, insbesondere federnder Ausgleichsrohre. Z. V. D. I. 1911, p. 1889.
49. KIRKPATRICK, M. R., Old Wood Stave Pipe Successfully Rewound on the Job. E. N. R. 1920, Vol. 85, No. 6.
50. KOEHN, TH., Der ,vaBBerbau. Handbuch der IngenieurwiBSenschaften, Part III, Leipzig 1908.
51. KULOY, T., Nogen driftserfaringer fra turbinror (Operating Experiences with Turbine Pipes). Teknisk Ukeblad 193"2, No. 17.
52. KAELIN, F. T., Die Neue Kraftiibertragungsanlage der Shawinigan Water & Power Co in Montreal. Schw. Bauz. 1914, No. 23.
53. LAGERBERG, T., Rotskador A barrvirke i vatten (Decay of Softwood Timber . in Water). SVKF pub]. 208, 1928, No. 8.
54. LEDOUX, J. W., E. N. R., Vol. 85, No. 20. 55. LEGROS, J., Holzerne Rohrleitungen in Oesterreich. Schw. Bauz. 1924, Vol.
83, No. 4. 56. LEINER, Die Praxis der Eisabwehr bei Wasserkraftanlagen. Der Bauingenieur
1925, No. 13. 57. LEM, A. H., Die Anwendung von holzernen Druckleitungen in Norwegen.
Schw. Bauz. 1920, Vol. 76 p. 101. 58. LUDIN, A., Die Wasserkrii.fte, Vol. II, Berlin 1913. 59. LuDIN, A., Rohrleitungen aus Holz. Die Wasserkraft 1921, No. 6.60. LuDIN, A., Die Nordischen Wasserkrii.fte. Berlin 1930. 61. LowY, R., Die Berechnung der Druckleitungen von Turbinenanlagen. Die
WaBBerwirtschaft 1926, No. 10. 6" MAIER, F., Neue Ausfiihrungen von Holzrohrleitungen. Die Bautechnik 1928,
No. 17.

I
151
63. MANNING, R., Flow of Water in Open Channels and Pipes. Trans. Inst. Civil.Eng. of Ireland 1890, Vol. 20.
64. MARX, C. D., and WING, C. B., Experiments on Flow of \Vater in 6-foot Steel and Wood Pipe Line at Ogden, Utah. A. S. C. E. Trans., Vol. 40 1898 and Vol. 44 1900.
65. MAURY, D. H., Journal of the American Water \\'arks Association, Vol. 12,No. 1.
66. MELIN, R., Undersokningar vid Sveriges meteorologiska och hydrologiskainstitut over vattendragens isforh!llanden (Investigations on Freezing of Watercourses Made by the Meteorological and Hydrological Institute of Sweden). SVKF pub!. 393, 1947, No. 3.
67. METROPOLITAN WATER BOARD, The Water Supply of London. London 1937. 68. l\foRITZ, E. A., Experiments on the Flow of \Vater in \Vood Stave Pipes.
A. S. C. E. Trans. 1911, Vol. 74. 69. NALDER, W. H., Condition of \Vood-Stave Pipe on Reclamation Projects.
E. N. R. 1922, Vol. 88, No. 12. 70. NATIONAL TANK AND PIPE Co., \Vood Pipe Handbook. Portland, Gregor,,
1945. 71. N OROES V ASSDRAOS- 00 ELEKTRISITETSVESEN, Vassdragstilsynets regler for
kontinuerlig bygde trer0r (Official Norwegian Rules for Continuous Wood-Stave Pipes). Oslo 1940.
72. NosSEK, L., Das Holzrohr und seine Verwendung in Osterreich. Z. 0. I. A. V. 1924, Nos. 21 and 22.
73. NYBRANT, G., Bildning av bottenis och sorpa i ett rinnande vattendrag(Formation of Bottom Ice and Ice Sludge in Watercourses). Tekn. T. V. 1943, No. 1.
74. PARTRIDGE, J. F., Modern Practice in Wood Stave Pipe Design and Suggestions for Standard Specifications. A. S. C. E. Trans. 1918, No. 1411.
75. PoE=ER, H., Holz als Werkstoff im chemischen Apparatebau. Die ChemischeTecknik, 1943, No. 9.
76. PooLE, C. 0., Hydroelectric Development on Bishop Creek. Electrical \Vorld 1914, Vol. 64 Nos. 16 and 17.
77. RABOVSKY, H., Holzdaubenrohre, Berlin 1926.78. REGNELL, S. E., Erfarenheter rorande trAtuber (Experience Regarding Wood
Stave Pipes). SVKF pub!. 385, 1946, No. 10. 79 .. SAllISIOE, A. F., Om trAtuber (On Wood-Stave Pipes). Tekn. T. V. 1916,
No. 9. 80. SAMSIOE, A. F., Tubledning av trA vid Lindesniis vattenkraftverk (Wood-Stave
Pipe Line at the Lindesniis Hydro-Electric Station). Tekn. T. V. 1922, No. 10.
81. SA111SIOE, A. F., Die Spannungen in einem auf mehreren Stiitzen in gleichergegenseitiger Entfernung aufgelegten und zur HiiUte mit Wasser gefiillten Rohr. I. V. A. hand!. 1926, No. 50.
8" Scmn=, F., Berechnung van holzernen aus Lamellen zusammengesetzten Druckrohrleitungen. Z. 0. I. A. V. 1923, p. 52.
83. SCHUBERT, Der Bau der Gothaer Trinkwasserzuleitung ans Holz. Der Stadt.Tiefbau. Der Briickenbau, Febr. 1927. Die Gothaer Holzrohrleitung fiir Trinkwasser. Der Bauingenieur 1925, No. 36.

152
84. SCHWERIN, E., -Ober die Spannungen in freitragenden gefiillten Rabren. Z. Math. Mech. 1922, Vol. 2, No. 5.
85. ScoBEY, F. C., The Flow of Water in Wood-Stave Pipe. U. S. Dep. Agr. Bull. 1916, No. 376.
86. SEITZ, H., Wasserdichtheit van Fichtenholz. Die Ba�technik 1929, No. 7. 87. SEITZ, H., Holzdaubenrohre im Wasserversorgungswesen. Gesundheitsingenieur
1931, No. 20. 88. SPIES, B., Moderna trii.riirledningar (Modern Wood-Stave Pipe Lines). Pappers
och tril.varutidekrift for Finland, 1932, No. 17. 89. STREETER, V. L., Frictional Resistance in Artificially Roughened Pipes. A. S.
C. E. Trane. 1936, Vol. 101, No. 1936. 90. STALHANE, B., and PYK, S., Beetil.mning av vii.rmeledningeformagan hoe ieole
ringsmaterial (Determination of Thermal Conductivity of Heat-Insulating Materials). Elektrovii.rmeinetitutete tioe.reekrift 1923-1933, N orrkoping 1933.
91. SVKF PunL. 1938, No. 16, Kort notie om tub vid Outardes (Canada) och Funna (Norge) (Short Notice on Pipes at Outardes, Canada, and Funna, Norway).
92. THAM, S., En metod for ekonomisk dimensionering av trycktuber (A Method of Economic Design of Pressure Pipes). Tekn. T. V. 1930, No. 3.
93. THOMA, S., Die Beanspruchung freitragender gefiillter Rohre durch das Gewicht der Fliieeigkeit. Z. Ges. '.Vurb. 1920, No. 5.
94. TIFFANY, R. IL, Experience with Wood-Stave Pipe in Irrigation. Eng. News 1913, Vol. 69, No. 6.
95. TILLMAN, R., Zur wirtschaftlichen Bemeeeung eiserner Druckrohrleitungen fiirWaeeerkraftanlagen. Die Wasserkraft 1926, Nos. 20 and 21.
96. WESTERBERG, N., Hallfasthetsberiikning av cirkulii.ra riirledningar (Design of Strength of Circular Pipe Lines). Tekn. T. V. 1918, No. 5.
97. WHITE, B. E., Maintenance of Wood-Stave Pipe in Hydro-Electric Practice. Power 1924, Vol. 60, No. 21.
98. WHITE, B. E., Improper Backfill Causes Failure of \Vood-Stave Pipe Lines. Power 1924, Vol. 60, No. 26.
99. WHITE, B. E., Design as a Factor in Upkeep of Wood-Stave P.ipe. Power 1925, Vol. 61, No. 4.
100. WHITE, B. E., Chapter on wood-stave pipes in CREAGER and JusTIN, HydroElectric Handbook, New York, 1927.
101. VoELL11lY, A., Eingebettete Rohre. Statische Untersuchung iiberschiitteter Leitungen mit Beriicksichtigung ihrer Elastizitil.t. E. T. H. l\:litteilung No. 9, Ziirich 1937.

154
L Distance between supports, m. Le Distance between supports calculated by means of stave pile method, cm. L, Distance between supports calculated by means of stave pile method, m. Lm Distance between supports calculated by melliJls of membrane method, m. l Distance between bands, m.
Mtotal 111
Coefficient in Manning's formula for friction loss of head. Moment, ton·m. · • · Moment acting on ring stiffener, ton-m. Moment acting in transverse plane at given point at bottom of pipe, ton-m per m. Moment acting in transverse plane at given point on level with longitudinal axis of pipe, ton-m per m. Moment actil)g in transverse plane at given point at crown of pipe, ton-m per m. Total moment in cross section, ton-m. Total thermal resistance of wall of pipe, m2 °C hour per kcal. Internal thermal film resistance (between liquid and wall), m2 °C hour per kcal. External thermal film resistance (between wall and air), m• °C hour per kcal. Thermal resistance of wall, m• °C hour per kcal. Normal force, tons per m. Normal force acting in transverse plane, tons per m. Normal force acting in transverse p lane at given point at bottom of pipe, tons per m.
N11:12 Normal force acting in transverse plane at given point on level with longitudinal axis of pipe, tons per m.
N11: Normal for.ce acting in transverse plane at given point at crown of pipe, tons per m.
n Coefficient of roughness in GANOUILLET's and KuTTER's formula for value of C.
n
p
p
Ps
Q
Qm q
R
R
r s
Srp
T1, T,,
Ttot t to
Number of staves in cross section of pipe. Total vertical reaction at supports, tons. Compressive stress in surface of contact between two adjacent staves, tons P!ll' m•. Compressive stress between the bands and the staves, tons per m'. Rate of water flow, m• per sec. Average rate of water flow during given period of time, m• per-sec. Internal pressure, tons per m•. Radius of ring stiffener, m. Hydraulic rad,ius, for circular cross section R = D/4, m. Internal radius of pipe = D/2, m. Static moment, m•. Normal force acting on bands, ton per m.
etc. = Partial periods of time, sec. Total time of operation, sec. Temperature of water, °C. Temperature of water at intake of pipe, °C.

tx ty
ta tv Vn:/2.
V
Vnppr
Va W1
lr'2
X
z
a
y
0
e
'P
rp
1/ 1/a ).
w
(!
a
GB
Gz
T
•m
•a
<;1, .;,
155
Temperature of water at distance x from intake of pipe, °C. Temperature of air on outside of pipe, •c. Temperature of wall on outside, •c.
Temperature of wall on inside, °C. Shearing force acting on wall of pipe in horizontal plane through longitudinal axis of pipe at right angles to this nxis, tons. Average velocity of water flow, m per sec. Approximate value of v, m per sec. Specific velocity of water flow, m per sec. Quantity of heat, kcal. Quantity of heat, kcal. Distance from intake to given point of pipe, m. Distance from centre between two supports to given point, m. Factor in expression a D = initial cost per metre of length of pipe. Specific gravity, tons per m". Vertical deflection of the pipe, m.
C ff.. f d' . Dh-Dv
oe 1cient o 1stort10n = ----
Angle in plane at right angles to longitudinal axis of pipe. The initial line of the angle passes through the lowest point of the pipe. Width of band, m. Displacement of given point of pipe wall in radial direction, m. Deflection of stave at centre, m. Thermal conductivity, keal per m per °C per hour Price of power, Swedish kronor per kW per year. Internal radivs of pipe, m. Maximum tensile stress in bending in the most heavily stressed stave, tons per m•. Tensile stress in bands, tons per m•. Tensile stress in staves parallel to longitudinal axis of pipe, tons per m2• Shearing stress in the wall of pipe, tons per m•. Maximum shearing stress in the wall of pipe calculated from the membrane method, tons per m•. Maximum shearing stress in the wnll of pipe calculated from the stave pile method, tons per m2. Constants.

Table of Contents
Acknowledgements
I. Preface.
II. StrengthA. Introduction B. Loads and Forces C. General ..... .
1. Normal Forces . 2. Moments ...
D. Wood-Stave Pipes Carried on Supports . 1. Introduction . . . . 2. Membrane Method . 3. Stave Pile Method . 4. Summary ..... . 5. Moments Acting on Ring Stiffeners .
Page 3
5
11
11
12 13 13 13 14 14 15
17 21 23
6. Conclusions Regarding Wood-Stave Pipes Carried on Supports 24
E. Embedded Wood-Stave Pipes . . . . . 25
1. Introduction . . . . . . . . . . . . . 25
2. FoRCHHEll\IER's Method of Design . 25
3. SAllISIOE's Method of Design . . . . 26
4. FEDERHOFER's Method of Design . 27
5. Method of Design Advanced by the Author . 28
6. Summary of Methods of Design for Embedded Wood-Stave Pipes . . . . . . . . 30
a. Normal Forces . . . . . . . . . 30
b. Moments . . . . . . . . . . . . 31
c. Design of Wood-Stave Pipes for Operation under Normal Conditions . . . . . . . . . . . . . . . . . . . . . . . 31
d. Design of Wood-Stave Pipes for Operation under Emptying and Filling Conditions 31
e. Discussion . . . . 32
F. Stress Measurements . . . . 33
1. Method of Testing . . . 33
2. Tests Made at Sikiors . 36
3. Tests Made at Harrselsfors . 39
4. Tests Made at Gideabruk . 41
5. Tests Made at .Aggfors 43 6. Summary . . . 45

,-
III.
157
Page
G. Swelling Stresses . 47
I. Earlier Tests . 47
2. New Tests . . 48
3. Conclusions Regarding Swelling Stresses 50
H. Thickness of Staves • . . . . . . . . . . . . . 53
I. Load-Carrying Ability of Pipe Regarded as a Beam between
Supports . . . . . . . . . . . . . . . . . . . . . . . . . 53
2. Strength of Staves Submitted to Internal Pressure . 53
3. Risk of Buckling Due to External Pressure . 54
4. Risk of Leakage . . . . . . . 56
a. Percolation . . . . . . . .
b. Lateral Contact between Staves .
c. Amount of Leakage .
5. Internal Wear .
6. External Decay .
I. Wood-Stave Joints .
I. Collar Type Pipes
2. Continuous Stave Pipes .
3. Group Stave Pipes
4. End Joints
J. Bands .
K. Shoes .
Operating Conditions A. Decay ........ .
I. Previous Experience .
2. Recent Swedish Experience
3. Conclusions Regarding Decay
B. Freezing . . . . . . . . . . . . . . .
I. Theory of Freezing Process .
a. Heat Transmission by Conduction and Convection
b. Freezing of Pipes . . . . . . . . . . . . . . . . . . .
c. Heat Transmission by Radiation and Evaporation
2. Experience Regarding Freezing of Wood-Stave Pipes
3. Summary Regarding Freezing of "\:Vood-Stave Pipes
C. Losses of Head . . . . . . . . . . . . . . . . . . . . . . .
I. Introduction . . . . . . . . . . . . . . . . . . . . . . .
2. Formulae for Calculation of Frictional Loss of Head .
3. Observed Frictional Loss of Head . .
4. Conclusions Regarding Loss of Head
56
56
57
58
59
59
59
60
61
62
64
65
69
69
69
73
78
79
79
79
80
82
85
88
90
90
90
93
93
IV. Economic Factors 95
95
96
99
A. General ..... .
B. Calculation of Most Economical Diameter
C. Summary Regarding Economic Factors . .
V. Modern Wood-Stave Pipes ........ . A. Pressure Pipe at the Dammfallet Hydro-Electric Station
B. Pressure Pipe at the Furudal Hydro-Electric Station . .
102
102
104

158
C.
D.
E.
F.
G.
H.
I.
J.
K.
Page Pressure Pipe at the Kalltorp Hydro-Electric Station . . . . . . . 106 Water Supply Main from Tisaren to the Kvarntorp Shale Oil Plant 108 Water Supply Main from Nolby to the Stockvik Works . . . . . . llO Water Supply Main of the Oskarstriim Sulphite Mills . . . . . . 112 Water Supply Main of the Alvenii.s Cellulose Wool Factory . . . ll3 Pressure Pipe at the Torsby Hydro-Electric Statio'n . . . . . . . . 114 Group Stave Pipe with Covered End Joints . . . . . . . . . . . . . 116 Shoes, Bands, and End Joints Manufactured by the Boxholms AB, Boxholm, Sweden, and the Skandinavisk Traeriir A/S, Oslo, Norway 117 Wood-Stave Pipe Manufactu,red by the AB Armerade Trii.riir, Gothenburg, Sweden. . . . . . . . . . . . 118
VI. Appendices . . . . . . . . . . . . . . . . . . 119 A. Design of Wood-Stave Pipes Carried on Supports. 119 B. Stress Measurements Made at Sikfors . . 124 C. Stress Measurements Made at Harrselsfors. 129 D. Stress Measurements Mode at Gideiibruk . . 138 E. Stress Measurements Made at Aggfors . . . 140 F. Theoretical Study of Freezing of Wood'-Stave Pipes 141
VII. Summary . 147
VIII. References . 148
IX. Notations . 153

Fort.. fr. 01,u/ . .!:drG ,;,1,..
2:J. JosJo:PHl:ION, BhNOT, lmpr.dance }tfea1<uru11cnta in Dcci111,etro Wauc Ba11d.
70 H. 1948. Kr. 5: -.
24. FALKEMo, CUJ{T, and ADLER REUTZ, JoHAN, Model Tut.a on Single-Step
Planing Surface!/. (Publication No. 1/1947 of Tho Ship Testing
Laboratory). 40 s. 1948. Kr. 3: 50.
25. ALM, E1>UL, Physical Propertiea of Arc., in Cimuit Broaktrs. 248 s. 1049.
Kr. 12:-.
26. MORATH, Emx, A Mathematical TheonJ of Sltadod-Pole Motors. 48 s.
1949. Kr. 4: -.
:!7. WEIBULL, W., A Stali-8tical Ropreae1italion of Fatigue Failurea in Soluh.
51 s. 1949. Kr. 4: -.
28. NYLANDER, HENRIK, Torsional and Lateral Buckling of Eccentrically
Compreased I and T Columns. 33 s. 1949. Kr. 3: -.
29. PETTERSSON, OVE, Combinod Bending and Torsion of Simply Supportod
Bea7118 of BunJ7nrnetrical CroBB Section. 45 s. 1949. Kr. 3: 50.
30. \'VASTLUND, GEORG, and BERGSTRi:hi:, SVEN G., Buckling of Compreased
Steel Members. 172 s. 1949. Kr. 10: -.
31. BJORKMAN, ANDERS, Studiea on Hydrogenation of Sulphite Waste Liquor.
41 s. 1950. Kr. 4: -.
32. HEUMAN, CARL, Zur Theorie der elliptiBchen Integrale. 58 s. 1050. Kr.
4: 50.
33. REGNELL, STIG, Wood-Stave PipcB. 158 s. 1050. Kr. 10: -.
1,

-----
- --
Pris kronor 10: ----
�- --
G0TEBORG 1950
JilLANDEll.S BOKTRYCKERI AKTIEllOLAU