Towards condition based asset management of uPVC pipes
171
-
Upload
khangminh22 -
Category
Documents
-
view
0 -
download
0
Transcript of Towards condition based asset management of uPVC pipes


Towards condition based asset management of uPVCpipes
Emiel Drenth

De promotiecommissie is als volgt samengesteld:
Voorzitter en secretaris:prof.dr. G.P.M.R. Dewulf Universiteit Twente
Promotoren:prof.dr.ir. R. Akkermanprof.dr.ir. M. Wolters
Universiteit TwenteUniversiteit Twente
Copromotor:dr.ir. T.C. Bor Universiteit Twente
Leden (in alfabetische volgorde):prof.dr. A. Blumeprof.dr.ir. L.E. Govaertprof.dr. S.J. Pickenprof.dr.ir. D.J. Schipper
Universiteit TwenteTechnische Universiteit EindhovenTechnische Universiteit DelftUniversiteit Twente
This research project was financially supported by Bureauleiding, Cogas Infra enBeheer, Delta Netwerkgroep, Enexis, Liander, Rendo, Stedin and Vitens.
Towards condition based asset management of uPVC pipes,Drenth, EmielPhD Thesis, University of Twente, Enschede, the NetherlandsDecember 2015
ISBN 978-90-365-3992-0DOI 10.3990/1.9789036539920© 2015 by E. Drenth, Apeldoorn, the NetherlandsPrinted by Gildeprint, Enschede, the Netherlands
Cover: photograph of used PVC pipes by Lifang1025 and used with permission.

TOWARDS CONDITION BASED ASSETMANAGEMENT OF uPVC PIPES
PROEFSCHRIFT
ter verkrijging vande graad van doctor aan de Universiteit Twente,
op gezag van de rector magnificus,prof.dr. H. Brinksma,
volgens besluit van het College voor Promotiesin het openbaar te verdedigen
op vrijdag 11 december 2015 om 14:45 uur
door
Emiel Drenth
geboren op 25 mei 1984
te Groningen

Dit proefschrift is goedgekeurd door de promotoren:
prof.dr.ir. R. Akkermanprof.dr.ir. M. Wolters
en door de copromotor:
dr.ir. T.C. Bor

Summary
The Dutch gas and water distribution networks consist of considerable amounts ofunplasticised poly(vinyl chloride) (uPVC) pipes: about 21,000 km (20%) in the gasdistribution network and about 60,000 km (48%) in the water distribution network.Most of these uPVC pipes were installed between the mid-fifties and mid-seventiesof the last century and have been in service ever since. The oldest uPVC pipes havesurpassed their already extended specified service lifetime of 50 years. ReplacinguPVC pipes which have exactly passed their specified lifetime would lead to anextremely labour intensive and costly project. Postponing replacements is thereforefavourable, but only without compromising the safety and the integrity of thenetworks. The main goal of this thesis is to answer the question: how can wedetermine when a uPVC pipe should be replaced?
The development of a framework for determining the current condition and theresidual lifetime of uPVC pipes started in 2005 in collaboration with the Dutchnetwork companies. It was soon realized that most of the failures in uPVC gas pipesare caused by impact loading events from (third party) digging activities. The riskof (fatal) incidents after impact damage is higher for brittle pipes than for ductilepipes. The occurrence of brittle failure was considered the main limit for the servicelife of uPVC gas pipes. Hence, brittle pipes should be located and replaced. Thefirst PhD project within the framework indicated that the extent of physical ageingand the level of gelation are the two important factors which can cause brittle failureof uPVC pipes. Methods were developed to determine the kinetics of the physicalaging process and to estimate the parameters that could be used as a criterion forreplacement of uPVC tubes.
In this second PhD project within the framework the emphasis is on improving theexisting residual lifetime assessment method towards a level that in-situ applicationin uPVC pipes becomes realistic (Chapter 2). A new method to determine the criticalcondition has been developed (Chapter 3) and a systematic investigation to thevariation in physical aging kinetics, as observed in the previous PhD project, hasbeen carried out (Chapter 4). Finally, the in-situ determination of the level of gelationof uPVC pipes has been investigated (Chapter 5). The research on each of thesesubjects is described in four consecutive chapters followed by a proposal for practicalimplementation, conclusions and recommendations.
After the extrusion of a uPVC pipe the material is in a non-equilibrium ther-modynamic state and undergoes physical ageing leading to changes in its yield
i

ii
stress. In Chapter 2 of this thesis a new measurement approach is presentedto non-destructively assess changes in the thermodynamic state of uPVC pipes.The measurement system employed is selected such that miniaturisation to a sizecompatible with the typical inner dimensions of uPVC pipe networks is realistic. Themeasurement approach consists of indentation of a uPVC pipe surface with a micro-Vickers indenter employing relatively low loads to minimally affect the uPVC pipesand confocal microscopy to determine the topography of the indents. The hardnesswas determined from the indent depth. The development of the yield stress and thehardness with the ageing time follow the same behaviour, which enables changesin the thermodynamic state to be determined from corresponding changes in thehardness measured. The residual lifetime of uPVC pipes can be non-destructivelyassessed using the ageing kinetics of the uPVC pipe investigated and assuming acritical limit to the yield stress and/or hardness. The measurement approach suffersfrom scatter in the hardness values determined. The scatter originated from surfaceroughness of the uPVC pipe as no pre-treatment to the pipe surfaces was carried outto keep the measurement approach simple with a view to future in-situ applicationin pipes. Statistical analysis has shown that the number of hardness measurementsrequired can be estimated from a desired degree of precision in the residual lifetime.The approach presented has a similar sensitivity to physical ageing as the one used inthe previous PhD project, but it is more robust and hence one step closer to practicalimplementation.
The residual lifetime of a uPVC pipe can only be determined when the criticalthermodynamic state at which the failure behaviour of a pipe turns from ductile intobrittle is known and quantified. A yield stress criterion was proposed in Chapter 3,which implies that a ductile-to-brittle transition occurs when the tensile yield stress ofuPVC surpasses a critical, temperature and time independent value. Tensile impacttests were performed to determine the ductile-to-brittle transition temperature uponisothermal annealing. The yield stress criterion was applied and enabled a goodprediction of the ductile-to-brittle transition temperature with annealing time, whichshows that the proposed criterion holds for uPVC. Subsequently, saw tests performedon a single excavated uPVC gas pipe showed that physical ageing can induce brittlefailure of a uPVC pipe. This result enables a quantitative assessment of a limitingtensile yield stress for loading conditions encountered in practice, which can then beused in lifetime assessment calculations.
In Chapter 4 the origin of the variation in the ageing kinetics of uPVC pipes hasbeen studied. The ageing kinetics of a pipe has to be known to determine theresidual lifetime of a pipe from the current yield stress, as measured with the micro-Vickers approach, and a limiting (maximum) value of the yield stress, where thematerial’s failure behaviour turns brittle. The ageing rates of a broad range ofuPVC pipes have been determined using uniaxial tensile experiments. Significantdifferences in the ageing rate up to a factor of four have been observed. These

iii
differences are believed to be caused by differences in the material’s physical and/orchemical structure and composition and might originate from one or more stages inthe lifetime of uPVC pipes (polymerisation, processing, service life). The relationbetween a number of selected uPVC (material) properties and the ageing rateshas been studied. It is shown that the properties related to the polymerisationstage (i.e. the PVC polymer chain structure, the average chain length and thecrystallinity) cannot explain the variation in the ageing rates of the pipes investigated.The characterisation of the processing stage concentrated on a number of additives(stabilisers, lubricants, fillers, etc.), typically expected in the uPVC pipes in the Dutchgas and water distribution networks. Their relative or absolute concentrations weredetermined employing a large number of analyses. No conclusive relation betweenthe presence/concentration of a single additive or combination of additives couldbe established that explains the variation in the ageing rates. However, to a certaindegree correlations with the lead content and the presence of polyethylene wax havebeen observed. The year of production of the uPVC pipe could be a worthwhilepiece of information as well, as there seems to be a considerable difference betweenthe ageing behaviour of pipes produced before 1980 mainly for gas distributionpurposes and those produced after this year for water distribution purposes. Anelaborate study considering an even broader range of additives should be carriedout to elucidate the origin of the variations in ageing rates observed. In addition,a relation between the ageing rate and the temperature at the maximum loss angleof the β-relaxation has been found. The latter enables a quicker way to determinethe ageing kinetics and may be a possible route to determine the residual lifetimequantitatively in the future by also assessing the ageing rate in addition to the yieldstress.
The level of gelation is the second important property that affects the failurebehaviour of uPVC pipes. The level is controlled by the production process ofthe uPVC pipe and remains constant during the lifetime of the pipe. The gelationlevel is mostly lowest in the interior of the pipe wall. First, a systematic literaturesearch was carried out to identify possible methods that allow in-situ, non-destructiveand through thickness determination of the gelation level. Possible methods werestudied in detail and evaluated, but currently no method is available that meets allrequirements. A possible method developed in this thesis that is destructive to a smallextent only is the micro-Methylene Chloride (MC) test. It is the small scale, more localversion of the commonly applied MC test. The microMC experiments carried out onunused uPVC gas pipes have shown that it is indeed possible to determine the levelof gelation of these pipes by milling a small hole to a depth of about 30% of thewall thickness of the (gas) pipe. The newly developed microMC method may beparticularly suitable for thick-walled pipes as used in water distribution networks.Here, more problems with the level of gelation are observed and the required millingdepth vs wall thickness ratio decreases drastically (to below 5%). Further study,especially to the temperature dependence of the method, can minimise the degree
iv
of material removal. The almost non-destructive method would be useful to locatesuspected uPVC pipes having low levels of gelation, if the major drawback of gettingpermission to perform in-situ measurements with MC in water pipes is overcome.
The research conducted in this PhD thesis forms an important step towardsanswering the main question posed: How can we determine when a uPVC pipeshould be replaced? The research provides clear suggestions to the practicalimplementation of an in-situ residual lifetime assessment method based on the effectsof physical ageing and the level of gelation on the failure behaviour of uPVC pipesused for gas and water distribution networks.
Samenvatting
Het Nederlandse gas- en waterdistributienetwerk bestaat voor een significant deeluit ongeplastificeerd polyvinylchloride (uPVC) buizen: ongeveer 21.000 km (20 %) inhet gasdistributienetwerk en 60.100 km (48 %) in het waterdistributienetwerk. Hetovergrote deel van deze leidingen is geïnstalleerd van halverwege de vijftiger jarentot halverwege de zeventiger jaren van de vorige eeuw en transporteren sindsdiengas of water. Oorspronkelijk is de levensduurverwachting van de uPVC leidingen op50 jaar geschat. Gezien de periode van installatie heeft een deel van de leidingendeze leeftijd inmiddels overschreden. De vervanging van de leidingen op basisvan de initieel verwachte levensduur zou leiden tot een enorm werkintensief enkostbaar project. Het uitstellen van vervanging heeft de voorkeur, maar is echteralleen mogelijk wanneer de veiligheid en de integriteit van het netwerk niet in gevaarkomt. Het voornaamste doel van dit proefschrift is om antwoord te geven op devraag: hoe kunnen we bepalen wanneer een uPVC buis vervangen moet worden?
In 2005 startte in samenwerking met de Nederlandse netwerkbeheerders de ont-wikkeling van een methodiek om de huidige conditie en de restlevensduur van uPVCbuizen te bepalen. Al in een vroeg stadium werd duidelijk dat de meeste storingenaan uPVC gasleidingen veroorzaakt worden door slagbelasting van graafwerk-zaamheden (van derden). Bij brosse breuk is het risico op (fatale) incidentengroter dan bij taaie breuk. Het optreden van brosse breuk wordt beschouwdals de belangrijkste limiet voor de restlevensduur van uPVC gasbuizen. Brossebuizen zouden daarom gelokaliseerd en vervangen moeten worden. In het eerstepromotietraject binnen dit restlevensduurproject is naar voren gekomen dat de matevan fysische veroudering en de geleringgraad twee belangrijke factoren zijn diezorgen voor brosse breuk. Methoden zijn ontwikkeld om de kinetiek van hetverouderingsproces te bepalen en om de parameters te bepalen welke gebruiktzouden kunnen worden voor een vervangingscriterium voor uPVC buizen.
In dit tweede promotietraject ligt de nadruk op het doorontwikkelen van debestaande restlevensduurmethode tot op het niveau waarbij in-situ toepassing inuPVC buizen realistisch wordt (hoofdstuk 2). Een nieuwe methode is ontwikkeldom de kritische conditie te bepalen (hoofdstuk 3). Een systematisch onderzoeknaar de variatie in de verouderingskinetiek is uitgevoerd (hoofdstuk 4). Alslaatste is onderzoek uitgevoerd naar de in-situ bepaling van de geleringsgraad.Het onderzoek naar elk van deze onderwerpen is beschreven in opeenvolgendehoofdstukken, gevolgd door een voorstel voor praktische implementatie van de
v

vi
restlevensduurmethode en de belangrijkste conclusies en aanbevelingen.
Na de extrusie van een buis is het PVC materiaal niet in een thermodynamischevenwicht en ondergaat het fysische veroudering. Tijdens dit proces vinden ver-anderingen in de thermodynamische toestand plaats en stijgt de vloeispanning vanhet materiaal. In hoofdstuk 2 is een nieuwe methode ontwikkeld om veranderingenin de thermodynamische toestand op niet-destructieve wijze te kunnen kwantificeren.De ontwikkelde methode is erop geselecteerd dat miniaturisatie tot de typischebinnenafmetingen van uPVC buisnetwerken realistisch is. De meetmethode bestaatuit een indentatie met een micro-Vickers indenter met een lage toegepaste belastingom de buis zo minimaal mogelijk te beïnvloeden en uit een bepaling van detopografie van de indrukkingen met confocaal microscopie. De hardheid wordtbepaald uit de diepte van de indrukking. De vloeispanning en de hardheid vertonenhetzelfde gedrag bij fysische veroudering, wat het mogelijk maakt om veranderingenin de thermodynamische toestand te bepalen aan de hand van de corresponderendeveranderingen in de gemeten hardheid. Vervolgens kan de restlevensduur opniet-destructieve wijze bepaald worden met de verouderingskinetiek en door hetaannemen van een kritische limiet van de vloeispanning en/of hardheid. Demeetmethode is onderhevig aan variatie in de gemeten hardheid. De variatie inhardheidswaardes komt voort uit de aanwezige oppervlakteruwheid. Vanwege deaanwezigheid van oppervlakteruwheid is bewust niet gekozen voor een voorbe-handeling van het oppervlak om de meetmethode simpel te houden met het oogop praktische implementatie in buizen. Een statistische analyse laat zien dat hetaantal benodigde metingen bepaald kan worden uit de gewenste precisie van derestlevensduur. De gepresenteerde methode heeft een vergelijkbare gevoeligheidvoor fysische veroudering als de methode gebruikt in het vorige promotietraject,maar de gepresenteerde methode is meer robuust en daarom een stap dichterbijpraktische implementatie.
De restlevensduur van een uPVC buis kan alleen bepaald worden indien dekritische thermodynamische toestand, waarbij het faalgedrag van de buis over-gaat van taai naar bros, bekend en gekwantificeerd is. In hoofdstuk 3 is eenvloeispanningscriterium geformuleerd. Dit criterium impliceert dat een taai-brosovergang plaatsvindt wanneer de vloeispanning van PVC een kritische temperatuurs-en tijdsonafhankelijke waarde bereikt. Trekslagproeven zijn uitgevoerd om deverandering van de taai-bros overgangstemperatuur door isotherme verwarmingbeneden Tg te bepalen. Het vloeispanningscriterium is toegepast en geeft eengoede voorspelling van de toename in de taai-bros overgangstemperatuur met deverwarmingstijd hetgeen laat zien dat het criterium geldig is voor PVC. Met deuitgevoerde zaagtesten is verbrossing door fysische veroudering aangetoond. Ditresultaat maakt het mogelijk om een limiterende waarde van de vloeispanningvoor praktijkcondities te bepalen welke vervolgens gebruikt kan worden voorrestlevensduurbepalingen.

vii
In hoofdstuk 4 is de oorsprong van de variatie in de verouderingskinetiek van uPVCbuizen onderzocht. De verouderingskinetiek moet bekend zijn om de restlevensduurvan een buis te kunnen bepalen met de huidige vloeispanning (bepaald met eenhardheidsmeting) en een limiterende waarde van de vloeispanning (waarbij hetfaalgedrag bros wordt). De verouderingssnelheid is voor verschillende uPVC buizenbepaald met trekproeven. Significante verschillen tot een maximum van een factorvier in de verouderingssnelheid zijn waargenomen. Deze variatie komt mogelijkvoort uit verschillen in de fysische en/of chemische structuur en de samenstelling vande PVC buismaterialen en is mogelijk te herleiden tot de drie fases in de levensduurvan PVC buizen: polymerisatie, verwerking en/of service. De relatie tussen eenaantal geselecteerde (materiaal) eigenschappen van PVC en de verouderingssnelheidis onderzocht. Er is naar voren gekomen dat de eigenschappen die gerelateerd zijnaan de polymerisatiefase (dat wil zeggen de ketenstructuur, de ketenlengte en dekristalliniteit) niet de variatie in de verouderingssnelheid van de onderzochte uPVCbuizen kunnen verklaren. De karakterisatie van de verwerkingsfase concentreerdezich op een aantal toevoegstoffen (stabilisatoren, glijmiddelen, vulmiddelen etc.)welke normaal gesproken verwacht worden in uPVC buizen in het Nederlandsegas- en waterdistributienetwerk. De relatieve en absolute concentraties zijn bepaaldmet een groot aantal analyses. Er is geen overtuigend verband gevonden tussende aanwezigheid of concentratie van een enkel additief of een combinatie vanadditieven en de verouderingssnelheid. Echter, tot op zekere hoogte zijn er correlatiesmet het gehalte aan lood en de aanwezigheid van polyetheenwas. Daarnaast lijkter een aanzienlijk verschil te zijn tussen het verouderingsgedrag van gasbuizenvan voor 1980 en waterleidingen na dit jaartal. Een studie aan buizen meteen zelfs groter bereik aan verschillende toevoegstoffen zou uitgevoerd moetenworden om de oorzaak van de verschillen in de verouderingssnelheid te kunnenachterhalen. Daarnaast is een verband gevonden tussen de verouderingssnelheid ende temperatuur op het maximum van de verlieshoek van de β-relaxatie. Deze laatsteeigenschap maakt het mogelijk om de verouderingssnelheid op een snellere manierte bepalen dan voorheen en zou een mogelijke route kunnen zijn om in de toekomstnaast de vloeispanning ook de verouderingssnelheid te kunnen bepalen.
De geleringsgraad is de tweede belangrijke eigenschap die het faalgedrag van uPVCbuizen beïnvloedt. De graad wordt bepaald door het productieproces en is constantnadat de buis geproduceerd is. De geleringsgraad is voornamelijk het laagste in hetmidden van de buiswand. Als eerste is een systematische literatuurstudie uitgevoerdom mogelijke methoden te identificeren om de geleringsgraad op niet-destructieve enin-situ wijze tot in het midden van de buiswand te bepalen. De mogelijkheden metpotentiële methoden zijn in detail onderzocht en geëvalueerd. Echter, er is geenmethode gevonden die aan alle gestelde eisen voldoet. Een mogelijke methode,ontwikkeld in dit proefschrift, is de microMethyleenChloride (microMC) test welkealleen op een lokale schaal destructief is. Het is de op lokale schaal toegepaste versievan de veel gebruikte MC methode. De microMC-experimenten uitgevoerd op niet-

viii
gebruikte uPVC gasbuizen laten zien dat het mogelijk is om de geleringsgraad vandeze buizen te bepalen door het frezen van een kleine holte aan de binnenwandvan de buizen met een diepte van ongeveer 30 % van de wanddikte van de buizen.Deze nieuw ontwikkelde methode is voornamelijk geschikt voor dikwandige buizenzoals gebruikt in het waterdistributienetwerk. Met deze buizen zijn meer probleemmet de geleringsgraad waargenomen en de verhouding tussen de vereiste diepte vande holte en de wanddikte neemt drastisch af (tot beneden 5 %). Verder onderzoeknaar vooral de invloed van temperatuur kan leiden tot reductie van het benodigdemateriaal wat verwijderd moet worden. Deze bijna niet-destructieve methode zoubruikbaar kunnen zijn voor het lokaliseren van uPVC buizen met een te lage (ofte hoge) geleringsgraad mits het grote nadeel van het toestemming krijgen voormetingen met MC in waterleidingen, verleend is.
Het uitgevoerde onderzoek in dit promotietraject is een belangrijke stap in hetbeantwoorden van de vraag: hoe kunnen we bepalen wanneer een uPVC buisvervangen moet worden? Het onderzoek levert duidelijke suggesties op voor depraktische implementatie van een in-situ restlevensduurmethode welke gebaseerd isop de invloed van fysische veroudering en de geleringsgraad op het breukgedragvan uPVC buizen gebruikt in gas- en waterdistributienetwerken.

Nomenclature
Roman symbols:Aω absorbance at wavenumber ω [-]aT temperature induced acceleration factor [-]b0 pre-exponential factor in ageing kinetics [s−1]b1 exponent in ageing kinetics [-]CV coefficient of variation [%]E margin of error in Equation 2.8 [%]EtFmax≤t≤tf absorbed energy from the point of maximum force to fracture [kJ/m2]F force [N]Fmax maximum force [N]H activation energy [J/mol]H enthaply [J/g]Hδ hardness in Equation 2.5 [kgf/mm2]NA numerical aperture [-]n sample size in Equation 2.8 [-]R universal gas constant [J/(mol · K)]Ra arithmetic average roughness [µm]R2 coefficient of determination [-]R2
adj adjusted coefficient of determination [-]
S standard deviation in Equation 2.8 [kgf/mm2]s displacement [mm]stFmax≤t≤tf extension at break from the point of maximum force to fracture [mm]T temperature [K]Ta annealing temperature [K]Tg glass transition temperature [K]Tref reference temperature [K]Td→b ductile-to-brittle transition temperature [K]t time [s]ta annealing time [s]teff effective time [s]tini initial age [s]tf failure time [s]tFmax time at maximum force [s]
ix

x
t0 constant with the value 1 s [s]z critical value in Equation 2.8 [-]
Greek symbols:∆U activation energy [J/mol]∆Ua ageing activation energy [J/mol]δ indent depth [µm]ε̇ strain rate [s−1]ε̇0 pre-exponential factor [s−1]ν∗ activation volume [m3/mol]σ (tensile) stress [Pa]σcr critical tensile yield stress [Pa]σlim limiting tensile yield stress [Pa]σy yield stress [Pa]σy,mh yield stress determined from micro-hardness measurements [Pa]σ̇y ageing rate [MPa/decade]
Subscripts:α refers to α-relaxationβ refers to β-relaxation
Abbreviations:AFM atomic force microscopyDMA dynamic mechanical analysisDOP dioctyl phthalateDSC differential scanning calorimeryESC environmental stress crackingIR infraredMCT methylene chloride temperatureMC methylene chlorideNMR nuclear magnetic resonancePC polycarbonatePE polyethylenePET polyethylene terephthalatePVC poly(vinyl chloride)uPVC unplasticised poly(vinyl chloride)THF tetrahydrofuran

Contents
Summary i
Samenvatting v
Nomenclature ix
1 Introduction 11.1 Background and motivation . . . . . . . . . . . . . . . . . . . . . . . . . . 11.2 Service lifetime of uPVC networks . . . . . . . . . . . . . . . . . . . . . . 31.3 Factors causing brittle behaviour of uPVC pipes . . . . . . . . . . . . . . 4
1.3.1 Processing . . . . . . . . . . . . . . . . . . . . . . . . . . . . . . . . 41.3.2 Installation . . . . . . . . . . . . . . . . . . . . . . . . . . . . . . . . 51.3.3 Service . . . . . . . . . . . . . . . . . . . . . . . . . . . . . . . . . . 5
1.4 Objective . . . . . . . . . . . . . . . . . . . . . . . . . . . . . . . . . . . . . 71.5 Outline . . . . . . . . . . . . . . . . . . . . . . . . . . . . . . . . . . . . . . 8
2 Quantitative assessment of the residual lifetime of uPVC pipes employinga robust non-destructive micro-hardness approach 112.1 Introduction . . . . . . . . . . . . . . . . . . . . . . . . . . . . . . . . . . . 112.2 Micro-hardness approach . . . . . . . . . . . . . . . . . . . . . . . . . . . 13
2.2.1 Selection of hardness measurement method . . . . . . . . . . . . 132.2.2 Automated hardness determination . . . . . . . . . . . . . . . . . 132.2.3 Measure for the thermodynamic state . . . . . . . . . . . . . . . . 15
2.3 Experimental . . . . . . . . . . . . . . . . . . . . . . . . . . . . . . . . . . 162.3.1 Materials . . . . . . . . . . . . . . . . . . . . . . . . . . . . . . . . . 162.3.2 Specimens . . . . . . . . . . . . . . . . . . . . . . . . . . . . . . . . 162.3.3 Equipment . . . . . . . . . . . . . . . . . . . . . . . . . . . . . . . . 172.3.4 Indent analysis . . . . . . . . . . . . . . . . . . . . . . . . . . . . . 18
2.4 Precision of the Vickers indenter and the confocal microscope . . . . . . 182.5 Influence of visco-elastic recovery and physical ageing . . . . . . . . . . 202.6 Origin of the variation in Hδ values . . . . . . . . . . . . . . . . . . . . . 22
xi

xii Contents
2.7 Quantitative assessment of the residual lifetime of uPVC pipes . . . . . 252.7.1 Influence of physical ageing . . . . . . . . . . . . . . . . . . . . . 252.7.2 Relating the hardness Hδ to the yield stress . . . . . . . . . . . . 252.7.3 From hardness Hδ to residual lifetime . . . . . . . . . . . . . . . . 28
2.8 Discussion . . . . . . . . . . . . . . . . . . . . . . . . . . . . . . . . . . . . 322.9 Conclusions . . . . . . . . . . . . . . . . . . . . . . . . . . . . . . . . . . . 33
3 Predicting embrittlement of uPVC pipes 353.1 Introduction . . . . . . . . . . . . . . . . . . . . . . . . . . . . . . . . . . . 353.2 Theoretical background . . . . . . . . . . . . . . . . . . . . . . . . . . . . 38
3.2.1 Embrittlement upon physical ageing . . . . . . . . . . . . . . . . 383.2.2 Yield stress criterion for uPVC . . . . . . . . . . . . . . . . . . . . 39
3.3 Experimental . . . . . . . . . . . . . . . . . . . . . . . . . . . . . . . . . . 423.3.1 Materials and specimen preparation . . . . . . . . . . . . . . . . . 423.3.2 Test methods . . . . . . . . . . . . . . . . . . . . . . . . . . . . . . 44
3.4 Impact test results . . . . . . . . . . . . . . . . . . . . . . . . . . . . . . . . 453.4.1 Types of failure . . . . . . . . . . . . . . . . . . . . . . . . . . . . . 453.4.2 Characterisation of force-displacement curves . . . . . . . . . . . 47
3.5 Ductile-to-brittle transition analysis . . . . . . . . . . . . . . . . . . . . . 493.6 Predicting embrittlement in practice . . . . . . . . . . . . . . . . . . . . . 543.7 Discussion . . . . . . . . . . . . . . . . . . . . . . . . . . . . . . . . . . . . 563.8 Conclusions . . . . . . . . . . . . . . . . . . . . . . . . . . . . . . . . . . . 59
4 The variation of physical ageing kinetics of uPVC pipes 614.1 Introduction . . . . . . . . . . . . . . . . . . . . . . . . . . . . . . . . . . . 614.2 Possible factors influencing the ageing rate . . . . . . . . . . . . . . . . . 63
4.2.1 Stage 1: Polymerisation . . . . . . . . . . . . . . . . . . . . . . . . 634.2.2 Stage 2: Processing . . . . . . . . . . . . . . . . . . . . . . . . . . . 654.2.3 Stage 3: Service . . . . . . . . . . . . . . . . . . . . . . . . . . . . . 684.2.4 Resulting molecular mobility . . . . . . . . . . . . . . . . . . . . . 68
4.3 Experimental . . . . . . . . . . . . . . . . . . . . . . . . . . . . . . . . . . 694.3.1 Materials . . . . . . . . . . . . . . . . . . . . . . . . . . . . . . . . . 694.3.2 Ageing rate . . . . . . . . . . . . . . . . . . . . . . . . . . . . . . . 694.3.3 Determining properties related to stage 1: Polymerisation . . . . 694.3.4 Determining properties related to stage 2: Processing . . . . . . . 704.3.5 Determining properties related to stage 3: Service . . . . . . . . . 714.3.6 Determining properties related to molecular mobility . . . . . . 72

Contents xiii
4.4 Results and discussion . . . . . . . . . . . . . . . . . . . . . . . . . . . . . 724.4.1 Ageing rates . . . . . . . . . . . . . . . . . . . . . . . . . . . . . . . 724.4.2 Properties related to stage 1: Polymerisation . . . . . . . . . . . . 724.4.3 Properties related to stage 2: Processing . . . . . . . . . . . . . . 764.4.4 Properties related to stage 3: Service . . . . . . . . . . . . . . . . 814.4.5 Molecular mobility . . . . . . . . . . . . . . . . . . . . . . . . . . . 82
4.5 Conclusions . . . . . . . . . . . . . . . . . . . . . . . . . . . . . . . . . . . 87
5 Non-destructive determination of the level of gelation 895.1 Introduction . . . . . . . . . . . . . . . . . . . . . . . . . . . . . . . . . . . 895.2 Screening of test methods . . . . . . . . . . . . . . . . . . . . . . . . . . . 925.3 Experimental approaches . . . . . . . . . . . . . . . . . . . . . . . . . . . 99
5.3.1 Raman depth profiling . . . . . . . . . . . . . . . . . . . . . . . . . 995.3.2 MicroMC method . . . . . . . . . . . . . . . . . . . . . . . . . . . . 100
5.4 Experimental . . . . . . . . . . . . . . . . . . . . . . . . . . . . . . . . . . 1015.4.1 Materials . . . . . . . . . . . . . . . . . . . . . . . . . . . . . . . . . 1015.4.2 Raman depth profiling . . . . . . . . . . . . . . . . . . . . . . . . . 1015.4.3 MicroMC test . . . . . . . . . . . . . . . . . . . . . . . . . . . . . . 102
5.5 Results . . . . . . . . . . . . . . . . . . . . . . . . . . . . . . . . . . . . . . 1035.5.1 Raman Depth Profiling . . . . . . . . . . . . . . . . . . . . . . . . 1035.5.2 MicroMC method . . . . . . . . . . . . . . . . . . . . . . . . . . . . 105
5.6 Discussion . . . . . . . . . . . . . . . . . . . . . . . . . . . . . . . . . . . . 1095.7 Conclusions . . . . . . . . . . . . . . . . . . . . . . . . . . . . . . . . . . . 110
6 Residual lifetime assessment in practice 1136.1 Introduction . . . . . . . . . . . . . . . . . . . . . . . . . . . . . . . . . . . 1136.2 The ideal residual lifetime assessment method . . . . . . . . . . . . . . . 1156.3 Current status . . . . . . . . . . . . . . . . . . . . . . . . . . . . . . . . . . 115
6.3.1 Decision for replacement . . . . . . . . . . . . . . . . . . . . . . . 1156.3.2 Estimating the residual lifetime . . . . . . . . . . . . . . . . . . . 116
6.4 How to proceed . . . . . . . . . . . . . . . . . . . . . . . . . . . . . . . . . 117
7 Conclusions and Recommendations 1197.1 Conclusions . . . . . . . . . . . . . . . . . . . . . . . . . . . . . . . . . . . 1197.2 Recommendations . . . . . . . . . . . . . . . . . . . . . . . . . . . . . . . 121
A Table with pipes 123

xiv Contents
B Details of experimental analysis 125B.1 Properties related to polymerisation . . . . . . . . . . . . . . . . . . . . . 125B.2 Properties related to processing . . . . . . . . . . . . . . . . . . . . . . . . 127B.3 Properties related to molecular mobility . . . . . . . . . . . . . . . . . . . 131
C Multi-variable analysis 133

Chapter 1
Introduction
1.1 Background and motivation
Recent pipe failures, such as the large water leakage in the south of Amsterdam dueto a transportation pipe failure (September 2015) and the four gas pipe failures inApeldoorn in the last two years, which were partly caused by water pipe failures,have increased the public awareness of the existence of the underground water andgas transportation and distribution networks. The implications of such failure eventscan be severe: a hospital had to be partially evacuated in the case of the failureincident in Amsterdam. Therefore, the network service providers are continuouslytrying to increase their knowledge of the condition of their network to maintain thecurrent very low downtime and the high level of safety of the Dutch water and gasdistribution networks. Only asset managers equipped with sufficient informationon the current state of network assets can achieve this goal at acceptable cost, asreplacement based on age would require huge investments both in labour and moneyin the upcoming years.
In the mid-1950s, PVC was the first polymer chosen for pipes as an attractivealternative to cast iron, steel and asbestos cement, because of its relatively highresistance to chemical components in the soil and its low cost [1, 2]. A drawbackof unplasticised poly(vinyl chloride) (uPVC) pipes is that they are sensitive to impactloading events; it is known that some uPVC pipes can be very brittle. In the mid-sixties, the first generation of polyethylene (PE) gas pipes was introduced in the gasdistribution network. These pipes are more resistant to impact loads than uPVCgas pipes. As a reaction to this development, impact-modified PVC gas pipes weredeveloped and introduced in the mid-1970s [3], but no uPVC gas pipes have beeninstalled since. The impact-modified PVC contains modifiers such as chlorinatedpolyethylene or an acrylate modifier, which make the impact resistance greater thanthat of uPVC pipes. For water distribution purposes uPVC is still the preferredmaterial given the service conditions in the water distribution network [4]. More
1

2 Chapter 1. Introduction
recently biaxially-oriented PVC pipes have been introduced which have a higherimpact resistance [3, 5] and resistance against internal pressure [3] than uPVC pipes.
The material composition of gas and water distribution networks is shown inFigure 1.1. About 76% (78,000 km) of the gas distribution network consists of PVCpipes [6], of which 21,000 km are uPVC pipes and 57,000 km are impact-modifiedPVC pipes. For the water distribution network, about half (60,200 km) of the totallength consists of PVC pipes. The majority of these pipes are unplasticised and onlya few percent are biaxially-oriented.
Figure 1.1 Material composition of the gas distribution network (left) [6] and the water distributionnetwork (right) [7, 8] (data from 2014 and 2012 respectively).
The oldest uPVC pipes were installed in the mid-1950s. These pipes have certainlypassed their (already extended) service lifetime of 50 years. Replacing uPVC pipes assoon as they have passed their specified lifetime would lead to an extremely labourintensive and costly project. Most pipes were installed in densely populated areasand the qualified personnel involved in the installation of the network have retired.Hence, postponing the replacements over a larger time period is favourable, but onlywithout if safety is not compromised.
Up to now, uPVC pipes in gas and water distribution networks have performed ratherwell. The number of failures of uPVC gas pipes is about 8% of the total number offailures occurring in the gas distribution network [9]. The failure rate of uPVC waterpipes is about half of the failure rates of steel, cast iron and asbestos cement pipes,but about a factor two higher than for PE [4].
The gas and water network companies do not have a method available for deter-mining the current condition of their uPVC distribution networks, which is not inkeeping with their ambition to reduce future downtime. Replacement policies arecurrently based on parameters which are readily available within the distributioncompanies, such as installation data and post-mortem data. The latter information

1.2. Service lifetime of uPVC networks 3
comprises leakage data [9], failure data [4, 9] and laboratory test data on fractureduPVC pipes [10]. It would be very beneficial to network companies to have a methodwith which the current condition of the network components while in service can bedetermined. In fact, it would be even more beneficial if possible changes taking placeover time could be monitored as well and an estimate of the residual lifetime couldbe made. Then, more data will become available to locate and preventively replacecritical network components, reducing both unexpected high costs (repair costs andcompensation costs of affected customers) and distrust of customers and supervisingauthorities. Hence, a method for monitoring and predicting the condition of pipeswould be very valuable to support the development of more effective replacementpolicies.
The development of a framework for a residual lifetime assessment method for uPVCpipes started in 2005 in collaboration with a number of Dutch network companies.This is the second research project on this topic and is supported by eight industrialpartners from the Dutch gas and water distribution sectors. For the development ofthe framework, the key aspects that influence the service lifetime of uPVC networkshave to be described first.
1.2 Service lifetime of uPVC networks
The uPVC distribution networks consist of many components such as pipes, jointsand saddles. Failure data shows that 75% of all failures in the uPVC gas networkoriginate from pipes rather than from other components [9]. Moreover, pipe failuregenerally has greater implications than failures of joints or saddles. Therefore, thecurrent research project focuses only on pipes; other network components will not beconsidered.
During the service life of a pipe, several factors may induce failure. Firstly, externalfactors like poor installation and soil subsidence may cause premature failure ofuPVC pipes [11, 12]. Secondly, the internal pressure in the network may cause micro-cracks to develop prior to failure. However, the stresses in the pipe walls are lowenough to prevent this kind of failure as the pressure in uPVC gas pipes does notsurpass 100 mbar. In fact, only a small amount of occurrences of failures caused byinternal or external loading are reported for the gas network [9].
For uPVC water distribution mains the wall stresses induced by the internal pressureare significantly higher and crack growth failure does occur and accounts for about37% of all failure incidents [4]. Although relevant, the crack growth behaviour ofuPVC water mains is outside the scope of this thesis.
In general, failures of uPVC gas pipes can be attributed to (third party) excavationactivities [6] as they constitute about 50% of the total number of failures. For watermains third party damage is also an important cause of failures [4]. For this type
4 Chapter 1. Introduction
of failure it is of particular importance whether a uPVC pipe fails in a brittle orductile way when hit during groundwork. Although a ductile pipe can absorb moreenergy before failing, it will not prevent failure, as in most cases there is an excess ofimpact energy due to the machinery used. Nonetheless, ductile failure is preferredfor three reasons. Firstly, a relatively larger part of the pipe is damaged after abrittle failure event. Secondly, the sharp, irregular fracture surface makes it moredifficult to stop the outflow of gas or water using a temporary stopper. In addition,there is an increased risk of crack propagation at the moment the pipe is plugged.Thirdly, the replacement of the temporary plugged pipe section usually involvessawing. For a brittle pipe, new cracks can readily form during sawing, which canresult in additional brittle failure. For these three reasons, the probability of (fatal)incidents is higher for brittle pipes than for ductile pipes. Consequently, the qualityand safety of the network is enhanced if pipes that behave in a brittle manner can beidentified and replaced. In the next section it will be shown that uPVC pipes becomemore brittle in the course of time and, in some cases, are already brittle directly afterproduction.
1.3 Factors causing brittle behaviour of uPVC pipes
There are various reasons why a uPVC pipe can display brittle behaviour. Thereasons can be linked to the various stages during the lifetime of uPVC pipes:processing, installation and service. In this section, causes for brittle behaviour ofuPVC are discussed in the order of the stages.
1.3.1 Processing
The raw material used for the extrusion of uPVC pipes is a powder. The PVCpowder is mostly produced using suspension polymerisation, but emulsion or masspolymerisation have been applied too. For most other polymers, extrusion is possibleusing thermal energy only. However, PVC will degrade (at ∼200 ◦C) before thecrystallites in the material are fully molten (265 ◦C); hence PVC cannot be extrudedfrom a melt. Different measures are taken to reduce the thermal degradation duringprocessing. Firstly, PVC is processed below the crystalline melting temperature (180 -200 ◦C) using high shear rates in addition to heat. Secondly, lubricants and thermalstabilisers are added to reduce the degradation during processing. Finally, PVC pipesare commonly produced using counter-rotating twin-screw extruders to ensure a lowdistribution of residence time of PVC material inside the extruder, further preventingthermal degradation.
A problem arising from this processing method is that it is difficult to completelydestroy the particulate structure of the uPVC powder and get a homogeneous
1.3. Factors causing brittle behaviour of uPVC pipes 5
material. The degree to which this homogenisation process is accomplished isreferred to as the level of gelation. The level of gelation is an important parameter forthe impact properties of a uPVC pipe. For example, when the particulate structure isstill partly intact, it can act as a craze initiation site [13–15], leading to poor impactresistance [16–18] and brittle failure [19, 20]. In the early years of the production ofuPVC pipes, the extrusion process was not always fully under control. As a result,uPVC pipes with a wide variation in the level of gelation were installed [10, 20].The level of gelation is therefore considered an important factor which influences theimpact resistance of buried uPVC pipes. The level of gelation is fixed after processingand does not change with time [10]. It is thus a measure for the initial (impact) qualityof the pipe.
Other processing-related factors that can influence the impact resistance of uPVCpipes are molecular orientation [21, 22], residual stress [23] and molecular weight [24].The studies cited show that effects of molecular orientation and residual stress on theimpact properties are marginal. These factors are therefore not taken into accountin the present research project. The molecular weight only has an influence on theimpact resistance of uPVC pipes at relatively low molecular weights. As most ofthe pipes produced after the mid-1960s have a significantly higher molecular weight,variation in impact resistance as caused by molecular weight is not expected as longas chemical degradation does not take place.
1.3.2 Installation
Before installation, uPVC pipes can degrade during storage as a result of weathering,i.e. the exposure to outdoor conditions. The ultraviolet rays in the sunlight contributemost to the embrittlement. The rays cause a decrease in the molecular weight andsubsequently in the impact resistance [25–28]. After installation the ultraviolet rayscannot reach the surface of buried pipes and do not contribute to embrittlementduring service. Hence, weathering is not taken into account in this study.
1.3.3 Service
Four processes are known to degrade uPVC pipes during service life: (i) chemicaldegradation, (ii) slow crack growth, (iii) environmental stress cracking (ESC) and (iv)physical ageing. Each of the four processes is discussed below.
The presence of oxygen can cause chemical degradation, leading to a decrease in themolecular weight and, subsequently, to a decrease in impact resistance, similar to theinfluence of ultraviolet rays. Deterioration by oxygen was already known at the timeof production of uPVC pipes, and measures have been taken to improve the resistanceto degradation [29]. Furthermore, the concentration of oxygen and the temperature
6 Chapter 1. Introduction
during service are relatively low. It can therefore be expected that degradation ofburied uPVC pipes by oxygen is very low.
When a uPVC pipe is subjected to a tensile stress, the existing imperfections in thepipe can evolve into cracks that slowly grow. This process is called slow crack growth.The presence of cracks decreases the impact resistance, making a pipe more proneto brittle failure. Cracks can grow from imperfections such as surface scratches [12]and/or internal flaws such as inhomogeneously dispersed additives, having a typicalsize of about 50-250 µm [20, 30]. However, the stresses exerted on buried uPVC gaspipes are relatively low, as gas pipes operate at a maximum pressure of 100 mbarabove atmospheric pressure. A decrease in the impact resistance as a result of slowcrack growth is therefore not expected, provided that the pipes are installed correctly.The uPVC water pipes operate at higher internal pressures and these pipes may sufferfrom slow crack growth. The influence of slow crack growth on the service lifetimeand impact resistance of uPVC water pipes is beyond the scope of the present study,as already mentioned.
The ESC process is similar to slow crack growth except that the crack growth isnow stimulated by the presence of a chemical agent. The formation of cracks wasobserved in some uPVC pipes, but exclusively on their pipe inner surfaces, showingthat buried uPVC pipes do not suffer from ESC caused by chemical components inthe surrounding soil [31]. The origin of the problem was that the distributed gascontained aromatic compounds that may cause ESC and a concomitant reductionof the impact resistance of the uPVC gas pipes [31–35]. However, these studiesshowed that ESC is unlikely to occur when uPVC gas pipes are subjected to theconcentration of aromatic components conventionally present in Dutch natural gas.Even the presence of gas condensate, which can stimulate the formation of ESCrelated cracks, is hardly ever encountered in the Dutch gas network, so there arevery few potential risk locations. Hence, the ESC process is not regarded as a criticalfactor to cause embrittlement during the service life of uPVC gas pipes and will notbe considered further in this thesis.
The mechanical properties of uPVC pipes can also change without any influence fromtheir surroundings as a result of physical ageing. The cause of this phenomenon isthat glassy polymers like uPVC* are not in a state of thermodynamic equilibrium, butcontinuously strive towards it [37, 38]. As a result, the polymer molecules rearrangeover time, resulting not only in a marginal change of the polymer density, but also inmodified mechanical properties due to the increased intermolecular interaction. Forexample, the yield stress increases over time [39, 40]. The influence of physical ageingon the intrinsic deformation behaviour of a glassy polymer is shown schematically
*A glassy polymer is incapable of crystallising and the solid state is characterised by an amorphousarrangement of molecules. The crystallinity of uPVC is generally up to about 8-10% [36] and themechanical properties of the uPVC match those of amorphous polymers, rather than semi-crystallinepolymers. Therefore, uPVC is referred to as an amorphous or glassy polymer throughout this thesis.

1.4. Objective 7
¢ ¡¤ £¦ ¥̈ § © © !" § © # ©
$ # § %& !
softening hardening
yield
True strain
Tru
e st
ress
ageing
Figure 1.2 A schematic illustration of the influence of physical ageing on the intrinsic deformationbehaviour of a glassy polymer like uPVC in compression. The solid and dashed linesrepresent, respectively, the true stress-strain response before and after annealing below Tg.
in Figure 1.2. Clearly, the yield stress increases due to physical ageing and, sincethe hardening behaviour remains unchanged, also the softening part of the intrinsicdeformation behaviour is increased. The latter effect promotes strain localisationleading to a decrease in impact resistance [41–44] and can eventually lead to brittlefailure [45]. It is important to note that physical ageing always occurs in uPVC pipesif kept at a temperature between its glass transition temperature (Tg ≈ 85 ◦C foruPVC) and its secondary glass transition temperature [46] (Tβ ≈ -50 ◦C for uPVC).Therefore, physical ageing occurs during the service life of water and gas pipes. It isconsidered an important contributor to the embrittlement of uPVC pipes. Significantdifferences in the ageing rates amongst uPVC pipes were observed [45], where ahigher ageing rate leads to embrittlement occurring earlier.
To summarise this section, physical ageing and the level of gelation are consideredthe two most important factors that limit the lifetime of uPVC gas and water pipes.Hence, a residual lifetime assessment method for uPVC gas pipes should take thesefactors into account.
1.4 Objective
The objective of this second research project is to improve and extend the currentlyavailable non-destructive residual lifetime assessment method for uPVC gas pipes asdeveloped in [47]. More specifically, the present study aims to improve the robustnessand precision of the available assessment procedure, as well as to provide a way ofmeasuring the level of gelation of uPVC pipes in a minimally invasive way. Moreover,the range of uPVC pipes studied is extended to give insight into the variation inageing kinetics and the root cause of this variation. In other words: the project tries

8 Chapter 1. Introduction
to answer the underlying question: how can we determine when a uPVC pipe shouldbe replaced? The outline of the thesis is described below.
1.5 Outline
A visual representation of the outline of this thesis is shown in Figure 1.3. The core ofthe thesis comprises five chapters (Chapters 2 to 6), which can be read independently.
Discussion
Chapter 6Residual lifetime
model
Chapter 2
Micro-hardness
Chapter 4
Ageing rate
Chapter 3
Critical condition
Chapter 5
Level of gelation
Figure 1.3 Outline of the thesis.
In Chapter 2, a robust micro-hardness method is developed which can be usedto determine non-destructively the yield stress of a uPVC pipe. Physical ageingcauses the yield stress to slowly increase in the course of time. The condition ofa uPVC pipe, also called the thermodynamic state, is related to the yield stress aswas shown schematically in Figure 1.2. The variation in measured hardness valuesis an important factor limiting the resolution of the residual lifetime assessmentmethod [47]. The origin of the variation in hardness values will be investigated aswell.
The increase in the yield stress due to physical ageing ultimately leads to a brittlefailure behaviour of the uPVC pipes. Network companies need a certain criterionto decide whether or not a uPVC pipe needs to be replaced. In Chapter 3 theeffects of physical ageing on the failure behaviour are investigated. A stresscriterion is described that allows the determination of the ductile-to-brittle transitiontemperature as a function of the extent of physical ageing. The residual lifetime ofthe pipe follows from the limiting yield stress and the kinetics of the ageing process.
The development of the yield stress as a function of time due to physical ageing, i.e.the ageing rate, is an important factor determining the residual lifetime of a uPVCpipe. If the ageing rate is high, a pipe quickly reaches a limiting yield stress value

1.5. Outline 9
and needs replacement. Prior work [47] has shown a range of ageing rates amongthe various uPVC pipes investigated. In Chapter 4 an in-depth study is performedon a large group of excavated and unused gas and water distribution uPVC pipesto elucidate the possible causes, grouped according to the different lifetime stages ofa uPVC pipe (processing, installation and service). If the origin of the ageing ratedifferences becomes clear, an appropriate measurement technique may be developedin the future to determine in situ the ageing rate of a uPVC pipe.
The residual lifetime of a uPVC pipe depends not only on changes over time causedby physical ageing, but also by the initial product quality as characterised by the levelof gelation. In Chapter 5 a systemic study is performed to identify possible methodsthat allow in-situ, non-destructive determination of the level of gelation over variousthicknesses. Possible alternative measurement methods are considered as well.
In Chapter 6 the practical implementation of the residual lifetime assessment methodis discussed based on the findings presented in Chapters 2 to 5. The conclusions andrecommendations for future research are presented in Chapter 7.

10 Chapter 1. Introduction
Chapter 2
Quantitative assessment of the residuallifetime of uPVC pipes employing arobust non-destructive micro-hardnessapproach
2.1 Introduction
Unplasticised poly(vinyl chloride) (uPVC) pipe materials have been used for a longtime in the Dutch gas and water distribution networks. In the course of time themechanical properties of the materials change due to physical ageing, as explainedin the introduction of the thesis. The physical ageing process is associated with smallchanges in conformation of the molecular chains of the polymer. After manufacturingof the uPVC pipe relatively rapid cooling has caused the material to be in a non-equilibrium thermodynamic state, which serves as the driving force for the physicalageing process. The conformational changes lead to an increase of the resistanceagainst plastic deformation; the yield stress of the uPVC pipe increases, making theuPVC pipe stronger, but yet more prone to unwanted brittle failure if impacted.All pipes being too brittle should be located in good time and replaced for safeexploitation of the uPVC distribution network.
Non-destructive, in situ and autonomous monitoring of changes in the thermody-namic state of uPVC pipes would be a helpful approach for the development of cost-effective replacement strategies. Autonomous robots for inspection of low-pressuregas distribution networks are currently in development [48–50]. Such robots can carryout inspection and measurements from inside the pipe, making expensive excavationto expose the uPVC pipe network unnecessary.
Micro-indentation [47] and ultrasonic non-collinear wave mixing [51] are pos-
11

12Chapter 2. Quantitative assessment of the residual lifetime of uPVC pipes employing a
robust non-destructive micro-hardness approach
sible non-destructive measurement techniques for determining changes in thethermodynamic state of uPVC materials. The micro-indentation systems andultrasonic transducers/receivers can be made quite compact to fit within uPVC pipes,increasing the potential to use these techniques for practical pipe inspection methods.However, a measurement procedure for determining changes in the thermodynamicstate automatically employing the non-collinear wave mixing technique is lesswell developed than in the case of the micro-indentation technique. This chaptertherefore continues with using the micro-indentation technique and the ultrasonicnon-collinear wave mixing will not be elaborated on.
This research project focuses on (i) monitoring changes in the thermodynamic state ofuPVC pipes using a micro-hardness approach and (ii) predicting the residual lifetimeof uPVC pipes. The development of the monitoring system should lead to a simpleand robust system that is easy to operate, performs in a reliable way and requires onlysmall amounts of energy and maintenance. It was therefore decided to refrain frompre-treatment of the specimen surfaces. No grinding and/or polishing of the innerwall of the uPVC pipes has to be carried out. In this way additional pre-treatmentfunctionality does not need to be integrated within future autonomous robot systems.
Recently, Visser et al. have shown that changes in the thermodynamic state of uPVCpipe specimens can be monitored non-destructively employing instrumented micro-indentation measurements [47]. A linear relation between the yield stress and thehardness, as deducted from the micro-indentation measurements, was found. Thisresult shows that the hardness can be related to the ageing kinetics of the yield stressand allows the age of an uPVC pipe to be determined non-destructively using micro-indentation measurements. The residual lifetime of the uPVC pipe material could bepredicted if a critical limit to the yield stress (at which the failure behaviour of thepipe become unacceptable) was assumed [45, 47].
However, the methodology faced two practical problems: (i) a rather complicatedand sensitive instrument was required to assess the material’s hardness and (ii) theprecision of the residual lifetime assessment method was fairly low.
In this study a new and more robust measurement set-up is presented that is lesssensitive to changes in environmental conditions and could form the basis for futurein-situ pipe inspection systems. The set-up is based on micro-Vickers hardnessmeasurements; it is presented in the first part of the chapter. The influence ofsurface roughness and (visco) elastic recovery on the precision of the micro-Vickershardness measurements is studied in the next part of the chapter. Finally, hardnessmeasurements have been performed employing the new set-up to assess the influenceof physical ageing on the mechanical properties of a series of uPVC specimens takenfrom the gas and water distribution networks. A statistical approach is included toestimate the residual lifetime of aged uPVC pipes.

2.2. Micro-hardness approach 13
2.2 Micro-hardness approach
2.2.1 Selection of hardness measurement method
Various hardness measurement methods, such as Shore, Vickers, Brinell and Rock-well B & C [52–55], could be applied to determine the hardness of polymers. Thehardness, as a measure of the resistance against plastic deformation, is determinedfrom the depth or width of the resulting indent. The determination of the hardness ina relatively small uPVC pipe requires a measurement set-up that is correspondinglysmall or that has the potential to be manufactured to such dimensions. The thicknessof a uPVC pipe wall is typically of the order of a few millimetres putting, constraintson the hardness measurement method. The depth of the indent should remain smallto avoid interference of the hardness measurement by the material supporting andsurrounding the buried uPVC pipe in the soil. The use of a micro-hardness approachis proposed for this reason and the micro-Vickers hardness measurement has beenselected. This approach uses a small pyramidal diamond indenter, which is pressedinto the specimen employing a constant mass. The hardness is usually determinedfrom the average length of the indent diagonals. These lengths are commonlydetermined using a dedicated light microscope that goes with the micro-Vickersset-up. Older systems require manual determination of the diagonal lengths, butmodern systems use automated image recognition techniques. The value of the masscan be selected on the basis of the anticipated indent dimensions. For measurementof the micro-Vickers hardness of uPVC pipes the indent widths are of the order of100-200 µm, employing a mass of 200 g. In this case the indent depths are of theorder of only 10-20 µm, which is sufficient to prevent any influence of the materialsupporting the uPVC specimen on the hardness determination. In this way, themicro-Vickers hardness measurement approach is virtually non-destructive for theuPVC pipe material.
2.2.2 Automated hardness determination
The in-situ inspection of many kilometres of gas and water pipes requires afast, robust and reliable hardness measurement system. Automated hardnessdetermination is essential to map the hardness distribution in the pipe networkeffectively. Indents are placed at numerous positions within the pipes and shouldbe analysed quickly and reliably. The image recognition system works best if theimages show sufficient contrast, i.e. the indents are clearly discernible from theadjacent unindented pipe material. This puts demands on the contrast and resolutionof the indent images obtained and, related to this, on the quality of the materialsurface under study. In this thesis the pipe material on the inside of the uPVC pipesis not polished, for reasons explained in the introduction. As a consequence the

14Chapter 2. Quantitative assessment of the residual lifetime of uPVC pipes employing a
robust non-destructive micro-hardness approach
automatic determination of the hardness becomes challenging. This will be explainedwith the help of Figure 2.1. A schematic representation of a Vickers indent for afully plastic material is shown in Figure 2.1 left by the grey lines. The indenteris still present although not drawn here. After removal of the indenter, the blacklines show the typical outline of an indent in uPVC, indicating that the materialshows considerable visco-elastic behaviour. As such, this does not pose a problem,however; the corresponding optical image of such an indent for a representativeuPVC specimen is shown in Figure 2.1 right. The poor reflective properties of uPVCcauses reduced image contrast. The outline of the indent is not visible in this image,making the determination of the diagonal lengths impossible. Hence, conventionalimage recognition techniques applied to optical images of indented uPVC pipes failto accurately determine the diagonal lengths.
50 µm
Figure 2.1 Left: a schematic representation of a Vickers indent for a fully plastic material (grey lines)and for a uPVC pipe material (black lines). The arrow in the centre of the indent indicates theindent depth δ after (elastic and) visco-elastic recovery of a PVC material. The four dashedarrows indicate the edges of the indent. Right: an optical image (enhanced for clarity) of anindent in a PVC material taken using the optics on Vickers indentation system. The whitearrow indicates the location of the indent tip.
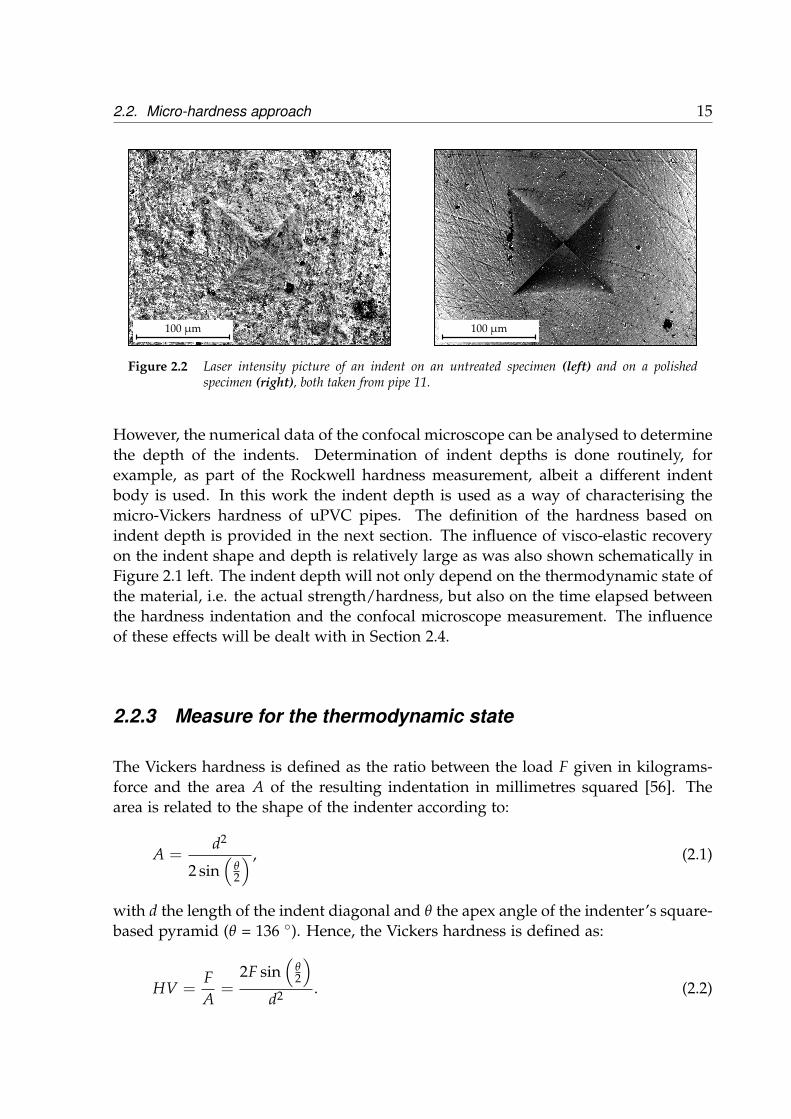
A different approach is followed here. The indents and an area in the vicinity ofthe indents are scanned by a confocal microscope after indentation. This microscopeprovides surface topology data that allows in principle the determination of the shapeof the indent on a uPVC specimen surface. An example of the laser intensity pictureobtained from an indented uPVC pipe specimen is shown in Figure 2.2 left. Theoutline of the indent is more clearly visible than in Figure 2.1 right, despite thepresence of surface roughness. Unfortunately, the indentation procedure does noteliminate the surface roughness at the location of the indent. Small-scale asperitiesremain after indentation, possibly as a result of (visco) elastic recovery. This surfaceroughness hampers the straightforward determination of the diagonal lengths as itis difficult to locate the diagonal ends precisely. A control specimen with a polishedsurface has been indented as well under comparable conditions, see Figure 2.2 right.In that case determination of the diagonal lengths of the indent is very possible. Itshows that the confocal microscope in principle allows for an accurate determinationof the indent dimensions, but that the surface roughness reduces the accuracy.
2.2. Micro-hardness approach 15
100 µm 100 µm
Figure 2.2 Laser intensity picture of an indent on an untreated specimen (left) and on a polishedspecimen (right), both taken from pipe 11.
However, the numerical data of the confocal microscope can be analysed to determinethe depth of the indents. Determination of indent depths is done routinely, forexample, as part of the Rockwell hardness measurement, albeit a different indentbody is used. In this work the indent depth is used as a way of characterising themicro-Vickers hardness of uPVC pipes. The definition of the hardness based onindent depth is provided in the next section. The influence of visco-elastic recoveryon the indent shape and depth is relatively large as was also shown schematically inFigure 2.1 left. The indent depth will not only depend on the thermodynamic state ofthe material, i.e. the actual strength/hardness, but also on the time elapsed betweenthe hardness indentation and the confocal microscope measurement. The influenceof these effects will be dealt with in Section 2.4.
2.2.3 Measure for the thermodynamic state
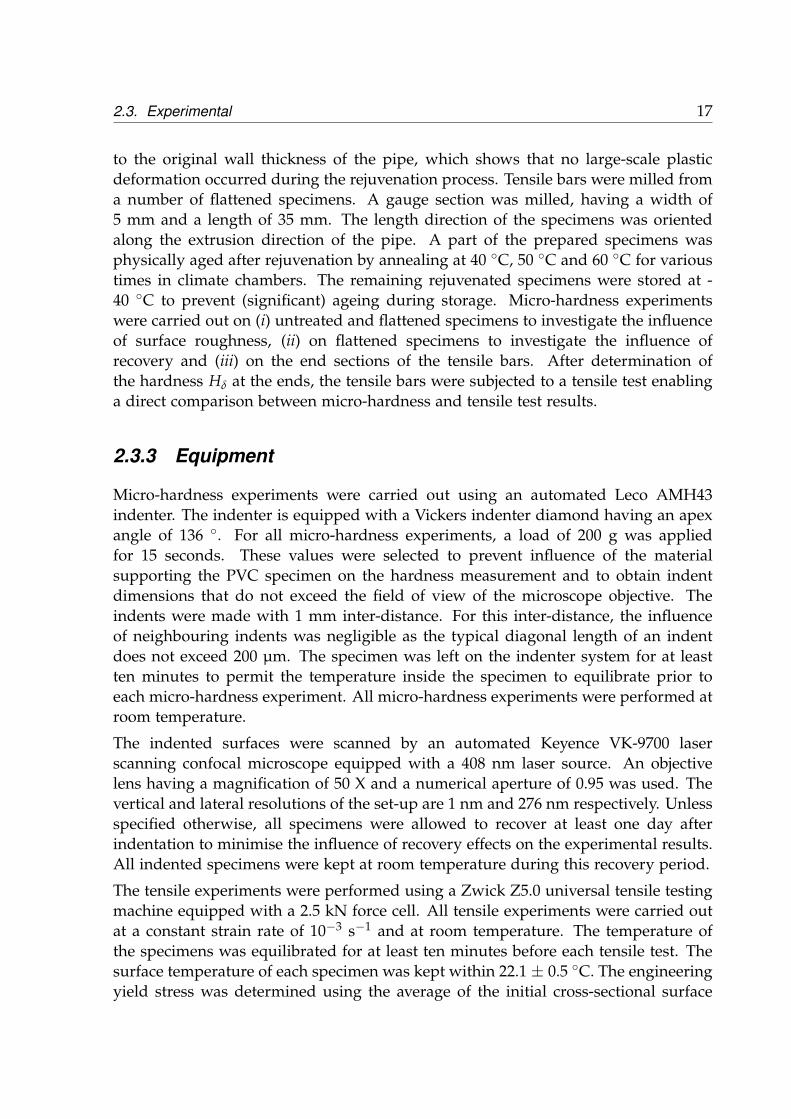
The Vickers hardness is defined as the ratio between the load F given in kilograms-force and the area A of the resulting indentation in millimetres squared [56]. Thearea is related to the shape of the indenter according to:
A =d2
2 sin(
θ2
) , (2.1)
with d the length of the indent diagonal and θ the apex angle of the indenter’s square-based pyramid (θ = 136 ◦). Hence, the Vickers hardness is defined as:
HV =FA
=2F sin
(θ2
)d2 . (2.2)

16Chapter 2. Quantitative assessment of the residual lifetime of uPVC pipes employing a
robust non-destructive micro-hardness approach
The relation between the length of the diagonal d and the indent depth, δ, is givenby:
δ =d
2√
2 tan(
θ2
) . (2.3)
Combining Equations 2.2 and 2.3, the following relation can be derived:
HV =F cos
(θ2
)4δ2 tan
(θ2
) = CFδ2 , (2.4)
with C ≈ 0.0378 if no (visco)-elastic recovery occurs. In general, recovery effectsare expected after indentation of a thermoplastic material, such as uPVC. Hence, analternative hardness scale is defined on the basis of the measured indent depths δ as:
Hδ =Fδ2 , (2.5)
neglecting the term C. The last step is only allowed if the influence of the (visco)-elastic recovery is independent of the thermodynamic state and level of gelation of theuPVC pipe materials considered. It will be shown in Section 2.4 that this assumptionis indeed valid for the materials studied in this thesis.
2.3 Experimental
2.3.1 Materials
All specimens were taken from unused uPVC gas pipes (pipes 10-13) and an unuseduPVC water pipe (pipe 8). Pipes 10-13 have the same composition, but differ only inlevel of gelation. The diameter and wall thickness of the pipes are given in Table A.1in Appendix A.
2.3.2 Specimens
Specimens of approximately 70×70 mm2 were taken from the unused uPVC pipes.A part of the specimens was pressed at 100 ◦C (about 20 ◦C above the glass transitiontemperature Tg) for 25 minutes between metal plates at a compressive stress of 2 MPa.This operation erased the thermodynamic history of the material (rejuvenation). Thepressed specimens were subsequently cooled under pressure to room temperaturewithin 5 minutes. The thickness of the flattened specimens was approximately equal
2.3. Experimental 17
to the original wall thickness of the pipe, which shows that no large-scale plasticdeformation occurred during the rejuvenation process. Tensile bars were milled froma number of flattened specimens. A gauge section was milled, having a width of5 mm and a length of 35 mm. The length direction of the specimens was orientedalong the extrusion direction of the pipe. A part of the prepared specimens wasphysically aged after rejuvenation by annealing at 40 ◦C, 50 ◦C and 60 ◦C for varioustimes in climate chambers. The remaining rejuvenated specimens were stored at -40 ◦C to prevent (significant) ageing during storage. Micro-hardness experimentswere carried out on (i) untreated and flattened specimens to investigate the influenceof surface roughness, (ii) on flattened specimens to investigate the influence ofrecovery and (iii) on the end sections of the tensile bars. After determination ofthe hardness Hδ at the ends, the tensile bars were subjected to a tensile test enablinga direct comparison between micro-hardness and tensile test results.
2.3.3 Equipment
Micro-hardness experiments were carried out using an automated Leco AMH43indenter. The indenter is equipped with a Vickers indenter diamond having an apexangle of 136 ◦. For all micro-hardness experiments, a load of 200 g was appliedfor 15 seconds. These values were selected to prevent influence of the materialsupporting the PVC specimen on the hardness measurement and to obtain indentdimensions that do not exceed the field of view of the microscope objective. Theindents were made with 1 mm inter-distance. For this inter-distance, the influenceof neighbouring indents was negligible as the typical diagonal length of an indentdoes not exceed 200 µm. The specimen was left on the indenter system for at leastten minutes to permit the temperature inside the specimen to equilibrate prior toeach micro-hardness experiment. All micro-hardness experiments were performed atroom temperature.
The indented surfaces were scanned by an automated Keyence VK-9700 laserscanning confocal microscope equipped with a 408 nm laser source. An objectivelens having a magnification of 50 X and a numerical aperture of 0.95 was used. Thevertical and lateral resolutions of the set-up are 1 nm and 276 nm respectively. Unlessspecified otherwise, all specimens were allowed to recover at least one day afterindentation to minimise the influence of recovery effects on the experimental results.All indented specimens were kept at room temperature during this recovery period.
The tensile experiments were performed using a Zwick Z5.0 universal tensile testingmachine equipped with a 2.5 kN force cell. All tensile experiments were carried outat a constant strain rate of 10−3 s−1 and at room temperature. The temperature ofthe specimens was equilibrated for at least ten minutes before each tensile test. Thesurface temperature of each specimen was kept within 22.1 ± 0.5 ◦C. The engineeringyield stress was determined using the average of the initial cross-sectional surface

18Chapter 2. Quantitative assessment of the residual lifetime of uPVC pipes employing a
robust non-destructive micro-hardness approach
areas measured at three locations along the gauge section and the maximum force inthe force-displacement graph. Triplicate tensile measurements were performed aftereach annealing treatment.
2.3.4 Indent analysis
The hardness Hδ was determined from the confocal microscope topology dataaccording to the following procedure: (i) a 5×5 median filter was applied to removenoise in the confocal microscope data (ii) a tilt correction was applied to correct forminor misalignment (iii) the reference plane was determined from the average surfaceposition in the vicinity of the indent (iv) the depth at the indent tip was determinedby locating the point having the maximal value in depth (v) the indent depth, definedas the distance between the reference plane and the indent tip, was determined and(vii) the hardness Hδ was determined from the indent depth using Equation 2.5.
In general, the measured Hδ values of a single specimen fall within a narrow range.The typical value of the coefficient of variation of the Hδ values measured is about 8%.Relatively large deviations of the Hδ values that could be attributed to indentationscarried out on relatively large surface defects such as scratches were neglected for thedetermination of the thermodynamic state.
2.4 Precision of the Vickers indenter and the confocalmicroscope
The micro-hardness approach consists of using two experimental set-ups: the Vickersindenter and the confocal microscope as described in the previous section. Theprecision of each set-up was investigated using three measurement series:
1. Ten confocal microscope measurements of a single indent on a flattenedspecimen taken from pipe 11. This series captures the variation in Hδ valuescaused only by the confocal microscope.
2. Ten indents on several locations on a calibration specimen specified in JIS B 7730[57]. This series captures the variation in Hδ values caused by both the confocalmicroscope and the Vickers indenter for a calibration specimen. It is assumedthat the variation in the Hδ values over the calibration specimen is negligible.
3. Ten indents on several locations on the inner wall surface for a uPVC specimentaken from pipe 11. This series captures the variation caused by the confocalmicroscope, the Vickers indenter and the variation within the material itself.

2.4. Precision of the Vickers indenter and the confocal microscope 19
The indents of the uPVC specimens were measured with the confocal microscopeafter an extensive recovery period of thirteen days. Preliminary experimental resultsshow that the hardness value of a single indent decreases by about 3% betweenone day and eleven days of recovery time. This decrease is a factor four less thanthe typical variation of the Hδ values of several indents measured (about 8%). Asthe recovery progresses on a logrithmic timescale the recovery after eleven dayswill progress at an even lower rate. The influence of the recovery effects on theexperimental results for a recovery period of thirteen days can therefore be neglected.
The coefficients of variation (CV) of the Hδ values for each measurement series areshown in Figure 2.3. The variation in the Hδ values caused by the confocal microscope(CV of series 1) is about eleven times smaller than the variation in the Hδ values overthe surface of the uPVC specimen (CV of series 3). Furthermore, the CV for thecalibration specimen (CV of series 2) is about five times lower than the value for auPVC specimen (CV of series 3). This strong difference shows that the precision ofthe Vickers indenter and the confocal microscope are sufficient for this study. Therelatively large variation in the Hδ values observed over the surface of the uPVCspecimen is further studied in Section 2.6. First, the results of the study on theinfluence of visco-elastic recovery on the hardness Hδ are shown and discussed inthe next section.
Figure 2.3 The coefficient of variation (CV) (= standard deviation/mean) of the Hδ values for threemeasurement series.(1) ten microscope measurements of a single indent on a flattened specimen taken frompipe 11.(2) ten indents on several locations on a calibration specimen specified in JIS B 7730 [57].(3) ten indents on several locations on the inner wall surface for a specimen taken frompipe 11.

20Chapter 2. Quantitative assessment of the residual lifetime of uPVC pipes employing a
robust non-destructive micro-hardness approach
2.5 Influence of visco-elastic recovery and physicalageing
The hardness Hδ of uPVC pipes is based on the indent depth, as explained inSection 2.2. After the indenter has been removed from the specimen surface, (visco)elastic recovery of the deformed volume takes place, effectively reducing the indentdepth. A typical topography of an indent resulting from a micro-hardness teston uPVC is illustrated in Figure 2.4. It shows the topography data as measuredby the confocal microscope along a diagonal of the indent of the uPVC specimenfrom measurement series 1 (see previous section). The location of the tip of theindent is clearly visible, along with small variations in height associated with surfaceroughness. A straight line is visible that represents the reference plane at this location.The indent depth is estimated as the distance from the indent tip to this (reference)line. It is approximately equal to 10 µm in this case. The diagonal length could alsobe estimated by measuring the distance between both intersection points of the linewith the height / topography data. The distance is about 103 µm. If it is assumedthat the diagonal lengths are not affected by the (visco) elastic recovery process, thelocation of the indent tip just before removal of the indenter at the end of the waitingtime of the hardness measurement can be determined from the shape of the indenterusing Equation 2.3. The location of the indenter is indicated in the figure by thedashed lines. Apparently, strong (visco) elastic recovery effect occurred after removalof the indenter.
The basis of the approach is the assumption that recovery effects work out in a similarfashion for all uPVC specimens. It means that if specimen A has a higher Hδ thanspecimen B at recovery time t, it should also have a higher Hδ value than specimenB at time t + ∆t, irrespective of the value of ∆t. If this is true, the Hδ values of uPVCspecimens are uniquely determined at any recovery time, as long as all specimensare measured at the same recovery time.
The kinetics of the recovery process has been studied for uPVC pipes, that vary inthe degree of physical ageing and/or the level of gelation. An indent was made oneach specimen. The recovery behaviour of the indents was determined by performingconfocal microscope measurements at various times after indentation. The recoverybehaviour of the indents is shown in Figure 2.5. In all cases the indent depths reducewith the recovery time. The behaviour can be described reasonably well by a lineardependence on the logarithm of the recovery time [52] in the studied range for eachuPVC pipe.
The recovery behaviours of pipes of the same uPVC grades are comparable. Theslopes of the fitted lines of the “rejuvenated” and the “severely aged” uPVCspecimens are very similar, see Figure 2.5 left. The same holds for all uPVC specimenswith a different level of gelation in Figure 2.5 right. However, the slopes of the fitted

2.5. Influence of visco-elastic recovery and physical ageing 21
Figure 2.4 Topography data along a diagonal of an indent of a uPVC specimen of pipe 11 (measurementseries 1). The estimated original position of the indenter before removal is shown by thedashed lines. Further explanation can be found in the text.
Figure 2.5 The indent depth versus the recovery time for indents made on a rejuvenated or severelyaged specimen of pipe 8 (left) and specimens of pipes 10-13 differing in the level of gelation(right). The straight solid lines in the graphs are linear functions which were fitted on alogarithmic time scale using the least squares method.
lines of both uPVC grades differ to some extent, which suggests that for a precisedetermination of Hδ, the recovery behaviour should be included in the analysis.The differences in recovery behaviour between the uPVC grades are rather small:it is estimated that the error made in the indent depth is of the order of 0.5-1.0 µm,which corresponds approximately to a relative error of 5-10%. These values are stillacceptable for application in practice and allow the use of Equation 2.5 as a means ofdefining the specimen hardness at a constant recovery time.
For practical applications, relatively short recovery times are preferred when deter-mining the thermodynamic state of a uPVC pipe within an acceptable time frame.The results in Figure 2.5 show that differences in the thermodynamic state of uPVCspecimens were observed for recovery times in the same order of magnitude as willbe used in practical applications. The micro-hardness approach may therefore be

22Chapter 2. Quantitative assessment of the residual lifetime of uPVC pipes employing a
robust non-destructive micro-hardness approach
suited for use in practice.
2.6 Origin of the variation in Hδ values
The precision of the measurement approach was studied by measuring Hδ of aspecimen from pipe 11 multiple times, as set out in Section 2.4. The coefficientof variation (CV) of the Hδ values reached almost 8%, which was much higherthan could be accounted for by the variation inherent to the measurement systememployed. The observed variation in Hδ values may be related to the presence ofinhomogeneities in the bulk of the uPVC materials and/or surface roughness. Theinhomogeneities include primary (∼1 µm) particles and filler particles (about 0.7-20 µm for CaCO3) [58] in the bulk, which are typically smaller than the lateraldimensions of an indent (approximately 120 µm). The roughness on the inner surfaceof the wall of uPVC pipes varies and may originate from variations in processingtemperature [59, 60], inner surface roughness of the extruder die [60], molecularweight [60] and/or additives [61].
The influence of surface roughness on the variation in the measured Hδ values wasstudied by comparing the CV of Hδ for uPVC specimens having different levels ofsurface roughness. Three uPVC specimens were taken from pipe 11. One specimenwas pressed according to the procedure described in Section 2.3, one specimen waspolished and one specimen was left untreated. Micro-hardness measurements werecarried out at various positions on each specimen and Hδ was determined in themanner described in Section 2.3.4. The surface roughness was characterised by theparameter Ra which is based on local variations in surface height. The parameter Rais defined as the arithmetic average of the absolute height values and is given by [62]
Ra =1n
n
∑i=1|yi|, (2.6)
where n is the number of equally spaced points over the surface and yi is the heightof the mean height for the ith data point. For each micro-hardness experiment, thevalue of Ra was determined from the surface in the vicinity of the indent.
The variations in the Hδ values for the specimens from pipe 11 with different surfacetreatments are shown as a function of Ra in Figure 2.6 left. The variation in Hδ
clearly reduces with decreasing Ra. The CV of the polished uPVC specimens isnot much larger than the CV of series 1 (see Figure 2.3) that represents the CV ofthe measurement system. The results indicate that the large variation in Hδ valuesobserved for the untreated uPVC specimens can be ascribed to the presence of surfaceroughness. If inhomogeneities were the main cause of the variation in Hδ, no decreasein the Hδ variation would be expected for specimens with a smoother surface as the
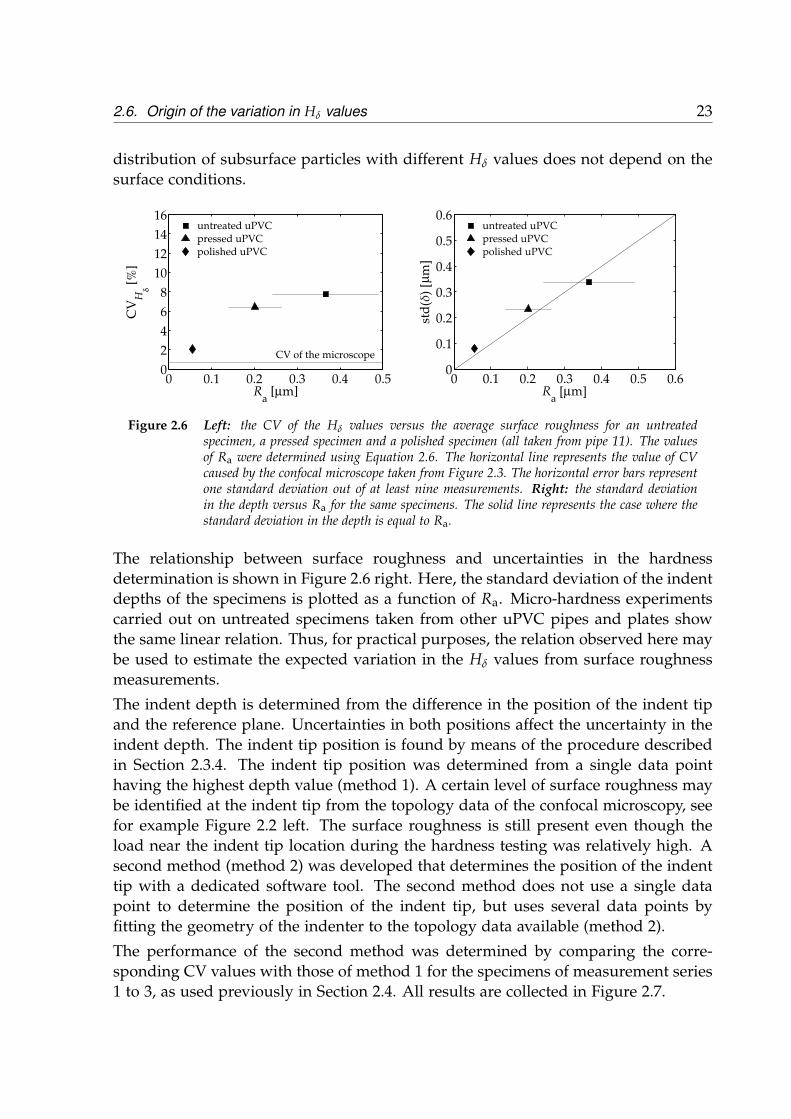
2.6. Origin of the variation in Hδ values 23
distribution of subsurface particles with different Hδ values does not depend on thesurface conditions.
Figure 2.6 Left: the CV of the Hδ values versus the average surface roughness for an untreatedspecimen, a pressed specimen and a polished specimen (all taken from pipe 11). The valuesof Ra were determined using Equation 2.6. The horizontal line represents the value of CVcaused by the confocal microscope taken from Figure 2.3. The horizontal error bars representone standard deviation out of at least nine measurements. Right: the standard deviationin the depth versus Ra for the same specimens. The solid line represents the case where thestandard deviation in the depth is equal to Ra.
The relationship between surface roughness and uncertainties in the hardnessdetermination is shown in Figure 2.6 right. Here, the standard deviation of the indentdepths of the specimens is plotted as a function of Ra. Micro-hardness experimentscarried out on untreated specimens taken from other uPVC pipes and plates showthe same linear relation. Thus, for practical purposes, the relation observed here maybe used to estimate the expected variation in the Hδ values from surface roughnessmeasurements.
The indent depth is determined from the difference in the position of the indent tipand the reference plane. Uncertainties in both positions affect the uncertainty in theindent depth. The indent tip position is found by means of the procedure describedin Section 2.3.4. The indent tip position was determined from a single data pointhaving the highest depth value (method 1). A certain level of surface roughness maybe identified at the indent tip from the topology data of the confocal microscopy, seefor example Figure 2.2 left. The surface roughness is still present even though theload near the indent tip location during the hardness testing was relatively high. Asecond method (method 2) was developed that determines the position of the indenttip with a dedicated software tool. The second method does not use a single datapoint to determine the position of the indent tip, but uses several data points byfitting the geometry of the indenter to the topology data available (method 2).
The performance of the second method was determined by comparing the corre-sponding CV values with those of method 1 for the specimens of measurement series1 to 3, as used previously in Section 2.4. All results are collected in Figure 2.7.

24Chapter 2. Quantitative assessment of the residual lifetime of uPVC pipes employing a
robust non-destructive micro-hardness approach
Figure 2.7 The CV of the Hδ values for analysis methods 1 and 2 for the three measurement series whichwere described previously in Section 2.4.
At first sight, method 2 seems to be more robust than method 1 as the CV for series 1decreased from 0.7% to 0.2%. Method 2 uses more data points to determine the exactlocation of the indent tip. The determined Hδ values are therefore less sensitive tovariations in depth values of individual data points. However, for series 2 and 3 theCV employing method 2 is comparable to the values obtained from method 1. Fromthese results it may be concluded that the determination of the depth location ofthe indent tip from the confocal microscope topology data is not the main source ofvariation of Hδ. Instead, the determination of the height of the reference plane fromthe data is the main source. Apparently, the presence of surface roughness leadsto uncertainties in the exact location of the reference plane if the topology data inthe neighbourhood of the indent is used to reconstruct the location of the indentedsurfaces before indentation.
A possible way to decrease the variation in measured depth values is to increase themass used during the hardness measurements. In that way the indent depth wouldincrease without any change in the surface roughness, i.e. Ra remains constant.
A series of micro-hardness measurements was performed employing a mass of 1 kgon the inner surface of an untreated specimen taken from pipe 11. No reduction in thevariation of Hδ could be observed. This somewhat surprising outcome may be relatedto the fact that two out of nine measurements showed indentation depth values thatwere considerably different from the other seven. Without these two measurements,the standard deviation was less than the value obtained with the mass of 200 g. Thissuggests that using a higher load can be beneficial to the precision, but the numberof measurements should be appropriate.
Further analysis of the specimen surfaces indicated that the surfaces can becharacterised by a certain waviness along with the presence of grooves and spiderlines. These features are inherent to the manufacturing process of the uPVC pipes asmentioned earlier.

2.7. Quantitative assessment of the residual lifetime of uPVC pipes 25
The results indicate that the determined values of the indent depths contain a certainstochastic nature that should be incorporated accordingly. The results are also inline with common practice in measurement of hardness values where specimensurfaces are usually prepared in accordance with the requirements of the hardnessmeasurement method employed [56]. Nevertheless, the accuracy and precision ofthe presented approach employing a Vickers indenter in conjunction with a confocalmicroscope is sufficient to study the development of the hardness of uPVC specimensover time, as a way to estimate the residual lifetime of uPVC pipe materials inpractice.
2.7 Quantitative assessment of the residual lifetime ofuPVC pipes
2.7.1 Influence of physical ageing
The yield stress of uPVC pipes increases over time due to physical ageing, asexplained in the introduction to this chapter. Changes in the yield stress may bereflected in the material’s hardness, as was observed by Visser et al. [47] (employinga different approach). In this section the relationship between the yield stress and thehardness Hδ of uPVC pipe materials with different thermodynamic states is studiedemploying the approach based on micro-Vickers hardness indentation and confocalmicroscopy as presented in the previous sections.
The study consists of a series of hardness and tensile test experiments. The tensilebars were annealed at several temperatures below Tg and for different annealingtimes. On the ends of each tensile bar, nine micro-hardness experiments were carriedout prior to tensile testing. The average Hδ values obtained from these experimentsare plotted against the annealing time for each annealing temperature in Figure 2.8. Itcan be seen that Hδ increases with the annealing time and the annealing temperature.
2.7.2 Relating the hardness Hδ to the yield stress
The yield stress values of the tensile bars were determined after the micro-hardnessexperiments were performed. These values are shown in Figure 2.9 left. The yieldstress increases with annealing time and temperature showing that physical ageingoccurred during the annealing treatments. The behaviour of the yield stress uponannealing is similar to the behaviour of Hδ, as can be concluded by comparingFigures 2.8 and 2.9; the yield stress and Hδ both increase with annealing time andtemperature. The ageing activation volume, ∆Ua, can be determined from the yieldstress data measured at different annealing times and annealing temperatures. A
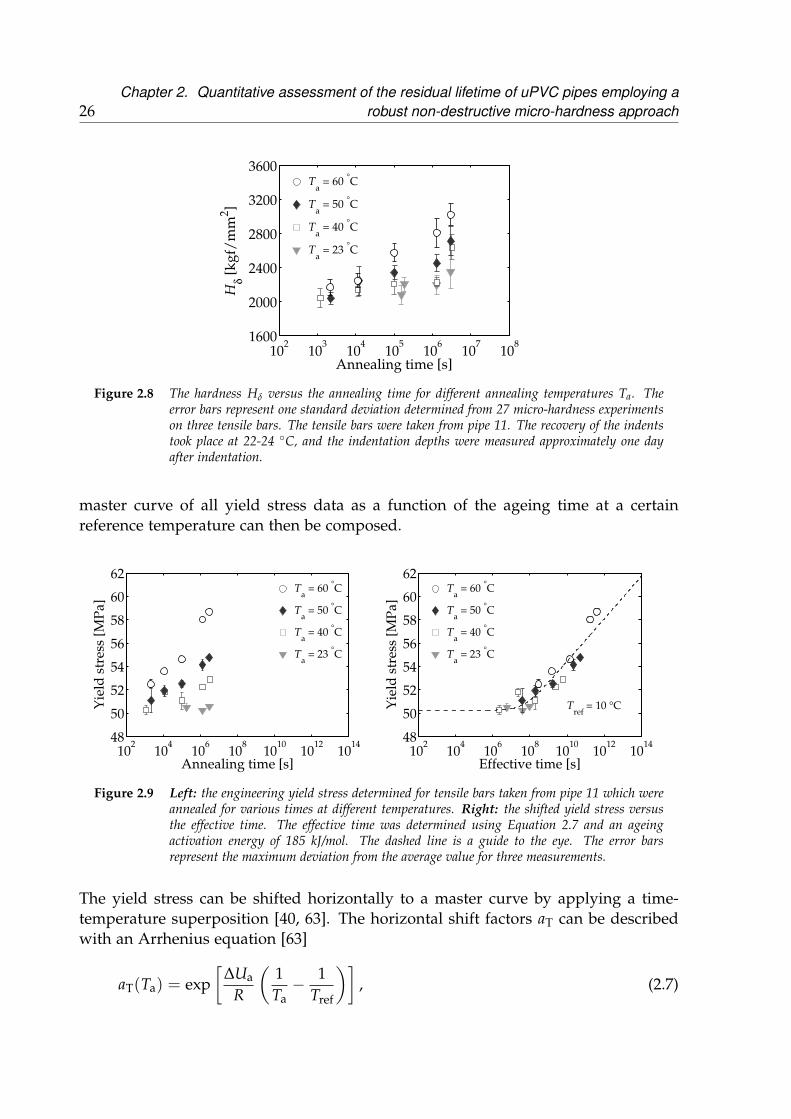
26Chapter 2. Quantitative assessment of the residual lifetime of uPVC pipes employing a
robust non-destructive micro-hardness approach
Figure 2.8 The hardness Hδ versus the annealing time for different annealing temperatures Ta. Theerror bars represent one standard deviation determined from 27 micro-hardness experimentson three tensile bars. The tensile bars were taken from pipe 11. The recovery of the indentstook place at 22-24 ◦C, and the indentation depths were measured approximately one dayafter indentation.
master curve of all yield stress data as a function of the ageing time at a certainreference temperature can then be composed.
Figure 2.9 Left: the engineering yield stress determined for tensile bars taken from pipe 11 which wereannealed for various times at different temperatures. Right: the shifted yield stress versusthe effective time. The effective time was determined using Equation 2.7 and an ageingactivation energy of 185 kJ/mol. The dashed line is a guide to the eye. The error barsrepresent the maximum deviation from the average value for three measurements.
The yield stress can be shifted horizontally to a master curve by applying a time-temperature superposition [40, 63]. The horizontal shift factors aT can be describedwith an Arrhenius equation [63]
aT(Ta) = exp[
∆Ua
R
(1Ta− 1
Tref
)], (2.7)

2.7. Quantitative assessment of the residual lifetime of uPVC pipes 27
where R is the universal gas constant, Tref the reference temperature and Ta theannealing temperature. The logarithm of the shift factors for shifting each curve tothe 60 ◦C annealing curve is plotted against the reciprocal annealing temperaturein Figure 2.10. The ageing activation energy ∆Ua was calculated from the slope,resulting in a value of 185 kJ/mol for this uPVC pipe. The value is of the same orderof magnitude as the values of the ageing activation energy found for other uPVCpipes (115 kJ/mol [40] and 238 kJ/mol [45] respectively). The origin of differencesin the ageing activation energy of uPVC pipes is discussed in detail in Chapter 4.Using Equation 2.7 and the ageing activation energy of 185 kJ/mol, the yield stressvalues in Figure 2.9 left are shifted to a reference temperature Tref = 10 ◦C, which isthe average temperature of uPVC pipes in the ground, and shown in Figure 2.9 right.The figure clearly shows the increase of the yield stress over time due to physicalageing, where all data points obtained from different annealing treatments build upa common master curve.
2.8 3 3.2 3.4 3.6−16
−12
−8
−4
0
4
1000/Ta [1/K]
ln(a
T)
[−]
Figure 2.10 The shift factor aT plotted against the reciprocal annealing temperature as measured onpipe 11.
Applying the same ageing activation energy to the hardness data shown in Figure 2.8,results in a similar master curve, as shown in Figure 2.11. The resulting curve of Hδ
is comparable to the curve of the yield stress visible in Figure 2.9 right, showingthat the Hδ values can be shifted using the same Arrhenius relation as was usedto shift the yield stress values. This observation confirms that Hδ determined frommicro-hardness experiments can directly be related to the yield stress, similar to theprocedure described by Visser [47].
The yield stress values are plotted against the corresponding Hδ values in Figure 2.12.A linear relationship is found, similar to the one observed by Visser et al. for anotheruPVC pipe employing a different indentation set-up and data reduction method [47].The variation in the hardness values compared to the maximum increase in thehardness in the study of Visser is 7.5%. In this study, a value of 8.5% is found.Hence, the sensitivity of both hardness methods of monitoring the effects of physical

28Chapter 2. Quantitative assessment of the residual lifetime of uPVC pipes employing a
robust non-destructive micro-hardness approach
Figure 2.11 The hardness Hδ versus the effective ageing time. The dashed line is a guide to the eye.
ageing is similar. The advantage of the method applied in the current study is thatit is more robust and thus more suitable for practical applications. The variationin the Hδ values is related mainly to surface roughness of the studied specimens,as discussed in the previous section. The variation in the measured yield stress isrelatively small. The variation in Hδ values is therefore considered the main factordetermining the precision of the residual lifetime assessment method presented inthe next section.
Figure 2.12 The yield stress versus the hardness Hδ as determined for pipe 11.
2.7.3 From hardness Hδ to residual lifetime
The residual lifetime of a uPVC pipe is defined in this thesis as the time remainingfor the pipe to reach a pre-defined yield stress, or equivalently, a pre-defined Hδ
value, at the reference temperature. As mentioned in the previous section, thereference temperature used here is 10 ◦C. The pre-defined yield stress and/or Hδ

2.7. Quantitative assessment of the residual lifetime of uPVC pipes 29
values provide upper limits that should not be exceeded, so as to prevent unwantedfailure behaviour, such as brittle fracture, upon impact during excavation activities.
The procedure to determine the residual lifetime is as follows. First, the Hδ of aselected uPVC pipe is assessed with the newly developed micro-Vickers approach.The corresponding yield stress value is obtained using the relationship betweenHδ and yield stress as displayed in Figure 2.12. The time to reach the limiting(predefined) value of the yield stress can then be determined from the knowndevelopment of the yield stress over time, i.e. the kinetics of the physical ageingprocess. This time constitutes the residual lifetime of the (u)PVC pipe investigated.If the value of the yield stress obtained is above the limiting one, the particularPVC pipe is considered unsafe for application in service conditions and should bereplaced.
The study of the micro-Vickers approach in the previous sections has shown thatsome degree of variation around an average Hδ value can occur. The Hδ distributionwas studied in more detail by performing 50 hardness measurements on the innersurface of an untreated specimen taken from pipe 11. The hardness indents wereallowed to recover for one month at room temperature.
The resulting Hδ distribution is shown in Figure 2.13 by the histogram. A normal(Gaussian) distribution function fits the data rather well (R2 = 0.93*) and thedistribution can be characterised by a standard deviation S of 244 kgf/mm2. Inpractice the number of indentations should be kept as low as possible. The requiredsample size n for approximating the true Hδ is given by [64]:
n =
(SzE
)2
, (2.8)
where S is the standard deviation of the distribution of Hδ values, E is the desiredmargin of error in the approximated true Hδ and z is the critical value determinedfrom the desired confidence level C of the confidence interval. The confidence intervalhas a total width of 2E centred around the average hardness H̄δ which is determinedfrom n measurements. The formula can be used here since the distribution of Hδ
values complies with the normal distribution, as exhibited in Figure 2.13.
The required sample size versus the confidence level was calculated for twoconfidence intervals: (i) 2% variation on the average hardness, 0.98H̄δ < H̄δ < 1.02H̄δ
and (ii) 5% variation on the average hardness, 0.95H̄δ < H̄δ < 1.05H̄δ. Thenumber of micro-Vickers hardness measurements necessary to assure a certain levelof confidence is given in Figure 2.14, utilising the standard deviation of the Hδ
distribution shown in Figure 2.13. The sample sizes required for 95% confidence(z = 1.96 [64]) and 98% confidence are about 20 and 110 hardness measurementsrespectively. The required numbers of measurements are large, but still acceptable.
*Similar values of R2 were found for measurement series on other uPVC pipes.

30Chapter 2. Quantitative assessment of the residual lifetime of uPVC pipes employing a
robust non-destructive micro-hardness approach
Figure 2.13 Histogram for fifty measurements of Hδ performed on the inner surface of an untreatedspecimen taken from pipe 11. The indents recovered for one month at room temperature.The solid line represents the best fit of a Gaussian function. The standard deviation S of theHδ values of this measurement series is 244 kgf/mm2.
Figure 2.14 The sample size versus the confidence level for 5% (113 kgf/mm2) and 2% (45 kgf/mm2)margins of error using Equation 2.8 and the standard deviation S = 244 kgf/mm2.
The relation between the micro-Vickers hardness and the prediction of the residuallifetime of a uPVC pipe is shown schematically in Figure 2.15. The confidenceintervals are given by the dark grey and light grey areas. The range of Hδ valueswithin the confidence interval corresponds to a range of yield stress values employingthe relationship between the yield stress and the hardness Hδ established previously.This corresponds to the horizontal light grey and dark grey bars in Figure 2.15 (leftand right). Subsequently, the ranges of yield stress values correspond to ranges ofeffective times, utilising the known relationship between the yield stress and theeffective time (i.e. the ageing kinetics). In this way the variation in Hδ values leads tocertain variations in effective time as shown by the vertical light and dark grey barsin Figure 2.15 right.
The lower and upper limits in the ranges of residual lifetimes are determined

2.7. Quantitative assessment of the residual lifetime of uPVC pipes 31
hypotheticallimiting yield stress σlim
Figure 2.15 The procedure used to determine the residual lifetime from hardness measurements. Thedark and light grey areas represent the confidence intervals with 5% (113 kgf/mm2) and2% (45 kgf/mm2) margins of error in the average hardness H̄δ respectively, where n is thesample size for a confidence level C of 95% and a standard deviation S of 244 kgf/mm2. Thedashed lines indicate a fictive value of the limiting yield stress σlim and the correspondingtime for pipe replacement.
assuming a hypothetical limiting yield stress, σlim, that corresponds to a certainmaximum age of the PVC pipe. In this case, for 20 hardness measurements (5%confidence interval), the lower and upper limits of the residual lifetime will be29 years and 51 years (22 year range) respectively. For 110 hardness measurements(2% confidence interval), the lower and upper limits will be 41 years and 49 years(8 year range) respectively. In conclusion: the approximation of the true Hδ improvesand the precision of the residual lifetime assessment method increases if the numberof hardness measurements is enlarged.
The required sample size can also be determined from a desired degree of precisionin the residual lifetime instead of determining the degree of precision in the residuallifetime from the sample size. The required sample size depends not only on thestandard deviation S and the confidence level C, but also on the functional behaviourof the yield stress versus Hδ and the yield stress versus the effective time. Forexample, the spread in the yield stress values in Figure 2.15 left is strongly dependenton the tangent of the yield stress versus Hδ line. The steeper the line, the greater thespread of the yield stress for a given confidence interval of Hδ values. A similar caseholds for the yield stress versus the effective time in Figure 2.15 right. The less steepthe yield stress versus the effective time line, the greater the spread of the effectivetime for a given spread in the yield stress.
The effective time axis of Figure 2.15 right is on a logarithmic basis. This hasconsequences for the precision of the residual lifetime prediction. If the widths ofthe dark grey and light grey areas on the effective time axis remain the same, butthese areas are shifted to the right on the time axis, the corresponding range of yearson a linear scale is strongly increased. Hence, the precision of the prediction of the
32Chapter 2. Quantitative assessment of the residual lifetime of uPVC pipes employing a
robust non-destructive micro-hardness approach
residual lifetime in number of years on a linear scale strongly reduces.
The prediction of the residual lifetime is also influenced by the standard deviation ofthe Hδ distribution, S, as the roughness amongst uPVC pipes will vary depending onthe process conditions during manufacturing. A value of S may be estimated fromroughness measurements and the relationship between the standard deviation of theindent depth and Ra shown in Figure 2.6 right.
2.8 Discussion
In the previous sections, it was shown that a number of micro-hardness measure-ments are required for determining the residual lifetime of a uPVC pipe withsufficient precision. A relatively fast measurement procedure is therefore requiredto determine the yield stress of a pipe within an acceptable time frame. Five possibleways to reduce the required time for the measurement procedure are discussed inthe rest of this section.
The first option to speed up the measurement procedure is to reduce the recoverytime. A recovery time of 1-2 days as applied in the current experiments isunacceptable for practical applications. A reduction of the waiting time requiresthe time between hardness indentation and confocal microscope measurement tovary less, because of stronger recovery at shorter recovery times (recovery followsa logarithmic time-path). Automated systems are very capable of following strictindentation and measurements schemes, allowing a substantial reduction of theoverall time required to analyse pipe sections.
A further reduction in measurement time can be achieved when the time to scanan indented surface is decreased. In this study, it takes roughly two minutesto determine the position of the indent tip and the reference plane using a highresolution confocal microscope. A faster, less precise measurement technique willsuffice in practice as the contribution to the variation in Hδ values caused by theconfocal microscope is not significant, see Section 2.6.
Thirdly, the influence of the applied load during the micro-Vickers measurementsneeds to be further investigated. The number of measurements performed with aload of 1 kg instead of 200 g was relatively small. This may have led to indecisiveresults. Given the number of hardness measurements required to fully characterisethe Hδ distribution in Figure 2.13, a more elaborate study might be able to disclose therelationship between the applied load and the measurement precision. The feasibilityof a high load to measure the micro-Vickers hardness Hδ on thin-walled PVC pipesshould be included as well.
A fourth option to speed up the measurement procedure is to reduce the number ofmicro-Vickers measurements. The number is related to the variation in Hδ values.

2.9. Conclusions 33
The Hδ values showed a considerable spread due to surface roughness on the innerwall of the PVC pipes. The surface roughness particularly affected the determinationof the reference level around the indent. In the current procedure the referencelevel is determined from topology data of the surface region close to the indent.However, a more elegant approach would be to scan the uPVC surface region with theconfocal microscope twice: prior to and after the hardness measurement. Then theindent depth could simply be determined from the difference between both confocalmeasurements without anything ado. It is expected that this new procedure stronglyreduces the variation in Hδ values and improves the applicability and usefulness ofthe micro-Vickers approach as a way to estimate the residual lifetime of uPVC pipes.
As a final option, careful preparation of the inner wall of the uPVC pipe couldalso reduce the surface roughness and improve the precision and accuracy of thedetermination of Hδ. Such an approach strongly increases the complexity of thedevice required for in-situ hardness measurement in gas and water distributionnetworks and was therefore not part of this study.
Future research could focus on how to polish/prepare the inner surface of uPVCpipes without changing locally the thermodynamic state of the uPVC pipe underinvestigation. Whether polishing can reduce the overall time required to analysepipe sections depends on the trade-off between the possible reduction of the numberof micro-Vickers measurements required and the increase in the time used for surfacepreparation.
2.9 Conclusions
In this chapter, a new micro-Vickers hardness based approach was presented todetermine changes in the thermodynamic states of uPVC pipes employed in gas andwater distribution networks. Physical ageing of uPVC pipes causes an increase of theyield stress and the hardness Hδ in course of time that can be monitored with thedeveloped methods.
The measurement approach consists of micro-Vickers hardness measurements withrelatively low loads that affect the uPVC pipes minimally and confocal microscopyto determine the topography of the indents. All hardness measurements wereperformed on non-polished specimen surfaces to replicate the future use of in-situpipe inspection systems. The hardness Hδ was determined from the indent depth;the diagonal length could not be determined accurately because of the presence ofsurface roughness. It was shown that the effects of (visco) elastic recovery hardlyaffected the results of the hardness measurements if the time between the indentationand the subsequent determination of the indent depth was kept constant among thespecimens studied or was large enough on a logarithmic time scale. The scatter ofthe Hδ values determined originated from the surface roughness present and was
34Chapter 2. Quantitative assessment of the residual lifetime of uPVC pipes employing a
robust non-destructive micro-hardness approach
caused primarily by variations in the reference level that was used to determine theindent depths. To improve the hardness measurement method it was suggested thatthe exact topology of the indent region prior to indentation should be determined,instead of estimating its level from the topology data in the vicinity of the indentafter indentation.
A linear relationship between the yield stress and the hardness Hδ has beenestablished. The yield stress and Hδ follow the same behaviour over time. Theresidual lifetime of uPVC pipes can be determined assuming a critical limit to theyield stress and/or Hδ. Statistical analysis has shown that the required number ofmeasurements can be estimated from a desired degree of precision in the residuallifetime.
In practice, a robust and relatively fast measurement procedure is required. Fromthe fact that the sensitivity to physical ageing of the approach presented in thisstudy is similar to the one used by Visser et al. [47] and that a more simple(constant load rather than force controlled) and less precise device is used, it can beconcluded that the presented approach is more robust and one step closer to practicalimplementation.

Chapter 3
Predicting embrittlement of uPVCpipes
3.1 Introduction
The occurrence of brittle failure is the main limitation for the service life of unplas-ticised poly(vinyl chloride) (uPVC) pipes in the Dutch gas and water distributionnetworks, as already elucidated in Chapter 1. When brittle failure occurs, a relativelylarge part of the pipe is destroyed resulting in a large gas or water outflow. Moreover,the sharp, irregular fracture surface makes it difficult to stop the outflow of gas usinga temporary stopper. In addition, there is an increased risk of crack propagation atthe moment the pipe is plugged.
The subsequent repair procedure of an impact-damaged uPVC pipe usually involvessawing. For ductile pipe material it is relatively easy to obtain a clean saw cut.In contrast, new cracks can form when sawing a brittle pipe. These newly formedcracks can result in a sharp irregular cutting surface, which complicates further repairworks. This distinct difference in the behaviour of uPVC pipes during sawing canbe demonstrated by a so-called ’saw test’ [65]. A photograph and a schematic cross-sectional view of the set-up of the saw test are shown in Figure 3.1 left and rightrespectively. The loading conditions encountered by sawing a uPVC pipe in practice(like the soil support) are mimicked in the test. A worst-case scenario is simulated byapplying a bending moment to the pipe which constraints the pipe. This constraintmakes the pipe more prone to brittle fracture when the pipe is sawed.
35

36 Chapter 3. Predicting embrittlement of uPVC pipes
sawing location
r
F
Figure 3.1 Photograph (left) and cross-sectional sketch (right) of the saw test set up. One end ofthe PVC pipe is clamped to simulate the force exerted by the surrounding solid soil. Theprotruding part is subjected to a bending moment by suspending a weight on the pipe at afixed distance. A cross-cut saw was used to cut the pipe. Sawing can be done at differentsaw speeds and temperatures.
The saw test was performed by Weller et al. on two excavated uPVC pipes behavingdifferently during failure (the failure behaviour was verified using tensile impacttests) [65]. Photographs of saw cuts of the uPVC pipes are shown in Figure 3.2.Significant differences between the saw cuts of pipe A and pipe B were observedfor each saw speed and temperature investigated, except for sawing fast at 5 ◦C.A straight saw cut shows that the pipe exhibited ductile behaviour. An irregularsaw cut shows that the pipe failed in a brittle way during sawing. A comparisonof the photographs shows that Pipe A fails in a brittle manner at temperatures of5 ◦C or lower only if the sawing is done fast. In contrast to pipe A, pipe B performsmuch worse; only slow sawing at temperatures of 20 ◦C or higher prevents it frombrittle failure. Therefore, sawing a brittle impact-damaged pipe (with similar materialproperties as pipe B) leads to a higher probability of incidents than sawing a pipe withsimilar material properties as pipe A. To conclude, brittle failure behaviour does notonly cause larger gas outflow which is more difficult to stop, but also increases thechance of incidents during repair.
The facts given above support the statement that time dependent embrittlementis an important factor limiting the service life of uPVC pipes used in distributionnetworks. Replacement before the pipes become too brittle is necessary to guaranteesafe operation of uPVC (gas) distribution networks in the future. Non-destructivemethods for assessing the condition of uPVC pipes and for predicting the time scalein which a pipe becomes too brittle would be valuable tools for the development ofa cost-effective replacement policy. A potential non-destructive method for assessingthe condition (yield stress) of uPVC pipes was presented in Chapter 2. The presentchapter focuses on linking the yield stress (evolution) to the impact failure behaviourand the behaviour during sawing.
Several factors can influence the failure behaviour of buried uPVC pipes. Aselucidated in Chapter 1, physical ageing and the level of gelation are the two

3.1. Introduction 37
5 °C 20 °C 20 °C5 °C
Pipe A
slow
fast
Pipe B
Test temperature
Saw
sp
eed
Saw
sp
eed
Test temperature
slow
fast
Figure 3.2 Photographs of saw cuts made by sawing of two excavated uPVC pipes. Each uPVC pipewas sawed at test temperatures of 5 ◦C and 20 ◦C, and was sawed at two different speeds -slow and fast. These results were made available by Kiwa Technology [65].
most important factors that influence the impact behaviour of buried uPVC pipes,thus limiting the service life of uPVC gas pipes. Physical ageing is related to thedensification of the polymer chains as a result of conformational changes, makingthem more prone to brittle failure [37, 46]. Physical ageing causes a decrease in theelongation at break [66–69] and the impact-breaking energy [21, 46, 70] and eventuallyleads to an increase of the ductile-to-brittle transition temperature [45]. Physicalageing should therefore be taken into account for predicting (ongoing) embrittlementof uPVC pipes.
As mentioned above, the level of gelation also has a distinct influence on theductility of uPVC. The level of gelation of a PVC pipe is a measure for the extentof primary particle breakdown and fusion after production [71]. When the level ofgelation is insufficient, poorly fused primary particles act as crack initiation sites [72],which can cause brittle failure [19]. The level of gelation does not change afterproduction and is therefore a measure of the initial product quality [10]. Hence,this chapter focuses primarily on physical ageing, as the main interest is on thetime dependent embrittlement during service life and not on the quality of the pipesduring installation. In Chapter 5 the focus will be on the level of gelation and findinga way to determine this property using a non-destructive, in-situ test method.
The goal of this chapter is to investigate whether embrittlement of uPVC pipes causedby physical ageing can be predicted using the ageing kinetics of the yield stress.As a first step, it is shown that the ductile-to-brittle transition can be related to theprocess of physical ageing by assuming a certain critical thermodynamic state. Thisrelationship is used to propose a yield stress criterion for embrittlement of uPVC.Next, experimental evidence is obtained which shows that this criterion holds foruPVC. Then a method is proposed for predicting embrittlement of uPVC pipes in

38 Chapter 3. Predicting embrittlement of uPVC pipes
operation using this yield stress criterion. Finally, some possible issues of the practicalimplementation of this method are discussed.
3.2 Theoretical background
3.2.1 Embrittlement upon physical ageing
Physical ageing can cause a ductile-to-brittle transition to occur during impact testing,whereas none of the measurement conditions change other than the (thermal) historyof the specimen; such was shown for polycarbonate (PC) in [73]. The ageing processoriginates from the fact that glassy polymers are not in thermodynamic equilibriumbut continuously strive towards it [37]. Although polymers are in a glassy statebelow their glass transition temperature, Tg ∼ 80 ◦C for uPVC, there is still somemolecular mobility. Conformational changes can still take place which allow a changein the thermodynamic state of the polymer towards its thermodynamic equilibrium.The kinetics of the ageing process is determined by the molecular mobility andtherefore the temperature influences the ageing rate. At elevated temperatures (butstill below Tg) physical ageing progresses faster and consequently shortens the timescale required to reach the equilibrium [37]. The thermodynamic state of a uPVCpipe depends therefore on its thermal history. As a result of the conformationalchanges, the density increases causing an increase in the interactions between thepolymer chains. These interactions in turn cause a decrease in molecular mobilityand thus an increase in the resistance against plastic deformation, which is observedas a significant increase in the yield stress [39, 40].
¢ ¡¤ £¦ ¥̈ § © © !" § © # ©
$ # § %& !
softening hardening
yield
True strain
Tru
e st
ress
ageing
Figure 3.3 A schematic illustration of the influence of physical ageing on the intrinsic deformationbehaviour of a glassy polymer like uPVC in compression. Solid line: before annealingbelow Tg, dashed line: after annealing below Tg.
The influence of physical ageing on the intrinsic deformation behaviour is shownschematically in Figure 3.3. The solid and dashed lines represent the true stress-

3.2. Theoretical background 39
strain response before and after an annealing treatment respectively. An annealingtreatment (defined here as a heat treatment at a temperature relatively close to butbelow Tg) accelerates the process of physical ageing. The figure shows that theyield stress increases as a result of the annealing treatment, whereas the effect ofthe annealing treatment disappears as soon as strain hardening occurs. This effectresults in an increase in the yield drop, also referred to as strain softening. Theinterplay of the amount of softening and the subsequent (strain) hardening takingplace determines the amount of localisation of plastic deformation when a glassypolymer is subjected to a tensile load. Depending on the interplay, the plasticdeformation zone (at a stress concentrator) will grow to macroscopic scale or willgrow further on a local scale. In the first case, failure after macroscopic growth ofthe plastic deformation zone is characterised as ductile failure. In the second case, ahydrostatic stress builds up, because the plastic deformation in the deformation zoneis constrained by its surrounding material. The polymer can relieve the increasingstress only by voiding, which occurs when the hydrostatic stress in the plastic zonesurpasses a critical value (a critical hydrostatic stress) [74]. Upon further deformation,the voids grow and coalesce, forming highly orientated fibrils, which will form acraze [75]. Eventually, the craze fibrils break, and a crack is formed which canpropagate until complete failure. Although the plastic strain within the fibril ofa craze can be very high, the region of plastic deformation is strongly localised.Therefore, this type of failure is perceived as brittle failure on a macroscopic scale.This phenomenon as a result of a change in intrinsic properties (caused by physicalageing in this case) is referred to as strain localisation [41–44].
The value of the critical hydrostatic stress at which a craze is formed (andsubsequently at which brittle failure occurs) is barely influenced by physical ageingas shown for PC [74, 76], poly(methyl methacrylate) [76] and polystyrene [77].The ductile-to-brittle transition can be related to the process of physical ageing bydetermining the critical thermodynamic state at which the deformation localisesto such an extent that the critical hydrostatic stress is reached. The criticalthermodynamic state will have a corresponding (critical) yield stress. This criticaltensile yield stress can therefore be used as a tool for predicting embrittlement. Inthe next section a critical tensile yield stress criterion for uPVC is proposed.
3.2.2 Yield stress criterion for uPVC
Experimental evidence for the existence of a critical tensile yield stress has been givenby Visser et al. for PC [45]. They analysed impact data of Legrand [73] and yieldstress data of Klompen et al. [63] on PC to show that a ductile-to-brittle transitionfor those PC tensile bars indeed occurred at a certain thermodynamic state witha constant yield stress. It should be borne in mind that the development of thehydrostatic stress in the plastic deformation zone during impact loading depends

40 Chapter 3. Predicting embrittlement of uPVC pipes
on the deformation behaviour of the material surrounding the plastic zone. Thedeformation behaviour of the surrounding material in turn depends on the loadingconditions [78], for instance, on the deformation field imposed by an impactor, on thepresence of a notch in the specimen, and on the applied strain rate. The critical tensileyield stress is therefore not a material parameter, but merely a tool for predictingembrittlement for the testing conditions and type of test used.
A yield stress criterion for uPVC was formulated by Visser et al. [45] which is basedon a similar criterion proposed before for PC [78]; a ductile-to-brittle transition willoccur when the yield stress σy of uPVC specimens surpasses a critical tensile yieldstress σcr. The critical tensile yield stress σcr is independent of test temperature,strain rate and thermodynamic state. In mathematical terms, the yield stress criterionmeans that the material will fail in a macroscopically brittle way (due to localisation)if:
σy(T, ta, Ta) ≥ σcr (3.1)
with T the temperature during testing, ta the annealing time and Ta the annealingtemperature. This criterion holds if the influence of annealing on the ductile-to-brittletransition temperature can be accurately predicted by the yield stress, taking intoaccount the influence of temperature and physical ageing [45]. Therefore, to validatethe criterion the influence of annealing on the ductile-to-brittle transition temperature(Td→b) has to be determined. Next, the choice for the type of test to determine Td→bas employed in the present work is described and founded.
In previous work [45] a puncture test was used to characterise Td→b. Thedisadvantages of this type of test are that (i) the specimens are relatively large,such that a large length of pipe material is required for a full characterisation and(ii) the strain field is rather complex with a combination of compression, shear andtensile strains [45, 79]. Besides these disadvantages, the observation of Mandell etal. [80] that the plane strain fracture toughness (KIc) of uPVC pipes is not significantlyinfluenced by annealing was taken into account. As opposed to starting froma sharp notch, with the aim to reduce plasticity at the notch tip, it is better touse blunt/unnotched specimens to promote plasticity leading to crack initiation,as physical ageing has a strong influence on this plastic behaviour. From theseconsiderations a tensile impact test using a rectangular shaped tensile bar with acircular hole at its centre (as also used by Weller et al. [65]) was chosen as thepreferred testing geometry. In comparison with the puncture test specimens [45],about nine times more tensile impact specimens can be produced per metre ofmanufactured uPVC pipe (diameter of 110 mm). Furthermore, the strain appliedis predominantly in tension and the specimens are relatively easy to manufacturewith the use of milling (for the geometry and the hole), which is convenient asimpact testing mostly requires a large number of specimens (about 124 specimenswere impacted in this work).

3.2. Theoretical background 41
Once the influence of physical ageing on Td→b is characterised using tensile impacttesting, the validity of the critical yield stress criterion which was proposed abovecan be checked. As mentioned, the advantage of the tensile impact test geometryis that the stresses and strains are predominantly in tension, thus comparable tostandard tensile tests which were used to determine the influence of ageing on theyield stress. However, the strain field is somewhat more complex around the hole andthe (local) strain rate can be determined only with the use of advanced optical strainmeasurements or numerical calculations. Here the global strain rate (impactor speeddivided by gauge length) is used to calculate the yield stress at a certain temperature(and after a certain annealing treatment). Although this global strain rate is not equalto the highest local strain rate, it does have the same order of magnitude (up to theyield point). It is assumed here that this simplification is allowed, as the quantitativeincrease in yield stress as a function of temperature and physical ageing are barelyinfluenced by the chosen strain rate [81].
Furthermore, it can be argued that the local strain rate will depend on the degreeof ageing as a severely aged specimen will display more strain localisation; its localstrain rate can be expected to be higher at the location where yield starts to occur,when compared to the strain rate of a more homogeneously deforming unagedspecimen. However, the interest here is on the onset of failure and thus on the pointof yielding. As localisation is a post-yield effect, this relationship between local strainrate and the ageing state is neglected here with the assumption that up to yieldingno localisation occurs and the (local) strain rate is equal to the global strain rate.
As the impact velocity for all tests is quite high, not only the α-relaxation, whichis related to the glass transition, but also the β-relaxation, which is presumablyrelated to the local twisting motions of small-scale macromolecular segments [82, 83],contributes to the yield stress of the specimens [45, 84–87]. The contributionsof both the α-relaxation and β-relaxation on the yield stress can be characterisedquantitatively using the Ree-Eyring relation [88]. This relation is a modification of theEyring rate equation [89], where the contributions of the two relaxation mechanismsare added independently. The Ree-Eyring relation used here was adopted from [45]:
σy(T, ε̇) = ∑x=α,β
RTν∗x
· sinh−1[
ε̇
ε̇0,x· exp
(∆Ux
RT
)], (3.2)
where σy is the yield stress, R the universal gas constant, T the test temperature,ν∗x the activation volume, ε̇ the strain rate, ε̇0,x a pre-exponential factor and ∆Ux theactivation energy. The subscript x of the parameters is equal to α or β, which refersto the respective relaxation mechanism.
The yield stress of PC and uPVC can be accurately described using constant valuesof the activation energies and the activation volumes for both relaxation mechanismsand thus do not change upon annealing [45, 90, 91]. Furthermore, the factor ε̇0,β
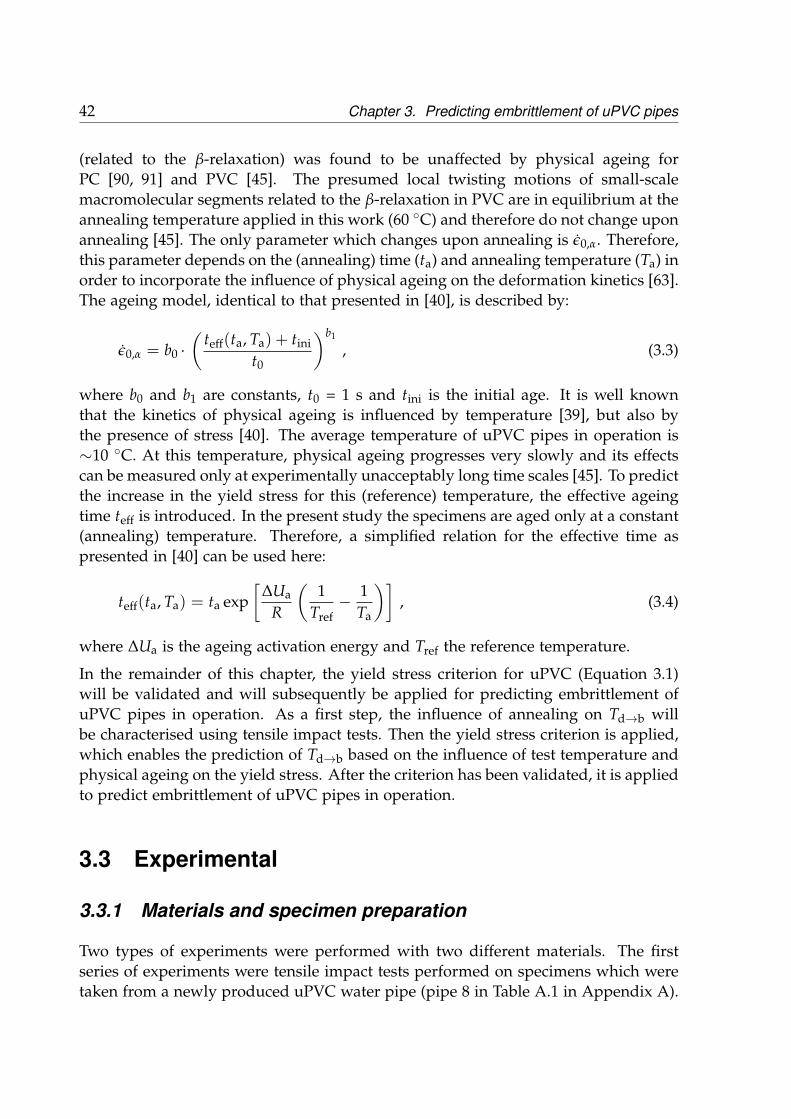
42 Chapter 3. Predicting embrittlement of uPVC pipes
(related to the β-relaxation) was found to be unaffected by physical ageing forPC [90, 91] and PVC [45]. The presumed local twisting motions of small-scalemacromolecular segments related to the β-relaxation in PVC are in equilibrium at theannealing temperature applied in this work (60 ◦C) and therefore do not change uponannealing [45]. The only parameter which changes upon annealing is ε̇0,α. Therefore,this parameter depends on the (annealing) time (ta) and annealing temperature (Ta) inorder to incorporate the influence of physical ageing on the deformation kinetics [63].The ageing model, identical to that presented in [40], is described by:
ε̇0,α = b0 ·(
teff(ta, Ta) + tini
t0
)b1
, (3.3)
where b0 and b1 are constants, t0 = 1 s and tini is the initial age. It is well knownthat the kinetics of physical ageing is influenced by temperature [39], but also bythe presence of stress [40]. The average temperature of uPVC pipes in operation is∼10 ◦C. At this temperature, physical ageing progresses very slowly and its effectscan be measured only at experimentally unacceptably long time scales [45]. To predictthe increase in the yield stress for this (reference) temperature, the effective ageingtime teff is introduced. In the present study the specimens are aged only at a constant(annealing) temperature. Therefore, a simplified relation for the effective time aspresented in [40] can be used here:
teff(ta, Ta) = ta exp[
∆Ua
R
(1
Tref− 1
Ta
)], (3.4)
where ∆Ua is the ageing activation energy and Tref the reference temperature.
In the remainder of this chapter, the yield stress criterion for uPVC (Equation 3.1)will be validated and will subsequently be applied for predicting embrittlement ofuPVC pipes in operation. As a first step, the influence of annealing on Td→b willbe characterised using tensile impact tests. Then the yield stress criterion is applied,which enables the prediction of Td→b based on the influence of test temperature andphysical ageing on the yield stress. After the criterion has been validated, it is appliedto predict embrittlement of uPVC pipes in operation.
3.3 Experimental
3.3.1 Materials and specimen preparation
Two types of experiments were performed with two different materials. The firstseries of experiments were tensile impact tests performed on specimens which weretaken from a newly produced uPVC water pipe (pipe 8 in Table A.1 in Appendix A).

3.3. Experimental 43
The pipe, having a diameter of 110 mm and a wall thickness of 2.7 mm, wascharacterised previously by Visser et al. who determined the deformation and theageing kinetics [45]. The model parameters of the pipe are summarised in Table 3.1.
Tensile impact specimens were produced by cutting 70 mm long semi-cylindricalsegments from the water pipe with a bandsaw. These segments were pressed ata compressive stress of ∼1 MPa into flat plates at 100 ◦C (∼15 ◦C above Tg) for25 minutes. Rectangular bars were milled from the plates with the length directionparallel to the axial (length) direction of the pipe, see Figure 3.4. The production ofthe tensile impact specimens was completed by milling a hole (� 4 mm) at the centreof the bars and milling holes (� 6 mm) at each end of the bars.
Ø 4 mm
10 mm
Ø 6 mmØ 6 mm
8 mm
31 mm
70 mm
Figure 3.4 A test specimen for the tensile impact test. The holes (� 6 mm) on both ends of the specimenwere used for clamping. The thickness of the bar is 2.7 mm.
The thermal pressing procedure erased all prior effects of physical ageing. Ohtaet al. [92] have shown that a heat treatment above Tg can change the crystallinestructure of PVC, which can in turn change the ageing kinetics of the material [93].However, as the pressing procedure has been carried out just above Tg for a relativelyshort time, its influence on the ageing kinetics is assumed to be negligible here.
Table 3.1 The values for the parameters in Equations 3.2 to 3.4 for the α and β relaxation mechanismsin the uPVC water pipe taken from Visser et al. [45].
α β
ε̇0,x 1.88 · 1038 2.21 · 109 [s−1]ν∗x 1.29 · 10−3 � 8.39 · 10−4 [m3/mol]
∆Ux 2.97 · 105 5.86 · 104 [J/mol]∆Ua,x 2.38 · 105 [J/mol]
b0 7.39 · 1041 � [s−1]b1 −0.45 [-]
� includes the pressure dependence on the yield stress of PVC [94].� The value of b0 is determined for Tref = 25 ◦C.
The second series of experiments were uniaxial tensile tests performed on specimenswhich were taken from an excavated uPVC gas pipe (pipe 6 in Table A.1 in
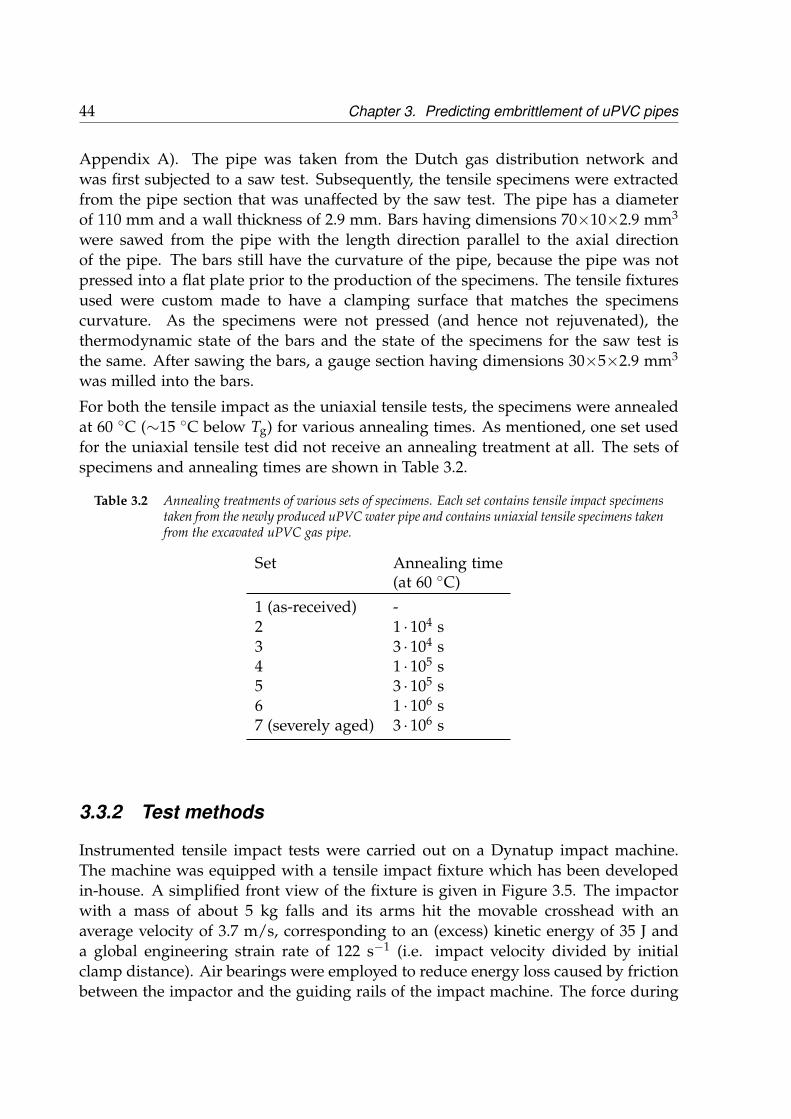
44 Chapter 3. Predicting embrittlement of uPVC pipes
Appendix A). The pipe was taken from the Dutch gas distribution network andwas first subjected to a saw test. Subsequently, the tensile specimens were extractedfrom the pipe section that was unaffected by the saw test. The pipe has a diameterof 110 mm and a wall thickness of 2.9 mm. Bars having dimensions 70×10×2.9 mm3
were sawed from the pipe with the length direction parallel to the axial directionof the pipe. The bars still have the curvature of the pipe, because the pipe was notpressed into a flat plate prior to the production of the specimens. The tensile fixturesused were custom made to have a clamping surface that matches the specimenscurvature. As the specimens were not pressed (and hence not rejuvenated), thethermodynamic state of the bars and the state of the specimens for the saw test isthe same. After sawing the bars, a gauge section having dimensions 30×5×2.9 mm3
was milled into the bars.
For both the tensile impact as the uniaxial tensile tests, the specimens were annealedat 60 ◦C (∼15 ◦C below Tg) for various annealing times. As mentioned, one set usedfor the uniaxial tensile test did not receive an annealing treatment at all. The sets ofspecimens and annealing times are shown in Table 3.2.
Table 3.2 Annealing treatments of various sets of specimens. Each set contains tensile impact specimenstaken from the newly produced uPVC water pipe and contains uniaxial tensile specimens takenfrom the excavated uPVC gas pipe.
Set Annealing time(at 60 ◦C)
1 (as-received) -2 1 · 104 s3 3 · 104 s4 1 · 105 s5 3 · 105 s6 1 · 106 s7 (severely aged) 3 · 106 s
3.3.2 Test methods
Instrumented tensile impact tests were carried out on a Dynatup impact machine.The machine was equipped with a tensile impact fixture which has been developedin-house. A simplified front view of the fixture is given in Figure 3.5. The impactorwith a mass of about 5 kg falls and its arms hit the movable crosshead with anaverage velocity of 3.7 m/s, corresponding to an (excess) kinetic energy of 35 J anda global engineering strain rate of 122 s−1 (i.e. impact velocity divided by initialclamp distance). Air bearings were employed to reduce energy loss caused by frictionbetween the impactor and the guiding rails of the impact machine. The force during

3.4. Impact test results 45
impact loading was measured using a precompressed 7.5 kN Kistler (type 9001A)force cell connected to a Kistler Type 5011A charge amplifier. The displacementwas measured using a Meterdrive ZAM 301 linear encoder and checked with theforce signal by integrating the displacement twice over a period of time. The tensileimpact tests were carried out at various temperatures between -20 ◦C and 80 ◦C.An additional device was employed for controlling the temperature of the specimenaround the centre hole within a range of ± 1.1 ◦C around the testing temperature.
specimen
movable crosshead
precompressed force cell
fixed crosshead
30 mm
10 mm
impactor arms
Ø 4 mmcentre hole
Figure 3.5 Front view of the fixture used for the tensile impact test.
Uniaxial tensile tests were carried out on a Zwick 1445 universal tensile testingmachine equipped with an AST 2.5 kN force cell and a temperature controlledchamber. All tensile tests were carried out at a constant engineering strain rate of10−3 s−1 and at a fixed temperature of 20 ± 0.1 ◦C. The value of the yield stress wascalculated using the local maximum in the force signal and the average of the initialcross-sectional surface areas measured at three locations along the gauge section.
3.4 Impact test results
3.4.1 Types of failure
The failures observed during impact testing can be divided into three types: brittle,semi-ductile and ductile failure. Force-displacement curves and photographs of thefractured specimens are given in Figure 3.6 for each type of failure.
For brittle failures, the force increases from the start of the impact loading to amaximum value of ∼1.5 kN, after which the force suddenly drops to zero directly
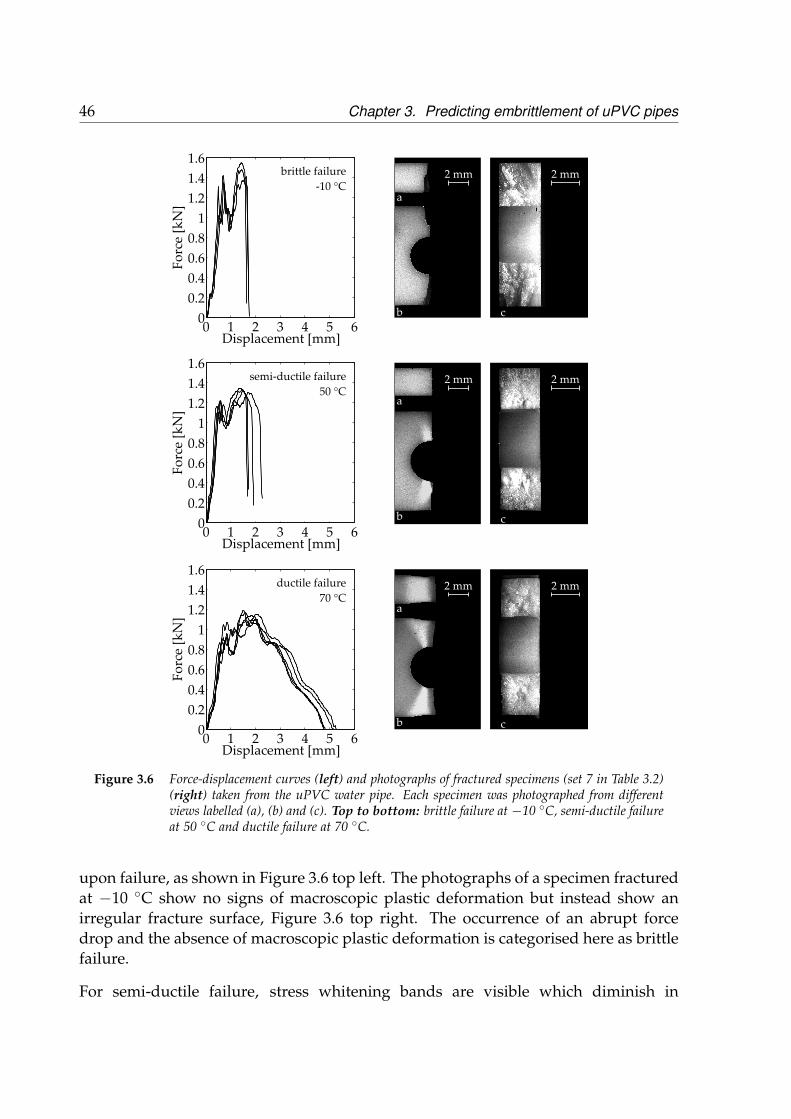
46 Chapter 3. Predicting embrittlement of uPVC pipes
2 mm
2 mm
2 mm
0 1 2 3 4 5 60
0.2
0.4
0.6
0.8
1
1.2
1.4
1.6
Displacement [mm]
Fo
rce
[kN
]
0 1 2 3 4 5 60
0.2
0.4
0.6
0.8
1
1.2
1.4
1.6
Displacement [mm]
Fo
rce
[kN
]
0 1 2 3 4 5 60
0.2
0.4
0.6
0.8
1
1.2
1.4
1.6
Displacement [mm]
Fo
rce
[kN
]
a
b
a
b
a
b
2 mm
c
2 mm
c
2 mm
c
brittle failure
-10 °C
semi-ductile failure
50 °C
ductile failure
70 °C
Figure 3.6 Force-displacement curves (left) and photographs of fractured specimens (set 7 in Table 3.2)(right) taken from the uPVC water pipe. Each specimen was photographed from differentviews labelled (a), (b) and (c). Top to bottom: brittle failure at −10 ◦C, semi-ductile failureat 50 ◦C and ductile failure at 70 ◦C.
upon failure, as shown in Figure 3.6 top left. The photographs of a specimen fracturedat −10 ◦C show no signs of macroscopic plastic deformation but instead show anirregular fracture surface, Figure 3.6 top right. The occurrence of an abrupt forcedrop and the absence of macroscopic plastic deformation is categorised here as brittlefailure.
For semi-ductile failure, stress whitening bands are visible which diminish in

3.4. Impact test results 47
radial direction from the hole, Figure 3.6 middle right. These bands indicate thatmacroscopic plastic deformation took place during impact loading. As shown inview (a), no plastic deformation was observed at the side edge of the specimen.Stress whitening over the partial cross section shows that the material deformedplastically to some extent before failure. This effect caused a small increase of thedisplacement at the force drop of the semi-ductile failed specimens in comparisonwith the displacement at the force drop in brittle failure events, Figure 3.6 middleleft. The occurrence of an abrupt force drop and macroscopic plastic deformationover the partial cross section is categorised here as semi-ductile failure.
Extensive stress whitening was observed in the photographs of the specimens whichfailed in a ductile way, Figure 3.6 bottom right. The photographs from views (a)and (b) show that the plastic deformation zone extended over the complete crosssection of the specimen. The extension of the plastic deformation zone complieswith a more or less smooth decrease after the point of maximum force up to thepoint of fracture as a function of the displacement, Figure 3.6 bottom left. Theoccurrence of plastic deformation over the complete cross section of the specimenand smooth decrease of the force after the point of maximum force is categorised hereas ductile failure. In the next section, the absorbed energy and the plastic extensionwill be determined from the obtained force-displacement curves and will be used todifferentiate quantitatively between the types of failure observed.
3.4.2 Characterisation of force-displacement curves
During the tensile impact tests, the kinetic energy supplied by the impactor is(i) stored as elastic energy in the specimen, (ii) dissipated in the form of plasticdeformation of the specimen, (iii) used to create surface area in the failure process,(iv) stored as elastic energy in the set up and (v) dissipated by the set-up (friction).The energy absorbed by the specimen during impact loading is equal to the total areaunder the force-displacement curve. Regardless of the type of failure, all specimensfollowed a similar path up to the point where the force reaches its maximum valueFmax, as was shown in Figure 3.6*. Only the part of the curves after Fmax has a linkwith the failure behaviour as this contributes to the observed plasticity. Therefore,the part of the force-displacement curves after Fmax is of interest in determining theinfluence of annealing on the amount of plasticity. Two parameters are proposed to beused here to distinguish the failure type from the force-displacement measurement,without having to revert to (the more subjective) image analysis. The first parameter
*The maximum force Fmax decreases as the temperature increases. This causes a decrease in thearea of the force-displacement curve up to Fmax. In parallel, the displacement at the point of Fmaxincreases with temperature and causes an increase in the area. These two effects partially compensateeach other. In fact, the area underneath the force-displacement curve up to Fmax is hardly influencedby the test temperature and thus is hardly influenced by type of failure.

48 Chapter 3. Predicting embrittlement of uPVC pipes
is the energy absorbed after Fmax was reached; given by:
EtFmax≤t≤tf =∫ s(tf)
s(tFmax)F (s) ds , (3.5)
where F is the measured force and s is the measured displacement. The integrationbounds are defined in Figure 3.7.
The second parameter that is proposed as a measure for the ductility of the specimenis the plastic extension of a specimen (stFmax≤t≤tf). This plastic extension is defined asthe extension that is observed for the specimen between the times tFmax and tf (alsoshown in Figure 3.7):
stFmax≤t≤tf = s(tf)− s(tFmax). (3.6)
Displacement
Fo
rce
s (tFmax) s (tf)
E
s
Figure 3.7 A typical force-displacement curve of a specimen taken from the uPVC water pipe whichfailed in a ductile way. The time tFmax is the time when the force reaches a maximumvalue Fmax. The time tf is the time when the force reaches zero. The absorbed energy aftermaximum force, referred to as the plastic energy or EtFmax≤t≤tf throughout the rest of thiswork, is defined as the surface area of the grey area. The plastic extension, stFmax≤t≤tf , isindicated by the black arrow.
The histograms of all results for both the plastic energy and the plastic extensionare given in Figure 3.8 for each type of failure. The histograms both show that thepopulation of ductile failure data clearly is separated from the populations of semi-ductile and brittle failure data. The latter two populations cannot be distinguishedclearly.
In the next section both failure parameters (EtFmax≤t≤tf and stFmax≤t≤tf) proposed in thissubsection will be employed to characterise Td→b.

3.5. Ductile-to-brittle transition analysis 49
0 20 40 60 80 100 120 140 1600
5
10
15
20
25
30
35
40
EtFmax ≤ t ≤ tf[kJ/m
2]
Occu
rren
ces [
-]
brittle
semi-ductile
ductile
0 1 2 3 4 50
5
10
15
20
25
30
35
40
s [mm]
Occu
rren
ces [
-]
brittle
semi-ductile
ductile
tFmax ≤ t ≤ tf
Figure 3.8 Histograms of the plastic energy EtFmax≤t≤tf (left) and plastic extension stFmax≤t≤tf (right)for each type of failure. The plastic energy and plastic extension were calculated usingEquations 3.5 and 3.6 respectively, and using the initial cross-sectional surface area measuredat the centre hole of the specimen. The histograms were obtained from 124 tensile impact testson specimens taken from the uPVC water pipe.
3.5 Ductile-to-brittle transition analysis
The plastic energy EtFmax≤t≤tf and plastic extension stFmax≤t≤tf for severely agedspecimens (set 7 in Table 3.2) are shown as a function of test temperature in Figure 3.9.Between −20 ◦C and 50 ◦C, the plastic energy and plastic extension are relativelysmall and almost independent of test temperature. The specimens failed in a brittleor semi-ductile way within this temperature range. In contrast, the specimens whichfractured at 60 ◦C and 70 ◦C failed in a ductile way. This change in type of failurecorrelates with the onset of a steep increase in the plastic energy and plastic extension.The data shows that there is a transition from brittle (and semi-ductile) failure toductile failure at ∼55 ◦C.
The plastic energy and plastic extension as a function of temperature exhibitessentially the same characteristics as shown in Figure 3.9 and can thus both be usedto determine the ductile-to-brittle transition. The onset temperature of ductile failureis the same for both properties. However, the scatter in the brittle/semi-ductile regionis larger for the plastic energy than for the plastic extension. Therefore, the plasticextension is used as a measure for the ductility in the following analyses.
The influence of physical ageing on Td→b has been studied to validate the yieldstress criterion defined by Equation 3.1. The increase in Td→b as a function of theannealing time has been determined from tensile impact tests on specimens takenfrom the uPVC water pipe. A graphical/mathematical methodology as presented inFigure 3.10 and in the next paragraph is employed to determine Td→b of each set ofspecimens defined in Table 3.2.
The plastic extension versus the test temperature for severely aged specimens is

50 Chapter 3. Predicting embrittlement of uPVC pipes
-20 0 20 40 60 800
40
80
120
160
Test temperature [°C]
E[k
J/m
2 ]
brittle andsemi-ductile failure
ductilefailure
t Fm
ax≤
t≤
t f
-20 0 20 40 60 800
1
2
3
4
5
6
Test temperature [°C]
s[m
m]
brittle andsemi-ductile failure
ductilefailure
t Fm
ax≤
t≤
t f
Figure 3.9 The plastic energy (left) and plastic extension (right) versus test temperature determinedfrom tensile impact tests performed on severely aged specimens taken from the uPVC waterpipe. The vertical dashed line separates brittle and semi-ductile failure events from ductilefailure events.
shown in Figure 3.10 left. As shown before, a steep increase in the plastic extensionwith increasing test temperature correlates with the change in type of failure frombrittle (and semi-ductile) to ductile. The temperature at the onset of this steepincrease in the extension is defined as Td→b and has been determined graphicallyusing linear fit functions. In Figure 3.10 left, the dashed line was determined by aleast squares fit of a linear function on the rejuvenated and severely aged specimensthat failed in a brittle and a semi-ductile way and was assumed to be independentof physical ageing. The increase in the plastic extension for severely aged specimens,which failed in a ductile way, was fitted using a linear function (solid line). The linearfunction describes the data well (R2 = 0.95) which shows that the extension increaseswith temperature in a linear fashion for range of temperatures investigated. Thetemperature at the intersection of the solid line with the dashed line defines the Td→bof the severely aged specimens and was found to be 50.8 ± 4.5 ◦C (95% confidenceintervals). The Td→b of the rejuvenated specimens was determined by the solid linethat was fitted using the slope of the solid line of the severely aged specimens. Theobtained fit is of sufficient quality (R2 = 0.93) to justify the assumption of a slope thatis independent of physical ageing for the wide range of annealing times investigated.The temperature at the intersection of the solid line of the rejuvenated specimens withthe dashed line was found to be 45.5 ± 2.0 ◦C (95% confidence intervals). Hence, adifference of ∼5 ◦C in the average Td→b between the rejuvenated and severely agedspecimens was found. Visser et al. found a similar difference in Td→b (∼4 ◦C) [45].They took specimens from the same uPVC water pipe and applied the same thermalhistory to their specimens, but used a puncture test instead of a tensile impact test,resulting in a different loading geometry.
The Td→b as a function of the annealing time was determined for another batchof specimens taken from the uPVC water pipe. The specimens received annealing

3.5. Ductile-to-brittle transition analysis 51
-20 0 20 40 60 800
1
2
3
4
5
Test temperature [°C]
physical ageing
rejuvenatedseverely aged
s[m
m]
t Fm
ax≤
t≤
t f
-20 0 20 40 60 800
1
2
3
4
5
Test temperature [°C]
9.0⋅103 s
2.8⋅104 s
1.0⋅105 s
2.8⋅105 s
9.2⋅106 s
2.8⋅106 s
s[m
m]
t Fm
ax≤
t≤
t f
Figure 3.10 The plastic extension versus the test temperature determined from tensile impact testsperformed on specimens taken from the uPVC water pipe. Left: rejuvenated and severelyaged specimens (set 1 and 7 in Table 3.2). The Td→b of the rejuvenated and severelyaged specimens are defined as the temperatures at the intersections of the parallel solidlines with the dashed line and are indicated by the arrows. The Td→b shifts to higher testtemperature as a result of the annealing treatment below Tg. Right: sets of specimens whichwere annealed according to Table 3.2. The nine specimens within a set have had the samethermal history. The error bars represent one standard deviation determined from the ninemeasurements. The dashed line is taken from the left figure. For each set of specimens a solidline is fitted which has the same slope as the solid lines in the left figure. The intersectionsof the parallel solid lines with the dashed line define Td→b for the sets of specimens.
treatments according to Table 3.2 (sets 1-7). Figure 3.10 right shows the plasticextension for various annealing times. The average test temperature between thesets was about 60 ◦C and varied maximally 3.3 ◦C. The temperature variation withineach set varied less; only 1.1 ◦C. The solid lines were fitted to the markers usingthe slope from the line describing the severely aged specimens in Figure 3.10 left.Referring to the proper fit of the rejuvenated and severely aged experimental datausing this same slope, this assumption seems to be viable. The Td→b of the sets ofspecimens were determined from the intersections between the solid lines and thedashed line in Figure 3.10 right. The Td→b for increasing annealing times are given inFigure 3.11 left. The 68% confidence intervals were determined from the variation inthe plastic extension and temperature in Figure 3.10 right. The Td→b clearly increasesby as much as 7.7 ◦C, with increasing annealing time. As the average test temperaturebetween the sets is greater than the temperature variation within each set, the formerof the two contributes most to the variation in average Td→b in Figure 3.11 left.
Note that the Td→b of the rejuvinated specimens (45.5 ± 2.0 ◦C) in Figure 3.10 leftwhich did not receive an annealing treatment is greater than that of the specimenswhich were annealed for 1 · 104 s and 3 · 104 s shown in Figure 3.11 left. Therejuvenated specimens have been extracted from the circumferential direction insteadof the extrusion direction of the original pipe. As also observed by others [21, 69],impact loading of specimens taken from in the circumferential direction the original

52 Chapter 3. Predicting embrittlement of uPVC pipes
uPVC pipe exhibit a more brittle failure behaviour and a greater Td→b than whenspecimens would be loaded in the extrusion direction of the pipe. The rejuvenatedspecimens were therefore not taken into account for determining the Td→b as afunction of the annealing time.
The influence of the annealing time on Td→b can be calculated by assuming that theyield stress criterion for uPVC (Equation 3.1) holds and using Equations 3.2 to 3.4and the parameters in Table 3.1. As a first step, the specimens annealed for 2.8 · 106 sthat show a Td→b of 49 ◦C, were chosen as a reference (see Figure 3.11 left). Theyield stress for these specimens at the transition conditions has been calculated to be74 MPa. The value of the yield stress is assigned as the critical tensile yield stress.The choice of another annealing time (and Td→b) is assumed to lead to a similar valueof the critical tensile yield stress. Remember that the critical tensile yield stress is nota material parameter, but merely a value that enables the modelling of the increasein Td→b resulting from annealing treatments below Tg for the loading conditions asapplied by the tensile impact setup.
Figure 3.11 Left: markers: the experimentally determined Td→b of specimens taken from the uPVCwater pipe which were annealed at 60 ◦C for various annealing times. The error barsrepresent 68% confidence intervals taking into account the variation in temperature andplastic extension. Solid line: the calculated Td→b versus the annealing time determinedusing the calculated critical tensile yield stress, Equations 3.2 to 3.4 and the parameters inTable 3.1. Right: the yield stress versus the test temperature for annealing times 9.0 · 103 s,2.8 · 105 s and 2.8 · 106 s. The critical tensile yield stress was determined from the referencepoint indicated in Figure 3.11 left. The vertical dashed lines indicate Td→b for the threeannealing times.
The methodology for calculating Td→b as a function of the annealing time from thecritical tensile yield stress is outlined in Figure 3.11 right. The calculated temperatureindependent critical tensile yield stress is shown as the horizontal dashed line. Thethree solid lines are the yield stress versus test temperature for annealing times of9.0 · 103 s, 2.8 · 105 s and 2.8 · 106 s respectively. The Td→b for these annealing timeshave been determined by calculating the test temperatures at which the yield stress

3.5. Ductile-to-brittle transition analysis 53
is equal to the critical tensile yield stress. The Td→b for these annealing times areindicated by vertical lines in Figure 3.11 right. The Td→b for a range of annealingtimes from 103 s to 108 s were calculated using the methodology explained aboveand is given by the solid line in Figure 3.11 left. Although there is significantvariation in the determined Td→b, clearly the trend in the experimentally obtainedvalues complies with the model results.
Instead of calculating Td→b using a critical tensile yield stress, the reverse route canalso be followed. The yield stress at transition conditions was calculated for eachof the different annealing times (in Figure 3.11 left) and is shown as function of theannealing time in Figure 3.12. The calculated values of critical tensile yield stressall fall within a range of 4 MPa, which is only 5% of the average value of 74 MPa.Furthermore, the critical tensile yield stress as a function of the annealing time isnearly constant. These results shows that uPVC exhibits a ductile-to-brittle transitionwhen the yield stress of the material surpasses a critical tensile yield stress value thatis independent of the thermodynamic state and justifies the assumption that other(reference) points in Figure 3.11 left will lead to similar values of the critical tensileyield stress.
103
104
105
106
107
108
68
70
72
74
76
78
Annealing time [s]
Cri
tica
l y
ield
str
ess
[MP
a]
Figure 3.12 The critical tensile yield stress for various annealing times. The critical tensile yield stresswas calculated for each annealing time and experimentally determined Td→b in Figure 3.11left and using Equations 3.2 to 3.4 and the parameters in Table 3.1.
The results presented in this section indicate that the concept of a critical tensileyield stress, as proposed by Engels et al. [78], also holds quantitatively for tensileimpact tests on uPVC. The kinetics of Td→b with physical ageing can be describedquantitatively with the use of a descriptive model for the deformation kinetics whichincorporates the ageing kinetics. This means that it is possible to calculate Td→bof a uPVC pipe once its yield stress at a certain deformation rate is known (forexample from a micro-hardness test). It should, however, be emphasised that thisvalue of Td→b is specific for the loading conditions applied during tensile impacttesting. For puncture tests much lower Td→b values were found [45] and the value
54 Chapter 3. Predicting embrittlement of uPVC pipes
of Td→b found in practice can be different again. In the next section an approach isproposed that uses the link between failure behaviour and deformation kinetics topredict the embrittlement of pipes in practical applications.
3.6 Predicting embrittlement in practice
The saw test that was mentioned in the introduction of this chapter was developed byWeller et al. [65]. The loading case applied in this test corresponds closely to loadingcases that typically take place in the field. This saw test can therefore be employedto determine to which extent ageing has progressed that the failure behaviour of apipe is such that it is unacceptable to keep it in service in the field. This (critical)thermodynamic state can then be used as a limiting value that can be employed incombination with the existing model for deformation and ageing kinetics to predictthe residual service lifetime of uPVC pipes. Before this procedure is presented, firstsome experiments that show the influence of physical ageing on the outcome of thesaw tests are presented.
Saw tests were performed on two pipe segments which were cut from the excavateduPVC gas pipe. One segment was annealed at 60 ◦C for 2.8 · 106 s and labelled as’severely aged’. The other segment did not receive an annealing treatment and waslabelled as ’as-received’. Each segment was sawed at two different test temperaturesand two different saw speeds. The resulting saw cuts were photographed and areshown in Figure 3.13. Two types of saw cuts can be observed: straight and irregular.A straight saw cut corresponds to ductile behaviour, whereas an irregular saw cutcorresponds to brittle failure, as described in the introduction. Sawing slowly resultedin straight saw cuts irrespective of the range of test temperatures and degrees ofphysical ageing investigated. Therefore, the annealing treatment did not influencethe failure behaviour of the pipe when sawing was done slowly. However, fast sawingthe as-received segment at 20 ◦C resulted in a straight saw cut, whereas sawing theseverely aged segment at the same conditions resulted in an irregular saw cut. Thisclearly illustrates that physical ageing can indeed influence the failure behaviour ofpipes with this type of test.
For the determination of a critical thermodynamic state, a decision should first bemade on which outcome of the saw test is still acceptable. If brittle fracture for fastsaw speeds at 5 ◦C are still allowed, it will give a different limiting value than ifthis is not allowed. Once this decision has been made the critical thermodynamicstate can be found by performing saw tests on not only specimens annealed attwo different annealing times as shown in Figure 3.13, but on many specimenswhich were annealed for different (intermediate) times. Then a replacement criterionmust be defined for determining the critical thermodynamic state at which thefailure behaviour in saw tests becomes unacceptable. Subsequently, a tensile test

3.6. Predicting embrittlement in practice 55
5 °C 20 °C 20 °C5 °C
As-received
slow
fast
Severely aged
Test temperature
Saw
sp
eed
Saw
sp
eed
Test temperature
slow
fast
Figure 3.13 Photographs of saw cuts made by sawing as-received and severely aged (2.8 · 106 s at 60 ◦C)pipe segments taken from the excavated uPVC gas pipe. Sawing was done at 5 ◦C and20 ◦C and for two different saw speeds: slow and fast. The saw tests were performed atKiwa Technology, the Netherlands.
should be performed on a specimen which must be in the same thermodynamicstate. The critical thermodynamic state can then be quantified using the yield stressdetermined from the tensile test. Once the critical tensile yield stress has beendetermined, the residual lifetime of the pipe follows from the ageing kinetics of theyield stress and the value of the yield stress belonging to the present thermodynamicstate of a pipe. The value of the current yield stress can be determined from anon-destructive measurement on a pipe, such as the micro-hardness measurementapproach explained in Chapter 2.
A major drawback of the saw test is that a lot of material is required for each test.As the length of the excavated pipe available for this study was limited, saw testsresults on specimens that received intermediate annealing times were not available.However, the yield stress was determined for a range of annealing times (listed inTable 3.2) using uniaxial tensile tests on specimens taken from the excavated pipe,such that the difference in thermodynamic state was quantified. The values of theyield stresses are plotted against the effective time in Figure 3.14. The effectivetime was calculated for a reference temperature of 10 ◦C using Equation 3.4. Anageing activation energy of 238 kJ/mol was assumed for this pipe (Table 3.1). Thespecimens that are in the same thermodynamic state as the segments cut for the sawtests are labelled ’as-received’ and ’severely aged’. The annealing treatment appliedto the segments for the saw tests caused the yield stress of the segments to increaseby approximately 10%. Apparently, such an increase in yield stress corresponds toa sufficiently large increase in strain localisation that failure behaviour at 20 ◦C ischanged as shown in Figure 3.13.
The residual lifetime of a pipe can be determined with the use of the ageing kinetics
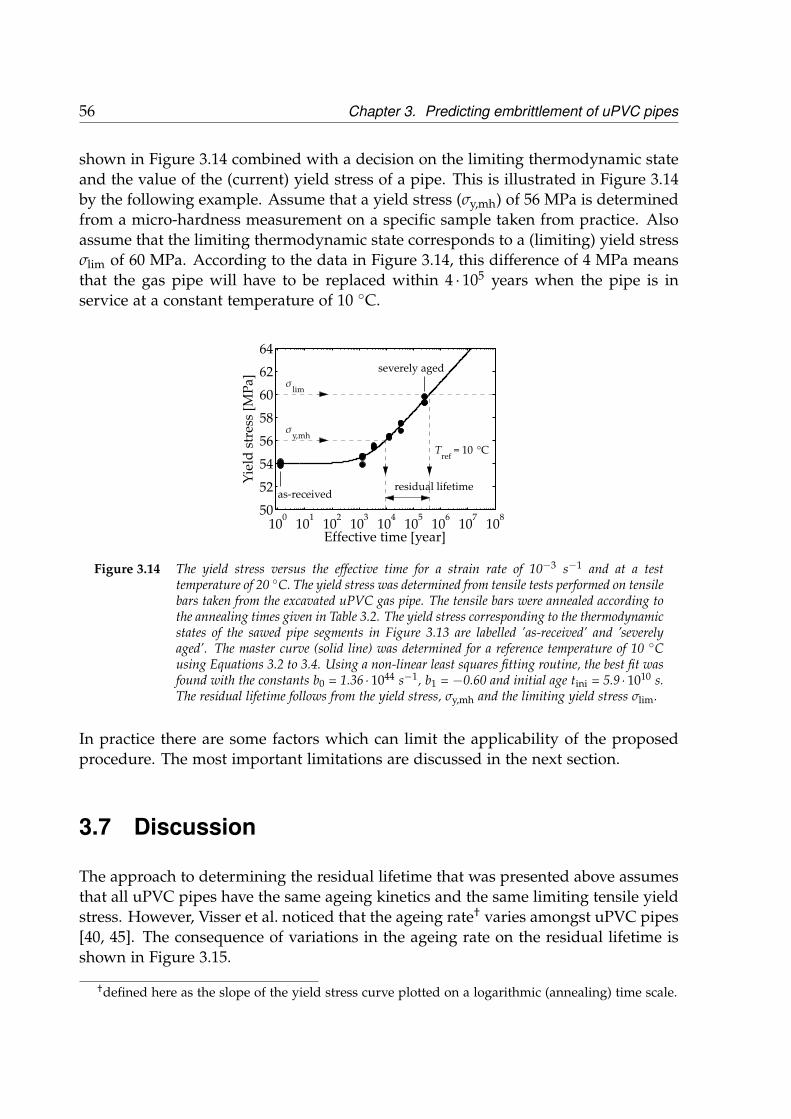
56 Chapter 3. Predicting embrittlement of uPVC pipes
shown in Figure 3.14 combined with a decision on the limiting thermodynamic stateand the value of the (current) yield stress of a pipe. This is illustrated in Figure 3.14by the following example. Assume that a yield stress (σy,mh) of 56 MPa is determinedfrom a micro-hardness measurement on a specific sample taken from practice. Alsoassume that the limiting thermodynamic state corresponds to a (limiting) yield stressσlim of 60 MPa. According to the data in Figure 3.14, this difference of 4 MPa meansthat the gas pipe will have to be replaced within 4 · 105 years when the pipe is inservice at a constant temperature of 10 ◦C.
Figure 3.14 The yield stress versus the effective time for a strain rate of 10−3 s−1 and at a testtemperature of 20 ◦C. The yield stress was determined from tensile tests performed on tensilebars taken from the excavated uPVC gas pipe. The tensile bars were annealed according tothe annealing times given in Table 3.2. The yield stress corresponding to the thermodynamicstates of the sawed pipe segments in Figure 3.13 are labelled ’as-received’ and ’severelyaged’. The master curve (solid line) was determined for a reference temperature of 10 ◦Cusing Equations 3.2 to 3.4. Using a non-linear least squares fitting routine, the best fit wasfound with the constants b0 = 1.36 · 1044 s−1, b1 = −0.60 and initial age tini = 5.9 · 1010 s.The residual lifetime follows from the yield stress, σy,mh and the limiting yield stress σlim.
In practice there are some factors which can limit the applicability of the proposedprocedure. The most important limitations are discussed in the next section.
3.7 Discussion
The approach to determining the residual lifetime that was presented above assumesthat all uPVC pipes have the same ageing kinetics and the same limiting tensile yieldstress. However, Visser et al. noticed that the ageing rate† varies amongst uPVC pipes[40, 45]. The consequence of variations in the ageing rate on the residual lifetime isshown in Figure 3.15.
†defined here as the slope of the yield stress curve plotted on a logarithmic (annealing) time scale.

3.7. Discussion 57
Figure 3.15 Master curves of the yield stress for three uPVC pipes having various rates of physicalageing. The master curves were determined for a strain rate of 10−3 s−1, a test temperatureof 20 ◦C and a reference temperature of 10 ◦C. The upper and lower horizontal dashed linesrepresent a hypothetical limiting yield stress σlim of 60 MPa and a hypothetical measuredyield stress σy,mh of 54 MPa respectively. The horizontal arrows indicate the correspondingresidual lifetimes. The residual lifetime of the three uPVC pipes is, respectively, 3.2 · 108,1.8 · 106 and 129 years for increasing ageing rate.
Here three master curves of different uPVC pipes are shown. These master curveswere determined by shifting the yield stress data using Equation 3.4 to the averageageing temperature in practice (10 ◦C). The master curves are described usingEquations 3.2 to 3.4. The values of the parameters b0, b1 and the ageing rates ofthe three pipes are given in Table 3.3. Clearly, each of the pipes has a distinctlydifferent ageing rate. Figure 3.15 shows that a (hypothetical) limiting tensile yieldstress σlim is reached at an earlier time, when the ageing rate of the pipe is higher.Consequently, in this example, the residual lifetime differs from about 300 millionyears to 129 years, assuming that all uPVC pipes in Figure 3.15 have the same limitingyield stress value. To conclude, if the ageing rate is sufficiently high, physical ageingcould cause embrittlement of the pipe during service. As a consequence, the ageingrate must be taken into account for accurate determination of the residual lifetime.A study on the origin of the variation in the ageing rate is presented in Chapter 4 ofthis thesis.
Physical ageing is not the only factor that can result in a reduction in ductility. Apartfrom physical ageing, the most important other factor that influences Td→b of uPVCgas pipes is the level of gelation [19]. The level of gelation (level of primary particlestructure breakdown [71]) is expected to influence the limiting tensile yield stress andthus to influence the residual lifetime. As the level of gelation varies amongst uPVCpipes [95], it must be taken into account for accurate determination of the residuallifetime of uPVC pipes in service.
Meijering studied the influence of the level of gelation on Td→b using puncture testsand found a minimum in Td→b for∼70% level of gelation [19]. The expected influence
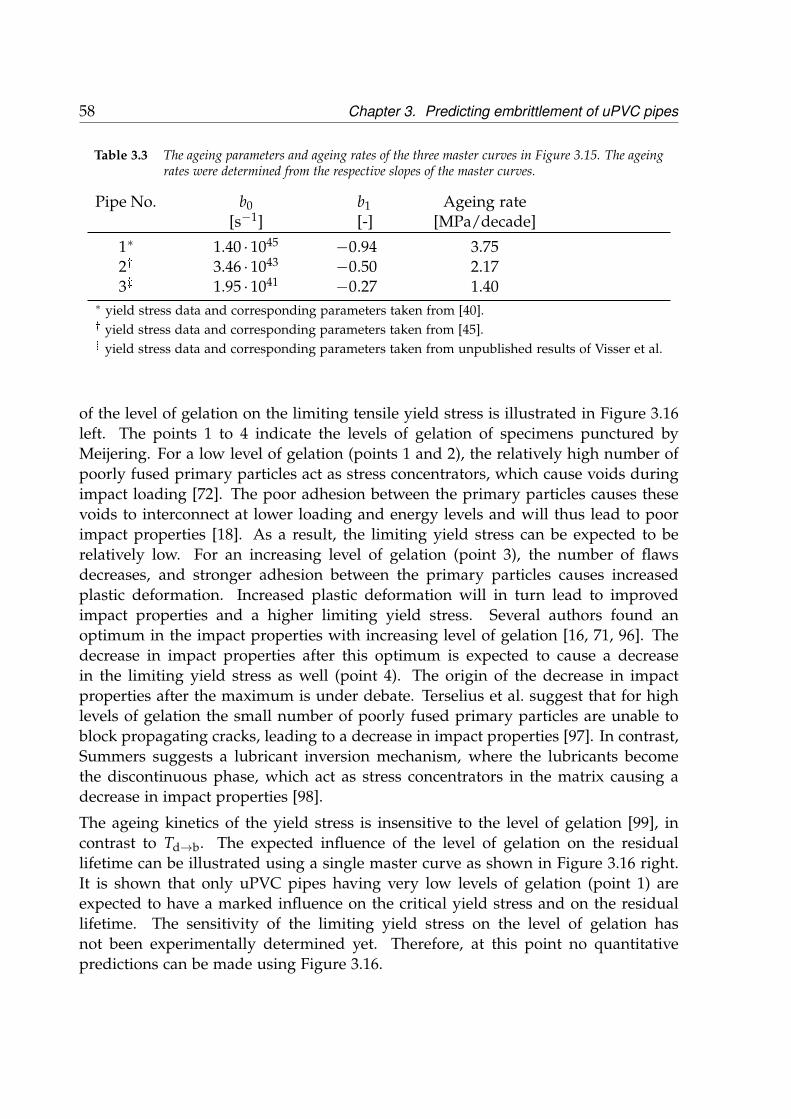
58 Chapter 3. Predicting embrittlement of uPVC pipes
Table 3.3 The ageing parameters and ageing rates of the three master curves in Figure 3.15. The ageingrates were determined from the respective slopes of the master curves.
Pipe No. b0 b1 Ageing rate[s−1] [-] [MPa/decade]
1∗ 1.40 · 1045 −0.94 3.752� 3.46 · 1043 −0.50 2.173� 1.95 · 1041 −0.27 1.40
∗ yield stress data and corresponding parameters taken from [40].� yield stress data and corresponding parameters taken from [45].� yield stress data and corresponding parameters taken from unpublished results of Visser et al.
of the level of gelation on the limiting tensile yield stress is illustrated in Figure 3.16left. The points 1 to 4 indicate the levels of gelation of specimens punctured byMeijering. For a low level of gelation (points 1 and 2), the relatively high number ofpoorly fused primary particles act as stress concentrators, which cause voids duringimpact loading [72]. The poor adhesion between the primary particles causes thesevoids to interconnect at lower loading and energy levels and will thus lead to poorimpact properties [18]. As a result, the limiting yield stress can be expected to berelatively low. For an increasing level of gelation (point 3), the number of flawsdecreases, and stronger adhesion between the primary particles causes increasedplastic deformation. Increased plastic deformation will in turn lead to improvedimpact properties and a higher limiting yield stress. Several authors found anoptimum in the impact properties with increasing level of gelation [16, 71, 96]. Thedecrease in impact properties after this optimum is expected to cause a decreasein the limiting yield stress as well (point 4). The origin of the decrease in impactproperties after the maximum is under debate. Terselius et al. suggest that for highlevels of gelation the small number of poorly fused primary particles are unable toblock propagating cracks, leading to a decrease in impact properties [97]. In contrast,Summers suggests a lubricant inversion mechanism, where the lubricants becomethe discontinuous phase, which act as stress concentrators in the matrix causing adecrease in impact properties [98].
The ageing kinetics of the yield stress is insensitive to the level of gelation [99], incontrast to Td→b. The expected influence of the level of gelation on the residuallifetime can be illustrated using a single master curve as shown in Figure 3.16 right.It is shown that only uPVC pipes having very low levels of gelation (point 1) areexpected to have a marked influence on the critical yield stress and on the residuallifetime. The sensitivity of the limiting yield stress on the level of gelation hasnot been experimentally determined yet. Therefore, at this point no quantitativepredictions can be made using Figure 3.16.
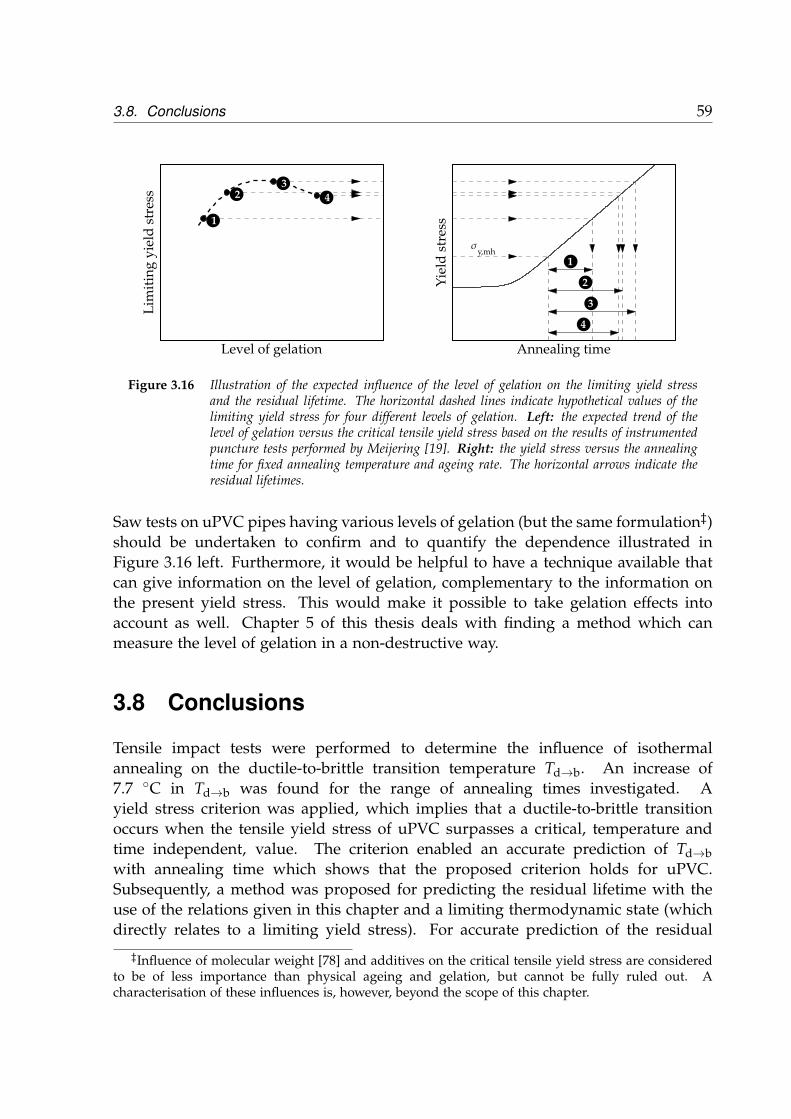
3.8. Conclusions 59
Level of gelation
Lim
itin
g y
ield
str
ess
1
2
3
4
Figure 3.16 Illustration of the expected influence of the level of gelation on the limiting yield stressand the residual lifetime. The horizontal dashed lines indicate hypothetical values of thelimiting yield stress for four different levels of gelation. Left: the expected trend of thelevel of gelation versus the critical tensile yield stress based on the results of instrumentedpuncture tests performed by Meijering [19]. Right: the yield stress versus the annealingtime for fixed annealing temperature and ageing rate. The horizontal arrows indicate theresidual lifetimes.
Saw tests on uPVC pipes having various levels of gelation (but the same formulation‡)should be undertaken to confirm and to quantify the dependence illustrated inFigure 3.16 left. Furthermore, it would be helpful to have a technique available thatcan give information on the level of gelation, complementary to the information onthe present yield stress. This would make it possible to take gelation effects intoaccount as well. Chapter 5 of this thesis deals with finding a method which canmeasure the level of gelation in a non-destructive way.
3.8 Conclusions
Tensile impact tests were performed to determine the influence of isothermalannealing on the ductile-to-brittle transition temperature Td→b. An increase of7.7 ◦C in Td→b was found for the range of annealing times investigated. Ayield stress criterion was applied, which implies that a ductile-to-brittle transitionoccurs when the tensile yield stress of uPVC surpasses a critical, temperature andtime independent, value. The criterion enabled an accurate prediction of Td→bwith annealing time which shows that the proposed criterion holds for uPVC.Subsequently, a method was proposed for predicting the residual lifetime with theuse of the relations given in this chapter and a limiting thermodynamic state (whichdirectly relates to a limiting yield stress). For accurate prediction of the residual
‡Influence of molecular weight [78] and additives on the critical tensile yield stress are consideredto be of less importance than physical ageing and gelation, but cannot be fully ruled out. Acharacterisation of these influences is, however, beyond the scope of this chapter.

60 Chapter 3. Predicting embrittlement of uPVC pipes
lifetime of uPVC pipes in distribution networks, variations in the ageing rate and thelevel of gelation amongst uPVC pipes must be taken into account.
Chapter 4
The variation of physical ageingkinetics of uPVC pipes
4.1 Introduction
Unplasticised poly(vinyl chloride) (uPVC) pipes in the Dutch gas and water distribu-tion networks physically age as explained in Chapter 1. This phenomenon is causedby the fact that glassy polymers, like PVC, are not in a state of thermodynamicequilibrium below the glass transition temperature Tg, but continuously strivetowards it [37, 46]. Physical ageing causes a gradual increase in the yield stressover time [39] which can eventually lead to brittle failure behaviour of uPVC pipesupon impact loading events [45]. Physical ageing is an important factor that limitsthe lifetime of uPVC pipes as the occurrence of brittle failures in PVC distributionnetworks is highly undesirable [9].
Visser et al. observed a significant difference in the rate at which the yield stressincreases as a function of time due to physical ageing, using the comparison of anold, excavated uPVC gas pipe against a new, unused uPVC water pipe [40, 45]. Theinfluence of differences in the ageing behaviour on the residual lifetime for thesepipes is shown in Figure 4.1. The yield stress is given as a function of the effectivetime at the reference temperature of 10 ◦C, which is the typical temperature duringservice. The rate at which the yield stress increases with the logarithm of time isdenoted as the ageing rate, σ̇y, and is expressed in MPa/decade. The ageing rates ofthe two pipes investigated by Visser et al. are 3.75 MPa/decade and 1.88 MPa/decaderespectively*.
The residual lifetime of each pipe was calculated using (i) an exemplary value of thelimiting tensile yield stress σlim at which the failure behaviour of uPVC pipes becomes
*For long effective times, the master curves are expected to level off when the PVC approachesits equilibrium thermodynamic state [100]. This effect has not been observed within the investigatedranges of annealing temperatures and annealing times.
61

62 Chapter 4. The variation of physical ageing kinetics of uPVC pipes
Figure 4.1 Master curves of the yield stress for two uPVC pipes [pipes 2 (3.75 MPa/decade) and 8 (1.88MPa/decade)] having different ageing rates σ̇y
(d σy
d log(t)
)reproduced from Visser et al. [40,
45]. The arrow indicates the residual lifetime of pipe 2 for exemplary values of limiting tensileyield stress σlim and the yield stress σy,mh.
unacceptable (as defined in Chapter 2 and discussed in Chapter 3) and (ii) the presentvalue of the yield stress σy,mh which can be determined from in-situ micro-hardnessmeasurements (see also Chapter 2). The residual lifetime is defined as the effectivetime it takes to reach the limiting tensile yield stress σlim according to the ageingbehaviour of the PVC pipe from the current yield stress value σy,mh. In this (fictive)example the residual lifetime of pipe 2 is 130 years and is indicated by the arrowin Figure 4.1. The residual lifetime of pipe 8 is 1.7 · 108 years. This is a somewhatextreme example, but clearly the ageing behaviour has a pronounced influence onthe predicted residual lifetimes. The variation of the ageing rate must therefore betaken into account for accurate implementation of the lifetime assessment model athand. Consequently, the ageing rate of each uPVC pipe in the distribution networkthat is investigated with the micro-hardness approach (see Chapter 2) should beknown. If the exact value for a particular uPVC pipe segment is unknown, it shouldbe determined, preferably in situ and non-destructively. The development of anyapproach to obtain these values should be based on the origin of the variation in theageing rates. The research described in this chapter concentrates on possible reasonsfor the observed variation in ageing rates amongst various uPVC pipes.
Physical ageing of glassy polymers like PVC occurs spontaneously at ambientconditions. It is accelerated by, for example, elevated temperatures and/or underthe influence of an applied stress [37]. The variations in ageing rates observed maybe the result of differences in composition, micro structure, extrusion conditions,service conditions, etc. In this chapter the possible causes for differences in ageingrates of a number of selected uPVC pipes are investigated systematically according tothe stages in the lifetime of the uPVC pipes: polymerisation, processing and servicelife. So far, no systematic study is available in literature about variations in ageing

4.2. Possible factors influencing the ageing rate 63
rates in line with these stages in the lifetime of uPVC pipes.
The structure of this chapter is as follows. Firstly, relevant material related propertiesthat potentially influence the ageing rate are discussed in Section 4.2. Note thatin this chapter the word "property" is used in a rather broad sense. It includesmaterial properties, but also the presence of additives, the service conditions, theprocess conditions, etc., i.e. all aspects that may influence in some way the physicalageing rate of uPVC pipes. The selected properties have been determined for a broadrange of uPVC pipes. The experimental conditions are described in Section 4.3. Themeasurement results and the discussion of the correlations between the propertiesand the ageing rate are discussed in Section 4.4, followed by the conclusions.
4.2 Possible factors influencing the ageing rate
Physical ageing arises from the fact that amorphous polymers below Tg are notin a thermodynamic equilibrium state. The "distance" to equilibrium serves asthe driving force of the physical ageing process. As such, amorphous polymersbelow Tg continuously strive towards the equilibrium state. Although the molecularmobility below Tg is low, it is sufficient to allow small conformational changes of thepolymer chains towards their thermodynamically more favoured positions [37, 46].The resultant changes can be monitored using several material properties suchas the yield stress [39, 40, 63, 101], the density [37], the enthalpy [67, 93, 102],creep compliance [46] or even the fluorescence intensity of dyes [103]. Althoughthe kinetics of the ageing process have been studied extensively [37, 38], theexact specific molecular processes that take place during physical ageing are stillunknown [37, 38, 104–108]. It is reasonable to assume that the ageing rate isinfluenced by mobility on a sub-molecular scale, that is to say the ability of thepolymer chains to locally change their conformation. The molecular mobility inturn depends on the chain flexibility and on the interactions between the polymerchains and their physical/chemical environment [105]. Possible causes for variationsin chain flexibility and chain interactions occurring during the lifetime stages ofuPVC pipes related to a number of uPVC properties have been collected in Table 4.1.The background of the potential influence of these properties on the ageing rate isdiscussed below.
4.2.1 Stage 1: Polymerisation
The first stage is the polymerisation of uPVC from vinyl chloride (or chloro-ethene).The conditions during polymerisation control the chain structure and chain lengthdistribution of PVC, which in turn influences the chain flexibility and the formationof crystallites. The characterisation of the polymerisation stage in terms of properties

64 Chapter 4. The variation of physical ageing kinetics of uPVC pipes
Table 4.1 Properties of uPVC pipes which have been tested.
that may affect the ageing rate was focused on (i) the occurrence of double bonds inthe main PVC chain structure, (ii) the tacticity in the main PVC chain structure, (iii)the K-value (a measure for the chain length) and (iv) the crystalline fraction.
Double bonds are defects in the (regular) chain structure which can be formedduring polymerisation by intermolecular H-abstraction, β-scission reactions [109]and during degradation of the polymer by means of dehydrochlorination [58]. Thedouble bond inhibits local changes in conformation of the main chain which in turn

4.2. Possible factors influencing the ageing rate 65
may decrease the ageing rate, as the carbon atoms connected by a double bond arenot able to rotate around that bond. The concentration of double bonds can bedetermined using 1H NMR [110]. Another property characterising the chain structureis tacticity, representing the regularity of chloride atoms along the PVC chains.Tacticity influences the ability of the PVC to form crystallites [111]. The presenceof crystallites constrains the ageing process, especially in the vicinity of crystals, asshown for PVC [93] and polyethylene terephthalate (PET) [112]. It can be attributedto a decrease of the molecular mobility of chains in the amorphous phase that extendinto the crystallites (also referred to as the rigid amorphous phase). Variations intacticity may have an effect on crystallinity and consequently on the ageing rate. Thetacticity of uPVC pipe materials was characterised from the syndiotactic-, isotactic-and heterotactic triad concentrations, which can be determined using 13C nuclearmagnetic resonance (NMR) [113]. The influence of crystallites on the physical ageingprocess relates to the crystalline fraction and the crystal morphology (size, shape)[93, 114]. A common technique to study crystalline morphology in PVC is X-raydiffraction [115]. However, quantifying differences in crystallinity in commercialPVC using this technique is difficult as (i) its crystalline fraction is low (usually 5-10%), (ii) the diffraction peaks are very broad owing to the small crystallite size(about 2-4 nm) and (iii) the presence of a mesomorphous phase in PVC makes itdifficult to separate diffraction peaks of the crystallites from the background causedby the amorphous phase [115–118]. Here, as a start, only the crystalline fractionsof PVC pipe materials were determined experimentally. The differential scanningcalorimetry (DSC) method was chosen to determine the crystalline fraction as it ismore sensitive to small variations in crystalline fraction than X-ray diffraction [118].
The length distribution of the uPVC chains was characterised by viscometry [119]. Itis expressed in terms of the K-value, which is a measure for the average molecularweight of PVC [120]. The K-value is merely used to characterise the uPVC, as itis known that commercial extrusion companies have experimented with various K-values in the early days of uPVC pipe manufacturing. The effect of the value of K onthe ageing rate is expected to be small, as indicated by published measurements onPC [63].
4.2.2 Stage 2: Processing
The second stage is the processing stage in which the polymerised PVC powder ismixed with additives and subsequently extruded into the shape of a pipe. Duringthis temperature-dependent process entanglement† of PVC chains from different PVCparticles occurs such that an interfacial network builds up during pipe production.The degree of interfacial entanglement is called the level of gelation. It has a markedinfluence on the mechanical properties of PVC pipes [16, 71, 122–124]. Both the
†Entanglement means the topological restriction of molecular motion by other chains [121].

66 Chapter 4. The variation of physical ageing kinetics of uPVC pipes
processing temperature and the gelation level will be characterised using DSC [125–128]. The influence of the level of gelation on the mechanical properties is furtherdiscussed in Chapter 5.
Several additives are mixed with the PVC powder during processing for a varietyof purposes, for example (i) to reduce friction during processing of PVC to preventexcessive heating, (ii) to improve thermal stability, (iii) to facilitate the gelation processand (iv) to increase volume/cost ratio) [58]. Apart from the general information aboutthe employed formulations in textbooks, the typical additives that were used in uPVCpipes from 1950 to 1975 were provided by one of the Dutch PVC pipe manufacturersand are summarised in Table 4.2.
Table 4.2 Commonly used additives for uPVC pipes in the Dutch gas and water distribution networksfrom 1950 to 1975.
Lead stabilisers are the oldest and most commonly used thermal stabilisers foruPVC pipe applications. Over time lead in stabilisers has been replaced by othercompounds (e.g. calcium-zinc mixtures) because of environmental concerns withlead. The degradation of PVC already begins at 100 ◦C by the loss of labile chloridegroups as HCl with the creation of a double bond [58]. This reaction causes theadjacent chloride to become labile; the chloride is also eliminated from the polymerchain through the release of HCl. This process repeats itself, eventually creatinga series of conjugated polyene sequences leading to undesired physical propertiesof the PVC. The main function of a lead stabiliser is to substitute labile chlorideswith stable ligands (e.g. lead chloride), mitigating the degradation process of thePVC during processing [129]. The most widely employed lead stabiliser for uPVCprocessing is tribasic lead sulphate [58] and is expected in old uPVC pipes takenfrom the distribution networks. Other commonly used lead stabilisers for uPVC pipeapplications are (dibasic) lead stearate and (dibasic) lead phosphite, see also Table 4.2.
Lubricants are added to PVC materials to reduce the tendency of PVC to stick to themetal of the processing equipment and to reduce friction between the primary PVC
4.2. Possible factors influencing the ageing rate 67
particles improving the flow of the rubbery PVC melt during processing. Which ofthe two features dominates depends on the polarity of the lubricant and the metalsurface of the extruder and the amount of lubricant added [58]. Commonly usedlubricants are glycerol monostearate, polyethylene wax (PE wax) and calcium stearate(Table 4.2).
Fillers are traditionally used to increase volume/cost ratio. The most widely usedfiller for uPVC pipe applications is calcium carbonate (chalk) [58]. Other additivesused in PVC pipes not mentioned in Table 4.2 are processing aids and pigments [58].Processing aids are typically acrylate compounds which adhere to the PVC grains,facilitating the transmission of elongational and shearing forces to the PVC powderand promoting the breakdown and the homogenisation of the PVC melt. Pigmentsare typically added for colour and increase the resistance against weathering [58].The presence of plasticisers (e.g. phthalate esters) is not expected in uPVC pipeapplications as plasticisers are usually added to obtain flexible PVC products.
The determination of the relation between additives present and the physical ageingrate of uPVC pipes requires knowledge of the type and concentration of all additivesadded to the individual uPVC pipes. The list of commonly used additives, asgiven in Table 4.2, and information from textbooks will probably not be sufficientto cover the effects of all possible additives employed over time, nor will it covertheir effects on the physical ageing rate or the effect of mutual interactions of theadditives on the physical ageing rate. Nevertheless, a selection of uPVC pipeswas analysed for the presence of various additives to see if a relationship betweenthe presence/concentration of the additive and the physical ageing rate can bediscovered.
As a first step, DSC and InfraRed spectroscopy (IR) was employed to obtain a generalview of the compounds present in the uPVC pipes investigated. The DSC method hasthe advantage that also the level of gelation and the processing temperature can bedetermined in a single run. For determination of inorganic components such as fillersand pigments, X-ray diffraction is used first. In general these techniques suggest thefamily to which the additives belong, but are not always sufficient for identificationand quantification of the specific compounds shown in Table 4.2 [58]. Therefore, insome cases compounds present in the PVC pipes investigated are separated from thePVC employing dedicated separation procedures and a number of other techniqueswere employed to characterise the specific compounds.
A number of additives in Table 4.2 are stearates consisting of metal ion(s) and fattyacids. Inductively Coupled Plasma-Optical Emission Spectrometry (ICP-OES) is usedto identify and determine the concentration of the metal ions. For fatty acids, the GasChromatography-Mass Spectrometry (GC-MS) method is employed, because it is ableto determine accurately the amount of fatty acids and, combined with MS, substancescan be identified simultaneously [58].
Stabilising salts, such as tribasic lead sulphate, consist of metal ions and molecular
68 Chapter 4. The variation of physical ageing kinetics of uPVC pipes
ions. The Capillary Electrophoresis (CE) method is used to quantify molecularions, as this technique uses an electrical potential difference to separate andidentify charged molecules. The presence of lubricants was investigated employingProgrammable Temperature Vaporising GC-MS (PTV-GC-MS).
A complete list of compounds (stabilisers, lubricants, processing aids, fillers andpigments) identified in this study is summarised in Table 4.1. Besides the compoundanalysis the dimensional properties of the uPVC pipes selected (diameter and wallthickness) were also determined.
4.2.3 Stage 3: Service
The third stage is service, in which the pipes are stored, installed and transport gasand water to the households. Compounds (e.g. PbS) may be formed during serviceas a result of chemical reactions of the pipe material with components in the soil.Also information regarding the year of production and installation are recorded ifknown.
4.2.4 Resulting molecular mobility
The presence of additives can have an effect on the thermal and mechanical propertiesof uPVC. If the additives modify the chain mobility on a molecular and/or asubmolecular scale, relaxation processes in uPVC may be affected. The magnitudeof the α-relaxation peak − related to the glass transition − and the β-relaxation peakcan change in height or temperature depending on the type and amount of additivesupplied. Sometimes the effects of the additive may be opposite depending on theadditive concentration. A well-known example is the plasticiser dioctyl phthalate(DOP). The addition of 10 wt.% DOP increases the enthalpy relaxation rate of PVCspecimens by 30% [102], presumably due to an increase in the mobility of the chainbackbone segments caused by the plasticiser. Simultaneously, the application ofDOP shifts the α-relaxation peak of PVC towards lower temperatures, implying anincrease of segmental mobility (plasticisation effect) [130]. In addition, DOP causesa suppression of the β-relaxation, implying a reduction in molecular mobility (anti-plasticisation effect) [130, 131].
The characterisation of the relaxation processes is useful for two reasons. Firstly, aninvestigation can be made as to whether the variation in the ageing rate is relatedto (anti-) plasticisation effects. Secondly, the characterisation may lead to other waysto determine the ageing rates of uPVC pipes if changes in the ageing rate and therelaxation processes are related. Hence, the β-relaxation peak of PVC pipes wascharacterised employing Dynamic Mechanical Analysis (DMA). The glass transitiontemperature was determined using DSC.

4.3. Experimental 69
4.3 Experimental
4.3.1 Materials
A broad range of uPVC pipes was investigated in this study (pipes 1 to 13 in Table A.1in Appendix A). Excavated pipes (samples 1-7) were taken from different locationsin the Dutch gas and water distribution network. Unused pipes 8-13 were added todetermine whether the compounds found originate from the processing of the pipesor from external factors during service (e.g. influence of the soil). Pipes (samples 10-13) have the same composition, but only differ in level of gelation. The diameter andthe thickness of the pipes are shown in Table 4.4. The year of production of the pipeswas collected from the suppliers or read from the pipe segment itself.
4.3.2 Ageing rate
The ageing rates of the used and unused uPVC pipes were determined on the basisof a number of uniaxial tensile tests performed on artificially aged specimens. Thetensile specimens were produced by cutting 70 mm long semi-cylindrical segmentsfrom the PVC pipes with a band saw. The segments were pressed at a compressivestress of ∼1 MPa into flat plates at 100 ◦C (about 15 ◦C above Tg) for 25 minutes. Thisoperation erased the thermodynamic history of the material. Rectangular bars weremilled from the plates with the length direction parallel to the axial direction of thepipe. A gauge section with a length of 30 mm and a width of 5 mm was milled intothe bars. The tensile test specimens were isothermally annealed at 60 ◦C for varioustimes. Tensile tests were carried out on a Zwick Z5.0 universal testing machineat ambient temperature and a Zwick Z1445 universal testing machine, equippedwith a temperature controlled chamber, at 20 ± 0.2 ◦C at a constant strain rate of10−3 s−1. At these test conditions, only the α-relaxation contributed to the yieldstress [45]. The engineering stress was determined from the average of the initialcross-sectional surface areas measured at three locations along the gauge section. Theyield stress was determined from the (first) local maximum in the force recording.Three experiments were carried out for each annealing treatment. The ageing ratewas determined from the slope of the yield stress curve plotted on a logarithmicannealing time scale using a linear function.
4.3.3 Determining properties related to stage 1: Polymerisation
The polymerisation conditions have a large influence on the uPVC polymer chainsformed, on possible defects occurring in the chains and on the fraction and propertiesof the crystals formed.

70 Chapter 4. The variation of physical ageing kinetics of uPVC pipes
Several techniques were employed for characterisation of this stage. In all casesthe additives were removed from the PVC before the experiments by the followingprocedure. Firstly, a pipe specimen was dissolved into tetrahydrofuran (THF). Theundissolved additives were removed by centrifuging the solution. Then methanolwas added to the clear solution, causing the PVC to precipitate. The PVC wassubsequently filtered off and dried in a vacuum oven. The dried PVC was dissolvedin THF-d8 by annealing the mixture for at least two hours at 45 ◦C. The concentrationof the PVC in the various solutions varied between 40 and 55 mg/l.
The double carbon bond concentrations were determined from the prepared solutionsusing 1H (proton) NMR [110]. The 1H NMR spectra were obtained at roomtemperature by employing a Bruker Ascend spectrometer operating at 400 MHz. Thespectral width was 8224 Hz and 5000 scans per solution were performed.
The syndiotactic-, isotactic- and heterotactic triad concentrations of the PVC pipeswere determined using 13C NMR [113, 132–134]. Inverse gated decoupled 13C NMRspectra were obtained at room temperature from the PVC solutions using the samespectrometer as in the 1H NMR experiments. The resonance peaks of THF do notoverlap with the PVC peaks from which the tacticity was determined [135, 136]. Thespectral width was 24038 Hz and a relaxation time of 2 s was applied. A total of10240 scans per solution were performed to acquire a sufficient signal to noise ratio.
The average molecular weight was determined by viscometry according to standardISO 1628-2:1998, employing the PVC solutions. The molecular weight of PVC isexpressed by the K-value which is related to the relative viscosity through theFikentscher equation [119].
4.3.4 Determining properties related to stage 2: Processing
The manufacturing of uPVC pipes by extrusion requires polymerised uPVC (see stage1) to be mixed with a number of additives, such as stabilisers, lubricants, fillers andpigments. Characterisation of this stage requires the application of a large number ofanalyses techniques.
The crystalline fraction, level of gelation, the processing temperature Tp, themelt enthalpies of additives present and the glass transition temperature were alldetermined using DSC. Three specimens were taken over the full wall thickness ofeach PVC pipe. The specimens were preheated to 50 ◦C under a nitrogen flow usinga Perkin Elmer DSC 7. Subsequently, the heat flow was measured from 50 ◦C toabout 250 ◦C at a rate of 10 ◦C/min. All properties were determined from the firstrun.
The concentrations of fatty acids were determined employing GC-MS. The PVCspecimens were firstly dissolved in THF and the PVC was precipitated usingpentane and filtered. Subsequently, the filtrates were treated with trimethylsulfonium

4.3. Experimental 71
hydroxide (TMSH) for transesterification to methyl esters, so that the fatty acidsbecame volatile. The compounds in the extracts were then separated and analysedusing a HP 6890 and a HP 5972 gas chromatograph spectrometer. The detection limitsof these devices is about 0.1 ppm (1 · 10−5 % w/w).
The concentrations of lead and zinc in the uPVC pipes were determined using aPerkin Elmer Optima DV 7000 ICP optical emission spectrometer. The destruction ofthe PVC specimens was carried out using concentrated nitric acid. After destruction,the acid mixture is diluted with water to a solution of 25 ml. The solution was thenanalysed for lead and zinc (detection limits of about 0.1 ppm).
The concentrations of different anions (SO2−4 , Cl−) were determined using a HP3D
capillary electrophoresis system (detection limits of about 0.1 ppm). The extractionprocedure corresponds to the procedure for analysing fatty acids, except that theprecipitation of the PVC is carried out with water.
The concentration of the filler chalk and the relative concentrations of carbonylgroups and hydroxyl groups, attributed to processing aids and lubricants respec-tively, were determined using IR. Specimens, taken from the pipes, were pressed at200 ◦C for 2-3 s into films of about 40 µm thickness. Infrared spectra of the films weredetermined at 20-23 ◦C using a Perkin Elmer Paragon 1000 mid infrared spectrometerhaving a resolution of 4 cm−1. For each film, 16 scans were performed and thetransmission was averaged for each wave number.
The presence of PE wax was determined using PTV-GC-MS. The PVC specimens wereheated from 40 ◦C to 600 ◦C (16 ◦C/s) under a helium flow using an Atas Optic 2PTV injector. The released components were brought with the helium to a HP 5890II plus and a HP 5972 gas chromatograph spectrometers for separation and analysis(detection limits of about 0.1 ppm).
The presence of minerals was investigated with XRD. A PANalytical diffractometerwas used equipped with a PW1830 standalone generator with Co radiation and an Feincident beam filter. Measurements were conducted from 5◦ 2θ to 100◦ 2θ with a stepsize of 0.05◦ 2θ and a time per step of 1 s. Four measurements were performed oneach PVC specimen to compensate for possible temperature and pressure variations.Phase analysis on the summed diffractograms was carried out with PANalyticalHighScore phase identification software.
4.3.5 Determining properties related to stage 3: Service
The year of production/installation was supplied by the network service providers(if known) or is printed on the pipe itself in the case of newer pipes. Information onPbS formation is obtained by visual inspection of the pipe segments.
72 Chapter 4. The variation of physical ageing kinetics of uPVC pipes
4.3.6 Determining properties related to molecular mobility
The molecular mobility in the used and unused uPVC pipes is characterised throughthe glass temperature as measured by DSC, see above, and the β-relaxation behaviour.The β-relaxation peaks of the uPVC materials were determined using an AntonPaar MCR501 rheometer equipped with an SRF-12 solid torsion bar fixture. Theloss angle was determined during a temperature sweep from 60 ◦C to −120 ◦C ata cooling rate of 12 ◦C/min for a 0.1% strain amplitude at a frequency of 1 Hz.Rectangular specimens were milled from plates that were pressed according to thesame procedure used for manufacturing the uniaxial tensile bars. The rectangularspecimens have a length of 50 mm and a width of 12 mm. The thicknesses of thespecimens were approximately equal to the original wall thicknesses of the pipes.
Detailed information regarding the various measurements performed and the pro-cessing of the measurement data to obtain the values of the relevant propertiesmentioned in Table 4.1 can be found in Appendix B.
4.4 Results and discussion
4.4.1 Ageing rates
The ageing rates of the uPVC pipes studied here are given in Figure 4.2. Theageing rates of the two pipes shown in Figure 4.1 in the introduction of this chapter(pipes 2 and 8) are also included. Most pipes in this study have an ageing rate ofapproximately 2.5 MPa/decade. The ageing rates of pipes 1, 2 and 3 are higherand pipe 1 has the highest ageing rate of 4.2 MPa/decade. Pipe 7 has the lowestageing rate of 1.1 MPa/decade. So, the ageing rates of the pipes in this study differconsiderably, up to a factor of almost four.
Throughout the rest of this section the experimental results of the propertiesinvestigated are checked for a linear correlation with the ageing rate. Besides thiscorrelation check a multi-variable analysis was carried out. No striking additionalobservations were found by the multi-variable analysis. Therefore, the description ofthe multi-variable analysis and the results are presented in Appendix C.
4.4.2 Properties related to stage 1: Polymerisation
Various analysis techniques were applied to characterise certain aspects and proper-ties of the polymerisation stage of the PVC material used for pipe manufacturing.The results of the analyses are given in Table 4.3. Properties related to the PVC chainstructure can be found in columns 1 to 5 and the degree of crystallinity can be foundin column 6.

4.4. Results and discussion 73
Figure 4.2 The ageing rates of the uPVC pipes. The error bars indicate 95% confidence intervals.�Unused uPVC pipes 10-13 have the same formulation and were processed on the sameextruder, but have strong differences in the level of gelation.
Influence of chain structure
The conditions during polymerisation control the chain structure of PVC. The PVCchains of the uPVC pipes investigated do not seem to vary much in their chainstructure and number of defects occurring, but only in their average length. Theconcentrations of chain defects in the form of double carbon bonds are very low(column 1). The variations in tacticity as characterised by the isotactic, heterotacticand syndiotactic triad concentrations are also small (columns 2-4). The largestvariations occur in the average PVC chain length as given by the K-value in column 5:the K-value is mostly between 64 and 68, except for pipes 3 and 4, where the K-valueis 72 or greater. The correlations between these properties and the ageing rates arevery low, as observed from the R2 values indicated by the bars shown at the bottomof Table 4.3. These values indicate how well the specific property correlates with theageing rate using a linear regression function. Apparently, the sporadic occurrenceof local non-rotatable chain parts, i.e. double carbon bonds and/or small variationsin triad concentrations, do not seem to affect the ageing rate, nor does the observedvariation in chain length. The absence of a clear correlation between the K-value andthe ageing rate (R2 = 0.04) is in line with the results found earlier for PC [63].
Influence of crystallinity
The crystalline fractions of the uPVC pipes vary considerably, by between 8% and19%. These values are in the same order of magnitude as found in [118]. Thecrystalline fractions hardly correlate to the ageing rate for the uPVC pipes selected inthis work as the R2 is very small, see Table 4.3. The minor effect of crystalline fractionon the ageing rate is supported by Tsitsilianis et al. who found no clear correlationbetween the crystalline fraction and the enthalpy relaxation rate for PVC [93]. They

74 Chapter 4. The variation of physical ageing kinetics of uPVC pipesTable
4.3The
experimentalresults
oftheproperties
1to
17as
listedin
Table4.1.
Forthe
casesin
which
aproperty
ofapipe
ism
easuredm
ultipletim
es,theaverage
valueis
shown
inthe
table.Pipes
1-7are
excavateduPV
Cpipes
andpipes
8-13are
unuseduPV
Cpipes.
Theageing
ratesare
givenin
thesecond
column
with
the95%
confidenceintervals
between
brackets.Thebars
shown
atthebottom
areR
2values
which
indicatehow
wella
propertycorrelates
with
theageing
ratefor
alinear
regressionfunction.
Theunused
uPVC
pipes10-13
havedifferent
levelsofgelation
butthesam
eform
ulationand
havebeen
processedon
thesam
eextruder.The
’-’-signindicates
thatthem
easurements
havenotbeen
performed.The
zerosin
columns
11,13,15and
16indicate
thatforthese
measurem
entsthe
compound
was
notobserved.
12345678910111213
Pro
pe
rty
Un
it
No
.1
24
[%]
48.7848.6348.4348.6548.6348.8448.92
48.7048.94
-48.46
--
heterotactic triadconcentration
[%]
18.2618.8118.6819.2018.8118.3617.64
18.5118.13
-18.76
--
isotactic triadconcentration
56
7 [%]
52456074796963718019487391level of gelation
10
[%]
32.9632.5632.9032.1532.5632.8033.44
32.7932.94
-32.78
--
syndiotactic triadconcentration
11
[‰]
-2.2--2.4-1.9-2.11.62.51.8-
double carbon bondconcentration
1214
15
[%]
16
9.27.9
18.418.318.613.56.9
18.418.113.711.912.913.8
crystalline fraction
[-]
66677273686866656864666565
K-value (molecular weight)
1713
184182180191188180182
186185162177183196
processingtemperature[ ◦C]
3
ageingrate(95%CI)
[MP
a/decad
e]
4.17 (0.72)
±3
.75
( 0.2
4)
±3.14 (
0.78)±
2.52 (0.35)
±2.28 (
0.25)±
2.17 (0.21)
±1.05 (
0.09)±
1.88 (0.35)
±1.86 (
0.31)±
2.25 (0.52)
±2.50 (
0.36)±
2.22 (0.47)
±2.24 (
0.38)±
R2
[%]
palmitic acidconcentration
tridecanoic acidconcentration
[%w
/w][%
w/w
]
89
stearic acidconcentration
[%w
/w]
0.074-
0.1840.120
- -
0.147
0.083
--- - -
0.042-
0.0900.077
- -
0.069
0.048
--- - -
0-
0.0130.009
- -
0.008
0
--- - -
Po
lym
erisation
Pro
cessing
Pip
e
No
.leadconcentration
[%w
/w]
-- -
0.8470.8230.921
0.357
0.178
--- - -
con
ditio
ns
stabilisers zinc concentration
[%w
/w]
0-
00
- -
00.040
--- - -
sulphate
concentration
(SO) 2-
4
[%w
/w]
0.002-
0.0010.004
- -
0.002
0.002
--- - -
Sta
ge
chain
structu
recry
st.C
lass
[-][-]
presence of PEwax
0-
00
- -
11
--- - -
0.5130.5811.0000.8880.1720.3200.170
0.1780.1850.1780.1430.1090.157
relative carbonyl group
concentration
(C=O)
[-]
aidlu
brican
ts
0.0830.0800.2050.2120000.7701.0000000
relative hydroxyl group
concentration
(OH)
0 20 40 60 80100

4.4. Results and discussion 75Table
4.4Theexperim
entalresultsoftheproperties18to
32aslisted
inTable4.1.Theoverallstructureisthesam
easinTable4.3.Thenum
bers1and
2in
column
19indicate
differenttypesofSiO
2 .Them
eltenthalpies1,2
and3
were
determined
fromm
eltendotherms
which
were
observedin
thetem
peratureranges
99-105◦C
,106-110◦C
and112-120
◦Crespectively.
[ ◦C]
-56.4-55.6-52.7-53.2
---
-45.4-43.8-49.5-49.4-49.0-49.2
β-relaxation temperature
[year]
1978196719611958
---
200620121981198119811981
year of production[w
t.%]
0000200342232
chalk
concentration
(CaCO)3
[-]1111111000000
excavated[1] /unused[0]
[-]
0.04530.04070.04160.0406
---
0.04280.04250.04080.04220.04060.0421
β-relaxation loss angle
[-]0000000001---
titaniumdioxide (TiO) presence
2
[-]0010010000---
leadsulphide (PbS) presence
[-]0100200100---
silicon dioxide (SiO) presence
2
83.483.882.382.186.683.982.8
85.685.185.686.085.286.1
glass transition temperature
[ ◦C]
12345678910111213
Pro
perty
Un
it
No
.21
2728
3132
2622
ageingrate(95%CI)
[MP
a/decad
e]
4.17 (0.72)
±3.75 (
0.24)±
3.14 (0.78)
±2.52 (
0.35)±
2.28 (0.25)
±2.17 (
0.21)±
1.05 (0.09)
±
1.88 (0.35)
±1.86 (
0.31)±
2.25 (0.52)
±2.50 (
0.36)±
2.22 (0.47)
±2.24 (
0.38)±
R2
[%]
2930
Pro
cessing
Pip
e
No
.
Serv
ice
2019
chloride
concentration
(Cl) -
[%w
/w]
0.009-
0.0080.029
- -
0.015
0.011
--- - -
Mo
lecular m
ob
ilityfillers
Sta
ge
pig
.o
ther co
mp
ou
nd
s
1823
2425
[mm
][m
m]
diameterwall thickness
1101608311016011060
11011050505050
2.94.13.03.04.22.92.2
2.73.02.32.32.32.3
geo
metry
Cla
ssco
mp
.co
nd
ition
s
[J/g]
melt enthalpy1
[J/g]
melt enthalpy3
[J/g]
0.470.460.690.4100.670.45
000000
0.290.3500000.38
00.130000
00000.4600000.420.360.460.60
melt enthalpy2
0 20 40 60 80100

76 Chapter 4. The variation of physical ageing kinetics of uPVC pipes
also suggested that knowledge of the crystalline fraction itself is not sufficient toexplain the ageing behaviour of uPVC, and variations in the ageing process mayoriginate as well from variations in the size, shape and perfection of the crystallites.
A higher degree of regularity of the polymer PVC chains promotes the formation ofcrystallites [111]. A clear correlation between the syndiotactic triad concentration andthe crystalline fraction is not observed (R2 = 0.21 determined from Table 4.3). This isin line with the results in [111]. The differences in tacticity determined are too small(around 0.3% on the content of 32%) to affect the crystalline fraction. The variationsin the crystalline fraction of the uPVC pipes may thus predominantly originate fromthe processing stage [137].
Conclusion on the effect of the polymerisation stage
It is concluded from the above results and observations that the properties relatedto the polymerisation stage, i.e. the chain structure, average chain length andcrystallinity, do not contribute significantly to the variation in the ageing rates ofthe pipes.
4.4.3 Properties related to stage 2: Processing
The extrusion process of uPVC pipes requires a number of additives to be mixed withthe uPVC powder to facilitate the manufacturing process and obtain uPVC pipes ofsufficient quality. Although it is known to a certain extent which additives havebeen used (see Table 4.2), a broad range of analysis techniques has been applied tocharacterise the uPVC pipes. The results of the measurements on the various materialproperties can be found in Table 4.3, columns 7 to 17 and Table 4.4, columns 18 to26.
Processing conditions
The extrusion process of PVC pipes is temperature dependent and the processtemperature has a marked influence on the level of gelation. This level varies between45 and 79 for the excavated pipes (see column 7, pipes 1-7). The last four unusedpipes, pipes 10-13, have the same formulation and were processed on the sameextruder with different process temperatures to induce different levels of gelation.The correlation between the level of gelation and the process temperature is verystrong: R2 = 0.97 for pipes 10-13 [97]. In general, the processing conditions have amarked influence on the mechanical properties of PVC pipes [16, 71, 122–124], butthe level of gelation has no significant influence on the ageing rate, as observed fromthe low values of R2 in the bottom of Table 4.3, see columns 7 and 8.
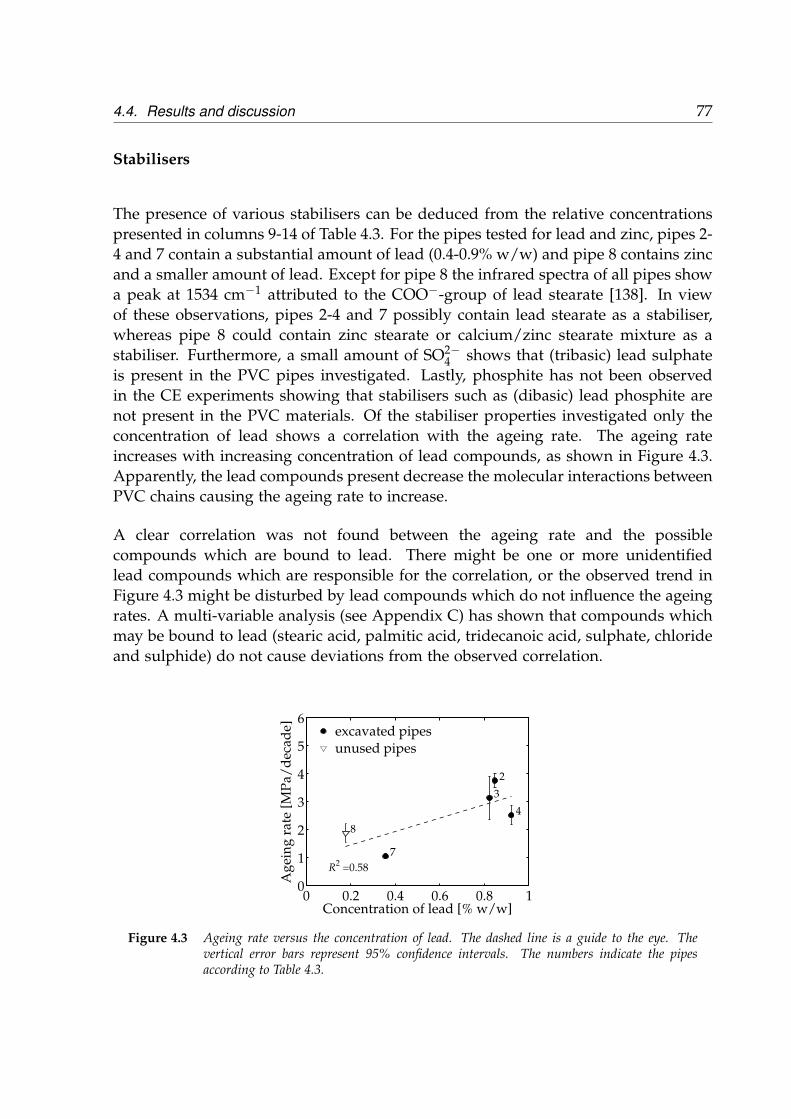
4.4. Results and discussion 77
Stabilisers
The presence of various stabilisers can be deduced from the relative concentrationspresented in columns 9-14 of Table 4.3. For the pipes tested for lead and zinc, pipes 2-4 and 7 contain a substantial amount of lead (0.4-0.9% w/w) and pipe 8 contains zincand a smaller amount of lead. Except for pipe 8 the infrared spectra of all pipes showa peak at 1534 cm−1 attributed to the COO−-group of lead stearate [138]. In viewof these observations, pipes 2-4 and 7 possibly contain lead stearate as a stabiliser,whereas pipe 8 could contain zinc stearate or calcium/zinc stearate mixture as astabiliser. Furthermore, a small amount of SO2−
4 shows that (tribasic) lead sulphateis present in the PVC pipes investigated. Lastly, phosphite has not been observedin the CE experiments showing that stabilisers such as (dibasic) lead phosphite arenot present in the PVC materials. Of the stabiliser properties investigated only theconcentration of lead shows a correlation with the ageing rate. The ageing rateincreases with increasing concentration of lead compounds, as shown in Figure 4.3.Apparently, the lead compounds present decrease the molecular interactions betweenPVC chains causing the ageing rate to increase.
A clear correlation was not found between the ageing rate and the possiblecompounds which are bound to lead. There might be one or more unidentifiedlead compounds which are responsible for the correlation, or the observed trend inFigure 4.3 might be disturbed by lead compounds which do not influence the ageingrates. A multi-variable analysis (see Appendix C) has shown that compounds whichmay be bound to lead (stearic acid, palmitic acid, tridecanoic acid, sulphate, chlorideand sulphide) do not cause deviations from the observed correlation.
Figure 4.3 Ageing rate versus the concentration of lead. The dashed line is a guide to the eye. Thevertical error bars represent 95% confidence intervals. The numbers indicate the pipesaccording to Table 4.3.

78 Chapter 4. The variation of physical ageing kinetics of uPVC pipes
Plasticisers
As expected, none of the uPVC pipes investigated contain phthalate esters utilised forplasticisation of PVC. The absence of phthalate esters indicates that these substancesdo not cause anti-plasticisation effects, which might explain that the variation in themaximum loss angle for the β-relaxation is small (about 12%, as will be presented in4.4.5) in comparison with a 22% decrease upon addition of 5 wt.% DOP in [131].
Lubricants
The relative concentration of hydroxyl (-OH) groups and the possible presence of PEwax is shown in columns 15 and 16 respectively of Table 4.3. The hydroxyl groupsidentified in the IR spectra of the PVC materials might indicate the presence of fattyalcohols such as glycerol monostearate, which is used as a lubricant. Molecularcompounds having hydroxyl groups do not seem to influence the ageing rate(R2 = 0.05), but further research is required to confirm the relation between thepresence of fatty alcohols and the ageing rate.
In the PTV-GC-MS experiments a number of peaks of hydrocarbons were observedfor pipes 7 and 8, see column 16. Some of these substances are also released duringpyrolysis of polyethylene (PE), showing that these pipes may contain PE wax as alubricant [139]. The ageing rate versus the presence of PE wax is shown in Figure 4.4,(R2 = 0.75). The correlation suggests that the presence of PE wax hinders themolecular motion of the PVC chains and decreases the ageing rate. However, toolittle data points are available to make a firm statement.
Figure 4.4 Ageing rate versus the presence of PE wax. The dashed line is a guide to the eye. The verticalerror bars represent 95% confidence intervals. The numbers indicate the pipes according toTable 4.3.

4.4. Results and discussion 79
Processing aids
The relative carbonyl (C=O) group concentration can be found in column 17 ofTable 4.3. The highest relative concentrations are found for excavated pipes 3 and 4,manufactured in the 1960s (see column 29 of Table 4.4). These pipes are alsocharacterised by a relatively high K-value (see column 5 of Table 4.3). Thisobservation suggests that the carbonyl groups can be attributed to a significantamount of processing aid required for extrusion of these pipes [58] and not tophthalate esters for plasticisation [140]. The concentration of carbonyl group doesnot influence the ageing rate (R2 = 0.32) substantially as shown in Table 4.3. Thepresence of carbonyl groups, determined by employing IR, only suggests the familyof additives: in this case processing aids. Here processing aids do not seem tosignificantly contribute to the variation in the ageing rate.
Fillers and pigments
Fillers are traditionally added to uPVC to increase the volume/cost ratio. Twotypes of fillers were observed − chalk and SiO2; the concentrations of both fillersare shown in columns 18 and 19 respectively of Table 4.4. The ageing rate versusthe chalk concentration is given in Figure 4.5. The dashed line drawn through thedata points of pipes 8-13 suggests a decreasing trend of the ageing rate with thechalk concentration. The observed decrease suggests that particles of CaCO3 mayhinder the molecular motion of chains that surround these filler particles. Indeed, alarge decrease up to a factor 14 in the ageing rate has been observed for nano-sizefillers [103]. However, in the current uPVC samples the typical widths of the XRDpeaks corresponding to chalk reflections indicate that the chalk crystals dimensionsare typically a micrometre or larger [141]. It is unlikely that such large particles mayhave a significant influence on the overall ageing rate, given the typical dimensionsof the segmental chain parts involved with physical ageing. Another reason may bethat CaCO3 particles do not strongly adhere to the PVC chains [142]. Hindrance ofmolecular motion responsible for physical ageing by CaCO3 particles may thereforebe rather limited.
Silicon dioxide (SiO2) is found in used and unused pipes as a filler or reinforcingagent in the PVC materials [58]. Only in unused pipe 10 was titanium dioxide (TiO2)observed, see column 20 of Table 4.4. It has no clear correlation with the ageing rate.The TiO2 is a white substance and is used as a pigment for colour stability of PVCpipes which have to cope with outdoor conditions (e.g. during outdoor storage). TheTiO2 inhibits degradation of the PVC by absorbing ultra-violet radiation [58].

80 Chapter 4. The variation of physical ageing kinetics of uPVC pipes
Figure 4.5 Ageing rate versus the concentration of chalk (CaCO3). The dashed line is a guide to the eye.
Other compounds
In column 23 the relative concentrations of Cl− are given. The presence ofchloride is indicative of degradation of PVC during processing. For this reasonstabilisers are added that substitute labile chloride with stable ligands mitigatingdehydrochlorination. An increase in the concentration of chloride with increasingprocessing temperatures is observed. Possibly the PVC degrades more at highertemperatures by dehydrochlorination, causing a higher concentration of chloride inthe specimens. However, no clear correlation between the chloride concentration andthe ageing rate has been observed. Finally, in columns 24-26 of Table 4.4 the meltenthalpies observed within specific temperature ranges of the DSC measurementsof the uPVC samples are given. It is unknown to what compound/material themelt enthalpies relate. Nevertheless, no clear relationships between the height of thevarious melt enthalpies and the physical ageing rate were observed. Further researchis required to elucidate the background of these enthalpy peaks.
Geometry
The dimensions of the used and unused uPVC pipes are provided in columns 21and 22 of Table 4.4. The diameter varies between 50 mm and 160 mm and thewall thickness varies between 2.2 mm and 4.5 mm. No correlation between the pipedimensions and the physical ageing rate exists as observed from the R2 data.
Conclusion on the effect of the processing stage
Despite the many analyses performed on the presence of a large number of additivesa solid explanation to the origin of the variation in ageing rates cannot be given. Itseems that the composition of the uPVC pipes is not completely defined by the list of

4.4. Results and discussion 81
typical ingredients, as shown in Table 4.2. In many analysis results of IR, NMR, DSCand XRD some of the peaks observed cannot be explained. The data presented inTables 4.3 and 4.4 indicates that the physical ageing rate is correlated to some extentwith the lead concentration and the presence of PE wax.
4.4.4 Properties related to stage 3: Service
Service-related properties, i.e. the year of production, the state of the material(excavated versus unused) and the presence of lead sulphide at the outside of thepipe, are shown in Table 4.4, columns 27 to 29.
Year of production
An interesting observation is the behaviour of the ageing rate as a function of the yearof production, as shown in Figure 4.6. The ageing rate of the uPVC pipes investigatedincreases as a function of the year of production up to approximately 1978-1980. Thenthe ageing rate suddenly drops and remains nearly constant, regardless of the yearof production. It is difficult to explain in this way why the ageing rate increases asa function of the year of production up to the end of the 1970s. It is known thatthe process conditions and the types and concentrations of various additives usedhave changed somewhat over the years, but this type of smooth behaviour seemsrather coincidental. The transition around the end of the 1970s might be related tothe end of the production of uPVC pipes for natural gas transport applications. All(unused) uPVC pipes produced from 1981 onwards (pipes 8-13) are meant for watertransport networks. Possibly different formulations have been applied since, leadingto different responses as a function of the ageing time.
Figure 4.6 Ageing rate versus year of production.

82 Chapter 4. The variation of physical ageing kinetics of uPVC pipes
Lead sulphide
The presence of hydrogen sulphide (H2S) was observed only for excavated pipes 3and 8. These pipes also have a very thin brown outer layer. Ssulphate-reducingbacteria can be present in some types of soil. These bacteria convert sulphate in thesoil into H2S. Subsequently, the H2S reacts with the lead stabiliser in the outer layerof the PVC pipe. In this process lead sulphide (PbS) is created, which turns the outerlayer of the pipe brown. The absence of a clear correlation between the ageing rateand compound PbS shows that the physical/chemical changes of the PVC materialsas a result of interactions between the lead stabiliser(s) with the surrounding soil donot seem to affect the ageing rate.
Conclusion on the effect of the service stage
It is concluded that the properties related to service do not clarify the variationin ageing rate of the pipes considered, although the year of production doessuggest differences in the behaviour between uPVC pipes produced for gas transportapplications that were typically manufactured before 1980 and those for watertransport applications manufactured after 1980.
4.4.5 Molecular mobility
The β-relaxation temperature
The β-relaxation (or secondary relaxation) peaks for several unused and excavateduPVC pipes, characterised with DMA, are shown in Figure 4.7 left. The storagemodulus data in the same temperature interval are shown in Figure 4.7 right. Thepeaks in the loss angle are attributed to molecular motion of chain segments. ForPVC, it is not known exactly which chain segments cause the β-relaxation [143, 144] asthe PVC chains have no flexible side groups. The relatively large chloride atoms causesubstantial steric hindrance. Hence, it is thought that the process arises primarilyfrom local main-chain motion [143].
The peak in the loss angle shows a small variation in height in Figure 4.7 left as well asa variation in peak temperature. It is known that small amounts of plasticisers (up to10% w/w) can suppress the β-relaxation, leading to a smaller peak as well as lowerpeak temperatures for increasing plasticiser content [130, 131, 145]. However, thepeak temperatures measured here do not decrease consistently in line with a decreasein the peak height. Moreover, no significant amount of plasticiser was found in theuPVC pipe material investigated here. Therefore, the variation in peak temperatureis not considered to be related to anti-plasticisation for these pipes.

4.4. Results and discussion 83
Figure 4.7 The loss angle (left) and storage modulus (right) versus temperature for PVC pipes havingdifferent ageing rates. The numbers indicate the pipes according to Table 4.3.
The locations of the maxima of the peaks, Tβ, are shown in Figure 4.8 along withthe corresponding data of the ageing rate of the uPVC pipes investigated. Aninteresting relation is observed, where the increase of the β-relaxation temperature isaccompanied by a decrease in the ageing rate.
Figure 4.8 The ageing rate versus β-relaxation temperature for excavated and unused PVC pipes. Thevertical error bars represent 95% confidence intervals. The horizontal error bars representthe uncertainty in Tβ caused by measurement noise and the shape of the loss angle versustemperature curves. The dashed line represents the best ordinary least squares fit of a linearfunction.
Changes in the β-relaxation temperatures of the uPVC pipes may be associated withchanges in the energy barriers that must be overcome by chain segments of theuPVC molecules to change their conformation locally. The activation energy of theβ-relaxation for uPVC is determined from Tβ and the applied strain rate during the
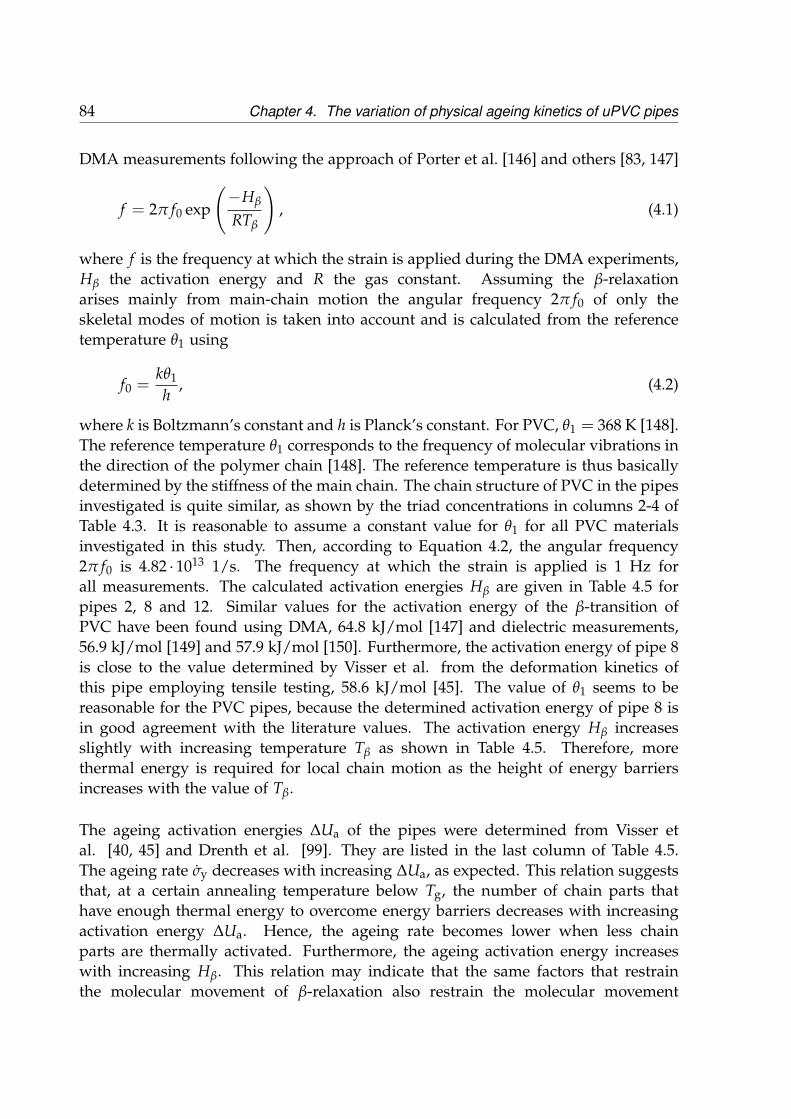
84 Chapter 4. The variation of physical ageing kinetics of uPVC pipes
DMA measurements following the approach of Porter et al. [146] and others [83, 147]
f = 2π f0 exp
(−Hβ
RTβ
), (4.1)
where f is the frequency at which the strain is applied during the DMA experiments,Hβ the activation energy and R the gas constant. Assuming the β-relaxationarises mainly from main-chain motion the angular frequency 2π f0 of only theskeletal modes of motion is taken into account and is calculated from the referencetemperature θ1 using
f0 =kθ1
h, (4.2)
where k is Boltzmann’s constant and h is Planck’s constant. For PVC, θ1 = 368 K [148].The reference temperature θ1 corresponds to the frequency of molecular vibrations inthe direction of the polymer chain [148]. The reference temperature is thus basicallydetermined by the stiffness of the main chain. The chain structure of PVC in the pipesinvestigated is quite similar, as shown by the triad concentrations in columns 2-4 ofTable 4.3. It is reasonable to assume a constant value for θ1 for all PVC materialsinvestigated in this study. Then, according to Equation 4.2, the angular frequency2π f0 is 4.82 · 1013 1/s. The frequency at which the strain is applied is 1 Hz forall measurements. The calculated activation energies Hβ are given in Table 4.5 forpipes 2, 8 and 12. Similar values for the activation energy of the β-transition ofPVC have been found using DMA, 64.8 kJ/mol [147] and dielectric measurements,56.9 kJ/mol [149] and 57.9 kJ/mol [150]. Furthermore, the activation energy of pipe 8is close to the value determined by Visser et al. from the deformation kinetics ofthis pipe employing tensile testing, 58.6 kJ/mol [45]. The value of θ1 seems to bereasonable for the PVC pipes, because the determined activation energy of pipe 8 isin good agreement with the literature values. The activation energy Hβ increasesslightly with increasing temperature Tβ as shown in Table 4.5. Therefore, morethermal energy is required for local chain motion as the height of energy barriersincreases with the value of Tβ.
The ageing activation energies ∆Ua of the pipes were determined from Visser etal. [40, 45] and Drenth et al. [99]. They are listed in the last column of Table 4.5.The ageing rate σ̇y decreases with increasing ∆Ua, as expected. This relation suggeststhat, at a certain annealing temperature below Tg, the number of chain parts thathave enough thermal energy to overcome energy barriers decreases with increasingactivation energy ∆Ua. Hence, the ageing rate becomes lower when less chainparts are thermally activated. Furthermore, the ageing activation energy increaseswith increasing Hβ. This relation may indicate that the same factors that restrainthe molecular movement of β-relaxation also restrain the molecular movement

4.4. Results and discussion 85
Table 4.5 The β-relaxation temperature Tβ, the activation energy of the β-relaxation Hβ, the ageing rateσ̇y and the ageing activation energy ∆Ua for unused and excavated uPVC pipes.
Pipe No. Tβ Hβ σ̇y ∆Ua[◦C] [kJ/mol] [MPa/decade] [kJ/mol]
2 -55.6 57.0 3.75 115∗
12 -48.2 58.9 2.22 194�
8 -45.4 59.7 1.88 238�
∗ from Visser et al. [40].� from Drenth et al. [99].� from Visser et al. [45].
responsible for the ageing process, and may explain the strong correlation observedin Figure 4.8. It must be pointed out, however, that ∆Ua is a factor two to fourhigher than Hβ. This significant difference suggests that ageing is caused by similarchain parts, but which have a more extended type of motion and/or include a largernumber of chain parts than for the β-relaxation to occur.
The β-relaxation temperature has also been determined using the loss modulusinstead of the loss angle. The values of Hβ obtained from the loss modulus correlatewith ∆Ua in a similar way as observed from the loss angle and led to the sameconclusions.
The relationship between creep and relaxation
The correlation between the ageing rate and Tβ may also be explained from the resultsof Struik [46]. He performed a large series of creep and relaxation experiments onvarious amorphous materials including uPVC. It was shown that physical ageing ledto a significant reduction in the creep and relaxation rates. The effects of physicalageing for uPVC were observed only within the temperature range from the β-transition temperature to the glass transition temperature with a certain maximumwithin this range. At the limits of the range the ageing rate declined. At andabove the glass transition temperature the amorphous material is in thermodynamicequilibrium and physical ageing does not occur. On the low temperature side of thetemperature range the movement of chain segments becomes increasingly difficultat lower temperatures. Hence, the material ages at a slower pace. Below the β-transition temperature ageing ceases completely even though the material is far fromthermodynamic equilibrium. Now, consider two uPVC pipes, where for the secondone the movements of chain segments are restricted more in some way. For thispipe the corresponding β-relaxation temperature occurs at a higher temperature. Ifit is also assumed that the maximum shifts accordingly, the ageing rates decreasesfor all temperatures within the range from the β-transition temperature up to the
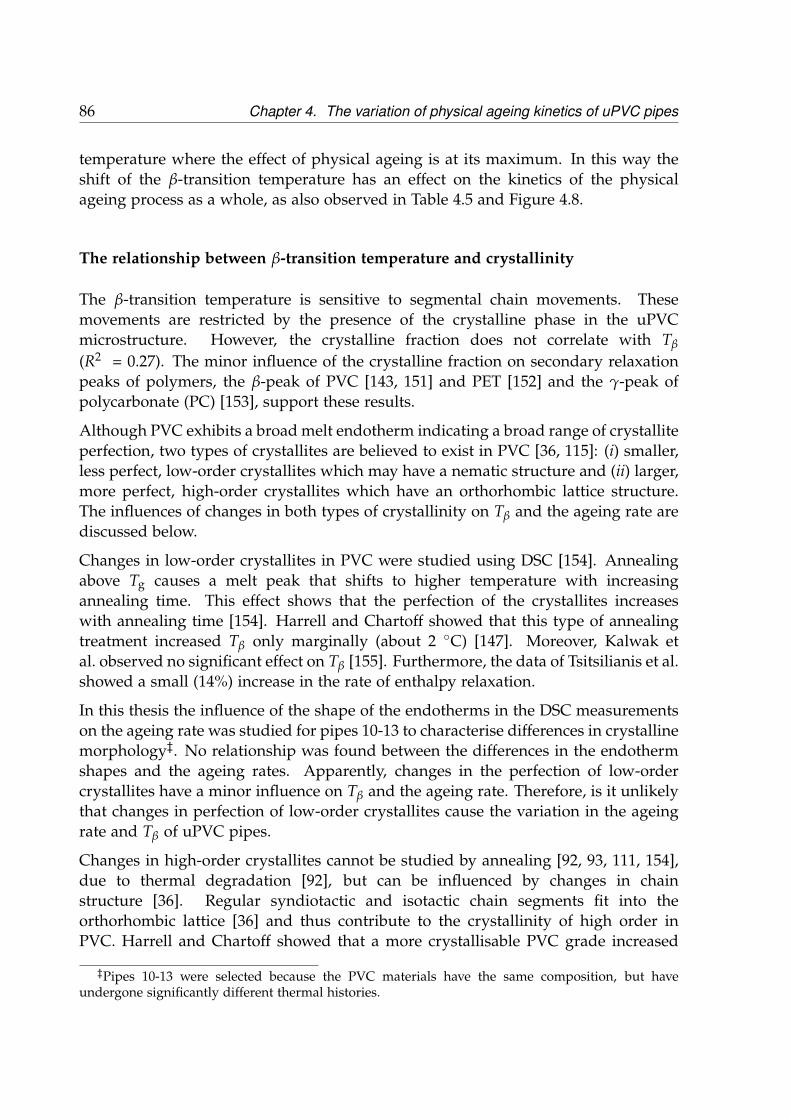
86 Chapter 4. The variation of physical ageing kinetics of uPVC pipes
temperature where the effect of physical ageing is at its maximum. In this way theshift of the β-transition temperature has an effect on the kinetics of the physicalageing process as a whole, as also observed in Table 4.5 and Figure 4.8.
The relationship between β-transition temperature and crystallinity
The β-transition temperature is sensitive to segmental chain movements. Thesemovements are restricted by the presence of the crystalline phase in the uPVCmicrostructure. However, the crystalline fraction does not correlate with Tβ
(R2 = 0.27). The minor influence of the crystalline fraction on secondary relaxationpeaks of polymers, the β-peak of PVC [143, 151] and PET [152] and the γ-peak ofpolycarbonate (PC) [153], support these results.
Although PVC exhibits a broad melt endotherm indicating a broad range of crystalliteperfection, two types of crystallites are believed to exist in PVC [36, 115]: (i) smaller,less perfect, low-order crystallites which may have a nematic structure and (ii) larger,more perfect, high-order crystallites which have an orthorhombic lattice structure.The influences of changes in both types of crystallinity on Tβ and the ageing rate arediscussed below.
Changes in low-order crystallites in PVC were studied using DSC [154]. Annealingabove Tg causes a melt peak that shifts to higher temperature with increasingannealing time. This effect shows that the perfection of the crystallites increaseswith annealing time [154]. Harrell and Chartoff showed that this type of annealingtreatment increased Tβ only marginally (about 2 ◦C) [147]. Moreover, Kalwak etal. observed no significant effect on Tβ [155]. Furthermore, the data of Tsitsilianis et al.showed a small (14%) increase in the rate of enthalpy relaxation.
In this thesis the influence of the shape of the endotherms in the DSC measurementson the ageing rate was studied for pipes 10-13 to characterise differences in crystallinemorphology‡. No relationship was found between the differences in the endothermshapes and the ageing rates. Apparently, changes in the perfection of low-ordercrystallites have a minor influence on Tβ and the ageing rate. Therefore, is it unlikelythat changes in perfection of low-order crystallites cause the variation in the ageingrate and Tβ of uPVC pipes.
Changes in high-order crystallites cannot be studied by annealing [92, 93, 111, 154],due to thermal degradation [92], but can be influenced by changes in chainstructure [36]. Regular syndiotactic and isotactic chain segments fit into theorthorhombic lattice [36] and thus contribute to the crystallinity of high order inPVC. Harrell and Chartoff showed that a more crystallisable PVC grade increased
‡Pipes 10-13 were selected because the PVC materials have the same composition, but haveundergone significantly different thermal histories.

4.5. Conclusions 87
Tβ by about 5 ◦C [147]. Although these observations show that variation in high-order crystallinity influences Tβ, differences in Tβ found by Harrell and Chartoffwere smaller than those found in this study (about 12.6 ◦C). Though, high-ordercrystallinity may have an effect on the ageing rate, it is not expected to be dominant.
Alternative approaches for determination of the ageing rates
The relationship between Tβ and the ageing rate is observed for a broad range ofpipes. An alternative to determining the ageing rate from tensile tests, as explainedin Section 4.3.2, would be to measure Tβ from DMA measurements and derive theageing rate from Figure 4.8. In such case a single test would be required instead ofseveral tests as is necessary in tensile testing; the new method would be quicker andrequire less material. Further research should be carried out to ascertain the accuracyof the alternative approach. Another alternative to determine the ageing rate wouldbe to perform tensile tests at strain rates at which the β-relaxation contributes tothe yield stress [156]. In this way Hβ is computed and this value can be relatedto Tβ through Equation 4.1 and the ageing rate follows from Figure 4.8. However,the resulting physical ageing rates are very sensitive to small variations in Hβ. Therelative differences between the Hβ values for samples 2, 8 and 12 shown in Table 4.5are small, whereas the ageing rates and ageing activation energies span a much widerrange.
Conclusion on the measurements of molecular mobility
The ageing rates observed in the excavated and unused uPVC pipes correlate wellwith the temperature at which the β-transition has a maximum, as determined fromDMA measurements. A higher β-relaxation temperature corresponds with a lowerageing rate. Apparently, the factors that restrain the molecular movement of the β-relaxation also restrict the molecular movement responsible for the ageing process.However, the correlation observed does not explain the origin of the differences inageing rates observed among the uPVC pipes investigated.
4.5 Conclusions
The ageing rates of a broad range of uPVC pipes, both excavated and unused, havebeen determined using uniaxial tensile experiments. A large variation in ageingrates has been observed among the pipes studied. Possible causes for differences inageing rates were investigated systematically according to the stages in the lifetimeof the uPVC pipes: polymerisation, processing and service life. Each stage wascharacterised by a number of material and/or process related properties.
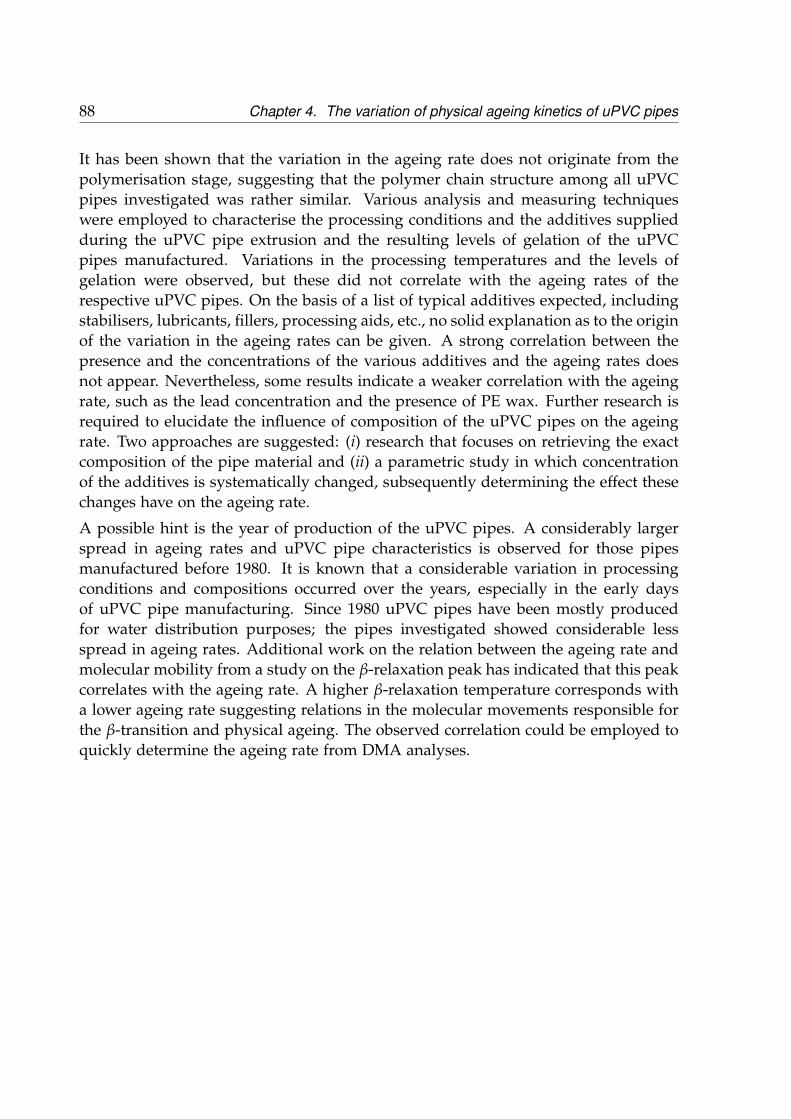
88 Chapter 4. The variation of physical ageing kinetics of uPVC pipes
It has been shown that the variation in the ageing rate does not originate from thepolymerisation stage, suggesting that the polymer chain structure among all uPVCpipes investigated was rather similar. Various analysis and measuring techniqueswere employed to characterise the processing conditions and the additives suppliedduring the uPVC pipe extrusion and the resulting levels of gelation of the uPVCpipes manufactured. Variations in the processing temperatures and the levels ofgelation were observed, but these did not correlate with the ageing rates of therespective uPVC pipes. On the basis of a list of typical additives expected, includingstabilisers, lubricants, fillers, processing aids, etc., no solid explanation as to the originof the variation in the ageing rates can be given. A strong correlation between thepresence and the concentrations of the various additives and the ageing rates doesnot appear. Nevertheless, some results indicate a weaker correlation with the ageingrate, such as the lead concentration and the presence of PE wax. Further research isrequired to elucidate the influence of composition of the uPVC pipes on the ageingrate. Two approaches are suggested: (i) research that focuses on retrieving the exactcomposition of the pipe material and (ii) a parametric study in which concentrationof the additives is systematically changed, subsequently determining the effect thesechanges have on the ageing rate.
A possible hint is the year of production of the uPVC pipes. A considerably largerspread in ageing rates and uPVC pipe characteristics is observed for those pipesmanufactured before 1980. It is known that a considerable variation in processingconditions and compositions occurred over the years, especially in the early daysof uPVC pipe manufacturing. Since 1980 uPVC pipes have been mostly producedfor water distribution purposes; the pipes investigated showed considerable lessspread in ageing rates. Additional work on the relation between the ageing rate andmolecular mobility from a study on the β-relaxation peak has indicated that this peakcorrelates with the ageing rate. A higher β-relaxation temperature corresponds witha lower ageing rate suggesting relations in the molecular movements responsible forthe β-transition and physical ageing. The observed correlation could be employed toquickly determine the ageing rate from DMA analyses.

Chapter 5
Non-destructive determination of thelevel of gelation
5.1 Introduction
The occurrence of brittle failure is the main limit for the service life of unplasticisedpoly(vinyl chloride) (uPVC) pipes in the Dutch gas and water distribution networks.Unwanted brittle failure events can be prevented by locating and subsequentlyreplacing brittle uPVC pipes. A non-destructive inspection method for locatingsuspected uPVC pipes can thus be a useful tool for the development of replacementstrategies. In Chapter 3 it was shown that physical ageing can result in embrittlementof uPVC pipes and a method to determine the residual lifetime was presented. Thismethod is still incomplete as the level of gelation is not taken into account, whereasit is considered to be an important factor influencing the failure behaviour of uPVCpipes [10]. Unfortunately, there are no devices available which are able to determinethe level of gelation in a non-destructive way. Therefore, the focus of this chapterwill be on screening of available techniques for their applicability for (in-situ) non-destructive evaluation of uPVC on the level of gelation.
Before the screening process can commence, it is important to have some insightinto the background of the gelation process, which is typical for PVC. Afterpolymerisation, PVC has the form of a powder, as do most of the polymers. Thedistinct difference of PVC is that it is not compounded into granules first butdirectly used as a powder in injection moulding machines and extruders. Thereason for this is that PVC degrades at a lower temperature (∼200 ◦C) than thatat which the crystallites in the material are fully melted (265 ◦C). Therefore, anintermediate compounding step would induce extra thermal degradation and iscommonly not used for PVC. Instead, PVC is processed directly from the powderand below its crystalline melting temperature (a common processing temperaturerange is 180-200 ◦C) using the combined action of temperature and high shear
89

90 Chapter 5. Non-destructive determination of the level of gelation
rates. Lubricants and thermal stabilisers are mixed with the PVC powder to reducethermal degradation during processing. Another preventive measure to reducethermal degradation is that PVC pipes are commonly produced using counter-rotating twin-screw extruders, which ensure a low distribution of residence time ofPVC material inside the extruder. The degree to which PVC powder is processed intoa homogeneous material in a product is called gelation or fusion and is illustratedin Figure 5.1. Unprocessed PVC powder consists of grains having typically a size of200 µm. During processing, the grains are progressively broken down into primaryparticles under the influence of temperature, pressure and shear. The primaryparticles have a typical size of 1 µm and are shown schematically in Figure 5.1 (a). Thepolymer chains located inside the primary particles are tightly bound by crystallites(called primary crystallites). As the temperature increases during processing, someof the primary crystallites melt. This leads to an increase of the molecular mobilitythat allows the polymer chains to diffuse across the boundaries of neighbouringparticles, as shown in Figure 5.1 (b). After cooling, PVC recrystallises, resulting in amolecular network between the particles tied by secondary crystallites, as shown inFigure 5.1 (c). As a result, a homogeneous material is formed in which the additivesare distributed homogeneously [157]. However, residual grains and primary particlescan still be identified when fusion is incomplete [157–159]. The degree to which thepowder grains have been broken down and to what extent the molecular networkbetween the primary particles has formed is defined as the level of gelation. The levelof gelation is determined only by the processing conditions, and does not changewith the age of the PVC pipe. Therefore, the level of gelation influences only theinitial quality of the pipe [10]. Since the first research on gelation of PVC in theearly eighties, manufacturers have been keen to monitor this property for newlyproduced batches of pipes. The level of gelation of older pipes does vary strongly,which underlines the necessity of taking the level of gelation into account for thedetermination of the residual lifetime of pipes that are currently in service.
Experimental data of the influence of the level of gelation on the impact resistanceis shown in Figure 5.2. For a low level of gelation the many poorly fused primaryparticles act as stress concentrators, which cause voiding during impact loading [72].The poor adhesion between the primary particles causes these voids to interconnectat lower loading and energy levels and will thus lead to poor impact properties [18]and a higher ductile-to-brittle transition temperature. For an increased level ofgelation, the number of flaws decreases, and stronger adhesion between the primaryparticles causes increased plastic deformation. Increased plastic deformation will inturn lead to improved impact properties and thus a lower transition temperature.Several authors found an optimum in the impact properties with increasing levelof gelation [16, 71, 96]. The origin of the decrease in impact properties after theoptimum is still under debate. Terselius et al. suggest that for high levels of gelationthe low number of poorly fused primary particles are unable to block propagatingcracks leading to a decrease in impact properties [97]. Summers suggests a lubricant

5.1. Introduction 91
(a) (b) (c)
~1 µmprimary particle
primary crystallitesecondary crystallite at original particle interfacesecondary crystallite inside boundary
additives
Figure 5.1 Physical working model of the gelation process according to Summers [160].
inversion mechanism where the lubricants become the discontinuous phase and actas stress concentrators in the matrix causing a decrease in impact properties [98].
The level of gelation should thus have an optimal value to achieve maximum impactresistance and prevent brittle failure as much as possible. As mentioned before, theextrusion process was not always fully under control in the early years of PVC pipeproduction. Consequently, uPVC pipes with a wide range of gelation levels wereinstalled in the past [10]. The pipes that have an insufficient or a too high level ofgelation may undergo brittle failure when impacted and should therefore be replaced(or should never have been installed).
Figure 5.2 The level of gelation versus the brittle-to-ductile transition temperature for puncture (impact)tests reproduced from [19].
Before the main task of screening for a proper technique for non-destructiveevaluation of the level of gelation can be carried out, the boundary conditions shouldbe clear. These boundary conditions can originate from the processing conditions as
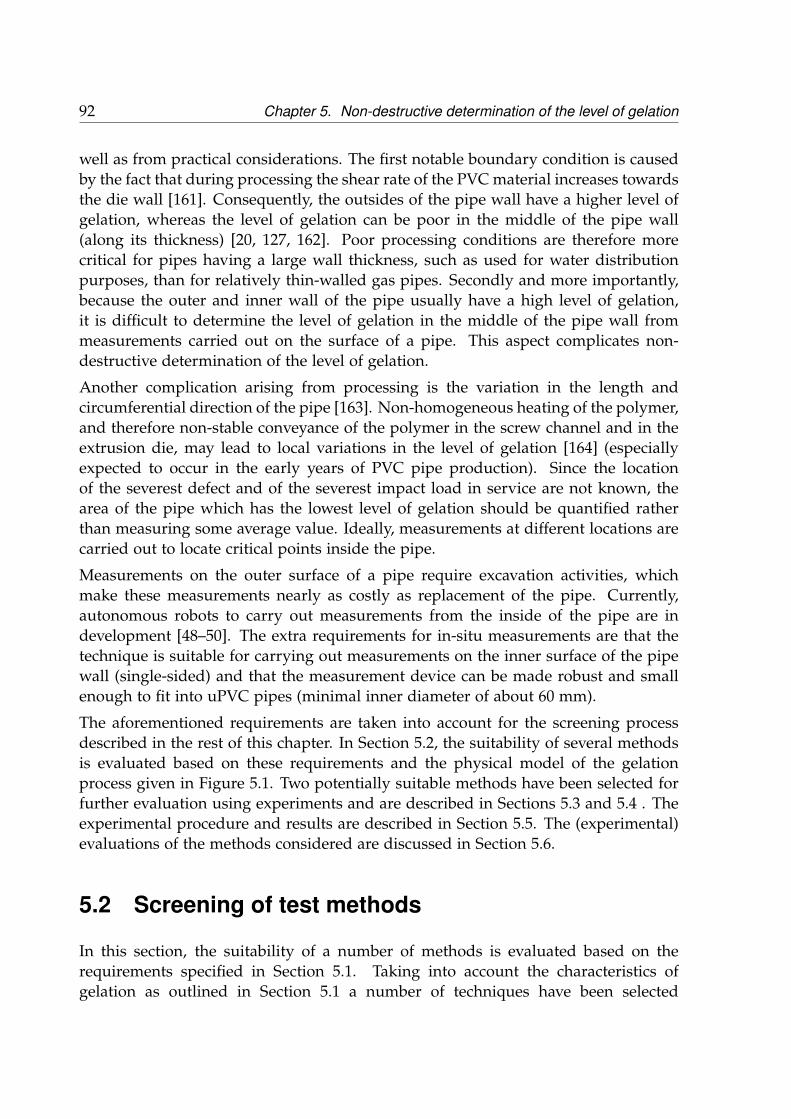
92 Chapter 5. Non-destructive determination of the level of gelation
well as from practical considerations. The first notable boundary condition is causedby the fact that during processing the shear rate of the PVC material increases towardsthe die wall [161]. Consequently, the outsides of the pipe wall have a higher level ofgelation, whereas the level of gelation can be poor in the middle of the pipe wall(along its thickness) [20, 127, 162]. Poor processing conditions are therefore morecritical for pipes having a large wall thickness, such as used for water distributionpurposes, than for relatively thin-walled gas pipes. Secondly and more importantly,because the outer and inner wall of the pipe usually have a high level of gelation,it is difficult to determine the level of gelation in the middle of the pipe wall frommeasurements carried out on the surface of a pipe. This aspect complicates non-destructive determination of the level of gelation.
Another complication arising from processing is the variation in the length andcircumferential direction of the pipe [163]. Non-homogeneous heating of the polymer,and therefore non-stable conveyance of the polymer in the screw channel and in theextrusion die, may lead to local variations in the level of gelation [164] (especiallyexpected to occur in the early years of PVC pipe production). Since the locationof the severest defect and of the severest impact load in service are not known, thearea of the pipe which has the lowest level of gelation should be quantified ratherthan measuring some average value. Ideally, measurements at different locations arecarried out to locate critical points inside the pipe.
Measurements on the outer surface of a pipe require excavation activities, whichmake these measurements nearly as costly as replacement of the pipe. Currently,autonomous robots to carry out measurements from the inside of the pipe are indevelopment [48–50]. The extra requirements for in-situ measurements are that thetechnique is suitable for carrying out measurements on the inner surface of the pipewall (single-sided) and that the measurement device can be made robust and smallenough to fit into uPVC pipes (minimal inner diameter of about 60 mm).
The aforementioned requirements are taken into account for the screening processdescribed in the rest of this chapter. In Section 5.2, the suitability of several methodsis evaluated based on these requirements and the physical model of the gelationprocess given in Figure 5.1. Two potentially suitable methods have been selected forfurther evaluation using experiments and are described in Sections 5.3 and 5.4 . Theexperimental procedure and results are described in Section 5.5. The (experimental)evaluations of the methods considered are discussed in Section 5.6.
5.2 Screening of test methods
In this section, the suitability of a number of methods is evaluated based on therequirements specified in Section 5.1. Taking into account the characteristics ofgelation as outlined in Section 5.1 a number of techniques have been selected

5.2. Screening of test methods 93
for screening; they are listed and categorised according to their physical workingprinciple in Table 5.1. The symbols used in Table 5.1 are defined in Table 5.2. Themethods listed in Table 5.1 have been evaluated using both literature and preliminaryexperiments.
Thermal methods
Differential Scanning Calorimetry (DSC) is a widely used method to determine thelevel of gelation. DSC is capable of determining the amount of energy required tomelt crystalline regions and can detect how many primary crystallites have meltedduring extrusion and how many crystallites recrystallised upon cooling. Only smallspecimens are required for DSC, which makes it possible to determine the level ofgelation across the wall thickness of the pipe. As differences in the gelation leveloccur mainly in the middle of the pipe, a rather thick layer of material (about a halfof the wall thickness) would, in practice, have to be removed from the inner wall todistinguish between poorly and properly processed pipes. This method is thereforedestructive and not suited for practical implementation.
Thermography is a non-destructive, single-sided technique in which the surfacetemperature of an object can be measured using compact thermal infrared cameras.Although primary particles can still be identified in incompletely fused uPVCmaterials [158, 159], the internal grain porosity has been eliminated at an early stagein the gelation process [168, 177]. Because residual particle boundaries have intimatecontact, local changes in thermal conduction in the material and subsequently insurface temperature are not expected and therefore this technique is not consideredto be a viable candidate.
The thermal methods shown in Table 5.1 are thus not suited for determining the levelof gelation and will be not evaluated experimentally.
Electric and magnetic methods
As PVC is an electrical insulator, non-destructive methods based on electric currentsand magnetic fields, such as eddy-current testing cannot be applied to PVC pipes.
Electric fields of alternating direction are, however, able to induce several mechanismsof polarisation inside PVC materials which can be studied using dielectric spec-troscopy [168]. At low frequencies (0.1 Hz-10 Hz) changes in dielectric properties ofPVC were observed only at the initial stages of the gelation process, possibly causedby interfacial polarisation as a result of air inclusions [168]. As internal porosity isabsent even for the lowest levels of gelation found in uPVC pipes [159], interfacialpolarisation effects are not expected. Hence, low frequency dielectric spectroscopy isnot capable of detecting differences in the gelation level.
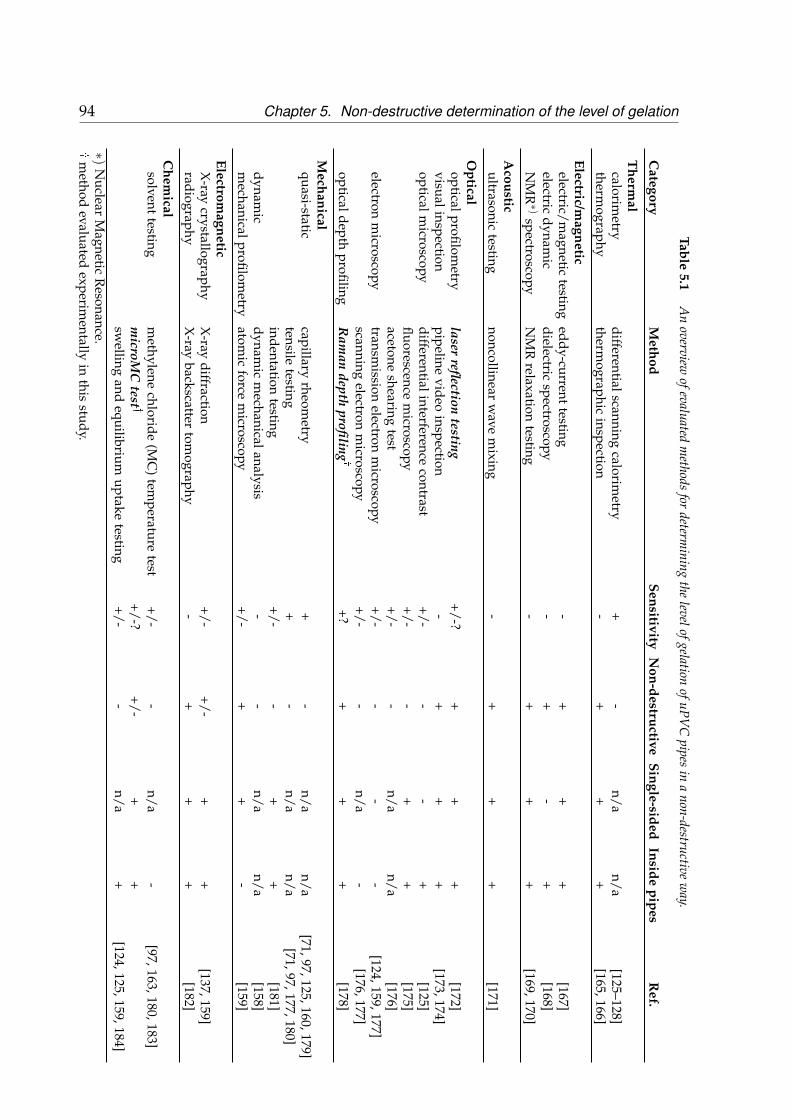
94 Chapter 5. Non-destructive determination of the level of gelationTable
5.1A
noverview
ofevaluatedm
ethodsfor
determining
thelevelofgelation
ofuPVC
pipesin
anon-destructive
way.
Category
Method
SensitivityN
on-destructiveSingle-sided
Insidepipes
Ref.
Therm
alcalorim
etrydifferentialscanning
calorimetry
+-
n/an/a
[125–128]therm
ographytherm
ographicinspection
-+
++
[165,166]
Electric/magnetic
electric/magnetic
testingeddy-current
testing-
++
+[167]
electricdynam
icdielectric
spectroscopy-
+-
+[168]
NM
R∗)
spectroscopyN
MR
relaxationtesting
-+
++
[169,170]
Acousticultrasonic
testingnoncollinear
wave
mixing
-+
++
[171]
Opticalopticalprofilom
etrylaser
reflectiontesting
+/-?+
++
[172]visualinspection
pipelinevideo
inspection-
++
+[173,174]
opticalmicroscopy
differentialinterferencecontrast
+/--
-+
[125]fluorescence
microscopy
+/--
++
[175]acetone
shearingtest
+/--
n/an/a
[176]electron
microscopy
transmission
electronm
icroscopy+/-
--
-[124,159,177]
scanningelectron
microscopy
+/--
n/a-
[176,177]opticaldepth
profilingR
aman
depthprofiling
�+?
++
+[178]
Mechanicalquasi-static
capillaryrheom
etry+
-n/a
n/a[71,97,125,160,179]
tensiletesting
+-
n/an/a
[71,97,177,180]indentation
testing+/-
-+
+[181]
dynamic
dynamic
mechanicalanalysis
--
n/an/a
[158]m
echanicalprofilometry
atomic
forcem
icroscopy+/-
++
-[159]
Electromagnetic
X-ray
crystallographyX
-raydiffraction
+/-+/-
++
[137,159]radiography
X-ray
backscattertom
ography-
++
+[182]
Chem
icalsolvent
testingm
ethylenechloride
(MC
)tem
peraturetest
+/--
n/a-
[97,163,180,183]m
icroMC
test�
+/-?+/-
++
swelling
andequilibrium
uptaketesting
+/--
n/a+
[124,125,159,184]∗)
Nuclear
Magnetic
Resonance.
�m
ethodevaluated
experimentally
inthis
study.

5.2. Screening of test methods 95
Table 5.2 The definitions of the symbols used in Table 5.1.
For the sensitivity Symbol
quantitative test results and high resolution over a wide range of levels of gelation +qualitative test results and/or limited resolution +/-the method is not sensitive to the level of gelation -
For the destructive character of the test
non-destructive +causes damage at local scale +/-destructive� -
For the side(s) where the probe(s) should be located
single-sided +double-sided -not applicable for this method n/a
For the suitability inside a pipe
robust and may fit into uPVC pipes +does not fit into uPVC pipes -not applicable for this method n/a� extraction of a specimen and heating above Tg are regarded as destructive operations.
At higher frequencies (10 Hz-10 MHz), molecular relaxation as a result of the rotationof Cl-C bonds in PVC can be detected [168] (similar to a dynamic mechanicaltests [83]). The level of gelation is, however, not expected to influence this relaxationmechanism [158]. Preliminary experiments carried out as part of the present studyindeed confirmed this: also at higher frequencies dielectric spectroscopy is notsuitable.
In industry, non-destructive, single-sided and compact nuclear magnetic resonance(NMR) devices are widely used for determining changes in material properties fromthe relaxation behaviour of nuclear spins [169, 170]. Preliminary measurements werecarried out using an NMR depth profiling device that is capable of determining therelaxation behaviour of spins in the centre of uPVC specimens where variationsin gelation levels are most pronounced. Unfortunately, differences in relaxationbehaviour for different gelation levels and over the thickness of the specimens werenot observed. Relaxation-based NMR is thus not suitable to determine the level ofgelation.
Apparently, the level of gelation has no significant influence on molecular relaxationeffects resulting from dipoles and nuclear spins. It is concluded that furtherdevelopment of a non-destructive method based on electric and magnetic fields maynot be useful.

96 Chapter 5. Non-destructive determination of the level of gelation
Acoustic methods
Ultrasonic testing is a non-destructive method based on the propagation of soundwaves through an object with frequencies between 20 kHz and 800 MHz. There is astrong link between ultrasonic and dielectric measurements and the latter techniqueis commonly used to find out whether ultrasonic waves are sensitive for the propertyunder study [185]. The conducted dielectric experiments noted before have shownthat dielectric properties are not influenced by the level of gelation. Based on thisresult it is expected that linear and non-linear ultrasonic techniques are not useful todetermine the level of gelation.
Optical methods
Optical profilometry is a form of non-destructive testing in which incident lightrays (from a compact laser device) are reflected from the surface of an object tothe determine surface roughness of the object [186]. Rabinovitch and Harshbargerhave shown a relationship between the level of gelation and the surface roughnessfor PVC specimens produced at different temperatures [60]. At low processingtemperatures, primary particles of the size of 1-2 µm can be distinguished at thesurface and contribute to the surface roughness of the inner wall of a uPVC pipe.For increasing processing temperatures, the particles are more fused together and anearly continuous melt is formed, resulting in a relatively smooth surface. It maystill be possible to distinguish particles on the surface in the case of low processingtemperatures, despite the fact that the level of gelation at the pipe surface is generallyhigher than at the centre of the wall [20, 127, 162]. Surface roughness measurementsusing laser reflections may therefore be useful for determining the level of gelationfrom the inside of pipes. Preliminary measurements have been carried out fora controlled set of specimens with identical composition, processed at the sameextruder but at different processing temperatures. The observations of Rabinovitchand Harshbarger [60] are confirmed for this specific set of specimens. However,application of the technique to a variety of pipes revealed that, unfortunately, notonly processing temperature, but also other processing variables, such as the screwspeed [60, 96] and the surface of the die [60], influence the surface roughness.Therefore, the practical relevance of surface roughness measurements is limited.
The variety of microscopy methods listed in Table 4.1 can be used to observe residualgrain boundaries and primary particles and thus can give direct information aboutthe level of gelation. Generally, microscopy methods do not fit inside a pipe; theyrequire specimens extracted from a pipe and are therefore destructive. Furtherdevelopment would be required if application in practice is pursued. Despite thisdisadvantage, the results of differential interference contrast microscopy experimentson PVC are particularly interesting to mention. A decrease in the magnitude of

5.2. Screening of test methods 97
fluctuations in the refractive index of PVC has been observed for increasing levelsof gelation [125]. The precise reason for these fluctuations is not entirely clear [125].It is reasonable to assume that light rays from an incoming laser beam are scatteredas a result of the fluctuations, leading to attenuation of the beam as it travels insidethe PVC material. A decrease in the attenuation of the beam with increasing levelsof gelation would then be expected. MacDonald et al. observed differences in theattenuation of a laser beam in non-destructive, single-sided Raman depth-profilingexperiments on PE (co)polymers [178]. The observed differences in attenuation wereattributed to differences in optical scattering in the bulk of the polymers. Hence,Raman depth profiling may also be a suitable technique to determine the level ofgelation of uPVC pipes.
Several Raman depth-profiling experiments are conducted and presented in thefollowing sections of this chapter. It is known that the penetration depth is ofthe order of only several micrometres but, as mentioned earlier, for low processingtemperatures, primary particles may still be identified at the pipe surface indicatingincomplete fusion [60].
Mechanical methods
In mechanical testing, a quasi-static or a dynamic mechanical excitation is appliedand the mechanical response is measured. Quasi-static tensile tests applied toPVC specimens show that the load-extension curves can be superimposed, the onlydifference being that break occurs earlier for decreasing level of gelation [123].Consequently, tensile properties which can be determined by applying only arelatively small amount of strain (e.g. Young’s modulus and yield stress) cannotbe used to determine the level of gelation, ruling out “non-destructive” mechanicaltesting.
A dynamic mechanical excitation is used in Dynamic Mechanical Analysis (DMA),which can be used to non-destructively (at low strains and temperatures below Tg)study different molecular relaxation mechanisms of PVC in a similar way as indielectric spectroscopy [83]. During preliminary measurements carried out below Tgdifferences in the storage and loss moduli with the level of gelation were notobserved, see also Chapter 4. These results confirm the findings of Uitenham andGeil [158] and are in line with the results of the preliminarily dielectric measurementsmentioned earlier. It is concluded from the results from tensile test and DMA thatmechanical methods based on low strains and temperatures below Tg are not suitedto determine the gelation level.
In contrast, differences in the level of gelation are clearly observed in measurementsperformed above Tg at high strains (e.g. in capillary rheometry tests and inindentation tests above Tg). However, the nature of these measurements is such thatthey cannot be developed for non-destructive, in-situ test methods.

98 Chapter 5. Non-destructive determination of the level of gelation
So far, only macro-mechanical methods have been evaluated. A non-destructive,single-sided micro-mechanical method is Atomic Force Microscopy (AFM). WithAFM a cantilever, typically with a length of about 1 mm, with a sharp tip at itsend can be used to differentiate between additives and the rigid PVC based on thedifference in their stiffness. This provides evidence of residual primary particles andcan be related to the level of gelation [159]. However, an AFM is a precision deviceand is, in general, not robust enough for practical application inside a uPVC pipe.
It is concluded that none of the mechanical methods shown in Table 5.1 are suitablefor the envisaged application and have been dropped in the screening process.
Electromagnetic methods
X-ray diffraction is used to identify regular atomic and molecular structures usingX-rays. The crystallinity in PVC has been studied extensively using X-ray diffractionmethods [116–118, 137, 187, 188]. Changes in the total crystalline fraction have beenobserved for increasing processing temperature and thus with increasing level ofgelation [137]. However, the crystalline fraction and the gelation level do not correlatewell, because one can be influenced without affecting the other. For example, byannealing PVC materials above Tg the crystalline fraction can be increased [93],whereas the level of gelation does not change upon annealing [127, 159]. Theobservation that the total crystalline fraction does not follow a monotonic trend withprocessing temperature [137] further complicates the correlation. For these reasons,determining the gelation level from the crystalline fraction is not straight forwardand X-ray diffraction is excluded as a solution in the present study.
Radiographic testing is a non-destructive imaging method using X-rays. Backscattercomputed tomography, which does not require a film on the opposing side ofan object as in conventional X-Ray imaging [182], has recently become availablecommercially. Another advantage is that it can penetrate the material and scan thebulk with the lowest levels of gelation as well. However, the resolution of suchsystems is not yet high enough (about 2 mm) to observe individual grains andprimary particles and therefore needs to evolve before it can be considered as asuitable technique.
Of the electromagnetic methods considered in Table 5.1, X-Ray tomography may bea suitable technique if its resolution can be increased.
Chemical methods
The chemical methods evaluated here are based on swelling and disintegration ofPVC specimens using compatible solvents [159, 184]. The destructive character ofthese methods make them in principle unsuitable for non-destructive determinationof the level of gelation.

5.3. Experimental approaches 99
A commonly used method for gelation measurements is the methylene chloride (ordichloromethane) temperature (MCT) test. In this test, a pipe part is chamferedto expose the inner wall. The chamfered part is submerged in methylene chloride(MC) and subsequently dried. By inspecting chamfered parts for attack after beingsubmerged at different temperatures, the level of gelation can be determined over thethickness and the circumferential direction of the pipe. The inner and outer side ofthe pipe wall may have a higher level of gelation than the pipe interior, as mentionedbefore.
An interesting, less destructive variant of the MCT test was developed in house. Asmall concavity is milled in a uPVC pipe wall from the pipe inside and is exposedto methylene chloride locally. The key issue of the technique is to minimise therequired depth of the concavity to recognise a pipe with an unwanted level ofgelation. Depending on the minimum concavity depth the local reduction of wallthickness may be small enough for the method to be considered as non-destructive.The method is referred to as the micro methylene chloride (microMC) test andinvestigated in the next sections.
The screening procedure has led to selecting the Raman depth profiling method andthe microMC method for in-depth experimental investigation as described in moredetail in the next section.
5.3 Experimental approaches
The two selected methods, Raman depth profiling and the microMC method,have been investigated experimentally to further evaluate whether they fit therequirements drawn up in the introduction. The approaches followed are outlinedand discussed in more detail in the following subsections.
5.3.1 Raman depth profiling
For increasing levels of gelation, a decrease in the attenuation of a laser beam whichtravels inside the PVC material is expected, as was already argued in Section 5.2. InRaman depth profiling, a laser beam is focused on a small material volume below thesurface of a specimen. A small fraction of the light rays in the incident beam will loseenergy due to Raman scattering*. The Raman scattered light rays are detected usinga detector situated at the same side of the specimen as the laser source, enablingsingle-sided inspection. The intensity of these rays can be determined at differentdepths below the surface by employing the confocal optics configuration. The rate
*Approximately one in ten million of the incoming photons will scatter inelastically, transferring apart of its energy to the atoms.

100 Chapter 5. Non-destructive determination of the level of gelation
at which the Raman intensity decreases with the depth is taken as a measure for theattenuation of the laser beam and may be used to determine the level of gelation.
A complicating factor in the analysis of Raman measurements is the attenuation of thebeam due to the surface roughness [178, 189]. The surface roughness of a uPVC pipeis influenced by processing variables, such as the screw speed and the surface of thedie, as mentioned before. The influence of the surface roughness must be minimisedas the typical penetration depth of Raman measurements is only a few micrometres.Here, an immersion oil with a refractive index comparable to that of uPVC has beenselected in favour of mechanical means to polish the pipe surfaces. In the lattercase the additional treatment might have undesirable effects on the subsurface regioninvestigated with the Raman measurements.
Lastly, because additives can influence the fluctuations in the refractive index [125],Raman depth profiling experiments were initially carried out on pipes having thesame formulation.
5.3.2 MicroMC method
The level of gelation may be determined by the microMC test i.e. exposing a smallportion of the pipe wall to methylene chloride. The microMC test is describedschematically in Figure 5.3. Firstly, a cylindrical concavity is milled down to a certaindepth in the pipe wall on the inside of the pipe. This exposes part of the pipeinterior material (Figure 5.3 a). Secondly, the milled surface is submerged into MCat a specified temperature for a specified time (Figure 5.3 b). Finally, the specimenis dried and the bottom of the concavity is inspected for signs of attack using a lightmicroscope (Figure 5.3 c). The sensitivity of the method for different gelation levelswas assessed using different concavity depths and test temperatures.
inner wallsurface
MC
(a) (b) (c)
microscopeobjective
concavity
PVC
attackedsurface
Figure 5.3 Systematic description of the microMC test. (a) a cylindrical concavity milled into the innerwall surface of a PVC pipe. (b) exposing the milled surface to MC (c) light microscopyinspection of the exposed concavity (not to scale).

5.4. Experimental 101
5.4 Experimental
5.4.1 Materials
Specimens were taken from four unused uPVC pipes and two excavated uPVC pipes(pipes 10 to 15 in Table A.1 in Appendix A). The unused pipes are composedof the same PVC materials used by Meijering [19]. The pipes have the samecomposition and were processed on the same extruder, but at different temperatures.The excavated pipes were taken from the Dutch water distribution network. Thediameters and wall thicknesses of the pipes are given in the third and fourth columnof Table 5.3 respectively.
Table 5.3 The dimensions and levels of gelation as determined by the MCT test and the Macklow-Smithrheological procedure [71] of the unused and excavated uPVC pipes used in this study.
Type No. Diameter Thickness Level of gelation[mm] [mm] MCT Macklow-Smith [71]
unused 10 50 2.3 under 19%unused 11 50 2.3 intermediate 48%unused 12 50 2.3 good 73%unused 13 50 2.3 over 91%
excavated 14 320 8.1 under� -excavated 15 600 18 under� -� Not assessed according to ISO 9852:2007. Only determined on small pieces of the pipe.
The gelation level of the pipes was determined using the MCT method in accordancewith ISO 9852:2007. After the pipes were chamfered, the pipes were submerged intomethylene chloride at temperatures of 5 ◦C, 10 ◦C and 15 ◦C for 30 minutes. Aftersubmerging, the pipes were dried and subsequently inspected visually for signs ofattack. The level of gelation is classified as ’under’, ’poor’, ’good’ or ’over’ based onthe combination of the occurrence of attack and the test temperature. The levels ofgelation from the MCT test are given in the fifth column of Table 5.3. The last columnshows the gelation levels in terms of percentages for the unused pipes. These pipeswere characterised using the Macklow-Smith rheological approach by Benjamin [71].
5.4.2 Raman depth profiling
Raman depth profiling experiments were carried out using a confocal Witec alpha300R microscope equipped with a Nikon 100X 1.25NA objective, where NA is thenumerical aperture of the objective. A Cargille 4108 LDF immersion oil havinga refractive index of 1.518 was used to match the refractive index of PVC, which

102 Chapter 5. Non-destructive determination of the level of gelation
is 1.540 according to [125]. Raman spectra were determined using excitationwavelengths of 633 nm and 785 nm and maximal laser powers of 4 mW and 32 mW,respectively. After each measurement, the specimen surface was checked for thermaldegradation using a common light microscope. A piezoelectric stage was usedto position the specimen relative to the microscope, such that the Raman spectracould be determined at different depths below the specimen’s surface. The referenceposition of the surface of the specimen was determined from the position at whichthe intensity of the Rayleigh peak was at a maximum. After each measurementabnormally high narrow peaks in the spectra (possibly due to stray light and cosmicrays) were removed. The characteristic peak of PVC at 1425 cm−1 (C-H bendingvibration [190]) was used to determine the intensity of Raman light rays as a functionof the depth since this peak does not overlap with peaks from additives present inuPVC. The height of the peak was determined after removing the background signalassuming linear baselines. The dimensions of the sample volume at the focus pointin air can be approximated using the equations [191]
d =1.22λ
NA, (5.1)
and
L =4λ
NA2 , (5.2)
where d is the width of the beam at the focus point, L/2 is the distance from the focuspoint at half of the intensity at the focal point and λ is the excitation wavelength. Forλ=785 nm (NA=1.25) the values are: d = 0.8 µm and L = 1.9 µm. For λ=633 nm thevalues decrease to: d = 0.6 µm and L = 1.6 µm. The spatial resolution of the set-upis similar in this case for both wavelengths used.
5.4.3 MicroMC test
The specimens taken from the unused pipes (pipes 1-4) were sawn to dimensions ofroughly 70×30×2.7 mm3. For the ease of further specimen preparation, the curvatureof the original pipe was eliminated by pressing the specimens at a compressive stressof ∼1 MPa at 100 ◦C (∼15 ◦C above Tg) for 25 minutes. Cylindrical concavities withdepths from 0.1 mm to 1.2 mm (thus up to a depth equal to approximately half ofthe wall thickness) were milled on the side that was originally the inner surface ofthe pipe. The diameter of each concavity was 4 mm. Large variations in gelationlevels along the length direction of the uPVC pipes were not expected. Hence, thedepth of the concavities was varied along this direction. Possible variations in thecircumferential direction were taken into account by milling several concavities ofthe same depth in this direction, as shown in Figure 5.4.

5.5. Results 103
Ø 4 mm
pipe
length
direction
pipe circumferential direction
C1 C2 C3 C4
deep
shallow
Figure 5.4 A test specimen used for the microMC test. Each of the columns C1 to C4 consists of fiveconcavities with differences in depths. The orientation of the test specimen in the uPVC pipeis indicated.
The specimens were submerged in MC such that all concavities were filled at 5 ◦Cand 10 ◦C for 30 minutes. The top of the MC filled glass containing specimen wassealed with parafilm to prevent excessive evaporation of MC. The specimen was driedafter submersion and the concavities were inspected for signs of attack using a LeicaM125 stereo microscope. The specimens submerged at 5 ◦C and 10 ◦C were reusedfor a measurement at 15 ◦C and 20 ◦C respectively. The chemical attack at the lowertemperature was assumed to be negligible in comparison with the attack at the highertemperature and the use of fresh specimens would not give different results.
5.5 Results
In Section 5.2, the Raman depth profiling method and the microMC test wereselected for experimental evaluation. The experimental details were described inSections 5.3 and 5.4. The results of the experiments are shown in this section.
5.5.1 Raman Depth Profiling
In Raman depth profiling, a laser beam is focused below the surface of a specimen.The amount of (back)scattered rays (and thus the attenuation of the signal detectedby the sensor) from this focal point is expected to decrease with increasing level ofgelation. A typical depth profile of the intensity of Raman scattered light rays forPVC is shown in Figure 5.5. The decrease in the measured intensity with increasingdepth is attributed to optical scattering of light rays travelling inside the bulk ofthe specimen. The influence of surface roughness has been eliminated by adequaterefractive index matching. The variations in the curve are probably due to localinhomogeneities inside the material (e.g. crystals and additives) which interfereslightly with the light beam.

104 Chapter 5. Non-destructive determination of the level of gelation
Figure 5.5 The intensity of the band characteristic of uPVC at 1425 cm−1 for pipe 1 determined usingan excitation wavelength of 758 nm and a laser power of 32 mW. The depth indicates thedistance from the specimen surface.
The depth profiles for pipes 1-4 that differ only in the level of gelation, are given inFigure 5.6, which shows only little differences in the depth profiles. Apparently, theoptical scattering behaviour of these materials is not significantly different at thesedepths. A possible explanation is that differences in fluctuations in refractive index asa result of differences in level of gelation at the surface are too small to be detected,even though poorly fused primary particles were observed at the surface for thesepipes at low processing temperatures in the preliminary experiments. A practicalconsequence is that Raman depth profiling experiments carried out from the insideof pipes are not sensitive enough and thus seem to be an unsuitable way to determinethe level of gelation.
Figure 5.6 The averaged depth profiles for pipes 1-4 using an excitation wavelength of 758 nm and laserpower of 32 mW. For each pipe, three measurements were carried out at different locationson the inner surface of the pipe wall. The legend indicates the pipe numbers and the level ofgelation.
An extra specimen was prepared from pipe 5 (with low level of gelation), to confirm
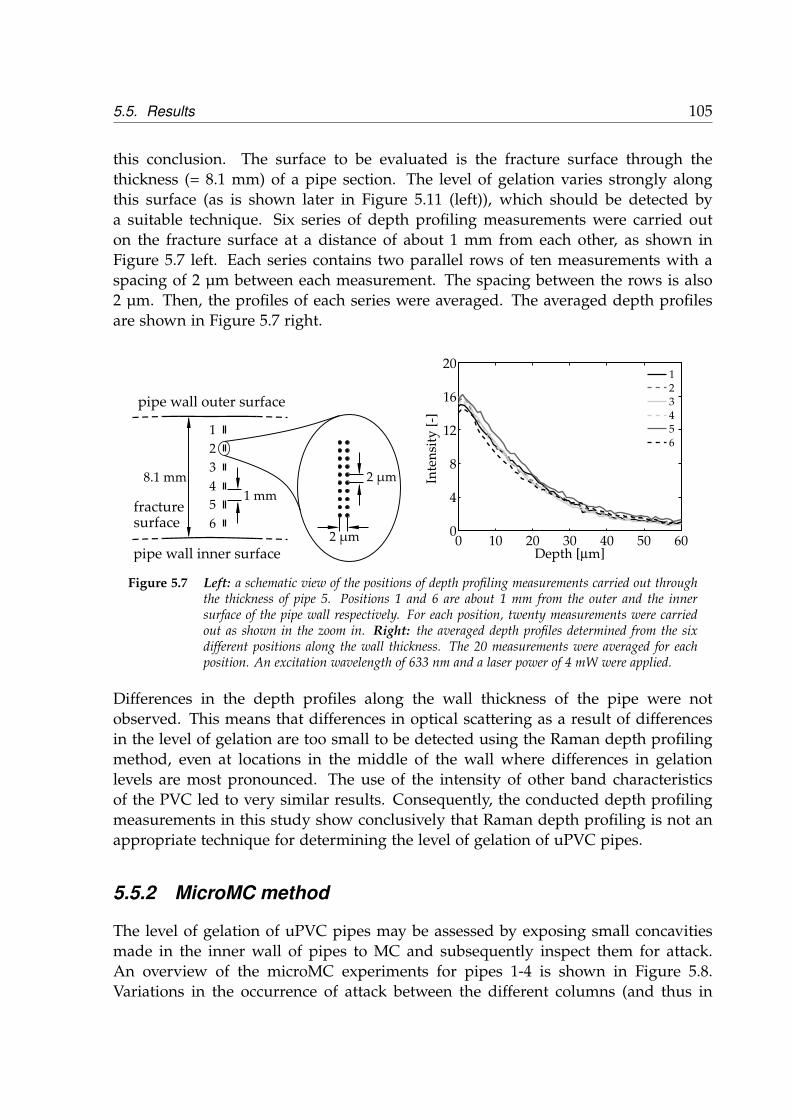
5.5. Results 105
this conclusion. The surface to be evaluated is the fracture surface through thethickness (= 8.1 mm) of a pipe section. The level of gelation varies strongly alongthis surface (as is shown later in Figure 5.11 (left)), which should be detected bya suitable technique. Six series of depth profiling measurements were carried outon the fracture surface at a distance of about 1 mm from each other, as shown inFigure 5.7 left. Each series contains two parallel rows of ten measurements with aspacing of 2 µm between each measurement. The spacing between the rows is also2 µm. Then, the profiles of each series were averaged. The averaged depth profilesare shown in Figure 5.7 right.
1
2 µm
2 µm
1 mm
2
3
4
5
6
pipe wall outer surface
pipe wall inner surface
fracturesurface
8.1 mm
Figure 5.7 Left: a schematic view of the positions of depth profiling measurements carried out throughthe thickness of pipe 5. Positions 1 and 6 are about 1 mm from the outer and the innersurface of the pipe wall respectively. For each position, twenty measurements were carriedout as shown in the zoom in. Right: the averaged depth profiles determined from the sixdifferent positions along the wall thickness. The 20 measurements were averaged for eachposition. An excitation wavelength of 633 nm and a laser power of 4 mW were applied.
Differences in the depth profiles along the wall thickness of the pipe were notobserved. This means that differences in optical scattering as a result of differencesin the level of gelation are too small to be detected using the Raman depth profilingmethod, even at locations in the middle of the wall where differences in gelationlevels are most pronounced. The use of the intensity of other band characteristicsof the PVC led to very similar results. Consequently, the conducted depth profilingmeasurements in this study show conclusively that Raman depth profiling is not anappropriate technique for determining the level of gelation of uPVC pipes.
5.5.2 MicroMC method
The level of gelation of uPVC pipes may be assessed by exposing small concavitiesmade in the inner wall of pipes to MC and subsequently inspect them for attack.An overview of the microMC experiments for pipes 1-4 is shown in Figure 5.8.Variations in the occurrence of attack between the different columns (and thus in

106 Chapter 5. Non-destructive determination of the level of gelation
the circumferential direction, see also Figure 5.4) were not observed for these pipes.Therefore, for each temperature only a single column with concavities is shown.
5 °C
Pipe 1
under
Pipe 2 Pipe 3 Pipe 4
intermediate good over
10 °C
0.2
0.4
0.6
1.0
1.2
0.1
0.2
0.4
0.8
1.2
5 °C
0.1
0.2
0.4
0.8
1.2
15 °C
0.1
0.2
0.4
0.8
1.2
20 °C
0.4
0.6
0.8
1.0
1.2
15 °C
0.1
0.2
0.4
0.8
1.2
20 °C
0.1
0.2
0.4
0.8
1.2
Figure 5.8 Photographs of cylindrical concavities are shown for pipes 1-4. The levels of gelation ofthe pipes as indicated in the top row were determined using the MCT test. For eachtemperature, the concavities of only column C1 are shown. The numbers indicate the depthof the concavities in millimetres. The concavities have depths up to 50% of the wall thicknessof the original pipes (=2.3 mm).
For the under-gelated pipe 1, attack was observed for each depth at 5 ◦C, and wasobserved even at the inner surface itself. For pipe 2, which was gelated up to anintermediate level, the attack initiates at low depths and increases with increasingdepth. For pipe 3, a pipe with a good level of gelation, attack was not observed forsubmersion at 15 ◦C, whereas for 20 ◦C attack initiated and increased with increaseddepth. For the over-gelated pipe 4, attack was not observed for the ranges of depthsand temperatures investigated. So, significant differences in the occurrence and theextent of attack were observed for these pipes.
The depth at which attack initiates is influenced by the test temperature. This effectis highlighted for pipe 2 in Figure 5.9. The two photographs on the left show that at5 ◦C, attack starts to occur at a depth of 0.4 mm, whereas at 10 ◦C, attack is observedalready at a depth of 0.2 mm as shown in the top right photograph (and increaseswith increasing depth as shown in the bottom right photograph). The disintegrationprocess of the PVC material is accelerated by increasing the temperature, whichexplains the initiation of attack at lower depths for higher temperatures.
For pipes 3 and 4 the first signs of differences between the initiation of attackare observed at 20 ◦C as shown in detail in Figure 5.10. For pipe 3, an attackedsurface is observed at a depth of 0.4 mm, whereas for pipe 4 no attacked surface isobserved at this and larger depths. So, for pipes having low levels of gelation, poorlyfused material is located closer to the surface than for pipes having high levels ofgelation, as expected. Thus, by carrying out measurements using the correct depths,

5.5. Results 107
5 °C 10 °C
0.21 mm
1 mm 0.4 1 mm 0.4
0.21 mm
Figure 5.9 Photographs of concavities for pipe 2 for 5 ◦C and 10 ◦C. The numbers indicate the depth inmillimetres.
temperatures and presumably also the exposure time which is not varied here, uPVCpipes having a wide range in levels of gelation can be distinguished from each otherusing the microMC method.
Pipe 3 Pipe 4
0.41 mm
1 mm 0.8 1 mm 0.8
0.41 mm
Figure 5.10 Photographs of concavities for pipes 3 and 4 tested at 20 ◦C. The numbers at the bottomright of each photograph indicate the depth in millimetres.
Remarkably, for pipe 1, attack was observed on the side of the specimen that wasoriginally the inner surface of the pipe, but it was not observed on the outer surfaceof the pipe. This phenomenon is possibly a result of a post-extrusion step whichis applied to reduce the effects of die-swell. After extrusion the hot PVC materialis pulled through a calibration ring. This causes a friction force between, and thusa shear stress at, the PVC material (mostly at the outer surface) and the calibration

108 Chapter 5. Non-destructive determination of the level of gelation
ring wall. This process may increase the level of gelation at the outside of the pipewall. Consequently, the level of gelation is no longer symmetrical, but higher on theoutside.
5 °C 10 °C
20 °C15 °C
4 mm 4 mm
4 mm 4 mm
4 mm 4 mm
4 mm4 mm
5 °C 10 °C
20 °C15 °C
Figure 5.11 Results of MCT test on pipe 5 (left) and pipe 6 (right). The specimens were subjected toMC for 30 minutes at the temperature indicated above each of the photographs.
The microMC test was further validated by performing measurements on twoexcavated pipes with a relatively large wall thickness used for water distribution. Thelarge wall thickness may result in strong variations in the level of gelation throughthe thickness after extrusion. The results of the regular MCT test are shown inFigure 5.11. Pipe 5 is classified as having an insufficient level of gelation as chemicalattack is observed even at 5 ◦C. However, there is still a significant surface area onthe chamfered edge located near the original pipes’ outer and inner wall which doesnot show signs of chemical attack. Pipe 6 clearly has an even lower level of gelation,as the inner pipe wall surface was also attacked by the MC at 5 ◦C. The images ofpipe 6 show that this pipe has an asymmetric profile of the level of gelation along itswall thickness. The calibration procedure that is used in the extrusion line could bethe underlying reason for this observation as argued before.
The results of the microMC tests conducted on pipe 5 are shown in Figure 5.12. Theseimages show that the attack starts to become visible somewhere between a depth of0.8 mm and 1.6 mm when the measurement is carried out at 10 ◦C. A lower depthcan be used if the measurement is carried out at 20 ◦C; the first signs of attack canbe observed at the bottom surface of the 0.8 mm deep concavity. This means that aconcavity of only about 10% of the wall thickness is required to determine whetheror not the level of gelation is too low. A further experimental study is required tooptimise the microMC procedure and to find the depth at which a pipe with anexcessively high level of gelation can be distinguished from a pipe with an optimallevel of gelation.

5.6. Discussion 109
10 °C 20 °C
1.61 mm
1 mm 3.2 1 mm 0.8
0.41 mm
Figure 5.12 Photographs of concavities in pipe 5 at different depths after exposure to MC at 10 ◦C (left)and 20 ◦C (right) for 30 minutes.
5.6 Discussion
The presented results from the Raman and microMC experiments show that only themicroMC method enables the determination of the level of gelation on a more or lessnon-destructive way. The microMC experiments have shown that a layer of materialof about 0.4 mm has to be removed from the inner wall to distinguish between thelevels of gelation for pipes in service. The method therefore seems more suitablefor thick-walled water distribution pipes than for thinner walled gas distributionpipes. The microMC experiments show that the critical depth at which attack initiatesdepends on the concavity depth and the test temperature and, presumably, on theexposure time. Further research on the effect of test temperature and exposure timeis required to optimise the approach and limit the required concavity depth as muchas possible.
Based on the results on pipes 1-4 the following procedure can be used in practice.Firstly, a measurement should be carried out at 10 ◦C on a concavity of 0.2 mm deepto distinguish between under, intermediate and higher levels of gelation. If attackis observed on the inner pipe wall surface, the level of gelation is poor. If attack isobserved only at the bottom of the concavity the pipe has an intermediate level ofgelation. If attack is not observed the pipe has either an optimal or an excessivelyhigh level of gelation. A second measurement can be carried out at 20 ◦C on aconcavity of 0.4 mm deep to differentiate between these levels. If attack starts tooccur at the bottom of the concavity, the pipe has the optimal level of gelation and ifno attack is observed the level of gelation is too high. So only one measurementis required to recognise whether a pipe has an insufficient level of gelation andan additional measurement is required to confirm whether the level of gelation is

110 Chapter 5. Non-destructive determination of the level of gelation
optimal. Additional research is required to optimise this procedure for the situationfound in practice. The depth of the concavity could, for example, be decreased byexploring higher test temperatures.
The major drawback of the microMC test is that it requires the use of the potentiallyharmful chemical methylene chloride inside the pipe. Water distribution operatorsin particular will be very reluctant to allow such measurements in their waterdistribution networks. Therefore, extra care should be taken with the (chemical)safety of the developed microMC device. Another drawback of the microMC methodis that the level of gelation of the pipe is determined only locally. Therefore,more measurements should be carried out to locate critical areas of the pipe. Themeasurements should be done mostly in the circumferential direction, as variationsin the level of gelation are more common in that direction than in the pipe lengthdirection.
Furthermore, it should be noted that the conditions at which attack initiates areinfluenced by the K-value [180]. As most of the pipes produced after the mid-1960shave a K-value of 65, particular caution should be observed for pipes installed beforethis period.
For practical implementation of the microMC method, future research should focuson (i) the extent to which the removal of material has an influence on the mechanicalperformance of pipes in service, (ii) ways to automate the method (potentially usingimage recognition technology) and (iii) the influence of the test temperature in orderto minimise the required depth that should be milled away from the pipe innersurface.
5.7 Conclusions
In this chapter a systemic study has been carried out to screen for methods todetermine non-destructively the level of gelation of a uPVC pipe in gas and waterdistribution networks while the pipe is in service. No technique was found thatwas able to determine the level of gelation in a non-destructive fashion, through thethickness of the pipe wall and from the pipe inside. The main limitation is the factthat the level of gelation is lowest in the interior of the pipe wall, making a non-destructive method challenging. X-ray tomography was identified in the screeningprocess as a viable option for the future if the resolution of the method can besufficiently improved and the size of the device itself can be reduced drastically.
The level of gelation of thick-walled uPVC (water) distribution pipes can bedetermined with the newly developed microMC method, which is a modified versionof the commonly applied MC method. Small concavities milled from the pipe insidereadily show signs of attack related to the concavity depth, test temperature and thelocal level of gelation of the pipe. Measurements on water distribution pipes taken

5.7. Conclusions 111
out of service confirm the capabilities of the method. The microMC test seems moreappropriate to thick-walled water distribution pipes, where the relative influence ofthe presence of local concavities is smaller than for thin-walled gas distribution pipesand also the expected variation in level of gelation is much larger.
A significant hurdle that should be overcome to implement the microMC methodin practice is to develop a device that can be safely applied in water distributionnetworks.

112 Chapter 5. Non-destructive determination of the level of gelation
Chapter 6
Residual lifetime assessment inpractice
6.1 Introduction
The objective of the research project described in this thesis is to improve and extendthe available residual lifetime assessment method for uPVC gas pipes, as formulatedin Chapter 1. With the new knowledge and understanding obtained in Chapters 2 to 5a significant step towards a more practical application of the method has been made.Before finalising the thesis, it is appropriate to take a critical look at the practicalapplicability of the developed and validated theoretical framework.
Each of the subsequent chapters contributed to answering this question. Thecharacterisation of the current condition of a uPVC pipe in terms of the degreeof physical ageing and the level of gelation was based on the material’s hardness(Chapter 2) and the material’s susceptibility to swelling and disintegration by solvents(Chapter 5). The critical/limiting strength of a uPVC pipe, defining the condition atwhich the uPVC pipe should be replaced, was studied through dedicated impacttests at a range of temperatures in Chapter 3. Physical ageing led to changes in thefracture behaviour as observed by an increase of the ductile-to-brittle temperature.The residual lifetime of a uPVC pipe follows from the time it takes for the materialto reach the critical condition from its current condition, which depends strongly onthe ageing rates. An in-depth analysis was carried out to investigate the causes of theobserved differences in ageing rates among the uPVC pipes investigated in Chapter 4.
Both physical ageing and the level of gelation have a distinct influence on the ductilityof a uPVC pipe, and thereby on the pipe’s (residual) lifetime. Where the stateof physical ageing changes during the lifetime of the pipe, the level of gelationremains constant as it is solely determined by the production process (extrusion).The influence of both processes on the ductile-to-brittle transition temperature and
113
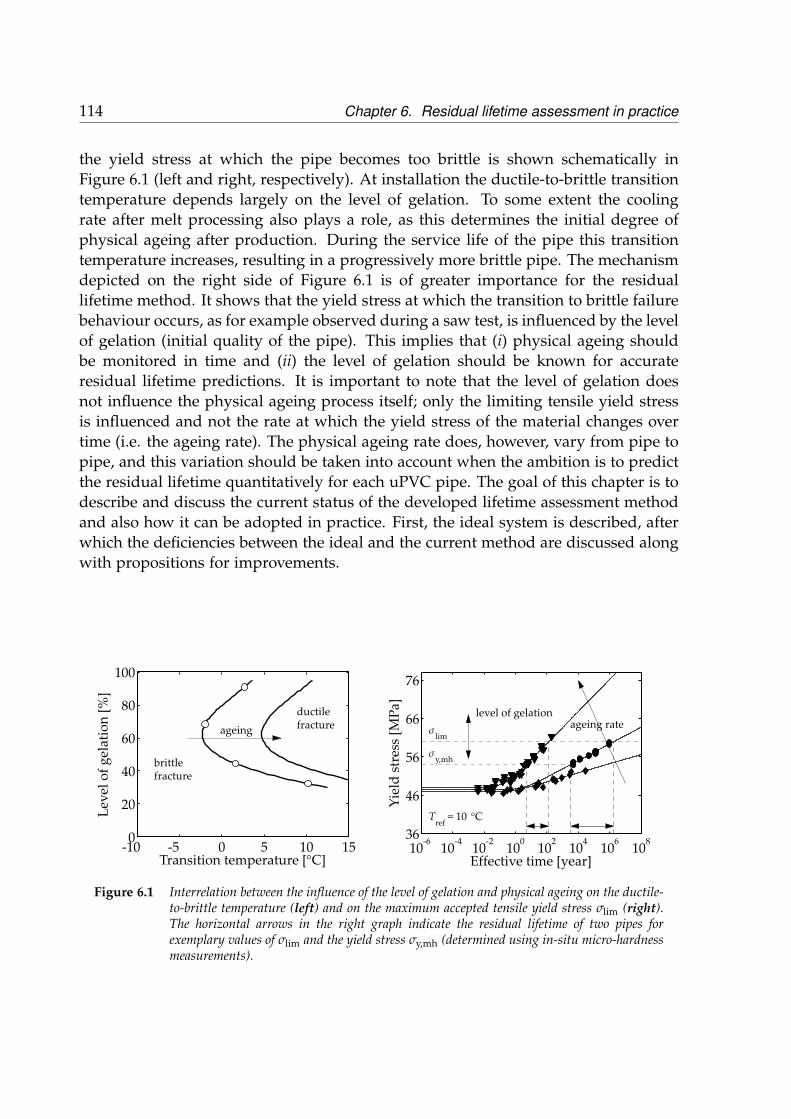
114 Chapter 6. Residual lifetime assessment in practice
the yield stress at which the pipe becomes too brittle is shown schematically inFigure 6.1 (left and right, respectively). At installation the ductile-to-brittle transitiontemperature depends largely on the level of gelation. To some extent the coolingrate after melt processing also plays a role, as this determines the initial degree ofphysical ageing after production. During the service life of the pipe this transitiontemperature increases, resulting in a progressively more brittle pipe. The mechanismdepicted on the right side of Figure 6.1 is of greater importance for the residuallifetime method. It shows that the yield stress at which the transition to brittle failurebehaviour occurs, as for example observed during a saw test, is influenced by the levelof gelation (initial quality of the pipe). This implies that (i) physical ageing shouldbe monitored in time and (ii) the level of gelation should be known for accurateresidual lifetime predictions. It is important to note that the level of gelation doesnot influence the physical ageing process itself; only the limiting tensile yield stressis influenced and not the rate at which the yield stress of the material changes overtime (i.e. the ageing rate). The physical ageing rate does, however, vary from pipe topipe, and this variation should be taken into account when the ambition is to predictthe residual lifetime quantitatively for each uPVC pipe. The goal of this chapter is todescribe and discuss the current status of the developed lifetime assessment methodand also how it can be adopted in practice. First, the ideal system is described, afterwhich the deficiencies between the ideal and the current method are discussed alongwith propositions for improvements.
Figure 6.1 Interrelation between the influence of the level of gelation and physical ageing on the ductile-to-brittle temperature (left) and on the maximum accepted tensile yield stress σlim (right).The horizontal arrows in the right graph indicate the residual lifetime of two pipes forexemplary values of σlim and the yield stress σy,mh (determined using in-situ micro-hardnessmeasurements).

6.2. The ideal residual lifetime assessment method 115
6.2 The ideal residual lifetime assessment method
Ideally, the residual lifetime assessment method for uPVC gas and water pipesis based on a full characterisation of all components in the transportation anddistribution networks. Relevant information comprises not only the level of gelationand the extent of physical ageing, but also data on, for example, the roundness ofthe pipe and the presence of cracks. The ideal method is capable of determining theinformation in a non-destructive fashion. It performs measurements and analyses insitu, while providing a sufficiently detailed spatial resolution of all important pipeparameters, and it does so accurately and sufficiently fast.
6.3 Current status
In this thesis a robust method to determine the hardness or microhardness of a uPVCpipe, and thereby the yield stress of the uPVC pipe, has been developed. Althoughthe proposed method is not an off-the-shelf solution, it does have the potential tobe developed for in-situ field applications. Both the micro-hardness tester and theconfocal microscope used in the lab may be scaled down to devices which are smalland robust enough for field application inside uPVC pipes. Beside carrying outmeasurements, the gas and water distribution network service providers also needto decide on a limiting hardness and/or tensile yield stress value at which the pipesbecome too brittle to keep them in service. In Chapter 3 a procedure involving thesaw test, as developed at Kiwa Technology, was proposed. An additional challenge,as discussed above in Figure 6.1 right, is that this limiting value of the tensile yieldstress is also related to the level of gelation of the pipe under study. Either the lowestvalue encountered for this limiting yield stress can be used (conservative approach) ormultiple limiting values could be decided upon, depending on the level of gelation.Having a limiting value as a function of the level of gelation means that the levelof gelation is required as an input to the method. The microMCT test as proposedin Chapter 5 could in that case be employed to obtain information on the level ofgelation.
6.3.1 Decision for replacement
Once the limiting value of the tensile yield stress has been decided upon, a series ofmeasurements will give a mean value of the hardness (and thus the yield stress)of a uPVC pipe. This information will help the network service providers todecide whether or not the pipe should be replaced. The measurements presentedin Chapter 2 do, however, show that there is always some variation in the hardnessvalues found using micro-hardness testing on uPVC and that this variation can be

116 Chapter 6. Residual lifetime assessment in practice
reduced substantially by reducing the surface roughness of the pipe material. Thismeans that if the tensile yield stress of the pipe is near the limiting value, moremeasurements are required to determine with confidence whether the tensile yieldstress is above or below the limiting value. How rapidly the required sample sizeincreases when the limiting value is approached depends on the desired confidencelevel C and (inner) surface roughness of the pipe. The influence of both aspectson the minimal sample size are illustrated for two pipes having a different surfaceroughness. In the case of a smooth pipe with a hardness value that differs from thelimiting value by up to around 2%, a reasonable number of measurements (about 20)will suffice to determine with high confidence (99%) whether the smooth pipe hasto be replaced. For the rough pipe about 80 measurements are required. For anautomated system, this number of measurements is still regarded as being feasible,assuming the measurement procedure takes no more than about one minute. It willrequire an accurate timing between the hardness test and the confocal measurementprocedure, as is also discussed in Chapter 2. As an alternative for performing moremeasurements, the inner surface of the pipe can also be polished to reduce the scatteron the hardness results. This will increase the complexity of the tool, but could becombined with the preparations for the microMCT as some milling is required forthis test.
Figure 6.2 The minimal sample size versus the distance from the limiting tensile yield stress for pipeshaving different inner surface roughness and for different confidence levels C. For the smoothpipe Ra = 0.19 µm and for the rough pipe Ra = 0.37 µm. The vertical dashed line at 0%indicates the case in which the tensile yield stress of a pipe equals the limiting value. Theminimal sample size was determined using Equation 2.8 and the standard deviation S (forthe smooth pipe, 0.0012 1/µm2, for the rough pipe, 0.0024 1/µm2).
6.3.2 Estimating the residual lifetime
Where the tensile yield stress is below the limiting value the pipe does not have to bereplaced immediately. The network company can determine the residual lifetime of

6.4. How to proceed 117
the pipe using the ageing kinetics of the pipe, and the value of limiting tensile yieldstress (see Chapter 2). However, it is not possible to extract the ageing rate from oneseries of measurements on a pipe. Therefore, the residual lifetime cannot be directlycalculated from the difference between the yield stress determined from the hardnesstest and the limiting tensile yield stress at which the pipe becomes too brittle. Thisdeficiency can be dealt with in three ways, which can all be followed in parallel todevelop the ideal system in the future:
i A conservative approach is followed; the residual lifetime is calculated usingthe highest ageing rate found for uPVC pipes. The downside of this approachis that most of the pipes will be replaced well before reaching their actual endof life, i.e. their ageing rates were overestimated.
ii The data of each of the measurements are stored in a database and themeasurements are repeated periodically (e.g. every five years). Over time adataset will be built up from which the development of the yield stress andthus the ageing rate will become clear. The estimated residual lifetime will beupdated with the most recent information on the ageing rates obtained.
iii The residual lifetime assessment method is extended with a measurement fromwhich the ageing rate can be determined directly. As shown in Chapter 4,the β-transition temperature has a direct relation with the ageing rate. Insteadof using a DMTA, it might be possible to characterise the damping behaviourof uPVC in a non-destructive way, with ultrasonic or dielectric techniques forexample. This will require additional research efforts, as these techniques havealready been evaluated in their common (linear) form which were found to beinappropriate for such a goal in Chapter 4.
6.4 How to proceed
At the time of writing a research programme initiated by Kiwa Technology is beingcarried out, in which several excavated pipes are tested according to the methodsdeveloped in this thesis. The results of the testing and analyses will be comparedwith characterisation data obtained by Kiwa Technology using several destructivetesting methods. The value of the developed methods for field application willemerge from the outcomes of this research programme. At this stage the execution ofthe research programme according to the developed methods is already a positivestep towards routine lifetime assessment of uPVC pipes for transportation anddistribution networks.

118 Chapter 6. Residual lifetime assessment in practice

Chapter 7
Conclusions and Recommendations
The development of methods for determining the current condition and the residuallifetime of uPVC pipes in the gas and water distribution networks has been the maintheme in this thesis. Up-to-date knowledge and understanding of the current andfuture state of the distribution networks is vital for safe and efficient condition basedasset management by the gas and water distribution companies. Failures in the uPVCpipe networks do not occur frequently; they are induced mostly by impact loadingevents from (third party) excavation activities. The occurrence of brittle failure shouldbe avoided, so as to limit the risks of (fatal) incidents. Two main factors have beenknown to increase the chances of brittle failure. Firstly, the occurrence of physicalageing leading to an increase of the strength and hardness of the uPVC pipes overtime, but concomitantly to a decrease of its toughness. Secondly, a non-optimisedlevel of gelation, where the level of the gelation is a measure for the homogeneityof the pipe material after extrusion, remaining constant over time. The crucialfactors in characterising the current and future condition of uPVC pipes are thedetermination of (i) the current strength and/or hardness of a uPVC pipe, (ii) themaximum allowable tensile yield stress avoiding brittle failure, (iii) the developmentof the yield stress in the course of time due to physical ageing and (iv) the level ofgelation. These topics have been investigated in depth in this thesis in Chapters 2 to5. The most important conclusions and recommendations regarding the research aregiven below.
7.1 Conclusions
A new micro-Vickers hardness-based approach has been presented which can beemployed to non-destructively determine changes in the thermodynamic state ofuPVC pipe materials for gas and water distribution networks. The hardnessmeasurements were carried out on non-polished specimen surfaces to replicatefuture use by in-situ pipe inspection systems. The hardness measurements were
119

120 Chapter 7. Conclusions and Recommendations
characterised by considerable scatter in the hardness (Hδ) values that influences theaccuracy of the determination of the residual lifetime. Nevertheless, the numberof hardness measurements required for the desired degree of precision could beestimated with the help of statistical analysis; practically realistic numbers have beenobtained. The sensitivity of the new approach to determine the hardness and tofollow hardness changes over time in relation to physical ageing is similar to theapproach used in a previous study. However, the current approach is simpler andmore robust, being one step closer to practical implementation.
The failure behaviour of uPVC pipes is shown to be strongly dependent on thetemperature and the degree of physical ageing at a constant level of gelation.Severly aged uPVC pipes showed a higher ductile-to-brittle transition temperatureupon impact testing than younger uPVC pipes. The change in the ductile-to-brittletransition temperature could be predicted quantitatively from the ageing behaviour.The underlying criterion was that the transition occurred if a certain critical tensileyield stress level is reached upon impact testing that is independent of time andtemperature. Practical tests, such as the pipe saw test, can be employed to determinethe relevant value of the limiting tensile yield stress for prediction of the residuallifetime of uPVC pipes.
The prediction of the residual lifetime of a uPVC pipe depends strongly on thedevelopment of the yield stress over time, i.e. the ageing kinetics. A large variationin ageing rates was observed for a broad range of excavated and unused gas andwater distribution uPVC pipes. An in-depth study of the origin of the differencesin ageing rates was conducted according to the various stages in the lifetime ofuPVC pipes: polymerisation, processing and service life. Properties related to thepolymerisation stage of uPVC (chain structure, chain length and crystallinity) are notrelated to the variations in ageing rates observed. These variations seem to originatefrom the processing stage, where various additives, such as stabilisers, lubricantsand fillers, are mixed with the uPVC powder. However, the correlation between theageing rate and the presence of lead and PE wax, for example, is not very strong.Regarding the service stage, the physical/chemical changes of the PVC materials asa result of interactions between components in the surrounding soil and the leadstabilisers are not primarily responsible for the variation in ageing rates. Furtherresults regarding the service stage seem to imply that the variation in ageing rates ofpipes produced before 1980 is greater than after that year. In the early years of uPVCpipe production considerable variation in the processing conditions and compositionsoccurred, possibly explaining the observed differences. After 1980, uPVC pipes wereproduced mainly for water distribution. In addition, an interesting relationshipbetween the ageing rate and the temperature at the maximum loss angle of the β-relaxation has been observed. A higher β-relaxation temperature corresponds witha lower ageing rate. It suggests that molecular movements responsible for the β-relaxation and the physical ageing rate are related. The relationship also makes it
7.2. Recommendations 121
possible to determine the ageing rate more quickly than by using uniaxial tensileexperiments, as commonly performed up to now.
The level of gelation of uPVC pipes is another crucial factor in the determinationof the condition of a uPVC pipe. A systemic study of potential useful methods ofdetermining the level of gelation in a uPVC pipe was unsuccessful. No techniquecurrently exists that is able to determine the level of gelation non-destructively,through the thickness of the pipe wall and from the inside of the pipe. The mainlimitation is the presence of regions with low levels of gelation in the interior of thepipe wall. A possible alternative is the newly proposed micro Methylene Chloride(microMC) test, which is a modified version of the commonly applied MethyleneChloride Temperature (MCT) test. The level of gelation of a uPVC pipe is determinedon the basis of chemical attack within a small concavity milled into the inside of apipe wall. As such, it seems more appropriate for the determination of the level ofgelation in relatively thick-walled water distribution pipes than in thin-walled gasdistribution pipes.
The results of this research provide a large step towards the realisation of residuallifetime assessment of uPVC pipes in practice. Additional research is required for theimplementation of the residual lifetime assessment method. The recommendationsfor additional research are given in the next section.
7.2 Recommendations
In this thesis, it was shown that physical ageing increases the hardness (and yieldstress) and causes embrittlement as shown in Chapters 2 and 3 respectively. However,the relation between hardness and embrittlement has only been shown for a few PVCpipe materials. For practical implementation of the residual lifetime method, it isrecommended to confirm the relation for a large set of uPVC pipes taken from thedistribution networks. On the basis of this result it can be decided to prepare themicro-Vickers hardness-based approach for in-situ pipe inspections.
In the hardness approach presented, the reference level for determining the indentdepth and hardness Hδ is assessed from the topology data of the surface region closeto the indent. It has been shown that the reference level is particularly sensitive to thesurface roughness present. It is recommended to determine the surface region of theindent prior to and after the hardness measurement and subtract the measurementdata. It is expected that this procedure strongly reduces the variation in hardnessvalues and makes the approach more suitable to determine the residual lifetime.Further aspects worth consideration are miniaturisation of the device, reduction inthe recovery and measurement time, influence of the applied load, and reduction inthe number of measurements by proper preparation of the inner wall (see Chapter 2).

122 Chapter 7. Conclusions and Recommendations
The expected influence of the level of gelation on the limiting tensile yield stress hasbeen shown qualitatively in Chapter 3. Only uPVC pipes having very low levels ofgelation are expected to have a marked influence on the limiting yield stress andthe residual lifetime. Saw tests on uPVC pipes having large differences in levels ofgelation should be performed to confirm this expectation.
The variation in ageing rates of uPVC pipes could be attributed to the processingstage; the concentration of lead, PE wax and chalk strongly affects the ageingrate. Further research is required so as to determine exactly which lead componentinfluences the ageing rate. Furthermore, the underlying mechanisms for themolecular interactions between these additives and the PVC polymer are unknownand should be elaborated on.
It is not yet possible to determine the ageing rate without having to dig up the pipeand determine the location of the maximum of the β-relaxation peak in a DMAexperiment. A practical recommendation to still determine the ageing rate non-destructively and without excavation activities is to perform several measurementsof the hardness of the pipe over time. In the course of time, more data will becomeavailable and the ageing rate and residual lifetime can be adjusted.
The level of gelation can be assessed virtually non-destructively employing the newlydeveloped microMC method presented in Chapter 5. However, the potential of themethod was shown only for a small number of pipes. The microMC experimentsshould be performed on a large collection of excavated PVC pipes to assess whetherthe method yields reliable results in practice. Based on this result, the microMCmethod can be prepared for employment inside buried uPVC pipes.
Lastly, for determining the yield stress and the level of gelation of uPVC pipesin service, it is recommended to combine the hardness method and the microMCmethod. Firstly, polish a part of the inner wall surface and carry out hardnessmeasurements on the polished surface to determine the yield stress. Secondly, applythe microMC method to the polished surface area of the inner wall to determine thegelation level. The network operator can then determine the residual lifetime fromthe limiting tensile yield stress and the ageing kinetics of the yield stress. The limitingtensile yield stress follows from the level of gelation and the ageing kinetics followsfrom the hardness measurement data.

Appendix A
Table with pipes
Table A.1 The ageing rate and dimensions of excavated and unused uPVC pipes in this thesis. Theageing rates are given in the second column with the 95%-confidence intervals in brackets.
Pipe No.[-]
1234567
89
1011121314
Ageing Rate
(95% CI)
[MPa/decade]
4.17 (± 0.72)3.75 ( 0.24)±
3.14 ( 0.78)±2.52 ( 0.35)±2.78 ( 0.25)±2.17 ( 0.21)±1.05 ( 0.09)±
1.88 ( 0.35)±1.86 ( 0.31)±2.25 ( 0.52)±2.50 ( 0.36)±2.22 ( 0.47)±2.24 ( 0.38)±
-
Diameter[mm]
160110
83110
110160
60
110
505050
50110
320
Thickness[mm]
4.12.9
3.03.0
2.94.2
2.2
2.7
2.32.32.3
2.33.0
8.115 - 600 18
123

124 Appendix A. Table with pipes

Appendix B
Details of experimental analysis
In this appendix, a detailed description is given in which way the values of thematerial properties of the PVC pipes were determined using the experimentaltechniques described in Section 4.3. The ageing rate and values of all other materialproperties are summarised in Figure 4.2 and Table 4.3 respectively.
B.1 Properties related to polymerisation
A typical 13C NMR spectrum of PVC dissolved in THF-d8 is displayed in Figure B.1left. The peaks at ∼25 ppm and ∼67 ppm have been attributed to the solvent THF-d8 [135], and the peaks at ∼45 ppm and ∼57 ppm to PVC [136]. Figure B.1 rightshows a section of the spectrum in the region of carbon atoms in the −CHCl−partof the PVC polymer chain [113, 134]. The concentration of each type of triad* wascalculated from the relative areas of the carbon peaks [113]. The maximum variationin the triad concentrations in the PVC pipes is about 8%.
A typical 1H NMR spectrum of PVC is shown in Figure B.2 left. The number ofcarbon double bonds NC=C per 1000 monomer units is determined by [110]
NC=C =As
ACHCl· 1000, (B.1)
where As is the area of the group of hydrogen resonance peaks between 5.6 ppmand 6.0 ppm which are assigned to the hydrogen atoms in the chain parts denoted inthe legend in Figure B.2 right. Carbon double bonds are located in these chain partsand thus the area As is directly related to the concentration of carbon double bonds.The area ACHCl is assigned to hydrogen atoms in the −CHCl−part of the polymerchain. The double carbon bond concentration in the PVC pipes investigated is about2-3 double bonds per 1000 monomer units.
*A triad is a segment of the polymer chain consisting of three monomer units.
125

126 Appendix B. Details of experimental analysis
0 20 40 60 80 100 120Chemical shift [ppm]
Inte
nsi
ty
PVC
THF−d8
THF−d8
55 56 57 58 59 60Chemical shift [ppm]
Inte
nsi
ty
Isotactic
Heterotactic
Syndiotactic
Figure B.1 (left) An 13C-NMR spectrum of PVC isolated for pipe 1. (right) a section of the spectrumshowing resonance peaks of carbons in the −CHCl−part of the polymer chain [113, 134].The groups of carbon peaks located at 56.5, 57.3 and 58.4 ppm are attributed to the isotactic,heterotactic and syndiotactic triads of the PVC chains respectively [113].
The K value (molecular weight) of most pipes is about 67. Excavated pipes 3 and 4have a higher K value (73-74). These pipes were installed in 1967 and 1961respectively. Around this period, a PVC powder having a higher K value was usedin processing.
0 1 2 3 4 5 6Chemical shift [ppm]
Inte
nsi
ty
THF−d8
THF−d8
THF−d8
PVC
PVC
Figure B.2 An 1H spectrum of PVC which was isolated from pipe 4. (Left) the peaks at 1.8 ppm,2.7 ppm and 3.6 ppm are of THF-d8 [135]. (Right) a section of the spectrum showingresonance peaks related to the hydrogen atoms in the -CHCl-chain parts. The hydrogenatoms in the chain parts responsible for the group of peaks located between 5.6 ppm and6.0 ppm are underlined in the legend [109, 192].

B.2. Properties related to processing 127
B.2 Properties related to processing
The crystalline fraction, the level of gelation, the processing temperature, the relativeconcentrations of additives and the glass transition temperature were determinedusing DSC. In Figure B.3 left two typical DSC measurements are shown in which thequantities of interest are labelled. The level of gelation G was determined accordingto the equation
G(%) =∆HA
∆HA + ∆HB· 100%, (B.2)
where ∆HA and ∆HB are the melt enthalpies of the secondary and primarycrystallites, respectively [126]. The processing temperature Tp is defined as thetemperature at which the primary crystallites start to melt and is a measure for themaximum temperature the material endured during extrusion [125]. The level ofgelation increases with increasing processing temperature [125, 126], which is alsoobserved here and shown in Figure B.3 right.
Figure B.3 The heat flow versus the temperature for (left) pipes 1 and 13 and (right) for pipes 10-13. The endotherms H1, H2 and H3 were observed in the temperature ranges 99-105 ◦C,106-110 ◦C and 112-120 ◦C respectively.
The level of gelation of pipes 10-13 corresponds with the level of gelation specifiedby the manufacturer. The crystalline fraction in PVC pipes is defined as the sum ofthe enthalpies of the endotherms HA and HB divided by the enthalpy Hcr for thecrystalline phase [115, 118]. A value of Hcr equal to 3 kJ/mol is selected, adoptedfrom [115, 118]. The endotherms H1, H2 and H3 are a consequence of the meltingof (molecular) additives in the PVC pipes. The enthalpies of all endotherms weredetermined using linear baselines. The glass transition temperature Tg is determinedfrom the corresponding jump in the heat flow.
The concentrations of various fatty acids were determined using GC-MS. A chro-matogram of a TMSH treated filtrate of pipe 3 is given in Figure B.4. The arrows
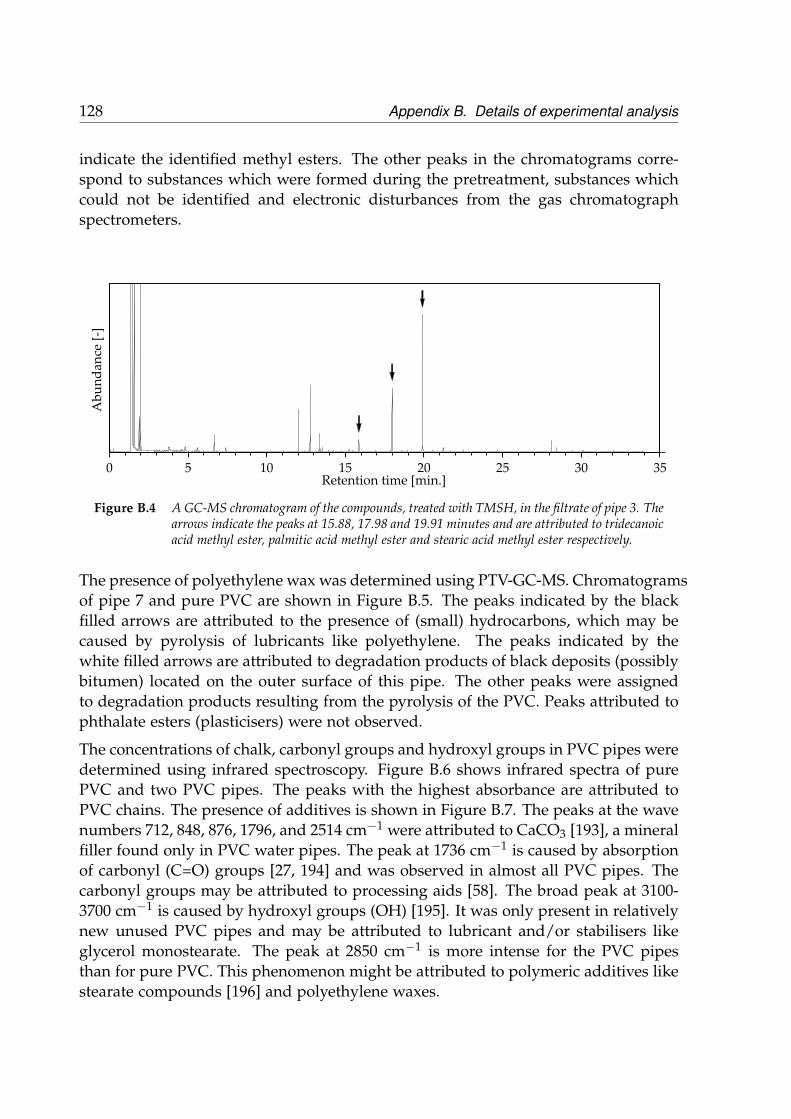
128 Appendix B. Details of experimental analysis
indicate the identified methyl esters. The other peaks in the chromatograms corre-spond to substances which were formed during the pretreatment, substances whichcould not be identified and electronic disturbances from the gas chromatographspectrometers.
0 5 10 15 20 25 30 35
Retention time [min.]
Ab
un
dan
ce [
-]
Figure B.4 A GC-MS chromatogram of the compounds, treated with TMSH, in the filtrate of pipe 3. Thearrows indicate the peaks at 15.88, 17.98 and 19.91 minutes and are attributed to tridecanoicacid methyl ester, palmitic acid methyl ester and stearic acid methyl ester respectively.
The presence of polyethylene wax was determined using PTV-GC-MS. Chromatogramsof pipe 7 and pure PVC are shown in Figure B.5. The peaks indicated by the blackfilled arrows are attributed to the presence of (small) hydrocarbons, which may becaused by pyrolysis of lubricants like polyethylene. The peaks indicated by thewhite filled arrows are attributed to degradation products of black deposits (possiblybitumen) located on the outer surface of this pipe. The other peaks were assignedto degradation products resulting from the pyrolysis of the PVC. Peaks attributed tophthalate esters (plasticisers) were not observed.
The concentrations of chalk, carbonyl groups and hydroxyl groups in PVC pipes weredetermined using infrared spectroscopy. Figure B.6 shows infrared spectra of purePVC and two PVC pipes. The peaks with the highest absorbance are attributed toPVC chains. The presence of additives is shown in Figure B.7. The peaks at the wavenumbers 712, 848, 876, 1796, and 2514 cm−1 were attributed to CaCO3 [193], a mineralfiller found only in PVC water pipes. The peak at 1736 cm−1 is caused by absorptionof carbonyl (C=O) groups [27, 194] and was observed in almost all PVC pipes. Thecarbonyl groups may be attributed to processing aids [58]. The broad peak at 3100-3700 cm−1 is caused by hydroxyl groups (OH) [195]. It was only present in relativelynew unused PVC pipes and may be attributed to lubricant and/or stabilisers likeglycerol monostearate. The peak at 2850 cm−1 is more intense for the PVC pipesthan for pure PVC. This phenomenon might be attributed to polymeric additives likestearate compounds [196] and polyethylene waxes.

B.2. Properties related to processing 129
0 5 10 15 20 25 30 350
0.5
1
1.5
2x 10
5
Retention time [min.]
Ab
un
dan
ce [
-]
pure PVC
pipe 7
Figure B.5 PTV-GC-MS chromatograms of pipe 7 and pure PVC. The black filled arrows at the peaksat retention times 3.03, 4.11, 4.24, 6.07 and 8.18 minutes are attributed to small amounts ofpentane, butene, hexane, heptane and octane respectively. The white filled arrows indicate thepeaks at 21.32, 28.59, 29.54, 30.47, 33.67 minutes were attributed to degradation products[lauric acid and hydrocarbons (C24H50 and C26H54)] of black deposits (bitumen) located onthe outer surface of this pipe.
400 900 1400 1900 2400 2900 3400 3900 4400
Wavenumber [cm−1
]
Ab
sorb
an
ce [
−]
pure PVC
4
8
Figure B.6 Infrared spectra of pipes 4 and 8 and of pure PVC.
Figure B.8 shows peaks at 1536 and 1570 cm−1 which are attributed to carboxylatesalts containing carboxylate ions (COO−) [138, 194, 196–198]. The peak at 1468 cm−1
is attributed to vibrations of methylene bridges (-CH2-) in carboxylate salts [196].Carboxylate salts are commonly used as stabilisers in PVC pipes. The presenceof carboxylate salts was observed for all PVC pipes and was added in relativelysmall amounts. To summarise, the presence of processing aids and stabilisers wereobserved for all PVC pipes. At first sight, large differences in the applied formulationof the PVC pipes were not observed.
The weight percentage of chalk in the PVC pipes was determined by comparingthe absorbance ratios A876/A695 and A1795/A695 with the same ratios for PVC pipes
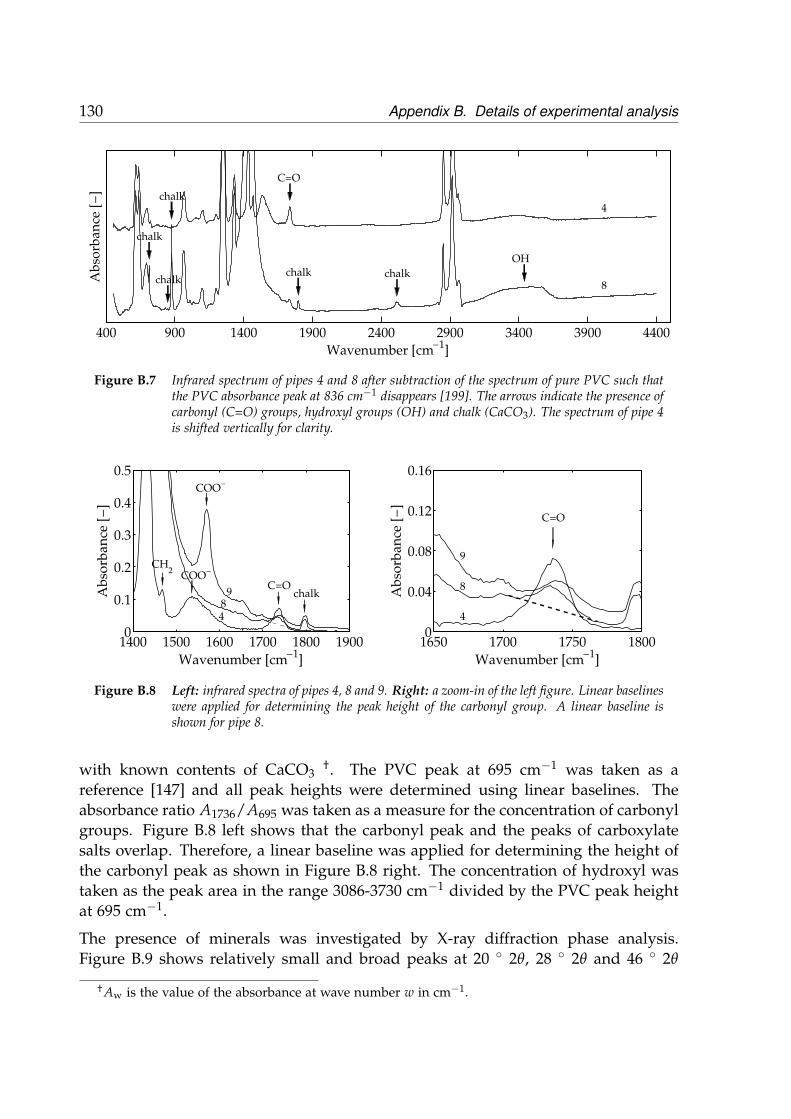
130 Appendix B. Details of experimental analysis
400 900 1400 1900 2400 2900 3400 3900 4400
Wavenumber [cm−1
]
Ab
sorb
an
ce [
−]
C=O
OH
chalk
chalk
chalk
chalk chalk8
4
Figure B.7 Infrared spectrum of pipes 4 and 8 after subtraction of the spectrum of pure PVC such thatthe PVC absorbance peak at 836 cm−1 disappears [199]. The arrows indicate the presence ofcarbonyl (C=O) groups, hydroxyl groups (OH) and chalk (CaCO3). The spectrum of pipe 4is shifted vertically for clarity.
1400 1500 1600 1700 1800 19000
0.1
0.2
0.3
0.4
0.5
Wavenumber [cm−1
]
Ab
sorb
an
ce [
−]
C=Ochalk
CH2
COO−
COO−
8
4
9
1650 1700 1750 18000
0.04
0.08
0.12
0.16
Wavenumber [cm−1
]
Ab
sorb
an
ce [
−]
C=O
8
4
9
Figure B.8 Left: infrared spectra of pipes 4, 8 and 9. Right: a zoom-in of the left figure. Linear baselineswere applied for determining the peak height of the carbonyl group. A linear baseline isshown for pipe 8.
with known contents of CaCO3†. The PVC peak at 695 cm−1 was taken as a
reference [147] and all peak heights were determined using linear baselines. Theabsorbance ratio A1736/A695 was taken as a measure for the concentration of carbonylgroups. Figure B.8 left shows that the carbonyl peak and the peaks of carboxylatesalts overlap. Therefore, a linear baseline was applied for determining the height ofthe carbonyl peak as shown in Figure B.8 right. The concentration of hydroxyl wastaken as the peak area in the range 3086-3730 cm−1 divided by the PVC peak heightat 695 cm−1.
The presence of minerals was investigated by X-ray diffraction phase analysis.Figure B.9 shows relatively small and broad peaks at 20 ◦ 2θ, 28 ◦ 2θ and 46 ◦ 2θ
† Aw is the value of the absorbance at wave number w in cm−1.

B.3. Properties related to molecular mobility 131
Figure B.9 X-ray spectra of excavated pipes (1-7) and of unused pipes 8, 9 and 10.
which are attributed to reflections of the PVC crystallites. The small height and therelatively large width of the peaks show that the PVC crystallites are relatively smalland that the crystalline fraction in the PVC pipes is relatively low. The broad peakat 8 ◦ 2θ is attributed to clusters of packed crystallites [116, 187]. The sharp peaksare attributed to small concentrations of chalk (CaCO3), titanium dioxide (TiO2, apigment [58]), silicon dioxide (SiO2, a filler [58]) and lead sulphide (PbS). The X-ray diffraction phase analysis confirms the presence of chalk determined by infraredspectroscopy.
B.3 Properties related to molecular mobility
The molecular mobility as a function of temperature was determined by characteris-ing the β-relaxation peak using DMA. The maximum loss angle and the temperatureat maximum loss angle were determined by spline approximation procedures.

132 Appendix B. Details of experimental analysis

Appendix C
Multi-variable analysis
A multi-variable analysis is included to aid the investigation of the background ofthe potential influence of all properties shown in Table 4.1. For simplicity, onlylinear regression models were used. Other models involving squared terms, power-law terms and cross terms were considered, but these models did not yield usefulinformation. Furthermore, it was only sensible to incorporate not more than twoproperties in a multi-variable model, because of the limited number of investigatedpipes. The general form of a linear regression model having two properties xi1 andxi2 is given by [200]
σ̇y,i = c0 + c1xi1 + c2xi2 + εi, (C.1)
where σ̇y,i are the experimentally determined ageing rates, c0, c1 and c2 the regressioncoefficients and εi the error. The index i indicates the pipe number. It should benoted that the two properties in the model must be independent of each other toavoid collinearity between both properties.
The multi-variable analysis was conducted by applying the following steps: (i)Determine which of the pairs of properties are independent. The criterion for apair of properties regarded as independent is if the coefficient of determinationR2 from a linear fit between the two properties is less than 0.10. (ii) Incorporatetwo independent properties in Equation C.1 and determine the adjusted coefficientof determination R2
adj . (iii) Repeat step (ii) for all pairs of independent properties.
The R2adj is defined as [200]
R2adj = 1− (1− R2)
n− 1n− p− 1
, (C.2)
where R2 is coefficient of determination, p the number of properties (in this study
133

134 Appendix C. Multi-variable analysis
p=2) and n the number of pipes included into the regression model*.
It is important to note that, because of limited resources, certain properties werenot determined for all pipes. As a result, the number of data points for fitting theregression coefficients cj is reduced if one of the properties in the model containsfewer data points. The reduction in the number of data points can cause an increasein the R2
adj value. This effect has been taken into account by considering only thosemodels for which a reasonable number of data points is available.
*The R2adj adjusts for the number of properties p in a combination relative to the number of data
points n. Unlike R2 , R2adj increases only when a new property is included if the new property improves
the R2 more than would be expected by chance.

135Table
C.1
TheR
2adj valuesfor
pairsofindependent
properties(R
2≤
0.10).The
R2
valuesfor
linearregression
between
theageing
rateand
asingle
propertyare
shown
inthe
bottomrow
.
X.X
X-
X.X
X-
Pro
perty
No
.1
24
56
710
1112
1415
1613
38
9
Po
lym
erisation
Pro
cessing
con
ditio
ns
stabilisers
Sta
ge
Pro
perty
descrip
tion
1234567891011121314151617181920212223242526272829
do
ub
le carbo
n b
on
d co
ncen
tration
con
centratio
nco
ncen
tration
con
centratio
n
isotactic triad
hetero
tactic triadsy
nd
iotactic triad
-valu
e (mo
lecular w
eigh
t)cry
stalline fractio
nKlev
el of g
elation
pro
cessing
temp
erature
stearic acid co
ncen
tration
palm
itic acid co
ncen
tration
tridecan
oic acid
con
centratio
n
presen
ce of P
E w
ax
lead co
ncen
tration
zinc co
ncen
tration
sulp
hate (S
O) co
ncen
tration
relative h
yd
rox
yl g
rou
p (O
H) co
ncen
tration
relative carb
on
yl g
rou
p (C
=O) co
ncen
tration
chalk
(CaC
O) co
ncen
tration
silicon
dio
xid
e (SiO
) presen
cetitan
ium
dio
xid
e (TiO
) presen
ced
iameter
wall th
ickn
essch
lorid
e (Cl -) co
ncen
tration
melt en
thalp
y 1
melt en
thalp
y 2
melt en
thalp
y 3
2-
3
2
2
lead su
lph
ide (P
bS
) presen
ceex
cavated
/un
used
year o
f pro
du
ction
303132
ββ
-relaxatio
n lo
ss ang
le-relax
ation
temp
erature
glass tran
sition
temp
erature
X.X
X0.26
-0.95
X.X
XX
.XX
X.X
X
1-X
.XX
-X
.XX
X.X
X-
X.X
XX
.XX
X.X
X-
X.X
XX
.XX
X.X
XX
.XX
-
X.X
X0.09
-0.32
-
X.X
X
X.X
X
--0.25X
.XX
-0.92X
.XX
X.X
X
-0.23-0.93X
.XX
X.X
X
X.X
X
X.X
XX
.XX
0.280.37
X.X
X
X.X
XX
.XX
X.X
X
X.X
X
0.590.670.78
0.65
0.190.35
-0.14X
.XX
X.X
XX
.XX
0.40X
.XX
X.X
X
0.44-0.050.04
0.02-0.05
-0.15-0.15
X.X
XX
.XX
0.050.53
-0.90
X.X
XX
.XX
X.X
X
0.08X
.XX
X.X
XX
.XX
X.X
X
-0.30
0.06X
.XX
X.X
XX
.XX
-0.30
-0.96
X.X
XX
.XX
X.X
XX
.XX
X.X
X0.17
X.X
X-
Cla
sscry
st.ch
ain stru
cture
4
lub
ricants
17
aid
R2
[%]
0 20 40 60 80100
0.01-0.02-0.05-0.32-0.09X
.XX
X.X
XX
.XX
X.X
XX
.XX
X.X
X0.52
X.X
XX
.XX
X.X
X
X.X
X0.43
0.31
0.290.20
0.020.23
X.X
XX
.XX
X.X
XX
.XX
X.X
X
X.X
X
X.X
X
X.X
XX
.XX
X.X
XX
.XX
-0.79X
.XX
X.X
XX
.XX
-0.97-0.980.37
-0.79
-0.04-0.14
-0.91
-0.94
X.X
X
X.X
XX
.XX
X.X
X
X.X
X-
X.X
X-
X.X
X-
X.X
X-
X.X
X-
X.X
X-
X.X
X-
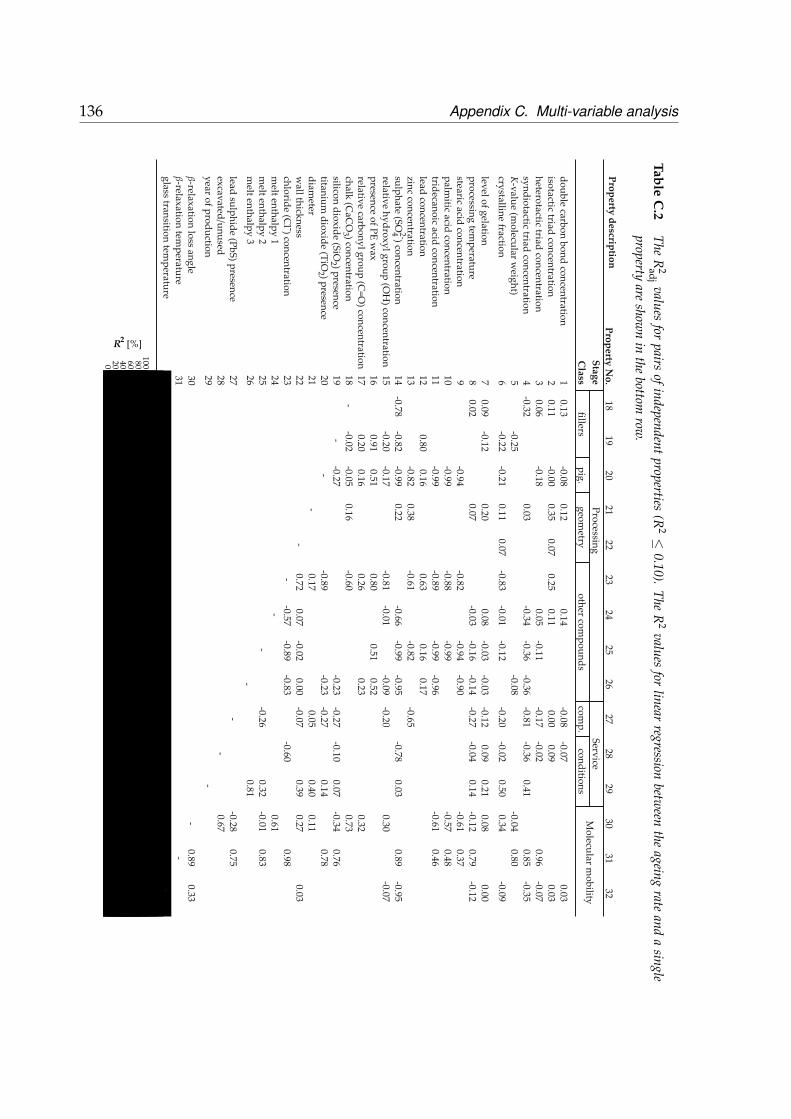
136 Appendix C. Multi-variable analysisTable
C.2
TheR
2adj valuesfor
pairsofindependent
properties(R
2≤
0.10).The
R2
valuesfor
linearregression
between
theageing
rateand
asingle
propertyare
shown
inthe
bottomrow
.
X.X
X-
Pro
perty
No
.21
2728
3132
2622
2930
Pro
cessing
Serv
ice
2019
Mo
lecular m
ob
ilityp
ig.
Sta
ge
fillerso
ther co
mp
ou
nd
s
1823
2425
geo
metry
Pro
perty
descrip
tion
1234567891011121314151617181920212223242526272829
do
ub
le carbo
n b
on
d co
ncen
tration
con
centratio
nco
ncen
tration
con
centratio
n
isotactic triad
hetero
tactic triadsy
nd
iotactic triad
-valu
e (mo
lecular w
eigh
t)cry
stalline fractio
nKlev
el of g
elation
pro
cessing
temp
erature
stearic acid co
ncen
tration
palm
itic acid co
ncen
tration
tridecan
oic acid
con
centratio
n
presen
ce of P
E w
ax
lead co
ncen
tration
zinc co
ncen
tration
sulp
hate (S
O) co
ncen
tration
relative h
yd
rox
yl g
rou
p (O
H) co
ncen
tration
relative carb
on
yl g
rou
p (C
=O) co
ncen
tration
chalk
(CaC
O) co
ncen
tration
silicon
dio
xid
e (SiO
) presen
cetitan
ium
dio
xid
e (TiO
) presen
ced
iameter
wall th
ickn
essch
lorid
e (Cl -) co
ncen
tration
melt en
thalp
y 1
melt en
thalp
y 2
melt en
thalp
y 3
2-
3
2
2
lead su
lph
ide (P
bS
) presen
ceex
cavated
/un
used
year o
f pro
du
ction
303132
ββ
-relaxatio
n lo
ss ang
le-relax
ation
temp
erature
glass tran
sition
temp
erature
0.13
-0.32
0.110.06
X.X
XX
.XX
X.X
XX
.XX
X.X
XX
.XX
-0.22-0.25
-0.08-0.00-0.18
-0.21
X.X
XX
.XX
0.12
0.03
0.11
0.35X
.XX
X.X
X
X.X
X0.07
0.07
X.X
XX
.XX
X.X
X
X.X
X0.25
-0.83
X.X
XX
.XX
X.X
X
-0.08
-0.81
0.00-0.17
-0.20X
.XX
-0.070.09
-0.02-0.36
-0.02X
.XX
X.X
XX
.XX
X.X
X0.41
0.50X
.XX
X.X
XX
.XX
X.X
XX
.XX
-0.040.34
X.X
XX
.XX
0.960.850.80
X.X
X
0.030.03
-0.07-0.35
-0.09X
.XX
0.090.02
-0.78
X.X
XX
.XX
X.X
XX
.XX
X.X
X
X.X
XX
.XX
X.X
X
-0.12
0.80
-0.82-0.200.910.20
-0.02
X.X
XX
.XX
X.X
XX
.XX
X.X
X
X.X
XX
.XX
-0.99
-0.94-0.99
0.16-0.82-0.99-0.170.510.16
-0.05-0.27
0.200.07
0.380.22
0.16
X.X
XX
.XX
X.X
XX
.XX
X.X
XX
.XX
X.X
X
X.X
XX
.XX
0.08-0.03
-0.66-0.01
0.07-0.57
X.X
XX
.XX
X.X
XX
.XX
X.X
X
X.X
XX
.XX
X.X
XX
.XX
X.X
XX
.XX
X.X
XX
.XX
X.X
X
X.X
X
-0.82-0.88-0.890.63
-0.61
-0.810.800.26
-0.60
-0.890.170.72
-0.12-0.27
-0.65
-0.20
-0.27-0.270.05
-0.07
X.X
XX
.XX
X.X
XX
.XX
X.X
X
X.X
XX
.XX
X.X
X
X.X
XX
.XX
X.X
XX
.XX
-0.26
0.09-0.04
-0.78
-0.10
-0.60
X.X
XX
.XX
X.X
XX
.XX
X.X
X
X.X
XX
.XX
X.X
XX
.XX
X.X
XX
.XX
X.X
X
X.X
XX
.XX
X.X
X
0.210.14
0.070.140.400.39
X.X
XX
.XX
X.X
XX
.XX
X.X
X
X.X
XX
.XX
X.X
XX
.XX
X.X
XX
.XX
0.03
0.320.81
X.X
X
X.X
XX
.XX
X.X
XX
.XX
X.X
XX
.XX
X.X
XX
.XX
X.X
X
X.X
X
0.790.370.480.46
0.89
0.760.78
0.98
0.83
0.08-0.12-0.61-0.57-0.61
0.30
0.320.73
-0.34
0.110.27
X.X
XX
.XX
X.X
X
X.X
X
X.X
X
X.X
X
X.X
X
0.61-0.01
0.00-0.12
-0.95-0.07
0.03
X.X
XX
.XX
X.X
XX
.XX
X.X
X
X.X
XX
.XX
X.X
XX
.XX
X.X
XX
.XX
X.X
XX
.XX
X.X
XX
.XX
-X
.XX
-X
.XX
X.X
X-0.280.67
X.X
X
0.75X
.XX
X.X
X
X.X
XX
.XX
X.X
X
-0.89
0.33X
.XX
-
-
-
-
-
-
-
-
-
Cla
ssco
mp
.co
nd
ition
s
4
R2
[%]
0 20 40 60 80100
0.14
- 0.110.05
-0.34
0.01X
.XX
X.X
XX
.XX
X.X
X
-0.11-0.36
-0.12
X.X
XX
.XX
X.X
X
X.X
X
-0.36-0.08
X.X
X-
X.X
X-
-0.03-0.16-0.94-0.99-0.990.16
-0.82-0.99
0.51
-0.02-0.89
X.X
X
X.X
XX
.XX
X.X
XX
.XX
X.X
X
X.X
X
-0.03-0.14-0.90
-0.960.17
-0.95-0.090.520.23
-0.23-0.23
0.00-0.83
X.X
X
X.X
X
X.X
X
X.X
X
X.X
XX
.XX

References
[1] A.C. Schouten. Een plastic buizennet te Ootmarsum. Het Gas, 78(8):159–161, 1957 (inDutch).
[2] J. Worp. Een en ander over hard PVC-buis en haar toepassingsmogelijkheden. HetGas, 78(1):2–12, 1957 (in Dutch).
[3] T.G. Meijering, P. Benjamin, and K. Eygelaar. Moleculaire biorientatie van PVC/CPEgasbuizen. Gas, 9:367–384, 1986 (in Dutch).
[4] I.N. Vloerbergh and E.J.M. Blokker. Statistische storingsanalyse - De mogelijkheden enbeperkingen van de huidige storingsregistratie. Technical report, Kiwa WaterResearch, 2007 (in Dutch).
[5] C.E. Anastassakis. Biaxially oriented rigid PVC pipes. In Proceedings of IUPACInternational Symposium on Interrelations Between Processing, Structure, andProperties of Polymeric Materials., 459–470. Athens, Greece, 1982.
[6] S.C.B. van Amersfoort. Overzicht graafschade in 2013. Technical report, 2014 (inDutch).
[7] Dutch Drinking and Water Statistics. Dutch drinking water statistics 2012. Technicalreport, Vewin, 2012.
[8] Data provided by the participating water network operator Vitens in 2014.[9] A. Hendriks. Storingsrapportage gasdistributienetten 2008. Technical report,
Netbeheer Nederland, Arnhem, The Netherlands, 2009 (in Dutch).[10] R.J.M. Hermkens, M. Wolters, J. Weller, and H.A. Visser. PVC pipes in gas distribution:
still going strong! In Proceedings of Plastics Pipes XIV. Budapest, Hungary, 2008.[11] G.P. Marshall and M.W. Birch. Criteria for high toughness in uPVC pressure pipes. In
Proceedings of Plastics Pipes V, 1–19. York, UK, 1982.[12] L.S. Burn. Lifetime prediction of uPVC pipes: Experimental and theoretical
comparisons. Plastics Rubber and Composites Processing and Applications, 21(2):99–108,1994.
[13] K.V. Gotham and M.J. Hitch. Factors affecting fatigue resistance in rigid uPVC pipecompositions. British Polymer Journal, 10(1):47–52, 1978.
[14] D.R. Moore, P.P. Benham, K.V. Gotham, M.J. Hitch, and M.J. Littlewood. Long-termfracture performance of uPVC pressure pipe as influenced by processing. Plastics andRubber: Materials and Applications, 5(4):146–150, 1980.
[15] Y.W. Mai and P.R. Kerr. Effect of processing on fracture toughness and fatigue crackpropagation in unplasticized polyvinyl chloride (uPVC). Journal of Vinyl Technology,7(4):130–139, 1985.
[16] B. Terselius, J.F. Jansson, and J. Bystedt. Gelation of PVC, Part 4: Impact strength.Plastics and Rubber Processing and Applications, 5(1):1–7, 1985.
137

138 References
[17] P. Benjamin. The influence of the extrusion process on the quality of unplasticizedpolyvinyl chloride (UPVC) pressure pipe. Journal of Vinyl and Additive Technology,2(4):254–258, 1980.
[18] T. Kuriyama, I. Narisawa, R. Shina, and M. Kotaki. Effects of morphology on thefracture toughness of PVC-U pipe. Journal of Vinyl and Additive Technology,4(3):164–168, 1998.
[19] T.G. Meijering. De restkwaliteit van PVC gasleidingen. Gas, 12:3–10, 1985 (in Dutch).[20] H.J.M. Rijpkema and M. Wolters. Service life analysis of PVC gas pipes in practice: A
predictable behaviour! In Proceedings of Plastics Pipes VIII, 1–10. Eindhoven, TheNetherlands, 1992.
[21] L.-A. Fillot, P. Hajji, C. Gauthier, and K. Masenelli-Varlot. Thermomechanical historyeffects on rigid PVC microstructure and impact properties. Polymer, 104(3):2009–2017,2007.
[22] N. Walker, R.N. Haward, and J.N. Hay. Plastic fracture in poly(vinyl chloride). Journalof Materials Science, 14(5):1085–1094, 1979.
[23] J. Breen. Quality of PVC sewage pipes in the Netherlands. Technical report, TNO,2008.
[24] D.P. Jones, D.C. Leach, and D.R. Moore. The application of instrumented fallingweight impact techniques to the study of toughness in thermoplastics. Plastics andRubber Processing and Applications, 6(1):67–79, 1986.
[25] G. Roux and P.A. Eurin. Indentation test for predicting embrittlement of rigid PVC byweathering. Journal of Macromolecular Science, Part B, B20(4):505–517, 1981.
[26] E.B. Rabinovitch, J.W. Summers, and W.E. Northcott. Changes in properties of rigidPVC during weathering. Journal of Vinyl Technology, 15(4):214–218, 1993.
[27] I. Hussain, S.H. Hamid, and J.H. Khan. Polyvinyl chloride pipe degradation studies innatural environments. Journal of Vinyl and Additive Technology, 1(3):137–141, 1995.
[28] C. Anton-Prinet, G. Mur, M. Gay, L. Audouin, and J. Verdu. Change of mechanicalproperties of rigid poly(vinyl chloride) during photochemical ageing. Journal ofMaterials Science, 34(2):379–384, 1999.
[29] K.S. Minsker and G.E. Zaikov. Achievements and research tasks for poly(vinylchloride) ageing and stabilization. Journal of Vinyl and Additive Technology, 7(4):222–234,2001.
[30] S. Burn, P. Davis, T. Schiller, B. Tiganis, G. Tjandraatmadja, M. Cardy, S. Gould, P.Sadler, and A. Whittle. Long-term performance prediction for PVC pipes. Technicalreport, Awwa research foundation, 2004.
[31] J. Wolf. Stress-cracking in hard PVC gasbuizen. Gas, 87:433–442, 1967 (in Dutch).[32] J. Breen and D.J. van Dijk. Environmental stress cracking of PVC: Effects of natural gas
with different amounts of benzene. Journal of Materials Science, 26(19):5212–5220, 1991.[33] J. Breen. Environmental stress cracking of PVC and PVC-CPE, Part I Crazing. Journal
of Materials Science, 28(14):3769–3776, 1993.[34] J. Breen. Environmental stress cracking of PVC and PVC-CPE, Part II Failure
mechanisms. Journal of Materials Science, 29(1):39–46, 1994.[35] J. Breen. Environmental stress cracking of PVC and PVC-PCE; Part III Crack growth.
Journal of Materials Science, 30(22):5833–5840, 1995.

References 139
[36] J.A. Juijn, J.H. Gisolf, and W.A. Jong. Crystallinity in atactic poly(vinyl chloride).Kolloid-Zeitschrift und Zeitschrift für Polymere, 251(7):456–473, 1973.
[37] J.M. Hutchinson. Physical aging of polymers. Progress in Polymer Science,20(4):703–760, 1995.
[38] A.L. Volynskii, A.V. Efimov, and N.F. Bakeev. Structural aspects of physical aging ofpolymer glasses. Polymer Science - Series C, 49(4):301–320, 2007.
[39] J.H. Golden, B.L. Hammant, and E.A. Hazell. The effect of thermal pretreatment onthe strength of polycarbonate. Journal of Applied Polymer Science, 11(8):1571–1579, 1967.
[40] H.A. Visser, T.C. Bor, M. Wolters, J.G. F. Wismans, and L.E. Govaert. Lifetimeassessment of load-bearing polymer glasses: The influence of physical ageing.Macromolecular Materials and Engineering, 295(12):1066–1081, 2010.
[41] T.E. Brady and G.S.Y. Yeh. Yielding behavior of glassy amorphous polymers. Journal ofApplied Physics, 42(12):4622–4630, 1971.
[42] G.A. Adam, A. Cross, and R.N. Haward. The effect of thermal pretreatment on themechanical properties of polycarbonate. Journal of Materials Science, 10(9):1582–1590,1975.
[43] A. Cross, R.N. Haward, and N.J. Mills. Post yield phenomena in tensile tests onpoly(vinyl chloride). Polymer, 20(3):288–294, 1979.
[44] H.G.H. Van Melick, L.E. Govaert, and H.E.H. Meijer. Localisation phenomena inglassy polymers: Influence of thermal and mechanical history. Polymer,44(12):3579–3591, 2003.
[45] H.A. Visser, T.C. Bor, M. Wolters, L.L. Warnet, and L.E. Govaert. Influence of physicalaging on impact embrittlement of uPVC pipes. Plastics, Rubber and Composites,40(5):201–212, 2011.
[46] L.C.E. Struik. Physical aging in amorphous polymers and other materials. ElsevierScientific Publishing Company, New York, USA, 1st edition, 1978.
[47] H.A. Visser. Residual lifetime assessment of uPVC gas pipes. Ph.D. thesis, Universityof Twente, The Netherlands, 2010. ISBN 9789036529587.
[48] E. Dertien, S. Stramigioli, and K. Pulles. Development of an inspection robot for smalldiameter gas distribution mains. In Proceedings of International Conference onRobotics and Automation, 5044–5049. Shanghai, China, 2011.
[49] E. Dertien. Design of an inspection robot for inspection of small diameter gasdistribution mains. Ph.D. thesis, University of Twente, The Netherlands, 2014. ISBN9789036536813.
[50] E. Dertien, M.M. Foumashi, K. Pulles, and S. Stramigioli. Design of a robot for in-pipeinspection using omnidirectional wheels and active stabilization. In Proceedings ofInternational Conference on Robotics and Automation, 5121–5126. Hong Kong, China,2014.
[51] A. Demcenko, R. Akkerman, P.B. Nagy, and R. Loendersloot. Non-collinear wavemixing for non-linear ultrasonic detection of physical ageing in PVC. NDT and EInternational, 49:34–39, 2012.
[52] S.B. Ainbinder and M.G. Laka. Hardness of polymers. Mekhanika Polimerov,2(3):337–349, 1966.
[53] P.J. Phillips, N.R. Ramakrishnan, and P.L.S. Oxlade. Hardness testing of plastics.

140 References
Polymer Engineering and Science, 18(11):869–874, 1978.[54] F.J. Baltá-Calleja, D.S. Sanditov, and V.P. Privalko. Review: The microhardness of
non-crystalline materials. Journal of Materials Science, 37(21):4507–4516, 2002.[55] A. Flores, F. Ania, and F.J. Baltá-Calleja. From the glassy state to ordered polymer
structures: A microhardness study. Polymer, 50(3):729–746, 2009.[56] J.A. Bailey, J. Barsom, P. Blau, and K. Budinski. ASM Handbook Volume 8 -
Mechanical testing and evaluation. ASM International, Russell Township, USA, 1stedition, 2000. ISBN 9780871703897.
[57] Japanese Industrial Standards. JIS B 7730:2010 - Rockwell hardness test - Calibration ofreference blocks. Technical report, Japanese Industrial Standards (JIS), 2010.
[58] C.E. Wilkes, J.W. Summers, C.A. Daniels, and M.T. Berard. PVC Handbook. HanserPublications, Cincinnati, USA, 1st edition, 2005. ISBN 1569903794.
[59] E.B. Rabinovitch and D. Harshbarger. Gloss control in rigid PVC - Part I. Techniquesfor gloss assessment of rigid PVC profiles. Journal of Vinyl and Additive Technology,6(4):171–175, 2000.
[60] E.B. Rabinovitch and D. Harshbarger. Gloss control in rigid PVC - Part II. Effect ofprocessing variables on the gloss of rigid PVC profiles. Journal of Vinyl and AdditiveTechnology, 6(4):4–8, 2000.
[61] D.L. Dunkelberger and S.J. Fitzwater. Gloss control additives for PVC. Journal of VinylTechnology, 12(1):28–33, 1990.
[62] D. Whitehouse. Profile and areal (3D) parameter characterization. In Surfaces andTheir Measurement, chapter 3, 48–95. Kogan Page Science, Oxford, UK, 1st edition,2002. ISBN 9781903996010.
[63] E.T.J. Klompen, T.A.P. Engels, L.E. Govaert, and H.E.H. Meijer. Modeling of thepostyield response of glassy polymers: Influence of thermomechanical history.Macromolecules, 38(16):6997–7008, 2005.
[64] D. Moore, G. McCabe, W.M. Duckworth, and L. Alwan. The practice of businessstatistics using data for decisions. W.H. Freeman and Company, New York, USA, 2ndedition, 2008. ISBN 9780716788256.
[65] J. Weller, E.J.W. Van Der Stok, and R.J.M. Hermkens. Tensile impact experiments ofPVC-U at wide range of temperatures. In Proceedings of Plastic Pipes XVI, 1–10.Barcelona, Spain, 2012.
[66] G. Peilstocker. The temperature behaviour of polycarbonate. British Plastics,35:365–369, 1962.
[67] K. H. Illers. Influence of thermal history upon physical properties of PVC. Journal ofMacromolecular Science, Part B, 14(4):471–482, 1977.
[68] E.B. Rabinovitch. The effect of physical aging on properties of rigid polyvinylchloride. Journal of Vinyl Technology, 14(3):126–130, 1992.
[69] N. Yarahmadi, I. Jakubowicz, and T. Hjertberg. The effects of heat treatment andageing on the mechanical properties of rigid PVC. Polymer Degradation and Stability,82(1):59–72, 2003.
[70] B. Cora, B. Daumas, and A. Zegers. Impact strength and morphology in poly(vinylchloride) window profiles-relationship with gelation level. Plastics, Rubber andComposites, 28(4):165–169, 1999.

References 141
[71] P. Benjamin. Quality and quality control of unplasticised polyvinylchloride (uPVC)pressure pipes. Plastics and Rubber: Materials and Applications, 5(4):151–160, 1980.
[72] H.-S. Kim, B. Cotterell, and Y.-W. Mai. Unnotched impact bend test assessment of thedegree of gelation in unplasticized poly(vinyl chloride) pipe. Polymer Engineering andScience, 27(4):277–281, 1987.
[73] D.G. Legrand. Crazing, yielding, and fracture of polymers. I. Ductile brittle transitionin polycarbonate. Journal of Applied Polymer Science, 13(10):2129–2147, 1969.
[74] M. Ishikawa, I. Narisawa, and H. Ogawa. Criterion for craze nucleation inpolycarbonate. Journal of Polymer Science: Polymer Physics Edition, 15(10):1791–1804,1977.
[75] E.J. Kramer. Microscopic and molecular fundamentals of crazing. In H.H. Kausch,editor, Advances in Polymer Science - Crazing in Polymers, volume 52/53, chapter 1,1–56. Springer-Verslag Berlin Heidelberg, Berlin, Germany, 1st edition, 1983. ISBN9783540125716.
[76] M. Ishikawa and I. Narisawa. The effect of heat treatment on plane strain fracture ofglassy polymers. Journal of Materials Science, 18(9):2826–2834, 1983.
[77] H.G.H. van Melick, O.F.J.T. Bressers, J.M.J. den Toonder, L.E. Govaert, and H.E.H.Meijer. A micro-indentation method for probing the craze-initiation stress in glassypolymers. Polymer, 44(8):2481–2491, 2003.
[78] T.A.P. Engels, L.C.A. van Breemen, L.E. Govaert, and H.E.H. Meijer. Criteria to predictthe embrittlement of polycarbonate. Polymer, 52(8):1811–1819, 2011.
[79] R.A. Chivers and D.R. Moore. Further developments in the interpretation of signalsfrom instrumented falling weight impact (IFWI). Measurement Science and Technology,1(4):313–321, 1990.
[80] J.F. Mandell, A.Y. Darwish, and F.J. McGarry. Effects of processing conditions andaging on the fracture toughness of rigid PVC pipe materials. Journal of VinylTechnology, 4(3):95–100, 1982.
[81] H.A. Visser, T.C. Bor, M. Wolters, T.A.P. Engels, and L.E. Govaert. Lifetime assessmentof load-bearing polymer glasses: An analytical framework for ductile failure.Macromolecular Materials and Engineering, 295(7):637–651, 2010.
[82] Y. Ishida. Dielectric relaxation of high polymers in the solid state. Journal of PolymerScience Part A-2, 7(11):1835–1861, 1969.
[83] L.A. Utracki and J.A. Jukes. Dielectric studies of poly(vinyl chloride). Journal of VinylTechnology, 6(2):85–94, 1984.
[84] J.A. Roetling. Yield stress behaviour of polymethylmethacrylate. Polymer, 6(6):311–317,1965.
[85] J.A. Roetling. Yield stress behaviour of poly(ethyl methacrylate) in the glass transitionregion. Polymer, 6(11):615–619, 1965.
[86] J.A. Roetling. Yield stress behaviour of isotactic polypropylene. Polymer, 7(7):303–306,1966.
[87] C. Bauwens-Crowet, J.-C. Bauwens, and G. Homes. Tensile yield-stress behavior ofglassy polymers. Journal of Polymer Science Part A-2: Polymer Physics, 7(4):735–742, 1969.
[88] T. Ree and H. Eyring. Theory of non-newtonian flow. I. Solid plastic system. Journal ofApplied Physics, 26(7):793–800, 1955.
142 References
[89] H. Eyring. Viscosity, plasticity, and diffusion as examples of absolute reaction rates.The Journal of Chemical Physics, 4(4):283–291, 1936.
[90] C. Bauwens-Crowet and J.-C. Bauwens. Effect of thermal history on the tensile yieldstress of polycarbonate in the β transition range. Polymer, 24(7):921–924, 1983.
[91] C. Ho Huu and T. Vu-Khanh. Effects of physical aging on yielding kinetics ofpolycarbonate. Theoretical and Applied Fracture Mechanics, 40(1):75–83, 2003.
[92] S. Ohta, T. Kajiyama, and M. Takayanagi. Annealing effect on the microstructure ofpoly(vinyl chloride). Polymer Engineering and Science, 16(7):465–472, 1976.
[93] C. Tsitsilianis, M. Tsapatsis, and Ch. Economou. Effects of crystallinity on ageingphenomena in poly(vinyl chloride). Polymer, 30(10):1861–1866, 1989.
[94] J. Yuan, A. Hiltner, and E. Baer. The mechanical properties of PVC under highpressure. Journal of Materials Science, 18(10):3063–3071, 1983.
[95] H.A. Visser, R.J.M. Hermkens, M. Wolters, J. Weller, and L.L. Warnet. Excellent impactperformance of PVC pipeline materials in gas distribution networks after many yearsof service. In Proceedings of International Gas Union Research Conference, 1–16.Paris, France, 2008.
[96] J.W. Summers, E.B. Rabinovitch, and J.G. Quisenberry. Polyvinyl chloride processingmorphology: Part III - Twin screw extrusion. Journal of Vinyl Technology, 4(2):67–69,1982.
[97] B. Terselius, J.F. Jansson, and J. Bystedt. Gelation of rigid PVC-pipes. Journal ofMacromolecular Science, Part B, 20(3):403–414, 1981.
[98] J.W. Summers. Lubrication mechanism of poly(vinyl chloride) compounds: Changesupon PVC fusion (gelation). Journal of Vinyl and Additive Technology, 11(2):57–62, 2005.
[99] E. Drenth, T.C. Bor, H.A. Visser, and M. Wolters. Influence of the level of gelation onphysical ageing kinetics of uPVC pipes. In abstract book of 15th InternationalConference on Deformation, Yield and Fracture of Polymers, 1–4. Kerkrade, TheNetherlands, 2012.
[100] G.B. McKenna. Mechanical rejuvenation in polymer glasses: Fact or fallacy? Journal ofPhysics: Condensed Matter, 15(11):S737–S763, 2003.
[101] J.T.A Kierkels, C.-L. Dona, T.A. Tervoort, and L.E. Govaert. Kinetics ofre-embrittlement of (anti)plasticized glassy polymers after mechanical rejuvenation.Journal of Polymer, 46(2):134–147, 2008.
[102] J.L. Gomez Ribelles, R. Diaz-Calleja, R. Ferguson, and J.M.G. Cowie. Glass transitionand physical ageing in plasticized poly(vinyl chloride). Polymer, 28(13):2262–2266,1987.
[103] P. Rittigstein and J.M. Torkelson. Polymer-nanoparticle interfacial interactions inpolymer nanocomposites: Confinement effects on glass transition temperature andsuppression of physical aging. Journal of Polymer Science Part B: Polymer Physics,44(20):2935–2943, 2006.
[104] J.L. Koenig and M.K. Antoon. Thermally induced conformational changes inpoly(vinyl chloride). Journal of Polymer Science: Polymer Physics Edition,15(8):1379–1395, 1977.
[105] P. Cortés and S. Montserrat. Physical aging studies of amorphous linear polyesters.Part II. Dependence of structural relaxation parameters on the chemical structure.

References 143
Journal of Polymer Science Part B: Polymer Physics, 36(1):113–126, 1998.[106] S.-N. Lee, V. Stolarski, A. Letton, and J. Laane. Studies of bisphenol-A polycarbonate
aging by Raman difference spectroscopy. Journal of Molecular Structure, 521(1-3):19–24,2000.
[107] M.J. Osborne and D.J. Lacks. Inherent structure analysis of the thermal historydependence of yielding in glasses. The Journal of Physical Chemistry B,108(51):19619–19622, 2004.
[108] S. Etienne, N. Hazeg, E. Duval, A. Mermet, A. Wypych, and L. David. Physical agingand molecular mobility of amorphous polymers. Journal of Non-Crystalline Solids,353(41-43):3871–3878, 2007.
[109] P. D’Antuono, E. Botek, B. Champagne, J. Wieme, M.-F. Reyniers, G.B. Marin, P.J.Adriaensens, and J.M. Gelan. A joined theoretical-experimental investigation on the1H and 13C NMR signatures of defects in poly(vinyl chloride). The Journal of PhysicalChemistry B, 112(47):14804–14818, 2008.
[110] A. Caraculacu and E. Bezdadea. Determination of unsaturated structures in poly(vinylchloride) by means of fourier transform 1H-NMR spectroscopy. Journal of PolymerScience, Polymer Chemistry Edition, 15(3):611–620, 1977.
[111] A. Gray and M. Gilbert. Structural order in heat treated vinyl chloride polymers.Polymer, 17(1):44–50, 1976.
[112] M.R. Tant and G.L. Wilkes. Physical aging studies of semicrystalline poly(ethyleneterephthalate). Journal of Applied Polymer Science, 26(9):2813–2825, 1981.
[113] G. Martinez and J.L. Millan. Correlation between the tacticity and content of labilenondefect structures in poly(vinyl chloride). Journal of Polymer Science Part A: PolymerChemistry, 40(22):3944–3949, 2002.
[114] R.K. Krishnaswamy, J.F. Geibel, and B.J. Lewis. Influence of semicrystallinemorphology on the physical aging characteristics of poly(phenylene sulfide).Macromolecules, 36(8):2907–2914, 2003.
[115] M. Gilbert. Crystallinity in poly(vinyl chloride). Journal of Macromolecular Science. PartC, Reviews in Macromolecular Chemistry and Physics, C34(1):77–135, 1994.
[116] W. Wenig. The microstructure of poly(vinyl chloride) as revealed by X-ray and lightscattering. Journal of Polymer Science: Polymer Physics, 16(9):1635–1649, 1978.
[117] S.J. Guerrero, H. Veloso, and E. Randon. On the analysis of wide-angle X-raydiffraction curves of poly(vinyl chloride) samples. Polymer, 31(9):1615–1622, 1990.
[118] P.C. Dawson, M. Gilbert, and W.F. Maddams. Comparison of X-ray diffraction andthermal analysis methods for assessing order in poly(vinyl chloride). Journal ofPolymer Science Part B: Polymer Physics, 29(11):1407–1418, 1991.
[119] International Organization for Standardization. Determination of the viscosity ofpolymers in dilute solution using capillary viscometers - Part 1: General principles,2009.
[120] G. Pepperl. Molecular weight distribution of commercial PVC. Journal of Vinyl andAdditive Technology, 6(2):88–92, 2000.
[121] T. C. B. McLeish. Tube theory of entangled polymer dynamics. Advances in Physics,51(6):1379–1527, 2002.
[122] B. Terselius and J.F. Jansson. Gelation of PVC, Part 2: Effect on internal pressure

144 References
resistance. Plastics and Rubber Processing and Applications, 4(4):285–290, 1984.[123] B. Terselius and J.F. Jansson. Gelation of PVC, Part 3: Effect on tensile properties.
Plastics and Rubber Processing and Applications, 4(4):291–299, 1984.[124] B. Terselius and J.F. Jansson. Gelation of PVC, Part 5: Effect on structure and physical
properties. Plastics and Rubber Processing and Applications, 5(3):193–201, 1985.[125] M. Gilbert, D. Hemsley, and A. Miadonye. Assessment of fusion in PVC compounds.
Plastics and Rubber Processing and Applications, 3(4):343–351, 1983.[126] H. Potente and S.M. Schultheis. Bestimmung des Geliergrads von PVC mit der DSC.
Kunststoffe, 77(4):401–404, 1987 (in German).[127] J.W. Teh, A.A. Cooper, A. Rudin, and J.L.H. Batiste. Interpretation of DSC
measurements of the degree of fusion of rigid PVC. Journal of Vinyl and AdditiveTechnology, 11(1):33–41, 1989.
[128] L.-A. Fillot, P. Hajji, and C. Gauthier. U-PVC gelation level assessment, Part 2:Optimization of the differential scanning calorimetry technique. Journal of Vinyl andAdditive Technology, 12(3):108–114, 2006.
[129] P. Simon, J. OremusovÁ, and L. Valko. Influence of metal stearates on thermal stabilityof poly(vinyl chloride) IV. Lead stearate. Chemical Papers, 45(3):389–399, 1991.
[130] N. Kinjo and T. Nakagawa. Antiplasticization in the slightly plasticized poly(vinylchloride). Polymer Journal, 4(2):143–153, 1973.
[131] N. Guarrotxena, P. Tiemblo, G. Martinez, J.M. Gomez-Elvira, and J.L. Millan. Tacticityinduced molecular microstructure dependence of physical properties of polymers:Fundamentals and overview of some tentative correlations. European Polymer Journal,34(5):833–839, 1998.
[132] C.J. Carman, A.R. Tarpley, and J.H. Goldstein. High-temperature carbon-13 nuclearmagnetic resonance spectra of poly(vinyl chloride). Macromolecules, 4(4):445–447, 1971.
[133] N.I. Liu, S.N. Tong, and J.L. Koenig. Stereoregularity of PVC studied by 13C NMR.Journal of Applied Polymer Science, 25(10):2205–2210, 1980.
[134] K.-F. Elgert, R. Kosfeld, and W.E. Hull. Contribution to the solvent and temperaturedependence of C-13 NMR spectra from poly(vinyl chloride). Polymer Bulletin,4(5):281–284, 1981.
[135] G.R. Fulmer, A.J.M. Miller, N.H. Sherden, H.E. Gottlieb, A. Nudelman, B.M. Stoltz, J.E.Bercaw, and K.I. Goldberg. NMR chemical shifts of trace impurities: Commonlaboratory solvents, organics, and gases in deuterated solvents relevant to theorganometallic chemist. Organometallics, 29(9):2176–2179, 2010.
[136] G. Szarka, A. Domján, T. Szakács, and B. Iván. Oil from poly(vinyl chloride):Unprecedented degradative chain scission under mild thermooxidative conditions.Polymer Degradation and Stability, 97(9):1787–1793, 2012.
[137] O.P. Obande and M. Gilbert. Crystallinity changes during PVC processing. Journal ofApplied Polymer Science, 37(6):1713–1726, 1989.
[138] R. Kalouskova, M. Novotna, and Z. Vymazal. Investigation of thermal stabilization ofpoly(vinyl chloride) by lead stearate and its combination with synthetic hydrotalcite.Polymer Degradation and Stability, 85(2):903–909, 2004.
[139] Private communications with Polymer Serivce Centre, 2015.[140] M.L. Souza de, E.R. Souza de, P. Corio, and M.L.A. Temperini. Vibrational

References 145
characterisation of plasticized PVC by FTIR and FTRaman. In Modern Topics inRaman Spectroscopy. Sao Paulo, Brazil, 2006.
[141] R. Delhez, Th. H. De Keijser, and E.J. Mittemeijer. Determination of crystallite size andlattice distortions through X-ray diffraction line profile analysis. Fresenius’ Zeitschriftfür Analytische Chemie, 312(1):1–16, 1982.
[142] L. Zhang, M. Luo, S. Sun, J. Ma, and C. Li. Effect of surface structure of nano-CaCO3particles on mechanical and rheological properties of PVC composites. Journal ofMacromolecular Science, Part B, 49(5):970–982, 2010.
[143] G. Pezzin, G. Ajroldi, and C. Garbuglio. Dynamic-mechanical study of the secondarytransition of poly(vinyl chloride). Journal of Applied Polymer Science, 11(12):2553–2566,1967.
[144] N. Guarrotxena, M. de Frutos, and J. Retes. On a novel tentative stereochemicalmicrostructure based explanation of β-relaxation of poly(vinyl chloride) (PVC).European Polymer Journal, 41(12):2824–2830, 2005.
[145] T. Vilics and H.A. Schneider. A DMA study of the suppression of the β transition inslightly plasticized PVC blends. Journal of Thermal Analysis, 47(4):1141–1153, 1996.
[146] D. Porter and P.J. Gould. Predictive nonlinear constitutive relations in polymersthrough loss history. International Journal of Solids and Structures, 46(9):1981–1993, 2009.
[147] E.R. Harrell and R.P. Chartoff. The influence of crystallinity on the beta-transition inpoly(vinyl chloride). Polymer Engineering and Science, 14(5):362–365, 1974.
[148] D. Porter. Group interaction modelling of polymer properties. Marcel Dekker, Inc.,New York, USA, 1st edition, 1995. ISBN 0-8247-9599-7.
[149] A. Elicegui, J.J. del Val, V. Bellenger, and J. Verdu. A study of plasticization effects inpoly(vinyl chloride). Polymer, 38(7):1647–1657, 1997.
[150] N. Guarrotxena, J.J. Del Val, A. Elicegui, and J. Millan. A stereochemicalmicrostructure-based attempt to explain the dielectric behavior of poly(vinyl chloride)(PVC). Journal of Polymer Science Part B: Polymer Physics, 42(12):2337–2347, 2004.
[151] G. Pezzin, G. Ajroldi, T. Casiraghi, C. Garbuglio, and G. Vittadini.Dynamic-mechanical and tensile properties of poly(vinyl chloride). Influence ofthermal history and crystallinity. Journal of Applied Polymer Science, 16(7):1839–1849,1972.
[152] R.H. Boyd. Relaxation processes in crystalline polymers: Experimental behaviour - areview. Polymer, 26(3):323–347, 1985.
[153] J.L. Kalwak, D.J. van Dijk, and J.H. Gisolf. The influence of crystallinity on thesecondary glass transition in polycarbonate. Colloid and Polymer Science,255(5):428–432, 1977.
[154] J.A. Juijn, J.H. Gisolf, and W.A. Jong. Calorimetric study of first order transitions inpoly(vinyl chloride). Kolloid-Zeitschrift und Zeitschrift für Polymere, 235(1):1158–1161,1969.
[155] J.L. Kalwak, D.J. van Dijk, and J.H. Gisolf. The influence of crystallinity on thesecondary glass-transition in poly(vinyl chloride). Delft Progress Reports, Series A,1:131–136, 1976.
[156] J.-C. Bauwens. Relation between the compression yield stress of poly(vinyl chloride)and the loss peak in the β-transition range. Journal of Polymer Science Part C: Polymer

146 References
Symposia, 33(1):123–133, 1971.[157] R.H. Burgess. Manufacture and Processing of PVC. Elsevier Applied Science, London,
UK, 1982. ISBN 0203490568.[158] L.C. Uitenham and P. H. Geil. Processing, morphology, and properties of PVC. Journal
of Macromolecular Science, Part B, 20(4):593–622, 1981.[159] L.-A. Fillot, P. Hajji, C. Gauthier, and K. Masenelli-Varlot. U-PVC gelation level
assessment, Part 1: Comparison of different techniques. Journal of Vinyl and AdditiveTechnology, 12(3):98–107, 2006.
[160] J.W. Summers, E.B. Rabinovitch, and P.C. Booth. Measurement of PVC fusion(gelation). Journal of Vinyl and Additive Technology, 8(1):2–6, 1986.
[161] J.C. Chauffoureaux, C. Dehennau, and J. Rijckevorsel van. Flow and thermal stabilityof rigid PVC. Journal of Rheology, 23(1):1–24, 1979.
[162] P. Choi, M. Lynch, A. Rudin, J.W. Teh, and J. Batiste. DSC analysis of fusion level ofrigid PVC revisited: Filler effects on thermal analysis data. Journal of Vinyl and AdditiveTechnology, 14(3):156–160, 1992.
[163] P.J.F. Heuvel van der. PVC pressure pipes: The importance of gelation to ensure pipereliability. In Proceedings of Plastics Pipes V. York, UK, 1982.
[164] T. Sterzynski. Instabilities of the single-screw extrusion process. Polimery,44(7-8):558–560, 1999.
[165] O. Hunaidi, W. Chu, A. Wang, and W. Guan. Detecting leaks in plastic pipes. JournalAWWA, 92(2):82–94, 2000.
[166] Y.Y. Hung, Y.S. Chen, S.P. Ng, L. Liu, Y.H. Huang, B.L. Luk, R.W.L. Ip, C.M.L. Wu, andP.S. Chung. Review and comparison of shearography and active thermography fornondestructive evaluation. Materials Science and Engineering: R: Reports, 64(5-6):73–112,2009.
[167] C. Hellier. Handbook of nondestructive evaluation. McGraw-Hill Professional, NewYork, USA, 1st edition, 2001. ISBN 007139947X.
[168] P.A.M. Steeman. Interfacial phenomena in polymer systems. Ph.D. thesis, DelftUniversity, The Netherlands, 1992.
[169] B. Blümich, J. Perlo, and F. Casanova. Mobile single-sided NMR. Progress in NuclearMagnetic Resonance Spectroscopy, 52(4):197–269, 2008.
[170] J. Perlo, F. Casanova, and B. Blümich. Profiles with microscopic resolution bysingle-sided NMR. Journal of Magnetic Resonance, 176(1):64–70, 2005.
[171] A. Demcenko, V. Koissin, and V.A. Korneev. Noncollinear wave mixing formeasurement of dynamic processes in polymers: Physical ageing in thermoplasticsand epoxy cure. Ultrasonics, 52(2):684–693, 2013.
[172] W.W. Zhang and B.H. Zhuang. Non-contact laser inspection for the inner wall surfaceof a pipe. Measurement Science and Technology, 9(9):1380–1387, 1998.
[173] O. Duran, K. Althoefer, and L.D. Seneviratne. Automated pipe defect detection andcategorization using camera/laser-based profiler and artificial neural network.Automation Science and Engineering, 4(1):118–126, 2007.
[174] H. Schempf, E. Mutschler, A. Gavaert, G. Skoptsov, and W. Crowley. Visual andnondestructive evaluation inspection of live gas mains using the Explorer family ofpipe robots. Journal of Field Robotics, 27(3):217–249, 2010.

References 147
[175] M.W. Allsopp. Manufacturing and Processing of PVC: Chapter 8 - Mechanism ofgelation of rigid PVC. In Manufacturing and Processing of PVC, chapter 8, 183–213.Elsevier Applied Science, London, UK, 1982. ISBN 9780853349723.
[176] J.W. Summers and E.B. Rabinovitch. Use of acetone in determining poly(vinylchloride) processing morphology and product morphology. Journal of MacromolecularScience, Part B: Polymer Physics, B20(2):219–233, 1981.
[177] J.A. Covas, M. Gilbert, and D.E. Marshall. Twin screw extrusion of a rigid PVCcompound - Effect on fusion and properties. Plastics and Rubber Processing andApplications, 9(2):107–116, 1988.
[178] A.M. MacDonald, A.S. Vaughan, and P. Wyeth. On confocal Raman spectroscopy ofsemicrystalline polymers: The effect of optical scattering. Applied Spectroscopy,57(12):1475–81, 2003.
[179] R.P. Marques and J.A. Covas. Processing characteristics of U-PVC compounds.Technical report, Cires, Estarreja, Portugal, 2003.
[180] O.P. Obande and M. Gilbert. Effect of formulation and processing conditions on PVCfusion. Plastics and Rubber Processing and Applications, 10(4):231–238, 1988.
[181] J.A. Covas. Hardness measurement as a technique for assessing gelation of rigid PVCcompounds. Plastics and Rubber Processing and Applications, 9(2):91–97, 1988.
[182] Inversa Systems. Technical Description of BCT. Technical report, Inversa Systems,2015.
[183] K. Piszczek. Visualization of gelation inhomogeneity of PVC. Polymer Testing,22(1):115–119, 2003.
[184] M. Gilbert. Fusion of PVC compounds. Plastics and Rubber International, 10(3):16–19,1985.
[185] Private communications with dr. A. Demcenko., 2014.[186] D.J. Whitehouse, D.K. Bowen, V.C. Venkatesh, P. Lonardo, and C.A. Brown. Gloss and
surface topography. CIRP Annals-Manufacturing Technology, 43(2):541–549, 1994.[187] D.J. Blundell. Small-angle X-ray study of microdomains in rigid PVC. Polymer,
20(8):934–938, 1979.[188] D.G.H. Ballard, A.N. Burgess, J.M. Dekoninck, and E.A. Roberts. The ’crystallinity’ of
PVC. Polymer, 28(1):3–9, 1987.[189] N.A. Freebody, A.S. Vaughan, and A.M. Macdonald. On optical depth profiling using
confocal Raman spectroscopy. Analytical and Bioanalytical Chemistry, 396(8):2813–23,2010.
[190] H. Reinecke, S.J. Spells, J. Sacristan, J. Yarwood, and C. Mijangos. Confocal Ramandepth profiling of surface-modified polymer films: Effects of sample refractive index.Applied Spectroscopy, 55(12):1660–1664, 2001.
[191] N.J. Everall. Confocal Raman microscopy: Performance, pitfalls, and best practice.Applied Spectroscopy, 63(9):245–262, 2009.
[192] V. Percec, A.V. Popov, E. Ramirez-Castillo, J.F.J. Coelho, and L.A. Hinojosa-Falcon.Non-transition metal-catalyzed living radical polymerization of vinyl chlorideinitiated with iodoform in water at 25 C. Journal of Polymer Science Part A: PolymerChemistry, 42(24):6267–6282, 2004.
[193] J. Liu, J. Feng, W. Zhang, Y. Liu, Z. Wang, M. Zhao, and Y. Cai. Discrimination of

148 References
carbonate-containing and carbonate-free polyvinyl chloride with fourier transforminfrared microscopy and raman spectroscopy. Spectroscopy, 27(6):36–41, 2012.
[194] C. Anton-Prinet, G. Mur, M. Gay, L. Audouin, and J. Verduc. Photoageing of rigidPVC-I. Films containing Ca/Zn thermal stabiliser. Polymer Degradation and Stability,60(2-3):265–273, 1998.
[195] F. Vallat-Joliveau, A. Delahaye-Vidal, and M. Figlarz. Some structural and texturalaspects of tribasic lead sulfate precipitation during the mixing of lead-acid batterypositive paste. Journal of the Electrochemical Society, 142(8):2710–2716, 1995.
[196] L. Robinet and M.-C. Corbeil. The characterization of metal soaps. Studies inConservation, 48(1):23–40, 2003.
[197] R. Benavides, M. Edge, and N.S. Allen. The mode of action of metal stearate stabilisersin poly(vinyl chloride). I. Influence of pre-heating on melt complexation. PolymerDegradation and Stability, 44(3):375–378, 1994.
[198] M. Fisch and R. Bacaloglu. Study of additive compatibility with poly(vinyl chloride)(PVC). 2: Dynamic mechanical analysis of PVC lubrication by stearic acid and itsderivatives. Journal of Vinyl and Additive Technology, 4(1):4–11, 1998.
[199] B.C. Smith. Fundamentals of fourier transform infrared spectroscopy. CRC Press,Boca Raton, USA, 2011. ISBN 0849324610.
[200] D. Moore, G. McCabe, W.M. Duckworth, and L. Alwan. Multiple Regression. In Thepractice of business statistics using data for decisions, chapter 11, 618–635. W.H.Freeman and Company, New York, USA, 2nd edition, 2008. ISBN 9780716788256.

Dankwoord
’Against all odds ...’
Dit proefschrift is mede tot stand gekomen dankzij het werk en de steun van velen.In dit stukje wil ik het woord richten aan iedereen die (op de meest uiteenlopendemanieren) heeft bijgedragen aan de totstandkoming van dit boekje.
Allereerst wil ik mijn promotor Mannes Wolters bedanken. Nadat ik te horen kreegdat er een onderzoek liep naar restlevensduur van PVC buizen raakte ik meteengeïnteresseerd. Hij heeft het mogelijk gemaakt dat ik het onderzoek naar PVC buizenkon uitvoeren. Jouw begeleiding en gestructureerde aanpak heb ik als zeer prettigervaren. De kritische en opbouwende opmerkingen hebben een essentiële bijdragegeleverd aan het resultaat.
Ik wil mijn promotor Remko Akkerman bedanken voor het mogelijk maken dathet onderzoek uitgevoerd kon worden in de groep Productie Technologie. BedanktRemko voor jouw vriendelijke doch, kritische houding en voor dat ik ondanks jouwovervolle agenda toch kon binnenlopen voor adviezen.
Naast de professoren had ik ook twee (dagelijkse) begeleiders. Mijn copromotoren dagelijkse begeleider Ton Bor, ik heb je begeleiding als prettig ervaren. Hetis noemenswaardig hoe je elke keer weer ergens een oplossing voor kon vinden.Verder wil ik je bedanken voor de vele goede ideeën, adviezen en vooral voor hetgeduld tijdens het doornemen van het geschreven werk. Roy Visser, bedankt vooralle ondersteunende en motiverende adviezen, en goede begeleiding. Zonder julliegrote inzet was de totstandkoming van dit proefschrift niet mogelijk!
Ongeveer twee keer per jaar werden de onderzoeksresultaten gepresenteerd aande afgevaardigden van de netwerkbeheerders. Het contact met de praktijk is zeerbelangrijk geweest voor de inhoud van het proefschrift. Ruud de Boer, Dirk Dijkstra,Wim van Erp, Anne Fijma, Victor Guilloteaux, Elbert Huijzer, Egbert Jansen, RogerJanssen, Tinus de Lange, Carel Lauwereijs, Roger Loop, Pieter Mans, Eelco Trietsch,Dineke Voogt bedankt voor jullie waardevolle bijdrage vanuit de praktijk.
Tijdens dit promotieonderzoek is intensief samengewerkt met KIWA Gas Technology.Ik wil de volgende mensen bedanken voor de prettige en succesvolle samenwerking:Jan Breen, Jolanda Brugman, René Hermkens, Peter Postma, Frans Scholten, MatthijsSchrijver, Ernst van der Stok en Jeroen Weller.
149

Naast contacten met de industrie mocht contact met een andere universiteit (natuur-lijk) niet ontbreken. Graag wil ik Leon Govaert van de Technische UniversiteitEindhoven bedanken voor de gastvrijheid, de voorzieningen voor het preparen vanproefstukken, de waardevolle inhoudelijke input en voor het nemen van zitting inmijn promotiecommissie.
Ik wil Sonja Eijpe en haar collega’s van Polymer Service Centre in Groningenbedanken voor de uitvoering van chemisch/fysische analyses op de PVC materialenen voor de waardevolle discussies.
Naast de bovengenoemden zijn er een aantal mensen die ook een waardvolle bijdragehebben geleverd aan de totstandkoming van dit proefschrift. Graag wil ik dezemensen bedanken. Marinus Kremer, voor het uitvoeren van essentiële metingen opPVC materialen en de waardevolle inhoudelijke discussies. De door jou verkregengegevens waren een belangrijk startpunt voor het onderzoek naar de oorzaak vande verschillen in de verouderingssnelheid van uPVC buizen. Cees Otto en AufriedLenferink, voor het uitvoeren van inleidende Raman metingen en de inhoudelijkediscussies. Ine Segers, voor alle ondersteuning en discussies tijdens mijn vele urenachter de Raman microscoop. Matthijn de Rooij, voor jouw waardevolle bijdrage enenthousiasme met betrekking tot microhardheid en oppervlakteruwheid. Durk vanDijk, voor de waardevolle en plezierige discussies en het kritisch doornemen vangeschreven werk.
In de loop van de jaren heb ik een aantal kantoorgenoten gehad. Arnoud van derStelt, Ted Ooijevaar, Shaojie Liu (Lily), Vitali Koissin en Sergey Ivanov, bedankt vooralle steun en de gezellige gesprekken en discussies. Aan Arnoud en Ted: tijd vooreen hangplek en een red bull!
Naast kamergenoten wil ik ook graag een aantal andere personen bedanken voor degezelligheid, ondersteunende diensten en inzet. Bert Vos en Laura Vargas-Llona,bedankt voor de leuke gesprekken die we gehad hebben en voor de essentiëletechnische ondersteuning tijdens mijn promotietraject. Ivo Vrooijink, bedankt voorde technische ondersteuning en je snelle manier van handelen wanneer dit nodigwas. Martin Sprenkeler, bedankt voor de leuke gesprekken en de ondersteuning bijhet flansen in de werkplaats. Ik wil Belinda en Debbie bedanken voor jullie steun ende nodige administratieve zaken rondom het promotietraject. Erik de Vries, bedanktvoor je enthousiasme en interesse in mijn promotieonderwerp en het aanhoren vanmijn colleges. Derek Land, ik wil je bedanken voor de luxe Taiwanese thee en degezellige koffiepauzes.
Verder wil ik alle andere collegae van de groepen Productie Technologie enTechnische Mechanica bedanken voor alle gezelligheid en steun!
Maarten Broekroelofs en Frank Haverkort, bedankt dat jullie mijn paranimfen willenzijn.

Ik wil mijn familie en vrienden bedanken voor hun onmisbare steun en het aanhorenvan mijn verhalen over het promotieonderzoek.
De laatste woorden van het dankwoord zijn gericht aan jou, Yvonne. Ik wil jebedanken voor je oneindige geduld en begrip. Er zijn veel weekenden en avondenin de week voorbij gegaan dat ik niet bij je kon zijn. Je hebt me veel geholpen omdoor te zetten met het schrijven van het proefschrift en mij aangemoedigd wanneerik dat nodig had. Ik zie ernaar uit om samen dit jaar succesvol af te sluiten met deafronding van het promotietraject en ons nieuwe huis.
Emiel Drenth,
Apeldoorn, oktober 2015