High-resolution RH map of horse chromosome 22 reveals a putative ancestral vertebrate chromosome
13
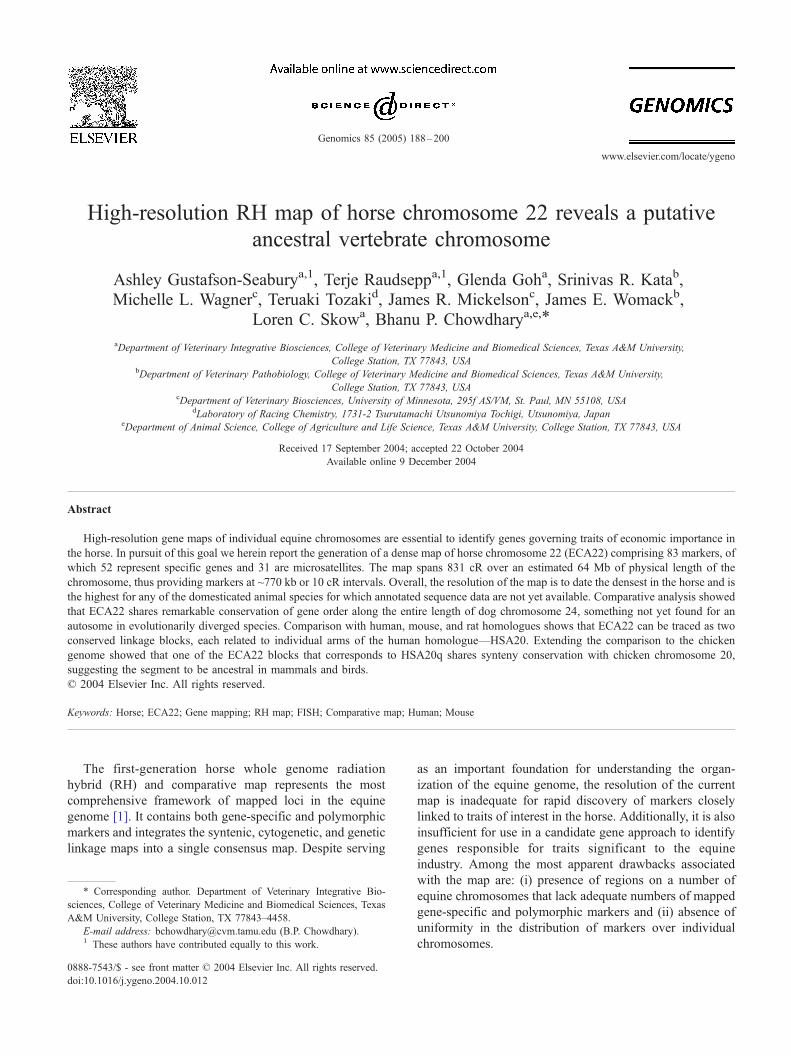
High-resolution RH map of horse chromosome 22 reveals a putative ancestral vertebrate chromosome Ashley Gustafson-Seabury a,1 , Terje Raudsepp a,1 , Glenda Goh a , Srinivas R. Kata b , Michelle L. Wagner c , Teruaki Tozaki d , James R. Mickelson c , James E. Womack b , Loren C. Skow a , Bhanu P. Chowdhary a,e, * a Department of Veterinary Integrative Biosciences, College of Veterinary Medicine and Biomedical Sciences, Texas A&M University, College Station, TX 77843, USA b Department of Veterinary Pathobiology, College of Veterinary Medicine and Biomedical Sciences, Texas A&M University, College Station, TX 77843, USA c Department of Veterinary Biosciences, University of Minnesota, 295f AS/VM, St. Paul, MN 55108, USA d Laboratory of Racing Chemistry, 1731-2 Tsurutamachi Utsunomiya Tochigi, Utsunomiya, Japan e Department of Animal Science, College of Agriculture and Life Science, Texas A&M University, College Station, TX 77843, USA Received 17 September 2004; accepted 22 October 2004 Available online 9 December 2004 Abstract High-resolution gene maps of individual equine chromosomes are essential to identify genes governing traits of economic importance in the horse. In pursuit of this goal we herein report the generation of a dense map of horse chromosome 22 (ECA22) comprising 83 markers, of which 52 represent specific genes and 31 are microsatellites. The map spans 831 cR over an estimated 64 Mb of physical length of the chromosome, thus providing markers at ~770 kb or 10 cR intervals. Overall, the resolution of the map is to date the densest in the horse and is the highest for any of the domesticated animal species for which annotated sequence data are not yet available. Comparative analysis showed that ECA22 shares remarkable conservation of gene order along the entire length of dog chromosome 24, something not yet found for an autosome in evolutionarily diverged species. Comparison with human, mouse, and rat homologues shows that ECA22 can be traced as two conserved linkage blocks, each related to individual arms of the human homologue—HSA20. Extending the comparison to the chicken genome showed that one of the ECA22 blocks that corresponds to HSA20q shares synteny conservation with chicken chromosome 20, suggesting the segment to be ancestral in mammals and birds. D 2004 Elsevier Inc. All rights reserved. Keywords: Horse; ECA22; Gene mapping; RH map; FISH; Comparative map; Human; Mouse The first-generation horse whole genome radiation hybrid (RH) and comparative map represents the most comprehensive framework of mapped loci in the equine genome [1]. It contains both gene-specific and polymorphic markers and integrates the syntenic, cytogenetic, and genetic linkage maps into a single consensus map. Despite serving as an important foundation for understanding the organ- ization of the equine genome, the resolution of the current map is inadequate for rapid discovery of markers closely linked to traits of interest in the horse. Additionally, it is also insufficient for use in a candidate gene approach to identify genes responsible for traits significant to the equine industry. Among the most apparent drawbacks associated with the map are: (i) presence of regions on a number of equine chromosomes that lack adequate numbers of mapped gene-specific and polymorphic markers and (ii) absence of uniformity in the distribution of markers over individual chromosomes. 0888-7543/$ - see front matter D 2004 Elsevier Inc. All rights reserved. doi:10.1016/j.ygeno.2004.10.012 * Corresponding author. Department of Veterinary Integrative Bio- sciences, College of Veterinary Medicine and Biomedical Sciences, Texas A&M University, College Station, TX 77843–4458. E-mail address: [email protected] (B.P. Chowdhary). 1 These authors have contributed equally to this work. Genomics 85 (2005) 188 – 200 www.elsevier.com/locate/ygeno
-
Upload
independent -
Category
Documents
-
view
0 -
download
0
Transcript of High-resolution RH map of horse chromosome 22 reveals a putative ancestral vertebrate chromosome
www.elsevier.com/locate/ygeno
Genomics 85 (20
High-resolution RH map of horse chromosome 22 reveals a putative
ancestral vertebrate chromosome
Ashley Gustafson-Seaburya,1, Terje Raudseppa,1, Glenda Goha, Srinivas R. Katab,
Michelle L. Wagnerc, Teruaki Tozakid, James R. Mickelsonc, James E. Womackb,
Loren C. Skowa, Bhanu P. Chowdharya,e,*
aDepartment of Veterinary Integrative Biosciences, College of Veterinary Medicine and Biomedical Sciences, Texas A&M University,
College Station, TX 77843, USAbDepartment of Veterinary Pathobiology, College of Veterinary Medicine and Biomedical Sciences, Texas A&M University,
College Station, TX 77843, USAcDepartment of Veterinary Biosciences, University of Minnesota, 295f AS/VM, St. Paul, MN 55108, USA
dLaboratory of Racing Chemistry, 1731-2 Tsurutamachi Utsunomiya Tochigi, Utsunomiya, JapaneDepartment of Animal Science, College of Agriculture and Life Science, Texas A&M University, College Station, TX 77843, USA
Received 17 September 2004; accepted 22 October 2004
Available online 9 December 2004
Abstract
High-resolution gene maps of individual equine chromosomes are essential to identify genes governing traits of economic importance in
the horse. In pursuit of this goal we herein report the generation of a dense map of horse chromosome 22 (ECA22) comprising 83 markers, of
which 52 represent specific genes and 31 are microsatellites. The map spans 831 cR over an estimated 64 Mb of physical length of the
chromosome, thus providing markers at ~770 kb or 10 cR intervals. Overall, the resolution of the map is to date the densest in the horse and is
the highest for any of the domesticated animal species for which annotated sequence data are not yet available. Comparative analysis showed
that ECA22 shares remarkable conservation of gene order along the entire length of dog chromosome 24, something not yet found for an
autosome in evolutionarily diverged species. Comparison with human, mouse, and rat homologues shows that ECA22 can be traced as two
conserved linkage blocks, each related to individual arms of the human homologue—HSA20. Extending the comparison to the chicken
genome showed that one of the ECA22 blocks that corresponds to HSA20q shares synteny conservation with chicken chromosome 20,
suggesting the segment to be ancestral in mammals and birds.
D 2004 Elsevier Inc. All rights reserved.
Keywords: Horse; ECA22; Gene mapping; RH map; FISH; Comparative map; Human; Mouse
The first-generation horse whole genome radiation
hybrid (RH) and comparative map represents the most
comprehensive framework of mapped loci in the equine
genome [1]. It contains both gene-specific and polymorphic
markers and integrates the syntenic, cytogenetic, and genetic
linkage maps into a single consensus map. Despite serving
0888-7543/$ - see front matter D 2004 Elsevier Inc. All rights reserved.
doi:10.1016/j.ygeno.2004.10.012
* Corresponding author. Department of Veterinary Integrative Bio-
sciences, College of Veterinary Medicine and Biomedical Sciences, Texas
A&M University, College Station, TX 77843–4458.
E-mail address: [email protected] (B.P. Chowdhary).1 These authors have contributed equally to this work.
as an important foundation for understanding the organ-
ization of the equine genome, the resolution of the current
map is inadequate for rapid discovery of markers closely
linked to traits of interest in the horse. Additionally, it is also
insufficient for use in a candidate gene approach to identify
genes responsible for traits significant to the equine
industry. Among the most apparent drawbacks associated
with the map are: (i) presence of regions on a number of
equine chromosomes that lack adequate numbers of mapped
gene-specific and polymorphic markers and (ii) absence of
uniformity in the distribution of markers over individual
chromosomes.
05) 188–200
A. Gustafson-Seabury et al. / Genomics 85 (2005) 188–200 189
To date very few genes controlling traits of economic
significance have been identified in the horse. Among the
genes identified include those governing monogenic traits,
e.g., coat color and some inherited diseases [2]. The
discoveries of most of these genes were facilitated by
knowledge of homologous genes for similar phenotypes in
humans or other mammalian species. Thus an a priori
knowledge of the causative gene and its mutation led to the
identification of the equine ortholog and its causative
mutation. However, most of the future research aimed at
identifying genes governing economically important traits in
the horse will require a set of genome-wide polymorphic
markers (genome scan panel) appropriate to the population
to be analyzed and high-resolution physically ordered
comparative maps to align the horse map accurately with
its mammalian counterparts. The latter will be critical for the
candidate gene approach used for isolating genes potentially
implicated in the hereditary condition analyzed. The recent
development of the high-resolution RH and comparative
map for horse chromosome 17 [3] and the X chromosome [4]
represents the first steps toward targeted expansion of gene
maps in the horse to obtain dense maps. Though the
approach used for these two chromosomes has provided
resolutions ranging between 1.4 to 1 Mb per marker, it
involved alignment of sequence from multiple species,
identification of conserved regions, and tedious development
of primer pairs to obtain horse-specific amplification [3,4].
Overgos (overlapping oligonucleotide primer pairs) are
probes that hybridize to conserved genomic regions (primar-
ily exons) and can be used for improved multiprobe high-
density filter hybridization to enable rapid identification of
BAC clones containing specific markers [5,6]. To improve
upon the development of expanded gene maps in the horse,
we used this approach to generate a high-resolution RH and
comparative map of horse chromosome 22 (ECA22).
Comparative analysis shows that ECA22 and its homologues
in various mammalian species represent one of the most
conserved genomic segments across a range of evolutionarily
diverged species [7]. The chromosome corresponds to
human chromosome 20 (HSA20) [8], which contains genes
implicated in, for example, spongiform encephalopathies
[9,10], Kindler syndrome [11], and congenital hereditary
endothelial dystrophy of the cornea [12,13].
The current map of ECA22 contains a total of 23 markers
(7 genes/ESTs and 16 microsatellites), assigned by RH and
linkage analysis [1,14,15]. Of the three linkage groups, only
two are physically aligned to the chromosome. The
proximal one-third of the chromosome has very few mapped
markers. To remedy these deficiencies, we undertook
development of a high-resolution map of the chromosome
with the goal of defining gene-specific markers at every
megabase interval. This would finely align ECA22 to the
human and mouse chromosomes, facilitate identification of
candidate loci for various equine conditions associated with
genes located on this chromosome, and help to understand
the relative organization and hence evolution of the
homologues of this chromosome among different mam-
mals/vertebrates.
Results
Overgo hybridization and isolation of BAC clones
containing targeted genes
A total of 45 overgo probes were designed within
conserved regions of genes selected at ~1 Mb intervals
from the terminal part of the short arm to the terminal part of
the long arm of HSA20. The first pooled hybridization with
18 overgo probes for genes located on HSA20p to the high-
density filters of the CHORI-241 horse genomic BAC
library yielded 63 BACs. The second pooled hybridization
with 27 overgo probes representing genes from HSA20q
yielded 103 BACs. The rearray and hybridization of the
positive BACs with individual overgo probes indicated that
4 of the probes from the short arm, and 8 from the long arm,
failed to identify any BACs. Thus, of the 45 overgo probes,
BAC clones were obtained for 33 sets, averaging 5.2 BACs/
overgo pair (Table 1).
To confirm the identity of the BACs, a single represen-
tative BAC clone for each overgo probe was used for direct
sequencing with one of the overgo primers as sequencing
primer. All representative clones provided on average 450
bp sequence with N80% identity with the respective human
ortholog. The BAC for TCF15 showed no amplification.
BAC end sequencing, sequence-tagged site (STS)
development, and optimization of PCR
Analysis of sequence data from one end of the 33
representative clones resulted in the generation of STSs from
only 12 of the ends. BACs that did not provide end sequence
from one end were sequenced from the other end. This
resulted in an additional 20 STS markers. BLAST analysis
[16] of the STS sequences showed that none of the end
sequences corresponded to coding regions of specific genes.
Most of the end sequences that could not be converted to
STSs comprised repetitive elements. Following optimization,
horse-specific amplification was obtained for 29 of the STSs.
Similarly, optimization was also carried out with primer pairs
from eight equine ESTs, eight equine orthologs for human
genes, and 19 microsatellite markers on ECA22 (Table 1).
Fluorescence in situ hybridization (FISH) mapping
All representative BAC clones isolated for the 33 overgo
probes localized to ECA22. One of the clones contained two
genes (BMP2 and CHGB). Further, BACs obtained for
AHT030, UMNe276, and UMNe344 mapped to ECA13q, in
contrast to previous erroneous FISH assignment of AHT030
[17] and subsequent mapping of loci in this RH group to
ECA22 [1]. The remaining five BACs representing ASIP,
Table 1
Composite information about all new genes (ordered according to human sequence map) and microsatellite markers mapped to ECA22
Symbol Name Overgo primers
5V–3V
BAC
CHORI-241
FISH location
on ECA22
PCR primers
5V–3V
Produc
size (bp)
Ta (8C) Reference
Accession No.
ATP5Ea ATP synthase,
H+ transporting,
mitochondrial F1
complex, q subunit
F: ACATCCGATACTCCCAGATCTGTG 161 L16 q19 F: GGAAGTCATTAGCTCCTGTCA 250 62 —
R: TCTCTCACTGCTTTTGCACAGATC R: CATGAAGAGCCTGGAACAAGT
ATP9Aa ATPase, class II, type 9A F: ACTGGCTCATGACAGTGGCGGAGC 355 M06 q18 F: GTCTTGGCTCTTAACGCTCAC 162 58 —
R: CAGGCCAGGCTGAGCAGCTCCGCC R: TCGTGGCTTGTTTGTTGTTAG
BMP2a Bone morphogenetic
protein 2
F: GCTGTCTTCTAGCGTTGCTGCTTC 174 N22 q14dist–q15prox F: AACTCCTCTGCATGGTGTGT 204 58 —
R: CCCAGGAGGACCTGGGGAAGCAGC R: TGTGGGGCCTAAGTTCTCTA
C20orf24 Chromosome 20 ORF 24 — — — F: AGCTGCATGGAACCTGGA 250 58 Equine EST
HEST20-5 R: CGACAGCTCCAATCAGCA BI961817
CDH4a Cadherin 4 F: GTTCATCAACCAGGTCTACAACGG 012 C18 q19 F: GGCCAGGAAATGAGTGTCTA 172 58 —
R: GCCCTCGTCCACGGAGCCGTTGTA R: AATCAGCGTCAATGCTTTTC
CENPBa Centromere protein B
(80 kDa)
F: GAGGCCATGGCTTACTTTGCCATG 185 P08 q14dist–q15prox F: CAGGAAGGTCTCGGCATC 285 60 —
R: TCAGGTACCTCTTGACCATGGCAA R: GTATGAAGGAGGGCACATCA
CHGBa Chromogranin B F: TTCTTCCCAGAATACAACTATGAC 174 N22 q14dist–q15prox Same as BMP2 — — —
R: GCTTTTTCTCCCACCAGTCATAGT
CPXMa Carboxypeptidase X
(M14 family)
F: TGCTTTGAGGTCACTGTGGAGCTG 157 M03 q14dist–q15prox F: ACGTGGCAACACATCTCCTA 167 58 —
R: GGAACTTGTCACAGGACAGCTCCA R: TGGTGATCTTCATTCGTTCTC
CRNKL1 Crooked neck-like 1
(Drosophila)
F: CAGCTTCGAGAATTTGACAGATGC 155 P23 q12–q13 No end sequence from this BAC clone — — —
R: TTTCATAAAGCTTCCGGCATCTGT
DAP4 Discs, large (Drosophila)
homolog-associated protein 4
— — — F: GGTTCGCCTCACAACTAAAC 288 TD60 Equine testis
HEST20-3 R: ACATGGCAGCTTCAAGGTTA cDNA
DOK5a Docking protein 5 F: TGATGCCATCTCCTAACTTAGATG 374 L16 q18 F: GTTTGCTCTCTTCCTTCATGC 182 58 —
R: GCACATTCGCCATGTACATCTAAG R: TGAGAAGCTACAACCAACCAA
DSTNa Destrin F: GCACCTCTGAAAAGTAAAATGATC 054 B22 q12–q13 F: CAAGCACTAAGCTGGGAAGTA 194 58 —
R: CCTTGGAGCTTGCATAGATCATTT R: CGACGGAGTAGGTCACAAAG
EYA2a Eyes absent homolog 2
(Drosophila)
F: ACTGGATGAGGAAGCTGGCCTTCC 027 F10 q18 F: CGGGTCTTACTCAGCTTCAG 191 58 —
R: TTCACCCGCCGGTAGCGGAAGGCC R: GCCTTATACGTGTCTGTCTGC
FKBP1A FK506 binding protein
1A, 12 kDa
— — — F: CAGCCATCATGACAAATCC 166 63 Equine EST
R: TCACCACATCACTACACAGG BI961944
HAO1a Hydroxyacid oxidase 1 F: GGTGCCAGAATGTGAAAGTCATCG 087 N18 q14 F: CCATTGTCATTTGGACCTGT 189 58 —
R: CTCACCAATGTCTTGTCGATGACT R: TGCTATTGGGTAGTTTATGCAC
ITCHb Itchy homolog E3
ubiquitin protein ligase (mouse)
— — — F: GACGTTTCTGTTGGGAACTG 248 58 —
R: AAAACAAATGGCTAAACCAAGG
ITGB4BPa Integrin h4binding protein
F: CCCAAGACTTCAATTGAAGACCAG 149 K17 q15–q16prox F: CAGCAAGGTATCCAGAGCAT 284 60 —
R: GAGAAGACAGCTCATCCTGGTCTT R: AGGGAATATGGGTGACGAGT
JAG1a Jagged 1 F: GATTTGGTTAATGGTTATCGCTGT 060 E04 q14 F: TCCCTCTTACTCAAATCAGCC 128 56 —
R: AGCCAGGTGGACAGATACAGCGAT R: GAAAGGTCTAAAAGTGCTGCC
KIAA1404 KIAA1404 protein — — — F: GGGCGTAAATCATACTCTGG 112 58 BI961572
HEST20-4 R: GATCTCCTCAAAGTTCATCAGG
KIAA1847 KIAA1847 protein — — — F: AGGAGAAGATCGAGCAGACC 416 63 BI961508
HEST20-8 R: GTCATCTTCTTGTGGGTGTCTG
MYL9b Myosin, light polypeptide 9, — — — F: GCCAAGGACAAAGACGACTA 230 58 —
regulatory R: CCTGTGTTACATTGGCTGTG
NAPBa N-ethylmaleimide-sensitive F: CTAGAAGCTCATGAAGAACAGAAC 363 K04 q12–q13 F: GATGGATGTGTAAAGGAGTGG 199 58 —
factor attachment protein, h R: CAGTGTAAGCTTCACTGTTCTGTT R: CTTTCTTTGTGGTTGATTGG
NTSR1 Neurotensin receptor 1 F: CGCGGAAGAAGTCGCTGCAGAGCC 396 F21 q19 Repetitive sequence; unsuitable — — —
R: TGCACCGTGCTCTGCAGGCTCTGC for PCR primer design
PAK7
HEST20-2
p21 (CDKN1A)-activated
kinase 7
— — — F: AGCACAACTCTCCTATGTCGG
R: AAGGCCATGAGAATTCCAGTC
279 58 Equine
monocyte
cDNA
HEST20-2
PDYNa Prodynorphin F: ATTCGTCCCAAGCTCAAGTGGGAC 145 E02 q15–q16prox F: CCCAGGTTAGGACAGACTCA 227 62 —
R: CATAGCGCTTCTGGTTGTCCCACT R: CCCCGATAGACACATTTTCTT
PLCB1b Phospholipase C, h1 — — — F: CAACCATACAAAGCCCCATC 227 58 —
R: GCTCAGTTTTCACCAAATGCC
PLCB4 Phospholipase C, h4 — — — F: CGCAGACCAGCAACAGTAG 108 58 AY011799
R: TCCATGGAATTTGTGTCCAG
A.Gusta
fson-Seabury
etal./Genomics
85(2005)188–200
190
(continued on next page)
PPGBa Protective protein for
h-galactosidaseF: TCCCTGGTCTACTTTGCCTACTA
R: TCCCCAGAAGGCCATGGTAGTAGG
370 C22 q17 F: TAGTTTGCCATGCCTATTCA
R: AGTATTTTAGGAGGCTTAATGTGA
151 58 —
PRNPa Prion protein F: TGACTATGAGGACCGTTACTATC 071 K03 q14dist–q15prox F: CTTTTTGGTGGAA TTTAG 493 58 —
R: ACGGTGCATGTTTTCACGATAGTA R: ACTCAACAGCAC TGAA
PSMA7a Proteasome (prosome,
macropain) subunit, a type, 7
F: CCATCACCGTCTTCTCGCCCGAC
R: ACTTGGAAGAGGTGGCCGTCGGGC
012 E24 q19 F: GAATCGGTCAGGA GAGA
R: GAACGTGCAGGG TTTG
193 58 —
PTPRTa Protein tyrosine
phosphatase, receptor
type, T
F: GATCTACATCCAGTGGAAACCTC
R: CCCATTGGTCTCATTGGGAGGTTT
401 L11 q16–q17prox F: GGATGCTTCTAAC CCTT
R: GTTGTGGTCTGGG CAAG
171 60 —
RALYa RNA binding protein
(autoantigenic,
hnRNP-associated
with lethal yellow)
F: CAATGAGCGCCATGCCCGGGCAG
R: ATTCTCTCCCAGCACAGCTGCCCG
352 I04 q15–q16prox F: CCTTCTGCTCACT TTTTA
R: CACTACGCACTGG AAGG
230 58 —
RBL1 Retinoblastoma-like
1 (p107)
F: ACTTTGCTGTAAACAGACTAAAG
R: TACAAAATTTCTGCCAGCTTTAGT
372 P16 q17 PCR primers amplify mster. H analysis. — — —
RPS21a Ribosomal protein S21 F: CAGAACGACGCCGGCGAGTTCGT 056 B24 q19 F: GAATAGCCAGCTT TCTGA 179 58 —
R: GCGGCACGTACAGGTCCACGAACT R: GACACACCAAAG ACAA a
SEC23Ba Transport protein Sec23
isoform B
F: CCTCTCGGGAACTGAAGATTGCA
R: CATGGACCAATGGCTCCTGCAATC
338 P22 q12–q13 F: GGAATAAGTGGAA CCAA
R: CTTACTATGGAGG AGTG TG
208 60 —
SGK2a Serum/glucocorticoid
regulated kinase 2
F: TTGACCCAGAGTTCACCCAGGAA
R: ATGGACTTGGACACAGCTTCCTGG
008 E15 q15–q16prox F: GAAGAGAAGGGG ACAGA
R: CCTCAGAACCACC GGAA
206 60 —
SNAI1a Snail homolog 1
(Drosophila)
F: TTCCAGCAGCCCTACGACCAGGC
R: TGGCTGCCAGCAGGTGGGCCTGGT
104 I23 q18 F: GCTAGGAAGTGGT AAGC
R: TGTGGAGTAAAA CTGG
321 58 —
SNRPB1b Small nuclear
ribonucleoprotein
polypeptides B and B1
— — — F: AAATGTTCTCTCT CAGC
R: AATGCCCAATTCC CCTT
110 58 —
SNRPB2a Small nuclear
ribonucleoprotein
polypeptide B
F: ATTGTGGCTTTAAAGACCATGAA
R: AGGCCTGCCCCCTCATCTTCATGG
397 G22 q12–q13 F: TGACCTTGGGGTC TTTG
R: GGCGTATCGGAGA CATAA
230 58 —
SNTA1a Syntrophin, a1
(acidic component)
F: TGGTGCACTCAGGCCCCTCCAAG
R: TCGTAGGGCACTGAGCCCTTGGAG
189 H02 q15–q16prox F: CCTTTCTGCGCTT TTTC
R: GGGTAAATCCGAA TTGA
383 60 —
SRCb v-src sarcoma
(Schmidt–Ruppin A-2)
viral oncogene
homolog (avian)
— — — F: TCACCTTGGGAAA CCAC
R: AGTGGATGGGGA ACAA
158 58 —
TAF4Aa TAF4 RNA
polymerase II,
TATA box binding
protein-associated
factor
F: ACAAAGAATCACGCGGGTCAACC
R: AAATATGAGGTCCCTGAGGTTGA
095 K05 q19 F: TGGGAGGTAGGCA CAAG
R: TAACGGTCAGGG GGAA
298 58 —
TCF15a??? Transcription
factor 15
F: AGGAGAACCGCAGCGAGAGCGAC
R: AACGACTGGTCCGACGCGTCGCTC
447 D16 q13dist–q14prox F: CTGCAAGAGAGAT AGGA
R: GCCGGAACGTAA GTGA
216 58 —
TCFL5b Transcription
factor-like 5
(basic helix-loop-helix)
— — — F: CTCTCATTCGACA CATC
R: GCAATCCAATATC GGTG
500 50 —
A.Gusta
fson-Seabury
etal./Genomics
85(2005)188–200
191
TT
AT
A
AC
AG
T
AA
C
ha
C
AC
A
TG
G
T
G
CC
CC
CA
TA
T
AT
C
A
CC
G
AT
G
GT
TC
CT
G
AGG
G
TC
TTC
No R
C
GG
GTT
AG
C
G
T
AA
C
A
CA
A
AG
G
AC
C
TG
Symbol Name Overgo primers
5V–3V
BAC
CHORI-241
FISH location
on ECA22
PCR primers
5V–3V
Produc
size (bp)
Ta (8C) Reference
Accession No.
TDE1a Tumor differentially
expressed 1
F: ATGCTCTGCTTGGCTTCCTTGTA
R: TCAGGGTCATCATGATGTACAAGG
099 O22 q15–q16prox F: GCCCTGGCACACAATAGA
R: GCATTAGTTTTCCCATCTGC
172 60 —
TKY498 Microsatellite — — — F: GGTGGGAGCATTATCTTTG 256 58 AB103716
R: CTGTCTTTGTGCGTTTGGAG
TKY548 Microsatellite — — — F: CAGCAAGACGTCTGTCCAT 173 58 AB103766
R: TACCCTGGGACTCATGCTCT
TKY554 Microsatellite — — — F: GGCCTTCCTGACTCCAATT 240 58 AB103772
R: AGCGTTTGCTGAAACCCATA
TKY560 Microsatellite — — — F: ATCCACCCTCTGCTCCTCT 150 58 AB103778
R: CCCAAGGGAAAAATGGAAAA
TKY785 Microsatellite — — — F: TTAGGTGTCAAGTCTAGGA 192 58 AB104003
R: GTGGGGAAGACGCTAAAGAG
TKY1009 Microsatellite — — — F: ACAATGTCTGCAACTCACT 121 58 AB104227
R: GCACTTTGCCACATTTGTTTC
TKY1106 Microsatellite — — — F: TGCCACAACTAGAAGGATT 280 58 AB104324
R: GCAGAACGTGCGAACTTAAC
TOP1b Topoisomerase (DNA) I — — — F: TCCCATTCACTCTTCTCCC 113 58 —
R: ATCCAGCCAAGAAAAGGCTC
UMNe105 Microsatellite — 078 B07 q15–q16prox F: TGTGTGGCCAGTTTATAACCATA 210 60 AF536249
R: AAACAAGCCAATCCCAAAAG
UMNe137 Microsatellite — — — F: CTGCTTTTTACTGCTTCAGTG 114 58 AY391299
R: GATTTGAGTCGAGGTCTGCC
UMNe183 Microsatellite — — — F: AGAGAACAGGAGAAGACATGC 106 58 AY391316
R: ACCCTGTCTCATGGAAGCTG
UMNe208 Microsatellite — — — F: AGAGCAGAACGCAACTTTC 140 58 AF536290
R: AGGAGATGCGCATATGTGC
UMNe215 Microsatellite — — — F: AACTGCAGCCTGGTGAG 197 58 AF536296
R: GACCTCCTCCTTTCCTTTCTG
UMNe355 Microsatellite — — — F: TCATGCAATTCTGAAAAAGAG 200 58 AY391346
R: CAGAGCAAATCTTCCTCACC
UMNe441 Microsatellite — — — F: GATAAACTGTCCTCCTGCTGA 150 62 —
R: GGCAGAAAGTTCTGTGGAGTG
UMNe466 Microsatellite — — — F: AGCATCCAGTCCACTGCA 378 58 —
R: GGCAGGTAAGTTTGAGAACCC
UMNe490 Microsatellite — — — F: TTGAAAAGGACACGTGCAA 300 55 —
R: TAGGCCACCTTCCAAAATTG
UMNe499 Microsatellite — — — F: CTGCAGCCCGTGTGTATG 100 60 —
R: TTAAAAGGGACTTGAGAGGGC
UMNe537 Microsatellite — — — F: TGCATTACGGGAAAGGAATC 150 58 —
R: CTGAACTGCACACTGAGAAATG
VIAATa Vesicular inhibitory
amino acid transporter
F: TCGACTTTGAGCACCGCCAGGGC
R: AGGATGTCCATCTGCAGGCCCTGG
156 E20 q15–q16prox F: GGCAGCATGGTTGTAATAGT
R: TGTATGTATTCTTCGGGGTCA
178 58 —
XRN2b 5V–3Vexoribonuclease 2 — — — F: TGGACATCAGTACCCTTCA 184 58 —
R: AGCACACAAAACACATGCAG
YWHAB
HEST6-7
Tyrosine
3-mono-oxygenase/tryptophan
5-monooxygenase activation
protein, h polypeptide
— — — F: CCCAATGCTACACAACCA
R: CCGAGAAATTGAGTGCCAG
~1000 62 Equine EST
BI961675
FISH locations shown in bold font are from this study. TD, touchdown PCR.
a Primers for RH designed from BAC end sequences.
b Primers for RH designed through multiple alignment of other mammalian sequences.
Table 1 (continued)A.Gusta
fson-Seabury
etal./Genomics
85(2005)188–200
192
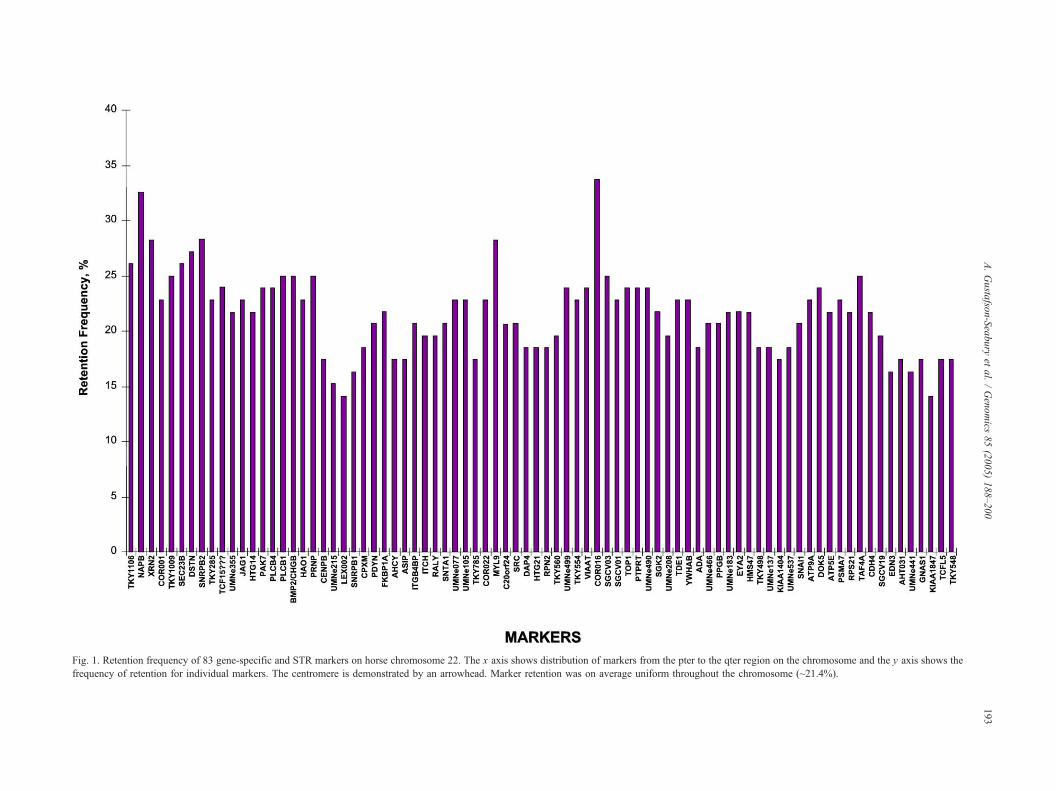
Fig. 1. Retention frequency of 83 gene-specific and STR markers on horse chromosome 22. The x axis shows distribution of markers from the pter to th ter region on the chromosome and the y axis shows the
frequency of retention for individual markers. The centromere is demonstrated by an arrowhead. Marker retention was on average uniform throughou e chromosome (~21.4%).
A.Gusta
fson-Seabury
etal./Genomics
85(2005)188–200
193
e q
t th
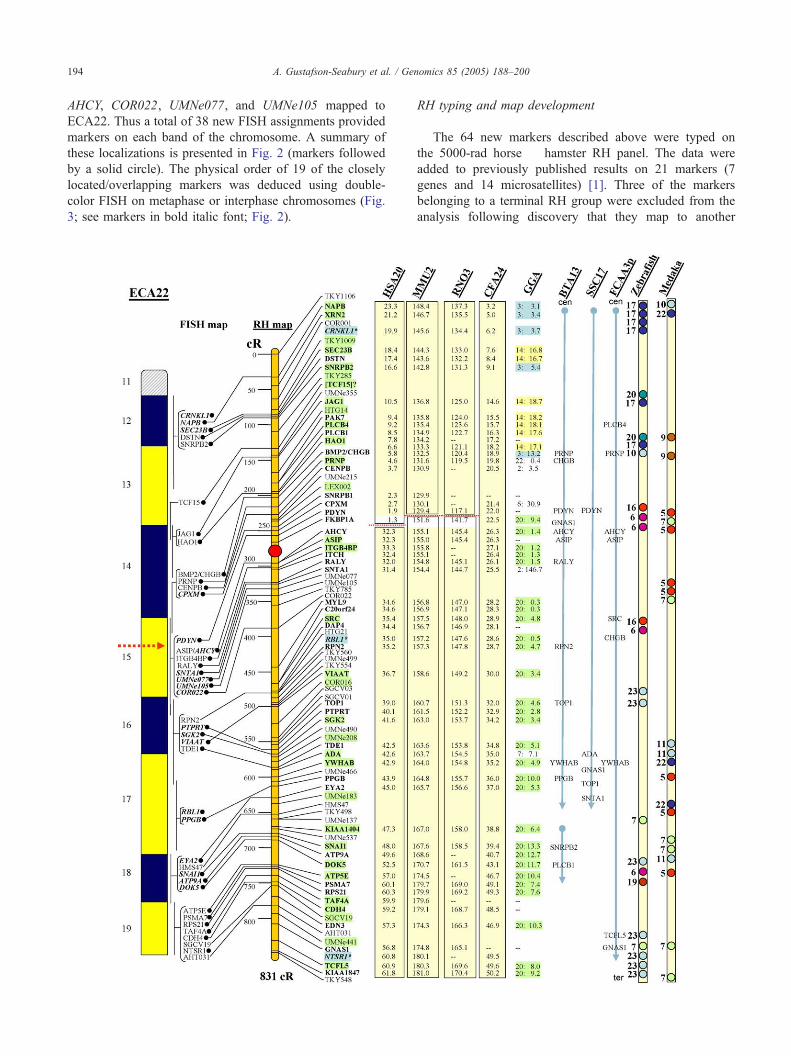
A. Gustafson-Seabury et al. / Genomics 85 (2005) 188–200194
AHCY, COR022, UMNe077, and UMNe105 mapped to
ECA22. Thus a total of 38 new FISH assignments provided
markers on each band of the chromosome. A summary of
these localizations is presented in Fig. 2 (markers followed
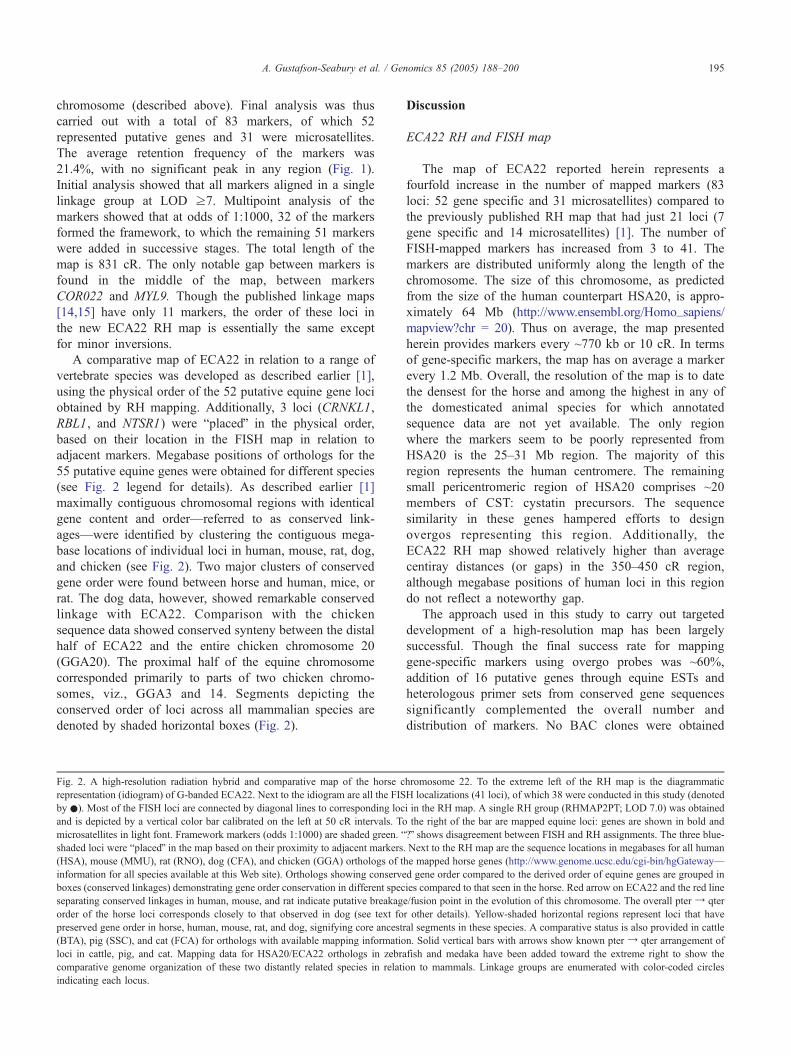
by a solid circle). The physical order of 19 of the closely
located/overlapping markers was deduced using double-
color FISH on metaphase or interphase chromosomes (Fig.
3; see markers in bold italic font; Fig. 2).
RH typing and map development
The 64 new markers described above were typed on
the 5000-rad horse � hamster RH panel. The data were
added to previously published results on 21 markers (7
genes and 14 microsatellites) [1]. Three of the markers
belonging to a terminal RH group were excluded from the
analysis following discovery that they map to another
A. Gustafson-Seabury et al. / Genomics 85 (2005) 188–200 195
chromosome (described above). Final analysis was thus
carried out with a total of 83 markers, of which 52
represented putative genes and 31 were microsatellites.
The average retention frequency of the markers was
21.4%, with no significant peak in any region (Fig. 1).
Initial analysis showed that all markers aligned in a single
linkage group at LOD z7. Multipoint analysis of the
markers showed that at odds of 1:1000, 32 of the markers
formed the framework, to which the remaining 51 markers
were added in successive stages. The total length of the
map is 831 cR. The only notable gap between markers is
found in the middle of the map, between markers
COR022 and MYL9. Though the published linkage maps
[14,15] have only 11 markers, the order of these loci in
the new ECA22 RH map is essentially the same except
for minor inversions.
A comparative map of ECA22 in relation to a range of
vertebrate species was developed as described earlier [1],
using the physical order of the 52 putative equine gene loci
obtained by RH mapping. Additionally, 3 loci (CRNKL1,
RBL1, and NTSR1) were bplacedQ in the physical order,
based on their location in the FISH map in relation to
adjacent markers. Megabase positions of orthologs for the
55 putative equine genes were obtained for different species
(see Fig. 2 legend for details). As described earlier [1]
maximally contiguous chromosomal regions with identical
gene content and order—referred to as conserved link-
ages—were identified by clustering the contiguous mega-
base locations of individual loci in human, mouse, rat, dog,
and chicken (see Fig. 2). Two major clusters of conserved
gene order were found between horse and human, mice, or
rat. The dog data, however, showed remarkable conserved
linkage with ECA22. Comparison with the chicken
sequence data showed conserved synteny between the distal
half of ECA22 and the entire chicken chromosome 20
(GGA20). The proximal half of the equine chromosome
corresponded primarily to parts of two chicken chromo-
somes, viz., GGA3 and 14. Segments depicting the
conserved order of loci across all mammalian species are
denoted by shaded horizontal boxes (Fig. 2).
Fig. 2. A high-resolution radiation hybrid and comparative map of the horse c
representation (idiogram) of G-banded ECA22. Next to the idiogram are all the FIS
by .). Most of the FISH loci are connected by diagonal lines to corresponding loc
and is depicted by a vertical color bar calibrated on the left at 50 cR intervals. To
microsatellites in light font. Framework markers (odds 1:1000) are shaded green. bshaded loci were bplacedQ in the map based on their proximity to adjacent markers
(HSA), mouse (MMU), rat (RNO), dog (CFA), and chicken (GGA) orthologs of t
information for all species available at this Web site). Orthologs showing conserve
boxes (conserved linkages) demonstrating gene order conservation in different spec
separating conserved linkages in human, mouse, and rat indicate putative breakag
order of the horse loci corresponds closely to that observed in dog (see text fo
preserved gene order in horse, human, mouse, rat, and dog, signifying core ancestr
(BTA), pig (SSC), and cat (FCA) for orthologs with available mapping informatio
loci in cattle, pig, and cat. Mapping data for HSA20/ECA22 orthologs in zebra
comparative genome organization of these two distantly related species in relati
indicating each locus.
Discussion
ECA22 RH and FISH map
The map of ECA22 reported herein represents a
fourfold increase in the number of mapped markers (83
loci: 52 gene specific and 31 microsatellites) compared to
the previously published RH map that had just 21 loci (7
gene specific and 14 microsatellites) [1]. The number of
FISH-mapped markers has increased from 3 to 41. The
markers are distributed uniformly along the length of the
chromosome. The size of this chromosome, as predicted
from the size of the human counterpart HSA20, is appro-
ximately 64 Mb (http://www.ensembl.org/Homo_sapiens/
mapview?chr = 20). Thus on average, the map presented
herein provides markers every ~770 kb or 10 cR. In terms
of gene-specific markers, the map has on average a marker
every 1.2 Mb. Overall, the resolution of the map is to date
the densest for the horse and among the highest in any of
the domesticated animal species for which annotated
sequence data are not yet available. The only region
where the markers seem to be poorly represented from
HSA20 is the 25–31 Mb region. The majority of this
region represents the human centromere. The remaining
small pericentromeric region of HSA20 comprises ~20
members of CST: cystatin precursors. The sequence
similarity in these genes hampered efforts to design
overgos representing this region. Additionally, the
ECA22 RH map showed relatively higher than average
centiray distances (or gaps) in the 350–450 cR region,
although megabase positions of human loci in this region
do not reflect a noteworthy gap.
The approach used in this study to carry out targeted
development of a high-resolution map has been largely
successful. Though the final success rate for mapping
gene-specific markers using overgo probes was ~60%,
addition of 16 putative genes through equine ESTs and
heterologous primer sets from conserved gene sequences
significantly complemented the overall number and
distribution of markers. No BAC clones were obtained
hromosome 22. To the extreme left of the RH map is the diagrammatic
H localizations (41 loci), of which 38 were conducted in this study (denoted
i in the RH map. A single RH group (RHMAP2PT; LOD 7.0) was obtained
the right of the bar are mapped equine loci: genes are shown in bold and
?Q shows disagreement between FISH and RH assignments. The three blue
. Next to the RH map are the sequence locations in megabases for all human
he mapped horse genes (http://www.genome.ucsc.edu/cgi-bin/hgGateway—
d gene order compared to the derived order of equine genes are grouped in
ies compared to that seen in the horse. Red arrow on ECA22 and the red line
e/fusion point in the evolution of this chromosome. The overall pter Y qte
r other details). Yellow-shaded horizontal regions represent loci that have
al segments in these species. A comparative status is also provided in cattle
n. Solid vertical bars with arrows show known pter Y qter arrangement o
fish and medaka have been added toward the extreme right to show the
on to mammals. Linkage groups are enumerated with color-coded circles
-
r
f
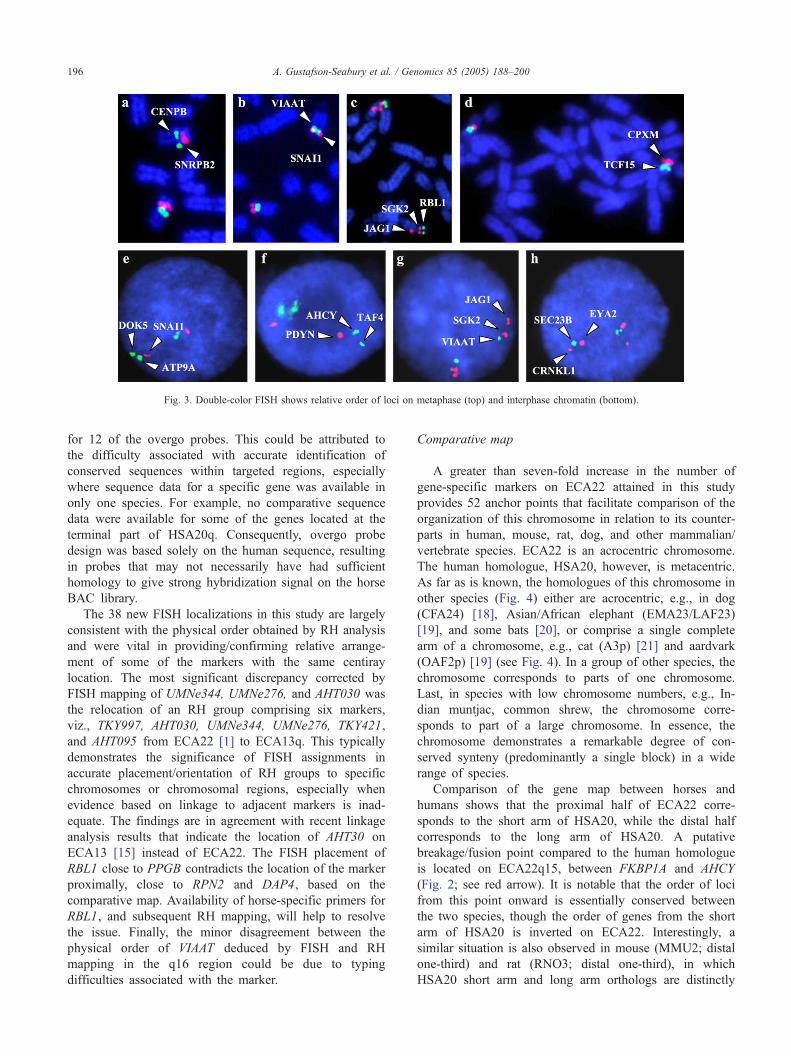
Fig. 3. Double-color FISH shows relative order of loci on metaphase (top) and interphase chromatin (bottom).
A. Gustafson-Seabury et al. / Genomics 85 (2005) 188–200196
for 12 of the overgo probes. This could be attributed to
the difficulty associated with accurate identification of
conserved sequences within targeted regions, especially
where sequence data for a specific gene was available in
only one species. For example, no comparative sequence
data were available for some of the genes located at the
terminal part of HSA20q. Consequently, overgo probe
design was based solely on the human sequence, resulting
in probes that may not necessarily have had sufficient
homology to give strong hybridization signal on the horse
BAC library.
The 38 new FISH localizations in this study are largely
consistent with the physical order obtained by RH analysis
and were vital in providing/confirming relative arrange-
ment of some of the markers with the same centiray
location. The most significant discrepancy corrected by
FISH mapping of UMNe344, UMNe276, and AHT030 was
the relocation of an RH group comprising six markers,
viz., TKY997, AHT030, UMNe344, UMNe276, TKY421,
and AHT095 from ECA22 [1] to ECA13q. This typically
demonstrates the significance of FISH assignments in
accurate placement/orientation of RH groups to specific
chromosomes or chromosomal regions, especially when
evidence based on linkage to adjacent markers is inad-
equate. The findings are in agreement with recent linkage
analysis results that indicate the location of AHT30 on
ECA13 [15] instead of ECA22. The FISH placement of
RBL1 close to PPGB contradicts the location of the marker
proximally, close to RPN2 and DAP4, based on the
comparative map. Availability of horse-specific primers for
RBL1, and subsequent RH mapping, will help to resolve
the issue. Finally, the minor disagreement between the
physical order of VIAAT deduced by FISH and RH
mapping in the q16 region could be due to typing
difficulties associated with the marker.
Comparative map
A greater than seven-fold increase in the number of
gene-specific markers on ECA22 attained in this study
provides 52 anchor points that facilitate comparison of the
organization of this chromosome in relation to its counter-
parts in human, mouse, rat, dog, and other mammalian/
vertebrate species. ECA22 is an acrocentric chromosome.
The human homologue, HSA20, however, is metacentric.
As far as is known, the homologues of this chromosome in
other species (Fig. 4) either are acrocentric, e.g., in dog
(CFA24) [18], Asian/African elephant (EMA23/LAF23)
[19], and some bats [20], or comprise a single complete
arm of a chromosome, e.g., cat (A3p) [21] and aardvark
(OAF2p) [19] (see Fig. 4). In a group of other species, the
chromosome corresponds to parts of one chromosome.
Last, in species with low chromosome numbers, e.g., In-
dian muntjac, common shrew, the chromosome corre-
sponds to part of a large chromosome. In essence, the
chromosome demonstrates a remarkable degree of con-
served synteny (predominantly a single block) in a wide
range of species.
Comparison of the gene map between horses and
humans shows that the proximal half of ECA22 corre-
sponds to the short arm of HSA20, while the distal half
corresponds to the long arm of HSA20. A putative
breakage/fusion point compared to the human homologue
is located on ECA22q15, between FKBP1A and AHCY
(Fig. 2; see red arrow). It is notable that the order of loci
from this point onward is essentially conserved between
the two species, though the order of genes from the short
arm of HSA20 is inverted on ECA22. Interestingly, a
similar situation is also observed in mouse (MMU2; distal
one-third) and rat (RNO3; distal one-third), in which
HSA20 short arm and long arm orthologs are distinctly
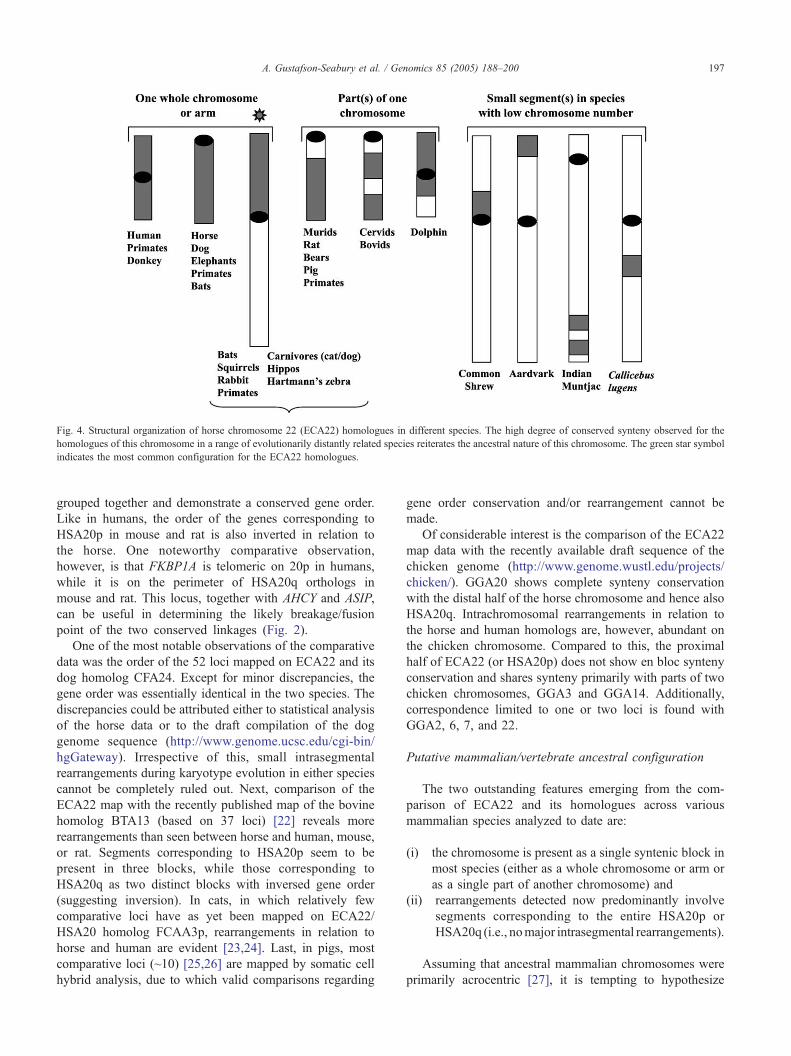
Fig. 4. Structural organization of horse chromosome 22 (ECA22) homologues in different species. The high degree of conserved synteny observed for the
homologues of this chromosome in a range of evolutionarily distantly related species reiterates the ancestral nature of this chromosome. The green star symbol
indicates the most common configuration for the ECA22 homologues.
A. Gustafson-Seabury et al. / Genomics 85 (2005) 188–200 197
grouped together and demonstrate a conserved gene order.
Like in humans, the order of the genes corresponding to
HSA20p in mouse and rat is also inverted in relation to
the horse. One noteworthy comparative observation,
however, is that FKBP1A is telomeric on 20p in humans,
while it is on the perimeter of HSA20q orthologs in
mouse and rat. This locus, together with AHCY and ASIP,
can be useful in determining the likely breakage/fusion
point of the two conserved linkages (Fig. 2).
One of the most notable observations of the comparative
data was the order of the 52 loci mapped on ECA22 and its
dog homolog CFA24. Except for minor discrepancies, the
gene order was essentially identical in the two species. The
discrepancies could be attributed either to statistical analysis
of the horse data or to the draft compilation of the dog
genome sequence (http://www.genome.ucsc.edu/cgi-bin/
hgGateway). Irrespective of this, small intrasegmental
rearrangements during karyotype evolution in either species
cannot be completely ruled out. Next, comparison of the
ECA22 map with the recently published map of the bovine
homolog BTA13 (based on 37 loci) [22] reveals more
rearrangements than seen between horse and human, mouse,
or rat. Segments corresponding to HSA20p seem to be
present in three blocks, while those corresponding to
HSA20q as two distinct blocks with inversed gene order
(suggesting inversion). In cats, in which relatively few
comparative loci have as yet been mapped on ECA22/
HSA20 homolog FCAA3p, rearrangements in relation to
horse and human are evident [23,24]. Last, in pigs, most
comparative loci (~10) [25,26] are mapped by somatic cell
hybrid analysis, due to which valid comparisons regarding
gene order conservation and/or rearrangement cannot be
made.
Of considerable interest is the comparison of the ECA22
map data with the recently available draft sequence of the
chicken genome (http://www.genome.wustl.edu/projects/
chicken/). GGA20 shows complete synteny conservation
with the distal half of the horse chromosome and hence also
HSA20q. Intrachromosomal rearrangements in relation to
the horse and human homologs are, however, abundant on
the chicken chromosome. Compared to this, the proximal
half of ECA22 (or HSA20p) does not show en bloc synteny
conservation and shares synteny primarily with parts of two
chicken chromosomes, GGA3 and GGA14. Additionally,
correspondence limited to one or two loci is found with
GGA2, 6, 7, and 22.
Putative mammalian/vertebrate ancestral configuration
The two outstanding features emerging from the com-
parison of ECA22 and its homologues across various
mammalian species analyzed to date are:
(i) the chromosome is present as a single syntenic block in
most species (either as a whole chromosome or arm or
as a single part of another chromosome) and
(ii) rearrangements detected now predominantly involve
segments corresponding to the entire HSA20p or
HSA20q (i.e., nomajor intrasegmental rearrangements).
Assuming that ancestral mammalian chromosomes were
primarily acrocentric [27], it is tempting to hypothesize
A. Gustafson-Seabury et al. / Genomics 85 (2005) 188–200198
that the near-identical horse and dog chromosomes
(ECA22 and CFA24) are ancestral among placental
mammals. However, a contrary possibility cannot be ruled
out when the human, mouse, and rat homologues of
ECA22 (HSA20 and the terminal one-third part of
MMU3p and RNO2p) are analyzed. It is noteworthy that
the three homologues have an almost identical gene order.
If the primate/rodent gene order is more primitive, the
human homologue most likely resulted from a simple
reinsertion of the centromere from the end to the middle of
the acrocentric ancestral chromosome. In this scenario, the
horse and dog counterparts should have undergone a
paracentric inversion, with breakages adjacent to the
centromere and the middle of the chromosome (Fig. 2,
red arrow). Emerging sequence data in a range of
evolutionarily diverged mammals (including marsupials
and monotremes) will help to validate either ancestral
configuration. Finally, primates and rodents are proposed
to be phylogenetically more closely related to each other
than with either horse or dog, which are anticipated to
have radiated separately from a common ancestor [28,29].
Considering this, the exceptional conserved linkage seen in
humans, mice, and rats may not be surprising. However,
maintenance of this linkage despite extensive rearrange-
ments in the rodent karyotype in comparison to humans is
indeed remarkable.
While extending the ECA22/HSA20 comparison to
other vertebrates, it was observed that the distal half of
ECA22 (HSA20q) shares striking similarity with GGA20.
This extraordinary synteny conservation in species as
diverged as mammals and birds (~310 Myr ago) [30]
leads us to postulate that the segment/arm is ancestral.
Extending the comparisons to the limited mapping data
available for zebrafish and medaka (shared a common
ancestor with mammals ~450 Myr ago) [30] shows that the
distal half of ECA22 (HSA20q) shares synteny mainly
with two to three linkage groups in zebrafish (LG6, 7, and
23) [31,32] as well as medaka (LG5, 7, and 11) [33].
Though a clearer picture of ECA22/HSA20 protovertebrate
chromosomes will emerge only after a finished whole
genome sequence is available for fishes (zebrafish, puffer-
fish, and medaka), the present comparisons add to the
current knowledge regarding the likely ancestral homo-
logue of ECA22/HSA20.
Conclusions
The high-resolution physically ordered map of ECA22
represents another important step toward targeted expansion
of the horse gene map and its alignment with maps of a
range of mammalian/vertebrate species, some of which have
sequence data available for detailed comparison. The
uniform distribution of markers and the accessibility of
comparative data in a range of species will considerably
facilitate the search for bcandidateQ genes on this equine
chromosome. The overall conservation of the chromosome
in a range of evolutionarily distantly related mammalian
species reinforces earlier suggestions that ECA22/HSA20 is
an ancestral configuration. The striking similarity in gene
order seen between ECA22 and CFA24 is unprecedented for
autosomes in species that diverged ~70–80 Myr ago from a
common ancestor.
Methods
Design of overlapping oligonucleotide (overgo) probes
Genes at ~1Mb intervals were identified for overgo primer
design using the human genomic draft sequence for
chromosome 20 (http://www.genome.ucsc.edu, version July
2003). Conserved regions within individual genes were
identified following multiple species alignment of the human
sequence using GenBank pair-wise BLAST [34]. These
regions were utilized to design overgo primer sets with the
Overgo Maker program (http://www.genome.wustl.edu/
tools?overgo.html). Finally, individual overgos were
screened against nr and EST sequences using BLAST
(http://www.ncbi.nlm.nih.gov/BLAST/) [16] to confirm their
specificity and to exclude homology with repetitive elements.
Overgo labeling, BAC library screening, isolation of BAC
clones, and end sequencing
The overgo primer sets were individually labeled radio-
actively with [32P]dATP and [32P]dCTP, pooled, and
hybridized onto high-density filters of an equine genomic
BAC library (CHORI-241; http://www.bacpac.chori.org/
equine241.htm) using a previously described protocol [35].
The filters were washed three times at 428C for 15 min in 2�SSPE (0.2 M NaH2PO4–H2O, 0.02 M EDTA, 3.0 M NaCl)
and exposed to film over intensifying screens for 4 days at
�808C prior to development of the autoradiograms. Analysis
of the autoradiograms led to identification of positive BAC
clones. These clones were isolated and used to generate
secondary filters. The secondary filters were hybridized with
individual radioactively labeled overgo probes and processed
following the protocol described above. Following develop-
ment and analysis of the autoradiograms, BAC clones
specific for individual overgo probes were identified. In
instances in which multiple BAC clones were positive for a
single overgo probe, a representative clone was chosen for
subsequent analysis. Individual BAC clones were cultured,
and DNA was extracted using the Qiagen Plasmid Midi kit
(Valencia, CA, USA). One of the overgo primers was used as
sequencing primer to obtain partial information on the
targeted gene. The identity of the sequence (hence the BAC
clone) was verified by using GenBank BLAST [16]. One
representative BAC clone for each overgo probe was end
sequenced using pTARBAC2.1-derived sequencing primers
T7.29 (5V-GCCGCTAATACGACTCACTATAGGGAGAG)
A. Gustafson-Seabury et al. / Genomics 85 (2005) 188–200 199
and SP6.26 (5V-CCGTCGACATTTAGGTGACACTATAG)[35].
FISH
The representative BAC clones in the final collection
were individually labeled with biotin and/or digoxigenin
using the BioNick Labeling System (Invitrogen) and DIG-
Nick Translation Mix (Roche). The labeled clones were
hybridized to horse metaphase chromosome spreads to
determine their chromosomal origin and physical location
along the length of the chromosome. Differentially labeled
clones were cohybridized to determine their relative order
along ECA22. DNA labeling, in situ hybridization, signal
detection, microscopy, and image analysis were carried out
as described previously [1,36].
Primer design and RH analysis
BAC end sequences were analyzed for repetitive elements
using RepeatMasker (http://www.repeatmasker.genome.
washington.edu/cgi-bin/RepeatMasker) and then exam-
ined for homology with available sequences using BLASTn
(http://www.ncbi.nlm.nih.gov/BLAST/) [16]. PCR primers
were designed from satisfactory end sequences using
Primer3 software (http://www.frodo.wi.mit.edu/cgi-bin/
primer3/primer3_www.cgi). Additionally, eight primer
pairs were generated from EST sequences obtained from
the horse testis cDNA library [37] that provided significant
hits to HSA20 genes. Finally, heterologous primer pairs for
eight additional HSA20 genes were developed following a
previously described approach of multiple alignment of the
human sequences with sequences available from other
species and identification of conserved regions for horse-
specific DNA amplification [3,38]. PCR amplification
conditions for individual primer pairs were optimized
using horse and hamster genomic DNA to ensure horse-
specific amplification. The successful primer pairs were
then used to type in duplicate the 5000-rad horse �hamster RH panel by PCR. Analysis of the typing data and
construction of a physically ordered RH map were carried
out as described previously [1].
Acknowledgments
This project was funded by grants from the Texas Higher
Education Board (ARP 010366-0162-2001, B.P.C.; ATP
000517-0306-2003, B.P.C., J.E.W.), NRICGP/USDA Grant
2003-03687 (B.P.C.), the Texas Equine Research Foundation
(B.P.C., L.C.S.), the Link Endowment (B.P.C., L.C.S.), the
American Quarter Horse Association, and the Dorothy
Russell Havemeyer Foundation. Additional support was
available from the USDA-NRSP-8 Coordinators Fund. We
thank Dr. Pat Venta, Michigan State University, for design
and supply of several primer pairs.
References
[1] B.P. Chowdhary, et al., The first-generation whole-genome radiation
hybrid map in the horse identifies conserved segments in human and
mouse genomes, Genome Res. 13 (2003) 742–751.
[2] B.P. Chowdhary, E. Bailey, Equine genomics: galloping to new
frontiers, Cytogenet. Genome Res. 102 (2003) 184–188.
[3] E.J. Lee, et al., A 1.4-Mb interval RH map of horse chromosome 17
provides detailed comparison with human and mouse homologues,
Genomics 83 (2004) 203–215.
[4] T. Raudsepp, et al., Exceptional conservation of horse–human gene
order on X chromosome revealed by high-resolution radiation
hybrid mapping, Proc. Natl. Acad. Sci. USA 101 (2004)
2386–2391.
[5] M.T. Ross, S. La Brie, J. McPherson, V.P. Stanton Jr., Screening large
insert libraries by hybridization, in: A. Boyl (Ed.), Current Protocols
in Human Genetics, Wiley, New York, 1999, pp. 5.6.1–5.6.52.
[6] C.S. Han, et al., Construction of a BAC contig map of chromosome
16q by two-dimensional overgo hybridization, Genome Res. 10
(2000) 714–721.
[7] B.P. Chowdhary, T. Raudsepp, L. Fronicke, H. Scherthan, Emerg-
ing patterns of comparative genome organization in some mam-
malian species as revealed by Zoo-FISH, Genome Res. 8 (1998)
577–589.
[8] T. Raudsepp, L. Fronicke, H. Scherthan, I. Gustavsson, B.P.
Chowdhary, Zoo-FISH delineates conserved chromosomal segments
in horse and man, Chromosome Res. 4 (1996) 218–225.
[9] R.S. Sparkes, et al., Assignment of the human and mouse prion
protein genes to homologous chromosomes, Proc. Natl. Acad. Sci.
USA 83 (1986) 7358–7362.
[10] J. Collinge, Prion diseases of humans and animals: their causes and
molecular basis, Annu. Rev. Neurosci. 24 (2001) 519–550.
[11] F. Jobard, et al., Identification of mutations in a new gene encoding a
FERM family protein with a pleckstrin homology domain in Kindler
syndrome, Hum. Mol. Genet. 12 (2003) 925–935.
[12] M. Callaghan, et al., Homozygosity mapping and linkage analysis
demonstrate that autosomal recessive congenital hereditary endothelial
dystrophy (CHED) and autosomal dominant CHED are genetically
distinct, Br. J. Ophthalmol. 83 (1999) 115–119.
[13] C.K. Hand, et al., Localization of the gene for autosomal recessive
congenital hereditary endothelial dystrophy (CHED2) to chromosome
20 by homozygosity mapping, Genomics 61 (1999) 1–4.
[14] J. Swinburne, et al., First comprehensive low-density horse linkage
map based on two three-generation, full-sibling, cross-bred horse
reference families, Genomics 66 (2000) 123–134.
[15] G. Guerin, et al., The second generation of the International Equine
Gene Mapping Workshop half-sibling linkage map, Anim. Genet. 34
(2003) 161–168.
[16] S.F. Altschul, W. Gish, W. Miller, E.W. Myers, D.J. Lipman, Basic
local alignment search tool, J. Mol. Biol. 215 (1990) 403–410.
[17] J. Swinburne, et al., First comprehensive low-density horse linkage
map based on two three-generation, full-sibling, cross-bred horse
reference families, Genomics 66 (2000) 123–134.
[18] M. Switonski, I. Szczerbal, J. Nowacka, The dog genome map and its
use in mammalian comparative genomics, J. Appl. Genet. 45 (2004)
195–214.
[19] F. Yang, et al., Reciprocal chromosome painting among human,
aardvark, and elephant (superorder Afrotheria) reveals the likely
eutherian ancestral karyotype, Proc. Natl. Acad. Sci. USA 100 (2003)
1062–1066.
[20] M. Volleth, K.G. Heller, R.A. Pfeiffer, H. Hameister, A comparative
ZOO-FISH analysis in bats elucidates the phylogenetic relationships
between Megachiroptera and five microchiropteran families,
Chromosome Res. 10 (2002) 477–497.
[21] W.J. Murphy, et al., A radiation hybrid map of the cat genome:
implications for comparative mapping, Genome Res. 10 (2000)
691–702.
A. Gustafson-Seabury et al. / Genomics 85 (2005) 188–200200
[22] A. Everts-van der Wind, et al., A 1463 gene cattle–human
comparative map with anchor points defined by human genome
sequence coordinates, Genome Res. 14 (2004) 1424–1437.
[23] M. Menotti-Raymond, et al., Second-generation integrated genetic
linkage/radiation hybrid maps of the domestic cat (Felis catus),
J. Hered. 94 (2003) 95–106.
[24] S. Sun, W.J. Murphy, M. Menotti-Raymond, S.J. O’Brien, Integration
of the feline radiation hybrid and linkage maps, Mamm. Genome 12
(2001) 436–441.
[25] H. Hayes, et al., Mapping of 195 genes in cattle and updated
comparative map with man, mouse, rat and pig, Cytogenet. Genome
Res. 102 (2003) 16–24.
[26] S. Cirera, et al., Comparative mapping in the pig: localization of 214
expressed sequence tags, Mamm. Genome 14 (2003) 405–426.
[27] F. Richard, M. Lombard, B. Dutrillaux, Reconstruction of the
ancestral karyotype of eutherian mammals, Chromosome Res. 11
(2003) 605–618.
[28] W.J. Murphy, Resolution of the early placental mammal radiation
using Bayesian phylogenetics, Science 294 (2001) 2348–2351.
[29] M.S. Springer, W.J. Murphy, E. Eizirik, S.J. O’Brien, Placental
mammal diversification and the Cretaceous–Tertiary boundary, Proc.
Natl. Acad. Sci. USA 100 (2003) 1056–1061.
[30] S. Kumar, S.B. Hedges, A molecular timescale for vertebrate
evolution, Nature 392 (1998) 917–920.
[31] J.H. Postlethwait, et al., Zebrafish comparative genomics and the
origins of vertebrate chromosomes, Genome Res. 10 (2000)
1890–1902.
[32] I.G. Woods, et al., A comparative map of the zebrafish genome,
Genome Res. 10 (2000) 1903–1914.
[33] K. Naruse, et al., A medaka gene map: the trace of ancestral vertebrate
proto-chromosomes revealed by comparative gene mapping, Genome
Res. 14 (2004) 820–828.
[34] T.A. Tatusova, T.L. Madden, BLAST 2 sequences, a new tool for
comparing protein and nucleotide sequences, FEMS Microbiol. Lett.
174 (1999) 247–250.
[35] A.L. Gustafson, et al., An ordered BAC contig map of the equine
major histocompatibility complex, Cytogenet. Genome Res. 102
(2003) 189–195.
[36] T. Raudsepp, et al., Comparison of horse chromosome 3 with donkey
and human chromosomes by cross-species painting and heterologous
FISH mapping, Mamm. Genome 10 (1999) 277–282.
[37] B.P. Chowdhary, et al., Construction of a 5000(rad) whole-genome
radiation hybrid panel in the horse and generation of a compre-
hensive and comparative map for ECA11, Mamm. Genome 13
(2002) 89–94.
[38] D.M. Shubitowski, P.J. Venta, C.L. Douglass, R.X. Zhou, S.L. Ewart,
Polymorphism identification within 50 equine gene-specific sequence
tagged sites, Anim. Genet. 32 (2001) 78–88.