Chætognath transcriptome reveals ancestral and unique features among bilaterians
18
Genome Biology 2008, 9:R94 Open Access 2008 Marlétaz et al. Volume 9, Issue 6, Article R94 Research Chætognath transcriptome reveals ancestral and unique features among bilaterians Ferdinand Marlétaz *† , André Gilles ‡§ , Xavier Caubit †¶ , Yvan Perez ‡§ , Carole Dossat ¥#** , Sylvie Samain ¥#** , Gabor Gyapay ¥#** , Patrick Wincker ¥#** and Yannick Le Parco *† Addresses: * CNRS UMR 6540 DIMAR, Station Marine d'Endoume, Centre d'Océanologie de Marseille, Chemin de la Batterie des Lions, 13007, Marseille, France. † Université de la Méditerranée Aix-Marseille II, Bd Charles Livon, 13284, Marseille, France. ‡ Université de Provence Aix- Marseille I, place Victor-Hugo, 13331, Marseille, France. § CNRS UMR 6116 IMEP, Centre St Charles, place Victor-Hugo, 13331, Marseille, France. ¶ CNRS UMR 6216, IBDML, Campus de Luminy, Route Léon Lachamp, 13288, Marseille, France. ¥ Genoscope (CEA), rue Gaston Crémieux, BP5706, 91057 Evry, France. # CNRS, UMR 8030, rue Gaston Crémieux, BP5706, 91057 Evry, France. ** Université d'Evry, Boulevard François Mitterrand, 91025, Evry, France. Correspondence: Yannick Le Parco. Email: [email protected] © 2008 Marlétaz et al.; licensee BioMed Central Ltd. This is an open access article distributed under the terms of the Creative Commons Attribution License (http://creativecommons.org/licenses/by/2.0), which permits unrestricted use, distribution, and reproduction in any medium, provided the original work is properly cited. Chætognath genomics and evolution <p>The chætognath transcriptome reveals unusual genomic features in the evolution of this protostome and suggests that it could be used as a model organism for bilaterians.</p> Abstract Background: The chætognaths (arrow worms) have puzzled zoologists for years because of their astonishing morphological and developmental characteristics. Despite their deuterostome-like development, phylogenomic studies recently positioned the chætognath phylum in protostomes, most likely in an early branching. This key phylogenetic position and the peculiar characteristics of chætognaths prompted further investigation of their genomic features. Results: Transcriptomic and genomic data were collected from the chætognath Spadella cephaloptera through the sequencing of expressed sequence tags and genomic bacterial artificial chromosome clones. Transcript comparisons at various taxonomic scales emphasized the conservation of a core gene set and phylogenomic analysis confirmed the basal position of chætognaths among protostomes. A detailed survey of transcript diversity and individual genotyping revealed a past genome duplication event in the chætognath lineage, which was, surprisingly, followed by a high retention rate of duplicated genes. Moreover, striking genetic heterogeneity was detected within the sampled population at the nuclear and mitochondrial levels but cannot be explained by cryptic speciation. Finally, we found evidence for trans-splicing maturation of transcripts through splice-leader addition in the chætognath phylum and we further report that this processing is associated with operonic transcription. Conclusion: These findings reveal both shared ancestral and unique derived characteristics of the chætognath genome, which suggests that this genome is likely the product of a very original evolutionary history. These features promote chætognaths as a pivotal model for comparative genomics, which could provide new clues for the investigation of the evolution of animal genomes. Published: 4 June 2008 Genome Biology 2008, 9:R94 (doi:10.1186/gb-2008-9-6-r94) Received: 5 November 2007 Revised: 3 March 2008 Accepted: 4 June 2008 The electronic version of this article is the complete one and can be found online at http://genomebiology.com/2008/9/6/R94
Transcript of Chætognath transcriptome reveals ancestral and unique features among bilaterians
Open Access2008Marlétazet al.Volume 9, Issue 6, Article R94ResearchChætognath transcriptome reveals ancestral and unique features among bilateriansFerdinand Marlétaz*†, André Gilles‡§, Xavier Caubit†¶, Yvan Perez‡§, Carole Dossat¥#**, Sylvie Samain¥#**, Gabor Gyapay¥#**, Patrick Wincker¥#** and Yannick Le Parco*†
Addresses: *CNRS UMR 6540 DIMAR, Station Marine d'Endoume, Centre d'Océanologie de Marseille, Chemin de la Batterie des Lions, 13007, Marseille, France. †Université de la Méditerranée Aix-Marseille II, Bd Charles Livon, 13284, Marseille, France. ‡Université de Provence Aix-Marseille I, place Victor-Hugo, 13331, Marseille, France. §CNRS UMR 6116 IMEP, Centre St Charles, place Victor-Hugo, 13331, Marseille, France. ¶CNRS UMR 6216, IBDML, Campus de Luminy, Route Léon Lachamp, 13288, Marseille, France. ¥Genoscope (CEA), rue Gaston Crémieux, BP5706, 91057 Evry, France. #CNRS, UMR 8030, rue Gaston Crémieux, BP5706, 91057 Evry, France. **Université d'Evry, Boulevard François Mitterrand, 91025, Evry, France.
Correspondence: Yannick Le Parco. Email: [email protected]
© 2008 Marlétaz et al.; licensee BioMed Central Ltd. This is an open access article distributed under the terms of the Creative Commons Attribution License (http://creativecommons.org/licenses/by/2.0), which permits unrestricted use, distribution, and reproduction in any medium, provided the original work is properly cited.Chætognath genomics and evolution<p>The chætognath transcriptome reveals unusual genomic features in the evolution of this protostome and suggests that it could be used as a model organism for bilaterians.</p>
Abstract
Background: The chætognaths (arrow worms) have puzzled zoologists for years because of theirastonishing morphological and developmental characteristics. Despite their deuterostome-likedevelopment, phylogenomic studies recently positioned the chætognath phylum in protostomes,most likely in an early branching. This key phylogenetic position and the peculiar characteristics ofchætognaths prompted further investigation of their genomic features.
Results: Transcriptomic and genomic data were collected from the chætognath Spadellacephaloptera through the sequencing of expressed sequence tags and genomic bacterial artificialchromosome clones. Transcript comparisons at various taxonomic scales emphasized theconservation of a core gene set and phylogenomic analysis confirmed the basal position ofchætognaths among protostomes. A detailed survey of transcript diversity and individualgenotyping revealed a past genome duplication event in the chætognath lineage, which was,surprisingly, followed by a high retention rate of duplicated genes. Moreover, striking geneticheterogeneity was detected within the sampled population at the nuclear and mitochondrial levelsbut cannot be explained by cryptic speciation. Finally, we found evidence for trans-splicingmaturation of transcripts through splice-leader addition in the chætognath phylum and we furtherreport that this processing is associated with operonic transcription.
Conclusion: These findings reveal both shared ancestral and unique derived characteristics of thechætognath genome, which suggests that this genome is likely the product of a very originalevolutionary history. These features promote chætognaths as a pivotal model for comparativegenomics, which could provide new clues for the investigation of the evolution of animal genomes.
Published: 4 June 2008
Genome Biology 2008, 9:R94 (doi:10.1186/gb-2008-9-6-r94)
Received: 5 November 2007Revised: 3 March 2008Accepted: 4 June 2008
The electronic version of this article is the complete one and can be found online at http://genomebiology.com/2008/9/6/R94
Genome Biology 2008, 9:R94

http://genomebiology.com/2008/9/6/R94 Genome Biology 2008, Volume 9, Issue 6, Article R94 Marlétaz et al. R94.2
BackgroundThe recent shift of genomic biology from conventional modelorganisms to evolutionarily relevant species has led to thequestioning of numerous ideas about metazoan evolution.For instance, the recently released genome of the starletanemone has revealed a striking conservation with its verte-brate counterparts despite an apparent morphological gapbetween these organisms [1]. On the contrary, whereas theHox gene clusters have been considered for a long time asstructures strictly required for the development of the com-mon bilaterian body plan, they were found to be disorganizedor even dislocated in animals such as nematodes or urochor-dates [2,3]. These cases illustrate the interest of genomicinsights from organisms that display either peculiar morpho-logical characteristics or have key phylogenetic positions.
Interestingly, chætognaths, also known as arrow worms, ful-fill both of these criteria: they have one of the most intriguingsets of morphological and developmental characteristicsamong animals and their phylogenetic position was recentlyreevaluated as a pivotal one for the understanding of animalevolution [4]. These free-living marine creatures representone of the major predators of the zooplancton food-chain butthe phylum is mainly known for its original mosaic of mor-phological characteristics that have puzzled zoologists foryears [5]. Their nervous system exhibits typical protostomefeatures, such as ventral nervous mid-body ganglions and cir-cum-esophageal fibers [6], whereas the enterocoelous forma-tion of their body cavity and the secondary emergence of theirmouth are embryological features traditionally related todeuterostomes [7]. Strikingly, this original body plan hasbeen conserved since the lowermost Cambrian period asshown by convincing fossil evidence [8,9]. First attempts toposition chætognaths using molecular phylogeny were diffi-cult because small subunits (SSUs) and large subunits (LSUs)of ribosomal RNA genes display very fast evolutionary ratesthat hinder accurate tree reconstruction [10-12]. Subsequentanalysis of their mitochondrial genome prompted classifica-tion of chætognaths among protostomes, but their exactbranching in this clade remains elusive [13,14]. The Hoxgenes of chætognaths are distinct from those typical of otherprotostomes: their original MedPost gene shares similaritywith both median and posterior classes [15] and the posteriorHox genes that were recently identified in these animals areneither related to the AbdB nor Post1/2 classes, which arespecific for ecdysozoans and lophotrochozoans, respectively[16].
Recently, the phylogenomic approach has provided theopportunity to sum up the phylogenetic signal from hundredsof genes and thereby to increase the resolution of the phylog-enies [17]. Two different phylogenomic studies involving dif-ferent chætognath species and based on different samples ofnuclear genes have assessed the phylogenetic position of chæ-tognaths. They have both provided strong support for theinclusion of chætognaths within protostomes [17-19]. Matus
et al. [19] suggested the branching of chætognaths at the baseof lophotrochozoans on the basis of 72 nuclear genesdescribed as valuable phylogenetic markers by Philippe et al.[20]. Conversely, using a slightly larger taxonomic samplingand 78 ribosomal protein (RP) genes, Marlétaz et al. [18] pro-posed that chætognaths are the sister group of all other pro-tostomes. This last hypothesis has deep implications for theevolution of developmental patterns among bilaterians sinceit promotes the view that deuterostome-like developmentalfeatures such as enterocoely or a secondary mouth openingmay be ancestral among bilaterians. Interestingly, recentinsights into the structure of the nervous system of chætog-naths suggest that these organisms have an intra-epidermalnon-centralized nerve plexus, such as those observed inhemichordates or cnidarians [6]. This is another example of aputative ancestral characteristic in this phylum. Then, boththe phylogenetic position of chætognaths and their peculiarmorphology and development indicate that these organismsare pivotal for the understanding of animal evolution.
The expressed sequence tag (EST) approach provides aninteresting opportunity to survey genomes and to performcomparisons between organisms. For instance, whole tran-scriptome comparisons based on ESTs initially suggested thatthe gene repertory shared by all metazoans is larger thanexpected [21]. Moreover, in regard to the unexpected geneticcomplexity of cnidarians, the evolutionary extent of genelosses observed in nematodes and Drosophila remains to bedefined [21]. Through their original phylogenetic position,chætognaths offer the opportunity to check whether theancestral protostome transcriptome has already undergonesuch gene losses or remains close to the ancestral bilateriangene set conserved between vertebrates and cnidarians. Fur-thermore, the identification of a core set of metazoan con-served genes from a large range of organisms providesmarker genes for phylogenomic analyses and signature genesas rare genomic changes, which could lead to a reevaluationof animal phylogeny [22,23].
Here, we describe an overview of Spadella cephalopteragenomics through fine-scale mining of consistent transcrip-tomic data. Although the morphology of chætognaths hasbeen extensively described, only a few molecular studies havefocused on these strange organisms. The transcriptome ofchætognaths reveals a strong similarity with that of otherbilaterians. This comparative framework allowed detection ofmolecular signatures and stressed the usefulness of RPs asmarker genes for phylogenomic reconstruction. Along withthe structural RNAs, RPs are major components of the ribos-ome translation complex [24]. They constitute a set ofremarkably conserved genes among eukaryotes, which havenot been significantly affected by lineage-specific duplication[25]. We took advantage of their high levels of expression,which allowed the assembly of a large dataset with extensivetaxon sampling using ESTs. We then investigated the originof the polymorphisms observed within the EST collection in
Genome Biology 2008, 9:R94

http://genomebiology.com/2008/9/6/R94 Genome Biology 2008, Volume 9, Issue 6, Article R94 Marlétaz et al. R94.3
the light of genome duplication or cryptic speciation as alter-native explanatory hypotheses. Lastly, we found evidence fortrans-splicing mRNA maturation in chætognaths from thisEST data. This original mRNA processing mechanisminvolves the addition of a spliced-leader sequence at the 5'extremity of transcripts. This mechanism has been discov-ered in several animal phyla by analyzing other EST collec-tions [26]. Interestingly, the occurrence of trans-splicing inchætognaths has deep implications for the evolutionary ori-gin and functional significance of this mechanism.
Results and discussionPartial transcriptome of the chætognath S. cephalopteraThe sequencing of an EST collection of the juvenile-stagedchætognath S. cephaloptera offered the opportunity toexplore the transcriptome of this evolutionarily significantorganism. The survey of sequence length and quality sup-ported the accuracy of these data (Figure S1 in Additionaldata file 1). During these steps, we noticed that 16% ofsequences match mitochondrial rRNA sequences (12S and16S rRNAs, Figure 1) probably because the long polyadeninestretches of these rRNA molecules were isolated by the oligos-dT employed for mRNA isolation (see Materials and meth-ods). We attempted to build clusters that gathered all tran-scripts from a unique gene so as to deal with a non-redundantpartial transcriptome. However, the low complexity regionsof some ESTs, which did not include an accurate open readingframe, hindered this process. Thus, ESTs were sorted intopredicted coding and non-coding sequences using conceptualtranslation, and the coding transcripts were retained for com-parative analyses. The overall content of the EST collectionwas evaluated using these steps (Figure 1). We noticed that upto 54% of the ESTs could be non-coding polyadenylated RNA,a striking figure that is, however, similar to that obtained forthe human genome [27]. The removal of non-codingsequences greatly improved clustering efficiency, yielding1,447 clusters, of which 459 include more than one sequence(Figure S1 in Additional data file 1). A total of 694 of theseclusters have significant matches within a protein database(TrEMBL, score >50) and 250 have clear homologs in thisdatabase with an average of 72% identity (score >150).Among the transcripts that match nuclear coding genes, theRP genes are largely represented compared to other genessimilar to SwissProt entries (Figure 1).
The average gene content of the library was checked regard-ing functional annotation as implemented in Gene Ontology[28]. The S. cephaloptera library exhibited a broad diversityof functional classes with a majority of transcripts involved inmetabolism or cellular activities and a non-negligible amountof transcripts involved in development (Figure S2 in Addi-tional data file 1), which is consistent with the juvenile stageof the animals used. Hence, this EST collection contains rep-
resentative, high quality sequences, providing suitable mate-rial for comparative analyses.
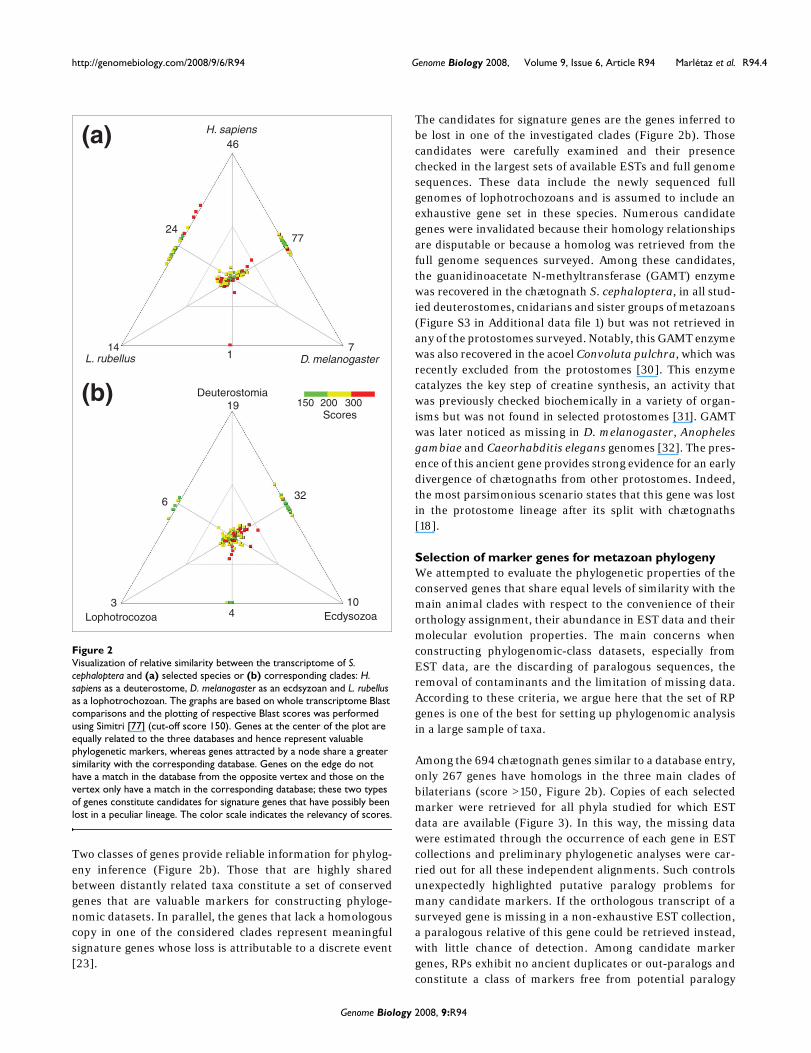
Gene core conservationThe set of non-redundant chætognath transcripts was com-pared with several databases using the Blast program. Thesedatabases first included sets of transcripts of representativespecies belonging to the most important clades of bilaterians:Drosophila melanogaster as an ecdysozoan, Lumbricus ter-restris as a lophotrochozoan and Homo sapiens as a deuter-ostome. These comparisons were depicted through theplotting of respective similarity scores for all transcripts thathave a significant match to at least one of these species (score>150, Figure 2). This comparison demonstrated that a pool of141 transcripts is strongly conserved between these distantlyrelated species (Figure 2a). Conversely, 169 transcripts didnot have significant matches in one or two of the speciesdespite their strong similarity between chætognath and theremaining species. This lack of homologs is generally imputedto extensive gene loss [21]. Therefore, further comparisonswere performed to identify genes whose homology assign-ment and gene loss in a peculiar lineage were unambiguous.Interestingly, the number of transcripts that did not match toone or more databases decreased from 169 to 74 when thecomplete set of sequences available for each bilaterian cladewas employed as the database, instead of only one represent-ative species (Figure 2b). The lack of homologous matches insome species could then be explained by an increase in evolu-tionary rates, which could have weakened the sequence simi-larity signal [29]. Additionally, the similarity level of matchesincreased when composite databases were employed (Figure2), which supports the interest in this approach for phyloge-nomic reconstruction [18].
Overall composition of the EST collectionFigure 1Overall composition of the EST collection. The annotation of transcripts is based on SwissProt (score >150) and led to identification of mitochondrial genes. The conceptual translation of ESTs allowed detection of those that include coding sequences. The large portion of non-coding polyadenylate nuclear transcripts and RPs among nuclear transcripts is the most prominent aspect of this distribution as well as the unexpected presence of mitochondrial rRNAs (12 and 16S) related to their polyadenine stretches.
12S mitochondrial rRNA
16S mitochondrial rRNA
Mitochondrial protein genes
Ribosomal proteins
Other SwissProt (≥150)
No SwissProt hit (<150)
Non-coding polyA+ mRNA
Mito
chon
dria
lN
ucle
ar
Total 11,934 ESTs
54%
19%
1%
8%
1%8%
8%
Genome Biology 2008, 9:R94
http://genomebiology.com/2008/9/6/R94 Genome Biology 2008, Volume 9, Issue 6, Article R94 Marlétaz et al. R94.4
Two classes of genes provide reliable information for phylog-eny inference (Figure 2b). Those that are highly sharedbetween distantly related taxa constitute a set of conservedgenes that are valuable markers for constructing phyloge-nomic datasets. In parallel, the genes that lack a homologouscopy in one of the considered clades represent meaningfulsignature genes whose loss is attributable to a discrete event[23].
The candidates for signature genes are the genes inferred tobe lost in one of the investigated clades (Figure 2b). Thosecandidates were carefully examined and their presencechecked in the largest sets of available ESTs and full genomesequences. These data include the newly sequenced fullgenomes of lophotrochozoans and is assumed to include anexhaustive gene set in these species. Numerous candidategenes were invalidated because their homology relationshipsare disputable or because a homolog was retrieved from thefull genome sequences surveyed. Among these candidates,the guanidinoacetate N-methyltransferase (GAMT) enzymewas recovered in the chætognath S. cephaloptera, in all stud-ied deuterostomes, cnidarians and sister groups of metazoans(Figure S3 in Additional data file 1) but was not retrieved inany of the protostomes surveyed. Notably, this GAMT enzymewas also recovered in the acoel Convoluta pulchra, which wasrecently excluded from the protostomes [30]. This enzymecatalyzes the key step of creatine synthesis, an activity thatwas previously checked biochemically in a variety of organ-isms but was not found in selected protostomes [31]. GAMTwas later noticed as missing in D. melanogaster, Anophelesgambiae and Caeorhabditis elegans genomes [32]. The pres-ence of this ancient gene provides strong evidence for an earlydivergence of chætognaths from other protostomes. Indeed,the most parsimonious scenario states that this gene was lostin the protostome lineage after its split with chætognaths[18].
Selection of marker genes for metazoan phylogenyWe attempted to evaluate the phylogenetic properties of theconserved genes that share equal levels of similarity with themain animal clades with respect to the convenience of theirorthology assignment, their abundance in EST data and theirmolecular evolution properties. The main concerns whenconstructing phylogenomic-class datasets, especially fromEST data, are the discarding of paralogous sequences, theremoval of contaminants and the limitation of missing data.According to these criteria, we argue here that the set of RPgenes is one of the best for setting up phylogenomic analysisin a large sample of taxa.
Among the 694 chætognath genes similar to a database entry,only 267 genes have homologs in the three main clades ofbilaterians (score >150, Figure 2b). Copies of each selectedmarker were retrieved for all phyla studied for which ESTdata are available (Figure 3). In this way, the missing datawere estimated through the occurrence of each gene in ESTcollections and preliminary phylogenetic analyses were car-ried out for all these independent alignments. Such controlsunexpectedly highlighted putative paralogy problems formany candidate markers. If the orthologous transcript of asurveyed gene is missing in a non-exhaustive EST collection,a paralogous relative of this gene could be retrieved instead,with little chance of detection. Among candidate markergenes, RPs exhibit no ancient duplicates or out-paralogs andconstitute a class of markers free from potential paralogy
Visualization of relative similarity between the transcriptome of S. cephaloptera and (a) selected species or (b) corresponding clades: H. sapiens as a deuterostome, D. melanogaster as an ecdsyzoan and L. rubellus as a lophotrochozoanFigure 2Visualization of relative similarity between the transcriptome of S. cephaloptera and (a) selected species or (b) corresponding clades: H. sapiens as a deuterostome, D. melanogaster as an ecdsyzoan and L. rubellus as a lophotrochozoan. The graphs are based on whole transcriptome Blast comparisons and the plotting of respective Blast scores was performed using Simitri [77] (cut-off score 150). Genes at the center of the plot are equally related to the three databases and hence represent valuable phylogenetic markers, whereas genes attracted by a node share a greater similarity with the corresponding database. Genes on the edge do not have a match in the database from the opposite vertex and those on the vertex only have a match in the corresponding database; these two types of genes constitute candidates for signature genes that have possibly been lost in a peculiar lineage. The color scale indicates the relevancy of scores.
3Lophotrocozoa
19
6
10
32
Ecdysozoa
Deuterostomia
46
7724
714L. rubellus
H. sapiens
D. melanogaster
(a)
(b)
4
150 200 300Scores
1
Genome Biology 2008, 9:R94

http://genomebiology.com/2008/9/6/R94 Genome Biology 2008, Volume 9, Issue 6, Article R94 Marlétaz et al. R94.5
assignment problems [25,33]. Moreover, the gene-specifictrees allowed detection of some contaminants in the ESTcollections, through the verification of unexpected clusteringsin the tree (for example, several EST collections of parasiticorganisms being contaminated by transcripts from theirhosts).
Next, the amount of missing data was estimated using theseraw alignments and compared with the number of ESTs ineach available collection (Figure 3). The positive correlationobserved between the number of ESTs and the completenessof the dataset is stronger when dealing with a dataset com-posed of RPs. For instance, the 5,235 EST collection of tardi-grades yielded a dataset that is 77% complete for RPs, butonly 35% complete for non-ribosomal markers. Thus, theirlarge representation in EST collections strengthens the use-fulness of RPs as phylogenetic markers.
Chætognaths within renewed metazoan phylogenyIn order to assess the branching of chætognaths and to stressthe usefulness of RP genes for phylogenomics, a RP datasetwas assembled using the composite dataset approach [18].This method depends on the selection of the least divergingcopy of each marker gene in each taxon, such as a phylum,and thus allows reduction of the branch lengths of compositetaxa (Table S1 in Additional data file 2). To overcome previousproblems, both taxon sampling and inference methods wereimproved. Several new phyla were included in this analysisand, in particular, numerous protostome groups: priapulids,platyhelminthes, nermerteans, ectoprocts, entoprocts androtifers [34-36]. Most rotifer sequences were retrieved fromOryza sativa (rice) ESTs, where they exist as contaminants,using their very specific splice-leader sequence as an anchor(see below and [37]). Rotifers constitute a key phylum withrespect to chætognaths because they were sometimes
grouped together in the gnathifera clade on the basis ofmorphological criteria [38]. Alternatively, a splitting oflophotrochozoans into two main lineages, the platyzoans(uniting platyhelminthes and rotifers) and the trochozoans(mainly annelids, molluscs, lophophorates and nermertes)has been proposed [39,40]. Otherwise, in addition to the tra-ditional site-homogenous WAG model, we have assessed thephylogeny of bilaterians using the site-heterogeneous CATmodel, which recently improved the limitation of the long-branch attraction artifact, a common pitfall in phylogeneticreconstruction [41,42]. The inclusion of the most recentlyreleased EST data for this large set of phyla led to a datasetincluding 11,730 amino acid positions and 25 taxa (Additionaldata file 4).
The analysis of this dataset confirmed the branching of chæ-tognaths at the base of the protostomes with significant sup-port values for both the site-homogeneous WAG model andthe site-heterogeneous CAT model (bootstrap proportion(BP) of 76 and posterior probability (PP) of 1; Figure 4a,b).The inclusion of chætognaths within protostomes is stillfirmly supported (BP 95, PP 1; Figure 4). The inclusion of newtaxa strengthens support for both the ecdyozoa and lophotro-chozoa clades but the exact relationships within these twoclades remain elusive [35,36,43]. Chætognaths and rotifersdo not exhibit any peculiar affinities, prompting us to rejectthe gnathifera hypothesis [38]. Conversely, the branching ofrotifers is problematic since this phylum is alternativelyincluded in ecdysozoans and lophotrochozoans depending onthe use of, respectively, site heterogeneous or homogeneousmodels (Figure 4). Thus, the clustering of platyhelminthesand rotifers in a platyzoa clade is supported by the WAGmodel but rejected by the CAT model, suggesting that thisgrouping may be somehow related to long-branch attraction(Figure 4). Alternatively, previous studies based on morphol-ogy and SSU genes have not argued for the ecdysozoan affin-ities of rotifers [38,39]. Surprisingly, CAT model analysis nolonger succeeds in recovering the monophyly of the deuteros-tomes (Figure 4b). Instead, it provides limited support for thesuccessive divergence of chordates and ambulacrarians (echi-noderms and hemichordates; PP 0.9; Figure 4b). This strik-ing topology was recovered by an independent study using thesame heterogeneous CAT model [43] but was neither con-firmed by WAG analyses (BP 89 for the monophyly of deuter-ostomes; Figure 4a) nor supported on morphological bases[34,38]. One can consider that the two unexpected branch-ings of rotifers and deuterostomes may be related to someartifact affecting the CAT model, such as sensitivity towardcompositional biases [44]. Finally, the placozoan Trichoplaxadherens surprisingly clustered within the poriferans, as asister group of the homoscleromorphs (BP 91, PP 0.94; Figure4), although this poriferan status has never been suggestedbefore [45,46]. These challenging hypotheses will be investi-gated in further studies because they have deep implicationsfor the evolution of metazoans (F Marlétaz et al., in progress).
RP minimization of missing data in EST-based phylogenomic datasetsFigure 3RP minimization of missing data in EST-based phylogenomic datasets. Dataset completeness was estimated for datasets composed of 78 RPs (red) or 115 other genes (green) retrieved from EST collections of a large range of sizes.
0
10
20
30
40
50
60
70
80
90
100
100 1,000 10,000 100,000 1,000,000
Number of ESTs (log)
RibosomalsNon-ribosomalsD
atas
et c
ompl
etne
ss (
%)
Genome Biology 2008, 9:R94

http://genomebiology.com/2008/9/6/R94 Genome Biology 2008, Volume 9, Issue 6, Article R94 Marlétaz et al. R94.6
Through extended taxon sampling and improved substitutionmodels, these analyses strongly confirm our previousstatements about basal-protostome branching of chætog-naths [18] and exclude the basal-lophotrochozan hypothesis[19]. Although some areas of bilaterian trees are sometimesincongruent depending on models and inference methods,the position of chætognaths remains remarkably stablethroughout our analyses. Furthermore, this branching is notonly supported by the presence of GAMT, an unambiguousmolecular signature, but also by the posterior Hox genes ofchætognaths that are not related to the classes specific toecdysozoans (Abd-B) or lophotrochozoans (Post1/2) [16].
Finally, this topology was also recovered by independentstudies involving alternative gene and taxon sampling[30,35,43]. In a broader perspective, the strengthening oftheir phylogenetic position makes chætognaths a key modelfor comparative genomics among bilaterians.
Genome duplication in the chætognath phylumThe clustering of similar sequences indicated that alternativenucleotide forms are present among the transcripts encodingthe same protein. Two distinct forms are observed in mostcases, although three forms encode some proteins. Theseforms are separated by a large amount of molecular diver-
The basal-protostome branching of chætognaths is confirmed through improved inference methods and expanded taxon samplingFigure 4The basal-protostome branching of chætognaths is confirmed through improved inference methods and expanded taxon sampling. A RP alignment of 11,730 positions (after GBlock filtration; see Additional data file 4) was analyzed using two classes of models. (a) Site-homogeneous model (WAG) implemented in a maximum-likelihood framework (PhyML [80] and Treefinder [81]). Similar topology and maximal posterior probabilities were obtained with Bayesian analyses using the same model (MrBayes). (b) Site-heterogeneous model (CAT) implemented in a bayesian framework (Phylobayes [79]). Plain colored circles denote nodes for which significant support values were obtained (likelihood ratio statistics based on expected-likelihood weights (LR-ELW) >0.95 for site-homogenous and PP >0.95 for site-heterogenous). Support values are indicated for selected nodes: LR-ELW statistics and bootstrap (bold type) for maximum likelihood (ML) using the WAG model and posterior probabilities for Bayesian inference using the CAT model.
Site-homogeneous(WAG model)
Site-heterogeneous(CAT model)
Ectoprocta
Nemertea
Annelida
Mollusca
Priapulida
Entoprocta
Hemichordata
Urochordata
Tardigrada
Platyhelminthes
Fungi
Rotifera
Insecta
Placozoa
Craniata
Choanoflagellata
Hydrozoa
Onychophora
Demospongia
Ctenophora
Homoscleromorpha
Chaetognatha
Anthozoa
Echinodermata
Xenoturbellida
Chelicerata
Cephalochordata
Crustacea
Nematoda
0.94
0.9
0.89
0.09
Demospongia
Rotifera
Anthozoa
Tardigrada
Chaetognatha
Cephalochordata
Echinodermata
Hemichordata
Placozoa
Insecta
Craniata
Xenoturbellida
Annelida
Homoscleromorpha
Entoprocta
Urochordata
Onychophora
Fungi
Priapulida
Platyhelminthes
Choanoflagellata
Chelicerata
Ctenophora
Ectoprocta
Mollusca
Crustacea
Nemertea
Hydrozoa
Nematoda
94/76
100/95
90/91
88/-
0.06
Lophotrochozoa
Deuterostom
ia
Porifera
Cnidaria
Ecdysozoa
Lophotrochozoa
Deuterostom
ia
Porifera
Cnidaria
Ecdysozoa
98/89
(a) (b)
Genome Biology 2008, 9:R94
http://genomebiology.com/2008/9/6/R94 Genome Biology 2008, Volume 9, Issue 6, Article R94 Marlétaz et al. R94.7
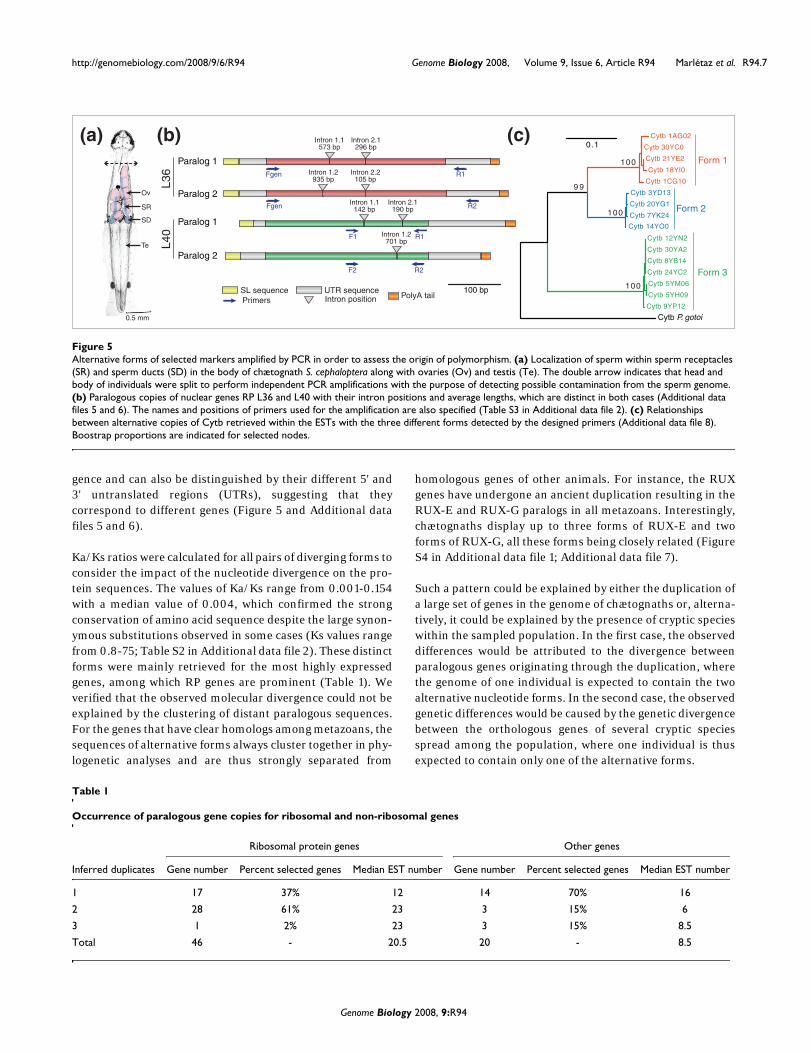
gence and can also be distinguished by their different 5' and3' untranslated regions (UTRs), suggesting that theycorrespond to different genes (Figure 5 and Additional datafiles 5 and 6).
Ka/Ks ratios were calculated for all pairs of diverging forms toconsider the impact of the nucleotide divergence on the pro-tein sequences. The values of Ka/Ks range from 0.001-0.154with a median value of 0.004, which confirmed the strongconservation of amino acid sequence despite the large synon-ymous substitutions observed in some cases (Ks values rangefrom 0.8-75; Table S2 in Additional data file 2). These distinctforms were mainly retrieved for the most highly expressedgenes, among which RP genes are prominent (Table 1). Weverified that the observed molecular divergence could not beexplained by the clustering of distant paralogous sequences.For the genes that have clear homologs among metazoans, thesequences of alternative forms always cluster together in phy-logenetic analyses and are thus strongly separated from
homologous genes of other animals. For instance, the RUXgenes have undergone an ancient duplication resulting in theRUX-E and RUX-G paralogs in all metazoans. Interestingly,chætognaths display up to three forms of RUX-E and twoforms of RUX-G, all these forms being closely related (FigureS4 in Additional data file 1; Additional data file 7).
Such a pattern could be explained by either the duplication ofa large set of genes in the genome of chætognaths or, alterna-tively, it could be explained by the presence of cryptic specieswithin the sampled population. In the first case, the observeddifferences would be attributed to the divergence betweenparalogous genes originating through the duplication, wherethe genome of one individual is expected to contain the twoalternative nucleotide forms. In the second case, the observedgenetic differences would be caused by the genetic divergencebetween the orthologous genes of several cryptic speciesspread among the population, where one individual is thusexpected to contain only one of the alternative forms.
Alternative forms of selected markers amplified by PCR in order to assess the origin of polymorphismFigure 5Alternative forms of selected markers amplified by PCR in order to assess the origin of polymorphism. (a) Localization of sperm within sperm receptacles (SR) and sperm ducts (SD) in the body of chætognath S. cephaloptera along with ovaries (Ov) and testis (Te). The double arrow indicates that head and body of individuals were split to perform independent PCR amplifications with the purpose of detecting possible contamination from the sperm genome. (b) Paralogous copies of nuclear genes RP L36 and L40 with their intron positions and average lengths, which are distinct in both cases (Additional data files 5 and 6). The names and positions of primers used for the amplification are also specified (Table S3 in Additional data file 2). (c) Relationships between alternative copies of Cytb retrieved within the ESTs with the three different forms detected by the designed primers (Additional data file 8). Boostrap proportions are indicated for selected nodes.
Paralog 1
Paralog 1
Paralog 2
Paralog 2
L36
L40
Form 1
Intron 1.1573 bp
Intron 2.1296 bp
Intron 1.1142 bp
Intron 2.1190 bp
Intron 1.2701 bp
100 bpSL sequencePrimers
F1
F2 R2
R1
R1
R2
Fgen
Fgen
UTR sequenceIntron position
Intron 1.2935 bp
Intron 2.2105 bp
0.5 mm
SR
SD
Te
Ov
Cytb 8YB14
Cytb 30YA2
Cytb 30YC0
Cytb 20YG1
Cytb 1CG10
Cytb 9YP12
Cytb 3YD13
Cytb 5YM06
Cytb 1AG02
Cytb 18YI0
Cytb 5YH09
Cytb 24YC2
Cytb 14YO0
Cytb 7YK24
Cytb 21YE2
Cytb 12YN2
Cytb P. gotoi
100
9 9
100
100
0.1
Form 2
Form 3
PolyA tail
(a) (b) (c)
Table 1
Occurrence of paralogous gene copies for ribosomal and non-ribosomal genes
Ribosomal protein genes Other genes
Inferred duplicates Gene number Percent selected genes Median EST number Gene number Percent selected genes Median EST number
1 17 37% 12 14 70% 16
2 28 61% 23 3 15% 6
3 1 2% 23 3 15% 8.5
Total 46 - 20.5 20 - 8.5
Genome Biology 2008, 9:R94
http://genomebiology.com/2008/9/6/R94 Genome Biology 2008, Volume 9, Issue 6, Article R94 Marlétaz et al. R94.8
This cryptic speciation hypothesis may be supported by thestrong polymorphism also observed for all genes of the mito-chondrial genome, which constitutes an independent lineagefrom the nuclear genome. For example, cytochrome b (Cytb)transcripts but also cytochrome oxydase I and III are splitinto distinct forms separated by large molecular distances(Figure 5c; Figure S4 in Additional data file 1; Additional datafiles 8-10), thus testifying to the presence of distinct mito-chondrial lineages within the sampled population.
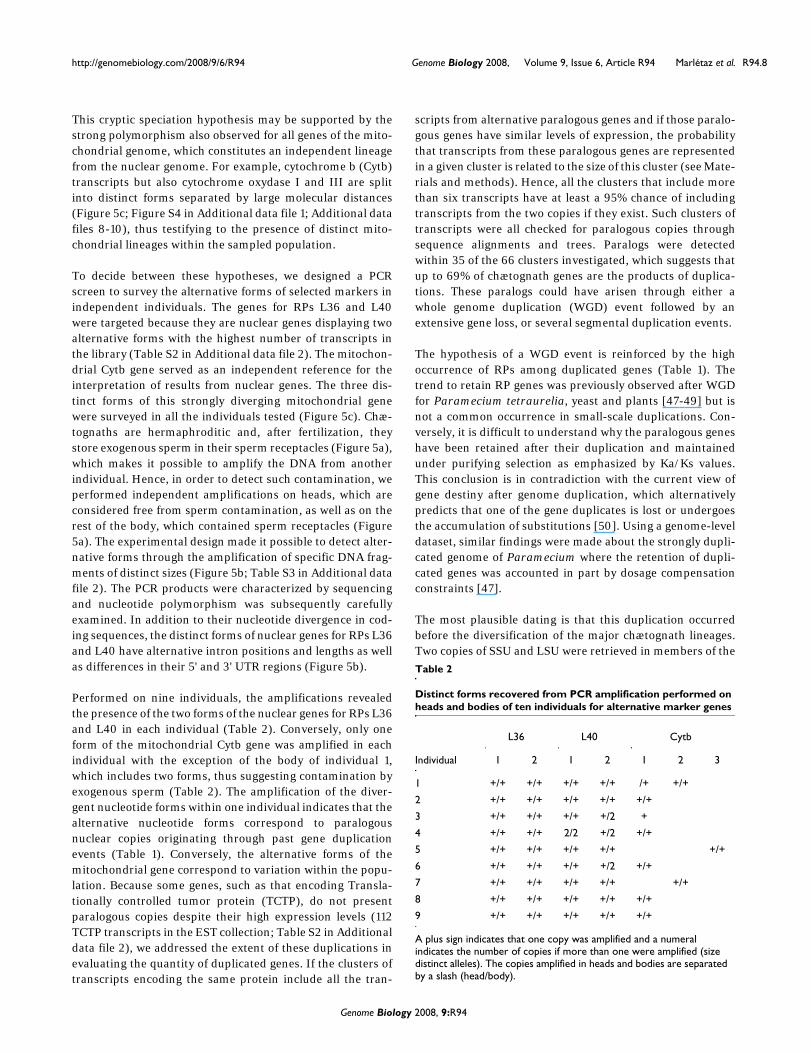
To decide between these hypotheses, we designed a PCRscreen to survey the alternative forms of selected markers inindependent individuals. The genes for RPs L36 and L40were targeted because they are nuclear genes displaying twoalternative forms with the highest number of transcripts inthe library (Table S2 in Additional data file 2). The mitochon-drial Cytb gene served as an independent reference for theinterpretation of results from nuclear genes. The three dis-tinct forms of this strongly diverging mitochondrial genewere surveyed in all the individuals tested (Figure 5c). Chæ-tognaths are hermaphroditic and, after fertilization, theystore exogenous sperm in their sperm receptacles (Figure 5a),which makes it possible to amplify the DNA from anotherindividual. Hence, in order to detect such contamination, weperformed independent amplifications on heads, which areconsidered free from sperm contamination, as well as on therest of the body, which contained sperm receptacles (Figure5a). The experimental design made it possible to detect alter-native forms through the amplification of specific DNA frag-ments of distinct sizes (Figure 5b; Table S3 in Additional datafile 2). The PCR products were characterized by sequencingand nucleotide polymorphism was subsequently carefullyexamined. In addition to their nucleotide divergence in cod-ing sequences, the distinct forms of nuclear genes for RPs L36and L40 have alternative intron positions and lengths as wellas differences in their 5' and 3' UTR regions (Figure 5b).
Performed on nine individuals, the amplifications revealedthe presence of the two forms of the nuclear genes for RPs L36and L40 in each individual (Table 2). Conversely, only oneform of the mitochondrial Cytb gene was amplified in eachindividual with the exception of the body of individual 1,which includes two forms, thus suggesting contamination byexogenous sperm (Table 2). The amplification of the diver-gent nucleotide forms within one individual indicates that thealternative nucleotide forms correspond to paralogousnuclear copies originating through past gene duplicationevents (Table 1). Conversely, the alternative forms of themitochondrial gene correspond to variation within the popu-lation. Because some genes, such as that encoding Transla-tionally controlled tumor protein (TCTP), do not presentparalogous copies despite their high expression levels (112TCTP transcripts in the EST collection; Table S2 in Additionaldata file 2), we addressed the extent of these duplications inevaluating the quantity of duplicated genes. If the clusters oftranscripts encoding the same protein include all the tran-
scripts from alternative paralogous genes and if those paralo-gous genes have similar levels of expression, the probabilitythat transcripts from these paralogous genes are representedin a given cluster is related to the size of this cluster (see Mate-rials and methods). Hence, all the clusters that include morethan six transcripts have at least a 95% chance of includingtranscripts from the two copies if they exist. Such clusters oftranscripts were all checked for paralogous copies throughsequence alignments and trees. Paralogs were detectedwithin 35 of the 66 clusters investigated, which suggests thatup to 69% of chætognath genes are the products of duplica-tions. These paralogs could have arisen through either awhole genome duplication (WGD) event followed by anextensive gene loss, or several segmental duplication events.
The hypothesis of a WGD event is reinforced by the highoccurrence of RPs among duplicated genes (Table 1). Thetrend to retain RP genes was previously observed after WGDfor Paramecium tetraurelia, yeast and plants [47-49] but isnot a common occurrence in small-scale duplications. Con-versely, it is difficult to understand why the paralogous geneshave been retained after their duplication and maintainedunder purifying selection as emphasized by Ka/Ks values.This conclusion is in contradiction with the current view ofgene destiny after genome duplication, which alternativelypredicts that one of the gene duplicates is lost or undergoesthe accumulation of substitutions [50]. Using a genome-leveldataset, similar findings were made about the strongly dupli-cated genome of Paramecium where the retention of dupli-cated genes was accounted in part by dosage compensationconstraints [47].
The most plausible dating is that this duplication occurredbefore the diversification of the major chætognath lineages.Two copies of SSU and LSU were retrieved in members of the
Table 2
Distinct forms recovered from PCR amplification performed on heads and bodies of ten individuals for alternative marker genes
L36 L40 Cytb
Individual 1 2 1 2 1 2 3
1 +/+ +/+ +/+ +/+ /+ +/+
2 +/+ +/+ +/+ +/+ +/+
3 +/+ +/+ +/+ +/2 +
4 +/+ +/+ 2/2 +/2 +/+
5 +/+ +/+ +/+ +/+ +/+
6 +/+ +/+ +/+ +/2 +/+
7 +/+ +/+ +/+ +/+ +/+
8 +/+ +/+ +/+ +/+ +/+
9 +/+ +/+ +/+ +/+ +/+
A plus sign indicates that one copy was amplified and a numeral indicates the number of copies if more than one were amplified (size distinct alleles). The copies amplified in heads and bodies are separated by a slash (head/body).
Genome Biology 2008, 9:R94

http://genomebiology.com/2008/9/6/R94 Genome Biology 2008, Volume 9, Issue 6, Article R94 Marlétaz et al. R94.9
phylum dispersed all over the tree of chætognaths [10-12].Moreover, the survey of 226 ESTs available for Flaccisagittaenflata also revealed the presence of alternative nucleotideforms for some genes (data not shown), which would confirmthat the duplication is not limited to SSU/LSU genes at thistaxonomic scale. Further genome data would be required todate the duplication, for instance, in considering the Ks distri-bution of the set of paralogs [51], and also to definitively statethe nature of the duplication through the analysis of syntenyin duplicated blocks of the genome. Nevertheless, this prelim-inary transcriptomic survey stresses the usefulness of thechætognaths to study phylum-level genome duplicationevents and the destiny of paralogous genes.
Population genomicsBeyond the molecular divergence between the codingsequences of duplicated paralogous genes, a subsequent sur-vey of the genomic sequences of selected genes revealed thatthe level of polymorphism is strong within each paralogousgene (Table S4 in Additional data file 2). Multiple nucleotidesubstitutions as well as insertion/deletion events (indels)occurred within the introns of the four selected nuclear genes(paralogous copies of the genes for both RPs L36 and L40;Additional data files 11-14). Similarly, a large number of sub-stitutions have accumulated in the various mitochondrialgenes, thus revealing distinct mitochondrial lineages withinthe sampled population (Figure 5c; Figure S4 in Additionaldata file 1). However, these strong levels of divergence remainconsistent with a population genetic structure because of theregular AT composition and the limited degree of saturationrevealed by Ts/Tv ratios, singleton positions being essentiallytransition substitutions (Table S4 in Additional data file 2;Figure S6 in Additional data file 1).
We attempted to determine the origin of this populationgenetic heterogeneity, which could, for instance, be due to acryptic speciation or to a past hybridization. For this, thesequences of each individual were compared using phyloge-netic trees and indels as discrete informative characteristics(Figure 6). For each marker gene, individual sequences splitinto several major clades supported by strong bootstrap anddiscrete indel events, which allows unambiguous identifica-tion of heterozygous individuals (Figure 6). For example,individual 4 is heterozygous for all markers and individuals 6,9 and 3 are heterozygous for at least one marker. Moreover,the occurrence of several cases of putative recombinationsbetween alleles highlights the heterozygous status of someindividuals (individuals 3 and 4, Figure 6b,d). Notably, ourPCR-based experimental design provided positive evidenceonly for heterozygosis because two amplifications (head andbody) were carried out per individual, yielding 0.5 probabilityto detect heterozygosity. Heterozygous individuals could thusbe even more abundant than observed. These heterozygouscases convincingly demonstrate that a shuffling occursbetween the most divergent alleles of each gene, which consti-tutes strong evidence for interbreeding within the sampled
population. This finding definitely excludes the possibility ofcryptic speciation within this S. cephaloptera population.Alternatively, the panmixy hypothesis was confirmed by theunimodal distribution of pairwise divergences in mismatchanalysis, which is consistent with constant population sizeand excludes a past hybridization event (Figure S6 in Addi-tional data file 1). Finally, the distinct mitochondrial lineagesare spread within the population but they are not correlatedwith any haplotype differentiation at the nuclear level, whichis a strong argument against the cryptic speciation hypothe-sis. This type of mitochondrial diversity was previously dis-covered for the planktonic species Sagitta setosa but was alsointerpreted with difficulty [52].
Strikingly, these comparisons also highlighted moleculardivergence between the head and the body of some individu-als for each of the five markers investigated (Figure 6 andAdditional data file 4). Such substitutions cannot beexplained by a heterozygous status of those individualsbecause sequences from head and body were firmly clusteredin the tree (Figure 6). For example, individual 4 exhibits well-separated alleles present in both head and body but intra-individual substitution took place between head and body forboth of these alleles (Figure 6c). This pattern of substitutionsmay be explained by the occurrence of somatic mutationsduring the life of individuals. This interpretation is corrobo-rated by the large extent of intra-individual substitutions inall marker genes and all individuals. Somatic mutations areconsidered as rare conditions, mainly known from relateddisorders in humans [53]. Less clear are the evolutionaryimplications and putative benefits of this phenomenon [54].They are sometimes suspected to play a prominent role inapoptosis and possibly in the regulation of cell division [54].Moreover, somatic mutations have been demonstrated to bemore widespread in Drosophila than in mammals [55], andare sometimes correlated with extensive chromosomerearrangement in the Drosophila lineage [56]. However, littleis known about the extent and importance of this process inthe non-model organisms. In the case of the chætognath,somatic mutation could be due to the high mutation rates thatseem to affect both germline and soma and could explain thedivergence at the population and individual levels. The possi-ble relationship of these accelerated mutation rates withstructural reshaping of the genome after duplication deservesfurther evaluation.
Notably, this level of somatic mutation generates a strongbackground noise that hinders the accurate interpretation ofpoint mutations related to the diversity of haplotypes. More-over, traditional hypotheses of population genetics are chal-lenged by our findings: the genetic distances observedbetween individuals of a single population reach species-levelwithout any evidence for cryptic speciation or past hybridiza-tion. In parallel, multiple mitochondrial lineages diverge andare spread and maintained within a single population [52]. Ifsuch features are revealed as more widespread than expected,
Genome Biology 2008, 9:R94

http://genomebiology.com/2008/9/6/R94 Genome Biology 2008, Volume 9, Issue 6, Article R94 Marlétaz et al. R94.10
Figure 6 (see legend on next page)
7 2
9 0
100
9 4
9 8
9 9
7 1
100
9 4
7 0
9 4
9 4
9 2
7 6
9 9
100
9 3
100
100
7 1
8 6
100
9 8
8 9
9 4
0.005
0.005 0.005
0.005
Ind. #7
Ind. #7
Ind. #7
Ind. #4
Ind. #2
Ind. #5
Ind. #8
Ind. #6
Ind. #2
Ind. #8
Ind. #9
Ind. #4
Ind. #3
Ind. #3
Ind. #3
Ind. #9
Ind. #6
Ind. #6
Ind. #3
Ind. #6
Ind. #6
Ind. #1
Ind. #5
Ind. #5
Ind. #5
Ind. #4
Ind. #4
Ind. #8
Ind. #8
Ind. #8
Ind. #8
Ind. #2
Ind. #4 allele 1
Ind. #4 allele 2
Ind. #7Ind. #3
Ind. #9
Ind. #9
Ind. #2
Ind. #2
Ind. #4
Ind. #4
Ind. #9
Ind. #9
100
9 1
8 8
8 5
100
100
9 9
9 9
7 9
1
2
Recombinant individual
Indel event
Head
Body
L36 form 1 L36 form 2
L40 form 1 L40 form 2
(a) (b)
(c) (d)
Genome Biology 2008, 9:R94

http://genomebiology.com/2008/9/6/R94 Genome Biology 2008, Volume 9, Issue 6, Article R94 Marlétaz et al. R94.11
the data collected from numerous population genetic or phy-logeographic studies require more cautious interpretation.This observation pleads for an increase of the sampling depthfor population genetics, especially through genomicapproaches [57].
Trans-splicing transcript maturation in chætognathsThe survey of the chætognath EST collection detected a com-mon 36 nucleotide motif shared at their 5' end between tran-scripts from unrelated genes. Selected cases showed thatthese short motifs are absent from upstream genomic regionsof the genes (Figure 7c; Additional data files 15-17). Thesefindings strongly suggest that mRNA of S. cephaloptera
undergoes trans-splicing maturation. This mRNA processingoccurs through the spliceosomal transfer of a small RNA mol-ecule at the 5' end of the mRNA from an independent spliced-leader (SL) gene and has been described in numerous species[26]. To exclude the possibility of an artifact, the 226 availa-ble EST sequences of F. enflata, another chætognath species,were screened using the identified SL sequences from S.cephaloptera. This survey led to the recovery of similar SLsequences at the 5' end of several cDNA sequences. As F.enflata and S. cephaloptera belong to the two main orders ofchætognaths [10], the trans-splicing mechanism is likely to bepresent in the whole chætognath phylum.
Relationships between haplotypes of nine individuals, including distinct head and body sequences for four marker genes, including two pairs of paralogous sequences: (a) L36 form 1; (b) L36 form 2; (c) L40 form 1; (d) L40 form 2Figure 6 (see previous page)Relationships between haplotypes of nine individuals, including distinct head and body sequences for four marker genes, including two pairs of paralogous sequences: (a) L36 form 1; (b) L36 form 2; (c) L40 form 1; (d) L40 form 2. The indels are plotted onto the branches (green lines). Noticeably, some individuals display mixed sequences from different haplotypes, which is explained by recombination events between alleles (purple star). The substitutions occurring between copies of the same allele in the head and body of individuals (blue branches) are assumed to be somatic mutations. These neighbor-joining trees were inferred assuming kimura 2 parameter distances from Additional data files 7-10. Boostrap proportions are indicated for selected nodes.
Identified S. cephaloptera operon within the BAC 35YA21Figure 7Identified S. cephaloptera operon within the BAC 35YA21. (a) Structure of the 158 kb BAC 35A21, including the predicted genes and the mapping of ESTs that bear SLs (purple). Detailed EST/BAC alignments are provided as Additional data files 15-17. (b) Detailed structure of the identified chætognath operon with RP S14 and PCNA genes and the corresponding ESTs (purple) that exhibit SL sequences. UTR (genomic, light orange; EST, light purple) and coding sequences (genomic, orange; EST, purple). (c) Alignments of selected regions of the operon, beginning and end of genes showing genomic DNA (orange) and transcripts with their alternative SL forms. The very short distance encountered between the end and beginning of the two genes argues for polycistronic transcription.
18YB09
1CC08
26YF0316YG1318YA01
6YE11
21YB19
24YH20
6YI2425YC10
6YJ13
SL
Ribosomal protein S14 PCNA
RP S14 CDS ----------------------------------------------------------------------------ATGGCGCCCAGAAA16YG13 -----------GGAAGCTTATTATTAAGTACTACCAATTTGTTTAAACTTTTATTCAGAACTTAAATTTAAAAACAATGGTGCCCAGAAA21YB19 -----------GGAAGCTTATTATTAAGTACTACCAAATTGTTTAAACTTTTATTCAGAACTTAAATTTAAAAACCATGGCGCCCAGAAA26YF03 -----------GGAAGCTTATAATTGAGTAGTTTCAATTTGTTTAAACTTTTATTCAGAACTTAAATTTAAAAACAATGGCGCCCAGAAA18YA01 -----------GGAAGCTTATAATTGAGTAGTTTCAATTTGTCTAAACTTTTATTCAGAACTTAAATTTAAAAACAATGGCGCCCAGAAAgDNA TTGCGACACTTGTGCGTGTAACGGCAAAGCCATTTTCTCGTCTTTAGCTTTTATTCAGAACTTAAATTTAAAAACAATGGCGCCCAGAAA
Alignment 1
TATCAGCAATTGTGTTGATCTGAATTCTTTTTTTCCAAATGTTTTTCCTTTCAAAAAAAAAAAAAAAAAAAAAAAAAAAAAA-------------------------------------------TATCAGCAATTGTGTTGATCTGAATTCTTTTTTTCCAAATGTTTTTCCTTTGAAAAAAAAAAAAAA-----------------------------------------------------------TATCAGCAATTGTGTTGATCTGAATTCTTTTTTTCCAAATGTTTTTCCTTTTAAGTAAAAAAAAAAAAAAAAAAAAAAAAAAAAAAA--------------------------------------TATCAGCAATTGTGTTGATCTAAATTCTTTTTTTCCAAATGTTTTTCCTTTTAAAAAAAAAAAAAAAAAAAAAAAAAAAAAA-------------------------------------------TATCAGCAATTGTGTTGATCTGAATTCTTTTTTTCCAAATGTTTTTCCTTTTAAGGCTTCGCGTAGGTAAGATGTAGATCTTAGTTTTTATAAGAGAAAGAATTTTTTTTTACGGAACACCGTTG-------------------GGAAGCTTATTATTAAGTACTACCAATTTGTTTAAAGCTTCGCGTAGGTAAGATGTAGATCTTCGTTTTTATAAGAGAAAGAATTTTTTTTTACGGAACACCGTTG
RP S14 16YG13RP S14 21YB19RP S14 26YF03 RP S14 18YA01gDNA PCNA 1CC08
Alignment 2
20 kb
0.5 kb
Alignment 1 Alignment 2
SL1
SL2
GeneTransposon
Panel (b)
PolyA tail
SL
(a)
(b)
(c)
Genome Biology 2008, 9:R94

http://genomebiology.com/2008/9/6/R94 Genome Biology 2008, Volume 9, Issue 6, Article R94 Marlétaz et al. R94.12
An extensive study of trans-splicing in the nematode phylumhas previously revealed the presence of different forms of SLsequences [58]. Similarly, several different SL sequenceswere retrieved from S. cephalotera (Table 3). This number isconsistent with the strong level of polymorphism previouslyobserved for coding sequences but two distinct SL formsalone (SL1 and SL2) represent 87% of the SL sequences(Table 3). These forms do not exhibit any specificity for thedifferent paralogs since SLs are added randomly to tran-scripts from these paralogs (Figure 7; Additional data files 5and 6). In an attempt to understand the evolutionary historyof trans-splicing within the chætognath phylum, the SL formsof F. enflata were compared with those of S. cephaloptera.This set of chætognath SL sequences splits into four mainforms: two of them, SL1 and SL3, are present in both the spe-cies investigated whereas the two other forms, SL2 and SL4,are specific for S. cephaloptera and F. enflata, respectively(Table 3). Otherwise, neither of these chætognath SL forms
display similarity with the SL of another phyla. This findingsuggests that just as in nematodes, the evolution of alterna-tive forms could have occurred at a relatively reduced taxo-nomic scale [58].
Within the EST collection, 2,914 sequences exhibit SL addi-tion, which represents 30% of nuclear transcripts (Figure 8a).Among the SL population, 72% are coding transcripts, ofwhich 46% have a homolog in SwissProt. The clustering ofsimilar coding trans-spliced transcripts indicated that 41% ofputative genes undergo SL addition. Furthermore, the rela-tionship between trans-splicing and expression level wastested through the comparison of the number of ESTs percluster of trans-spliced or non-trans-spliced transcripts. If weposit that this number can be considered as an estimate of theexpression level, trans-spliced genes are significantly moreexpressed than others (Wilcoxon rank test, p < 2.2e-16). Forinstance, among the 50 more expressed genes (that is, biggest
Table 3
Splice-leader isoforms isolated in two chætognath species: S. cephaloptera and F. enflata
Form ID Sequence Species Abundance
Form 1 SL1 GGAAGCTAAAATTCTTTTA--TTTGCTT-AATTAAA Both <
Form 2 SL2.0 GGAAGCTTATAATTGAGTAGTTTCAATTTGTTTAAA Both 70.83%
SL2.1 GGAAGCTTATAATTGAGTGGTTTCAATTTGTTTAAA S. cephaloptera <
SL2.2 GGAAGCTTATAATTGAGCAGTTTCAATTTGTTTAAA S. cephaloptera <
SL2.3 GGAAGCTTATAATTGACTATTTTCAATTTGTTTAAA S. cephaloptera <
SL2.4 GGAAGCTTATAATTGAGTATTTTCAATTTGTTTAAA S. cephaloptera 1.44%
SL2.5 GGAAGCTTATAATTGCGTATTTTCAATTTGTTTAAA S. cephaloptera <
SL2.6 GGAAGCTTATAATTGCGTAGTTTCAATTTGTTTAAA S. cephaloptera <
SL2.7 GGAAGCTTATAATTCATTAGTTTCAATTTGTTTAAA S. cephaloptera <
SL2.8 GGAAGCTTATAATTCAGTAGTTTCAATTTGTTTAAA S. cephaloptera <
SL2.9 GGAAGCTTATAATTGATTAGTTTCAATTTGTTTAAA S. cephaloptera 2.17%
SL2.10 GGAAGCTTATAACTGTTTAGTTTCAATTTGTTTAAA S. cephaloptera <
SL2.11 GGAAGCTTATAATTGACTAGTTTCAATTTGTTTAAA S. cephaloptera <
SL2.12 GGAAGCTTATAATTGAGTAGCTTCAATTTGTTTAAA S. cephaloptera <
Form 3 SL3.1 GGAAGCCAAT-TTCTACTA-CTTCACTT-GTTTAAA F. enflata -
SL3.2 GGAAGCTAAT-TTCTACTA-CTTCACTT-GTTTAAA F. enflata -
SL3.3 GGAAGCTAAT-ATCTACTA-CTTCACTTTGTTTAAA F. enflata -
Form 4 SL4.1 GGAAGCTTATTATCAAGTACTACCAATTTGTTTAAA S. cephaloptera <
SL4.2 GGAAGCTTATTATTAAGTACTACCAATTTGTTTAAA S. cephaloptera 16.91%
SL4.3 GGAAGCTTATTATTAAGTACTACCAAATTGTTTAAA S. cephaloptera <
SL4.4 GGAAGCTTATTATTAAGTACTACCAGTTTGTTTAAA S. cephaloptera <
SL4.5 GGAAGCTTATTATTACGTACTACCAATTTGTTTAAA S. cephaloptera <
SL4.6 GGAAGCTTATTATTAATTACTACCAATTTGTTTAAA S. cephaloptera <
SL4.7 GGAAGCTTATTATTATTTACTACCAATTTGTTTAAA S. cephaloptera <
SL4.8 GGAAGCTTATTATTAACTACTACCAATTTGTTTAAA S. cephaloptera <
SL4.9 GGAAGCTTATTATTCAGTACTACCAATTTGTTTAAA S. cephaloptera <
The abundance of the forms corresponds to the rate of the forms among all SLs and is calculated only for S. cephaloptera sequences. A 'less-than' sign indicates that the abundance is below 1%.
Genome Biology 2008, 9:R94

http://genomebiology.com/2008/9/6/R94 Genome Biology 2008, Volume 9, Issue 6, Article R94 Marlétaz et al. R94.13
EST clusters), only two are not trans-spliced. These valuessuggest that trans-splicing is involved in the regulation of aset of strongly expressed genes responsible for key cellularfunctions, for example, the RP set.
Hence, the set of trans-spliced genes of S. cephaloptera wascompared with those of other animals that carry out this RNAmaturation process (Table 4). Particularly, trans-splicing wascharacterized in the nematode C. elegans model, for which alarge EST set is available [58,59]. These data were especiallyuseful for extensive comparisons with S. cephaloptera (Fig-ure 8b). The amount of ESTs with a SL is slightly smaller in C.elegans (22%) than in S. cephaloptera (29%) and trans-spliced transcripts are missing from the very reduced non-coding ESTs, only 5% of the total EST collection in C. elegans.This comparison suggests that trans-splicing is at least aswidespread in S. cephaloptera as in C. elegans. Furthermore,the set of genes affected by trans-splicing in S. cephalopterawas comparable with those of C. elegans. Among the 119 dif-ferent genes that are both trans-spliced and annotated usingSwissProt with high confidence, 79 have trans-spliced homol-ogous genes in C. elegans (Additional data file 3). Thesevalues do not include the 78 RP set, which are conserved andtrans-spliced in both species. While the molecular actorsinvolved in trans-splicing do not exhibit evolutionary conser-vation [26], the genes undergoing this kind of processingcould otherwise be similar in distantly related species.
Trans-splicing has been discovered in a set of organismsspread all over the phylogenetic tree of eukaryotes, but themolecular actors involved in this RNA maturation process donot exhibit any evolutionary conservation: the SL sequencescannot be aligned and the ribonucleoproteic machineries
involved in this process have no homologs in other species[26,37,60-62]. However, the discovery of SL trans-splicing innew animal phyla strongly argues for an ancient origin of thisprocess, especially if these phyla have significant phyloge-netic positions, such as chætognaths or acoels. Noticeably, wealso found evidence for SL addition in recently released ESTsfrom the acoels (unpublished observations), worm-like ani-mals that were recently excluded from the protostomes [30].Moreover, an extensive comparison of available genomic datarevealed that the set of genes undergoing trans-splicing isevolutionarily conserved between those species, which isanother indication of a putative common evolutionary originof trans-splicing (Additional data file 3 and Table 4).
Operonic transcription in S. cephalopteraIn the nematode chætognath C. elegans and the tunicateCiona intestinalis, polycistronic mRNA molecules that con-tain two or more genes are transcribed from operon struc-tures and subsequently resolved by trans-splicing [58,59]. Wemined for similar eukaryotic operons in our pool ofsequenced bacterial artificial chromosomes (BACs) in lookingfor clusters of genes with the same transcription orientationand very short intergenic regions. The trans-splicing matura-tion of these putative operons was confirmed by mapping thetran-spliced ESTs onto these genomic sequences. One operonincluding RP S14 and PCNA genes was successfully identifiedin the BAC 35A21 that otherwise contains a large number ofgenes undergoing trans-splicing (Figure 7a; Table S5 in Addi-tional data file 2; Additional data files 15-17). EST mappingand ab initio gene prediction suggested that only three basesseparate the polyadenylation site of the upstream RP S14gene from the acceptor splice site at the PCNA downstreamgene. This distance is even shorter than that in C. intestinalis
Categories of trans-spliced transcripts for chætognath (a) S. cephaloptera and (b) nematode C. elegansFigure 8Categories of trans-spliced transcripts for chætognath (a) S. cephaloptera and (b) nematode C. elegans. The presence of a SL sequence is related to coding properties and homologous matches in SwissProt (score >150) of the sequences. C. elegans exhibits less non-coding transcripts than S. cephaloptera.
SL addition+ -
Coding mRNA, SwissProt annotated
Coding mRNA,unidentified
Non-coding polyA+ mRNA
57%
12%
1%
8%
11%
10% 4%
16%57%
0.4%
10%
12%
(a) (b)
S. cephaloptera C. elegans9,834 nuclear ESTs 147,447 ESTs
Genome Biology 2008, 9:R94

http://genomebiology.com/2008/9/6/R94 Genome Biology 2008, Volume 9, Issue 6, Article R94 Marlétaz et al. R94.14
operons [61] and clearly excludes the possibility for a re-initi-ation of transcription between the genes (Figure 7c). ThisBAC sequence contains several other predicted genes that areclosely clustered, share the same orientation and could thusbelong to operonic structures (Figure 7; Table S5 in Addi-tional data file 2). The transcripts of gene RP S14 include thetwo major SL 1 or 2 forms (Figure 7c). Similarly, transcriptsfrom both paralogous copies of duplicated genes bear any ofthe alternative SL forms. Hence, contrary to C. elegans forwhich a SL form is specific for the upstream and the down-stream genes in operons [58], no specificity of the SL for geneposition in the operon was recovered in S. cephaloptera (Fig-ure 7).
Hence, we have provided arguments for polycistronic tran-scription in another animal phylum, the chætognaths. Animaloperons have previously been described in the nematodesand in the tunicate C. intestinalis and were often interpretedas an adaptation to the genome size reduction observed inboth these organisms [26]. However, the genome size of S.cephaloptera is rather large at 1.05 Gb [63] and the transcrip-tome of chætognaths is conserved among bilaterians, in termsof gene similarity and content. Furthermore, extensive studyof genes co-transcribed in C. elegans led to the conclusionthat the operons constitute functional units in grouping genesinvolved in similar pathways [59]. Hence, the presence ofoperonic transcription in the chætognath, a basal proto-stome, strongly suggests that this mechanism should be morelikely considered as an original mode of gene regulation,whose evolutionary importance may have been underesti-mated. Thanks to the pivotal comparative genomic abilities ofchætognaths, the comparison of operon structure and con-tent between nematodes and chætognaths should allow theextension of the functional results obtained in C. elegans to alarger set of organisms, including vertebrates. Such anapproach would require further genomic data in the chætog-nath but will likely lead to the characterization of new gene
regulatory networks, potentially leading to a better under-standing of some genetic disorders [59].
ConclusionChætognaths have been formerly known for their peculiarmorphological characteristics. The fine-scale analysis of tran-scriptomic data reported here illuminates significant genomicfeatures of this phylum, strengthening its very original statusamong bilaterians. These genome features may be shuffledinto opposite categories: shared ancestral characteristics ofbilaterians on one hand and lineage-specific rearrangementsand divergences on the other. First, the chætognath tran-scriptome bears a core set of genes conserved within bilateri-ans. Together with recent evidence from lophotrochozoanssuch as annelids [64], this result confirms that the extensivegene loss previously observed within insects or nematodescannot be extended to the whole protostome lineage. The con-servation of such a core gene set was exploited for phyloge-nomic inference through the definition of RP genes as high-grade marker genes for phylogeny. Subsequent analyses ofthese marker genes confirmed the basal position of chætog-naths among protostomes, a position that has been previouslysupported [18,30,43]. This position strongly impacts on theunderstanding of the evolution of embryological characteris-tics since it rejects some developmental characteristics at thestem of bilaterians, such as enterocoely or secondary mouthopening that were considered to be deuterostome-specific.
This interpretation can be extended to the new genome-levelcharacteristics that we have highlighted here. For example,the trans-splicing mechanism of mRNA processing as well asthe operonic transcription depicted here were often inter-preted as a secondary evolved condition related to peculiaradaptations in animals such as nematodes or tunicates [26].Contrarily, the occurrence of these mechanisms in chætog-naths and acoels suggests that their evolutionary origins maybe more ancient than originally expected. Together, these
Table 4
Distribution and modalities of trans-splicing among metazoans
Phylum: species Trans-splicing Percent trans-spliced genes
Number of SL forms Operons Percent genes in operons
References
Cnidaria: Hydra vulgaris + Very few* 2 ? NA [85]
Urochordata (tunicate): Ciona intestinalis
+ ~2%* 1 + ~2% [61]
Chætognatha: Spadella cephaloptera; Flaccisagitta enflata
+ ~55% 2* + ND This study
Acoela: Convoluta pulchra + >5% 1 ? ND This study
Rotifera: Adineta ricciae; Philodina sp. + ND 1 ND ND [37]
Platyhelminth: Schistosoma mansoni; seven more species‡
+ >3%† 1-2 + ND [60,62]
Nematoda: Caenothabditis elegans + ~50% 2 + ~20% [58,59]
*This figure was obtained by the analysis of a sample of several cDNA libraries sequenced from the 5' end. †This figure was obtained from 3' end sequenced cDNA libraries and may be greatly underestimated. ‡For a precise list of these species see [62]. NA, not applicable; ND, not determined.
Genome Biology 2008, 9:R94
http://genomebiology.com/2008/9/6/R94 Genome Biology 2008, Volume 9, Issue 6, Article R94 Marlétaz et al. R94.15
findings strongly argue for the relevance of chætognaths as acomparative genomics model because of their conserved geneset, their original phylogenetic position and their original fea-tures such as trans-splicing and operonic transcription. Forexample, the study of chætognath operons could be a promis-ing approach to identify molecular pathways involved inhuman genetic diseases [59].
Some genetic and genomic features of chætognaths we haveillustrated here are unique among the animals. We have dis-covered a genome duplication event followed by a high reten-tion of duplicated genes that were maintained under strongpurifying selection. The current view of the evolution of dupli-cated genes in animals or plants mainly predicts a loss ofgenes that have not evolved novel functions [50,65]. This viewis contradicted by recent evidence from protists [47], plants[25] and the whole fungal kingdom [66] that suggests newmodalities of genome evolution and, in particular, strongretention and constraint of former duplicated genes. Hence,the chætognath genome duplication deserves further docu-mentation and investigation as one possible special caseamong bilaterians. Another unique feature of chætognaths isthe high level of divergence within the population. We dem-onstrated that this divergence is related to neither crypticspeciation nor past hybridization but conversely revealedvery high mutation rates within the germ line of individualsbut also within their soma. These observations have deepimplications for the correct interpretation of numerouspopulation genetics studies. This apparent genome plasticitywith duplications and high mutation rates is in contrast to thestrong morphological conservation of the phylum that hascontinued nearly unchanged since the early Cambrian period[8,9]. This uncoupling between morphological conservationand genome plasticity makes us wonder how the gene regula-tory networks responsible for the establishment of the bodyorganization of these animals could have remained stabledespite such a genome dynamic?
In summary, these findings promote the study of chætognathfor orienting not only morphological but also genomic char-acteristics among bilaterians. With the recent rise of lopho-trochozoans as promising model systems [67], thechætognath phylum represents the next step of investigationwithin protostomes with its striking combination of distinctancestral and derived features that could illuminate the evo-lution of bilaterians.
Materials and methodscDNA library and EST sequencingThe juvenile-staged cDNA library of S. cephaloptera, Bush1851 was previously described in [18]. Briefly, polyA+ RNAswere isolated from hatchling to one-day-old juveniles col-lected in the coastal area near Marseille (Le Brusc, La Ciotat).After reverse transcription and selection of longer transcriptsby size fractionation, cDNAs were cloned into Lambda Tri-
plex 2 vector (Clontech, Palo Alto, CA, USA). There were12,324 clones sequenced from a 5' primer at Génoscope (CNS,France). A total of 390 sequences were discarded due to vec-tor contamination or cloning artifacts, yielding a total 11,934sequences.
BAC libraryThe BAC library was constructed by BioS&T Inc. (Montreal,Québec, Canada) in the pIndigoBAC-5 vector (Epicentre,Madison, WI, USA) from adult S. cephalotera genomic DNA.Average insert size is 135 kb. The library was arrayed andselected clones were sequenced using a shotgun approach atGénoscope.
Analysis of the EST collectionThe sequences were annotated through Blast searches [68]against SwissProt and TrEMBL databases. The transcriptswere searched for reliable coding sequences using ESTScanand subsequently sorted into coding and non-codingsequences [69]. Transcripts from the same putative geneswere grouped into clusters using CLOBB [70]. The functionalGene Ontology classification was retrieved from SwissProtmatches using Fatigo [71]. Transcripts that bear splice-leaderat their 5' extremity were searched with Blastn using the SLsequences obtained from a preliminary screen. Data parsingprocesses were conducted using Perl scripting language andthe Bioperl resource [72].
Databases and searches for marker genesThe set of databases compared with the chætognath tran-scriptome includes the transcriptomes of D. melanogasterand H. sapiens downloaded from Ensembl [73]. The partialtranscriptome of Lumbricus rubellus as well as clade-levelEST databases were obtained from the NCBI EST databaseusing appropriate keywords [74]. The recently releasedgenomes of several lophotrochozoans (Capitella capitata,Helobdella robusta, Lottia gigantea, Aplysia californica,Schmidtea mediterranea and Schistosoma mansoni) wereaccessed directly on the JGI web site [75] or retrieved fromthe NCBI trace archive [76]. The respective scores were visu-alized using Simitri [77].
Duplicated gene detectionAll the transcript sequences encoding similar protein codingsequences were clustered on the basis of a similar SwissProthit or a reciprocal blast hit after conceptual translation byESTScan [69]. Gene clusters were analyzed using Clustalwalignment, phylogenetic analyses and visual checking for theinclusion of potential diverging sequences (Table S1 in Addi-tional data file 2). The minimal EST number (N) per cluster todetect the occurrence of two duplicated paralogous sequencesat a 5% probability is 6 as estimated by 1 - 2(1/2)N. Ka/Ks werecomputed using PAML [78].
Genome Biology 2008, 9:R94

http://genomebiology.com/2008/9/6/R94 Genome Biology 2008, Volume 9, Issue 6, Article R94 Marlétaz et al. R94.16
Phylogenetic analysesThe RP dataset was built using a composite databaseapproach so as to select the least divergent sequences for eachtaxon [18]. The species set involved in each taxon as well asthe data on missing sequences are available in Table S1 inAdditional data file 2. This dataset was analyzed using theCAT model as implemented in Phylobayes [79]. Maximum-likelihood and Bayesian inferences were performed usingPhyML [80], Treefinder [81] and MrBayes [82], respectively,and both assumed a WAG+Γ4+I model. For bayesian analy-ses (MrBayes and Phylobayes), at least two chains werelaunched, their convergence was verified and the correspond-ing burn-in period discarded.
PCR amplifications of duplicated markersThe individuals of S. cephaloptera employed for polymor-phism analysis were collected across the Posidonia seagrass,in the calanque of Sormiou, in the coastal area near Marseille,France. Copies of nuclear RP S36 and RP L40 and mitochon-drial Cytb genes were amplified by PCR using allele-specificprimers (Table S3 in Additional data file 2). Genomic DNAextractions were carried out on heads and bodies of S. cepha-loptera individuals from the calanque of Sormiou using theWizard SV Kit (Promega, Madison, WI, USA) and PCR reac-tions were carried out using GoTaq polymerase (Promega).PCR conditions were defined according to the melting tem-perature determined for each pair of primers. Fragmentswere subsequently gel-purified, cloned in pGEM-T easy(Promega) and sequenced. PCR artifacts were excluded bytwo approaches: first, amplifications were performed on headand body of the same individual, which allows checking of thecongruence between the sequences; then, the accuracy ofDNA polymerase was verified by amplifying and sequencingcloned DNA. These validations were confirmed by the recov-ery of the amplified sequences in the EST library and by thehigh levels of substitutions between sequences, which are toolarge to be interpreted as PCR artifacts.
Population genetic analysesPairwise sequence comparisons and molecular evolutionanalyses were performed with Mega2 software assuming thekimura 2 parameters model [83]. The demographic history ofthe populations was evaluated by mismatch analyses usingTajima's D and Fu and Li's D neutrality test implemented inDNAsp software [84].
Accession numbersThe set of sequences analyzed in this paper has been depos-ited in GenBank with the following accession numbers:CU555081-CU563075 and CU693608-CU693592 for the11,934 ESTs, CU672232 for the BAC 35YA21, and EU529890-EU529968 for the sequences of RP L36 and L40 paralogs innine individuals (Table 2).
AbbreviationsBAC, bacterial artificial chromosome; BP, bootstrap propor-tion; Cytb, cytochrome b; EST, expressed sequence tag;GAMT, guanidinoacetate N-methyltransferase; indels, inser-tion or deletion events; LSU, large subunit of ribosomal RNA;PP, posterior probability; RP, ribosomal protein; SL, splice-leader; SSU, small subunit of ribosomal RNA; UTR, untrans-lated region; WGD, whole genome duplication.
Authors' contributionsYLP and FM conceived the project and performed the analy-ses focused on phylogenomics, characterization of duplica-tion and trans-splicing. YLP and XC were in charge of theconstruction of the cDNA and BAC libraries. YLP, FM, andAG carried out the experiments related to the study of poly-morphism in the population. YP ensured the collection of ani-mals required for construction of libraries and populationgenetics studies. PW supervised the sequencing project thatSS, CD and GG carried out. FM wrote the paper and allauthors agreed on the final version.
Additional data filesThe following additional data are available. Additional datafile 1 includes supplementary Figures S1-S6 with legends:EST library statistics (Figure S1), Gene Ontology annotation(Figure S2), alignment of GAMT in selected taxa (Figure S3),trees illustrating the divergence between copies of nuclearand mitochondrial genes in the library (Figure S4), transitionversus transversion ratios for the five targeted genes (FigureS5), and mismatch analyses and testing for the five targetedgenes (Figure S6). Additional data file 2 includes supplemen-tary Tables S1-S5 with legends: composition of the compositetaxa involved in phylogenomic analyses (Table S1), list of allclusters of transcripts corresponding to alternative forms ornot with Ka/Ks ratios (Table S2), list of primers employed forPCR amplifications of alternative forms (Table S3), compari-son of molecular evolution trends for four genes retrieved innine individuals (Table S4), and annotation of the BAC 35A21(Table S5). Additional data file 3 lists the trans-spliced genesconserved between S. cephaloptera and C. elegans andho-mologous to a SwissProt entry (Figure S6 in Additional datafile 1). Additional data file 4 is the concatenated gblockedalignment that clusters 77 RPs, yielding 24 taxa and 11,730shuffled amino acid positions. This dataset was employed forphylogenomic reconstruction. Additional data files 5 and 6are the transcript sequences of RP L36 (Additional data file 5)and RP L40 (Additional data file 6) exhibiting the alternativeforms corresponding to paralogous copies and the position ofprimers designed to specifically amplify these forms. Addi-tional data file 7 is the alignment of amino acid sequences ofRUX paralogs and variants from S. cephaloptera and someother eukaryotic taxa. Additional data file 8 is the alignmentof Cytb displaying selected variants retrieved from the ESTlibrary and the coding sequences of Cytb from nine
Genome Biology 2008, 9:R94

http://genomebiology.com/2008/9/6/R94 Genome Biology 2008, Volume 9, Issue 6, Article R94 Marlétaz et al. R94.17
individuals showing the differences between genetic lineageswithin the population (primers employed for the specificamplifications are included). Additional data files 9 and 10are the alignments of cytochrome oxydase I and III tran-scripts retrieved from the EST library. Additional data files 11,12, 13 and 14 are the alignments of genomic sequence of par-alogs of RP L36 (paralogs 1 and 2, Additional data files 11 and12) and RP L40 (paralogs 1 and 2, Additional data files 13 and14) from 9 individuals that have been amplified from the body(B) or head (H) of individuals as indicated in the sequencename. Additional data files 15, 16 and 17 are EST/BAC align-ments for four trans-spliced genes present in BAC 35A21,whose transcripts are represented in the EST library. Addi-tional data file 15 contains the RP S14 and PCNA genes gath-ered in an operonic structure and eight matching ESTs.Additional data file 16 contains the COP9 gene and twomatching ESTs. Additional data file 17 contains an unidenti-fied gene matching EST clones 6YJ23. All these alignmentsclearly exhibit lack of a SL motif in the genomic sequence.Additional data file 1Supplementary Figures S1-S6Figure S1: EST library statistics. Figure S2: Gene Ontology annota-tion. Figure S3: alignment of GAMT in selected taxa. Figure S4: trees illustrating the divergence between copies of nuclear and mitochondrial genes in the library. Figure S5: transition versus transversion ratios for the five targeted genes. Figure S6: mismatch analyses and testing for the five targeted genes.Click here for fileAdditional data file 2Supplementary Tables S1-S5Table S1: composition of the composite taxa involved in phyloge-nomic analyses. Table S2: list of all clusters of transcripts corre-sponding to alternative forms or not with Ka/Ks ratios. Table S3: list of primers employed for PCR amplifications of alternative forms. Table S4: comparison of molecular evolution trends for four genes retrieved in nine individuals. Table S5: annotation of the BAC 35A21.Click here for fileAdditional data file 3Trans-spliced genes conserved between S. cephaloptera and C. ele-gans and homologous to a SwissProt entryTrans-spliced genes conserved between S. cephaloptera and C. ele-gans and homologous to a SwissProt entry (Figure S6 in Additional data file 1).Click here for fileAdditional data file 4Concatenated gblocked alignment that clusters 77 RPs, yielding 24 taxa and 11,730 shuffled amino acid positionsThis dataset was employed for phylogenomic reconstruction.Click here for fileAdditional data file 5Transcript sequences of RP L36 exhibiting the alternative forms corresponding to paralogous copies and the position of primers designed to specifically amplify these formsTranscript sequences of RP L36 exhibiting the alternative forms corresponding to paralogous copies and the position of primers designed to specifically amplify these forms.Click here for fileAdditional data file 6Transcript sequences of RP L40 exhibiting the alternative forms corresponding to paralogous copies and the position of primers designed to specifically amplify these formsTranscript sequences of RP L40 exhibiting the alternative forms corresponding to paralogous copies and the position of primers designed to specifically amplify these forms.Click here for fileAdditional data file 7Alignment of amino acid sequences of RUX paralogs and variants from S. cephaloptera and some other eukaryotic taxaAlignment of amino acid sequences of RUX paralogs and variants from S. cephaloptera and some other eukaryotic taxa.Click here for fileAdditional data file 8Alignment of Cytb displaying selected variants retrieved from the EST library and the coding sequences of Cytb from nine individuals showing the differences between genetic lineages within the populationPrimers employed for the specific amplifications are included.Click here for fileAdditional data file 9Alignment of cytochrome oxydase I transcripts retrieved from the EST libraryAlignment of cytochrome oxydase I transcripts retrieved from the EST library.Click here for fileAdditional data file 10Alignment of cytochrome oxydase III transcripts retrieved from the EST libraryAlignment of cytochrome oxydase III transcripts retrieved from the EST library.Click here for fileAdditional data file 11Alignments of genomic sequences of paralogs of RP L36 (paralog 1) from nine individualsSequences were amplified from the body (B) or head (H) of individ-uals as indicated in the sequence name.Click here for fileAdditional data file 12Alignments of genomic sequences of paralogs of RP L36 (paralog 2) from nine individualsSequences were amplified from the body (B) or head (H) of individ-uals as indicated in the sequence name.Click here for fileAdditional data file 13Alignments of genomic sequences of paralogs of RP L40 (paralog 1) from nine individualsSequences were amplified from the body (B) or head (H) of individ-uals as indicated in the sequence name.Click here for fileAdditional data file 14Alignments of genomic sequences of paralogs of RP L40 (paralog 2) from nine individualsSequences were amplified from the body (B) or head (H) of individ-uals as indicated in the sequence name.Click here for fileAdditional data file 15EST/BAC alignment trans-spliced genes present in BAC 35A21: RP S14 and PCNA genes gathered in an operonic structure and eight matching ESTsAll the alignments in Additional data files 15, 16, 17 clearly exhibit lack of a SL motif in the genomic sequence.Click here for fileAdditional data file 16EST/BAC alignment trans-spliced genes present in BAC 35A21: the COP9 gene and two matching ESTsAll the alignments in Additional data files 15, 16, 17 clearly exhibit lack of a SL motif in the genomic sequence.Click here for fileAdditional data file 17EST/BAC alignment trans-spliced genes present in BAC 35A21: an unidentified gene matching EST clones 6YJ23All the alignments in Additional data files 15, 16, 17 clearly exhibit lack of a SL motif in the genomic sequence.Click here for file
AcknowledgementsWe thank Bastien Boussau and Cédric Finet for their insightful commentson the manuscript. We also thank Eliane Alivon for her help in the molec-ular biology experiments, Susan Cure and Andy Saurin for correcting themanuscript. This work was supported by the GIS Génomique Marine(CNRS), the Consortium National de Recherche en Génomique, BQRfrom Université de Provence and Université de la Méditerranée. FM is sup-ported by a BDI CNRS Fellowship.
References1. Putnam NH, Srivastava M, Hellsten U, Dirks B, Chapman J, Salamov
A, Terry A, Shapiro H, Lindquist E, Kapitonov VV, Jurka J, Genikhov-ich G, Grigoriev IV, Lucas SM, Steele RE, Finnerty JR, Technau U, Mar-tindale MQ, Rokhsar DS: Sea anemone genome revealsancestral eumetazoan gene repertoire and genomicorganization. Science 2007, 317:86-94.
2. Duboule D: The rise and fall of Hox gene clusters. Development2007, 134:2549-2560.
3. Seo HC, Edvardsen RB, Maeland AD, Bjordal M, Jensen MF, HansenA, Flaat M, Weissenbach J, Lehrach H, Wincker P, Reinhardt R,Chourrout D: Hox cluster disintegration with persistentanteroposterior order of expression in Oikopleura dioica.Nature 2004, 431:67-71.
4. Ball EE, Miller DJ: Phylogeny: the continuing classificatoryconundrum of chaetognaths. Curr Biol 2006, 16:R593-R596.
5. Hyman LH: The Invertebrates, Vol. 5, Smaller Coelomate Groups. NewYork: McGraw-Hill; 1959.
6. Harzsch S, Muller CH: A new look at the ventral nerve centreof Sagitta: implications for the phylogenetic position of Cha-etognatha (arrow worms) and the evolution of the bilateriannervous system. Front Zool 2007, 4:14.
7. Kapp H: The unique embryology of Chaetognatha. Zool Anz2000, 239:263-266.
8. Chen JY, Huang DY: A possible Lower Cambrian chaetognath(arrow worm). Science 2002, 298:187.
9. Vannier J, Steiner M, Renvoisé E, Hu SX, Casanova JP: Early Cam-brian origin of modern food webs: evidence from predatorarrow worms. Proc Biol Sci 2007, 274:627-633.
10. Papillon D, Perez Y, Caubit X, Le Parco Y: Systematics of Chae-tognatha under the light of molecular data, using duplicatedribosomal 18S DNA sequences. Mol Phylogenet Evol 2006,38:621-634.
11. Telford MJ, Holland PW: The phylogenetic affinities of the cha-etognaths: a molecular analysis. Mol Biol Evol 1993, 10:660-676.
12. Telford MJ, Holland PW: Evolution of 28S ribosomal DNA inchaetognaths: duplicate genes and molecular phylogeny. J
Mol Evol 1997, 44:135-144.13. Helfenbein KG, Fourcade HM, Vanjani RG, Boore JL: The mito-
chondrial genome of Paraspadella gotoi is highly reduced andreveals that chaetognaths are a sister group to protostomes.Proc Natl Acad Sci USA 2004, 101:10639-10643.
14. Papillon D, Perez Y, Caubit X, Le Parco Y: Identification of chae-tognaths as protostomes is supported by the analysis of theirmitochondrial genome. Mol Biol Evol 2004, 21:2122-2129.
15. Papillon D, Perez Y, Fasano L, Le Parco Y, Caubit X: Hox gene sur-vey in the chaetognath Spadella cephaloptera: evolutionaryimplications. Dev Genes Evol 2003, 213:142-148.
16. Matus DQ, Halanych KM, Martindale MQ: The Hox gene comple-ment of a pelagic chaetognath, Flaccisagitta enflata. IntegrComp Biol 2007, 47:854-864.
17. Delsuc F, Brinkmann H, Philippe H: Phylogenomics and thereconstruction of the tree of life. Nat Rev Genet 2005, 6:361-375.
18. Marlétaz F, Martin E, Perez Y, Papillon D, Caubit X, Lowe CJ, FreemanB, Fasano L, Dossat C, Wincker P, Weissenbach J, Le Parco Y: Cha-etognath phylogenomics: a protostome with deuterostome-like development. Curr Biol 2006, 16:R577-R578.
19. Matus DQ, Copley RR, Dunn CW, Hejnol A, Eccleston H, HalanychKM, Martindale MQ, Telford MJ: Broad taxon and gene samplingindicate that chaetognaths are protostomes. Curr Biol 2006,16:R575-R576.
20. Philippe H, Lartillot N, Brinkmann H: Multigene analyses of bilat-erian animals corroborate the monophyly of Ecdysozoa,Lophotrochozoa, and Protostomia. Mol Biol Evol 2005,22:1246-1253.
21. Kortschak RD, Samuel G, Saint R, Miller DJ: EST analysis of thecnidarian Acropora millepora reveals extensive gene loss andrapid sequence divergence in the model invertebrates. CurrBiol 2003, 13:2190-2195.
22. Philippe H, Telford MJ: Large-scale sequencing and the new ani-mal phylogeny. Trends Ecol Evol 2006, 21:614-620.
23. Rokas A, Holland PW: Rare genomic changes as a tool forphylogenetics. Trends Ecol Evol 2000, 15:454-459.
24. Doudna JA, Rath VL: Structure and function of the eukaryoticribosome: the next frontier. Cell 2002, 109:153-156.
25. Maere S, De Bodt S, Raes J, Casneuf T, Van Montagu M, Kuiper M, Vande Peer Y: Modeling gene and genome duplications ineukaryotes. Proc Natl Acad Sci USA 2005, 102:5454-5459.
26. Hastings KE: SL trans-splicing: easy come or easy go? TrendsGenet 2005, 21:240-247.
27. Kapranov P, Willingham AT, Gingeras TR: Genome-wide tran-scription and the implications for genomic organization. NatRev Genet 2007, 8:413-423.
28. Xie H, Wasserman A, Levine Z, Novik A, Grebinskiy V, Shoshan A,Mintz L: Large-scale protein annotation through geneontology. Genome Res 2002, 12:785-794.
29. Parkinson J, Mitreva M, Whitton C, Thomson M, Daub J, Martin J,Schmid R, Hall N, Barrell B, Waterston RH, McCarter JP, Blaxter ML:A transcriptomic analysis of the phylum Nematoda. NatGenet 2004, 36:1259-1267.
30. Philippe H, Brinkmann H, Martinez P, Riutort M, Baguñà J: Acoel flat-worms are not platyhelminthes: evidence fromphylogenomics. PLoS ONE 2007, 2:e717.
31. Van Pilsum JF, Stephens GC, Taylor D: Distribution of creatine,guanidinoacetate and the enzymes for their biosynthesis inthe animal kingdom. Implications for phylogeny. Biochem J1972, 126:325-345.
32. Zdobnov EM, von Mering C, Letunic I, Torrents D, Suyama M, CopleyRR, Christophides GK, Thomasova D, Holt RA, Subramanian GM,Mueller HM, Dimopoulos G, Law JH, Wells MA, Birney E, Charlab R,Halpern AL, Kokoza E, Kraft CL, Lai Z, Lewis S, Louis C, Barillas-MuryC, Nusskern D, Rubin GM, Salzberg SL, Sutton GG, Topalis P, WidesR, Wincker P, et al.: Comparative genome and proteome anal-ysis of Anopheles gambiae and Drosophila melanogaster. Sci-ence 2002, 298:149-159.
33. Sonnhammer EL, Koonin EV: Orthology, paralogy and proposedclassification for paralog subtypes. Trends Genet 2002,18:619-620.
34. Bourlat SJ, Juliusdottir T, Lowe CJ, Freeman R, Aronowicz J, Kir-schner M, Lander ES, Thorndyke M, Nakano H, Kohn AB, Heyland A,Moroz LL, Copley RR, Telford MJ: Deuterostome phylogenyreveals monophyletic chordates and the new phylumXenoturbellida. Nature 2006, 444:85-88.
35. Hausdorf B, Helmkampf M, Meyer A, Witek A, Herlyn H, BruchhausI, Hankeln T, Struck TH, Lieb B: Spiralian phylogenomics
Genome Biology 2008, 9:R94
http://www.ncbi.nlm.nih.gov/entrez/query.fcgi?cmd=Retrieve&db=PubMed&dopt=Abstract&list_uids=8336548
http://www.ncbi.nlm.nih.gov/entrez/query.fcgi?cmd=Retrieve&db=PubMed&dopt=Abstract&list_uids=8336548
http://www.ncbi.nlm.nih.gov/entrez/query.fcgi?cmd=Retrieve&db=PubMed&dopt=Abstract&list_uids=9069174
http://genomebiology.com/2008/9/6/R94 Genome Biology 2008, Volume 9, Issue 6, Article R94 Marlétaz et al. R94.18
supports the resurrection of Bryozoa comprising Ectoproctaand Entoprocta. Mol Biol Evol 2007, 24:2723-2729.
36. Struck TH, Fisse F: Phylogenetic position of Nemertea derivedfrom phylogenomic data. Mol Biol Evol 2008, 25:728-736.
37. Pouchkina-Stantcheva NN, Tunnacliffe A: Spliced leader RNA-mediated trans-splicing in phylum Rotifera. Mol Biol Evol 2005,22:1482-1489.
38. Nielsen C: Animal Evolution: Interelationships of the Living Phyla. NewYork: Oxford University Press; 2001.
39. Giribet G, Distel DL, Polz M, Sterrer W, Wheeler WC: Triploblas-tic relationships with emphasis on the acoelomates and theposition of Gnathostomulida, Cycliophora, Plathelminthes,and Chaetognatha: a combined approach of 18S rDNAsequences and morphology. Syst Biol 2000, 49:539-562.
40. Halanych KM: The new view of animal phylogeny. Annu Rev EcolEvol Syst 2004, 35:229-256.
41. Baurain D, Brinkmann H, Philippe H: Lack of resolution in the ani-mal phylogeny: closely spaced cladogeneses or undetectedsystematic errors? Mol Biol Evol 2007, 24:6-9.
42. Lartillot N, Brinkmann H, Philippe H: Suppression of long-branchattraction artefacts in the animal phylogeny using a site-het-erogeneous model. BMC Evol Biol 2007, 7(Suppl 1):S4.
43. Lartillot N, Philippe H: Improvement of molecular phylogeneticinference and the phylogeny of Bilateria. Philos Trans R Soc LondB Biol Sci 2008, 363:1463-1472.
44. Blanquart S, Lartillot N: A site- and time-heterogeneous modelof amino-acid replacement. Mol Biol Evol 2008, 25:842-858.
45. Dellaporta SL, Xu A, Sagasser S, Jakob W, Moreno MA, Buss LW, Sch-ierwater B: Mitochondrial genome of Trichoplax adhaerenssupports placozoa as the basal lower metazoan phylum. ProcNatl Acad Sci USA 2006, 103:8751-8756.
46. Schierwater B: My favorite animal, Trichoplax adhaerens. Bioes-says 2005, 27:1294-1302.
47. Aury JM, Jaillon O, Duret L, Noel B, Jubin C, Porcel BM, Ségurens B,Daubin V, Anthouard V, Aiach N, Arnaiz O, Billaut A, Beisson J, BlancI, Bouhouche K, Câmara F, Duharcourt S, Guigo R, Gogendeau D,Katinka M, Keller AM, Kissmehl R, Klotz C, Koll F, Le Mouël A, Lep-ère G, Malinsky S, Nowacki M, Nowak JK, Plattner H, et al.: Globaltrends of whole-genome duplications revealed by the ciliateParamecium tetraurelia. Nature 2006, 444:171-178.
48. Blanc G, Wolfe KH: Functional divergence of duplicated genesformed by polyploidy during Arabidopsis evolution. Plant Cell2004, 16:1679-1691.
49. Seoighe C, Wolfe KH: Yeast genome evolution in the post-genome era. Curr Opin Microbiol 1999, 2:548-554.
50. Force A, Lynch M, Pickett FB, Amores A, Yan YL, Postlethwait J:Preservation of duplicate genes by complementary, degen-erative mutations. Genetics 1999, 151:1531-1545.
51. Vandepoele K, De Vos W, Taylor JS, Meyer A, Van de Peer Y: Majorevents in the genome evolution of vertebrates: paranomeage and size differ considerably between ray-finned fishesand land vertebrates. Proc Natl Acad Sci USA 2004, 101:1638-1643.
52. Peijnenburg KT, Fauvelot C, Breeuwer JA, Menken SB: Spatial andtemporal genetic structure of the planktonic Sagitta setosa(Chaetognatha) in European seas as revealed by mitochon-drial and nuclear DNA markers. Mol Ecol 2006, 15:3319-3338.
53. Youssoufian H, Pyeritz RE: Mechanisms and consequences ofsomatic mosaicism in humans. Nat Rev Genet 2002, 3:748-758.
54. Pineda-Krch M, Lehtilä K: Costs and benefits of genetic hetero-geneity within organisms. J Evol Biol 2004, 17:1167-1177.
55. Garcia AM, Derventzi A, Busuttil R, Calder RB, Perez E Jr, ChadwellL, Dolle ME, Lundell M, Vijg J: A model system for analyzingsomatic mutations in Drosophila melanogaster. Nat Methods2007, 4:401-403.
56. Ranz JM, Maurin D, Chan YS, von Grotthuss M, Hillier LW, Roote J,Ashburner M, Bergman CM: Principles of genome evolution inthe Drosophila melanogaster species group. PLoS Biol 2007,5:e152.
57. Luikart G, England PR, Tallmon D, Jordan S, Taberlet P: The powerand promise of population genomics: from genotyping togenome typing. Nat Rev Genet 2003, 4:981-994.
58. Guiliano DB, Blaxter ML: Operon conservation and the evolu-tion of trans-splicing in the phylum Nematoda. PLoS Genet2006, 2:e198.
59. Blumenthal T, Gleason KS: Caenorhabditis elegans operons: formand function. Nat Rev Genet 2003, 4:112-120.
60. Davis RE, Hodgson S: Gene linkage and steady state RNAs sug-gest trans-splicing may be associated with a polycistronic
transcript in Schistosoma mansoni. Mol Biochem Parasitol 1997,89:25-39.
61. Satou Y, Hamaguchi M, Takeuchi K, Hastings KE, Satoh N: Genomicoverview of mRNA 5'-leader trans-splicing in the ascidianCiona intestinalis. Nucleic Acids Res 2006, 34:3378-3388.
62. Zayas RM, Bold TD, Newmark PA: Spliced-leader trans-splicingin freshwater planarians. Mol Biol Evol 2005, 22:2048-2054.
63. Animal Genome Size Database [http://www.genomesize.com]64. Raible F, Tessmar-Raible K, Osoegawa K, Wincker P, Jubin C, Bala-
voine G, Ferrier D, Benes V, de Jong P, Weissenbach J, Bork P, ArendtD: Vertebrate-type intron-rich genes in the marine annelidPlatynereis dumerilii. Science 2005, 310:1325-1326.
65. Taylor JS, Raes J: Duplication and divergence: the evolution ofnew genes and old ideas. Annu Rev Genet 2004, 38:615-643.
66. Wapinski I, Pfeffer A, Friedman N, Regev A: Natural history andevolutionary principles of gene duplication in fungi. Nature2007, 449:54-61.
67. Denes AS, Jékely G, Steinmetz PR, Raible F, Snyman H, Prud'hommeB, Ferrier DE, Balavoine G, Arendt D: Molecular architecture ofannelid nerve cord supports common origin of nervous sys-tem centralization in bilateria. Cell 2007, 129:277-288.
68. Altschul SF, Madden TL, Schäffer AA, Zhang J, Zhang Z, Miller W, Lip-man DJ: Gapped BLAST and PSI-BLAST: a new generation ofprotein database search programs. Nucleic Acids Res 1997,25:3389-3402.
69. Lottaz C, Iseli C, Jongeneel CV, Bucher P: Modeling sequencingerrors by combining hidden Markov models. Bioinformatics2003, 19(Suppl 2):ii103-ii112.
70. Parkinson J, Guiliano DB, Blaxter M: Making sense of ESTsequences by CLOBBing them. BMC Bioinformatics 2002, 3:31.
71. Al-Shahrour F, Diaz-Uriarte R, Dopazo J: FatiGO: a web tool forfinding significant associations of Gene Ontology terms withgroups of genes. Bioinformatics 2004, 20:578-580.
72. Stajich JE, Block D, Boulez K, Brenner SE, Chervitz SA, Dagdigian C,Fuellen G, Gilbert JG, Korf I, Lapp H, Lehvaslaiho H, Matsalla C, Mun-gall CJ, Osborne BI, Pocock MR, Schattner P, Senger M, Stein LD,Stupka E, Wilkinson MD, Birney E: The Bioperl toolkit: Perl mod-ules for the life sciences. Genome Res 2002, 12:1611-1618.
73. Ensembl Genome Browser [http://www.ensembl.org]74. NCBI EST Database (dbEST) [http://www.ncbi.nlm.nih.gov/
dbEST]75. JGI Eukaryotic Genomics [http://genome.jgi-psf.org]76. NCBI Trace Archive [http://www.ncbi.nlm.nih.gov/Traces]77. Parkinson J, Blaxter M: SimiTri--visualizing similarity relation-
ships for groups of sequences. Bioinformatics 2003, 19:390-395.78. Yang Z: PAML 4: Phylogenetic Analysis by Maximum
Likelihood. Mol Biol Evol 2007, 24:1586-1591.79. Lartillot N, Philippe H: A Bayesian mixture model for across-
site heterogeneities in the amino-acid replacement process.Mol Biol Evol 2004, 21:1095-1109.
80. Guindon S, Gascuel O: A simple, fast, and accurate algorithmto estimate large phylogenies by maximum likelihood. SystBiol 2003, 52:696-704.
81. Jobb G, von Haeseler A, Strimmer K: TREEFINDER: a powerfulgraphical analysis environment for molecular phylogenetics.BMC Evol Biol 2004, 4:18.
82. Ronquist F, Huelsenbeck JP: MrBayes 3: Bayesian phylogeneticinference under mixed models. Bioinformatics 2003,19:1572-1574.
83. Kumar S, Tamura K, Jakobsen IB, Nei M: MEGA2: molecular evo-lutionary genetics analysis software. Bioinformatics 2001,17:1244-1245.
84. Rozas J, Sánchez-DelBarrio JC, Messeguer X, Rozas R: DnaSP, DNApolymorphism analyses by the coalescent and othermethods. Bioinformatics 2003, 19:2496-2497.
85. Stover NA, Steele RE: Trans-spliced leader addition to mRNAsin a cnidarian. Proc Natl Acad Sci USA 2001, 98:5693-5698.
Genome Biology 2008, 9:R94
http://www.ncbi.nlm.nih.gov/entrez/query.fcgi?cmd=Retrieve&db=PubMed&dopt=Abstract&list_uids=9297698
http://www.ncbi.nlm.nih.gov/entrez/query.fcgi?cmd=Retrieve&db=PubMed&dopt=Abstract&list_uids=9254694