Transcriptome architecture across tissues in the pig
20
BioMed Central Page 1 of 20 (page number not for citation purposes) BMC Genomics Open Access Research article Transcriptome architecture across tissues in the pig André LJ Ferraz 1,2 , Ana Ojeda 1 , Manel López-Béjar 3 , Lana T Fernandes 4 , Anna Castelló 1 , Josep M Folch 1 and Miguel Pérez-Enciso* 1,5 Address: 1 Departament de Ciència Animal i dels Aliments, Facultat de Veterinària, Universitat Autònoma de Barcelona, 08193 Bellaterra, Spain, 2 Faculdade de Ciências Agrárias e Veterinária, Universidade Estadual Paulista (UNESP), 14884-900 Jaboticabal – SP, Brazil, 3 Departament de Sanitat i d'Anatomia Animals, Facultat de Veterinària, Universitat Autònoma de Barcelona, 08193 Bellaterra, Spain, 4 Centre de Recerca en Sanitat Animal (CReSA), Universitat Autònoma de Barcelona, 08193 Bellaterra, Spain and 5 Institut Català de Recerca i Estudis Avançats (ICREA), C/Lluis Companys 23, 08010 Barcelona, Spain Email: André LJ Ferraz - [email protected]; Ana Ojeda - [email protected]; Manel López-Béjar - [email protected]; Lana T Fernandes - [email protected]; Anna Castelló - [email protected]; Josep M Folch - [email protected]; Miguel Pérez- Enciso* - [email protected] * Corresponding author Abstract Background: Artificial selection has resulted in animal breeds with extreme phenotypes. As an organism is made up of many different tissues and organs, each with its own genetic programme, it is pertinent to ask: How relevant is tissue in terms of total transcriptome variability? Which are the genes most distinctly expressed between tissues? Does breed or sex equally affect the transcriptome across tissues? Results: In order to gain insight on these issues, we conducted microarray expression profiling of 16 different tissues from four animals of two extreme pig breeds, Large White and Iberian, two males and two females. Mixed model analysis and neighbor – joining trees showed that tissues with similar developmental origin clustered closer than those with different embryonic origins. Often a sound biological interpretation was possible for overrepresented gene ontology categories within differentially expressed genes between groups of tissues. For instance, an excess of nervous system or muscle development genes were found among tissues of ectoderm or mesoderm origins, respectively. Tissue accounted for ~11 times more variability than sex or breed. Nevertheless, we were able to confidently identify genes with differential expression across tissues between breeds (33 genes) and between sexes (19 genes). The genes primarily affected by sex were overall different than those affected by breed or tissue. Interaction with tissue can be important for differentially expressed genes between breeds but not so much for genes whose expression differ between sexes. Conclusion: Embryonic development leaves an enduring footprint on the transcriptome. The interaction in gene × tissue for differentially expressed genes between breeds suggests that animal breeding has targeted differentially each tissue's transcriptome. Published: 16 April 2008 BMC Genomics 2008, 9:173 doi:10.1186/1471-2164-9-173 Received: 7 December 2007 Accepted: 16 April 2008 This article is available from: http://www.biomedcentral.com/1471-2164/9/173 © 2008 Ferraz et al; licensee BioMed Central Ltd. This is an Open Access article distributed under the terms of the Creative Commons Attribution License (http://creativecommons.org/licenses/by/2.0 ), which permits unrestricted use, distribution, and reproduction in any medium, provided the original work is properly cited.
-
Upload
independent -
Category
Documents
-
view
0 -
download
0
Transcript of Transcriptome architecture across tissues in the pig

BioMed CentralBMC Genomics
ss
Open AcceResearch articleTranscriptome architecture across tissues in the pigAndré LJ Ferraz1,2, Ana Ojeda1, Manel López-Béjar3, Lana T Fernandes4, Anna Castelló1, Josep M Folch1 and Miguel Pérez-Enciso*1,5Address: 1Departament de Ciència Animal i dels Aliments, Facultat de Veterinària, Universitat Autònoma de Barcelona, 08193 Bellaterra, Spain, 2Faculdade de Ciências Agrárias e Veterinária, Universidade Estadual Paulista (UNESP), 14884-900 Jaboticabal – SP, Brazil, 3Departament de Sanitat i d'Anatomia Animals, Facultat de Veterinària, Universitat Autònoma de Barcelona, 08193 Bellaterra, Spain, 4Centre de Recerca en Sanitat Animal (CReSA), Universitat Autònoma de Barcelona, 08193 Bellaterra, Spain and 5Institut Català de Recerca i Estudis Avançats (ICREA), C/Lluis Companys 23, 08010 Barcelona, Spain
Email: André LJ Ferraz - [email protected]; Ana Ojeda - [email protected]; Manel López-Béjar - [email protected]; Lana T Fernandes - [email protected]; Anna Castelló - [email protected]; Josep M Folch - [email protected]; Miguel Pérez-Enciso* - [email protected]
* Corresponding author
AbstractBackground: Artificial selection has resulted in animal breeds with extreme phenotypes. As anorganism is made up of many different tissues and organs, each with its own genetic programme, itis pertinent to ask: How relevant is tissue in terms of total transcriptome variability? Which are thegenes most distinctly expressed between tissues? Does breed or sex equally affect thetranscriptome across tissues?
Results: In order to gain insight on these issues, we conducted microarray expression profiling of16 different tissues from four animals of two extreme pig breeds, Large White and Iberian, twomales and two females. Mixed model analysis and neighbor – joining trees showed that tissues withsimilar developmental origin clustered closer than those with different embryonic origins. Often asound biological interpretation was possible for overrepresented gene ontology categories withindifferentially expressed genes between groups of tissues. For instance, an excess of nervous systemor muscle development genes were found among tissues of ectoderm or mesoderm origins,respectively. Tissue accounted for ~11 times more variability than sex or breed. Nevertheless, wewere able to confidently identify genes with differential expression across tissues between breeds(33 genes) and between sexes (19 genes). The genes primarily affected by sex were overall differentthan those affected by breed or tissue. Interaction with tissue can be important for differentiallyexpressed genes between breeds but not so much for genes whose expression differ betweensexes.
Conclusion: Embryonic development leaves an enduring footprint on the transcriptome. Theinteraction in gene × tissue for differentially expressed genes between breeds suggests that animalbreeding has targeted differentially each tissue's transcriptome.
Published: 16 April 2008
BMC Genomics 2008, 9:173 doi:10.1186/1471-2164-9-173
Received: 7 December 2007Accepted: 16 April 2008
This article is available from: http://www.biomedcentral.com/1471-2164/9/173
© 2008 Ferraz et al; licensee BioMed Central Ltd. This is an Open Access article distributed under the terms of the Creative Commons Attribution License (http://creativecommons.org/licenses/by/2.0), which permits unrestricted use, distribution, and reproduction in any medium, provided the original work is properly cited.
Page 1 of 20(page number not for citation purposes)

BMC Genomics 2008, 9:173 http://www.biomedcentral.com/1471-2164/9/173
BackgroundIt is now feasible to carry out large scale characterizationof transcription activity using microarrays. This technol-ogy has opened new avenues to characterize and to dissectthe transcriptome's genetic basis. It is a complementaryapproach to the classical ascertainment of the geneticarchitecture of complex traits, such as quantitative traitloci studies. There is now overwhelming evidence that thelevels of mRNA are affected by a number of environmen-tal, physiological and genetic factors, much the same asfor any other quantitative, complex trait [1,2]. The extentand influence of each factor is, however, controversial andunknown to a large extent. Some authors reported that sexwas far more important than the genetic line or age in Dro-sophila [3], whereas individual variability have been foundto be very large in Fundulus fish [4]. The study of thegenetic basis of variability at the transcriptome level is par-ticularly relevant because, it has been claimed, evolutionand thus phenotypic variability is due primarily to regula-tory rather than structural mutations [4,5].
In many microarray studies so far, the goal has been tocompare two physiological statuses, e.g., disease vs.healthy, by analyzing a single tissue in several individuals.Some studies have also compared different breeds orstrains, again focussing on one or very few tissues in orderto gain insight as to how much phenotypic variability cor-relates with differences at the transcriptome level; see forinstance Reiner-Benaim et al. [6]. Nevertheless, thenumber of studies comparing different breeds is not verylarge yet, particularly in livestock. For instance, only fourpublished studies have compared the global transcrip-tome of at least two porcine breeds [7-10] and one com-pared two divergent lines [11], whereas over a hundreddealing with porcine microarrays are indexed inPubmed[12] as of November 2007. Thus, although a greatdeal is known about the transcriptome changes broughtabout by diseases, say cancer, much less is known aboutthe relevance of genetic or environmental factors. Moreo-ver, an organism is made up of many different tissues andorgans, each with its own genetic programme. How differ-ent are these genetic programmes? How relevant are theyin terms of total transcriptome variability? What are therelative contributions of breed or sex when assessed acrosstissues? Divergent livestock breeds offer extremely valua-ble genetic material to study these issues.
In order to contribute to answering these questions, herewe study the variability in a large number of tissues per-taining to a reduced number of individuals. By allocatingmore experimental resources to a much larger number oftissues than usual, we aim at better characterizing the tran-scriptome variability across the whole organism.Although some studies have compared the transcriptomeacross different tissues [13-16], the contribution of each
effect (e.g., tissue vs. sex) has not been quantified. The var-iability between tissues is not as well studied as thatwithin tissues and some tissues remain poorly character-ized, all the more in livestock species. The transcriptomeof some tissues like liver and muscle have been analyzedextensively, well over a thousand citations in Pubmed[12]as of November 2007. Some other tissues have been onlyrarely studied despite their known physiological impor-tance: only four microarray studies are reported for pinealgland, 19 for the hypophysis. Certainly, phenotypic differ-ences in a given tissue can actually be due to changes thatoccur in a different organ. For instance, the fatness differ-ences between individuals, a trait of utmost relevance inanimal breeding, are more likely to be caused by geneticsignals that originate in the hypothalamus or in the pinealgland rather than in the fat tissue itself.
The aim of this work was to study the global transcripomeacross tissues in two highly divergent pig breeds. Wereport a mixed model analysis of 16 tissues pertaining tofour pigs, two Large White (LW) and two Iberian (IB), onemale and one female per breed. These two breeds are phe-notypically extreme for most traits of economic relevance,e.g., growth, fatness, reproductive performance. The tis-sues studied were olfactory bulb, hypothalamus, pinealgland, adenohypophysis, neurohypophysis, adrenal cor-tex, adrenal medulla, thyroid gland, diaphragm, Bicepsfemoris muscle, back fat tissue, abdominal fat tissue, stom-ach, liver, ileum and whole blood.
Results and DiscussionTranscriptome diversity across tissues and samplesClustering is a useful starting exploratory tool to visualizehighly dimensional data, and has been widely used tomicroarray data since the seminal paper of Eisen and cols.[17]. Here we applied two clustering methdos, the classi-cal one based on the UPGMA criterion [17], and theneighbor-joing (NJ) clustering. In both cases, we used thedistance one minus the squared correlation (1-r2)between the samples, after normalizing the raw data withthe RMA procedure [18], as detailed in Material and Meth-ods. Results are drawn in Figure 1, where it can be seenthat samples were clearly grouped by tissue, next by breedin both trees. This was neatly observed for ileum, liver,thyroid gland, adeno and neurohypohysis and olfactorybulb. Muscle samples were clustered by tissue (dia-phragma vs. M. biceps femori) but less clearly within eachmuscle. As for fat, the similarity was larger between tissuesthan between breeds, and samples of both back andabdominal fat origins were clustered together. The samewas observed between cortex and medulla from adrenalgland. In this case, contamination between both tissuescannot be ruled out because of the irregular limits of themedulla that make not easy to separate that region neatlyfrom the cortex collecting rapidly enough amount of tis-
Page 2 of 20(page number not for citation purposes)

BMC Genomics 2008, 9:173 http://www.biomedcentral.com/1471-2164/9/173
Page 3 of 20(page number not for citation purposes)
NJ (left) and UPGMA trees (right) using the 1 - r2 distanceFigure 1NJ (left) and UPGMA trees (right) using the 1 - r2 distance. Each sample is named using the tissue acronym (four let-ters, Table 1), breed (LW or IB) and sex (M, male or F, female); LW males are indicated by open squares; LW females, by open circles; IB males, by black squares and IB females, by black circles.
HYPO LWM
HYPO LWF
PING LWM
HYPO IBF
HYPO IBM
OLFB LWM
OLFB LWF
OLFB IBF
OLFB IBM
PING IBM
PING LWF
PING IBF
AHYP LWM
AHYP LWF
AHYP IBF
AHYP IBM
NHYP LWM
NHYP LWF
NHYP IBF
NHYP IBM
ADGM IBM
ADGC IBM
ADGC IBF
ADGM IBF
ADGC LWM
ADGM LWM
ADGC LWF
ADGM LWF
THYG LWM
THYG LWF
THYG IBF
THYG IBM
BIFE LWM
BIFE IBF
BIFE IBM
BIFE LWF
DIAP LWM
DIAP IBF
DIAP IBM
DIAP LWF
FATA IBM
FATB IBF
FATA IBF
FATB IBM
FATB LWM
FATB LWF
FATA LWM
FATA LWF
STOM LWM
STOM IBM
STOM LWF
STOM IBF
LIVR LWM
LIVR LWF
LIVR IBF
LIVR IBM
BLOO LWF
BLOO IBF
BLOO IBM
BLOO LWM
ILEU LWM
ILEU LWF
ILEU IBF
ILEU IBM
0.05
FATB LWM
FATB LWF
FATA LWM
FATA LWF
FATA IBM
FATB IBM
FATB IBF
FATA IBF
THYG LWF
THYG LWM
THYG IBF
THYG IBM
ADGC IBF
ADGC IBM
ADGM IBM
ADGM IBF
ADGM LWM
ADGC LWM
ADGC LWF
ADGM LWF
STOM LWM
STOM IBM
STOM LWF
STOM IBF
ILEU IBF
ILEU IBM
ILEU LWM
ILEU LWF
AHYP LWF
AHYP IBF
AHYP IBM
AHYP LWM
NHYP LWM
NHYP LWF
NHYP IBF
NHYP IBM
PING IBF
PING IBM
PING LWF
OLFB LWM
OLFB LWF
OLFB IBF
OLFB IBM
HYPO LWF
PING LWM
HYPO IBM
HYPO LWM
HYPO IBF
BIFE IBF
BIFE LWM
BIFE LWF
BIFE IBM
DIAP LWM
DIAP LWF
DIAP IBF
DIAP IBM
LIVR LWM
LIVR LWF
LIVR IBF
LIVR IBM
BLOO IBM
BLOO LWF
BLOO LWM
BLOO IBF
0.000.050.100.150.20

BMC Genomics 2008, 9:173 http://www.biomedcentral.com/1471-2164/9/173
sue for analysis. Other authors have described previouslycontamination of medulla in the cortex sample whenmechanical separation is performed[19]. Thus, thisresemblance was not completely unexpected. The onlyoutlier sample seemed to be the pineal gland of the LargeWhite male (PING_LWM), which clustered with the restof hypothalamus microarrays. Here contamination can bediscarded in all likelihood because the two regions,hypothalamus and pineal gland, are in distinct areas ofthe brain. However, the pineal gland works in harmonywith the hypothalamus. The former produces melatonin,which directly influences the function of various braincenters, including the hypothalamus. In stomach, lessclearly in blood, samples were grouped by sex rather thanby breed.
As expected, both UPGMA and NJ methods providedidentical clustering at the first coalescence level. However,there were some interesting differences at higher levels. NJidentified four groups of tissues. The first group com-prised brain tissues, including hypophysis; the secondgroup, thyroid and adrenal endocrine glands; the third,muscle and fat tissues; whereas stomach, ileum, bloodand liver were in the last group. In contrast, UPGMA clus-tered blood, liver and muscles in separate groups, whilebrain tissues were grouped together with fat, thyroid andadrenal glands; blood and liver were in distinct groups. Itis well known that NJ have better properties than UPGMAwhen reconstructing evolutionary trees because it doesnot assume a constant evolutionary rate [20]. But is notevident how to translate this advantage in relation to theperformance for classifying transcriptomes. The UPGMAmethod is equivalent to clustering algorithms imple-mented in popular microarray packages [17], whereas NJhave not been used so far, to our knowledge, in microar-ray studies. Here we found that, overall, NJ provided morebiologically sound results than UPGMA: the first twogroups in the NJ-tree comprised brain tissues and endo-crine glands; muscle and fat tissues have a predominantlystructural function in the body, while the rest of tissues(liver, stomach, ileum and blood) have an important met-abolic role. In contrast, UPGMA results were not always soeasily interpretable, e.g., it grouped hypophysis closer tofat tissues than to other brain organs like hypothalamus orthe olfactory bulb.
The trees depicted in Figure 1 were obtained with the orig-inal data (after RMA transformation). A better alternativeto study relationships between tissues is to consider theProbe × Tissue solutions obtained from model (2), as thesesolutions are corrected for 'noisy' factors such as sex, breedand global tissue effects. Thus we constructed a NJ-tree of
tissue transcriptomes using the 1- distance (see meth-
ods). This tree is shown in Figure 2. Although the pattern
was similar to the NJ-tree in Figure 1, this tree provided aclearer picture of relationships between tissues. Forinstance, it emphasized that blood is the most distant tis-sue, corroborated also by the fact that blood harbored thelargest number of extreme probes (Table 1). We defined atissue's extreme probe as a probe for which all four mRNAlevels of the tissue were either smaller or larger than theremaining mRNA levels (Material and Methods). In con-trast, the two adrenal tissues and both fats were the closestpair of tissues. The brain is not a uniform organ, and thiswell known fact [21-23] was corroborated by a relevantvariability within the different brain tissues sampled.Olfactory bulb was neighbor to hypothalamus. The twopituitaries, adenohypohysis and neurohypohysis, exhib-ited neighbor but distinct transcriptomes. This resultagrees with the fact that both organs carry out very differ-ent physiological functions and have separate embryonicorigins from the ectoderm layer (from an ectodermal out-pocketing of the stomodeum and neural ectoderm,respectively). In fact, it was more interesting to note thatneurohypophysis and hypothalamus were relatively dis-tant. A close relationship might have been expectedbecause neurohypophysis consists primarily of axonicprojections of the hypothalamus. The pineal gland exhib-ited an intermediate transcriptome between hypophysesand hypothalamus – olfactory bulb.
Interestingly, there was a relation between embryonic ori-gin and clustering. Most tissues with the same embryonicorigin clustered together in the NJ-tree (Figure 2). Allbrain tissues are of ectodermic origin, as is hypophysis,and these tissues were clustered together in the first groupof tissues. The second group comprised the adrenal andthyroid glands, tissues with double embryonic origin. Theadrenal medulla derives from ectoderm (neural crestcells), while the cortex develops from mesoderm. The thy-roid gland develops from two distinct embryonic lineages:follicular cells (which produce thyroxine) and parafollic-ular C-cells (which produce calcitonin) and are of endo-dermal and ectodermal neural crest origins, respectively[24]. Mesoderm gives origin to fat and muscle. Liver, andstomach and ileum epithelia are derived from endoderm.Finally, blood, the most separate and outlier tissue, is ofmesoderm origin. Thus, it seems that embryonic develop-ment leaves a standing footprint on the transcriptome ineach of the tissues.
Functional analysis of extreme genes across embryo origins and tissuesWe sought to investigate more in detail the genetic basisof the tissue arrangement by embryonic layers, and to pickup genes that can be differentially expressed in concerted
rT2
Page 4 of 20(page number not for citation purposes)
BM
C G
enom
ics
2008
, 9:1
73ht
tp://
ww
w.b
iom
edce
ntra
l.com
/147
1-21
64/9
/173
Page
5 o
f 20
(pag
e nu
mbe
r not
for c
itatio
n pu
rpos
es)
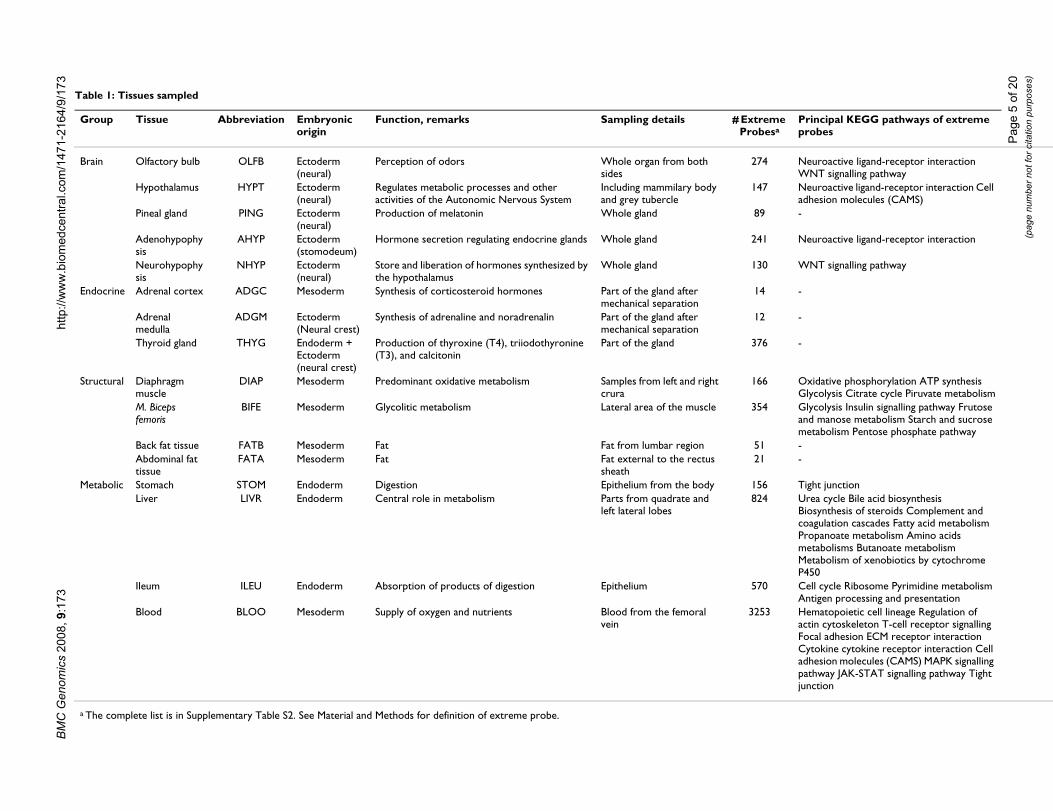
Table 1: Tissues sampled
Group Tissue Abbreviation Embryonic origin
Function, remarks Sampling details # Extreme Probesa
Principal KEGG pathways of extreme probes
Brain Olfactory bulb OLFB Ectoderm (neural)
Perception of odors Whole organ from both sides
274 Neuroactive ligand-receptor interaction WNT signalling pathway
Hypothalamus HYPT Ectoderm (neural)
Regulates metabolic processes and other activities of the Autonomic Nervous System
Including mammilary body and grey tubercle
147 Neuroactive ligand-receptor interaction Cell adhesion molecules (CAMS)
Pineal gland PING Ectoderm (neural)
Production of melatonin Whole gland 89 -
Adenohypophysis
AHYP Ectoderm (stomodeum)
Hormone secretion regulating endocrine glands Whole gland 241 Neuroactive ligand-receptor interaction
Neurohypophysis
NHYP Ectoderm (neural)
Store and liberation of hormones synthesized by the hypothalamus
Whole gland 130 WNT signalling pathway
Endocrine Adrenal cortex ADGC Mesoderm Synthesis of corticosteroid hormones Part of the gland after mechanical separation
14 -
Adrenal medulla
ADGM Ectoderm (Neural crest)
Synthesis of adrenaline and noradrenalin Part of the gland after mechanical separation
12 -
Thyroid gland THYG Endoderm + Ectoderm (neural crest)
Production of thyroxine (T4), triiodothyronine (T3), and calcitonin
Part of the gland 376 -
Structural Diaphragm muscle
DIAP Mesoderm Predominant oxidative metabolism Samples from left and right crura
166 Oxidative phosphorylation ATP synthesis Glycolysis Citrate cycle Piruvate metabolism
M. Biceps femoris
BIFE Mesoderm Glycolitic metabolism Lateral area of the muscle 354 Glycolysis Insulin signalling pathway Frutose and manose metabolism Starch and sucrose metabolism Pentose phosphate pathway
Back fat tissue FATB Mesoderm Fat Fat from lumbar region 51 -Abdominal fat tissue
FATA Mesoderm Fat Fat external to the rectus sheath
21 -
Metabolic Stomach STOM Endoderm Digestion Epithelium from the body 156 Tight junctionLiver LIVR Endoderm Central role in metabolism Parts from quadrate and
left lateral lobes824 Urea cycle Bile acid biosynthesis
Biosynthesis of steroids Complement and coagulation cascades Fatty acid metabolism Propanoate metabolism Amino acids metabolisms Butanoate metabolism Metabolism of xenobiotics by cytochrome P450
Ileum ILEU Endoderm Absorption of products of digestion Epithelium 570 Cell cycle Ribosome Pyrimidine metabolism Antigen processing and presentation
Blood BLOO Mesoderm Supply of oxygen and nutrients Blood from the femoral vein
3253 Hematopoietic cell lineage Regulation of actin cytoskeleton T-cell receptor signalling Focal adhesion ECM receptor interaction Cytokine cytokine receptor interaction Cell adhesion molecules (CAMS) MAPK signalling pathway JAK-STAT signalling pathway Tight junction
a The complete list is in Supplementary Table S2. See Material and Methods for definition of extreme probe.

BMC Genomics 2008, 9:173 http://www.biomedcentral.com/1471-2164/9/173
action within each embryonic layer. To that end, weobtained the extreme gene probes differentiating the ecto-derm tissues (olfactory bulb, hypothalamus, pineal gland,adenohypophysis and neurohypophysis), mesoderm(muscle and fat), and endoderm (liver, stomach andileum). An extreme probe for each embryo layer wasdefined as for individual tissues, i.e., a probe whose allexpression levels for that group of tissues were eithersmaller or larger than the levels for the rest of tissues(Material and Methods). We excluded thyroid and adrenalglands for being mixed tissues and blood, for outlier. Thecomplete list in additional file 1. A pie-plot with differen-
tial gene ontology (GO) frequencies obtained with onto-express [25] is in Figure 3. A wide variety of GO were overrepresented in each layer; this fact, together with a largepercentage of unknown or unannotated genes makes itsomewhat difficult to interpret the results in detail.
Neverheless, some interesting results appeared. Forinstance, genes with ontologies like nervous developmentand ion transport – clearly related to central nervous sys-tem – were more frequent than expected within ectodermextreme genes, as were genes involved in development(Figure 3A). In particular, some of the most overexpressed
NJ tree of tissues using the 1- DistanceFigure 2
NJ tree of tissues using the 1- Distance. The four groups in Table 1 are indicated by symbols: brain (open squares),
endocrine (grey squares), structural (grey triangles) and metabolic (black circles).
OLF
B
HY
PO
PING
AHYP
NHYP
ADGC
AD
GM T
HY
G
DIA
P
BIFE
FATB
FATA
STOM
LIVR
ILE
U
BLO
O
0.05
rT2
rT2
Page 6 of 20(page number not for citation purposes)

BMC Genomics 2008, 9:173 http://www.biomedcentral.com/1471-2164/9/173
genes like INA (internexin neuronal intermediate fila-ment protein), ASTN (astrotactin) or NAPIL2 (nucleo-some assembly protein 1-like 2) are involved in neurondevelopment, whereas others like GABRG2 (GABA Areceptor) or SYT4 (synaptotagmin IV) are involved in nor-mal neuron functioning. The case of NAP1L2 (nucleo-some assembly protein 1-like 2) is particularly interesting.Although, according to Pubmed, 'the function of this fam-ily member is unknown, mouse studies suggest that it rep-resents a class of tissue-specific factors interacting withchromatin to regulate neuronal cell proliferation'. Ourresults strongly suggest that NAP1L2 is involved in neuro-nal system and that the function is maintained across spe-cies.
In parallel to results for ecctoderm tissues, the most signif-icant enriched ontology was muscle development in themesoderm (Figure 3B). Here, some of the most extreme
genes were Hox genes involved in limb development andmyogenesis (e.g., PRRX1, HOXD8 and MEOX2). In partic-ular, it has been suggested that PRRX1 and HOXD8 arealso involved in the urogenital tract development, also ofmesoderm origin. The two top extreme genes for meso-derm tissues gamma-sarcoglycans (SGCD and SGCG) arealso involved in muscle development. As for the endo-derm (liver, ileum and stomach), an excess of genesinvolved in general metabolism was observed, althoughwe also found a significant enrichment in nervous devel-opment genes (Figure 3C). Two of the most overexpressedextreme genes, HNF4A (hepatocyte nuclear factor 4,alpha) and FOXA3 (hepatocyte nuclear factor 3 or fork-head box A3) are known to be involved in liver develop-ment, and it is suspected that HNF4A can play a role alsoin intestine development, which is supported by our data.Intriguingly, some of the most extreme overexpressedgenes were involved in the complement pathway (C5, BF,
Differential GO categories across embryo layersFigure 3Differential GO categories across embryo layers. Percentage of the most frequent GO categories within extreme genes for each embryonic layer (A, ectoderm; B, mesoderm; C, endoderm; D, all genes in A, B and C). The number in each cate-gory is the false discovery rate (FDR) that the category is over represented with respect to the GO frequency across all genes in the microarray. The FDR is shown only if < 0.20.
Ectoderm GOUnknown / Other
Signal transduction
Regulation of transcription
Multicellular organismaldevelopmentTranscription
Ion transport
Cell adhesion
Cell differentiation
Transport
Nervous systemdevelopment
0.05
0.05
0.17
0.03
0.05
0.16
A Ectoderm GOUnknown / Other
Signal transduction
Regulation of transcription
Multicellular organismaldevelopmentTranscription
Ion transport
Cell adhesion
Cell differentiation
Transport
Nervous systemdevelopment
0.05
0.05
0.17
0.03
0.05
0.16
Ectoderm GOUnknown / Other
Signal transduction
Regulation of transcription
Multicellular organismaldevelopmentTranscription
Ion transport
Cell adhesion
Cell differentiation
Transport
Nervous systemdevelopment
0.05
0.05
0.17
0.03
0.05
0.16
A Mesoderm GO Unknown / Other
Regulation oftranscriptionMulticellular organismaldevelopmentCell adhesion
Transcription
Signal transduction
Apoptosis
Muscle development
0.10
0.01
<0.01
0.08
<0.01B Mesoderm GO Unknown / Other
Regulation oftranscriptionMulticellular organismaldevelopmentCell adhesion
Transcription
Signal transduction
Apoptosis
Muscle development
0.10
0.01
<0.01
0.08
<0.01 Mesoderm GO Unknown / Other
Regulation oftranscriptionMulticellular organismaldevelopmentCell adhesion
Transcription
Signal transduction
Apoptosis
Muscle development
0.10
0.01
<0.01
0.08
<0.01B
Endoderm GO Unknown / Other
Regulation oftranscriptionMetabolic process
Transcription
Nervous systemdevelopmentProteolysis
Protein amino acidphosphorylationCarbohydrate metabolicprocessMulticellular organismaldevelopment
0.08
0.03
0.10
0.02
C Endoderm GO Unknown / Other
Regulation oftranscriptionMetabolic process
Transcription
Nervous systemdevelopmentProteolysis
Protein amino acidphosphorylationCarbohydrate metabolicprocessMulticellular organismaldevelopment
0.08
0.03
0.10
0.02
Endoderm GO Unknown / Other
Regulation oftranscriptionMetabolic process
Transcription
Nervous systemdevelopmentProteolysis
Protein amino acidphosphorylationCarbohydrate metabolicprocessMulticellular organismaldevelopment
0.08
0.03
0.10
0.02
CAll layer GO Unknown / Other
Regulation oftranscriptionSignal transduction
Multicellular organismaldevelopmentTranscription
Cell adhesion
Ion transport
Cell differentiation
Transport
Metabolic process
Nervous systemdevelopment
<0.01
0.01
0.11
0.04
0.02
D
All layer GO Unknown / Other
Regulation oftranscriptionSignal transduction
Multicellular organismaldevelopmentTranscription
Cell adhesion
Ion transport
Cell differentiation
Transport
Metabolic process
Nervous systemdevelopment
<0.01
0.01
0.11
0.04
0.02 All layer GO Unknown / Other
Regulation oftranscriptionSignal transduction
Multicellular organismaldevelopmentTranscription
Cell adhesion
Ion transport
Cell differentiation
Transport
Metabolic process
Nervous systemdevelopment
<0.01
0.01
0.11
0.04
0.02
D
Page 7 of 20(page number not for citation purposes)

BMC Genomics 2008, 9:173 http://www.biomedcentral.com/1471-2164/9/173
SDC1, C4BPA), may be as a consequence of the defensefunction of the ileum. Finally, when all extreme genesacross the three embryo layers were considered jointly(Figure 3D), the most significant ontologies were nervoussystem development, cell differentiation, cell adhesionand multicellular organism development, which againsuggests a sound biological interpretation.
We also obtained the extreme probes for each of the indi-vidual tissues. The main over represented biological proc-ess per tissue is in Table 1, and a complete list of the genesis in additional file 2. Results confirmed, overall, previousbiological knowledge. brain tissues (olfactory bulb, hypo-physes, pineal gland and hypothalamus) exhibited a largenumber of genes in signalling pathways (see also Figure3A). The highly oxidative muscle diaphragma wasenriched in genes involved in ATP synthesis through cit-rate cycle and oxidative phosphorylation, whereas bicepsfemori (glycolytic muscle) extreme genes were oftenrelated to the production of ATP by glycolysis and sugarpathway. The liver extreme genes were in the urea cyclepathway and bile acid and amino acid metabolisms;blood genes pertained to hematopoietic processes and sig-naling pathway systems.
Mixed model analysis
Mixed model analyses were highly successful in model-ling transcriptome variability (Table 2). For instance, formodel (2) the fraction of unexplained variance was very
small, 1 - - = 0.03, and ~15% in the rest of mod-
els. This means that the set of expression levels can be veryaccurately modelled as a random normal variate in the logscale. Note that models (1 – 4) were highly parsimonious:a few parameters, i.e., the variance components and thefixed effects tissue, sex and breed were needed to modelthe data. By far, the largest variance component was thatof the probe, which explained overall at least 85% of thetotal variability (Table 2). The interaction probe × tissue
( ) accounted for 11% of phenotypic variance (model
2), whereas the total variances explained by probe × breedor probe × sex were marginal, only about 1% (models 3and 4). These were the global variance estimates, when allprobes were considered jointly. It does not follow that sexor breed were not associated to changes in gene expres-sion. The relative importance of sex or breed did increasewhen we restricted the analysis to a data subset. Forinstance, the percentage of total variance explained bybreed or sex increased to 25% or 48% when we used the100 most differentially expressed genes between breeds orbetween sexes, respectively (last two rows of Table 2).
Symmetrically, the relevance of probe effect decreased forthese data subsets.
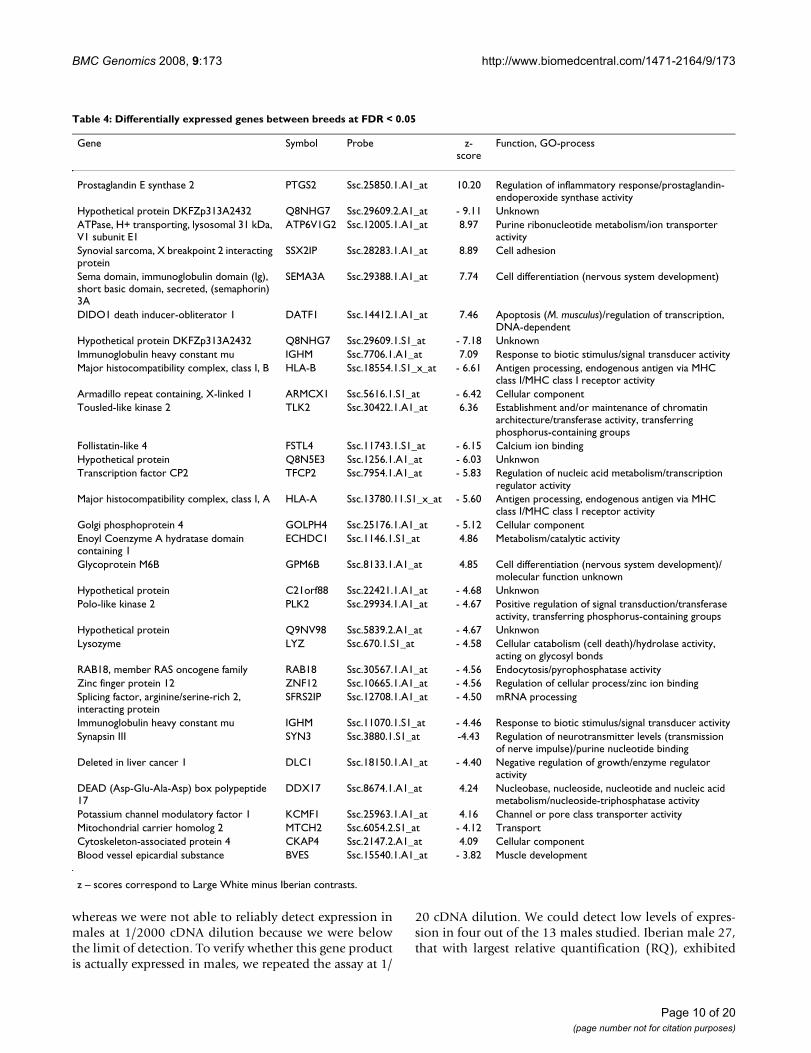
Differential gene expressionAt a false discovery rate FDR < 0.05, we identified 19 and33 genes differentially expressed between sexes andbreeds, respectively. The complete lists together with ten-tative annotations [26] are in Tables 3 and 4. Two of thegenes, orthologous to human genes in the HLA-A andHLA-B complex, were differentially expressed simultane-ously between breeds and between sexes. However, therewas no correlation overall between tissue, breed or sexeffects. This was evident from the pattern in Figure 4,which displays the relation between zb and zs scores (topfigure) and between zb scores and the standard deviationof the probe × tissue solutions (bottom figure). If therewere a relation, we would see the dots around a diagonalrather than close to the axes. Thus, each of the factors stud-ied here, sex and breed, influence the transcriptomethrough different genetic programmes.
We performed a clustering of probes and samples usingonly the differentially expressed genes from Tables 3 and4. Results were drawn in Figure 5, where the discrimina-tion between sexes (top) and breeds (bottom) is neat andclearly visible. This clustering contrasts with that in Figure1 where all probes were employed. The discrepancy occursbecause the expression pattern of most genes is primarilyaffected by the tissue and not so much by sex or breed, asdiscussed. However, as Figure 5 clearly shows, this doesnot mean that a careful selection of probes does not allowus to discriminate samples between according to sex orbreed.
The list of differentially expressed genes between sexescomprised eight X or Y linked genes, based on the locali-zation of orthologous human genes (Table 3). Note thatthree X-linked genes were up-regulated in males (ZFX,UTX and TMSB4X), a phenomenon also observed by Yanget al. [14] although for different genes. Male up-regulatedgenes were predominantly involved in spermatogenesis(DDX3Y), cell proliferation, migration, and differentia-tion (GSTA1, TMSB4X), as well as genes genes from the
hP2 hPT
2
σ PT2
Table 2: Parameter estimates
Model Dataset
1 Complete 0.87 - - -2 Complete 0.86 0.11 - -3 Complete 0.85 - 0.01 -4 Complete 0.85 - - 0.013 100 largest zb 0.46 - 0.25 -4 100 largest zs 0.25 - - 0.48
hP2 hPT
2 hPB2 hPS
2
Page 8 of 20(page number not for citation purposes)

BMC Genomics 2008, 9:173 http://www.biomedcentral.com/1471-2164/9/173
histocompatiblity complex (HLA-A, HLA-B). Female up-regulated genes had functions related to positive regula-tion of the transforming growth factor beta receptor sign-aling pathway (HIPK2), proteins up-regulated ingonadotropinomas (FAM5C) or affecting the circadianrhytm (CLOCK). Up-regulation of CLOCK in females isconsistent with evidence showing that this gene is relatedto the cyclic nature of the reproductive process in females,both in mammal and in non mammal species [27-29].
We found a good concordance with the list of differen-tially expressed genes obtained with the same microarrayin lung and mesenteric lymph node by our group in a sep-arate experiment (Fernandes et al., unpublished results).Thirteen genes (mesenteric lymph node) and ten genes(lung) were also in Table 3, despite the fact that corre-sponded to different tissues, treatments and breeds. Yanget al. [14] compared microarrays of 169 female and 165
male mice in four tissues (whole brain, liver, skeletal mus-cle and gonadal adipose), the largest study to date of sexdifferentially expressed genes. They reported 27 genes thatwere differentially expressed in all four tissues, four ofthem (DDX3Y, EIF2S3Y, JARID1D and UTX) were alsofound here; DDX3Y and EIF2S3Y were the most differen-tially expressed genes found here and in [14]. It is interest-ing to note that these authors also reported that immunegenes, e.g., histocompatiblity genes, were overexpressedin males with respect to females, in agreement again withour results [14,30]. Differential expression between sexesfor SSCY genes can be considered as validated.
We also validated probe (Ssc.4897.1.A1_at), annotated asCLOCK gene [26], by real time quantitative RT-PCR(QRT-PCR) in backfat samples of 27 pigs. QRT-PCRresults clearly confirmed the microarray data (Table 5).The average relative expression was 1.88 ± 0.68 in females,
Table 3: Differentially expressed genes between sexes at FDR < 0.05
Gene Symbol Probe z-score
Function, GO-process
DEAD (Asp-Glu-Ala-Asp) box polypeptide 3, Y-linked
DDX3Y Ssc.7473.1.A1_at 20.96 Nucleoside-triphosphatase activity
Eukaryotic translation initiation factor 2, subunit 3 gamma,
EIF2S3 Ssc.16426.1.S1_at 20.19 Protein metabolism/translation regulator activity
FAM5C – family with sequence similarity 5, member C
FAM5C Ssc.6667.1.A1_at -18.80 Unknown
Eukaryotic translation initiation factor 1A, Y-linked
EIF1AY Ssc.26799.1.S1_at 18.77 Translational initiation/translation regulator activity
DENN/MADD domain containing 4A DENND4A Ssc.13426.1.A1_at -18.07 Regulation of transcription, DNA-dependentProtein tyrosine phosphatase, receptor type, M
PTPRM Ssc.31029.1.A1_at -16.39 Protein amino acid dephosphorylation/protein tyrosine phosphatase activity
Latrophilin 2 LPHN2 Ssc.21512.1.A1_at -15.40 Neuropeptide signaling pathway/signal transducer activity
Homeodomain interacting protein kinase 2 HIPK2 Ssc.2434.1.A1_at -14.25 Positive regulation of programmed cell death/transcription regulator activity
Circadian locomoter output cycles kaput; clock homolog
CLOCK Ssc.4897.1.A1_at -14.10 Circadian rhythm/transcription regulator activity
Thymosin, beta 4, X-linked TMSB4X Ssc.27304.1.S1_at 12.26 Cytoskeleton organization and biogenesis/actin binding
Ubiquitously transcribed tetratricopeptide repeat gene, Y-linked
UTY Ssc.27236.1.S1_at 11.10 Unknown. Positive regulation of growth rate (C. elegans)
Jumonji, AT rich interactive domain 1C JARID1C Ssc.21814.1.S1_at 8.41 Regulation of transcription, DNA-dependent/oxidoreductase activity
Ubiquitously transcribed tetratricopeptide repeat, X chromosome
UTX Ssc.15821.1.S1_at 7.45 Unknown. Positive regulation of growth rate (C. elegans)
Glutathione S-transferase A1 GSTA1 Ssc.16377.1.A1_at 6.67 Glutathione metabolism/transferase activityMajor histocompatibility complex, class I, A HLA-A Ssc.13780.11.S1_x_at 4.81 Antigen processing, endogenous antigen via MHC
class I/MHC class I receptor activityMajor histocompatibility complex, class I, B HLA-B Ssc.18552.1.S1_at 4.39 Antigen processing, endogenous antigen via MHC
class I/MHC class I receptor activityMajor histocompatibility complex, class I, B HLA-B Ssc.18554.1.S1_x_at -4.38 Antigen processing, endogenous antigen via MHC
class I/Zinc finger protein, X-linked ZFX Ssc.26228.1.S1_at 4.19 Regulation of transcription/transcriptional activator
activityHypothetical protein FLJ20035 Q8IY21 Ssc.18924.1.A1_at -3.95 Unknown
z – scores correspond to male minus female contrasts.
Page 9 of 20(page number not for citation purposes)
BMC Genomics 2008, 9:173 http://www.biomedcentral.com/1471-2164/9/173
whereas we were not able to reliably detect expression inmales at 1/2000 cDNA dilution because we were belowthe limit of detection. To verify whether this gene productis actually expressed in males, we repeated the assay at 1/
20 cDNA dilution. We could detect low levels of expres-sion in four out of the 13 males studied. Iberian male 27,that with largest relative quantification (RQ), exhibited
Table 4: Differentially expressed genes between breeds at FDR < 0.05
Gene Symbol Probe z-score
Function, GO-process
Prostaglandin E synthase 2 PTGS2 Ssc.25850.1.A1_at 10.20 Regulation of inflammatory response/prostaglandin-endoperoxide synthase activity
Hypothetical protein DKFZp313A2432 Q8NHG7 Ssc.29609.2.A1_at - 9.11 UnknownATPase, H+ transporting, lysosomal 31 kDa, V1 subunit E1
ATP6V1G2 Ssc.12005.1.A1_at 8.97 Purine ribonucleotide metabolism/ion transporter activity
Synovial sarcoma, X breakpoint 2 interacting protein
SSX2IP Ssc.28283.1.A1_at 8.89 Cell adhesion
Sema domain, immunoglobulin domain (Ig), short basic domain, secreted, (semaphorin) 3A
SEMA3A Ssc.29388.1.A1_at 7.74 Cell differentiation (nervous system development)
DIDO1 death inducer-obliterator 1 DATF1 Ssc.14412.1.A1_at 7.46 Apoptosis (M. musculus)/regulation of transcription, DNA-dependent
Hypothetical protein DKFZp313A2432 Q8NHG7 Ssc.29609.1.S1_at - 7.18 UnknownImmunoglobulin heavy constant mu IGHM Ssc.7706.1.A1_at 7.09 Response to biotic stimulus/signal transducer activityMajor histocompatibility complex, class I, B HLA-B Ssc.18554.1.S1_x_at - 6.61 Antigen processing, endogenous antigen via MHC
class I/MHC class I receptor activityArmadillo repeat containing, X-linked 1 ARMCX1 Ssc.5616.1.S1_at - 6.42 Cellular componentTousled-like kinase 2 TLK2 Ssc.30422.1.A1_at 6.36 Establishment and/or maintenance of chromatin
architecture/transferase activity, transferring phosphorus-containing groups
Follistatin-like 4 FSTL4 Ssc.11743.1.S1_at - 6.15 Calcium ion bindingHypothetical protein Q8N5E3 Ssc.1256.1.A1_at - 6.03 UnknwonTranscription factor CP2 TFCP2 Ssc.7954.1.A1_at - 5.83 Regulation of nucleic acid metabolism/transcription
regulator activityMajor histocompatibility complex, class I, A HLA-A Ssc.13780.11.S1_x_at - 5.60 Antigen processing, endogenous antigen via MHC
class I/MHC class I receptor activityGolgi phosphoprotein 4 GOLPH4 Ssc.25176.1.A1_at - 5.12 Cellular componentEnoyl Coenzyme A hydratase domain containing 1
ECHDC1 Ssc.1146.1.S1_at 4.86 Metabolism/catalytic activity
Glycoprotein M6B GPM6B Ssc.8133.1.A1_at 4.85 Cell differentiation (nervous system development)/molecular function unknown
Hypothetical protein C21orf88 Ssc.22421.1.A1_at - 4.68 UnknwonPolo-like kinase 2 PLK2 Ssc.29934.1.A1_at - 4.67 Positive regulation of signal transduction/transferase
activity, transferring phosphorus-containing groupsHypothetical protein Q9NV98 Ssc.5839.2.A1_at - 4.67 UnknwonLysozyme LYZ Ssc.670.1.S1_at - 4.58 Cellular catabolism (cell death)/hydrolase activity,
acting on glycosyl bondsRAB18, member RAS oncogene family RAB18 Ssc.30567.1.A1_at - 4.56 Endocytosis/pyrophosphatase activityZinc finger protein 12 ZNF12 Ssc.10665.1.A1_at - 4.56 Regulation of cellular process/zinc ion bindingSplicing factor, arginine/serine-rich 2, interacting protein
SFRS2IP Ssc.12708.1.A1_at - 4.50 mRNA processing
Immunoglobulin heavy constant mu IGHM Ssc.11070.1.S1_at - 4.46 Response to biotic stimulus/signal transducer activitySynapsin III SYN3 Ssc.3880.1.S1_at -4.43 Regulation of neurotransmitter levels (transmission
of nerve impulse)/purine nucleotide bindingDeleted in liver cancer 1 DLC1 Ssc.18150.1.A1_at - 4.40 Negative regulation of growth/enzyme regulator
activityDEAD (Asp-Glu-Ala-Asp) box polypeptide 17
DDX17 Ssc.8674.1.A1_at 4.24 Nucleobase, nucleoside, nucleotide and nucleic acid metabolism/nucleoside-triphosphatase activity
Potassium channel modulatory factor 1 KCMF1 Ssc.25963.1.A1_at 4.16 Channel or pore class transporter activityMitochondrial carrier homolog 2 MTCH2 Ssc.6054.2.S1_at - 4.12 TransportCytoskeleton-associated protein 4 CKAP4 Ssc.2147.2.A1_at 4.09 Cellular componentBlood vessel epicardial substance BVES Ssc.15540.1.A1_at - 3.82 Muscle development
z – scores correspond to Large White minus Iberian contrasts.
Page 10 of 20(page number not for citation purposes)

BMC Genomics 2008, 9:173 http://www.biomedcentral.com/1471-2164/9/173
Page 11 of 20(page number not for citation purposes)
Relation between z-scoresFigure 4Relation between z-scores. Plot of z-scores of breeds and sexes (top), and between the breed z-scores and the standard deviation within probes of Probe × Tissue solutions (bottom).
0
0.5
1
1.5
2
2.5
3
3.5
4
4.5
-15 -10 -5 0 5 10 15
z-score breed
SD
of
pro
be
x ti
ssu
e in
tera
ctio
ns
-25
-20
-15
-10
-5
0
5
10
15
20
25
-15 -10 -5 0 5 10 15
z-score breed
z-sc
ore
sex

BMC Genomics 2008, 9:173 http://www.biomedcentral.com/1471-2164/9/173
Page 12 of 20(page number not for citation purposes)
Sample clustering using differentially expressed genesFigure 5Sample clustering using differentially expressed genes. Genes differentially expressed between sexes (top) and breeds (bottom).

BMC Genomics 2008, 9:173 http://www.biomedcentral.com/1471-2164/9/173
nonetheless a expression level ~100 fold lower than infemales.
The list of probe sets corresponding to differentiallyexpressed genes at FDR < 0.05 between LW and IB breedsis in Table 4. The thirty three probes corresponded to 27genes and 5 hypothetical proteins; 12 were over expressedin Large White (LW-biased) and 21 over expressed in Ibe-rian (IB-biased). The LW-biased list comprised genesinvolved in ATP biosynthetic process, nervous systemdevelopment, lipid metabolism, RNA processing, andcontrol of growing and cellular division. The IB-biasedgenes affected the regulation of cell growth, RNA splicingfactor activity or muscle development. These results hintthat transcriptome differences between breeds seem to bemanifold. No particular single biological process was pre-dominantly affected. It is to be noticed, nonetheless, thatthere were several genes involved in nervous development
(SEMA3A, GPM6B, SYN3) or growth and cell cycle(DATF1, LYZ, RAB18, ZNF12, DLC1, BVES). As there iscurrently very little information on the transcriptome dif-ferences between pig breeds, it is not possible to knowhow general these results will be. Some recent results havecompared muscle in Duroc vs. Taoyuan breeds [8], in Lan-drace vs. Tongcheng [10] and liver and muscle in Durocvs. Pietrain [7,9]. While these studies have focussed on aparticular tissue and with different techniques and micro-arrays, all suggest that breeds differ in genes related to avariety of functional categories. In some cases, the micro-array included predominantly genes involved in musclestructure and development or energy metabolism [7] sotheir results may not be representative of the wholegenome.
It should be noted that the differentially expressed genesreported here (Tables 3 and 4) were those that exhibitedlargest differential expression across all tissues. This fol-lows from the specification of models (1–4), where allprobes were analyzed simultaneously and where the tis-sue effect was included in the models as just an additionaleffect. Thus, it is important to bear in mind that othergenes could show larger differential expressions in a spe-cific tissue than those listed in Tables 3 and 4. The experi-mental design of this study did not allow us tocharacterize with reasonable FDR the specific expressionof a gene in a single tissue. Nevertheless, we can get aglimpse of the effect of tissue in differential expression bysubdividing the tissues in groups. We reasoned that theprobe × tissue interaction should be larger between tissuesthat clustered far apart, as their genetic programmes aremore different that tissues that are very similar, e.g., backand abdominal fats. We defined the following tissuegroups base on the NJ-tree shown in Figure 2: brain (olfac-tory bulb, hypophises, hypothalamus and pineal gland),endocrine (adrenal and thyroid glands), structural (fatand muscle) and metabolic tissues (stomach, ileum, liverand blood). To a large extent, these groups reflect also acommon embryonic origin (Table 1).
We reanalyzed each of the groups with models 3 and 4,obtaining new zb and zs scores for each of the tissue groups.Table 6 presents the correlation between the z-scoresobtained with all tissues analyzed simultaneously andeach of the groups. In order to focus on the most relevantgenes, the correlations shown were those obtained withthe 100 genes with largest absolute z-scores. The patternshown was highly illuminating. For sex, there seemed tobe little interaction, as zs-scores were highly correlatedacross groups of tissues. Correlation coefficients werealways > 0.9. In contrast, correlations between zb scoreswere much more variable and, importantly, much loweroverall. Thus, whereas the correlation between brain and
Table 5: QRT-PCR results for CLOCK gene, probe Ssc.4897.1.A1_at
Sample Sex Breed RQ (1/2000) RQ (1/20)
13 F Duroc 1.000 NA14 F Duroc 1.555 NA16 F Duroc 2.694 NA22 F Iberian 1.114 NA25 F Iberian 2.054 NA26 F Iberian 1.581 NA8 F Landrace 1.621 NA10 F Landrace 1.521 NA1 F Large White 1.272 NA3 F Large White 1.796 NA5 F Large White 2.696 NA6 F Large White 1.961 NA17 F Synthetic 1.951 NA21 F Synthetic 3.482 NA12 M Duroc BLD BLD15 M Duroc BLD BLD23 M Iberian BLD BLD24 M Iberian BLD 0.01227 M Iberian BLD 0.0107 M Landrace BLD BLD9 M Landrace BLD BLD11 M Landrace BLD 0.0012 M Large White BLD 0.0034 M Large White BLD BLD18 M Synthetic BLD BLD19 M Synthetic BLD BLD20 M Synthetic BLD BLD
Sex: F, female; M, maleRQ (1/2000): Relative quantification RQ, average of three replicates each, at 1/2000 cDNA dilution. The results are given in terms of sample number 13, used as calibrator, i.e., RQ = 1RQ (1/20): Relative quantification RQ, average of three replicates each, at 1/20 cDNA dilution, only analyzed for malesBLD, below limit of detectionNA, not available
Page 13 of 20(page number not for citation purposes)

BMC Genomics 2008, 9:173 http://www.biomedcentral.com/1471-2164/9/173
metabolic tissues was 0.91 for sex z-scores, it was only0.34 for breed z-scores. This means that most differen-tially expressed genes between sexes were shared acrosstissues whereas this was much more unlikely when com-paring two distant breeds like Iberian and Large White. Itis interesting to note that the clusters in Figure 5 alsohinted that heterogeneity was larger within breed differen-tially expressed genes than within sex differentiallyexpressed genes. Note that the color patterns of sex differ-entially expressed genes were more uniform across sam-ples than for breed differentially expressed genes. Besides,clustering was much 'flatter' – i.e., more uniform – withinsexes than within breeds. This result may have importantimplications. It suggests that physiological changesresponsible for breed differences have targeted differen-tially the transcriptome across tissues. Not all tissues havebeen equally affected. It remains to be studied on whichof the tissues the effect of breed differentiation has beenthe largest. Our current data set does not allow us torespond to this question accurately: the probe × tissue her-
itabilities ( ) were very similar in all tissue groups and
no clear pattern emerged from Figure 1.
Functional annotation of sex and breed differentially expressed genesWe carried a GO automatic annotation [25] with the 19most differentially expressed genes between sexes and 33between breeds. The corresponding plots are in Figure 6.In neither case, sex or breed, was a given biological proc-ess GO clearly over represented (except the class ofunknown/others which pools unknown and minoritary GOclasses). As a result, the discussion should be consideredas tentative or provisional. Nevertheless, we founddefense genes to be over represented for both sex andbreed specific genes. For sex, there was a significant excessof transcription and translation related genes. Some ofthese genes are sex linked (EIF1AY, UTX, ZFX), as men-
tioned above, so an over representation of this ontology isnot unexpected. The GO biological processes were morescattered for breed than for sex (Figure 6B vs. 6A). Interest-ingly, there were more genes involved in nervous systemdevelopment and cell differentiation than expectedamong breed specific genes. This might provide someclues as to what are the primary changes exerted by selec-tion and breeding in the organism' transcriptome but fur-ther work is needed to get a definitive answer.
Global Discussion and ConclusionThis study shows that a much larger fraction of transcrip-tome variability is due to tissue differences rather than tosex or breed. Our results agree with recent literature[13,15] that showed that transcriptional co-expression isindicative of gene function and that tissues with similarfunction tend to cluster together. An additional relevantobservation from the NJ-clustering (Figures 1 and 2) wasthat embryonic development seems to leave an enduringfootprint on the transcriptome: tissues with similar devel-opmental origin tend to cluster closer than those with dif-ferent embryonic origins. As clustering was carried outwith all probes simultaneously, this means that the foot-print extends to the majority of genes. We further charac-terized the GO biological process of the extreme genesbetween tissues or groups of tissues sharing a commonembryonic origin (Figure 3, and additional files 1 and 2).We found that, often, a sound biological interpretationwas possible. For instance, when all extreme genes acrossthe three embryo layers were considered jointly (Figure3D), the most frequent and significant ontologies wererelated to development. We also indentified several genesinvolved in tissue development that have a distinct expres-sion pattern in tissues with a common embryonic origin.This distinct expression pattern is maintained beyondembryo development.
A key element of our analysis was mixed model methods.Although well known to statisticians and animal breeders[31], these techniques are not so widely employed to dis-sect microarray data. Nevertheless, its use have been advo-cated and successfully employed in a number of studies,e.g., [32,33]. We report that mixed modeling explained alarge part of total variability, with a very parsimoniousparameterization. A relevant advantage over standardmethods is that all data are analyzed simultaneously asopposed to more utilized methods like ANOVA – basedtechniques or bioconductor's package limma [34]; as aconsequence, reduced standard errors are expected. In asecond step, one can use the solutions from the models tocarry out clustering or differential expression studies, aswe did here.
Although the variance explained by the effect of tissue wasmuch larger (~11 times) than that explained by sex or
hPB2
Table 6: Correlation between between z-scores in different tissue groups
All Brain Endocrine Structural Metabolic
All - 0.98 0.97 0.98 0.97Brain 0.79 - 0.92 0.96 0.91Endocrine 0.87 0.62 - 0.92 0.97Structural 0.83 0.46 0.68 - 0.93Metabolic 0.77 0.34 0.63 0.64 -
The tissues included in each group are listed in Table 1. The z-scores correspond to the 100 largest differentially expressed genes when all tissues are jointly analyzed. Upper diagonal, sex differentially expressed genes. Lower diagonal, breed differentially expressed genes.
Page 14 of 20(page number not for citation purposes)

BMC Genomics 2008, 9:173 http://www.biomedcentral.com/1471-2164/9/173
Page 15 of 20(page number not for citation purposes)
Proportion of functional annotation categoriesFigure 6Proportion of functional annotation categories. Percentage of the most frequent GO categories within the most signifi-cant differentially expressed genes between sexes (Table 3) and between breeds (Table 4). The number in each category is the false discovery rate (FDR) that the category is over represented with respect to the GO frequency across all genes in the microarray. The FDR is shown only if < 0.20.
Main Breed GO Unknown / Others
Transcription
Immune response
Antigen processing
Regulation of transcription
Multicellular organismaldevelopmentMetabolic process
Protein amino acid phosphorylation
Transport
Biological_process
Cell differentiation
Nervous system development
0.02
<0.01
0.16
0.14
0.140.06
0.07
BMain Breed GO Unknown / Others
Transcription
Immune response
Antigen processing
Regulation of transcription
Multicellular organismaldevelopmentMetabolic process
Protein amino acid phosphorylation
Transport
Biological_process
Cell differentiation
Nervous system development
0.02
<0.01
0.16
0.14
0.140.06
0.07 Main Breed GO Unknown / Others
Transcription
Immune response
Antigen processing
Regulation of transcription
Multicellular organismaldevelopmentMetabolic process
Protein amino acid phosphorylation
Transport
Biological_process
Cell differentiation
Nervous system development
0.02
<0.01
0.16
0.14
0.140.06
0.07
B
Main Sex GO
Regulation of transcription
Biological_process
Unknown / Others
Transcription
Translational initiation
Antigen processing
Immune response
Signal transduction
0.02
0.09
<0.01
<0.01
<0.01
0.02
A
Main Sex GO
Regulation of transcription
Biological_process
Unknown / Others
Transcription
Translational initiation
Antigen processing
Immune response
Signal transduction
0.02
0.09
<0.01
<0.01
<0.01
0.02 Main Sex GO
Regulation of transcription
Biological_process
Unknown / Others
Transcription
Translational initiation
Antigen processing
Immune response
Signal transduction
0.02
0.09
<0.01
<0.01
<0.01
0.02
A
BMC Genomics 2008, 9:173 http://www.biomedcentral.com/1471-2164/9/173
breed, which were comparable (Table 2), we were able toidentify genes with differential expression between breedsand between sexes. Noticeably, different genes wereaffected by each factor, i.e., the genes primarily affected bysex were different than those affected by breed or tissue.Are genes whose expression differ between breeds differ-entially expressed across all tissues or is there any interac-tion tissue × gene? Our experimental design does notallow to resolve this issue with enough power. However,the results (Figure 5, Table 6) hint that interaction can beimportant for differentially expressed genes betweenbreeds but not so much between sexes. Resolving thisquestion is of the utmost interest, both to understand theprofound influences of artificial selection on the organ-isms and to propose novel more efficient strategies foranimal breeding.
Although more work is needed to calibrate the actual rel-evance of breed or genetic differences to the pig's tran-scriptome (or in any other species), it seems difficult thatthe importance of breed or sex differences exceeds that oftissue. Thus, the argument that regulatory rather thanstructural mutations are a more important source of phe-notypic variability [5] needs then to be considered in per-spective. It follows from our study that differences withinthe same individual largely exceeds those between indi-viduals.
MethodsAnimal materialFour animals, two Large White (LW) and two Iberian (IB)piglets were bought from two breeding companies andtransferred to the University experimental farms at wean-ing, i.e., aged one month approximately. Pigs were housedsimultaneously, fed the same diets during the fatteningperiod, that lasted two months, and were weighed atweekly intervals. At the time of slaughter, the average ageswere 87 and 89 days for LW and IB, respectively. Theirmean live weights at that time were 37.5 (LW) and 29.1 kg(IB). The four animals were identified as LW or IB andmale (M) or female (F), i.e., LWM, LWF, IBM and IBF.
Animals were euthanized by an overdose of intravenoussodium thiobarbital. At necropsy, samples of 16 tissueswere collected, snap frozen in liquid nitrogen and storedat -80°C. The average time gap between euthanasia andtissue collection was ~15 minutes, maximum time was 25minutes. The tissues collected were olfactory bulb (OLFB),hypothalamus (HYPO), pineal gland (PING), adenohy-pophysis (AHYP), neurohypophysis (NHYP), adrenal cor-tex (ADGC), adrenal medulla (ADGM), thyroid gland(THYG), diaphragm (DIAP), M. Biceps femoris (BIFE),back fat tissue (FATB), abdominal fat tissue (FATA), stom-ach (STOM), liver (LIVR), ileum (ILEU) and whole blood(BLOO). Adrenal cortex and medulla were separated by a
sharp knife. The hypothalamus included the mamillarybody and grey tubercle but excluded the chiasma opti-cum. The nomenclature for organs and tissues was usedaccording to the Nomina Anatomica Veterinaria[35]. Moredetails are given in Table 1. Throughout this work, a sam-ple is identified by the acronym of the tissue followed bythe animal id, e.g., FATB_LWF refers to back fat tissuefrom the female Large White. All procedures wereapproved by the Ethical and Animal Welfare Committeeof the Universitat Autònoma de Barcelona, in accordancewith the guidelines of the Good Experimental Practices.
RNA extraction and microarray hybridizationTotal RNA was extracted from 100 mg tissue using theRiboPure™ kit (Ambion, Austin, USA) according to themanufacturer's protocol. RNA was quantified with theNanoDrop ND-1000 spectrophotometer (NanoDropTechnologies, Wilmington, USA) and the RNA integritywas assessed by Agilent Bioanalyser 2100 and RNA Nano6000 Labchip kit (Agilent Technologies, Palo Alto, USA).Due to high variation in concentrations of the total RNAobtained in different tissues, all samples were concen-trated and cleaned using the RNAeasy MiniElute Cleanupkit (Qiagen, Basel, Switzerland) obtaining final concen-trations between 500 and 1000 ng/μl.
A total of 64 microarrays (4 animals × 16 tissues) werehybridized and scanned at the Institut de Recerca HospitalUniversitari Vall d'Hebron (Barcelona, Spain). Briefly, thecDNA synthesis was undertaken with 5 μg of total RNA,labelled with biotin and hybridized to individual high-density oligonucleotide microarray chips (GeneChip®
Porcine) from Affymetrix (Santa Clara CA) containing atotal of 23,937 probe sets (23,256 transcripts), represent-ing 20,201 Sus scrofa genes, 11,265 of these genes wereannotated by Tsai et al. (2006). The hybridization wasdone according to Affymetrix standard protocols andmicroarray expression data were generated with Gene-Chip Operating Software (GCOS). As the annotation pro-vided by the manufacturer is not too detailed, the resultsin this work are based in the annotation developed by[26]. The complete data set, both RMA and original CELfiles, are available at Gene Expression Omnibus (GEO)under accession number GSE10898.
Quantitative RT-PCRWe used quantitative real time PCR (QRT-PCR) to vali-date differential expression between sexes of one of theprobes (Ssc.4897.1.A1_at) annotated as CLOCK gene[26]. Expression was analyzed in backfat tissue from 27pigs, 14 females and 13 males, pertaining to five breeds:Large White, Landrace, Duroc, Iberian and a compositeline. We used the ABBI PRISM 7900 Sequence DetectionSystem in combination of SYBR Green chemistry (AppliedBiosystems, Inc., Foster City, CA). S. scrofa Beta-2-
Page 16 of 20(page number not for citation purposes)

BMC Genomics 2008, 9:173 http://www.biomedcentral.com/1471-2164/9/173
microglobulin (GenBank accession numberNM_213978.1) was used as endogenous control. Primerswere designed using the PrimerExpress 2.0 software(Applied Biosystems, Inc., Foster City, CA) and are shownin additional file 3. The PCR amplicons were 96 bp and108 bp long for the Ssc.4897.1.A1_at and microglobulingenes, respectively.
We used the 2-ΔΔCT method for relative quantification(RQ) of gene expression [36], a comparative technique inwhich a target gene is normalized to an endogenous con-trol and relative to a calibrator sample. This methodrequires the target and endogenous PCR efficiencies to benearly to equal. Thus, we performed a validation experi-ment and we plotted the log input amount of cDNA (dilu-tions of 1:20, 1:200, 1:2000, 1:20000 of a back fat tissuecDNA sample) versus de ΔCt, obtaining an absolute slopeof 0.0273 (<0.1) thus permitting the use of the 2-ΔΔCT
method for relative quantification. The High CapacitycDNA Transcription Kit (Applied Biosystems, Inc., FosterCity, CA) was used to synthesize cDNA from 1 μg of back-fat tissue RNA following the manufacturer's instructions.PCR amplifications were performed in a total volume of20 μl containing 5 μl of cDNA sample diluted 1:2000 or1:20. Primers were used at 300 nM each and at 600 nMeach for Ssc.4897.1.A1_at and microglobulin genes,respectively. Each sample was analyzed by triplicate. Thethermal cycle was: 10 min at 95°C and 40 cycles of 15 secat 95°C and 1 min at 60°C. A dissociation curve was per-formed in order to assess that there were not primer dimerformation. The sample of lowest expression level was usedas calibrator
Data processing and statistical analysisQuality control of CEL files was done with the Affy pack-age of bioconductor [37]: RNA degradation and the rawdata distribution were ascertained. All CEL files were nor-malized simultaneously with the RMA procedure usinglibaffy [38]. This software is much more efficient in termsof memory than the bioconductor application. After RMAprocessing, data were log-transformed for further analysis.
An initial visual appraisal of the data was carried outdrawing neighbor – joining (NJ) and UPGMA trees withMega 4.0 [39]. The pairwise distance used was 1 - r2, wherer is the correlation coefficient across all pairs of probe lev-els between pairs of samples. To gain further insight, werelied on mixed model methods. These have been longbeing used in Animal Breeding [31], and have been advo-cated more recently to analyze microarray data, mainly inthe context of cDNA (two color) microarray [40]. We fit-ted several mixed models to the data. The most basicmodel,
yijkg = Tissuei + Breedj + Sexk + Probeg + eijkg, (1)
was used for initial exploratory analysis. Above ygijk refers
to the expression level of the g-th Probe (g = 1, 23937) ati-th tissue (i = 1, 16) from animal of breed j (j = 1, 2, i.e.,Large White and Iberian) and sex k (k = 1, 2 or male andfemale). Note that a given gene may be represented bymore than one probe. However, different probes of thesame gene can behave differently due to at least two rea-sons: alternative splicing and poor annotation. Thus, herewe used the probe rather than the annotated gene in themodel. Preliminary studies (results not shown) shownthat including the probe rather than the gene explained alarger part of the variance. Nevertheless, we refer to differ-entially expressed gene to mean the gene (if known) cor-responding to the probe that shows a significantdifferential hybridization. All Tissue, Breed and Sex weretreated as fixed effects, whereas Probe was random with
variance . Next, we evaluated the relevance of interac-
tion probe × tissue, probe × breed and probe × sex by com-paring the following models against model (1):
yijkg = Tissuei + Breedj + Sexk + Probeg + Probeg × Tissuei +eijkg,(2)
yijkg = Tissuei + Breedj + Sexk + Probeg + Probeg × Breedj +eijkg,(3)
and
yijkg = Tissuei + Breedj + Sexk + Probeg + Probeg × Sexk + eijkg .(4)
All interactions above were treated as random. The ratio of
variances ,
and
measure the global rele-
vance of differential gene expression across tissues, breedsand sexes, respectively. Analyses were carried out withQxpak [41] and VCE [42]on a Linux PC.
We also explored the biometric relationship between tis-sues. The average distance between tissues was obtained
from 1- , where between tissues i and j is the
squared correlation across probes between the Probeg × Tis-
suei and Probeg × Tissuej solutions obtained from model
(2). Again, NJ-trees were drawn with Mega 4 to visualizethe results. An additional measure of distance between tis-sues can be provided by the number of extreme probesthat separated a given tissue (or a group of tissues) from
σ P2
hPT PT PT P2 2 2 2 2= + +σ σ σ σ/ )( e
hPB PB PB P2 2 2 2 2= + +σ σ σ σ/ )( e
hPS PS PS P2 2 2 2 2= + +σ σ σ σ/ )( e
rT2 rT
2
Page 17 of 20(page number not for citation purposes)

BMC Genomics 2008, 9:173 http://www.biomedcentral.com/1471-2164/9/173
the rest. An extreme probe for the i-th tissue was definedas a probe for which all four mRNA levels of the i-th tissuewere either smaller or larger than the remaining 60 obser-vations pertaining to the remaining 15 tissues. The sameprocedure applies when Simulations showed that theprobability of having such an arrangement was very small(P ~10-4) for random normal variates.
Further, we examined the effects of breed and sex on geneexpression. To do that, we computed the z-score, definedas the standardized difference of gene expression predic-
tions between breeds ( ) or between sexes ( ), i.e., for
gene g with subscript 1 referring to male
and 2 to female, and with subscript 1
referring to Large White and 2 to Iberian, where PBgj is the
prediction of the interaction between probe g and breed j
(Probeg × Breedj) obtained from model (3), and σΔ is the
standard deviation of the numerator. Similar notation
applies to . Once the probes were ranked by their breed
or sex absolute scores, we selected those with a false dis-covery rate (FDR) of less than 5% following the standardprocedure [43]. P-values of the z-scores were obtainedassuming a normal distribution with SD = 1. We per-formed a hierarchical cluster analyses of the microarraysusing the significant (FDR < 0.05) probes for either breedor sex with Cluster 3.0 [17]. The metrics employed wasuncentered correlation with the complete linkage option.Results were visualized with Java TreeView 1.1 [44].
Note that all data available were utilized simultaneouslyin the mixed model analyses just presented,i.e., 23,937probes × 16 tissues × 4 animals ~1.5 million records. Thisimplies that any solution in models (1 – 4) was estimatedtaking into account all information available. Thus, allestimates should have high accuracy, provided that themodels adjust to the data. We discuss this issue in theresults and discussion section below.
Functional analysesWe obtained the gene ontology (GO) process using theonto-express platform [25]. This platform allows to com-pare automatically the frequency in GO classes in allgenes with known annotation in the whole microarray vs.GO class frequencies in a target lits, e.g., the most differ-entially expressed genes between sexes or breeds orextreme genes in embryonic layers. False discovery ratesare reported.
AbbreviationsFDR: False Discovery Rate; GO: Gene Ontology; IB: Ibe-rian pig breed; LW: Large White pig breed; NJ: Neighbor –Joining; RMA: Robust Multiarray Average; QRT-PCR: RealTime Quantitative Reverse Transcription PolymeraseChain reaction; UPGMA: Unweighted Pair-Group Methodwith Arithmetic Mean.
Authors' contributionsMPE conceived the research. MPE, MLB and JMF super-vised research, all carried out the research. ALJF and MPEanalyzed the data. ALJF and MPE wrote the first version ofthe manuscript.
Data availabilityThe data used in this study have been deposited in GEOunder accession numbers GSE10898.
Additional material
AcknowledgementsThanks to Toni Reverter for insightful discussions, to all people who helped in the dissection (Irina Garcia-Ispierto, Cristina Andreu, Llibertat Tussell, Sònia Tort, Sebas Morán and Carlos López-Plana), to J. Estellé for sharing unpublished QRT-PCR primers, to the personnel in the microarray service
z gb z g
s
z gb PBg PBg
B= 1 2−
σΔ
z gs PSg PSg
S=
−1 2σΔ
z gs
Additional file 1List of extreme probes for each of the tissues grouped according to the three embryonic layers. Ectoderm tissues were olfactory bulb, both hypophyses, pineal gland and hypothalamus; mesoderm comprised fat and muscle tis-sues; and endoderm, liver, stomach and ileum. An extreme probe for a given group was defined as one where all expression values in the tissue group were either higher or lower than the values in the rest of tissues (Material and Methods). The marginal difference is the difference between the maximum value of the extreme probe in the group of tissues under consideration and the minimum value in the rest of tissues (when marginal difference is negative) or between the minimum value in the group and the maximum value in the rest of tissues (a positive difference). Thus, a negative marginal diference means that the gene is underex-pressed; a positive marginal difference, overexpressed. There are two sets of columns for negative and positive marginal differences, respectively.Click here for file[http://www.biomedcentral.com/content/supplementary/1471-2164-9-173-S1.xls]
Additional file 2List of extreme genes for each of the 16 tissues studied. Notation is iden-tical to that in additional file 1.Click here for file[http://www.biomedcentral.com/content/supplementary/1471-2164-9-173-S2.xls]
Additional file 3Primers used for QRT-PCR.Click here for file[http://www.biomedcentral.com/content/supplementary/1471-2164-9-173-S3.doc]
Page 18 of 20(page number not for citation purposes)

BMC Genomics 2008, 9:173 http://www.biomedcentral.com/1471-2164/9/173
from Vall d'Hebron Hospital (Barcelona) and in the farm. We are also grate-ful to J. Reixach and Batallé (Girona, Spain) and to A. Fernández (INIA, Madrid) for sharing unpublished information. ALJF is recipient of a fellow-ship from National Council of Technological and Scientific Development (CNPq, Brazil), AO is funded by a PhD fellowship (Ministry of Education and Science – MEC – Spain), LTF is supported by a CAPES grant (Ministry of Education, Brazil). Work funded by MEC grants AGL2004-0103/GAN and AGL2007-65563-C02-01/GAN (Spain). The microarray hibridizations were carried out at the Microarray Service, Core Facility of Institute of Research of University Hospital Vall d'Hebron (UCTS IR-HUVH, Barce-lona) and subsidized by Fundación Genoma España (www.gen-es.org).
References1. Gibson G, Weir B: The quantitative genetics of transcription.
Trends Genet 2005, 21(11):616-623.2. Cheung VG, Spielman RS: The genetics of variation in gene
expression. Nat Genet 2002, 32 :522-525.3. Jin W, Riley RM, Wolfinger RD, White KP, Passador-Gurgel G, Gib-
son G: The contributions of sex, genotype and age to tran-scriptional variance in Drosophila melanogaster. Nat Genet2001, 29(4):389-395.
4. Oleksiak MF, Churchill GA, Crawford DL: Variation in geneexpression within and among natural populations. Nat Genet2002, 32(2):261-266.
5. King MC, Wilson AC: Evolution at two levels in humans andchimpanzees. Science 1975, 188(4184):107-116.
6. Reiner-Benaim A, Yekutieli D, Letwin NE, Elmer GI, Lee NH, KafkafiN, Benjamini Y: Associating quantitative behavioral traits withgene expression in the brain: searching for diamonds in thehay. Bioinformatics 2007, 23(17):2239-2246.
7. Cagnazzo M, te Pas MFW, Priem J, de Wit AAC, Pool MH, Davoli R,Russo V: Comparison of prenatal muscle tissue expressionprofiles of two pig breeds differing in muscle characteristics.J Anim Sci 2006, 84(1):1-10.
8. Lin CS, Hsu CW: Differentially transcribed genes in skeletalmuscle of Duroc and Taoyuan pigs. J Anim Sci 2005,83(9):2075-2086.
9. Ponsuksili S, Murani E, Walz C, Schwerin M, Wimmers K: Pre- andpostnatal hepatic gene expression profiles of two pig breedsdiffering in body composition: insight into pathways of met-abolic regulation. Physiol Genomics 2007, 29(3):267-279.
10. Tang Z, Li Y, Wan P, Li X, Zhao S, Liu B, Fan B, Zhu M, Yu M, Li K:LongSAGE analysis of skeletal muscle at three prenatalstages in Tongcheng and Landrace pigs. Genome Biol 2007,8(6):R115.
11. Caetano AR, Johnson RK, Ford JJ, Pomp D: Microarray profilingfor differential gene expression in ovaries and ovarian folli-cles of pigs selected for increased ovulation rate. Genetics2004, 168(3):1529-1537.
12. Pubmed: [http://www.ncbi.nlm.nih.gov/sites/entrez?db=PubMed].13. Zhang W, Morris QD, Chang R, Shai O, Bakowski MA, Mitsakakis N,
Mohammad N, Robinson MD, Zirngibl R, Somogyi E, Laurin N,Eftekharpour E, Sat E, Grigull J, Pan Q, Peng WT, Krogan N, Green-blatt J, Fehlings M, van der Kooy D, Aubin J, Bruneau BG, Rossant J,Blencowe BJ, Frey BJ, Hughes TR: The functional landscape ofmouse gene expression. J Biol 2004, 3(5):21.
14. Yang X, Schadt EE, Wang S, Wang H, Arnold AP, Ingram-Drake L,Drake TA, Lusis AJ: Tissue-specific expression and regulationof sexually dimorphic genes in mice. Genome Res 2006,16(8):995-1004.
15. Shyamsundar R, Kim YH, Higgins JP, Montgomery K, Jorden M,Sethuraman A, van de Rijn M, Botstein D, Brown PO, Pollack JR: ADNA microarray survey of gene expression in normalhuman tissues. Genome Biol 2005, 6(3):R22.
16. Su AI, Wiltshire T, Batalov S, Lapp H, Ching KA, Block D, Zhang J,Soden R, Hayakawa M, Kreiman G, Cooke MP, Walker JR, HogeneschJB: A gene atlas of the mouse and human protein-encodingtranscriptomes. Proc Natl Acad Sci U S A 2004, 101(16):6062-6067.
17. Eisen MB, Spellman PT, Brown PO, Botstein D: Cluster analysisand display of genome-wide expression patterns. Proc NatlAcad Sci U S A 1998, 95(25):14863-14868.
18. Irizarry RA, Bolstad BM, Collin F, Cope LM, Hobbs B, Speed TP:Summaries of Affymetrix GeneChip probe level data. NucleicAcids Res 2003, 31(4):e15.
19. Igarashi Y, Kimura T: Adrenocorticotropic hormone-mediatedchanges in rat adrenal mitochondrial phospholipids. J BiolChem 1984, 259(17):10745-10753.
20. Felsenstein J: Inferring Phylogenies. Sinauer; 2004. 21. Gofflot F, Chartoire N, Vasseur L, Heikkinen S, Dembele D, Le Mer-
rer J, Auwerx J: Systematic gene expression mapping clustersnuclear receptors according to their function in the brain.Cell 2007, 131(2):405-418.
22. Nadler JJ, Zou F, Huang H, Moy SS, Lauder J, Crawley JN, ThreadgillDW, Wright FA, Magnuson TR: Large-Scale Gene ExpressionDifferences Across Brain Regions and Inbred Strains Corre-late With a Behavioral Phenotype. Genetics 2006,174(3):1229-1236.
23. Xu X, Zhan M, Duan W, Prabhu V, Brenneman R, Wood W, FirmanJ, Li H, Zhang P, Ibe C, Zonderman AB, Longo DL, Poosala S, BeckerKG, Mattson MP: Gene expression atlas of the mouse centralnervous system: impact and interactions of age, energyintake and gender. Genome Biol 2007, 8(11):R234.
24. Mansouri A, Chowdhury K, Gruss P: Follicular cells of the thyroidgland require Pax8 gene function. Nat Genet 1998, 19(1):87-90.
25. Draghici S, Khatri P, Bhavsar P, Shah A, Krawetz SA, Tainsky MA:Onto-Tools, the toolkit of the modern biologist: Onto-Express, Onto-Compare, Onto-Design and Onto-Translate.Nucleic Acids Res 2003, 31(13):3775-3781.
26. Tsai S, Cassady JP, Freking BA, Nonneman DJ, Rohrer GA, PiedrahitaJA: Annotation of the Affymetrix porcine genome microar-ray. Animal Genetics 2006, 37(4):423-424.
27. de la Iglesia HO, Schwartz WJ: Minireview: timely ovulation: cir-cadian regulation of the female hypothalamo-pituitary-gonadal axis. Endocrinology 2006, 147(3):1148-1153.
28. Sakai T, Ishida N: Circadian rhythms of female mating activitygoverned by clock genes in Drosophila. Proc Natl Acad Sci U S A2001, 98(16):9221-9225.
29. Rymer J, Bauernfeind AL, Brown S, Page TL: Circadian rhythms inthe mating behavior of the cockroach, Leucophaea mad-erae. J Biol Rhythms 2007, 22(1):43-57.
30. Ellegren H, Parsch J: The evolution of sex-biased genes and sex-biased gene expression. Nat Rev Genet 2007, 8(9):689-698.
31. Henderson CR: Applications of Linear Models in AnimalBreeding. University of Guelph; 1984:462.
32. Kerr MK, Churchill GA: Statistical design and the analysis ofgene expression microarray data. Genet Res 2001,77(2):123-128.
33. Moser RJ, Reverter A, Kerr CA, Beh KJ, Lehnert SA: A mixed-model approach for the analysis of cDNA microarray geneexpression data from extreme-performing pigs after infec-tion with Actinobacillus pleuropneumoniae. J Anim Sci 2004,82(5):1261-1271.
34. Gentleman R, Carey VJ, Huber W, Irizarry RA, Dudoit S: Bioinfor-matics and computational biology solutions using R and bio-conductor. Springer; 2005.
35. NAV: Nomina Anatomica Veterinaria. In World Association ofVeterinary Anatomists (5th edition) Edited by: H. Waibl HGGCYHPS.Hannover ; 2005.
36. Livak KJ, Schmittgen TD: Analysis of relative gene expressiondata using real-time quantitative PCR and the 2(-Delta DeltaC(T)) Method. Methods 2001, 25(4):402-408.
37. Reimers M, Carey VJ: Bioconductor: an open source frameworkfor bioinformatics and computational biology. Methods Enzy-mol 2006, 411:119-134.
38. Eschrich SA, Hoerter AM: Libaffy: software for processingAffymetrix(R) GeneChip(R) data. Bioinformatics 2007,23(12):1562-1564.
39. Tamura K, Dudley J, Nei M, Kumar S: MEGA4: Molecular Evolu-tionary Genetics Analysis (MEGA) software version 4.0. MolBiol Evol 2007, 24(8):1596-1599.
40. Kerr MK, Martin M, Churchill GA: Analysis of variance for geneexpression microarray data. J Comput Biol 2000, 7(6):819-837.
41. Pérez-Enciso M, Misztal I: Qxpak: a versatile mixed model appli-cation for genetical genomics and QTL analyses. Bioinformatics2004, 20(16):2792-2798.
42. Groeneveld E: VCE: variance component estimation. 1998[http://www.tzv.fal.de/~eg/].
Page 19 of 20(page number not for citation purposes)
http://www.ncbi.nlm.nih.gov/entrez/query.fcgi?cmd=Retrieve&db=PubMed&dopt=Abstract&list_uids=1090005
http://www.ncbi.nlm.nih.gov/entrez/query.fcgi?cmd=Retrieve&db=PubMed&dopt=Abstract&list_uids=1090005
http://www.ncbi.nlm.nih.gov/entrez/query.fcgi?cmd=Retrieve&db=PubMed&dopt=Abstract&list_uids=9843981
http://www.ncbi.nlm.nih.gov/entrez/query.fcgi?cmd=Retrieve&db=PubMed&dopt=Abstract&list_uids=9843981
http://www.ncbi.nlm.nih.gov/entrez/query.fcgi?cmd=Retrieve&db=PubMed&dopt=Abstract&list_uids=6088515
http://www.ncbi.nlm.nih.gov/entrez/query.fcgi?cmd=Retrieve&db=PubMed&dopt=Abstract&list_uids=6088515
http://www.ncbi.nlm.nih.gov/entrez/query.fcgi?cmd=Retrieve&db=PubMed&dopt=Abstract&list_uids=9590297
BMC Genomics 2008, 9:173 http://www.biomedcentral.com/1471-2164/9/173
Publish with BioMed Central and every scientist can read your work free of charge
"BioMed Central will be the most significant development for disseminating the results of biomedical research in our lifetime."
Sir Paul Nurse, Cancer Research UK
Your research papers will be:
available free of charge to the entire biomedical community
peer reviewed and published immediately upon acceptance
cited in PubMed and archived on PubMed Central
yours — you keep the copyright
Submit your manuscript here:http://www.biomedcentral.com/info/publishing_adv.asp
BioMedcentral
43. Benjamini Y, Hochberg: Controlling the false discovery rate - Apractical and powerful approach to multiple testing. J RoyalStat Soc Ser B 1995, 57:289-300.
44. Saldanha AJ: Java Treeview--extensible visualization of micro-array data. Bioinformatics 2004, 20(17):3246-3248.
Page 20 of 20(page number not for citation purposes)