
Estrogen Receptor β (ESR2) Transcriptome and Chromatin ...
17
Citation: Huang, D.; Huang, Z.; Indukuri, R.; Bangalore Revanna, C.; Berglund, M.; Guan, J.; Yakimchuk, K.; Damdimopoulos, A.; Williams, C.; Okret, S. Estrogen Receptor β (ESR2) Transcriptome and Chromatin Binding in a Mantle Cell Lymphoma Tumor Model Reveal the Tumor-Suppressing Mechanisms of Estrogens. Cancers 2022, 14, 3098. https://doi.org/10.3390/ cancers14133098 Academic Editors: Takashi Suzuki and Yasuhiro Miki Received: 27 May 2022 Accepted: 21 June 2022 Published: 24 June 2022 Publisher’s Note: MDPI stays neutral with regard to jurisdictional claims in published maps and institutional affil- iations. Copyright: © 2022 by the authors. Licensee MDPI, Basel, Switzerland. This article is an open access article distributed under the terms and conditions of the Creative Commons Attribution (CC BY) license (https:// creativecommons.org/licenses/by/ 4.0/). cancers Article Estrogen Receptor β (ESR2) Transcriptome and Chromatin Binding in a Mantle Cell Lymphoma Tumor Model Reveal the Tumor-Suppressing Mechanisms of Estrogens Dan Huang 1 , Zhiqiang Huang 1 , Rajitha Indukuri 1,2 , Chandrashekar Bangalore Revanna 1 , Mattias Berglund 1 , Jiyu Guan 1 , Konstantin Yakimchuk 1 , Anastasios Damdimopoulos 3 , Cecilia Williams 1,2 and Sam Okret 1, * 1 Department of Biosciences and Nutrition, Karolinska Institutet, SE-141 83 Huddinge, Sweden; [email protected] (D.H.); [email protected] (Z.H.); [email protected] (R.I.); [email protected] (C.B.R.); [email protected] (M.B.); [email protected] (J.G.); [email protected] (K.Y.); [email protected] (C.W.) 2 Department of Protein Science, Science for Life Laboratory, KTH Royal Institute of Technology, SE-171 21 Solna, Sweden 3 Bioinformatics and Expression Core Facility, Department of Biosciences and Nutrition, Karolinska Institutet, SE-141 83 Huddinge, Sweden; [email protected] * Correspondence: [email protected]; Tel.: +46-8-524-81069 Simple Summary: Mantle cell lymphoma (MCL) is much more common in males than in females. The reason for this is not clear, but research has indicated that the female sex hormones, estrogens, have a protective effect on MCL development. To study this further, mice were transplanted with MCL cells and treated with an estrogen that selectively activates ESR2, the main nuclear estrogen receptor in lymphoma cells. The activation of ESR2 resulted in reduced MCL tumor growth of MCL tumors that were both sensitive and resistant to a newly developed drug (ibrutinib). The mechanism for this effect was investigated by analyzing gene expression and ESR2 binding to target genes. The results show that the affected genes were enriched in several malignancy-related biological processes, including MCL. Furthermore, the results suggested an interplay between the lymphoma cells and the tumor microenvironment in response to ESR2 activation. Altogether, the results clarify the mechanisms of ESR2-mediated MCL growth impairment by estrogens and provide a possible explanation for the sex difference in incidence. Furthermore, targeting ESR2 may be an option when considering the treatment of MCL. Abstract: Mantle cell lymphoma (MCL) is a non-Hodgkin lymphoma with one of the highest male-to- female incidence ratios. The reason for this is not clear, but epidemiological as well as experimental data have suggested a role for estrogens, particularly acting through estrogen receptor β (ESR2). To study the ESR2 effects on MCL progression, MCL cells sensitive and resistant to the Bruton tyrosine kinase inhibitor ibrutinib were grafted to mice and treated with the ESR2-selective agonist diarylpropionitrile (DPN). The results showed that the DPN treatment of mice grafted with both ibrutinib-sensitive and -resistant MCL tumors resulted in impaired tumor progression. To identify the signaling pathways involved in the impaired tumor progression following ESR2 agonist treatment, the transcriptome and ESR2 binding to target genes were investigated by genome-wide chromatin immunoprecipitation in Granta-519 MCL tumors. DPN-regulated genes were enriched in several biological processes that included cell–cell adhesion, endothelial–mesenchymal transition, nuclear factor-kappaB signaling, vasculogenesis, lymphocyte proliferation, and apoptosis. In addition, downregulation of individual genes, such as SOX11 and MALAT1, that play a role in MCL progression was also observed. Furthermore, the data suggested an interplay between the lymphoma cells and the tumor microenvironment in response to the ESR2 agonist. In conclusion, the results clarify the mechanisms by which estrogens, via ESR2, impair MCL tumor progression and provide a possible explanation for the sex-dependent difference in incidence. Furthermore, targeting ESR2 with a selective agonist may be an additional option when considering the treatment of both ibrutinib- sensitive and -resistant MCL tumors. Cancers 2022, 14, 3098. https://doi.org/10.3390/cancers14133098 https://www.mdpi.com/journal/cancers
-
Upload
khangminh22 -
Category
Documents
-
view
2 -
download
0
Transcript of Estrogen Receptor β (ESR2) Transcriptome and Chromatin ...

Citation: Huang, D.; Huang, Z.;
Indukuri, R.; Bangalore Revanna, C.;
Berglund, M.; Guan, J.; Yakimchuk,
K.; Damdimopoulos, A.; Williams, C.;
Okret, S. Estrogen Receptor β (ESR2)
Transcriptome and Chromatin
Binding in a Mantle Cell Lymphoma
Tumor Model Reveal the
Tumor-Suppressing Mechanisms of
Estrogens. Cancers 2022, 14, 3098.
https://doi.org/10.3390/
cancers14133098
Academic Editors: Takashi Suzuki
and Yasuhiro Miki
Received: 27 May 2022
Accepted: 21 June 2022
Published: 24 June 2022
Publisher’s Note: MDPI stays neutral
with regard to jurisdictional claims in
published maps and institutional affil-
iations.
Copyright: © 2022 by the authors.
Licensee MDPI, Basel, Switzerland.
This article is an open access article
distributed under the terms and
conditions of the Creative Commons
Attribution (CC BY) license (https://
creativecommons.org/licenses/by/
4.0/).
cancers
Article
Estrogen Receptor β (ESR2) Transcriptome and ChromatinBinding in a Mantle Cell Lymphoma Tumor Model Reveal theTumor-Suppressing Mechanisms of EstrogensDan Huang 1, Zhiqiang Huang 1 , Rajitha Indukuri 1,2 , Chandrashekar Bangalore Revanna 1, Mattias Berglund 1,Jiyu Guan 1, Konstantin Yakimchuk 1, Anastasios Damdimopoulos 3, Cecilia Williams 1,2 and Sam Okret 1,*
1 Department of Biosciences and Nutrition, Karolinska Institutet, SE-141 83 Huddinge, Sweden;[email protected] (D.H.); [email protected] (Z.H.); [email protected] (R.I.);[email protected] (C.B.R.); [email protected] (M.B.); [email protected] (J.G.);[email protected] (K.Y.); [email protected] (C.W.)
2 Department of Protein Science, Science for Life Laboratory, KTH Royal Institute of Technology,SE-171 21 Solna, Sweden
3 Bioinformatics and Expression Core Facility, Department of Biosciences and Nutrition, Karolinska Institutet,SE-141 83 Huddinge, Sweden; [email protected]
* Correspondence: [email protected]; Tel.: +46-8-524-81069
Simple Summary: Mantle cell lymphoma (MCL) is much more common in males than in females.The reason for this is not clear, but research has indicated that the female sex hormones, estrogens,have a protective effect on MCL development. To study this further, mice were transplanted withMCL cells and treated with an estrogen that selectively activates ESR2, the main nuclear estrogenreceptor in lymphoma cells. The activation of ESR2 resulted in reduced MCL tumor growth of MCLtumors that were both sensitive and resistant to a newly developed drug (ibrutinib). The mechanismfor this effect was investigated by analyzing gene expression and ESR2 binding to target genes.The results show that the affected genes were enriched in several malignancy-related biologicalprocesses, including MCL. Furthermore, the results suggested an interplay between the lymphomacells and the tumor microenvironment in response to ESR2 activation. Altogether, the results clarifythe mechanisms of ESR2-mediated MCL growth impairment by estrogens and provide a possibleexplanation for the sex difference in incidence. Furthermore, targeting ESR2 may be an option whenconsidering the treatment of MCL.
Abstract: Mantle cell lymphoma (MCL) is a non-Hodgkin lymphoma with one of the highest male-to-female incidence ratios. The reason for this is not clear, but epidemiological as well as experimentaldata have suggested a role for estrogens, particularly acting through estrogen receptor β (ESR2).To study the ESR2 effects on MCL progression, MCL cells sensitive and resistant to the Brutontyrosine kinase inhibitor ibrutinib were grafted to mice and treated with the ESR2-selective agonistdiarylpropionitrile (DPN). The results showed that the DPN treatment of mice grafted with bothibrutinib-sensitive and -resistant MCL tumors resulted in impaired tumor progression. To identify thesignaling pathways involved in the impaired tumor progression following ESR2 agonist treatment,the transcriptome and ESR2 binding to target genes were investigated by genome-wide chromatinimmunoprecipitation in Granta-519 MCL tumors. DPN-regulated genes were enriched in severalbiological processes that included cell–cell adhesion, endothelial–mesenchymal transition, nuclearfactor-kappaB signaling, vasculogenesis, lymphocyte proliferation, and apoptosis. In addition,downregulation of individual genes, such as SOX11 and MALAT1, that play a role in MCL progressionwas also observed. Furthermore, the data suggested an interplay between the lymphoma cells andthe tumor microenvironment in response to the ESR2 agonist. In conclusion, the results clarify themechanisms by which estrogens, via ESR2, impair MCL tumor progression and provide a possibleexplanation for the sex-dependent difference in incidence. Furthermore, targeting ESR2 with aselective agonist may be an additional option when considering the treatment of both ibrutinib-sensitive and -resistant MCL tumors.
Cancers 2022, 14, 3098. https://doi.org/10.3390/cancers14133098 https://www.mdpi.com/journal/cancers

Cancers 2022, 14, 3098 2 of 17
Keywords: mantle cell lymphoma; estrogens; estrogen receptor β; ESR2; xenograft; ibrutinib; RNAsequencing; chromatin immunoprecipitation; tumor microenvironment; macrophages
1. Introduction
Mantle cell lymphoma (MCL) is one of the non-Hodgkin lymphoma (NHL) subtypes,and it constitutes approximately 7% of adult NHL, with an overall poor prognosis [1].Furthermore, MCLs are heterogeneous regarding their response to targeted therapy usingibrutinib, an inhibitor of the Bruton tyrosine kinase (BTK), a central mediator of B-cellreceptor (BCR) signaling. Likewise, for most NHL including MCL, males are more affectedthan females with male-to-female incidence ratios for MCL varying between 2 and 7:1 indifferent reports [2,3]. Furthermore, male sex has, in an observational study, been identifiedas an independent negative prognostic factor [4]. The reason for the sex difference is unclear,but epidemiological data have suggested that estrogens may exert a protective effect onNHL [5,6].
The biological actions of estrogens are largely mediated through nuclear estrogenreceptor α (ESR1) and estrogen receptor β (ESR2). Acting as ligand-regulated transcriptionfactors, these receptors, when bound to estrogens, either stimulate or repress target genetranscription. This is performed by binding directly to the DNA at estrogen responsiveelements (ERE) by target genes or indirectly by tethering to other transcription factorsbound to the DNA [7]. In addition, estrogens may act through G-protein-coupled estrogenreceptor 1 (GPER1), a membrane-bound receptor mediating mainly rapid non-genomicresponses [8]. Though human lymph nodes express both ESR1 and ESR2, the predominantlyexpressed nuclear estrogen receptor in normal lymphocytes and lymphomas is ESR2 [9,10].In addition, GPER1 is expressed in lymphocytes [11] and lymphoma cells [12]. Based on thestructural differences in the ligand-binding domains of ESR1 and ESR2, synthetic ligandshave been developed, which show receptor selectivity in contrast to 17β-estradiol. Onesuch highly potent selective ESR2 agonist is diarylpropionitrile (DPN), which exhibitsa 70-fold binding selectivity for ESR2 over ESR1 and has a 170-fold selectivity of ESR2transcriptional activation over ESR1 when tested on an ERE-controlled reporter plasmid intransfection experiments [13]. DPN does not activate GPER1 [14].
Estrogen’s effects on the immune system and on lymphocytes are well-recognized [15].However, the role on lymphomas is less well-established. In order to clarify the molecularmechanisms involved in the ESR2-mediated effects on MCL tumors, the transcriptomein Granta-519 MCL tumors in response to DPN was studied, as well as genome-wideESR2-binding chromatin sites, using chromatin immunoprecipitation sequencing (ChIP-seq). A deeper understanding of the molecular effects exerted by estrogens on MCLmay help to elucidate the mechanisms for the sex-mediated differences in incidence andprognosis. Furthermore, increased knowledge of the genes and signaling pathways affectedby estrogens may help to identify new treatment targets.
2. Materials and Methods2.1. Cell Lines
The human MCL cell lines Granta-519 (ACC432), Mino (ACC687), JeKo-1 (ACC553),and Maver-1 (ACC717) were obtained from the German Collection of Microorganisms andCell Cultures GmbH (DSMZ, Leibniz Institute, Braunschweig, Germany). Z-138 (CRL-3001)was obtained from the American Type Culture Collection (ATCC, Manassas, VA, USA).Cells were maintained as previously described [16,17]. The MCL cells were free of my-coplasma infection, and cell identity was verified by STR genotyping at NGI-Uppsala,SciLifeLab, Sweden.

Cancers 2022, 14, 3098 3 of 17
2.2. Mice and In Vivo Experiment
Immunocompromised non-obese diabetic severe combined immunodeficiency NOD/S-CID IL2γnull (NOD.Cg-Prkdcscid Il2rgtm1Wjl/SzJ) mice (referred to as NSG mice) were ob-tained from the Jackson Laboratory (Bar Harbor, ME, USA) and bred at the Animal Facilityof Karolinska University Hospital (Huddinge, Sweden). For the xenograft experiment,male mice (8–10 weeks of age) were injected subcutaneously with 15 × 106 MCL cells in100 µL of sterile PBS in the right flank. When the MCL tumor size reached 100 mm3,mice were randomly selected into groups and injected once per day subcutaneouslywith vehicle, 12.5 µmol/kg body weight of the ESR2-selective agonist DPN (Tocris Bio-science, Bristol, Great Britain, Cat. No. 1494), and/or ibrutinib (Selleck Chemicals, Hous-ton, TX, USA, PCI-32765, Cat. No. S2680, 5 mg/kg body weight), as described ear-lier [17] and in the figure legend. The tumor size was measured daily and calculated as0.5 × length (mm) × width2 (mm) using a caliper. Mice were sacrificed at the same numberof days following the start of treatment except in the case of Granta-519 MCL tumors,where mice were sacrificed when the tumor size of both the DPN- and vehicle-treated micereached 1300 mm3. For a further analysis of the Granta-519 MCL tumors, half of the tumortissue was fixed in 4% formaldehyde dissolved in PBS for 24 h then transferred to 70%ethanol and stored at 4 ◦C for TUNEL and Ki67 staining. The remaining half of the tumortissue was cut into small pieces and kept in RNAlater (Sigma Aldrich, St Louis, MO, USA,Cat. No. R0901) at −20 ◦C before RNA isolation. All animal experiments were approved bythe Swedish Research Animal Ethics Committee (approvals No. 192-14 and No. 14912-2019)and were performed according to the guidelines of the Karolinska Institutet.
2.3. Library Preparation, RNA Sequencing, and Data Analysis
RNA sequencing was performed in the Granta-519 tumor samples’ RNA. The Bioin-formatics and Expression Analysis (BEA) core facility at Karolinska Institutet preparedthe RNA libraries using a TruSeq Stranded mRNA sample prep kit. The libraries weresequenced as single-end 50 bp read lengths on an Illumina HiSeq 2500. The RNA-seqanalysis is described in the supplementary methods. The sequence data are uploaded toGEO (GSE190600).
2.4. Chromatin Immunoprecipitation (ChIP) and ChIP-Seq Analysis
The ChIP assay was performed as described previously [18] using a highly validatedhuman ESR2 antibody (R & D systems, Minneapolis, MN, USA, Cat. No. PP-PPZ0506-00, 2 µg of antibody per 100 µg of chromatin DNA) on extracts from Granta-519 cellsstably over-expressing full-length wild-type ESR2. The Bioinformatic and ExpressionAnalysis core facility at Karolinska Institutet prepared the ChIP DNA libraries using anNEB Next Ultra II DNA Library Prep kit, and quality control was performed using anAgilent TapeStation 2200. The libraries were sequenced on NextSeq 2000 P3 reagents(100 cycles). The ChIP-seq analysis is described in the supplementary methods. Thesequencing data are uploaded to GEO (GSE190599).
2.5. Statistical Tests
The statistical tests used are described in the Materials and Methods in relation to eachmethod used and complemented with information in the figure legend.
3. Results3.1. The ERβ-Selective Agonist DPN Inhibits Growth In Vivo of Both Ibrutinib-Sensitive and-Resistant MCL Grafted to Mice
Ibrutinib does not significantly affect the proliferation of ibrutinib-resistant Granta-519MCL cells [19]. However, the growth curve of Granta-519 MCL grafted to mice showedthat tumor progression was impaired in the mice treated with DPN in comparison to whenmice were treated with vehicle (Figure 1A). Likewise, DPN impaired the tumor progressionof ibrutinib-resistant Z-138 and Maver-1 MCL tumors as well as ibrutinib-sensitive Mino

Cancers 2022, 14, 3098 4 of 17
and JeKo-1 MCL tumors (Figure 1B). In ibrutinib-sensitive MCL tumors, DPN and ibrutinibexerted an additive effect. An analysis of the proliferative activity in the Granta-519 tumorsby immunostaining for Ki67 demonstrated that proliferation was decreased, whereas aTUNEL assay showed that apoptosis was enhanced (Figures 1C and 1D, respectively).
Cancers 2022, 14, x 4 of 17
were treated with vehicle (Figure 1A). Likewise, DPN impaired the tumor progression of ib-
rutinib-resistant Z-138 and Maver-1 MCL tumors as well as ibrutinib-sensitive Mino and JeKo-
1 MCL tumors (Figure 1B). In ibrutinib-sensitive MCL tumors, DPN and ibrutinib exerted an
additive effect. An analysis of the proliferative activity in the Granta-519 tumors by im-
munostaining for Ki67 demonstrated that proliferation was decreased, whereas a TUNEL
assay showed that apoptosis was enhanced (Figure 1C and Figure 1D, respectively).
Figure 1. The ESR2 selective-agonist DPN inhibits growth in vivo of both ibrutinib-sensitive and -re-
sistant MCL grafted to mice. (A) Male NSG mice were injected subcutaneously with Granta-519 cells and
treated subcutaneously daily with vehicle or the ESR2-selective agonist DPN (12.5 mmol/kg body
weight). Both groups consisted of 7 mice. Tumor size was measured daily. (B) Mino, Maver-1, Z-
138, or JeKo-1 cells were engrafted into male NSG mice and treated subcutaneously daily with ve-
hicle, ibrutinib (5 mg/kg body weight), DPN (12.5 mmol/kg body weight), or with both drugs. Tu-
mor size was measured daily. Each group consisted of 6–9 mice, depending on the grafted tumor
cell. (C) Ki67 immunostaining in sectioned Granta-519 tumors at the size of 1.3 cm3. (D) TUNEL staining
in sectioned Granta-519 tumors at the size of 1.3 cm3. The percent of stained cells from 10 randomly cho-
sen fields (at 200× magnification) were counted for each sample. Data are shown as means ± SD. Un-
paired two-tailed t-test was used for statistical analysis between the two groups, * p < 0.05, ** p <
0.01, *** p < 0.001.
3.2. Transcriptome and Signaling Pathway Analysis of the Granta-519 MCL Tumor Cells Fol-
lowing DPN Treatment
In order to further understand the mechanisms by which DPN impaired MCL tumor
growth, alterations of the transcriptome in response to DPN treatment were analyzed by
RNA sequencing (RNA-seq). In addition, the signaling pathways involved were studied in
Granta-519 MCL tumors. Since the tumor cells were of human origin and the cells constitut-
ing the tumor microenvironment (TME) were of murine origin, we could discriminate be-
tween alterations in each of the two tumor compartments.
Figure 1. The ESR2 selective-agonist DPN inhibits growth in vivo of both ibrutinib-sensitive and -resistant MCL grafted to mice. (A) Male NSG mice were injected subcutaneously with Granta-519 cellsand treated subcutaneously daily with vehicle or the ESR2-selective agonist DPN (12.5 mmol/kgbody weight). Both groups consisted of 7 mice. Tumor size was measured daily. (B) Mino, Maver-1,Z-138, or JeKo-1 cells were engrafted into male NSG mice and treated subcutaneously daily withvehicle, ibrutinib (5 mg/kg body weight), DPN (12.5 mmol/kg body weight), or with both drugs.Tumor size was measured daily. Each group consisted of 6–9 mice, depending on the grafted tumorcell. (C) Ki67 immunostaining in sectioned Granta-519 tumors at the size of 1.3 cm3. (D) TUNELstaining in sectioned Granta-519 tumors at the size of 1.3 cm3. The percent of stained cells from10 randomly chosen fields (at 200× magnification) were counted for each sample. Data are shownas means ± SD. Unpaired two-tailed t-test was used for statistical analysis between the two groups,* p < 0.05, ** p < 0.01, *** p < 0.001.
3.2. Transcriptome and Signaling Pathway Analysis of the Granta-519 MCL Tumor CellsFollowing DPN Treatment
In order to further understand the mechanisms by which DPN impaired MCL tumorgrowth, alterations of the transcriptome in response to DPN treatment were analyzed byRNA sequencing (RNA-seq). In addition, the signaling pathways involved were studied inGranta-519 MCL tumors. Since the tumor cells were of human origin and the cells consti-tuting the tumor microenvironment (TME) were of murine origin, we could discriminatebetween alterations in each of the two tumor compartments.
The RNA-seq results showed that 538 human genes were significantly affected in theGranta-519 tumors by the DPN treatment (p-value < 0.01, Supplementary Table S2). Most

Cancers 2022, 14, 3098 5 of 17
(78.6%) of these genes were downregulated (Figure 2A). Based on the RNA-seq differentialexpression analysis, we selected 10 genes and performed RT-qPCR to confirm the RNA-seqresults. The RT-qPCR results showed, in accordance with the results derived from the RNA-seq analysis, that the mRNA expression of LIM domain only 2 (LMO2) was significantlyincreased (p < 0.001), while the expression of FOS proto-oncogenes FOS and FOSB, myeloid-associated differentiation marker (MYADM), MCL marker SRY-box transcription factor11 (SOX11), vascular endothelial growth factor A (VEGFA), metastasis-associated lungadenocarcinoma transcript 1 (MALAT1), and nuclear paraspeckle assembly transcript 1(NEAT1) were decreased (p < 0.01) (Figure 2B). The C-X-C motif chemokine receptor 4(CXCR4) and Jun proto-oncogene (JUN) showed a tendency for decreased expression,although they did not reach significance in the qPCR analysis.
Cancers 2022, 14, x 5 of 17
The RNA-seq results showed that 538 human genes were significantly affected in the
Granta-519 tumors by the DPN treatment (p-value < 0.01, Supplementary Table S2). Most
(78.6%) of these genes were downregulated (Figure 2A). Based on the RNA-seq differential
expression analysis, we selected 10 genes and performed RT-qPCR to confirm the RNA-seq
results. The RT-qPCR results showed, in accordance with the results derived from the RNA-
seq analysis, that the mRNA expression of LIM domain only 2 (LMO2) was significantly
increased (p < 0.001), while the expression of FOS proto-oncogenes FOS and FOSB, myeloid-
associated differentiation marker (MYADM), MCL marker SRY-box transcription factor 11
(SOX11), vascular endothelial growth factor A (VEGFA), metastasis-associated lung adeno-
carcinoma transcript 1 (MALAT1), and nuclear paraspeckle assembly transcript 1 (NEAT1)
were decreased (p < 0.01) (Figure 2B). The C-X-C motif chemokine receptor 4 (CXCR4) and Jun
proto-oncogene (JUN) showed a tendency for decreased expression, although they did not
reach significance in the qPCR analysis.
Figure 2. Identification of transcriptome and signaling pathways affected by DPN in the tumor cells
of the Granta-519 MCL tumors. (A) The volcano plot shows DPN-regulated genes in the tumor cells,
as determined by RNA-seq. Genes were considered differentially expressed when p < 0.01. Upregu-
lated genes are marked in red, and downregulated genes are marked in blue, while non-significant
genes are marked in grey. (B) RT-qPCR analysis of 10 selected genes. Results are presented as relative
expression (mean ± SD). Unpaired two-tailed t-test was used for statistical analysis between the two
groups (n = 4 to 5, ** p < 0.01; *** p < 0.001). (C) Gene set enrichment analysis (GSEA) using all genes based
on fold change. Pathways are sorted by adjust p value. (D) Gene ontology (GO) biological processes (BP)
enrichment analysis of significantly altered genes (p < 0.01) in the tumor cells by DPN treatment. (E)
Gene concept network depicting the linkages of significantly altered genes (p < 0.01) and GO terms.
Upregulated genes are marked in orange and downregulated genes are marked in blue. The size of
a GO BP circle represents the number of genes attributed to it.
A gene set enrichment analysis (GSEA), based on ranking all genes according to their
fold difference in expression, was performed. Hypoxia, epithelial mesenchymal transition
(EMT), and TNFA signaling via NF-B were among the top-ten most enriched hallmarks, with
Figure 2. Identification of transcriptome and signaling pathways affected by DPN in the tumor cells ofthe Granta-519 MCL tumors. (A) The volcano plot shows DPN-regulated genes in the tumor cells, asdetermined by RNA-seq. Genes were considered differentially expressed when p < 0.01. Upregulatedgenes are marked in red, and downregulated genes are marked in blue, while non-significant genesare marked in grey. (B) RT-qPCR analysis of 10 selected genes. Results are presented as relativeexpression (mean ± SD). Unpaired two-tailed t-test was used for statistical analysis between the twogroups (n = 4 to 5, ** p < 0.01; *** p < 0.001). (C) Gene set enrichment analysis (GSEA) using all genesbased on fold change. Pathways are sorted by adjust p value. (D) Gene ontology (GO) biologicalprocesses (BP) enrichment analysis of significantly altered genes (p < 0.01) in the tumor cells by DPNtreatment. (E) Gene concept network depicting the linkages of significantly altered genes (p < 0.01)and GO terms. Upregulated genes are marked in orange and downregulated genes are marked inblue. The size of a GO BP circle represents the number of genes attributed to it.
A gene set enrichment analysis (GSEA), based on ranking all genes according to theirfold difference in expression, was performed. Hypoxia, epithelial mesenchymal transition(EMT), and TNFA signaling via NF-κB were among the top-ten most enriched hallmarks,with most genes allocated to these hallmarks being suppressed in the tumor cells following

Cancers 2022, 14, 3098 6 of 17
the DPN treatment (Figure 2C and Figure S1A). Among the top-ten hallmarks significantlyenriched were also oxidative phosphorylation, MYC targets V1, and E2F targets, with mostgenes allocated to these hallmarks being activated (Figure 2C and Figure S1B).
To strengthen the analysis of the affected signaling pathways, we also performed ananalysis using gene ontology (GO) biological processes (BP) including differentially ex-pressed genes with a p-value < 0.01. Enrichment was seen to BP that comprise the regulationof cell–cell adhesion, autophagy, vasculogenesis, the response to hypoxia, cell–cell junctionorganization, negative regulation of Wnt signaling, the lymphocyte apoptotic process, theregulation of I-κB kinase/NF-κB signaling, and the regulation of lymphocyte proliferation(Figure 2D). The affected genes associated with these BP and their direction of regulationare depicted in the gene concept network (Figure 2E). Most of the genes associated with the“regulation of lymphocyte proliferation” (including SOX11) were downregulated, support-ing the phenotypic observation in mice with grafted Granta-519 MCL tumors that DPNtreatment impaired tumor growth by affecting lymphoma cell proliferation (Figure 1B).The identification of enrichment of the GO BP “lymphocyte apoptotic process” is coherentwith the phenotypic observation in the Granta-519 tumors determined by the TUNEL assay(Figure 1C).
3.3. Genome-Wide Identification of ESR2 DNA-Binding Regions in the Granta-519 MCL Cells
To identify ESR2 target genes in the Granta-519 MCL cells, we performed a genome-wide characterization of ESR2 chromatin-binding regions by ChIP-seq. Although Granta-519 cells express ESR2 (Supplementary Figure S2A), the expression level was found to be toolow to allow for the generation of a clear genome-wide chromatin-binding profile by ChIP-seq when using the most specific and verified ESR2 antibody available, PPZ0506 [9,10],since only a few peaks were identified (Supplementary Figure S3). To overcome thisobstacle, we stably overexpressed full-length wild-type ESR2 (530 amino acids, 59 kDa) inthe Granta-519 cells using lentivirus-based transduction. The cells, denoted Granta-519-ESR2, expressed approximately 22-fold more ESR2 compared to wild-type Granta-519 cells,which was determined by Western blotting (Supplementary Figure S2A). The transducedESR2 was shown to be functional, as tested by the ability to effectively induce luciferaseexpression in response to DPN from a plasmid regulated by estrogen responsive elements(EREs, Supplementary Figure S2B).
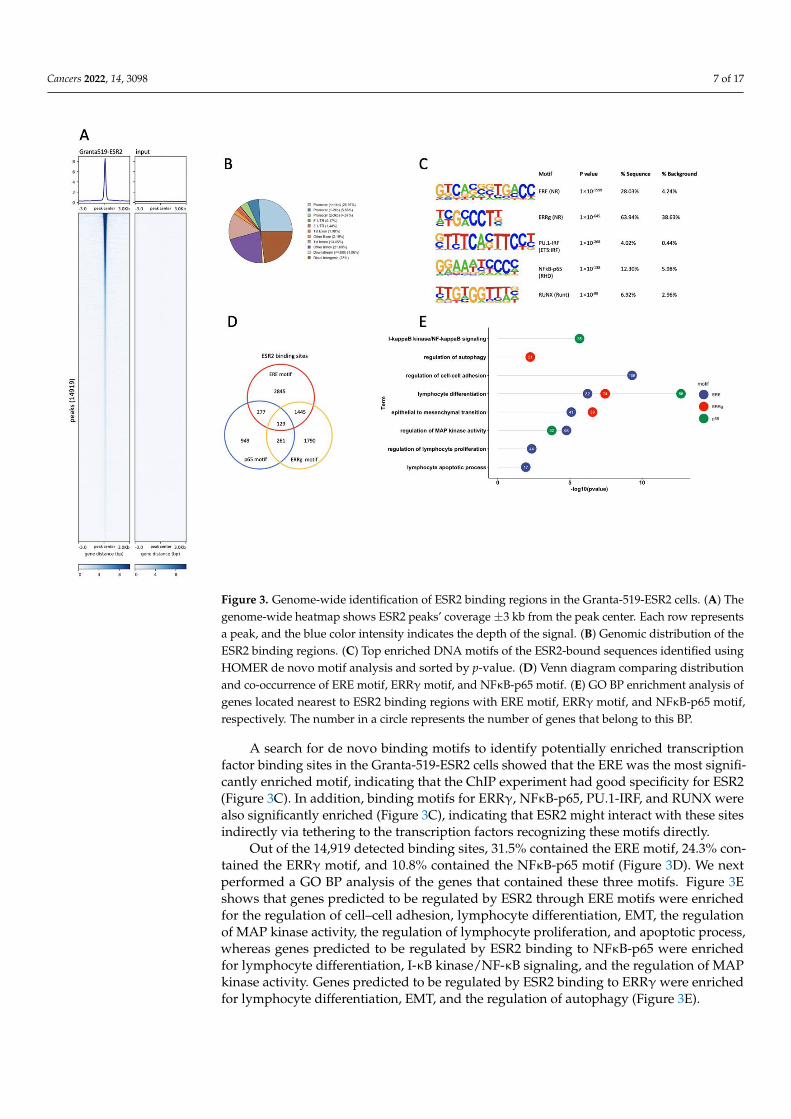
An analysis of ESR2 binding sites in the Granta-519-ESR2 cells was performed bywhole-genome ChIP-seq. A total of 14,919 binding sites were identified in the Granta-519-ESR2 cells following DPN treatment (100 nM for 2 h), which could be attributed to8689 individual genes. The genome-wide heatmap, Figure 3A, depicts the ESR2 bindingsites ±3 kb from the peak center in Granta-519-ESR2 cells and the input sample with alow background signal, demonstrating the specificity of the peaks. Figure 3B illustratesthe genomic distribution of the peaks with ESR2 binding, out of which 35.9% were locatedat promoter regions ≤3 kb from the transcription start site (TSS) and with the majority ofthese located ≤1 kb from the TSS (Figure 3B).
Cancers 2022, 14, 3098 7 of 17
Cancers 2022, 14, x 7 of 17
genes predicted to be regulated by ESR2 binding to NFB-p65 were enriched for lympho-
cyte differentiation, I-B kinase/NF-B signaling, and the regulation of MAP kinase activity.
Genes predicted to be regulated by ESR2 binding to ERR were enriched for lymphocyte
differentiation, EMT, and the regulation of autophagy (Figure 3E).
Figure 3. Genome-wide identification of ESR2 binding regions in the Granta-519-ESR2 cells. (A) The
genome-wide heatmap shows ESR2 peaks’ coverage ±3 kb from the peak center. Each row repre-
sents a peak, and the blue color intensity indicates the depth of the signal. (B) Genomic distribution
of the ESR2 binding regions. (C) Top enriched DNA motifs of the ESR2-bound sequences identified
using HOMER de novo motif analysis and sorted by p-value. (D) Venn diagram comparing distribu-
tion and co-occurrence of ERE motif, ERR motif, and NFB-p65 motif. (E) GO BP enrichment analysis
of genes located nearest to ESR2 binding regions with ERE motif, ERR motif, and NFB-p65 motif,
respectively. The number in a circle represents the number of genes that belong to this BP.
3.4. ESR2 Binding Occurs to the DPN-Regulated Genes in the Tumor Cells of the Granta-519
Tumors
In order to investigate which genes in the Granta-519 tumors were directly affected by
ESR2, the ChIP-seq data derived from the Granta-519-ESR2 cells were combined with the ex-
pression results obtained from the RNA-seq analysis of human genes in the Granta-519 tu-
mors. Of the significantly regulated human genes derived from the RNA-seq analysis, 210
genes (39%) were found to harbor ESR2 binding sites (Figure 4A and Supplementary Table
S3). Among them were VEGFA, FOS, FOSB, CXCR4, MALAT1, and NEAT1. Figure 4B shows
the differential expression of genes with the highest ESR2 binding peak scores (>30), which
included the VEGFA, NEAT1, FOS, and CXCR4 genes. Interestingly, no direct binding of ESR2
to the SOX11, JUN, and MYADM genes was detected, suggesting that these genes are regu-
lated by DPN through an indirect mechanism and not by ESR2 binding.
Figure 3. Genome-wide identification of ESR2 binding regions in the Granta-519-ESR2 cells. (A) Thegenome-wide heatmap shows ESR2 peaks’ coverage ±3 kb from the peak center. Each row representsa peak, and the blue color intensity indicates the depth of the signal. (B) Genomic distribution of theESR2 binding regions. (C) Top enriched DNA motifs of the ESR2-bound sequences identified usingHOMER de novo motif analysis and sorted by p-value. (D) Venn diagram comparing distributionand co-occurrence of ERE motif, ERRγ motif, and NFκB-p65 motif. (E) GO BP enrichment analysis ofgenes located nearest to ESR2 binding regions with ERE motif, ERRγ motif, and NFκB-p65 motif,respectively. The number in a circle represents the number of genes that belong to this BP.
A search for de novo binding motifs to identify potentially enriched transcriptionfactor binding sites in the Granta-519-ESR2 cells showed that the ERE was the most signifi-cantly enriched motif, indicating that the ChIP experiment had good specificity for ESR2(Figure 3C). In addition, binding motifs for ERRγ, NFκB-p65, PU.1-IRF, and RUNX werealso significantly enriched (Figure 3C), indicating that ESR2 might interact with these sitesindirectly via tethering to the transcription factors recognizing these motifs directly.
Out of the 14,919 detected binding sites, 31.5% contained the ERE motif, 24.3% con-tained the ERRγ motif, and 10.8% contained the NFκB-p65 motif (Figure 3D). We nextperformed a GO BP analysis of the genes that contained these three motifs. Figure 3Eshows that genes predicted to be regulated by ESR2 through ERE motifs were enrichedfor the regulation of cell–cell adhesion, lymphocyte differentiation, EMT, the regulationof MAP kinase activity, the regulation of lymphocyte proliferation, and apoptotic process,whereas genes predicted to be regulated by ESR2 binding to NFκB-p65 were enrichedfor lymphocyte differentiation, I-κB kinase/NF-κB signaling, and the regulation of MAPkinase activity. Genes predicted to be regulated by ESR2 binding to ERRγ were enrichedfor lymphocyte differentiation, EMT, and the regulation of autophagy (Figure 3E).

Cancers 2022, 14, 3098 8 of 17
3.4. ESR2 Binding Occurs to the DPN-Regulated Genes in the Tumor Cells of theGranta-519 Tumors
In order to investigate which genes in the Granta-519 tumors were directly affectedby ESR2, the ChIP-seq data derived from the Granta-519-ESR2 cells were combined withthe expression results obtained from the RNA-seq analysis of human genes in the Granta-519 tumors. Of the significantly regulated human genes derived from the RNA-seq analysis,210 genes (39%) were found to harbor ESR2 binding sites (Figure 4A and SupplementaryTable S3). Among them were VEGFA, FOS, FOSB, CXCR4, MALAT1, and NEAT1. Figure 4Bshows the differential expression of genes with the highest ESR2 binding peak scores (>30),which included the VEGFA, NEAT1, FOS, and CXCR4 genes. Interestingly, no direct bindingof ESR2 to the SOX11, JUN, and MYADM genes was detected, suggesting that these genesare regulated by DPN through an indirect mechanism and not by ESR2 binding.
Cancers 2022, 14, x 8 of 17
Figure 4. ESR2 binding occurs to the DPN-regulated genes in the Granta-519 tumor cells. (A) Venn
diagram of ESR2 cistrome and transcriptome data identified 210 differentially regulated genes that
showed direct ESR2 binding. (B) Bar graph showing the log2-fold change of genes from tumor cells
after DPN treatment with peak scores >30 in the ChIP-seq analysis. Upregulated genes are marked in
red, and downregulated genes are marked in blue. (C) The top enriched DNA motifs in the 411 ESR2-
bound sequences present in the 210 genes were identified using HOMER de novo motif analysis and
sorted by p-value. (D) ESR2 ChIP-seq enrichment signals and localization for FOS, FOSB, NEAT1, and
VEGFA binding sites visualized by UCSC genome browser. (E) Venn diagram of ESR2 cistrome with
ERE motif and NFB-p65 motif. (F) GO BP enrichment analysis based on the 210 genes that are
differentially regulated and have ESR2 binding regions with ERE motif and/or p65 motif, respec-
tively. The number in a circle represents the number of genes that belong to this BP. (G) Gene con-
cept network depicting the linkages of significant genes and GO terms. Upregulated genes are
marked in orange, and downregulated genes are marked in blue. The size of a GO BP circle repre-
sents the number of genes attributed to it.
A de novo motif analysis of the 411 ESR2 binding sites present in the 210 genes showed
that binding motifs for the transcription factors ESR (ERE), NFB-p65, FOS, NR4A2 (NURR1),
and RUNX1 were the most enriched (Figure 4C). Figure 4D depicts the position of the ESR2
binding in relation to the FOS, FOSB, NEAT1, and VEGFA genes. Among the 210 signifi-
cantly regulated genes with ESR2 binding sites, 87 genes (41.4%) had the ERE motif and 42
genes (20%) had the NFB-p65 binding motif, while 24 genes (11.4%) contained both the
ERE and NFB-p65 motifs (Figure 4E and Supplementary Table S4).
A GO BP analysis using the 210 transcriptionally regulated genes with ESR2 binding
showed that among the significantly enriched pathways were cell–cell adhesion, autophagy,
Figure 4. ESR2 binding occurs to the DPN-regulated genes in the Granta-519 tumor cells. (A) Venndiagram of ESR2 cistrome and transcriptome data identified 210 differentially regulated genes thatshowed direct ESR2 binding. (B) Bar graph showing the log2-fold change of genes from tumorcells after DPN treatment with peak scores >30 in the ChIP-seq analysis. Upregulated genes aremarked in red, and downregulated genes are marked in blue. (C) The top enriched DNA motifsin the 411 ESR2-bound sequences present in the 210 genes were identified using HOMER de novomotif analysis and sorted by p-value. (D) ESR2 ChIP-seq enrichment signals and localization for FOS,FOSB, NEAT1, and VEGFA binding sites visualized by UCSC genome browser. (E) Venn diagram ofESR2 cistrome with ERE motif and NFκB-p65 motif. (F) GO BP enrichment analysis based on the210 genes that are differentially regulated and have ESR2 binding regions with ERE motif and/orp65 motif, respectively. The number in a circle represents the number of genes that belong to this BP.(G) Gene concept network depicting the linkages of significant genes and GO terms. Upregulatedgenes are marked in orange, and downregulated genes are marked in blue. The size of a GO BP circlerepresents the number of genes attributed to it.

Cancers 2022, 14, 3098 9 of 17
A de novo motif analysis of the 411 ESR2 binding sites present in the 210 genesshowed that binding motifs for the transcription factors ESR (ERE), NFκB-p65, FOS, NR4A2(NURR1), and RUNX1 were the most enriched (Figure 4C). Figure 4D depicts the positionof the ESR2 binding in relation to the FOS, FOSB, NEAT1, and VEGFA genes. Amongthe 210 significantly regulated genes with ESR2 binding sites, 87 genes (41.4%) had theERE motif and 42 genes (20%) had the NFκB-p65 binding motif, while 24 genes (11.4%)contained both the ERE and NFκB-p65 motifs (Figure 4E and Supplementary Table S4).
A GO BP analysis using the 210 transcriptionally regulated genes with ESR2 bindingshowed that among the significantly enriched pathways were cell–cell adhesion, autophagy,the response to hypoxia, the regulation of MAP kinase activity, vasculogenesis, and theregulation of the lymphocyte apoptosis process (Figure 4F). This figure also shows that theERE motif was present in the genes contributing to the enrichment of all these pathways,while the NFκB-p65 motif was found to be restricted to the genes contributing to cell–celladhesion and autophagy. The affected genes associated to these BPs and their direction ofregulation are depicted in the gene concept network (Figure 4G).
3.5. ESR2 Binding to the Regulated Genes Is Enhanced following DPN Treatment
In order to validate if the ESR2 binding of the genes identified in the ChIP-seq increasedin response to DPN treatment, Granta-519-ESR2 cells were treated with 100 nM DPN orvehicle for 2 h, after which a selected number of genes, FOS, FOSB, VEGFA, CXCR4,MALAT1, and NEAT1, were analyzed by ChIP-qPCR. GREB1 was used as a positivecontrol since it was previously shown by ChIP to bind ESR2 when analyzed using thePPZ0506 antibody [18]. When comparing DPN- to vehicle-treated Granta-519-ESR2 cells,the enrichment of ESR2 binding to CXCR4, GREB1, VEGFA, NEAT1, and FOS was detectedfollowing the DPN treatment, demonstrating that the binding of ESR2 to these genes wasincreased upon ligand binding. ESR2 binding to MALAT1 and FOSB showed a tendencyto increase in response to DPN administration but did not reach statistical significance(Figure 5).
Cancers 2022, 14, x 9 of 17
the response to hypoxia, the regulation of MAP kinase activity, vasculogenesis, and the regu-
lation of the lymphocyte apoptosis process (Figure 4F). This figure also shows that the ERE
motif was present in the genes contributing to the enrichment of all these pathways, while the
NFB-p65 motif was found to be restricted to the genes contributing to cell–cell adhesion and
autophagy. The affected genes associated to these BPs and their direction of regulation are
depicted in the gene concept network (Figure 4G).
3.5. ESR2 Binding to the Regulated Genes Is Enhanced following DPN Treatment
In order to validate if the ESR2 binding of the genes identified in the ChIP-seq increased
in response to DPN treatment, Granta-519-ESR2 cells were treated with 100 nM DPN or vehi-
cle for 2 h, after which a selected number of genes, FOS, FOSB, VEGFA, CXCR4, MALAT1, and
NEAT1, were analyzed by ChIP-qPCR. GREB1 was used as a positive control since it was pre-
viously shown by ChIP to bind ESR2 when analyzed using the PPZ0506 antibody [18]. When
comparing DPN- to vehicle-treated Granta-519-ESR2 cells, the enrichment of ESR2 binding
to CXCR4, GREB1, VEGFA, NEAT1, and FOS was detected following the DPN treatment,
demonstrating that the binding of ESR2 to these genes was increased upon ligand binding.
ESR2 binding to MALAT1 and FOSB showed a tendency to increase in response to DPN
administration but did not reach statistical significance (Figure 5).
Figure 5. ESR2 binding to the regulated genes is enhanced following DPN treatment. ChIP-qPCR
showing ESR2 binding to CXCR4 (Chr2, position 136117143–136117371), GREB1 (Chr2, position
11541917–11542145), VEGFA (Chr6, position 43760763–43760991), NEAT1 (Chr11, position 65418735–
65418963), MALAT1 (chr11, position 65497575–65497803), FOS (Chr14, position 75275317–75275545),
and FOSB (Chr19, position 45475539–45475767) (Genome version: UCSC human reference genome
GRCh38) following a 2 h treatment of the Granta-519-ESR2 cells with 100 nM DPN or vehicle. Data
are represented as means ± SD. An unpaired two-tailed t-test was used for statistical analysis be-
tween the two groups generated from three separate experiments (* p < 0.05).
Figure 5. ESR2 binding to the regulated genes is enhanced following DPN treatment. ChIP-qPCRshowing ESR2 binding to CXCR4 (Chr2, position 136117143–136117371), GREB1 (Chr2, position11541917–11542145), VEGFA (Chr6, position 43760763–43760991), NEAT1 (Chr11, position 65418735–

Cancers 2022, 14, 3098 10 of 17
65418963), MALAT1 (chr11, position 65497575–65497803), FOS (Chr14, position 75275317–75275545),and FOSB (Chr19, position 45475539–45475767) (Genome version: UCSC human reference genomeGRCh38) following a 2 h treatment of the Granta-519-ESR2 cells with 100 nM DPN or vehicle. Data arerepresented as means ± SD. An unpaired two-tailed t-test was used for statistical analysis betweenthe two groups generated from three separate experiments (* p < 0.05).
3.6. DPN Treatment of Granta-519 Cells in Culture Does Not affect Proliferation or Apoptosis
The Granta-519 tumor grafting experiment demonstrated that tumor cell proliferationdecreased and apoptosis increased in response to DPN treatment (Figure 1C,D above). Inorder to investigate if these responses were a direct effect on the tumor cells or requiredcontributions by other cellular components, we treated carboxyfluorescein succinimidylester (CFSE)-labeled wild-type or Granta-519-ESR2 cells in culture with 100 nM DPN orvehicle for 5, 7, or 10 days. The results showed that DPN treatment had no direct effect onGranta-519 cell proliferation (Supplementary Figure S4A,B). Furthermore, the apoptosisof Granta-519 cells and Granta-519-ESR2 cells was not significantly affected by 24 h ofDPN treatment (Supplementary Figure S4C,D). This is surprising, considering that thecells express ESR2 mRNA [16] and ESR2 protein (Supplementary Figure S2A). To furtherinvestigate this, we analyzed the expression of a selected number of genes in the wild-typeGranta-519 cells in culture following DPN treatment. Interestingly, some of the genes, butnot all, found to be regulated in vivo were also significantly regulated in Granta-519 cellsin vitro. This included the ESR2-binding genes CXCR4, FOSB, and VEGFA as well as thenon-ESR2-binding genes MYADM and LMO2. In contrast, the regulation of FOS, MALAT1,and SOX11 was not significantly regulated in culture (Supplementary Figure S5). Theregulated expression of these latter genes might therefore require the interaction of theGranta-519 lymphoma cells with the TME.
3.7. Transcriptome and Signaling Pathway Analysis in the TME of the Granta-519 TumorsFollowing DPN Treatment
Considering that the response of the tumor cells in the Granta-519 tumors to DPN mayrely on the TME, transcriptional alterations in the TME (murine genes) were analyzed. Theresults showed that a total of 430 genes were significantly regulated (p < 0.01), with 57.7%being downregulated after DPN treatment (Figure 6A and Supplementary Table S5). AGSEA of the murine genes showed that among the top 11 significantly affected hallmarkswere hypoxia, EMT, TNFA signaling via NF-κB, and angiogenesis, with genes attributed tothese hallmarks mainly being suppressed by the DPN treatment (Figure 6B,C). A GO BPanalysis based on significantly regulated genes in the TME showed that the significantlyaffected biological processes were the regulation of the inflammatory response, the responseto transforming growth factor beta (TGFβ), cell chemotaxis, cell–matrix adhesion, leukocytemigration, the regulation of chemokine production, the response to hypoxia, EMT, and theregulation of angiogenesis (Figure 6D). The association of significantly regulated genesand their direction of regulation for these BP are depicted in the gene concept network(Figure 6E). Notably, the results showed that most of the genes belonging to the regulationof the inflammatory response, the response to TGFβ, cell–matrix adhesion, the response tohypoxia, EMT, and angiogenesis were downregulated (Figure 6E). These results demon-strate that in addition to the Granta-519 tumor cells, cells of the TME are largely affected bythe DPN treatment. It is notable that the Esr2 expression in the TME is low in comparisonto the ESR2 expression in the tumor cells (Figure 6F).

Cancers 2022, 14, 3098 11 of 17Cancers 2022, 14, x 11 of 17
Figure 6. Identification of transcriptome and signaling pathways affected by DPN in the TME of the
Granta-519 MCL tumors. (A) The volcano plot shows DPN-regulated genes in the TME, as deter-
mined by RNA-seq. Genes were considered differentially expressed when p < 0.01. Upregulated
genes are marked in red, and downregulated genes are marked in blue. Non-significant genes are
marked in grey. (B) GSEA analysis showing the top pathways affected when using all genes based
on log2-fold change. Pathways are sorted by adjusted p value. (C) Enrichment plot for the top path-
ways. The data are presented with enrichment scores and adjusted p-values. (D) GO BP enrichment
analysis of significantly altered genes (p < 0.01) in the TME by DPN treatment. (E) Gene concept
network depicting the linkages of significantly altered genes and GO terms. Upregulated genes are
marked in orange, and downregulated genes are marked in blue. The size of a GO BP circle repre-
sents the number of genes that belong to it. (F) The relative expression of ESR2 and reference genes
(GAPDH, ACTB, EIF1, RPL5, and RPLP0) in tumor cells and their murine homologues in the TME
of the Granta-519 tumors based on the RNA-seq results (n = 7).
3.8. Changes in Immune Cell Composition of the TME following DPN Treatment
We next analyzed the changes in the immune cell composition of the TME following
the DPN treatment. Using Seq-ImmuCC [20], we observed that the macrophage population
was the most abundant immune cell type of the Granta-519 tumor TME in the NSG mice
(Figure 7A, note: NSG mice lack lymphocytes). In order to differentiate between M1 and M2
macrophages, we also used CIBERSORTx, which provides information on macrophage sub-
types [21]. The results indicated that the number of M2 macrophages was decreased follow-
ing the DPN treatment, while the number of M1 macrophages was not affected (Figure
7B).
Figure 6. Identification of transcriptome and signaling pathways affected by DPN in the TME ofthe Granta-519 MCL tumors. (A) The volcano plot shows DPN-regulated genes in the TME, asdetermined by RNA-seq. Genes were considered differentially expressed when p < 0.01. Upregulatedgenes are marked in red, and downregulated genes are marked in blue. Non-significant genesare marked in grey. (B) GSEA analysis showing the top pathways affected when using all genesbased on log2-fold change. Pathways are sorted by adjusted p value. (C) Enrichment plot for thetop pathways. The data are presented with enrichment scores and adjusted p-values. (D) GO BPenrichment analysis of significantly altered genes (p < 0.01) in the TME by DPN treatment. (E) Geneconcept network depicting the linkages of significantly altered genes and GO terms. Upregulatedgenes are marked in orange, and downregulated genes are marked in blue. The size of a GO BP circlerepresents the number of genes that belong to it. (F) The relative expression of ESR2 and referencegenes (GAPDH, ACTB, EIF1, RPL5, and RPLP0) in tumor cells and their murine homologues in theTME of the Granta-519 tumors based on the RNA-seq results (n = 7).
3.8. Changes in Immune Cell Composition of the TME following DPN Treatment
We next analyzed the changes in the immune cell composition of the TME followingthe DPN treatment. Using Seq-ImmuCC [20], we observed that the macrophage populationwas the most abundant immune cell type of the Granta-519 tumor TME in the NSG mice(Figure 7A, note: NSG mice lack lymphocytes). In order to differentiate between M1 andM2 macrophages, we also used CIBERSORTx, which provides information on macrophagesubtypes [21]. The results indicated that the number of M2 macrophages was decreasedfollowing the DPN treatment, while the number of M1 macrophages was not affected(Figure 7B).

Cancers 2022, 14, 3098 12 of 17Cancers 2022, 14, x 12 of 17
Figure 7. The composition of immune cells in the TME of the Granta-519 MCL tumors. (A) Bar plot show-
ing the estimated composition of 10 different immune cells in the TME, as measured by Seq-ImmuCC in
individual Granta-519 tumors treated with DPN and vehicle. (B) Box and whisker plot showing the
estimated composition of M1 and M2 macrophages in Granta-519 tumors treated with DPN and vehicle,
respectively, as determined by CIBERSORTx. An unpaired two-tailed t-test was used for statistical
analysis between the two treatments (n = 6–7 per group, * p < 0.05).
4. Discussion
We show that the reduced tumor size seen by DPN treatment following the grafting of
Granta-519 MCL cells to mice is due to impaired tumor cell proliferation and increased apop-
tosis, an effect not due to different tumor sizes. By analyzing the transcriptomes in the tumor
cells and the TME as well as genome-wide ESR2 binding, we describe the molecular mecha-
nisms responsible for the impaired tumor progression seen in response to the DPN treatment.
The significantly enriched signaling pathways in the lymphoma cells of the Granta-519 MCL
tumors in response to the DPN treatment included the regulation of I-κΒ kinase/NF-B sig-
naling, EMT, cell adhesion, vasculogenesis, the lymphocyte apoptotic process, and the regu-
lation of lymphocyte proliferation. The identification of the biological processes of the “lym-
phocyte apoptotic process” and the “regulation of lymphocyte proliferation” are consistent
with the increase in apoptosis and the decrease in proliferation (including downregulation
of SOX11 expression) observed in the Granta-519 tumors following the DPN treatment. It
is notable that a high expression of Ki67 is a strong indicator of poor prognosis in MCL [22].
NF-B is a transcription factor complex that regulates the growth and survival of B-cells,
and MCL has been shown to depend on NF-B signaling for growth and proliferation [23].
NF-B has anti-apoptotic effects protecting the tumor cells from undergoing cell death [24].
Furthermore, Saba et al. demonstrated that the constitutive activation of canonical NF-B sig-
naling via BCR is a key feature found in most MCLs [25]. Therefore, many new drugs for
targeting the canonical NF-B signaling have been introduced for the treatment of MCL, with
a good response, at least initially [23]. Thus, a reduction in the canonical NF-B signaling path-
way following DPN treatment can explain the reduced tumor cell proliferation and in-
creased apoptosis seen in MCL tumors. Notably, the ibrutinib-resistant Granta-519, Z-138,
and Maver-1 cells [19] responded to the treatment with an ESR2-selective agonist, similar to
the ibrutinib-sensitive Mino and JeKo-1 MCL tumors, as demonstrated in this report. The
cause of the ibrutinib resistance in MCL cells has been shown to be due to constitutive
activation of the non-canonical NF-B signaling pathway, which is not targeted by BTK
or PKC inhibitors, in contrast to the canonical NF-B signaling, which is sensitive to BTK
or PKC inhibitors [19]. Therefore, our results suggest that ESR2 agonists may also be use-
ful for inhibiting ibrutinib-resistant MCLs that rely on non-canonical NF-B signaling.
The biological process of altered cell–cell adhesion in response to DPN treatment is
interesting, as it has been shown that adhesion receptors in lymphoid malignancies contrib-
ute to lymphoma aggressiveness by their capability to transduce signals into the cells pro-
moting tumor cell growth and survival as well as enhancing lymphoma dissemination [26].
An altered cell–cell adhesion with regulated genes associated to this biological process
mainly being suppressed is consistent with a previous study from us where we showed
Figure 7. The composition of immune cells in the TME of the Granta-519 MCL tumors. (A) Barplot showing the estimated composition of 10 different immune cells in the TME, as measured bySeq-ImmuCC in individual Granta-519 tumors treated with DPN and vehicle. (B) Box and whiskerplot showing the estimated composition of M1 and M2 macrophages in Granta-519 tumors treatedwith DPN and vehicle, respectively, as determined by CIBERSORTx. An unpaired two-tailed t-testwas used for statistical analysis between the two treatments (n = 6–7 per group, * p < 0.05).
4. Discussion
We show that the reduced tumor size seen by DPN treatment following the graftingof Granta-519 MCL cells to mice is due to impaired tumor cell proliferation and increasedapoptosis, an effect not due to different tumor sizes. By analyzing the transcriptomesin the tumor cells and the TME as well as genome-wide ESR2 binding, we describe themolecular mechanisms responsible for the impaired tumor progression seen in responseto the DPN treatment. The significantly enriched signaling pathways in the lymphomacells of the Granta-519 MCL tumors in response to the DPN treatment included the regula-tion of I-κB kinase/NF-κB signaling, EMT, cell adhesion, vasculogenesis, the lymphocyteapoptotic process, and the regulation of lymphocyte proliferation. The identification ofthe biological processes of the “lymphocyte apoptotic process” and the “regulation oflymphocyte proliferation” are consistent with the increase in apoptosis and the decrease inproliferation (including downregulation of SOX11 expression) observed in the Granta-519tumors following the DPN treatment. It is notable that a high expression of Ki67 is a strongindicator of poor prognosis in MCL [22].
NF-κB is a transcription factor complex that regulates the growth and survival ofB-cells, and MCL has been shown to depend on NF-κB signaling for growth and prolifer-ation [23]. NF-κB has anti-apoptotic effects protecting the tumor cells from undergoingcell death [24]. Furthermore, Saba et al. demonstrated that the constitutive activation ofcanonical NF-κB signaling via BCR is a key feature found in most MCLs [25]. Therefore,many new drugs for targeting the canonical NF-κB signaling have been introduced forthe treatment of MCL, with a good response, at least initially [23]. Thus, a reductionin the canonical NF-κB signaling pathway following DPN treatment can explain the re-duced tumor cell proliferation and increased apoptosis seen in MCL tumors. Notably, theibrutinib-resistant Granta-519, Z-138, and Maver-1 cells [19] responded to the treatmentwith an ESR2-selective agonist, similar to the ibrutinib-sensitive Mino and JeKo-1 MCLtumors, as demonstrated in this report. The cause of the ibrutinib resistance in MCL cellshas been shown to be due to constitutive activation of the non-canonical NF-κB signalingpathway, which is not targeted by BTK or PKC inhibitors, in contrast to the canonical NF-κBsignaling, which is sensitive to BTK or PKC inhibitors [19]. Therefore, our results suggestthat ESR2 agonists may also be useful for inhibiting ibrutinib-resistant MCLs that rely onnon-canonical NF-κB signaling.
The biological process of altered cell–cell adhesion in response to DPN treatment is in-teresting, as it has been shown that adhesion receptors in lymphoid malignancies contributeto lymphoma aggressiveness by their capability to transduce signals into the cells promot-

Cancers 2022, 14, 3098 13 of 17
ing tumor cell growth and survival as well as enhancing lymphoma dissemination [26]. Analtered cell–cell adhesion with regulated genes associated to this biological process mainlybeing suppressed is consistent with a previous study from us where we showed that DPNtreatment of mice that had been subcutaneously grafted with disseminating Burkitt’s Rajilymphoma cells resulted in less liver metastasis [16]. Furthermore, the treatment of Minoand Rec-1 MCL cells grown in the presence of stromal cells with antibodies against theadhesion receptor VLA-4 could overcome the stromal-cell-mediated ibrutinib resistance ofthe MCL cells, emphasizing a role for cell–cell adhesion in MCL survival [17]. It was alsorecently shown that the inhibition of BCR signaling disrupts adhesion in MCL, connect-ing downstream BCR signaling, including NF-κB signaling, to the regulation of cell–celladhesion [27]. In addition, the GO BP analysis identified vasculogenesis as being signif-icantly altered, which may be explained by a decreased expression of VEGFA. EMT wasalso affected by DPN, with genes associated with this pathway mainly being suppressed.Growing evidence suggests that EMT promotes leukemia and lymphoma progression aswell as therapy resistance [28,29]. Moreover, the EMT process is also closely connected tothe TME [30–33].
In addition to the enriched signaling pathways altered by the DPN treatment, in-dividual genes that were significantly altered and were described to be highly relevantin MCL pathogenesis were identified. This included decreased SOX11 expression. Thetranscription factor SOX11 has been shown to be a key oncogenic factor in MCL by pro-moting tumor growth in vivo by regulating B-cell differentiation pathways and controllingthe cell cycle and apoptosis [34,35]. Furthermore, SOX11 overexpression associates withincreased signaling via the BCR and can be reversed by BTK inhibition. The impairedtumor progression seen in the Granta-519 MCL tumors following DPN treatment maytherefore involve a DPN-mediated suppression of SOX11 expression. SOX11 also regulatesCXCR4 expression, with CXCR4 being important for the tumor–TME interaction [34]. MCLis known to express high levels of the CXCR4 chemokine receptor, which contributes,similar to VLA-4, to adhesive interactions between MCL cells and stromal cells of the TME,conferring cell survival and drug resistance [36]. Notably, CXCR4 expression in tumor cellsand vasculogenesis in the TME were decreased following DPN treatment, further featuringan MCL tumor cell–TME connection.
The expression of some additional genes described to be relevant for MCL pathogen-esis was also found to be regulated by the DPN treatment. This included MALAT1 andNEAT1. Both MALAT1 and NEAT1 belong to the group of long non-coding RNA (lncRNA).Wang et al. showed that MALAT1 expression is elevated in human MCL tumors and celllines compared to normal controls, and the elevated levels of MALAT1 correlated with ahigher MCL international prognostic index and reduced overall survival [37]. Furthermore,MCL with a knockdown of MALAT1 expression showed impaired cell proliferation andfacilitated apoptosis [37]. NEAT1 may exert a similar effect because a knockdown of NEAT1inhibits cell proliferation and promotes apoptosis in DLBCL [38]. In colon cancer, NEAT1activates Wnt/β-catenin signaling, promoting cancer progression [39]. The expression ofboth MALAT1 and NEAT1 were downregulated by DPN in the Granta-519 MCL tumors,according to the RNA-seq analysis.
In order to identify direct ESR2 binding targets, a genome-wide ChIP-seq was per-formed. The most significant ESR2 binding motif found in the genes transcriptionallyregulated by DPN was ERE. Other transfection factor binding motifs found in the ESR2binding sites were NF-κB, FOS, NR4A2, and RUNX1. This is in line with the finding thatmost of the above transcription factors binding to the non-ERE-containing motifs have beenshown to crosstalk with ESR1 and ESR2. For example, a crosstalk between ESR with NF-κBproteins is well-established and has been suggested to explain the immunosuppressiveand anti-inflammatory effects of estrogens [40,41]. Similarly, crosstalk between ESR1 andESR2 and the AP-1 (FOS/JUN) complex is recognized [18,42,43] as well as with the RUNXtranscription factors [44]. A crosstalk between ESR and NR4A2 is less well-established.

Cancers 2022, 14, 3098 14 of 17
One biological process identified as significantly enriched when performing the GOBP based on the significantly regulated genes with ESR2 binding sites was the “regulationof MAPK activity”. MAPK activation is an important downstream signaling pathway of theBCR, and the inhibition of BCR will thus reduce MAPK signaling, including the activity ofthe downstream MAPK3/1 (also called ERK1/2). ERK1/2 are involved in the transcriptionof regulatory genes such as FOS and JUN that are important for cell survival in MCL [45].This is in line with the FOS and JUN genes being downregulated by DPN in the Granta-519tumors, as determined by the RNA-seq.
Interestingly, the pro-apoptotic and anti-proliferative effects seen in Granta-519 cellsin vivo were not seen in Granta-519 cells in culture, indicating that the interactions betweenlymphoma cells and other cellular compartments, such as the TME, are important forthese responses. Two of the most significant pathways in the TME that were affected bythe DPN treatment were the “regulation of inflammatory response” and the “responseto TGFβ”. Most of the genes associated to the “regulation of inflammatory response”were downregulated by the DPN treatment, suggesting a reduced activity of this BP. TheBP “response to TGFβ” was also mainly associated with a reduced expression of genes,implicating impaired TGFβ signaling. This was substantiated by a reduced expression ofSmad3, a central intracellular signaling molecule downstream of the TGFβ receptor [46].Importantly, TGFβ signaling is an important player in the regulation of the TME and couldbe ascribed to several of the regulated signaling pathways found to be affected in theTME of the Granta-519 tumors. Dysregulated TGFβ signaling has also been describedin MCL [47]. TGFβ and TGFβ receptor signaling promote tumor growth and metastasisas tumors progress by stimulating EMT, inducing myofibroblast differentiation, alteringthe differentiation and proliferation of immune cells, modulating the matrix composition,and reprograming cell metabolism [46,48]. The reduced TGFβ signaling in the TMEmay therefore also contribute to the suppression of EMT, angiogenesis, myogenesis, andsome of the other enriched hallmarks in the TME identified by the GSEA. It is notablethat the reduced tumor progression brought about by DPN treatment does not involvehost lymphocytes, as the immunocompromised NSG mice used for the experiments lackB, T and NK cells. However, following the DPN treatment, we observed a reductionin M2 macrophages in the TME, while the M1 macrophages were not affected. SinceM2 macrophages promote tumor cell proliferation and invasion [49], this reduction intumor-associated M2 macrophages may contribute to the reduction in Granta-519 tumorprogression following DPN treatment. Furthermore, tumor-associated macrophages canexpress a variety of cytokines, including TGFβ1, that stimulate tumor cell proliferation andsurvival. Thus, a reduced abundance of tumor-associated M2 macrophages following DPNtreatment relates to the “negative regulation of inflammatory response” and the “responseto TGFβ” in the TME of the Granta-159 tumors, as determined by the GO BP analysis.These above results imply that the TME is an important contributor in eliciting the effectof estrogens via ESR2 on MCL. This is likely an indirect effect since Esr2 expression in theTME is very low.
5. Conclusions
Our results clearly demonstrate that MCL is under estrogen control mediated byESR2, as shown in the grafting experiments of both ibrutinib-resistant and -sensitiveMCL cells. The ESR2-mediated responses, as studied in Granta-519 MCL tumors, involvethe alteration of several signaling pathways in the tumor cells as well in the TME thathelp to clarify the mechanism for the impaired tumor progression seen by estrogens.Furthermore, the results may also help to explain the lower incidence of MCL in femalescompared to males, supporting a protective role. In addition, targeting ESR2 with a selectiveagonist not interacting with ESR1 (ESR1 being responsible for many of the unwanted sideeffects, e.g., the growth stimulatory effects on the breast and uterus) may be an additionalapproach when considering the treatment of MCL, especially ibrutinib-resistant MCL. The

Cancers 2022, 14, 3098 15 of 17
results may also lead to a more personalized treatment that takes sex and endocrine statusinto consideration.
Supplementary Materials: The following supporting information can be downloaded at https://www.mdpi.com/article/10.3390/cancers14133098/s1, Figure S1: Enrichment plots for the topdownregulated (S1A) and upregulated (S1B) pathways in the Granta-519 MCL tumor cells followingDPN treatment; Figure S2: (A) Western blot analysis showing ESR2 expression in wild-type Granta-519, Granta-519-ESR2, and Granta-519-mock cells, (B) The transduced ESR2 in Granta-519-ESR2 cellsis functional; Figure S3: Genome-wide identification of ESR2 binding regions in Granta-519-mockcells not overexpressing ESR2; Figure S4: The effect of DPN treatment on proliferation and apoptosisof the Granta-519-mock and Granta-519-ESR2 cells in culture; Figure S5: DPN regulates expression ofa number of genes in Granta-519 cells in culture; Table S1: Primers used for RT-qPCR and ChIP-qPCR(docx); Table S2: List of human genes significantly affected in the Granta-519 MCL tumors by theDPN treatment (xls); Table S3: List of significantly regulated human genes derived from the RNA-seqwhich harbor ESR2 binding sites (xls); Table S4: ERE and p65 motifs present in the 210 significantlyregulated genes that demonstrate ESR2 binding (xls); Table S5: Genes significantly affected in thetumor microenvironment of the Granta-519 MCL tumors by the DPN treatment (xlsx); Supplementarymethods: Supplementary methods that were not described in the research article (docx).
Author Contributions: Conceptualization, D.H. and S.O.; data curation, A.D.; formal analysis, D.H.,Z.H. and A.D.; funding acquisition, S.O. and C.W.; investigation, D.H., Z.H., R.I., C.B.R., J.G. and K.Y.;methodology, D.H., Z.H., R.I., C.B.R., J.G. and K.Y.; project administration, D.H. and S.O.; resources,A.D., R.I. and C.W.; supervision, S.O.; validation, D.H., C.B.R. and M.B.; visualization, D.H., Z.H. andR.I.; writing—original draft preparation, D.H.; writing—review and editing, S.O., M.B., K.Y. and C.W.All authors have read and agreed to the published version of the manuscript.
Funding: This work was supported by grants to S.O. from the Swedish Cancer Society (20 1024 PjF,2017/404) and the Swedish Childhood Cancer Fund (PR2019-0019 and PR2016-0038) and grants toC.W. from the Swedish Cancer Society (21 1632 Pj 01 H) and Swedish Research Council (2017-01658).D.H. was funded by a scholarship from the Chinese Scholarship Council.
Institutional Review Board Statement: All animal experiments were approved by the SwedishResearch Animal Ethics Committee (approvals No. 192-14 and No. 14912-2019) and were performedaccording to the guidelines of the Karolinska Institutet. No clinical human data or human tissue wereused in this study.
Informed Consent Statement: Not applicable.
Data Availability Statement: The transcriptome and ChIP-seq datasets generated in the currentproject are available in the NCBI Gene Expression Omnibus (GEO) repository (https://www.ncbi.nlm.nih.gov/geo/) with accession No. GSE190600 and GSE190599 (accessible on 30 June 2022),respectively. Additional information is also available as supplementary tables, figures, and methods.
Acknowledgments: The authors thank the Bioinformatic and Expression Analysis Core Facility atthe Karolinska Institutet for performing libraries for RNA-seq and ChIP-seq. The authors also thankDandan Song who provided 3X ERE luciferase and pRL-TK Renilla luciferase plasmids and the Centrefor Bioinformatics and Biostatistics (Carsten Daub) at Karolinska Institutet for bioinformatics advice.
Conflicts of Interest: The authors declare no conflict of interest.
References1. Sapkota, S.; Shaikh, H. Non-Hodgkin Lymphoma. In StatPearls [Internet]; StatPearls Publishing: Treasure Island, FL, USA, 2022.2. Sant, M.; Allemani, C.; Tereanu, C.; De Angelis, R.; Capocaccia, R.; Visser, O.; Marcos-Gragera, R.; Maynadié, M.; Simonetti, A.;
Lutz, J.M.; et al. Incidence of hematologic malignancies in Europe by morphologic subtype: Results of the HAEMACARE project.Blood 2010, 116, 3724–3734. [CrossRef] [PubMed]
3. Jares, P.; Campo, E. Advances in the understanding of mantle cell lymphoma. Br. J. Haematol. 2008, 142, 149–165. [CrossRef][PubMed]
4. Abrahamsson, A.; Albertsson-Lindblad, A.; Brown, P.N.; Baumgartner-Wennerholm, S.; Pedersen, L.M.; D’Amore, F.; Nilsson-Ehle, H.; Jensen, P.; Pedersen, M.; Geisler, C.H.; et al. Real world data on primary treatment for mantle cell lymphoma: A NordicLymphoma Group observational study. Blood 2014, 124, 1288–1295. [CrossRef] [PubMed]

Cancers 2022, 14, 3098 16 of 17
5. Yakimchuk, K.; Revanna, C.B.; Huang, D.; Inzunza, J.; Okret, S. Suppression of lymphoma growth by the xenoestrogens bisphenolA and genistein. Endocr. Connect. 2018, 7, 1472–1479. [CrossRef]
6. Vanura, K. Sex as decisive variable in lymphoid neoplasms—an update. ESMO Open 2021, 6, 100001. [CrossRef]7. Heldring, N.; Isaacs, G.D.; Diehl, A.G.; Sun, M.; Cheung, E.; Ranish, J.A.; Kraus, W.L. Multiple Sequence-Specific DNA-Binding
Proteins Mediate Estrogen Receptor Signaling through a Tethering Pathway. Mol. Endocrinol. 2011, 25, 564–574. [CrossRef]8. Fuentes, N.; Silveyra, P. Estrogen receptor signaling mechanisms. Adv. Protein Chem. Struct. Biol. 2019, 116, 135–170. [CrossRef]9. Shim, G.J.; Gherman, D.; Kim, H.J.; Omoto, Y.; Iwase, H.; Bouton, D.; Kis, L.L.; Andersson, C.T.; Warner, M.; Gustafsson, J.
Differential expression of oestrogen receptors in human secondary lymphoid tissues. J. Pathol. 2005, 208, 408–414. [CrossRef]10. Andersson, S.; Sundberg, M.; Pristovsek, N.; Ibrahim, A.; Jonsson, P.; Katona, B.; Clausson, C.; Zieba, A.; Ramström, M.; Söderberg,
O.; et al. Insufficient antibody validation challenges oestrogen receptor beta research. Nat. Commun. 2017, 8, 15840. [CrossRef]11. Notas, G.; Kampa, M.; Castanas, E. G Protein-Coupled Estrogen Receptor in Immune Cells and Its Role in Immune-Related
Diseases. Front. Endocrinol. 2020, 11, 579420. [CrossRef]12. Rudelius, M.; Rauert-Wunderlich, H.; Hartmann, E.; Hoster, E.; Dreyling, M.; Klapper, W.; Ott, G.; Rosenwald, A. The G protein-
coupled estrogen receptor 1 (GPER-1) contributes to the proliferation and survival of mantle cell lymphoma cells. Haematologica2015, 100, e458–e461. [CrossRef] [PubMed]
13. Said, S.A.; Isedowo, R.; Guerin, C.; Nar, N.N.; Lillie, L.; Bukovac, S.; Simone, J.J.; Green, M.R.; McCormick, C.M.; Stuart, J.A.Effects of long-term dietary administration of estrogen receptor-beta agonist diarylpropionitrile on ovariectomized female ICR(CD-1) mice. GeroScience 2018, 40, 393–403. [CrossRef] [PubMed]
14. Petrie, W.K.; Dennis, M.K.; Hu, C.; Dai, D.; Arterburn, J.B.; Smith, H.O.; Hathaway, H.J.; Prossnitz, E.R. G Protein-CoupledEstrogen Receptor-Selective Ligands Modulate Endometrial Tumor Growth. Obstet. Gynecol. Int. 2013, 2013, 472720. [CrossRef][PubMed]
15. Yakimchuk, K.; Jondal, M.; Okret, S. Estrogen receptor alpha and beta in the normal immune system and in lymphoid malignancies.Mol. Cell. Endocrinol. 2013, 375, 121–129. [CrossRef] [PubMed]
16. Yakimchuk, K.; Hasni, M.S.; Guan, J.; Chao, M.P.; Sander, B.; Okret, S. Inhibition of lymphoma vascularization and disseminationby estrogen receptor beta agonists. Blood 2014, 123, 2054–2061. [CrossRef] [PubMed]
17. Guan, J.; Huang, D.; Yakimchuk, K.; Okret, S. p110α Inhibition Overcomes Stromal Cell–Mediated Ibrutinib Resistance in MantleCell Lymphoma. Mol. Cancer Ther. 2018, 17, 1090–1100. [CrossRef]
18. Indukuri, R.; Jafferali, M.H.; Song, D.; Damdimopoulos, A.; Hases, L.; Zhao, C.; Archer, A.; Williams, C. Genome-wide estrogenreceptor beta chromatin binding in human colon cancer cells reveals its tumor suppressor activity. Int. J. Cancer 2021, 149, 692–706.[CrossRef]
19. Rahal, R.; Frick, M.; Romero, R.; Korn, J.M.; Kridel, R.; Chan, F.C.; Meissner, B.; Bhang, H.; Ruddy, D.; Kauffmann, A.; et al.Pharmacological and genomic profiling identifies NF-kappaB-targeted treatment strategies for mantle cell lymphoma. Nat. Med.2014, 20, 87–92. [CrossRef]
20. Chen, Z.; Quan, L.; Huang, A.; Zhao, Q.; Yuan, Y.; Yuan, X.; Shen, Q.; Shang, J.; Ben, Y.; Qin, F.X.; et al. seq-ImmuCC: Cell-CentricView of Tissue Transcriptome Measuring Cellular Compositions of Immune Microenvironment From Mouse RNA-Seq Data.Front. Immunol. 2018, 9, 1286. [CrossRef]
21. Newman, A.M.; Liu, C.L.; Green, M.R.; Gentles, A.J.; Feng, W.; Xu, Y.; Hoang, C.D.; Diehn, M.; Alizadeh, A.A. Robust enumerationof cell subsets from tissue expression profiles. Nat. Methods 2015, 12, 453–457. [CrossRef]
22. Hoster, E.; Rosenwald, A.; Berger, F.; Bernd, H.W.; Hartmann, S.; Loddenkemper, C.; Barth, T.F.; Brousse, N.; Pileri, S.; Rymkiewicz,G.; et al. Prognostic Value of Ki-67 Index, Cytology, and Growth Pattern in Mantle-Cell Lymphoma: Results from RandomizedTrials of the European Mantle Cell Lymphoma Network. J. Clin. Oncol. 2016, 34, 1386–1394. [CrossRef]
23. Balaji, S.; Ahmed, M.; Lorence, E.; Yan, F.; Nomie, K.; Wang, M. NF-kappaB signaling and its relevance to the treatment of mantlecell lymphoma. J. Hematol. Oncol. 2018, 11, 83. [CrossRef] [PubMed]
24. Wang, C.Y.; Cusack, J.C., Jr.; Liu, R.; Baldwin, A.S., Jr. Control of inducible chemoresistance: Enhanced anti-tumor therapythrough increased apoptosis by inhibition of NF-kappaB. Nat. Med. 1999, 5, 412–417. [CrossRef]
25. Saba, N.S.; Liu, D.; Herman, S.E.; Underbayev, C.; Tian, X.; Behrend, D.; Weniger, M.A.; Skarzynski, M.; Gyamfi, J.; Fontan, L.; et al.Pathogenic role of B-cell receptor signaling and canonical NF-kappaB activation in mantle cell lymphoma. Blood 2016, 128, 82–92.[CrossRef] [PubMed]
26. Drillenburg, P.; Pals, S.T. Cell adhesion receptors in lymphoma dissemination. Blood 2000, 95, 1900–1910. [CrossRef] [PubMed]27. Wu, W.; Wang, W.; Franzen, C.A.; Guo, H.; Lee, J.; Li, Y.; Sukhanova, M.; Sheng, D.; Venkataraman, G.; Ming, M.; et al. Inhibition
of B-cell receptor signaling disrupts cell adhesion in mantle cell lymphoma via RAC2. Blood Adv. 2021, 5, 185–197. [CrossRef]28. Chen, S.C.; Liao, T.T.; Yang, M.H. Emerging roles of epithelial-mesenchymal transition in hematological malignancies. J. Biomed.
Sci. 2018, 25, 37. [CrossRef]29. Kahlert, U.; Joseph, J.V.; Kruyt, F.A.E. EMT- and MET-related processes in nonepithelial tumors: Importance for disease
progression, prognosis, and therapeutic opportunities. Mol. Oncol. 2017, 11, 860–877. [CrossRef]30. Taki, M.; Abiko, K.; Ukita, M.; Murakami, R.; Yamanoi, K.; Yamaguchi, K.; Hamanishi, J.; Baba, T.; Matsumura, N.; Mandai, M.
Tumor Immune Microenvironment during Epithelial–Mesenchymal Transition. Clin. Cancer Res. 2021, 27, 4669–4679. [CrossRef]31. Hass, R.; Von Der Ohe, J.; Ungefroren, H. The Intimate Relationship among EMT, MET and TME: A T(ransdifferentiation)
E(nhancing) M(ix) to Be Exploited for Therapeutic Purposes. Cancers 2020, 12, 3674. [CrossRef]

Cancers 2022, 14, 3098 17 of 17
32. Aggarwal, V.; Montoya, C.A.; Donnenberg, V.S.; Sant, S. Interplay between tumor microenvironment and partial EMT as thedriver of tumor progression. iScience 2021, 24, 102113. [CrossRef] [PubMed]
33. Jung, H.Y.; Fattet, L.; Yang, J. Molecular Pathways: Linking Tumor Microenvironment to Epithelial–Mesenchymal Transition inMetastasis. Clin. Cancer Res. 2015, 21, 962–968. [CrossRef] [PubMed]
34. Beekman, R.; Amador, V.; Campo, E. SOX11, a key oncogenic factor in mantle cell lymphoma. Curr. Opin. Hematol. 2018, 25, 299–306.[CrossRef] [PubMed]
35. Kuo, P.Y.; Jatiani, S.S.; Rahman, A.H.; Edwards, D.; Jiang, Z.; Ahr, K.; Perumal, D.; Leshchenko, V.V.; Brody, J.; Shaknovich, R.;et al. SOX11 augments BCR signaling to drive MCL-like tumor development. Blood 2018, 131, 2247–2255. [CrossRef] [PubMed]
36. Kurtova, A.V.; Tamayo, A.T.; Ford, R.J.; Burger, J.A. Mantle cell lymphoma cells express high levels of CXCR4, CXCR5, and VLA-4(CD49d): Importance for interactions with the stromal microenvironment and specific targeting. Blood 2009, 113, 4604–4613.[CrossRef]
37. Wang, X.; Sehgal, L.; Jain, N.; Khashab, T.; Mathur, R.; Samaniego, F. LncRNA MALAT1 promotes development of mantle celllymphoma by associating with EZH2. J. Transl. Med. 2016, 14, 346. [CrossRef]
38. Qian, C.S.; Li, L.J.; Huang, H.W.; Yang, H.F.; Wu, D.P. MYC-regulated lncRNA NEAT1 promotes B cell proliferation andlymphomagenesis via the miR-34b-5p-GLI1 pathway in diffuse large B-cell lymphoma. Cancer Cell Int. 2020, 20, 87. [CrossRef]
39. Zhang, M.; Weng, W.; Zhang, Q.; Wu, Y.; Ni, S.; Tan, C.; Xu, M.; Sun, H.; Liu, C.; Wei, P.; et al. The lncRNA NEAT1 activatesWnt/beta-catenin signaling and promotes colorectal cancer progression via interacting with DDX5. J. Hematol. Oncol. 2018, 11, 113.[CrossRef]
40. Kalaitzidis, D.; Gilmore, T.D. Transcription factor cross-talk: The estrogen receptor and NF-kappaB. Trends Endocrinol. Metab.2005, 16, 46–52. [CrossRef]
41. Sas, L.; Lardon, F.; Vermeulen, P.B.; Hauspy, J.; Van Dam, P.; Pauwels, P.; Dirix, L.Y.; van Laere, S.J. The interaction between ERand NFkappaB in resistance to endocrine therapy. Breast Cancer Res. 2012, 14, 212. [CrossRef]
42. Dahlman-Wright, K.; Qiao, Y.; Jonsson, P.; Gustafsson, J.; Williams, C.; Zhao, C. Interplay between AP-1 and estrogen receptor αin regulating gene expression and proliferation networks in breast cancer cells. Carcinogenesis 2012, 33, 1684–1691. [CrossRef][PubMed]
43. Zhao, C.; Gao, H.; Liu, Y.; Papoutsi, Z.; Jaffrey, S.; Gustafsson, J.A.; Dahlman-Wright, K. Genome-wide mapping of estrogenreceptor-beta-binding regions reveals extensive cross-talk with transcription factor activator protein-1. Cancer Res. 2010, 70,5174–5183. [CrossRef] [PubMed]
44. Rojas, A.; Otálora-Otálora, B.A.; Henríquez, B.; López-Kleine, L. RUNX family: Oncogenes or tumor suppressors (Review). Oncol.Rep. 2019, 42, 3–19. [CrossRef]
45. Merolle, M.; Ahmed, M.; Nomie, K.; Wang, M.L. The B cell receptor signaling pathway in mantle cell lymphoma. Oncotarget 2018,9, 25332–25341. [CrossRef]
46. Stuelten, C.H.; Zhang, Y.E. Transforming Growth Factor-beta: An Agent of Change in the Tumor Microenvironment. Front. CellDev. Biol. 2021, 9, 764727. [CrossRef]
47. Gil Rizzatti, E.; Falcao, R.P.; Panepucci, R.A.; Proto-Siqueira, R.; Anselmo-Lima, W.T.; Okamoto, O.K.; Zago, M.A. Gene expressionprofiling of mantle cell lymphoma cells reveals aberrant expression of genes from the PI3K-AKT, WNT and TGFbeta signallingpathways. Br. J. Haematol. 2005, 130, 516–526. [CrossRef]
48. Derynck, R.; Turley, S.J.; Akhurst, R.J. TGFbeta biology in cancer progression and immunotherapy. Nat. Rev. Clin. Oncol. 2021,18, 9–34. [CrossRef]
49. Pan, Y.; Yu, Y.; Wang, X.; Zhang, T. Tumor-Associated Macrophages in Tumor Immunity. Front. Immunol. 2020, 11, 583084.[CrossRef]