Stromal contribution to the colorectal cancer transcriptome
11
© 2015 Nature America, Inc. All rights reserved. NATURE GENETICS ADVANCE ONLINE PUBLICATION ANALYSIS Recent studies identified a poor-prognosis stem/serrated/ mesenchymal (SSM) transcriptional subtype of colorectal cancer (CRC). We noted that genes upregulated in this subtype are also prominently expressed by stromal cells, suggesting that SSM transcripts could derive from stromal rather than epithelial cancer cells. To test this hypothesis, we analyzed CRC expression data from patient-derived xenografts, where mouse stroma supports human cancer cells. Species-specific expression analysis showed that the mRNA levels of SSM genes were mostly due to stromal expression. Transcriptional signatures built to specifically report the abundance of cancer-associated fibroblasts (CAFs), leukocytes or endothelial cells all had significantly higher expression in human CRC samples of the SSM subtype. High expression of the CAF signature was associated with poor prognosis in untreated CRC, and joint high expression of the stromal signatures predicted resistance to radiotherapy in rectal cancer. These data show that the distinctive transcriptional and clinical features of the SSM subtype can be ascribed to its particularly abundant stromal component. CRC is a heterogeneous disease, with variable molecular pathogenesis, natural history and response to treatments 1,2 . The definition of patient subgroups with distinct molecular and clinical features is needed for effective disease management. Recently, three research groups con- currently published independent works proposing new CRC classi- fication systems based on gene expression, named the Colon Cancer Subtype (CCS) system, the Colorectal Cancer Assigner (CRCA) and the Colon Cancer Molecular Subtype (CCMS) system 3–6 . In all three cases, the authors identified one subtype that was associated with a low degree of differentiation, epithelial-to-mesenchymal transi- tion (EMT) and poor prognosis: in the CRCA system, subtype 5 was dubbed ‘stem-like’; in the CCS classifier, subtype 3 was associated with a serrated adenoma 7 origin; and, in the CCMS system, subtype 4 was associated with EMT. These data have univocally been interpreted as signs of a phenotypic switch whereby cancer cells of epithelial origin acquire mesenchymal traits that typically associate with stem cell–like features. However, the carcinoma transcriptome is composed of signals originating not only from cancer cells but also from the tumor microenvironment, composed of stromal cells that intrinsi- cally display mesenchymal characteristics. Indeed, earlier works have described stromal ‘signatures’ in different tumor types, with possible clinical relevance 8,9 . It is thus conceivable that gene expression traits for noncancerous components might influence the assignment of specific CRC transcriptional subtypes. More importantly, it has not been assessed whether and to what extent stromal signals contribute to assigning each tumor to a specific transcriptional group. To tackle this issue, we designed an analytical procedure aimed at (i) assessing how tumor purity affects CRC transcriptional sub- typing; (ii) discriminating stromal from cancer cell gene expression; and (iii) assigning the previously defined CRC subtype signature genes to a stromal or epithelial origin. The analysis employed data sets from primary CRCs, sorted CRC subpopulations, rectal cancer samples before and after treatment, and patient-derived xenografts (PDXs) 10 . Of note, in PDXs, human stromal cells are substituted by mouse cells 11,12 , such that gene expression by cancer and stromal cells can be distinguished by species of origin for the transcripts. RESULTS Molecular subtyping of CRC identifies three consensus subgroups To explore how different classifiers divided CRCs into subtypes, we assembled a 450-sample, RNA sequencing (RNA-seq)-based mRNA expression data set from The Cancer Genome Atlas (TCGA) 13 . Each sample was then assigned to intrinsic subtypes according to the CRCA (subtypes 1 to 5), CCS (subtypes 1 to 3) and CCMS (subtypes 1 to 6) classifiers 3–5 using Nearest-Template Prediction (NTP), a ‘nearest- neighbor’ class prediction algorithm that also estimates the significance of class assignment 14 . Significant subtype assignment was obtained for more than 85% of the samples with each classifier (Supplementary Table 1). Interestingly, for 369 samples, all 3 classifiers were significant; Stromal contribution to the colorectal cancer transcriptome Claudio Isella 1,2 , Andrea Terrasi 2 , Sara Erika Bellomo 1,2 , Consalvo Petti 1 , Giovanni Galatola 1 , Andrea Muratore 1 , Alfredo Mellano 1 , Rebecca Senetta 3 , Adele Cassenti 3 , Cristina Sonetto 4 , Giorgio Inghirami 5 , Livio Trusolino 1,2 , Zsolt Fekete 6 , Mark De Ridder 7 , Paola Cassoni 3 , Guy Storme 7 , Andrea Bertotti 1,2 & Enzo Medico 1,2 1 Candiolo Cancer Institute, Fondazione Piemontese per l’Oncologia–Istituto di Ricovero e Cura a Carattere Scientifico (FRO-IRCCS), Candiolo, Italy. 2 Department of Oncology, University of Torino, Candiolo, Italy. 3 Department of Medical Science, University of Torino, Torino, Italy. 4 Department of Oncology, University of Torino, Orbassano, Italy. 5 Department of Molecular Biotechnology and Health Science, Center for Experimental Research and Medical Studies, University of Torino, Torino, Italy. 6 Institute of Oncology Prof. Dr. Ion Chiricuta, Cluj, Romania. 7 Department of Radiotherapy, Universitair Ziekenhuis Brussel, Vrije Universiteit Brussel, Brussels, Belgium. Correspondence should be addressed to E.M. ([email protected]) or C.I. ([email protected]). Received 31 August 2014; accepted 28 January 2015; published online 23 February 2015; doi:10.1038/ng.3224
Transcript of Stromal contribution to the colorectal cancer transcriptome

©20
15N
atu
re A
mer
ica,
Inc.
All
rig
hts
res
erve
d.
Nature GeNetics ADVANCE ONLINE PUBLICATION �
a n a ly s i s
Recent studies identified a poor-prognosis stem/serrated/mesenchymal (SSM) transcriptional subtype of colorectal cancer (CRC). We noted that genes upregulated in this subtype are also prominently expressed by stromal cells, suggesting that SSM transcripts could derive from stromal rather than epithelial cancer cells. To test this hypothesis, we analyzed CRC expression data from patient-derived xenografts, where mouse stroma supports human cancer cells. Species-specific expression analysis showed that the mRNA levels of SSM genes were mostly due to stromal expression. Transcriptional signatures built to specifically report the abundance of cancer-associated fibroblasts (CAFs), leukocytes or endothelial cells all had significantly higher expression in human CRC samples of the SSM subtype. High expression of the CAF signature was associated with poor prognosis in untreated CRC, and joint high expression of the stromal signatures predicted resistance to radiotherapy in rectal cancer. These data show that the distinctive transcriptional and clinical features of the SSM subtype can be ascribed to its particularly abundant stromal component.
CRC is a heterogeneous disease, with variable molecular pathogenesis, natural history and response to treatments1,2. The definition of patient subgroups with distinct molecular and clinical features is needed for effective disease management. Recently, three research groups con-currently published independent works proposing new CRC classi-fication systems based on gene expression, named the Colon Cancer Subtype (CCS) system, the Colorectal Cancer Assigner (CRCA) and the Colon Cancer Molecular Subtype (CCMS) system3–6. In all three cases, the authors identified one subtype that was associated with
a low degree of differentiation, epithelial-to-mesenchymal transi-tion (EMT) and poor prognosis: in the CRCA system, subtype 5 was dubbed ‘stem-like’; in the CCS classifier, subtype 3 was associated with a serrated adenoma7 origin; and, in the CCMS system, subtype 4 was associated with EMT. These data have univocally been interpreted as signs of a phenotypic switch whereby cancer cells of epithelial origin acquire mesenchymal traits that typically associate with stem cell–like features. However, the carcinoma transcriptome is composed of signals originating not only from cancer cells but also from the tumor microenvironment, composed of stromal cells that intrinsi-cally display mesenchymal characteristics. Indeed, earlier works have described stromal ‘signatures’ in different tumor types, with possible clinical relevance8,9. It is thus conceivable that gene expression traits for noncancerous components might influence the assignment of specific CRC transcriptional subtypes. More importantly, it has not been assessed whether and to what extent stromal signals contribute to assigning each tumor to a specific transcriptional group.
To tackle this issue, we designed an analytical procedure aimed at (i) assessing how tumor purity affects CRC transcriptional sub-typing; (ii) discriminating stromal from cancer cell gene expression; and (iii) assigning the previously defined CRC subtype signature genes to a stromal or epithelial origin. The analysis employed data sets from primary CRCs, sorted CRC subpopulations, rectal cancer samples before and after treatment, and patient-derived xenografts (PDXs)10. Of note, in PDXs, human stromal cells are substituted by mouse cells11,12, such that gene expression by cancer and stromal cells can be distinguished by species of origin for the transcripts.
RESULTSMolecular subtyping of CRC identifies three consensus subgroupsTo explore how different classifiers divided CRCs into subtypes, we assembled a 450-sample, RNA sequencing (RNA-seq)-based mRNA expression data set from The Cancer Genome Atlas (TCGA)13. Each sample was then assigned to intrinsic subtypes according to the CRCA (subtypes 1 to 5), CCS (subtypes 1 to 3) and CCMS (subtypes 1 to 6) classifiers3–5 using Nearest-Template Prediction (NTP), a ‘nearest-neighbor’ class prediction algorithm that also estimates the significance of class assignment14. Significant subtype assignment was obtained for more than 85% of the samples with each classifier (Supplementary Table 1). Interestingly, for 369 samples, all 3 classifiers were significant;
Stromal contribution to the colorectal cancer transcriptomeClaudio Isella1,2, Andrea Terrasi2, Sara Erika Bellomo1,2, Consalvo Petti1, Giovanni Galatola1, Andrea Muratore1, Alfredo Mellano1, Rebecca Senetta3, Adele Cassenti3, Cristina Sonetto4, Giorgio Inghirami5, Livio Trusolino1,2, Zsolt Fekete6, Mark De Ridder7, Paola Cassoni3, Guy Storme7, Andrea Bertotti1,2 & Enzo Medico1,2
1Candiolo Cancer Institute, Fondazione Piemontese per l’Oncologia–Istituto di Ricovero e Cura a Carattere Scientifico (FRO-IRCCS), Candiolo, Italy. 2Department of Oncology, University of Torino, Candiolo, Italy. 3Department of Medical Science, University of Torino, Torino, Italy. 4Department of Oncology, University of Torino, Orbassano, Italy. 5Department of Molecular Biotechnology and Health Science, Center for Experimental Research and Medical Studies, University of Torino, Torino, Italy. 6Institute of Oncology Prof. Dr. Ion Chiricuta, Cluj, Romania. 7Department of Radiotherapy, Universitair Ziekenhuis Brussel, Vrije Universiteit Brussel, Brussels, Belgium. Correspondence should be addressed to E.M. ([email protected]) or C.I. ([email protected]).
Received 31 August 2014; accepted 28 January 2015; published online 23 February 2015; doi:10.1038/ng.3224

©20
15N
atu
re A
mer
ica,
Inc.
All
rig
hts
res
erve
d.
� ADVANCE ONLINE PUBLICATION Nature GeNetics
a n a ly s i s
we used Caleydo15 to jointly visualize the classifications of these samples and observed highly concordant assignment to related subtypes (Fig. 1a). Two of the three CCS subtypes were each split between two groups in the CRCA system and assigned to corresponding CCMS subtypes. Similarly, the CRCA4 ‘transit-amplifying’ (TA) subtype was split into CCMS1 and CCMS5. The subtype overlaps, previously reported only for the CCS and CRCA classifiers6, were found to be highly statistically significant in all cases (Online Methods and Supplementary Table 2). Moreover, significant gene overlap was also observed between the three signa-tures, which was particularly evident for the CRCA5 ‘stem-like’, CCS3 ‘serrated’ and CCMS4 ‘EMT’ subtypes (Supplementary Table 3). Notably, for these highly related subtypes, no merge or split was observed across the three classification systems.
On the basis of these results, we could reconcile the subtypes defined by the three classification systems into three major subgroups: TA/enterocyte, goblet/inflammatory and stem/serrated/mesenchymal (SSM) (Fig. 1b). Samples that were assigned to subtypes belonging to the same subgroup by at least two classifiers were assigned to that subgroup in subsequent analyses. Because the SSM subgroup was the most homogeneous, we collectively considered the SSM signature to be the union of the 3 gene expression signatures for the corresponding subtypes (48 CCS3 genes, 185 CRCA5 genes and 288 CCMS4 genes, merged into a 389-gene signature).
The SSM subgroup is associated with high stromal contentThe molecular attributes of ‘stemness’ and EMT, which typified the SSM subgroup, converge on mesenchymal traits that can be ascribed either to the phenotypic conversion of cancer cells during tumor pro-gression or to inherent characteristics of stromal cells.
We observed that the three SSM gene signatures contained many shared genes known to be expressed by supportive stromal cells, such as genes of the serpin family, collagens, FAP—a well know activator of CAFs specifically expressed by stroma16,17—and MGP (expressed by mesenchymal cells and associated with bone remodeling)18. Two studies employed ZEB1 as a protein marker of the SSM subtype19, whose corresponding gene was originally cloned in mesenchymal cells and which shows high expression in mesoderm-derived cells20,21. All this evidence poses the question of whether expression of SSM genes, when detected in a CRC sample, is of stromal or epithelial origin.
To analytically explore this issue, we first determined whether sub-group assignment was influenced by the extent of stromal content in each sample. To this end, we employed an estimate of tumor purity based on genomic allelic frequencies determined for TCGA samples9 using the Absolute algorithm22. This information was available for 158 of our subgroup-assigned samples (Supplementary Table 4). The average tumor purity of SSM samples (54%) was significantly lower than that of non-SSM samples (68%; P < 0.001) (Fig. 1b).
To validate these findings in a paired analysis setting, we took advantage of a gene expression data set of 72 rectal cancer samples generated in the laboratory (Gene Expression Omnibus (GEO), GSE56699), which comprised 11 cases of tissue biopsies taken before the start of preoperative radiotherapy and matched post-treatment surgical specimens. The aim of this analysis was to determine whether and how substitution of cancer cells by fibrous tissue—a typical repar-ative reaction triggered by radiotherapy—affected subtype assign-ment. All classifiers successfully assigned most of the samples of the data set, including the 11 matched sequential pairs, to subtypes
CCS(De Sousa
E Melo)
a CRCA(Sadanandam)
CCMS(Marisa)
Consensusn = 418
CCS2
OR = 11.67P < 5 × 10–15
OR = 20.72P < 1 × 10 –32
OR = 84.82P < 1 × 10–34
OR = 12.67
P < 1 × 10–14
OR = 99.92
P < 5 × 10–34
OR = 56.75P < 1 × 10–29
OR = 131.16
P < 5 × 10–52
OR = 367.67P < 1 × 10–50 OR = 629.99
P < 5 × 10–56
SSMn = 83
TA/enterocyten = 221
Goblet/inflammatory
n = 114
OR = 5.15P < 1 × 10 –6
OR = 9.63
P < 1 × 10 –11
CCS1
CCS3
CRCA1-INFL
CRCA2-GOB
CRCA3-ENT
CRCA4-TA
CRCA5-STEM
CCMS2
CCMS3
CCMS6
CCMS1
CCMS5
CCMS4
b Tumor purity
Goblet/inflam
matory
(n = 42)
TA
/enterocyte(n =
102)S
SM
(n = 14)
0.2 0.4 0.6 0.8 1.0
Enterocytec
Enterocyte SSM TA* *
RC
a001
0R
Ca0
010
RC
a001
3R
Ca0
013
RC
a000
1
RC
a000
5
RC
a000
2
RC
a000
1
RC
a000
5
RC
a000
2
RC
a001
4R
Ca0
014
RC
a001
6R
Ca0
016
RC
a000
3R
Ca0
003
RC
a000
4R
Ca0
004
RC
a000
7
RC
a001
5
RC
a000
7
RC
a001
5
Beforeradiotherapy
Afterradiotherapy
Goblet TA
FAP+
(CAF)
CD31+
(Endothelial)
CD45+
(Leukocyte)
EPCAM+
EPCAM+
EPCAM+
SSMgene set
SSMgene set
SSMgene set
NES = 3.8P < 10–7
NES = 3.2P < 10–7
NES = 2P < 10–4
Enr
ichm
ent
scor
eE
nric
hmen
tsc
ore
Enr
ichm
ent
scor
e
0.8
d0.70.60.50.40.30.20.1
0
0.7
0.450.400.350.300.250.200.150.100.05
0
0.60.50.40.30.20.1
0
Figure 1 The CRC SSM subgroup is consistently recognized by different classifiers and is associated with high stromal content. (a) Caleydo view of correspondences between the subtype assignments of 369 TCGA CRC samples by the CCS, CRCA and CCMS classification systems. Edges connecting the subtypes across the different classifiers are colored to highlight overlapping subtypes. Fisher test P values and odds ratios (ORs) of classification overlaps are reported within each edge. The boxes on the right represent a reconciliation of the CRC subtypes defined by the three classifiers into common, larger subgroups. Samples were assigned to a consensus subgroup if at least two of the three classifiers significantly assigned them to a subtype part of the subgroup. INFL, inflammatory; GOB, goblet-like; ENT, enterocyte; STEM, stem-like. (b) Tukey box plots reporting, for each subgroup, tumor purity estimated by Absolute analysis on TCGA CRC samples. The central line is the median, the box defines the 25th and 75th percentiles, and the whiskers indicate the data within 1.5 times the interquartile range. (c) Transcriptional classification of paired rectal cancer samples before and after radiotherapy, showing a systematic switch to SSM subtypes after treatment. Asterisks highlight two cases that underwent pathological complete response, whose post-treatment samples contained only stromal cells. (d) GSEA testing for upregulation of the SSM gene set in stromal cell subpopulations (CAFs, FAP+; endothelial cells, CD31+; leukocytes, CD45+) versus epithelial cells (EpCAM+). NES, normalized enrichment score.
©20
15N
atu
re A
mer
ica,
Inc.
All
rig
hts
res
erve
d.
Nature GeNetics ADVANCE ONLINE PUBLICATION �
a n a ly s i s
(Supplementary Table 5). We observed that, whereas the pretreat-ment biopsies were assigned preferentially to the TA/enterocyte sub-group, most of the corresponding post-treatment specimens were assigned to the SSM subgroup. Notably, in two of these cases, in which the patients underwent complete response, the post-treatment surgical samples were histologically described as ‘transmural scars’ (Fig. 1c and Supplementary Fig. 1), confirming the expression of SSM signature genes by stromal cells.
To assess which stromal cells expressed SSM genes, we analyzed a gene expression data set (GEO, GSE39397) obtained in cells sorted from fresh CRC samples on the basis of specific surface markers: EPCAM for epithelial tumor cells, CD45 for leukocytes, CD31 for endothelial cells and FAP for CAFs23. We used Gene Set Enrichment Analysis (GSEA)24 to test subtype gene signatures for expression in stromal cell subpopulations versus cancer cells. SSM genes were strongly upregulated in CAFs but also in leukocytes and endothelial cells (Fig. 1d). Results obtained with individual signatures from the three classifiers confirmed upregulation of SSM genes in CAFs and evidenced additional upregulation of inflammatory (CRCA1) genes in leukocytes, consistent with their immune function (Supplementary Fig. 2). Collectively, these findings demonstrate that most SSM genes are more highly expressed by CAFs and other stromal cells than by cancer cells.
In CRC PDXs, transcripts of SSM genes originate from mouse stromal cellsTo more quantitatively investigate the extent of stromal contribution to the CRC transcriptome, we analyzed gene expression profiles from CRC PDXs, for which the transcriptome is a mixture of human RNAs (deriving from cancer cells) and mouse RNAs (deriving from stromal cells). Expression profiling of PDX samples with human microarrays is therefore not expected to detect transcripts of stromal origin, unless
array probes cross-hybridize with mouse transcripts. Indeed, by opti-mizing this approach for Affymetrix expression data, through the identification and removal of probes that would hybridize to both spe-cies, in a data set of 27 pairs of human CRCs and matched PDXs (GEO, GSE35144)25 (Supplementary Fig. 3), we identified 848 genes whose expression was lost after tumor transplantation in mice (Fig. 2a and Supplementary Table 6). Analysis of the 848 genes depleted in PDXs using the tissue expression module of the DAVID EASE portal26 showed a strong enrichment for genes expressed in connective, spleen and adipose tissues (Supplementary Table 7). We then evaluated how many of the SSM genes lost or maintained their expression in PDXs and found that, of the 270 SSM genes expressed in this data set, expression was lost for 199 in PDXs (Fig. 2a). Detailed analysis of the lost/maintained fraction for all subtype genes for all classifiers identified additional losses in expression for inflammatory genes from CRCA (72/130; Fig. 2b), consistent with their putative expression in leukocytes. Depletion of human stromal mRNAs in PDXs detect-ably affected their transcriptional classification: none of the human CRC samples assigned to the SSM subgroup (15) maintained this assignment in the corresponding PDX and were instead significantly reclassified in the TA/enterocyte or goblet/inflammatory subgroup (Fig. 2c and Supplementary Table 8). We obtained similar results for a data set of matched primary CRC and PDX samples profiled for gene expression with a different microarray platform, Illumina HumanHT12-V4 (GEO, GSE56695; Fig. 2d,e, Supplementary Fig. 4 and Supplementary Tables 9 and 10).
To determine whether the human stromal transcripts lost in PDXs were replaced by mouse stromal transcripts, we analyzed RNA-seq data on nine PDX samples obtained from three CRCs, profiled at high coverage11. RNA-seq allows the quantification of parallel transcripts of human and mouse origin in the same PDX sample, generating species-specific profiles11,27,28. Indeed, most of the genes previously
Human CRC samples PDX derivatives
Goblet/inflammatory Goblet/inflammatory
SSM
TA/enterocyte
TA/enterocyte
INFL/GOBgenes
TA/ENTgenes
SSMgenes
GOB/INFLgenes
TA/ENTgenes
SSMgenes
High-stroma sample50,000
10,000
1,000
100
100
1,00
0
10,0
00
50,0
00
Exp
ress
ion
leve
l in
PD
Xs
100
1,00
0
10,0
00
50,0
00
50,000
10,000
1,000
100
Low-stroma sample
100755025
0–25–50–75
–100CCS2 CCS1 CCS3
INFL GOB
2 3 6
Maintained in PDXsLost in PDXs
1 5 4
ENT TA STEM
100755025
0–25–50–75
–100
100755025
0–25–50–75
–100
CC
S
CR
CA
CC
MS
Per
cent
gen
eslo
st o
r ke
ptP
erce
nt g
enes
lost
or
kept
Per
cent
gen
es lo
st o
r ke
pt
50,000a b c
d eExpression level in human tumors
10,000
1,000
Exp
ress
ion
leve
l in
PD
Xs
10
100 1,000 10,000 50,000
Expression level in human tumors
Figure 2 Systematic loss of SSM gene expression upon propagation of CRC tissues in PDXs. (a) Scatter plot comparing, for each gene tested on human arrays, average expression in 27 human CRC samples (x axis) with average expression in the corresponding PDX derivatives (y axis). Blue dots indicate genes of the SSM subgroup. (b) Bar plots representing, for each subtype signature of the three classifiers, the percentage of genes expressed in PDXs and the percentage of genes for which expression was lost upon PDX propagation, as measured by human arrays. (c) Caleydo visualization of the assignment to CRC subgroups of human CRC samples (left) and of their corresponding PDX samples (right), for a total of 22 sample pairs. (d,e) Scatter plots comparing, for each gene tested on human arrays, average expression in one human primary CRC sample (x axis) with that in the corresponding PDX derivative (y axis). Blue dots indicate genes of the SSM subgroup. The primary CRC sample in d was classified as SSM; the sample in e was assigned to the TA/enterocyte subgroup and shows fewer highly expressed SSM genes on the x axis. (a–c) Affymetrix GSE35144 data set processed with the H-spec CDF (content descriptor file). (d,e) Illumina GSE56695 data set.

©20
15N
atu
re A
mer
ica,
Inc.
All
rig
hts
res
erve
d.
� ADVANCE ONLINE PUBLICATION Nature GeNetics
a n a ly s i s
identified as losing expression in PDXs were barely detected as human reads but had higher than average expression as mouse reads (Fig. 3a), confirming their stromal expression also in PDXs. We obtained similar results when analyzing genes of the SSM signature (Fig. 3b), confirming that most SSM genes are not expressed by cancer cells but are highly represented in stromal cells; conversely, genes of the TA/enterocyte and goblet/inflammatory subgroups were mostly expressed by epithelial cells (Fig. 3c,d). In accordance with their potential enrichment for leukocytes, the inflammatory subtypes also displayed higher mouse expression for a substantial number of genes, whereas expression of the remaining non-SSM signatures was mostly associated with an epithelial origin (Supplementary Fig. 5). To com-pute a transcript-by-transcript assessment of epithelial versus stromal contribution to gene expression, we used absolute read counts to cal-culate the relative numbers of human and mouse reads mapping to each ortholog (Supplementary Table 11). By assuming that the frac-tion of mouse reads divided by the total number of reads adequately represented the stromal contribution to the expression of a gene, we estimated that stromal (mouse) transcripts were more abundant than epithelial (human) transcripts for the vast majority of the SSM signature genes (Fig. 3e), despite a calculated global stromal fraction in the samples of less than 5%. Additional subtype signatures with relevant although lower stromal contribution included those for the inflammatory and enterocyte subtypes. GSEA confirmed significant enrichment of genes with stromal (mouse) expression among SSM genes, including the fraction that was not designated as losing expres-sion upon PDX propagation in the microarray experiments; other subtype signatures were enriched in genes with epithelial expression (Supplementary Table 11b). For each gene of the CCS, CRCA and CCMS classifiers, all the above-described annotations are provided in Supplementary Table 11c–e.
To assess whether SSM samples were also endowed with the tran-scriptional traits of the TA/enterocyte or goblet/inflammatory sub-group, we applied NTP classification to TCGA samples after removing the SSM subgroup signature from the CCS, CRCA or CCMS classifier. Indeed, 49 of the 83 SSM samples could be significantly assigned to either the goblet/inflammatory or TA/enterocyte subgroup when the SSM centroid was absent.
We then systematically evaluated stromal contribution to the expres-sion of additional published CRC gene signatures (Supplementary Fig. 6)29–34. In about half of these cases, one of the gene lists displayed strong stromal contribution to expression for a large fraction of the genes, with the highest contribution being observed for an EMT signature35.
Proteins encoded by SSM genes are detected in stromal CRC cellsA major drawback of molecular profiling based on tissue lysis is that detailed morphological information is lost. It is therefore virtually
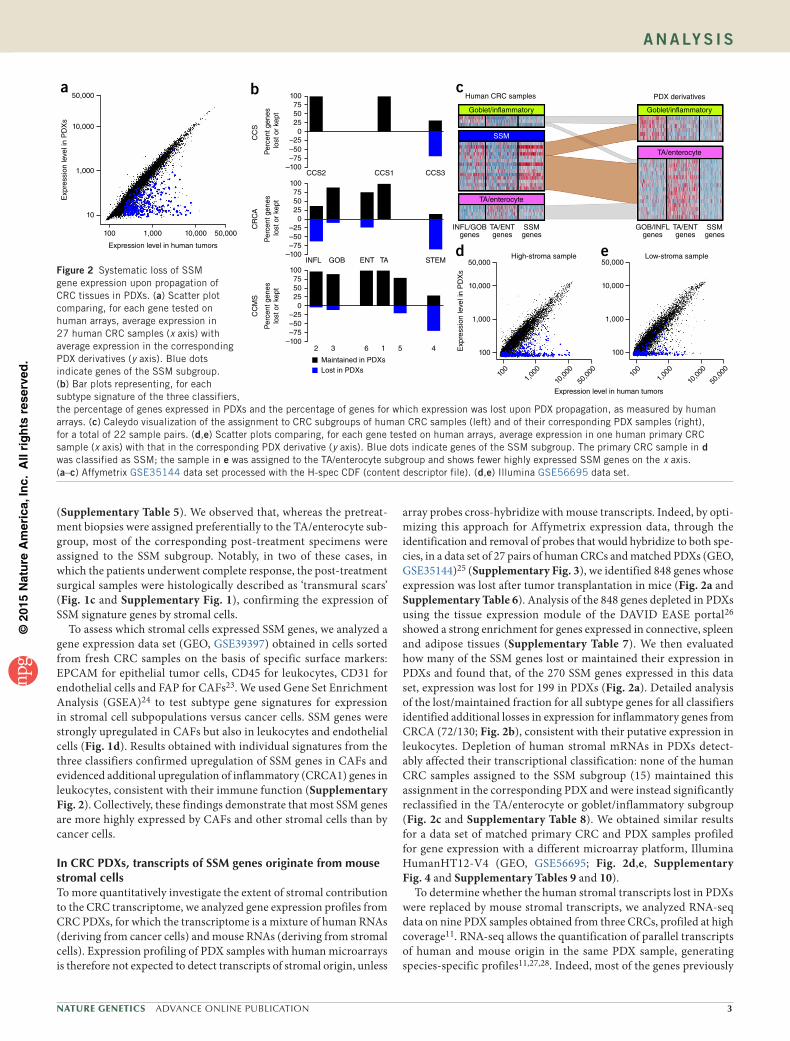
impossible to verify whether, in SSM samples, cancer cells do in fact express SSM genes, even at low levels. To overcome this limita-tion, we exploited available immunohistochemistry data systemati-cally generated by the Human Protein Atlas Consortium36. Staining results of CRC samples with validated antibodies were available for 64 SSM genes and 98 non-SSM genes. Through examination of the immunohistochemistry data, we found that half of the 98 non-SSM genes had detectable protein expression in more than 90% of the sam-ples, whereas fewer than 25% of the SSM genes had protein expression reaching this detection frequency (Fig. 4a). Visual inspection of the immunohistochemistry data for some of the SSM genes with negative results confirmed the absence of signal in cancer cells and highlighted robust expression by stromal cells (Supplementary Note). To confirm these results, we selected three SSM genes for independent immuno-histochemistry analyses: ZEB1, which was previously employed as an immunohistochemistry marker of the CCS3 and CRCA5 subtypes3,4; MAP1B, which scored among the top genes associated with all three SSM signatures; and TAGLN, which was present in two of the three SSM signatures (CRCA5 and CCMS4). We analyzed the encoded markers by staining sections from (i) one CRC sample classified as SSM and its PDX derivative, classified as TA/enterocyte (Fig. 4b); (ii) two rectal cancer samples that switched from the TA/enterocyte group to the SSM group after radiotherapy (Fig. 4b); and (iii) four
10,000a b
c
e
d
1,000
100
10
1
0.1
0.01
0.001
0.00
10.
1 1 10 1001,
000
10,0
00
10,000
1,000
100
10
1
0.1
0.01
0.001
0.00
10.
1 1 10 1001,
000
10,0
00
Mou
se tr
ansc
ript
leve
l (R
PM
)
Human transcript level (RPM)
Human transcript level (RPM)
10,000
1,000
100
10
1
0.1
0.01
0.001
0.00
10.
1 1 10 1001,
000
10,0
00
10,000
1,000
100
10
1
0.1
0.01
0.001
0.00
10.
1 1 10 1001,
000
10,0
00M
ouse
tran
scrip
tle
vel (
RP
M)
10075
250
10075
250
100
1.0 0.8
CCS: CRCA:
CCMS:
CCS1
CCMS1 CCMS2 CCMS3 CCMS4 CCMS5 CCMS6
CCS2 CCS3 INFL GOB ENT TA STEM
0.6
Percentile
0.4 0.2 0
CCMS
CRCA
CCS
75
250P
erce
nt r
eads
of m
ouse
orig
in
Figure 3 Species-specific analysis of RNA-seq data from PDX samples to distinguish stromal from cancer cell gene expression. (a–d) Scatter plots comparing, for each gene ortholog pair, human (x axis) and mouse (y axis) RPM (reads per million) values from PDX RNA-seq data. Values are the averages for the PDXs from three patients. Genes defined as losing expression upon PDX propagation by human microarray analysis are highlighted in a (purple), and SSM genes are highlighted in b (blue). Goblet/inflammatory genes (yellow) and TA/enterocyte genes (pink) are highlighted, respectively, in c and d. (e) Plots of CRC signature gene lists ranked by the extent of gene expression contributed by the stroma: the x axis reports the gene list percentile, and the y axis reports the stromal contribution to gene expression, calculated for each gene as the percentage of mouse reads divided by the total number of reads (mouse and human), based on PDX RNA-seq data.
©20
15N
atu
re A
mer
ica,
Inc.
All
rig
hts
res
erve
d.
Nature GeNetics ADVANCE ONLINE PUBLICATION �
a n a ly s i s
rectal cancer preoperative biopsies classified as SSM (Supplementary Fig. 7a). Indeed, in all cases, the tested markers stained only stromal cells, with the exception of ZEB1, which also showed positive staining in cancer cells. However, ZEB1 was weakly expressed and atypically confined to the cytoplasm in cancer cells, whereas it exhibited strong, canonical positivity in the nuclei of stromal cells. Moreover, RNA in situ hybridization of an SSM case with cytoplasmic staining of epithelial cells showed strong ZEB1 mRNA expression in stromal cells rather than epithelial cells (Supplementary Fig. 7b). All these findings, together with the observation that ZEB1 cytoplasmic signal was also detected in cancer cells from TA/enterocyte samples, call into ques-tion the specificity of such staining. These results show that, even in samples robustly assigned to the SSM subgroup by transcriptional profiling, cancer cells do not express SSM marker genes.
Very recently, CRC classification has also been achieved by global proteomic profiling, which led to the identification of five distinct subtypes, from A to E37. We noticed that the only consistent overlap with RNA-based subtypes was between proteomic subtype C and transcriptional subtypes of the SSM group and that the tran-scriptional SSM signature was significantly enriched for genes cor-responding to proteins upregulated in subtype C (Supplementary Table 12). We therefore reasoned that proteins upregulated in sub-type C could originate from stromal rather than neoplastic cells and applied all the above analyses to assess the stromal origin of such proteins. This appraisal found that (i) TCGA samples assigned to proteomic subtype C had lower tumor purity; (ii) a large fraction of subtype C signature proteins were encoded by genes expressed, at the RNA level, only by stromal (mouse) cells in PDX models; and (iii) the major source of transcripts coding for subtype C proteins was CAFs (Supplementary Fig. 8).
Prognostic and predictive value of CRC stromal transcriptsThe SSM subgroup is endowed with distinctive clinical features, namely, a high relapse rate and increased sensitivity to chemother-apy4. These features could indeed be a consequence of the abundant stromal components of these samples. To accurately trace the stromal sources of tumor transcripts, we first designated a set of 4,434 genes not expressed by CRC neoplastic cells by combining our data for all the above-described mRNA-based analyses (array and RNA-seq) in tumors and PDXs (Supplementary Table 13). Then, by intersect-ing this gene set with the transcriptional profiles of sorted CRC cell populations23, we defined 3 signatures, composed of 131, 47 and 35 genes, specifically expressed by CAFs, leukocytes and endothe-lial cells, respectively (Supplementary Fig. 9a and Supplementary Table 14). Averaging the expression of genes in each signature yielded three stromal scores (CAF, leukocyte and endothelial), which could be easily calculated to quantify stromal cell populations and assess their clinical correlations. Relationships between the three scores were assessed in the TCGA data set and found to be highly correlated but
not completely overlapping (Supplementary Fig. 9b). Considering that the SSM subgroup generally included 20–25% of the samples, we classified the data set on the basis of the 25th to 75th percentile of each score and verified that the fraction of samples displaying concordantly high or low scores was, respectively, 51 and 53 samples, about half of the quartile size for each score (112 samples; Supplementary Fig. 9c). To explore relationships between the stromal scores and tissue sample morphology, we took advantage of the TCGA Digital Slide Archive38 and observed strong concordance between each score and the respec-tive stromal population (Supplementary Note). As expected, CAF score was extremely high in TCGA samples of the SSM subgroup (P < 1 × 10−83), together with the leukocyte and endothelial scores (P < 1 × 10⁻¹¹ and P < 1 × 10−37, respectively). Leukocyte score was also higher in inflammatory subtype samples (P < 1 × 10⁻⁴).
In the TCGA CRC data set, the three stromal scores were not asso-ciated with tumor stage, size or lymph node status. On the contrary, leukocyte score was strongly associated with microsatellite instability (MSI-H; t test, P < 1 × 10⁻⁶), the CpG island methylator phenotype (CIMP: P < 1 × 10⁻⁴) and BRAF mutation (P < 1 × 10⁻³). To evaluate correlations between stromal scores and post-surgery disease-free survival, we analyzed a CRC expression data set (GEO, GSE14333) annotated with long-term disease outcome33. Tumors with a high CAF score (>75th percentile) had significantly shorter disease-free survival times (Fig. 5a). Moreover, by stratifying patients on the basis of treatment history, we observed that the prognostic power of the CAF score was selectively confined to the patient subpopulation that did not receive adjuvant therapy after surgery. In this setting, CAF score was found to be an even stronger indicator of negative progno-sis (Fig. 5b), independent of tumor stage (Cox regression analysis; CAF score: hazards ratio (HR) = 2.913, P < 0.013; Duke’s stage C: HR = 7.3, P < 1 × 10⁻⁵). No independence was found between CAF
50a
40
30
20
Per
cent
gen
es in
the
sign
atur
e
10
0Detected in <10%
of the samplesDetected in >90%
of the samples
b
Tumor
PDX
Pre-RT
Post-RT
Pre-RT
Post-RT
SSM
TA/enterocyte
SSM
TA/enterocyte
TA/enterocyte
SSM
TAGLNMAP1BZEB1
RT-
sens
itive
rec
tal
canc
erR
T-re
sist
ant r
ecta
lca
ncer
Col
on c
ance
r
SSM genes Non-SSM genesFigure 4 Proteins encoded by SSM genes are detected in stromal rather than epithelial CRC cells. (a) Bar graph reporting the fraction of signature genes detected as being expressed in CRC epithelial cells by immunohistochemistry, according to the Human Protein Atlas database. (b) Micrographs of immunohistochemistry staining for ZEB1, MAP1B and TAGLN in CRC samples. The transcriptional classification of each sample is reported on the right. In all micrographs, specific staining of all antibodies is confined to the stromal components: ZEB1 is localized to the nuclei of fibroblasts, leukocytes and other mesenchymal cells; MAP1B preferentially stains endothelial cells and nerve structures; and TAGLN is mainly expressed by smooth muscle cells. RT, radiotherapy. Scale bars, 20 µm.

©20
15N
atu
re A
mer
ica,
Inc.
All
rig
hts
res
erve
d.
� ADVANCE ONLINE PUBLICATION Nature GeNetics
a n a ly s i s
score and SSM subgroup assignment, reinforcing the notion that the SSM subgroup is largely recapitulated by stromal score. Notably, no correlation between CAF score and disease-free survival was observed in treated patients (Fig. 5c), suggesting that high CAF score is also associated with better response to treatment, at least for the first 1–2 years.
To assess whether any of the stromal scores were associated with rectal cancer response to radiotherapy, we analyzed the 72-sample rec-tal cancer cohort described above (GEO, GSE56699; Supplementary Table 15) by comparing the stromal scores measured in pretreatment samples with the radiotherapy response as evaluated by the Mandard scoring system39: cases with Mandard 1–2 were considered sensitive, those with Mandard 4–5 were classified as resistant and those with Mandard 3 were categorized as intermediate. For each score, first-quartile samples were described as having a low score and fourth-quartile samples were described as having a high score. Interestingly, the three stromal scores were not concomitantly high or low in the same samples; yet, for each of them, low values were associated with increased sensitivity to radiotherapy and high values were associated with increased resistance (Supplementary Table 16). Moreover, a ‘compound stromal score’ defined as the median of the three percen-tiles was found to significantly discriminate sensitive samples from resistant ones (Fig. 5d and Supplementary Table 16). These results show that the response of rectal cancer to radiotherapy is negatively influenced by all three major components of the tumor stroma (CAFs, leukocytes and endothelial cells). To test whether SSM rectal cancer samples collected before and after treatment had different stromal con-tent, we compared rectal cancer SSM pretreatment biopsies with SSM surgical samples and evaluated by GSEA a possible asymmetry in the distribution of the three stromal scores. Interestingly, the endothelial score was significantly lower in treated samples, suggesting that reduc-tion in the endothelial component after treatment is representative of inert, reparative mesenchymal tissue as opposed to active stroma supporting cell growth in naive samples (Supplementary Fig. 10).
DISCUSSIONAnalyses presented in this work provide four strong, concordant lines of evidence that genes whose expression is positively associated with the SSM subgroup of CRC are mostly expressed by stromal cells. First, SSM samples have a significantly higher stromal content, as found in TCGA samples annotated for tumor purity and in rectal cancer samples that have undergone radiotherapy-mediated substitution of cancer cells with reparative stroma. Second, analysis of the expression profiles of sorted CRC cell subpopulations showed that SSM genes are expressed by CAFs, leukocytes and endothelial cells rather than
by epithelial neoplastic cells. Third, in PDXs, where human stroma is substituted by mouse stroma, most SSM genes are well detected in the mouse rather than the human fraction of the transcriptome. Fourth, immunohistochemistry data meta-analysis, coupled with experimen-tal staining of SSM samples, shows that the proteins encoded by top-scoring SSM genes are expressed by stromal and not epithelial cells.
The discrete subgroup of SSM-like CRC samples—characterized by transcriptional traits dominated by their stromal component—was initially evidenced in the TCGA CRC data set and then confirmed in multiple independent cohorts (GSE56699, GSE35144, GSE56695 and GSE14333, GEO). Moreover, the data were generated using diverse gene expression platforms (Affymetrix and Illumina gene expres-sion arrays and RNA-seq) and even completely independent techno-logical approaches, such as immunohistochemistry and proteomics. It is therefore unlikely that the presence of this subgroup is related to batch effects consequent to the inaccurate selection of sampling areas. Indeed, a CRC transcriptional subtype dubbed EMT/stroma has been associated with desmoplastic histological traits, indicating that abun-dant stroma can be considered a distinctive feature of some CRCs40. From a complementary viewpoint, PDX-derived RNA-seq data indi-cate that even a very low fraction of stromal content can substantially influence the transcriptional profile of SSM genes (owing to their weak expression in cancer cells); therefore, further accuracy in sampling techniques is expected not to provide substantially better resolution.
Our finding that the SSM subgroup signature mainly includes tran-scripts of stromal origin may seem disruptive because it challenges the notion that EMT and stemness contribute to CRC. Indeed, our results do not exclude such transcriptional traits in cancer cells, which have also been observed in CRC cell lines cultured in vitro (and, therefore, in the absence of stromal cells)3–5,41. Accordingly, when we applied PDX-based analysis of the stromal transcript fraction to two intestinal stem cell (ISC) signatures obtained in sorted EPHB2+ and LRG5+ intestinal cells42, we found that about one-quarter of the genes had expression of a predominantly stromal nature (Supplementary Fig. 6). It is likely that these genes typify the (still elusive) mesenchymal sub-phenotype of epithelial ISCs, which superimposes with the bulk of inherent mesenchymal traits expressed by stromal cells. However, consistent with the notion that ISCs may dynamically acquire some mesenchymal characteristics but substantially retain an epithelial memory43, the majority of the remaining genes in both ISC signa-tures displayed negligible stromal contribution. This confirms that ‘stroma-aware’ approaches to the definition of CRC stemness signa-tures are feasible.
We describe here that a CAF-specific stromal signature reca-pitulates the clinical attributes of the SSM subgroup, that is, higher
1.0a b c d
0.8
0.6
0.4
0.2
1.0
0.8
0.6
0.4
0.2
1.0
0.8
0.6
0.4
0.2Sur
viva
l (fr
actio
n)
0 0 0
0 1
150
Low CAF scoreHigh CAF score
P < 0.03 P < 0.002 P = 0.383
124 97 69 37
16
108 99 82 64 46 24
6
46
20 19
39
15
29 20
8 7
10
11
33
913
Resistant
Intermediate
Sensitive
10.750.25Compound stromal score (percentile)
020263020284051
169
57
2 3 4 5 0 1 2 3 4 5 0 1 2 3 4 5
Low CAF scoreHigh CAF score
Low CAF scoreHigh CAF score
Years
Figure 5 Clinical impact of stromal gene signatures. (a–c) Kaplan-Meier analysis of disease-free survival on a data set of 226 CRC samples classified as having high (top quartile) or low (first to third quartile) CAF score. (a) Analysis of all samples. (b) Analysis of only the 138 samples with no adjuvant therapy. (c) Analysis of the 66 samples that only underwent adjuvant chemotherapy after surgery. (d) Dot plot reporting, on the x axis, the compound stromal score for 52 rectal cancer biopsies. On the y axis, samples are subdivided by their response to radiotherapy.

©20
15N
atu
re A
mer
ica,
Inc.
All
rig
hts
res
erve
d.
Nature GeNetics ADVANCE ONLINE PUBLICATION �
a n a ly s i s
intrinsic aggressiveness and better response to chemotherapy. We also provide new evidence that CAF, endothelial and leukocyte scores jointly predict the response of rectal cancer to radiotherapy. Different from tumor purity measures based on microscopic inspec-tion or DNA analysis, transcriptional stromal scores do not simply reflect the fraction of stromal cells in the tumor but also provide infor-mation on their composition and functional state. This may explain why the ‘static’ evaluation of stroma abundance by pathological or DNA-based criteria failed to highlight clinically relevant correlates. Congruent with the established notion that interactions between cancer cells and the microenvironment may affect tumor biology, disease outcome and response to treatment44–49, clinically relevant stromal gene expression signatures have been reported for various cancer types, including CRC8,9. In particular, a transcriptional score named ‘Estimate’, aimed at quantifying the stromal components of epithelial tumors, was recently defined by analyzing the expression profiles of microdissected ovarian, breast and colon cancer samples9. At odds with the stromal signatures described here, genes used for cal-culating the Estimate score (and also other stromal signatures) were not checked for lack of expression in CRC cancer cells, which could potentially affect the accuracy of the analysis. Indeed, albeit signifi-cant, the prognostic value of the Estimate score in the GSE14333 data set was lower than that of the CAF score (Supplementary Fig. 11). Collectively, these results reinterpret the EMT and stemness traits typically ascribed to epithelial cancer cells as prevalent stromal contributions and provide new stromal scores that may prove helpful in advancing CRC prognosis and response prediction.
URLs. TCGA data portal, https://tcga-data.nci.nih.gov/; Bioconductor, http://www.bioconductor.org/; Broad Institute GSEA portal, http://www.broadinstitute.org/gsea/index.jsp; NCBI Gene Expression Omnibus (GEO), http://www.ncbi.nlm.nih.gov/geo/; Human Protein Atlas portal, http://www.proteinatlas.org/; R survival analysis package, http://CRAN.R-project.org/package=survival; Broad Institute GenePattern, http://www.broadinstitute.org/cancer/software/genepattern/.
METHODSMethods and any associated references are available in the online version of the paper.
Accession codes. Tumor-PDX expression data set, GSE56695 (GEO); rectal cancer data set, GSE56699 (GEO); TCGA CRC expression data set, Bioconductor experiment package TCGAcrcmRNA.
Note: Any Supplementary Information and Source Data files are available in the online version of the paper.
ACknowLEDGMEnTSWe thank E. Trisolini, R. Porporato, D. Cantarella, B. Martinoglio, F. Sassi and S. Destefanis for technical assistance. E.M., A.B. and L.T. are members of the EurOPDX Consortium. This work was supported by grants from Associazione Italiana per la Ricerca sul Cancro (IG12944 and IG14205; 9970-2010 Special Program Molecular Clinical Oncology 5x1000), Fondazione Piemontese per la Ricerca sul Cancro (5x1000 Ministero della Salute 2010 and 2011) and Compagnia di San Paolo/Ateneo (project ‘Rethe’).
AUTHoR ConTRIBUTIonSC.I. contributed study design, data analysis, bioinformatics analyses, histochemical and morphological analyses, and manuscript writing. A.T. contributed molecular and morphological data generation and analysis. S.E.B. contributed data analysis and bioinformatics analyses. C.P. contributed molecular data generation. G.G., A. Muratore, A. Mellano, Z.F., M.D.R. and G.S. contributed sample acquisition, clinical data collection and curation. R.S., A.C., C.S. and P.C. contributed histochemical and morphological analyses, sample acquisition and clinical data collection and curation. G.I. contributed
histochemical and morphological analyses. L.T. contributed sample acquisition and manuscript writing. A.B. contributed data analysis, sample acquisition and manuscript writing. E.M. contributed study design, data analysis, bioinformatics analyses, histochemical and morphological analyses, manuscript writing and project oversight.
CoMPETInG FInAnCIAL InTERESTSThe authors declare no competing financial interests.
Reprints and permissions information is available online at http://www.nature.com/reprints/index.html.
1. Walther, A. et al. Genetic prognostic and predictive markers in colorectal cancer. Nat. Rev. Cancer 9, 489–499 (2009).
2. Cunningham, D. et al. Colorectal cancer. Lancet 375, 1030–1047 (2010).3. De Sousa, E. & Melo, F. et al. Poor-prognosis colon cancer is defined by a molecularly
distinct subtype and develops from serrated precursor lesions. Nat. Med. 19, 614–618 (2013).
4. Sadanandam, A. et al. A colorectal cancer classification system that associates cellular phenotype and responses to therapy. Nat. Med. 19, 619–625 (2013).
5. Marisa, L. et al. Gene expression classification of colon cancer into molecular subtypes: characterization, validation, and prognostic value. PLoS Med. 10, e1001453 (2013).
6. Sadanandam, A. et al. Reconciliation of classification systems defining molecular subtypes of colorectal cancer: interrelationships and clinical implications. Cell Cycle 13, 353–357 (2014).
7. Pai, R.K. et al. Histologic and molecular analyses of colonic perineurial-like proliferations in serrated polyps: perineurial-like stromal proliferations are seen in sessile serrated adenomas. Am. J. Surg. Pathol. 35, 1373–1380 (2011).
8. Farmer, P. et al. A stroma-related gene signature predicts resistance to neoadjuvant chemotherapy in breast cancer. Nat. Med. 15, 68–74 (2009).
9. Yoshihara, K. et al. Inferring tumour purity and stromal and immune cell admixture from expression data. Nat. Commun. 4, 2612 (2013).
10. Bertotti, A. et al. A molecularly annotated platform of patient-derived xenografts (“xenopatients”) identifies HER2 as an effective therapeutic target in cetuximab-resistant colorectal cancer. Cancer Discov. 1, 508–523 (2011).
11. Chou, J. et al. Phenotypic and transcriptional fidelity of patient-derived colon cancer xenografts in immune-deficient mice. PLoS ONE 8, e79874 (2013).
12. Julien, S. et al. Characterization of a large panel of patient-derived tumor xenografts representing the clinical heterogeneity of human colorectal cancer. Clin. Cancer Res. 18, 5314–5328 (2012).
13. Cancer Genome Atlas Research Network. Comprehensive molecular characterization of human colon and rectal cancer. Nature 487, 330–337 (2012).
14. Hoshida, Y. Nearest template prediction: a single-sample-based flexible class prediction with confidence assessment. PLoS ONE 5, e15543 (2010).
15. Lex, A. et al. StratomeX: visual analysis of large-scale heterogeneous genomics data for cancer subtype characterization. Comput. Graph. Forum 31, 1175–1184 (2012).
16. Mathew, S. et al. The gene for fibroblast activation protein α (FAP), a putative cell surface–bound serine protease expressed in cancer stroma and wound healing, maps to chromosome band 2q23. Genomics 25, 335–337 (1995).
17. Fearon, D.T. The carcinoma-associated fibroblast expressing fibroblast activation protein and escape from immune surveillance. Cancer Immunol. Res. 2, 187–193 (2014).
18. Laizé, V., Martel, P., Viegas, C.S., Price, P.A. & Cancela, M.L. Evolution of matrix and bone γ-carboxyglutamic acid proteins in vertebrates. J. Biol. Chem. 280, 26659–26668 (2005).
19. Peinado, H., Olmeda, D. & Cano, A. Snail, Zeb and bHLH factors in tumour progression: an alliance against the epithelial phenotype? Nat. Rev. Cancer 7, 415–428 (2007).
20. Nishimura, G. et al. δEF1 mediates TGF-β signaling in vascular smooth muscle cell differentiation. Dev. Cell 11, 93–104 (2006).
21. Funahashi, J., Sekido, R., Murai, K., Kamachi, Y. & Kondoh, H. δ-crystallin enhancer binding protein δEF1 is a zinc finger–homeodomain protein implicated in postgastrulation embryogenesis. Development 119, 433–446 (1993).
22. Carter, S.L. et al. Absolute quantification of somatic DNA alterations in human cancer. Nat. Biotechnol. 30, 413–421 (2012).
23. Calon, A. et al. Dependency of colorectal cancer on a TGF-β–driven program in stromal cells for metastasis initiation. Cancer Cell 22, 571–584 (2012).
24. Mootha, V.K. et al. PGC-1α–responsive genes involved in oxidative phosphorylation are coordinately downregulated in human diabetes. Nat. Genet. 34, 267–273 (2003).
25. Uronis, J.M. et al. Histological and molecular evaluation of patient-derived colorectal cancer explants. PLoS ONE 7, e38422 (2012).
26. Huang, W., Sherman, B.T. & Lempicki, R.A. Systematic and integrative analysis of large gene lists using DAVID bioinformatics resources. Nat. Protoc. 4, 44–57 (2009).
27. Martelli, M.L. et al. Exploiting orthologue diversity for systematic detection of gain-of-function phenotypes. BMC Genomics 9, 254 (2008).
28. Conway, T. et al. Xenome—a tool for classifying reads from xenograft samples. Bioinformatics 28, i172–i178 (2012).
29. Salazar, R. et al. Gene expression signature to improve prognosis prediction of stage II and III colorectal cancer. J. Clin. Oncol. 29, 17–24 (2011).
©20
15N
atu
re A
mer
ica,
Inc.
All
rig
hts
res
erve
d.
� ADVANCE ONLINE PUBLICATION Nature GeNetics
a n a ly s i s
30. Popovici, V. et al. Identification of a poor-prognosis BRAF-mutant-like population of patients with colon cancer. J. Clin. Oncol. 30, 1288–1295 (2012).
31. De Sousa, E. & Melo, F. et al. Methylation of cancer-stem-cell-associated Wnt target genes predicts poor prognosis in colorectal cancer patients. Cell Stem Cell 9, 476–485 (2011).
32. Oh, S.C. et al. Prognostic gene expression signature associated with two molecularly distinct subtypes of colorectal cancer. Gut 61, 1291–1298 (2012).
33. Jorissen, R.N. et al. Metastasis-associated gene expression changes predict poor outcomes in patients with Dukes stage B and C colorectal cancer. Clin. Cancer Res. 15, 7642–7651 (2009).
34. Smith, J.J. et al. Experimentally derived metastasis gene expression profile predicts recurrence and death in patients with colon cancer. Gastroenterology 138, 958–968 (2010).
35. Loboda, A. et al. EMT is the dominant program in human colon cancer. BMC Med. Genomics 4, 9 (2011).
36. Uhlen, M. et al. Towards a knowledge-based Human Protein Atlas. Nat. Biotechnol. 28, 1248–1250 (2010).
37. Zhang, B. et al. Proteogenomic characterization of human colon and rectal cancer. Nature 513, 382–387 (2014).
38. Gutman, D.A. et al. Cancer Digital Slide Archive: an informatics resource to support integrated in silico analysis of TCGA pathology data. J. Am. Med. Inform. Assoc. 20, 1091–1098 (2013).
39. Suárez, J. et al. Pathologic response assessed by Mandard grade is a better prognostic factor than down staging for disease-free survival after preoperative radiochemotherapy for advanced rectal cancer. Colorectal Dis. 10, 563–568 (2008).
40. Budinska, E. et al. Gene expression patterns unveil a new level of molecular heterogeneity in colorectal cancer. J. Pathol. 231, 63–76 (2013).
41. Yang, A.D. et al. Chronic oxaliplatin resistance induces epithelial-to-mesenchymal transition in colorectal cancer cell lines. Clin. Cancer Res. 12, 4147–4153 (2006).
42. Merlos-Suárez, A. et al. The intestinal stem cell signature identifies colorectal cancer stem cells and predicts disease relapse. Cell Stem Cell 8, 511–524 (2011).
43. Medema, J.P. Cancer stem cells: the challenges ahead. Nat. Cell Biol. 15, 338–344 (2013).
44. Sautès-Fridman, C. et al. Tumor microenvironment is multifaceted. Cancer Metastasis Rev. 30, 13–25 (2011).
45. Micke, P. & Ostman, A. Exploring the tumour environment: cancer-associated fibroblasts as targets in cancer therapy. Expert Opin. Ther. Targets 9, 1217–1233 (2005).
46. Torres, S. et al. Proteome profiling of cancer-associated fibroblasts identifies novel proinflammatory signatures and prognostic markers for colorectal cancer. Clin. Cancer Res. 19, 6006–6019 (2013).
47. Chargari, C., Clemenson, C., Martins, I., Perfettini, J.L. & Deutsch, E. Understanding the functions of tumor stroma in resistance to ionizing radiation: emerging targets for pharmacological modulation. Drug Resist. Updat. 16, 10–21 (2013).
48. Saigusa, S. et al. Cancer-associated fibroblasts correlate with poor prognosis in rectal cancer after chemoradiotherapy. Int. J. Oncol. 38, 655–663 (2011).
49. Schneider, S. et al. Gene expression in tumor-adjacent normal tissue is associated with recurrence in patients with rectal cancer treated with adjuvant chemoradiation. Pharmacogenet. Genomics 16, 555–563 (2006).
©20
15N
atu
re A
mer
ica,
Inc.
All
rig
hts
res
erve
d.
Nature GeNeticsdoi:10.1038/ng.3224
ONLINE METHODSAssembly of the TCGA data set. Level 3 TCGA RNA-seq data for both colon (337) and rectum (113) adenocarcinomas were downloaded from the TCGA Data Portal (April 2013 release; see URLs). RNA profiles generated by both the Genome Analyzer (GA) and HiSeq Illumina platforms were acquired. We independently assembled GA and HiSeq RNA-seq expression estimation by expectation-maximization (RSEM) expression matrices, thresholding extremely low RSEM values to one and log2 transforming all data. To aggre-gate the GA and HiSeq matrices, we took advantage of 19 samples analyzed on both platforms to perform gene-level scaling. We applied the scaling only for transcripts matching 2 criteria: (i) RSEM above 5 in at least 50 samples (threshold chosen by analyzing the distribution of the RSEM values of all genes) and (ii) Spearman correlation above 0.7 in the 18 common samples; 20,531 unique genes met these criteria. For each gene, the scale factor for scaling GA data toward HiSeq data was defined as follows:
Scale factor RSEM RSEMi HiSeq, GA,= −i i
where
RSEMHiSeq,i
is the average expression in the HiSeq data set for gene i and
RSEMGA,i
is the average expression in the GA data set for gene i. The scale factor was summed to the GA RSEM values to merge this data set with the HiSeq data set. The 450-sample data set was finally filtered to remove genes with extremely low variability in expression (below the 10th percentile of the s.d. of all genes)13. The final 450-sample mRNA data set is available in the Bioconductor experi-ment data package TCGAcrcmRNA at Bioconductor (see URLs).
NTP implementation and signature adaptation. NTP-based classifi-cation14 was performed using scripts from the GenePattern Bioportal50 (see URLs). The threshold chosen for significant classification of a sample was Benjamini-Hochberg–corrected false discovery rate (FDR) <0.2, as previously reported4.
Lists of CRCA, CCS and CCMS signature genes were obtained from the supplementary tables published by the respective authors3–5. These lists were further adapted to NTP analysis as follows. The CRCA and CCS signatures both included, for each gene, a prediction analysis of microarrays (PAM) score, reflecting positive or negative correlation between gene expression and each class51. From these signatures, we selected only genes positively associated with each class; when a gene had a positive PAM score for more than one class, it was assigned to the class with the highest PAM score only if the dif-ference between the highest and second highest PAM values was greater than 0.1. In the case of the CCMS signature, we started from the 1,108-gene list provided in supplementary table S10 of ref. 5, which reported, for every gene, fold-change (log2 ratio) values and corresponding P values for expression in samples of each class versus the remaining samples; selected genes were univo-cally assigned to one class by two criteria: (i) the positive log2 ratio in the class was the highest and greater by at least 0.2 than the second highest ratio and (ii) the adjusted P value in the same class was the minimum between the adjusted P values of all the other classes with a positive log2 ratio. For the CRCA and CCMS classifiers, the authors also provided restricted signatures, respectively, of 30 and 57 genes. We tested these classifiers with NTP and observed a much lower rate of significant classification.
Subtype reconciliation across the CCS, CRCA and CCMS classifiers. We analyzed the correspondences between subtype assignments by the three classifiers using Fisher’s exact test to obtain odds ratios and P values and sub-class mapping using the SubMap R package52. Both approaches highlighted the same subtype overlaps, as reported in Supplementary Table 2. Subtype correspondences were visualized with Caleydo15 for the samples that were significantly classified by all three signatures.
GSEA analysis. GSEA software was downloaded from the Broad Institute GSEA portal (see URLs) and applied using as gene sets all the lists of subtype-specific signature genes from the CRCA, CCS and CCMS classifiers. An additional tested list was the SSM signature. For the analysis, the GSE39397 data set was partitioned into four subgroups: EPCAM+ cells (epithelial CRC cells), CD45+ cells (leukocytes), CD31+ cells (endothelial cells) and FAP+ cells (CAFs). GSEA was then carried out for all gene lists on the comparisons between EPCAM+ cells and each of the other subgroups, using signal-to-noise ratios for gene ranking. The significance of enrichment was estimated using 1,000 gene permutations.
Affymetrix human-specific content descriptor file. To Identify probes on the Affymetrix Human Genome U133 Plus 2.0 array cross-hybridizing with mouse RNA, we analyzed the GSE49353 data set, in which mouse RNA was hybrid-ized on this platform53, at both probe set and single-probe levels, comparing the signals with those obtained for 27 human CRC samples from GSE35144 (ref. 25); in the case of multiple PDXs derived from the same tumor, we selected the PDX with the highest number of passages in mice. We considered probes to be cross-hybridizing if they displayed on mouse RNA a signal greater than the 25th percentile (190.7 signal intensity) of their average signal in the 27 human CRC samples. In total, 265,699 cross-hybridizing probes were identified and flagged for removal, together with all mismatch probes. We then generated a new content descriptor file (CDF) for the Human Genome U133 Plus 2.0 array, which we called H-spec. To do this, we univocally mapped probes to single Entrez genes using the BrainArray standard CDF54,55, which takes advantage of systematic mapping of the probes to human Entrez transcripts to remove potentially nonspecific probes. After assigning each probe to an Entrez gene, we built the new probe sets, accepting only probe sets with at least three probes. In total, 16,985 probe sets could be built, of which only 3,400 had fewer than 5 probes. The H-spec CDF is available on Bioconductor as hspeccdf.
Identification by Affymetrix arrays of genes lost upon PDX propagation of CRCs. To identify genes whose expression was lost upon propagation of CRC tissues in the derived PDXs, we required that they meet three criteria: (i) the gene was expressed in the human CRC sample, that is, its signal was above the 50th percentile of the signals of all probe sets in that sample; (ii) the gene was not expressed in the matched PDX derivative, that is, its signal was below the 50th percentile as described above; and (iii) the expression level was at least twofold lower in the PDX derivative (to avoid a call for genes that were barely expressed in human CRC samples). Considering all 27 tumor-PDX pairs from the GSE35144 data set, to call a gene as ‘lost in PDX’, we required a lost call in at least 5 pairs.
Identification by Illumina arrays of genes lost upon PDX propagation of CRCs. From the GSE56695 Illumina HumanHT12-V4 expression data set, we used data from two mouse samples, one of CRC and one of endothe-lial cells, to identify cross-hybridizing probes. In this case, the longer, 50-mer probes were much more species specific when challenged against mouse mRNA (Supplementary Fig. 4). In total, 1,776 probes with a sig-nificant detection P value (<0.01) and a signal above 350 in at least one mouse sample were defined as cross-reactive and removed from further analyses (Supplementary Fig. 5). To identify genes whose expression was lost upon PDX propagation, we used from the same data set the non- normalized expression profiles of four matched human CRC–PDX derivative samples. Having a much higher fraction of non-expressed genes out of the over 45,000 probes passing the specificity filter, in the case of Illumina data, we considered as the threshold for detected expression the 70th percentile signal in each sample. On the basis of this threshold, a gene was considered lost in PDX if it was detected in the human CRC sample, not detected in the matched PDX sample and had at least twofold lower expression in the PDX than in the matched tumor. Considering all 4 pairs, 295 unique tran-scripts were called ‘lost in PDX’, being lost in 2 or more pairs. Of these, 163 were previously identified in the Affymetrix analysis. Functional analysis by DAVID EASE accordingly highlighted enrichment in the expression of mesenchymal genes (Supplementary Table 10). Because of the limited size of the data set, we assigned tumors to a CRC class by calculating the average expression of each signature.
©20
15N
atu
re A
mer
ica,
Inc.
All
rig
hts
res
erve
d.
Nature GeNetics doi:10.1038/ng.3224
Analysis of RNA-seq data from PDX samples. RNA-seq profiles of nine PDX samples derived from three CRC cases, containing RPM counts univocally assigned to human and mouse transcripts by the Xenome tool28, were obtained from the Supplementary Table 1 (human expression values) and 2 (mouse expression values) of the work published by Chou and colleagues11. For our analyses, we selected those samples in which human stromal cells were not maintained in the PDX (selected sample IDs: D61540.T2.X1, D61540.X2, P2726.Ov.X1, P2726.Ov.X2, D55949.X2, D55949.X3F, D55949.X3M, D55949.X4 and D55949.X7). The data tables already contained orthologous gene anno-tations. For the analyses shown in Figure 3a–d, we averaged, for each gene, RPM values for PDX samples derived from the same parent tumor and then calculated a global average. For subsequent analyses, we reverse engineered the RPM data to obtain absolute mouse and human counts for each orthologous pair. To this end, we exploited the fact that, by definition, in RPM scaling the lowest expression value greater than zero (minRPM >0) in one sample corre-sponds to an absolute read count of 1 divided by the total number of reads in that sample, multiplied by one million. Therefore, the absolute read counts of any gene in that sample can easily be calculated by dividing the gene RPM by the minRPM >0 of the sample. Such calculation was applied to all samples and yielded only integer values, which confirmed our approach. Similarly to RPM data, we averaged the gene read counts of PDX samples derived from the same parent tumor and then calculated a global average. To then estimate at the gene level the fraction of transcripts deriving from stroma (mouse), we divided the absolute number of mouse reads by the sum of the human and mouse reads in each samples. To avoid erroneous ratios for genes with low expression, we defined as the threshold for transcript detection, respectively, 50 and 5 reads per transcript in the human and mouse profiles.
A second useful calculation that we could do on the basis of this principle is total read counts, obtained by dividing 1 million by minRPM >0. In this way, it is possible to compare, for the same PDX sample, the total numbers of human and mouse reads corresponding to, respectively, the neoplastic and stromal fractions. Therefore, to globally quantify stromal contribution to the PDX transcriptome, one can calculate the percentage of mouse reads out of the total (human and mouse) reads. This calculation confirmed that in all PDX samples the estimated stromal transcript fraction did not exceed 5%, confirming pub-lished information11. To evaluate the significance of enrichment for genes with high stromal contribution, we conducted ‘classic’ Gene Signature Enrichment Analysis on the percentage of mouse reads out of the total (human and mouse) reads for all the gene signatures involved in the analysis.
Compendium of genes not expressed by CRC cells in PDX samples. To generate a consensus list of genes not expressed by tumor epithelial cells, we integrated the information from array hybridization and RNA-seq data obtained from PDX samples. The largest cohort of samples was the one profiled with Affymetrix arrays (GSE35144; n = 27). We considered as not expressed in this data set genes whose signal, in data processed with the H-Spec CDF, was never above the median of all genes in any sample. In the case of the Illumina GSE56695 data set, containing many more negative probes, the threshold for detected expression was the 70th-percentile signal in each sample. Genes with signal below this threshold in all four samples were considered to not be expressed in this data set. In PDX RNA-seq data, genes were considered to not be expressed if their human RPM values were always below the 30th percentile in each of the nine samples. Understandably, not all genes were explored by all platforms. To merge the results of the three data sets, we assigned priority to the larger Affymetrix data set: a first set of genes was therefore called not expressed by cancer cells if the genes were never detected in the Affymetrix data set and were also never detected or explored by the other two platforms. For the genes not explored by Affymetrix arrays, we required that the genes were concordantly called never expressed by cancer cells in both Illumina and RNA-seq data.
Analysis on the Human Protein Atlas database. We downloaded the full database from the Human Protein Atlas portal (Version 12; see URLs) and selected only antibodies with reported ‘supportive’ validation that were used for immunohistochemistry on CRC samples, for a total of 2,934 genes. Each antibody was used to stain a variable number of CRC samples, typically around 10. In some cases, more than one antibody was used for the same gene.
For each antibody in each sample, the immunohistochemistry signal was provided by the curators as semiquantitative scores: ‘negative’, ‘weak’, ‘moderate’ and ‘high’ signal. Most notably, scoring for immunohistochem-istry signal was exclusively relative to cancer cells, not considering staining of stromal cells. We considered a protein to be ‘detected’ in one sample if its immunohistochemistry score was not ‘negative’. We then calculated, for each gene, the fraction of samples in which the protein was detected, consider-ing all supportive antibodies used for than gene. The resulting calculations were used to evaluate the fraction of positive CRC samples for the SSM and non-SSM gene signatures.
Immunohistochemistry and in situ hybridization on CRC samples. Formalin-fixed, paraffin-embedded tissue sections (4 µm thick) were collected on Superfrost plus slides. Immunohistochemistry reactions were performed using an automated slide processing platform (Ventana BenchMark XT AutoStainer, Ventana Medical Systems). The following primary antibodies were used: rabbit antibody to Map1b (polyclonal, Sigma-Aldrich, HPA022275; 1:700 dilution; antigen retrieval: prediluted pretreatment solution Cell Conditioning 1 for 30 min); rabbit antibody to Tagln (polyclonal, Sigma-Aldrich, HPA019467; 1:100 dilution; antigen retrieval: prediluted pretreat-ment solution Cell Conditioning 1 for 30 min) and rabbit antibody to Zeb1 (polyclonal, Sigma-Aldrich, HPA027524; 1:1,200 dilution; antigen retrieval: prediluted pretreatment solution Cell Conditioning 1 for 30 min). RNA in situ hybridization for ZEB1 mRNA was performed using the RNAScope 2.0 RED Assay (310036, ACD), according to the manufacturer’s protocol. Briefly, tissue sections were deparaffinized with xylene (Sigma-Aldrich, 33817) and 100% ethanol (Bio-Optica, 06-10077E) and then pretreated with “ready-to-use” reagents (ACD, 310020). ZEB1-specific oligonucleotide probe (four drops) was incubated for 2 h at 40 °C in the Hybex oven (ACD). After signal amplification, each section was hybridized with alkaline phosphatase (AP)-labeled probe and stained with RED solution B and RED solution A at a ratio of 1:60 (ACD, 310034). After counterstaining with Gill’s hematoxylin (Sigma, GHS1128-4L), slides were dried at 60 °C for 15 min and mounted using Ecomount (BioCare Medical, EM897L). Slides were imaged with a bright-field microscope (Leica DMLB with camera ICC 50 HD).
Definition of stromal cell–specific signatures. To identify genes specifically expressed in three CRC stromal cell subpopulations, i.e., CAFs, leukocytes and endothelial cells, we analyzed the GSE39397 data set. In the case of multiple probe sets for the same gene symbol, we selected those with the highest aver-age expression. To avoid selecting genes also expressed by neoplastic cells, we performed the analysis using only the 4,434 genes previously defined here as not expressed by epithelial cells. Differential expression was assessed by applying the Mulcom test, an inferential parametric test designed to compare the mean of each of multiple experimental groups with the mean of a control group based on Dunnett’s test56. To generate gene signatures, the test was run three times comparing each stromal subcellular population against the oth-ers and epithelial cells. In this way, each gene was evaluated for cell-specific expression in all subpopulations. The test parameters m and T were adjusted to 0.3 and 2 to obtain global FDR <0.05. The three gene signatures were each defined by selecting genes positively associated with one cell subgroup in all comparative tests.
Survival analysis. Affymetrix gene expression profiles from 290 primary CRC surgical specimens were downloaded from GEO (GSE14333)33. In the case of genes with multiple probe sets, we selected those with higher average levels of expression. The Cox regression hazard model and Kaplan-Meier analyses were conducted with the R Bioconductor ‘survival’ package (see URLs)57. Statistics were run as a computational pipeline on the entire data set so that the investi-gator had no direct view of the single-case outcome or of its prediction.
50. Reich, M. et al. GenePattern 2.0. Nat. Genet. 38, 500–501 (2006).51. Tibshirani, R., Hastie, T., Narasimhan, B. & Chu, G. Diagnosis of multiple cancer
types by shrunken centroids of gene expression. Proc. Natl. Acad. Sci. USA 99, 6567–6572 (2002).
52. Hoshida, Y., Brunet, J.P., Tamayo, P., Golub, T.R. & Mesirov, J.P. Subclass mapping: identifying common subtypes in independent disease data sets. PLoS ONE 2, e1195 (2007).
©20
15N
atu
re A
mer
ica,
Inc.
All
rig
hts
res
erve
d.
Nature GeNeticsdoi:10.1038/ng.3224
53. Hollingshead, M.G. et al. Gene expression profiling of 49 human tumor xenografts from in vitro culture through multiple in vivo passages—strategies for data mining in support of therapeutic studies. BMC Genomics 15, 393 (2014).
54. Dai, M. et al. Evolving gene/transcript definitions significantly alter the interpretation of GeneChip data. Nucleic Acids Res. 33, e175 (2005).
55. Sandberg, R. & Larsson, O. Improved precision and accuracy for microarrays using updated probe set definitions. BMC Bioinformatics 8, 48 (2007).
56. Isella, C., Renzulli, T., Cora, D. & Medico, E. Mulcom: a multiple comparison statistical test for microarray data in Bioconductor. BMC Bioinformatics 12, 382 (2011).
57. Gentleman, R.C. et al. Bioconductor: open software development for computational biology and bioinformatics. Genome Biol. 5, R80 (2004).