Field cancerisation in colorectal cancer - Warwick WRAP
292
warwick.ac.uk/lib-publications A Thesis Submitted for the Degree of PhD at the University of Warwick Permanent WRAP URL: http://wrap.warwick.ac.uk/87284 Copyright and reuse: This thesis is made available online and is protected by original copyright. Please scroll down to view the document itself. Please refer to the repository record for this item for information to help you to cite it. Our policy information is available from the repository home page. For more information, please contact the WRAP Team at: [email protected]
-
Upload
khangminh22 -
Category
Documents
-
view
4 -
download
0
Transcript of Field cancerisation in colorectal cancer - Warwick WRAP

warwick.ac.uk/lib-publications
A Thesis Submitted for the Degree of PhD at the University of Warwick
Permanent WRAP URL:
http://wrap.warwick.ac.uk/87284
Copyright and reuse:
This thesis is made available online and is protected by original copyright.
Please scroll down to view the document itself.
Please refer to the repository record for this item for information to help you to cite it.
Our policy information is available from the repository home page.
For more information, please contact the WRAP Team at: [email protected]

1 | P a g e
Field cancerisation in colorectal
cancer
By Abhilasha Patel
MA (Hons) Cantab, MB BChir, MMedEd, MRCS
A thesis submitted in partial fulfilment of the requirements for the
degree of Doctor of Medicine
Division of Translational and Systems Medicine, Warwick Medical
School, University of Warwick
December 2015

2 | P a g e
For my boys: Taran and Tilak

3 | P a g e
Table of Contents
Abbreviations………………………………………………….. 12
List of figures………………………………………………….. 19
List of tables…………………………………………………… 21
Acknowledgements……………………………………………. 22
Declaration…………………………………………………….. 23
List of publications……………………………………………. 23
Abstract………………………………………………………... 24
Section 1. Introduction………………………………………... 25
1.1. Colorectal cancer epidemiology…………………………………………….... 26
1.2 Anatomy of the colon…………………………………………………………. 27
1.2.1. The colonic wall…………………………………………………… 27
1.2.2. The stem cell compartment……………………………………… 28
1.2.3 Blood supply of the colon………………………………………….. 29
1.3. Staging and prognosis of colorectal cancer…………………………………... 30
1.4 Risk factors for colorectal cancer……………………………………………... 33
1.4.1 Genetic predisposition to CRC……………………………………... 33
1.4.1.1. FAP……………………………………………………... 34
1.4.1.2. HNPCC…………………………………………………. 36
1.4.2. Environmental risk factors………………………………………… 38

4 | P a g e
1.4.2.1. Diet……………………………………………………… 38
1.4.2.2. Physical activity and obesity…………………………… 39
1.4.2.3. Cigarette smoking and alcohol consumption…………… 39
1.4.3. Inflammatory bowel disease……………………………………….. 40
1.4.4. Previous colorectal cancer…………………………………………. 40
1.5. Pathogenesis of colorectal cancer……………………………………………. 41
1.5.1. Evidence to support polyps as precursors to colorectal cancer…… 42
1.5.2. The adenoma-carcinoma sequence ................................................... 43
1.5.3. Chromosomal instability…………………………………………… 47
1.5.4. DNA mismatch repair defects……………………………………... 48
1.5.5. CpG island methylator subtype…………………………………… 50
1.5.6. Newer emerging theories…………………………………………... 50
1.6. Screening and treatment of colorectal cancer………………………………… 52
1.6.1. FOBT……………………………………………………………… 52
1.6.2. Flexible sigmoidoscopy…………………………………………… 53
1.6.3. Colonoscopy……………………………………………………… 54
1.6.4. Emerging screening modalities…………………………………… 54
1.7. Cancer biology………………………………………………………………... 55
1.7.1. Multi-hit Hypothesis of cancer…………………………………….. 56
1.7.2. The stem cell theory………………………………………………... 58
1.7.3. Top down or bottom up histogenesis……………………………… 61
1.7.4. Other cancer theories……………………………………………… 62

5 | P a g e
1.7.4.1 Tissue Organisation theory………………………………. 62
1.7.4.2 Chromosomal theory…………………………………….. 62
1.7.4.3. Metabolic theory………………………………………… 63
1.8. The role of the tumour microenvironment and supporting stroma…………… 63
1.8.1. Tumour infiltrating cells…………………………………………… 64
1.8.2. Angiogenesis……………………………………………………… 66
1.8.3. Extracellular matrix………………………………………………... 66
1.8.4. Growth Factors…………………………………………………….. 68
1.8.4.1. Epidermal growth factor (EGF) ………………………… 68
1.8.4.2. Vascular endothelial growth factor (VEGF)……………. 69
1.8.4.3. Transforming growth factor β (TGF- β)………………… 69
1.8.4.4. Insulin like growth factors……………………………… 70
1.8.4.5. Fibroblast growth factors………………………………... 70
1.9 Genetic profiling in CRC……………………………………………………… 77
1.9.1. Techniques for genetic profiling …………………………………... 77
1.9.2. Micro-array analysis……………………………………………….. 78
1.10. Field cancerisation…………………………………………………………... 80
1.10.1 Field defect in inflammatory bowel disease……………………… 81
1.10.2. Mechanism for field cancerisation ……………………………… 82
1.10.3. Field cancerisation in CRC……………………………………… 85
1.11. Summary…………………………………………………………………… 85
1.12. Research hypothesis, aims and objectives…………………………………... 86
1.12.1. Research hypothesis……………………………………………… 86

6 | P a g e
1.12.2. Research aims…………………………………………………… 86
1.12.3. Research objectives……………………………………………… 86
Section 2: Materials and methods…………………………… 88
2.1. Ethical approval………………………………………………………………. 89
2.2. Setting and participants………………………………………………………. 89
2.2.1. At endoscopy………………………………………………………. 89
2.2.2. At surgery………………………………………………………….. 90
2.2.3. Sample processing………………………………………………… 91
2.2.4. Collection of blood samples……………………………………… 91
2.2.5. Study design………………………………………………………. 91
2.3. Micro-array methods…………………………………………………………. 92
2.3.1. Participants……………………………………………………....... 92
2.3.2. Experimental design……………………………………………….. 93
2.3.3. Isolation, purification and quantification of RNA…………………. 94
2.3.4. Genechip micro-array assay method………………………………. 94
2.3.5. Micro-array data analysis…………………………………………. 95
2.4 Gene expression………………………………………………………………. 97
2.4.1. RNA extraction and processing…………………………………… 97
2.4.2. Complimentary DNA (cDNA) synthesis…………………………. 98
2.4.3. Quantitative real time polymerase chain reaction (qRT-PCR)……. 98
2.5. Protein expression……………………………………………………………. 99
2.5.1. Protein extraction…………………………………………………. 99

7 | P a g e
2.5.2. Western blot analysis………………………………………………. 100
2.6. Serum analysis……………………………………………………………….. 100
2.7. Statistical analysis……………………………………………………………. 101
Section 3: Colonic polyps are biomarkers of field
cancerisation in colorectal cancer…………………………… 102
3.1. Introduction, aims and objectives…………………………………………..... 103
3.1.1. Introduction………………………………………………………... 103
3.1.2. Aims and objectives……………………………………………….. 105
3.2. Materials and methods………………………………………………………... 105
3.2.1. Data collection…………………………………………………….. 107
3.2.2. Statistical data analysis……………………………………………. 107
3.3. Results………………………………………………………………………… 108
3.3.1. Characteristics of patients with synchronous polyps at
presentation ………………………………………………………………. 111
3.3.2. Presence of synchronous adenomas indicates future risk of
metachronous adenomas…………………………………………………. 114
3.3.3. Local recurrence is not affected by presence of adenomas ………..116
3.3.4. Overall and disease free survival do not differ with adenomas…….. 117
3.4 Discussion…………………………………………………………………...... 119
3.5. Summary and conclusions……………………………………………………. 123
Chapter 4: Characterisation of the gene expression
profile of the mucosal field around colorectal cancer and
polyps………………………………………………………….. 124

8 | P a g e
4.1. Introduction………………………………………………………………...... 125
4.1.1. Gene expression profiling in colorectal cancer……………………. 125
4.1.2. Aims and objectives……………………………………………….. 127
4.2. Materials and methods………………………………………………………. 128
4.2.1. Setting and participants
4.2.2. Data Analysis
4.3. Results………………………………………………………………………… 130
4.3.1. The global gene expression profile of patients with adenomas
and colorectal cancer differs…………………………………………….. 130
4.3.2. Multiple signalling pathways are dysregulated in the colonic
field (DAVID analysis)………………………………………………… 131
4.3.2.1. Cancer versus control…………………………………… 131
4.3.2.2. Polyps versus control…………………………………… 131
4.3.2.3. Polyp versus cancer…………………………………….. 131
4.3.2.4. Selection of genes for validation and further enquiry…. 133
4.3.3. Multiple differences in cellular component, molecular function
and biological processes in the colonic field (PANTHER analysis)…….. 135
4.3.3.1. Intersect genes………………………………………….. 135
4.3.3.2. PANTHER analysis of union genes…………………….. 139
4.3.3.3. Cancer versus control…………………………………… 139
4.3.3.4. Polyp versus control……………………………………. 142
4.3.3.5. Polyp versus cancer…………………………………….. 146

9 | P a g e
4.3.3.6. Several cellular processes are dysregulated in the
colonic field……………………………………………………
4.3.3.6.1. Immune response……………………………. 151
4.3.3.6.2. Metabolism………………………………… 151
4.3.3.6.3. Cell-cell interaction………………………… 152
4.3.3.6.4. RNA transcription……………………………. 153
4.4 Discussion……………………………………………………………………... 154
4.4.1. Immune response………………………………………………... 155
4.4.2. Metabolic process…………………………………………………. 156
4.4.3 Epithelial-mesenchymal transition…………………………………. 157
4.4.4. Cell proliferation…………………………………………………… 158
4.4.5. Field cancerisation ………………………………………………… 159
4.4.6. Limitations……………………………………………………….... 160
4.5. Summary and conclusions…………………………………………… ………. 161
Chapter 5: Differences in gene expression in the colonic
field around colorectal cancer and polyps ………………...... 162
5.1 Introduction, aims and objectives…………………………………………….. 163
5.1.1. Introduction……………………………………………………….. 163
5.1.2. Aims and objectives………………………………………………. 167
5.2. Materials and Methods………………………………………………………. 168
5.2.1 Setting and participants…………………………………………. 168
5.2.2. Experimental methods……………………………………………. 170
5.2.3. Statistical analysis………………………………………………… 170

10 | P a g e
5.3. Results……………………………………………………………………….. 172
5.3.1. Mucin expression is altered in colorectal cancer but GADD45B
expression is no different ………………………………………………. 172
5.3.2. CXCL2, S100P and FUT2 are dysregulated in colorectal cancer…. 176
5.3.3 There is a gradient in gene expression along the colon
comparing caecum to rectum…………………………………………….. 180
5.3.4. Serum CXCL2 levels do not differ between the three groups…….. 181
5.4 Discussion…………………………………………………………………….. 182
5.5. Summary and conclusions……………………………………………………. 187
Chapter 6: The role of fibroblast growth factors
in field cancerisation in colorectal cancer…………………… 189
6.1. Introduction, aims and objectives…………………………………………. 190
6.1.1. Introduction……………………………………………………… 190
6.1.2. Aims and objectives…………………………………………….. 192
6.2. Materials and methods…………………………………………………….. 193
6.2.1. Setting and participants…………………………………………. 193
6.2.2. Experimental methods………………………………………….. 195
6.2.3. Statistical analysis ………………………………………………. 196
6.3. Results………………………………………………………………………. 197
6.3.1. FGF7 is upregulated in the colonic field……………………….. 197
6.3.2. The FGF7-FGFR2 signalling axis is dysregulated in tumour
tissue…………………………………………………………………….. 198
6.3.3. FGF7 and FGFR2 gene expression are no different in patients

11 | P a g e
with polyps………………………………………………………………... 199
6.3.4. The FGF7-FGFR2 signalling axis is dampened in colorectal
cancer tissue……………………………………………………………… 200
6.3.5. FGF7 serum concentration does not differ between cancer and
control subjects…………………………………………………………… 201
6.3.6. FGF19 is expressed at low levels in colonic tissue……………….. 202
6.3.7. FGF19 serum levels are lower in colorectal cancer patients
with right sided tumours………………………………………………… 202
6.4. Discussion…………………………………………………………………. 204
6.5. Summary and conclusions………………………………………………... 209
Chapter 7: Discussion………………………………………… 210
7.1. Introduction………………………………………………………………… 211
7.2. Field cancerisation in colorectal cancer – parallels between inflammatory
bowel disease and sporadic colorectal cancer…………………………………. 211
7.3. Existing scientific evidence to support field cancerisation………………. 212
7.4. A candidate free approach to identify novel genes………………………. 213
7.5. Implications of the findings of this thesis………………………………… 214
7.6. Limitations…………………………………………………………………. 216
7.7. Future directions…………………………………………………………… 217
7.8. Final conclusion……………………………………………………………. 219
Bibliography…………………………………………………. 220
Appendices……………………………………………………... 282

12 | P a g e
Abbreviations
dCT Delta threshold cycle
mL millilitres
µg micrograms
μm Micrometres
ng nanograms
nm nanometres
V Volt
AAPC Attenuated Adenomatosis Polyposis Coli
ACF Aberrant crypt focus
AJCC American Joint Committee on Cancer
Akt Protein kinase B
APC Adenomatous Polyposis Coli
AXIN2 Axis inhibitory protein 2
β-actin Beta-actin
BCL2 B-cell lymphoma 2
BMP3 Bone morphogenetic protein 3
BRAF B-raf proto-oncogene
CAF Cancer associated fibroblasts
CCL2 (C-C motif) ligand 2
CD8 Cluster of differentiation
CDKN2A Cyclin-dependent kinase inhibitor 2A

13 | P a g e
CEA Carcinoembryonic antigen
CGH Comparative genomic hybridisation
CIMP CpG island methylator phenotype
CpG Cysteine-phosphate-guanine
CRC Colorectal cancer
CSC Cancer stem cell
CT Computed tomography
CXCL2 Growth related oncogene β (GRO- β)
CXCL12 C-X-C motif ligand 12
CYP7A1 Cholesterol 7 alpha-hydroxylase
DACH1 Dachshund Family Transcription Factor 1
DALMs Dysplasia associated lesion or mass
DCC Deleted in colon cancer
DEG Differentially expressed gene
DFS Disease free survival
DNA Deoxyribonucleic acid
ECM Extracellular matrix
EGF Epidermal growth factor
EGFR Epidermal growth factor receptor
EMT Epithelial Mesenchymal Transition
Eps8 Epidermal growth factor receptor substrate 8
Erk 1/2 Extracellular signal-regulated kinase

14 | P a g e
FaMISHED Food and Fermentation using Metagenomics in Health and Disease
FAP Familial Adenomatous Polyposis
FGF Fibroblast growth factor
FGF2 Fibroblast growth factor 2
FGF7 Fibroblast growth factor 7
FGF15 Fibroblast growth factor 15
FGF19 Fibroblast growth factor 19
FGF21 Fibroblast growth factor 21
FGF23 Fibroblast growth factor 23
FGFR Fibroblast growth factor receptor
FGFR2 Fibroblast growth factor receptor 2
FGFR4 Fibroblast growth factor receptor 4
FISH Fluorescence in situ hybridisation
FOBT Faecal occult blood test
FRS2α Fibroblast receptor substrate 2α
FUT2 Fucosyltransferase 2
GADD45B Growth arrest DNA damage inducible 45, subunit B
GM-CSF Granulocyte macrophage stimulating factor
HCC Hepatocellular carcinoma
HIF-1α Hypoxia-inducible factor 1α
hMLH1 MutL homolog 1
hMSH2 MutS homolog 2
hMSH6 MutS homolog 6

15 | P a g e
HNPCC Hereditary Non-Polyposis Colorectal Cancer
HOXB9 Homeobox B9
HS Heparan sulfate
IBD Inflammatory bowel disease
IBD-CRC Colorectal cancer associated with inflammatory bowel disease
IGF Insulin like growth factor
IL-1β Interleukin 1β
IL-4 Interleukin 4
IL-7 Interleukin 7
IL-13 Interleukin 13
IRF-1 Interferon regulatory factor 1
IRF-2 Interferon regulatory factor 2
KGF Keratinocyte growth factor
KRAS Kirsten rat sarcoma virus
LIMMA LmFT function (Bioconductor R package)
LOH Loss of heterozygosity
LR Local recurrence
MA Metachronous adenoma
MAP MYH-associated polyposis
MAPK Mitogen activated protein kinase
MDT Multidisciplinary team
ME1 Malic enzyme 1

16 | P a g e
ME2 Malic enzyme 2
MGMT O-6-Methylguanine-DNA Methyltransferase
MIP2 Macrophage inhibitory protein 2
MMP Matrix Metalloproteinase
MNM Macroscopically normal mucosa
MP Metachronous polyp
MSI Microsatelite instability
MSI-H Microsatelite stability - high
MSI-L Microsatelite stability – low
MUC2 Mucin 2
MUC5AC Mucin 5, subunit AC
NF-Kappa B Nuclear factor kappa B
OS Overall survival
PCR Polymerase chain reaction
PDGF Platelet derived growth factor
PET-CT Positron emission tomography – computed tomography
PGE2 Prostaglandin E2
PGF Placenta growth factor
PI3K Phosphatidylinositol 3-kinase
PLS3 Plastin 3
PSCA Prostate stem cell antigen
qRT-PCR Quantitative real time polymerase chain reaction

17 | P a g e
RAF Rapidly accelerated fibrosarcoma
RAGE Receptor for advanced glycation end products
RAS Rat sarcoma virus
RIPA Radioimmunoprecipitation
RNA Ribonucleic acid
ROS Reactive oxygen species
RR Robust regression function (Bioconductor R package)
S100P S100 calcium binding protein P
SA Synchronous adenoma
SDF-1 Stroma derived factor 1
SDS-PAGE Sodium dodecyl sulfate polyacrylamide gel electrophoresis
SIR Standardised incidence ratio
siRNA Synthetic RNA duplex
SLC46A1 Solute carrier family 46, folate transporter, member 1
SMAD2 SMAD family member 2
SMAD4 SMAD family member 4
SP Synchronous polyp
SR Standardised incidence rate
STAT Signal transducers and activators of transcription
STAT6 Signal Transducer And Activator Of Transcription 6
TAF Tumour associated fibroblasts
TAN Tumour associated neutrophils

18 | P a g e
TCA Tricarboxylic acid cycle
TCF/LEF T-cell factor/lymphoid enhancer factor
TGF Transforming growth factor
Th1 T helper cell response 1
TH2 T helper cell response 2
TIMP Tissue Inhibitors of Metalloproteinases
TNF-α Tumour necrosis factor alpha
TNM Tumour Nodes Metastasis
TP53/p53 Tumour suppressor p53
TPPP Tubulin Polymerization Promoting Protein
TPPP3 Tubulin Polymerization Promoting Protein 3
WNT Wingless-type mouse mammary tumour virus integration site
UHCW University Hospitals of Coventry and Warwickshire NHS Trust
UK United Kingdom
USA United States of America
UV Ultraviolet
VEGF Vascular endothelial growth factor
ZEB Zinc finger E-box-binding homeobox 1

19 | P a g e
List of figures
1.2. Crypt of Lieberkuhn
1.3. Staging of colon cancer
1.4. Diagnostic criteria used for HNPCC
1.5. The adenoma-carcinoma sequence
1.7. The stem cell theory
1.8.1. Signalling cascade involved in FGF-FGFR interaction
1.8.2. The physiological roles of FGF19
1.10. Schematic representation of proposed mechanisms for formation of field defect
2.2. Sampling sites from specimen
2.3. Two channel micro-array experiment
2.4. Analysis of micro-array data
3.1. Flowchart showing how patients were selected from the MDT database
3.2. Flowchart of patients included in the analysis
3.3. Kaplan-Meier survival analysis demonstrating overall survival in SA and non-SA
patients
3.4. Kaplan-Meier survival analysis demonstrating disease free survival in SA and non-SA
patients
4.1. Principal components analysis of the global gene expression profile
4.2. DAVID analysis
4.3. PANTHER analysis
4.4. PANTHER analysis of DEGs found between cancer and control
4.5. PANTHER analysis of DEGs found between polyp and control

20 | P a g e
4.6. PANTHER analysis of DEGs found between polyp and cancer
4.7. Proposed cellular alterations in the colonic field
5.1.1. MUC2 expression in control subjects compared to tumour samples, MNM adjacent to
tumour and at resection margin from colectomy specimen
5.1.2. MUC5AC expression in control subjects compared to tumour samples, MNM adjacent
to tumour and at resection margin from colectomy specimen
5.1.3. GADD45B expression in control subjects compared to tumour samples, MNM
adjacent to tumour and at resection margin from colectomy specimen
5.1.4. MUC2 expression levels in control subjects compared to right colonic, left colonic and
adjacent MNM taken in patients with polyps
5.1.5. MUC5AC expression levels in control subjects compared to right colonic, left colonic
and adjacent MNM taken in patients with polyps
5.1.6. GADD45B expression levels in control subjects compared to right colonic, left
colonic and adjacent MNM taken in patients with polyps
5.2.1. Expression levels of CXCL2, FUT2, S100P and SLC46A1 in control subjects
compared to patients with cancer
5.2.2. Expression levels of CXCL2, FUT2, S100P and SLC46A1 in control subjects
compared to patients with polyps
6.1. Mean gene expression level of FGF7 and FGFR2
6.2. FGF7 and FGFR2 correlation
6.3. FGF7 and FGFR2 gene expression in patients with polyps
6.4. Protein expression of FRS2α and pFRS2α
6.5. Protein expression of pErk, Erk, pAkt and Akt

21 | P a g e
List of tables
1.4. Genetic syndromes
1.5. Different molecular types of colorectal cancer
2.3. Demographic and clinical details of patients that were included in the micro-array study
3.1. Clinical, operative and pathological details of patients who met the inclusion criteria
3.2. Clinical, operative and pathological details of SA and non-SA patients
3.3. Univariate and multivariate factors that predict the development of MAs in colorectal
cancer patients 0-24 months after surgery
3.4. Univariate and multivariate factors that predict the development of MAs in colorectal
cancer patients 0-60 months after surgery
3.5. Univariate and multivariate factors that predict development of local recurrence at site
of previous resection
4.1. Candidate genes for further validation
4.2. Potential genes for qRT-PCR validation
4.3. Statistical over representation test for cancer versus control
4.4. Statistical over representation test for polyp versus control
4.5. Statistical over representation test for polyp versus cancer
5.1. Micro-array genes
5.2. Clinical and pathological details of patients included in the analysis
6.1. Clinical and pathological details of all participants in the study
6.2. Serum FGF19 concentration and correlation with clinical factors

22 | P a g e
Acknowledgements
This thesis was possible through the continued support and funding provided by
several people whom I would like to acknowledge –
Dr Ramesh Arasaradnam, Mr Nigel Williams and Dr Gyanendra Tripathi for giving
me the opportunity to undertake this research and providing excellent support and
supervision
Dr Philip McTernan for his help and advice, which was invaluable in ensuring timely
completion of this work
Sean James for his assistance in sample collection and immunohistochemistry
Dr Kishore Gopalakrishnan for his support in collection of tissue samples from
colectomy specimens
The FAMISHED research team (Catherine Bailey, Nicola O’Connell and Subie
Wuriatu).
My colleagues who provided help and support in learning molecular biological
laboratory techniques (Philip Voyias, Warunee Kumsaiyai, Alice Murphy, Sahar
Azharian, Adaikala Antonysunil, Nithya Sukumar, Ciara McCarthy, Milan Piya and Lucia
Martinez de la Escalera Clapp).
The Department of Systems Biology, University of Warwick, particularly Yi-Fang Wang
and Jonathan Moore for their assistance in analysing the micro-array data.
Oxford Gene Technology for performing the micro-array chip hybridisation
The Bowel Disease Research Foundation (BDRF) and Colorectal Cancer Research Fund
(UHCW) for providing some of the funding that contributed to this research.
Finally, my family for their everlasting concern, support and inspiration.

23 | P a g e
Declaration
This thesis is submitted to the University of Warwick in support of my application for the
degree of Doctor of Philosophy. I, Abhilasha Patel, declare that it has been composed by
myself and has not been submitted in any previous application for any degree and all the
research has been undertaken in accordance with University safety policy and Guidelines on
Ethical Practice.
The presented work, including data generation and data analysis, was carried out by the
author except in the cases outlined below:
The micro-array chip hybridisation was commercially performed by Oxford Gene
Technology
The micro-array results were analysed in collaboration with the Department of
Systems Biology, University of Warwick
List of publications
Patel A, Tripathi G, Gopalakrishnan K, Williams N, Arasaradnam R. (2015). Field
cancerisation in colorectal cancer: A new frontier or pastures past? World J Gastroenterol.
2015 Apr 7; 21(13): 3763–3772

24 | P a g e
Abstract
Colorectal cancer (CRC) continues to cause significant global health burden, despite
advances in our understanding of tumour biology, the development of screening programs
and increasing public awareness about the disease. Previous studies investigating CRC
pathogenesis have been criticised for focussing on the tumour tissue itself. Investigators
have proposed that if early biomarkers of disease are to be identified, efforts need to be
undertaken in examining pre-neoplastic tissue prior to malignant transformation. Based on
the field cancerisation concept, the research hypothesis was that the macroscopically normal
mucosa (MNM) around colorectal cancer and polyps is biologically altered. The aims of the
study were to determine if the presence of colorectal adenomas at time of cancer diagnosis
was predictive of future risk of colonic neoplasia and to characterise the global gene
expression profile of MNM adjacent to CRC and adenomas. A retrospective cohort study of
CRC patients demonstrated that synchronous adenomas were associated with a higher risk of
future adenomas at short term follow up but were not predictive of local recurrence. Thus,
other more reliable biological markers of field effect need to be identified. Global gene
expression profiles of MNM around cancer, polyps and in control subjects were significantly
different when evaluated with micro-array. The differentially expressed genes were involved
in immunity, metabolism, epithelial-mesenchymal transition and RNA transcription. CXCL2
and FGF7 were identified as being upregulated in MNM adjacent to CRC suggesting that
they could be utilised as markers of field cancerisation in the colon. Further investigation
demonstrated that the FGF7-FGFR2 axis was disrupted only at the tumour site with
downregulation of some of its downstream targets emphasising the potential role of this
signalling axis in CRC formation. Collectively, these findings support the field cancerisation
concept in CRC and highlight the importance of signals released by stromal cells in
facilitating epithelial growth. These genes may be utilised to develop early biomarkers of
disease or could be targeted with pharmacotherapy to modulate future CRC risk.

25 | P a g e
Chapter 1: Introduction

26 | P a g e
1.1. Colorectal cancer epidemiology
Colorectal cancer is the fourth most common cancer in the UK affecting 1 in 17 people in
the UK (CRUK) and more than a million people worldwide (Ferlay J et al., 2013). The
highest rates of cancer are found in Australia/New Zealand and the lowest in Western
Africa. In Europe, it is the second most common cancer with just under half a million cases
diagnosed in 2012. The incidence rate in the UK is 20th highest in males in Europe and 17th
highest in females (Ferlay J et al., 2013). Overall, CRC occurs more frequently in men
compared to women with an overall male:female ratio of 13:10 (CRUK). Most cancers
occur in the colon with just over a third (34%) in the rectum. Incidence is related to age with
the majority (95%) of cancers being diagnosed in those aged above 50 yrs.
Within the UK, a north-south divide has been observed for men with the highest incidence
being recorded in Scotland, Northern Ireland and north of England (Quinn et al., 2005;
NCIN). In comparison, the overall incidence for women does not demarcate as clearly with
areas in the east and southwest also experiencing high rates of CRC.
The European age standardised incidence rates (SR) have increased by 29 % and 7 % for
men and women respectively between 1975-1977 and 2009-2011 (CRUK). Some of the
increase in the last decade has been the result of better screening which has detected cancers
at an early stage (Jones et al., 2009).
There has been a gradual improvement in CRC survival over time. The one year age
standardised survival rate has increased from 46.2 % to 75.7 % between 1971-1972 and
2010-2011 (CRUK). However, despite improvements in screening and diagnosis, prognosis
after CRC in the UK remains poor, particularly compared to the rest of Europe (Sant et al.,

27 | P a g e
2009). The age standardised 5-year survival rate in the UK is 53.6 % compared to 65.9 %
and 62.6 % in Australia and Sweden respectively (Coleman et al., 2011). Some of these
inter-country differences have been attributed to later presentation (Woodman et al., 2001)
and delay in treatment, however, there may be other differences in ethnicity, dietary and
lifestyle factors that could account for variation in survival.
1.2 Anatomy of the colon
The last part of the aerodigestive tract is referred to as the colon or large intestine. It consists
of four sections; the ascending colon, transverse colon, descending colon and sigmoid colon.
Based on its embryological origin, the right colon refers to the caecum, ascending colon and
2/3 proximal transverse colon originating from the midgut. The rest of the transverse colon,
descending colon and sigmoid colon are derived from the hindgut and are collectively
described as the left colon.
1.2.1. The colonic wall
The wall of the colon can be divided into four layers:
i) The innermost mucosa which consists of an epithelial layer, the lamina propria
which is a connective tissue layer that contains blood vessels, nerves, lymphoid
tissue to support the mucosa and the muscularis mucosa which is a layer of
smooth muscle that contracts to change the shape of the lumen
ii) The submucosal region contains fat, fibrous connective tissue and larger blood
vessels and nerves
iii) The muscularis externa comprises an inner circular and outer longitudinal layer
of smooth muscle fibres responsible for peristaltic activity driving digestion

28 | P a g e
iv) The serosa formed by fat and another layer of epithelial cells called
mesothelium.
1.2.2. The stem cell compartment
The epithelial layer consists of a single sheet of columnar epithelial cells folded into finger
like vaginations that form the functional unit of the intestine called crypts of Lieberkuhn. In
the adult human colon, around 14,000 crypts per square centimeter are found and it is
estimated that over 6 times 1014 colonocytes are produced every 5 days (Potten et al., 1992;
Cheng et al., 1984). Each colonic crypt is shaped like a test tube and consists of 2500-5000
cells (Nooteboom et al., 2010), 85-106 cells in length and 29-43 cells in circumference
(Bernstein et al., 2010). At the base, there are 10-20 cells designated the stem cell niche
(Nicolas et al., 2007; Willis et al., 2008) which are pluripotent stem cells that undergo self-
renewal through asymmetric division and generate a population of transit amplifying cells
(Radtke & Clevers, 2005) (See figure 1.2.1). These cells proliferate and differentiate as they
migrate upward along the crypt giving rise to the terminally differentiated epithelial cells
found at the top of the crypt. Each stem cell can give rise to one of three differentiated
epithelial cell types that include colonocytes (responsible for absorption), mucus secreting
goblet cells and enteroendocrine cells.

29 | P a g e
Figure 1.2. Crypt of Lieberkuhn showing stem cells at base with progressive upward
differentiation of cells.
Proliferation, life span and cell death are regulated to ensure that the stem cell compartment
in the crypt remains constant despite this cycling process. This is achieved through Wnt
signaling ligands that are produced by the mesenchymal cells of the myofibroblast lineage
and are closely applied to the basal lamina that surround the crypt (Fevr et al., 2007). Other
factors that have been found to contribute to stem cell behavior include bone morphogenetic
protein, antagonists gremlin 1 and gremlin 2 (Kosinski et al., 2007), Notch signaling
pathways, ephin-B1 and its receptors (Eph-B2, Eph-B3) (Batlle et al., 2002; van Es &
Clevers, 2005; Crosnier et al., 2006).
1.2.3 Blood supply of the colon
Based on its embryological origin, the blood supply to the right colon is from the superior
mesenteric artery and to the left colon is from the inferior mesenteric artery. Curative CRC
surgery will aim to remove the draining lymph nodes of the tumour and therefore will
require resection of the entire segment of colon that is supplied by that particular artery.
Hence, a tumour of the sigmoid will require resection of the descending colon and sigmoid
up to the recto-sigmoid junction with ligation of the inferior mesenteric artery at its origin.
Transient amplifying cells
Stem cells
Differentiated cells

30 | P a g e
This will ensure that the entire lymphatic basin draining the tumour, which could potentially
harbour metastasis, is removed.
1.3. Staging and prognosis of colorectal cancer
The pathological stage of CRC describes the disease extent both locally at the colonic site
and distal spread into lymph nodes or distant organs such as the liver. In 1950, Cuthbert
Dukes first described the relationship between pathological stage and rectal cancer survival
(DUKES, 1950). He described 4 distinct stages of CRC based on depth of local invasion and
subsequent spread into lymph nodes or distant organs. The more recent Astler-Coller
(ASTLER & COLLER, 1954) and TNM staging system (Edge SB et al., 2010) are based
upon similar principles to that of Dukes staging, namely, description of local and distant
tumour spread. TNM staging relies on 3 pieces of information –
i) T (tumour)-– spread of the tumour in terms of the different layers of the colonic
wall
ii) N (nodes) – spread to local or systemic lymph nodes
iii) M (metastasis) – systemic spread of tumour outside of the colon (does not
include organs that are adjacent to the tumour and are directly invaded).

31 | P a g e
Figure 1.3: Staging of colon cancer. Three different staging systems that have been
described.
Duke's stagingDukes' A: Invasion into but not through the bowel wall
Dukes' B: Invasion through the bowel wall penetrating the muscle layer but not involving lymph nodes
Dukes' C: Involvement of lymph nodes
Dukes' D: Widespread metastases
Astler-Coller
Stage A: Limited to mucosa
Stage B1: Extending into muscularis propria but not penetrating through it; nodes not involved
Stage B2: Penetrating through muscularis propria; nodes not involved
Stage C1: Extending into muscularis propria but not penetrating through it. Nodes involved
Stage C2: Penetrating through muscularis propria. Nodes involved
Stage D: Distant metastatic spread
TNM staging
Stage 0 - Tumour confined to mucosa (Tis)
Stage I - tumour confined to submucosa (T1) or muscularis propria (T2)
Stage II - tumour invades subserosa (T3) or adjacent organs (T4)
Stage III - any T stage with lymph node involvement
Stage IV - metastatic involvement of distant organs

32 | P a g e
Staging of CRC is not only important for planning adjuvant therapy but determines
prognosis. Early stage colorectal cancer confined to the colon is associated with a 5-year
survival of 93.2 % for T1-T2 lesions and 77 % for T3-T4 lesions (NCIN). In comparison,
cancer that has spread to the lymph nodes or distant organs only has a 5-year survival of
47.7 % and 6.6 % respectively (NCIN). At present, only 13 % patients present with early
stage disease and more than a quarter (32.8 %) have either nodal or distant metastases at
time of diagnosis. Patients with liver or lung metastases that are amenable to surgical
resection have a five-year survival of approximately 25% (Cady & Stone, 1991; Fong et al.,
1999; Kanemitsu et al., 2004; Vogelsang et al., 2004; Choti, 2009).
Other prognostic factors that have been described by AJCC (7th edition) (Edge SB et al.,
2010) include–
i) Presence of tumour deposits – these are discrete foci of tumour that are
found in the pericolic, perirectal or mesenteric fat, in the absence of
residual lymph node tissue but within the lymph drainage area of the
primary tumour.
ii) Residual tumour at the radial or excision margin
iii) Presence of perineural invasion
iv) Microsatellite instability (MSI) – recorded as stable, MSI-low, MSI-
high and not registered
v) Tumour regression grade – this describes the change in rectal tumour
following neoadjuvant therapy as either no tumour viable cells present
to extensive residual tumour present
vi) K-ras gene analysis as mutated K-ras is associated with poor response to
anti-EGFR therapy which is given to patients with metastatic CRC
vii) 18q loss of heterozygosity (LOH) assay – this is used to determine if
patients with stage II CRC require neoadjuvant therapy or not.

33 | P a g e
1.4 Risk factors for colorectal cancer
Most cases of CRC are sporadic, however, 5 % cases are associated with familial syndromes
(CRUK). Risk factors for sporadic colorectal cancer include increasing age, male sex,
previous colonic polyps/cancer and environmental factors such as red meat, high fat diet,
low fibre intake, obesity and a sedentary lifestyle.
Familial syndromes associated with colorectal cancer include Lynch syndrome (also known
as hereditary non-polyposis colorectal cancer, HNPCC), familial adenomatous polyposis
(FAP) and MYH-associated polyposis (MAP). They are characterised by the presence of
specific mutations (mutation in the gene APC in FAP and mutations in DNA mismatch
repair genes in Lynch syndrome) that lead to earlier onset of cancer and higher risk of
further lesions. Lynch syndrome and FAP are both autosomal dominant whereas MYH-
associated polyposis is autosomal recessive. Aside from these syndromes, in 20 % sporadic
cases there is a higher risk based on number of first-degree relatives with cancer and the
underlying aetiology for this is unknown (Butterworth et al., 2006; Johns & Houlston,
2001).
The other risk factor for CRC is inflammatory bowel disease. Both Ulcerative Colitis and
Crohn’s disease have been linked with an increased risk of CRC, particularly with increasing
duration or severity of disease activity (Eaden et al., 2001; Bernstein et al., 2001; Canavan et
al., 2006; von Roon et al., 2007; Laukoetter et al., 2011).
1.4.1 Genetic predisposition to CRC
FAP and HNPCC account for around 5 % of all CRC (Hampel et al., 2008; Bülow et al.,
1996) with the hamartomatous syndromes such as Peutz-Jeghers, familial juvenile polyposis

34 | P a g e
and Cowden’s syndrome being associated with a further 1 % CRC. The genes that have been
linked with these syndromes are shown below (Fearnhead et al., 2002).
Table 1.4.: Genetic syndromes with increased colorectal cancer risk and underlying genetic
defect responsible
Syndrome Genes responsible
FAP APC (dominant), MYH (recessive)
HNPCC hMLH1, hMSH2, hMSH6, PMS1, PMS2,
hMLH3, EXOI
Peutz-Jeghers syndrome STK1
Juvenile polyposis SMAD4/MADh4 or BMPR1A
Cowden disease PTEN/MMAC1
Li-Fraumeni syndrome p53
Modified from Arnold et al, 2005
1.4.1.1. FAP
FAP has an incidence at birth of around 1 in 8619 (Evans et al., 2010). It occurs equally in
both sexes and is characterised by multiple polyps (>100) in the colon and rectum. If
untreated, there is 100% chance of malignancy, usually before the age of 40 years (Half et
al., 2009). There are three forms of FAP: classic FAP, attenuated adenomatous polyposis
coli (AAPC) and MYH-associated polyposis (MAP). Classic FAP and AAPC are both
autosomal dominant and are associated with a mutation in the Adenomatous Polyposis Coli
gene on chromosome 5q21. In AAPC, however, the gene is partly functional which leads to
fewer colonic polyps that develop at a later stage, predominantly affect the proximal colon
(Knudsen et al., 2003; Grover et al., 2012) and confer a 70 % lifetime risk of CRC.
Although FAP is usually diagnosed based on prior family history, up to 16 % cases are

35 | P a g e
associated with a de novo mutation in the APC gene (Evans et al., 2010). The APC gene is a
tumour suppressor gene that promotes apoptosis in colonic cells. It phosphorylates beta
catenin leading to its ubiquitination and degradation through the proteasome pathway (Oving
& Clevers, 2002). Loss of the APC protein leads to increased levels of nuclear B-catenin
which is able to stimulate cell proliferation and transcriptional activation of c-myc, cyclin
D1 and PPAR-delta. Interestingly, the phenotype of FAP patients depends upon the site of
the truncating mutation in the APC gene (Brensinger et al., 1998).
FAP is also associated with extra-intestinal manifestations such as osteomas, dental
abnormalities (unerupted teeth, congenital absence of one or more teeth, supernumerary
teeth, dentigerous cysts and odontomas), congenital hypertrophy of the retinal pigment
epithelium (CHRPE), desmoid tumours, and extracolonic cancers (thyroid, liver, bile ducts
and central nervous system) (Half et al., 2009).
MYH-associated polyposis syndrome is an autosomal recessive condition characterised by a
germline inactivation of a base excision repair gene called mutY homologue (Al-Tassan et
al., 2002; Kastrinos & Syngal, 2007). This gene is responsible for excising the 8-oxoguanine
product of oxidative damage to guanine. As it is recessive, two inactive germline MYH
alleles need to be inherited to develop the disease which confers an almost 100 % risk of
CRC by 60 years of age (Kastrinos & Syngal, 2007). One third of individuals with more
than 15 colorectal adenomas will test positive for the two common mutations Y165C and
G382D. Somatic inactivation of MYH allele has not been detected in sporadic cancer.

36 | P a g e
1.4.1.2. HNPCC
HNPCC or Lynch syndrome is an autosomal dominant condition associated with defective
DNA mismatch repair leading to microsatellite instability (Lynch et al., 2009). HNPCC
sufferers have an 80 % lifetime risk of CRC. The majority (2/3) of these cancers occur in the
proximal to the splenic flexure and CRC usually occurs at an earlier age (44 yrs.) compared
to the general population (63 yrs.). Accelerated carcinogenesis is seen in the colon whereby
small adenomas become malignant over 2-3 years in comparison to the usual 8-10 years
(Rijcken et al., 2002; Rijcken et al., 2008). The colorectal tumours that are encountered
amongst HNPCC individuals tend to be poorly differentiated, are mucinous and associated
with a lymphocytic infiltrate often described as a ‘Crohn’s like reaction. There is an
increased risk of metachronous CRC if the initial operation was not a subtotal colectomy
(Parry et al., 2011). These individuals are also at increased risk of developing cancer of the
endometrium (40-60 % lifetime risk), ovary (12-15%), stomach, urinary tract, pancreas,
small bowel and brain (Watson et al., 2008; Barrow et al., 2009).
The most commonly affected genes are hMLH1 (Bronner et al., 1994; Papadopoulos et al.,
1994) and hMSH2 (Fishel et al., 1993; Leach et al., 1993) which together account for 90 %
of all gene mutations found in HNPCC. Other genes that have been implicated include
hPMS2 (Nicolaides et al., 1994) and hMSH6 (Hendriks et al., 2004). These genes are
involved in DNA mismatch repair and defective function usually results in microsatellite
instability (Thibodeau et al., 1993; de la Chapelle, 2003). Mutations in hMSH6 result in
partial deficiency of mismatch repair with tumours often displaying lower levels of
microsatellite instability. Clinically, this mutation is associated with an attenuated form of
HNPCC with later age of onset (around 70 yrs.), however, there is a particularly elevated
risk of endometrial cancer (Senter et al., 2008).

37 | P a g e
Patients with HNPCC can be identified based upon the Amsterdam II criteria (Vasen et al.,
1999) which detail clinical aspects of the disease. However, the Revised Bethesda guidelines
(Umar et al., 2004), based upon pathological criteria, have been found to be more effective
at discriminating HNPCC sufferers (Piñol et al., 2005).
Figure 1.4: Diagnostic criteria used for HNPCC
Amsterdam criteria
•3 or more relatives with an associated cancer (colorectal cancer, or cancer of the endometrium, small intestine, ureter or renal pelvis);
•2 or more successive generations affected;
•1 or more relatives diagnosed before the age of 50 years;
•1 should be a first-degree relative of the other two;
•Familial adenomatous polyposis (FAP) should be excluded in cases of colorectal carcinoma;
•Tumors should be verified by pathologic examination.[4]
Bethseda guidelines
•1. Patients aged less than 50 years with a diagnosis of colorectal cancer.
•2. Patients with synchronous or metachronous colorectal or other syndrome-associated tumours, regardless of age.
•3. Patients aged less than 60 years with colorectal cancer with histology suggestive of microsatellite instability (presence of tumour infiltrating lymphocytes, Crohns disease–like lymphocytic reaction, mucinous or signet-ring differentiation, or medullary growth pattern).
•4. Patients with at least one first-degree relative with a diagnosis of colorectal cancer or a syndrome-associated tumour under age 50 years.
•5. Colorectal cancer or syndrome associated tumour diagnosed at any age in two first or second degree relatives

38 | P a g e
1.4.2. Environmental risk factors
A western diet and lifestyle have been associated with an increased risk of CRC based on the
geographical worldwide distribution of CRC. Furthermore, countries such as Japan,
Singapore and Eastern European countries that have recently made a transition from a low-
income to high-income demonstrate rising rates of CRC (Coleman et al., 2011; Boyle &
Langman, 2000). Migrants that move from a low risk to high risk country acquire CRC at a
rate that is similar to the population of the host country (Boyle & Langman, 2000; Johnson
& Lund, 2007). This has been observed in the offspring of the Japanese population that
migrated to United States who have 3-4 times higher CRC incidence compared to the native
Japanese.
1.4.2.1. Diet
A high fat, low fibre diet with high red meat consumption has been implicated in CRC
(Bingham et al., 2002; Liang & Binns, 2009). High fat content is associated with the
development of bacterial flora that degrade bile salts into potentially carcinogenic N-nitroso
compounds (Larsson & Wolk, 2006). A systematic review showed that high red meat
consumption increased the relative risk of colonic but not rectal cancer (Magalhães et al.,
2012). The heme iron found in red meat and production of carcinogenic agents such as
heterocyclic amines and polycyclic aromatic hydrocarbons have been proposed to be
causative factors (Santarelli et al., 2008; Sinha, 2002). Similarly, differences in dietary fibre
intake are also associated with differing risk of CRC. A high fibre intake, particularly
comprising cereal grains and wholegrains was found to be strongly associated with a
reduced risk of CRC across several studies (Aune et al., 2011).

39 | P a g e
1.4.2.2. Physical activity and obesity
Higher levels of physical activity have been linked to a reduced risk of CRC (Lee et al.,
2007; de Jong et al., 2005). However, in several studies, this association appears only to
exist with colonic cancers and not rectal cancers (Bazensky et al., 2007; Harriss et al.,
2009a). The underlying mechanism behind this association is being elucidated. Moderate
physical activity increases the metabolic rate, increases oxygen uptake, reduces blood
pressure, reduces insulin resistance and increases gut motility (Lee et al., 2007) which are
believed to protect against cancer formation. Increased physical activity also protects against
obesity which has also been linked to increased CRC risk (Harriss et al., 2009b).
1.4.2.3. Cigarette smoking and alcohol consumption
Smoking has been linked to both formation of adenomas (Botteri et al., 2008) and higher
incidence of CRC (Zisman et al., 2006). A review of the literature demonstrated that several
parameters of cigarette smoking including quantity of cigarettes smoked, duration of
smoking and number of pack years were quantitatively linked with relative risk of CRC
(Liang et al., 2009). This effect was more pronounced for rectal cancer in studies which
examined risk according to segment of colon affected. An earlier age of onset of CRC has
also been found in individuals who smoke (Zisman et al., 2006; Tsong et al., 2007).
Several studies have also linked increased alcohol consumption to CRC risk (Zisman et al.,
2006; Tsong et al., 2007). Reactive metabolites that are produced in response to alcohol
consumption such as acetaldehyde have been shown to be carcinogenic (Seitz & Mueller,
2015) and these effects may be potentiated by the presence of tobacco (Zisman et al., 2006).

40 | P a g e
1.4.3. Inflammatory bowel disease
Inflammatory bowel disease comprises Ulcerative Colitis and Crohn’s disease, both of
which are associated with significant increase in risk of colorectal cancer compared to the
normal population. In a meta-analysis of the incidence of CRC in UC (Eaden et al., 2001),
the risk of cancer was 2% after 10 years, 8 % after 20 years and 18 % after 30 years. Similar
studies on the incidence of colorectal cancer in Crohn’s disease show a similar risk (Maykel
et al., 2006; Friedman et al., 2008; Seitz & Mueller, 2015), however, do not report length of
duration of the disease. A subsequent meta-analysis which did adjust for duration of disease
found that the SIR (standardised incidence ratio) was 2.5 and the relative risk was 4.5 (von
Roon et al., 2007). Therefore both Crohn’s disease and UC are subject to surveillance
programs when patients have had the disease for more than 10 years (Gillen et al., 1994).
The risk of cancer is also related to the age of onset of the disease and its extent; the greatest
risk being found in patients with colitis affecting colon up to or more proximal to the hepatic
flexure (Sugita et al., 1991).
1.4.4. Previous colorectal cancer
Patients with CRC are at higher risk of developing cancers elsewhere in the colon. The SIR
of a second cancer was higher at 1.5 compared to the general population risk (Levi et al.,
2013) and was related to age. The SIR was 7.5 for those below the age of 50 and declines
thereafter to reach 1.0 at the age of 80 years and above. Several other studies have found
similar findings (Mulder et al., 2012; Liu et al., 2013a). In the long-term, CRC survivors
older than 50 years, elevated risk was only observed for the proximal colon with no
detectable differences for rectal cancer. Amongst the patient and tumour factors that have
been investigated, presence of synchronous neoplastic lesion at time of diagnosis (Ballesté et
al., 2007) and a proximal location of the first tumour (Gervaz et al., 2005) have found to be
predictive for development of subsequent metachronous lesions.

41 | P a g e
1.5. Pathogenesis of colorectal cancer
A large body of epidemiologic, clinical and pathological evidence exists to support the
notion that colorectal cancer develops from precursor lesions called polyps. Histologically,
there are two types of polyps: hyperplastic polyps, which contain increased number of
glandular cells with decreased cytoplasmic mucus but preserved cell architecture and
adenomatous polyps, which have disordered cell architecture consisting of cells that are
enlarged, hyperchromatic, cigar-shaped and crowded together to form a palisade pattern.
Malignant transformation involves these cells becoming invasive and migrating beyond the
basement membrane. Adenomas are classified into tubular adenomas where there are
branched tubules and villous adenomas that contain finger-like villi arranged in a frond.
Tubulovillous adenomas contain elements of both. Increased colorectal cancer risk has
previously only been associated with the presence of adenomas, however, there is emerging
evidence to suggest that hyperplastic polyps in a certain setting are also pre-malignant
(Jeevaratnam et al., 1996; Rashid et al., 2000). Risk factors that are associated with
increased CRC risk in hyperplastic polyps include large polyp size (>1 cm diameter),
location in the right colon, focus of adenoma within the hyperplastic polyp, presence of
more than 20 hyperplastic polyps and a family history of hyperplastic polyposis syndrome
(Jass, 2001). Serrated polyps may appear similar to hyperplastic polyps but have a
significant associated risk of CRC as they tend to be large, are usually found in the right
colon and the colonocytes in these polyps frequently contain BRAF mutations and DNA
methylation (Montgomery, 2004; Wynter et al., 2004).

42 | P a g e
1.5.1. Evidence to support polyps as precursors to colorectal cancer
The following clinical observations support the concept that adenomas are precursor lesions
for CRC –
i) The prevalence and anatomical distribution of adenomas and CRC is similar
(Morson, 1974; Muto et al., 1975)
ii) Patients who have colorectal adenomas are at higher risk of developing CRC
(Neugut et al., 1993; Winawer et al., 1993)
iii) Synchronous adenomas are found in up to one third of CRC colectomy resection
specimens (Day DW & BC., 1978)
iv) Adenomatous tissue is found contiguous with CRC (Day DW & BC., 1978)
v) The risk of CRC increases with number and size of polyps (Heald & Bussey,
1975).
vi) Patients who refuse polypectomy develop CRC at a rate of 4 % after 5 years and
14 % after 10 years (Stryker et al., 1987).
vii) Following curative resection, adenomas develop in 30 % patients who have
CRC (McFall et al., 2003; Mattar et al., 2005; Moon et al., 2010).
viii) Removal of adenomas results in reduced CRC incidence (Müller & Sonnenberg,
1995; O'brien et al., 2004a).
The earliest lesions that lead to the development of adenomas are aberrant crypt foci (ACF)
(Bird, 1987; Bird et al., 1989). These consist of abnormal tube like glands, which contain
cells that are resistant to apoptosis. Previous studies have utilised ACFs as a surrogate
endpoint biomarker in chemoprevention trials (Raju, 2008; Corpet & Taché, 2002; Cho et
al., 2008), however, the relevance of ACFs in this setting remains controversial (Lance &
Hamilton, 2008). Not all ACFs lead to CRC and it is unclear which attributes of ACFs
predispose to further growth and development of adenomas, therefore, the use of chemical
agents to reduce ACF number or size is of questionable importance.

43 | P a g e
1.5.2. The adenoma-carcinoma sequence
Based upon the body of evidence outlined above, the adenoma-carcinoma sequence was
proposed. This refers to the process whereby normal mucosa becomes altered forming
aberrant crypt foci, followed by adenoma of varying dysplasia and subsequently culminating
in invasive CRC. The molecular changes that underpin this process were described by
Vogelstein in the late 1980’s (Vogelstein et al., 1988). It is now well recognised that
multiple genes and molecular pathways are dysregulated during CRC formation. The
original description of the adenoma-carcinoma sequence refers to cancers with chromosomal
instability, which includes around 80 % of all cancers (see figure below).

44 | P a g e
Figure 1.5. The adenoma-carcinoma sequence
APC
KRAS
SMAD2/SMAD4/DCC
TP53

45 | P a g e
Chromosomal instability is characterised by numerical and structural changes in
chromosomes collectively referred to as aneuploidy (Muleris et al., 1990; Bardi et al., 1995;
Thiagalingam et al., 2001). In contrast, cancers with DNA mismatch repair defects (15 % of
all tumours) retain a near-diploid karyotype and show normal rates of gross chromosomal
aberrations (Parsons et al., 1993; Eshleman et al., 1998). These tumours exhibit
microsatellite instability (MSI) and have distinct histological features with frameshift
mutations and base pair substitutions in short tandemly repeated nucleotide sequences called
microsatellites. They are similar to the tumours encountered in HNPCC but usually result
from silencing of the hMLH1 gene through CpG promoter hypermethylation rather than a
germline mutation. The other molecular pathway that can lead to CRC formation is CIMP
(CpG island methylator phenotype) whereby tumour suppressor genes are silenced through
epigenetic modification rather than gene mutation. It appears that chromosomal instability
and MSI are mutually exclusive (Lengauer et al., 1998). However, a subgroup of colorectal
cancers with near diploid chromosomes and stable microsatellites have also been described
suggesting an alternative pathway to genetic instability (Chan et al., 2001).

46 | P a g e
Table 1.5: Different molecular types of colorectal cancer with underlying gene defects
Type of genetic instability Type of
defect
Genes involved Phenotype
Chromosomal instability
(loss of heterozygosity at
multiple site)
Somatic Loss of
heterozygosity
at
APC, TP53,
SMAD4
Characteristic of 80 to 85%
of sporadic colorectal
cancers, depending on stage
DNA mismatch repair
defects
HNPCC
Sporadic CRC
Germline
Somatic
MLH1, MSH2,
MSH6 germ-
line gene
mutations
MLH1 somatic
methylation
Multiple primary colorectal
cancers, accelerated
tumour progression, and
increased risk of endometrial,
gastric, and urothelial
tumours
Colorectal cancer with
increased risk of
poor differentiation, more
commonly located in right
colon, less aggressive clinical
behaviour than tumours
without mismatch-repair
deficiency
CpG island methylator
phenotype
Somatic Target loci
MLH1,
MINT1,MINT2
, MINT3
Characteristic of 15% of
colorectal cancers,
with most showing mismatch
repair deficiency from loss of
tumour MLH1 expression
Base excision repair defect Germline MYH Development of 15 or more
colorectal adenomas with
increased risk of colorectal
cancer

47 | P a g e
1.5.3. Chromosomal instability
Most sporadic cases have chromosomal instability characterised by an allelic imbalance at
several chromosomal loci (5q, 8p, 17p and 18q) which leads to loss of tumour suppressor
genes such as APC, p53 and SMAD4. There are also rare inactivating mutations of genes
that are involved in maintaining chromosomal stability (Barber et al., 2008). In contrast to
most other cancers, amplification of gene number (Leary et al., 2008) or gene rearrangement
through translocation are rarely found in colorectal cancer.
The majority (around 70-80 %) of FAP and sporadic CRCs are characterised by loss of
heterozygosity and bi-allelic mutations in APC (Miyoshi et al., 2002; Lammi et al., 2004).
APC forms a ‘destruction complex’ in association with beta catenin, GSK-3beta and CKI
kinases which triggers the phosphorylation of beta catenin in the absence of the WNT
ligand. This leads to proteolytic degradation of beta catenin. In the presence of WNT, this
destruction complex is inhibited which prevents beta catenin degradation, enabling it to
translocate to the nucleus and activate downstream target genes through interaction with the
TCF/LEF family of transcription factors (Polakis et al., 1999). Constitutive activation of the
WNT pathway occurs most commonly due to mutations in the APC or beta catenin genes.
However, mutations in other members such as AXIN 2 have also been detected (Lammi et
al., 2004).
Up to 50 % of all CRCs contain an activating mutation in the KRAS2 oncogene (Bos et al.,
1987; Vogelstein et al., 1988; Andreyev et al., 2001). In its absence, 20 % of CRCs contain
mutations in BRAF (Davies et al., 2002; Rajagopalan et al., 2002). Both play a role in the
RAS-RAF-MAPK signalling pathway that modulates cell growth and survival. Although
both mutations are associated with adenoma growth and progression (Vogelstein et al.,

48 | P a g e
1988; Rajagopalan et al., 2002), there is some evidence to suggest that they may develop
earlier in aberrant crypt foci (Takayama et al., 2001).
Alterations in the TGFβ signal transduction pathway are associated with the progression to
late adenoma/early adenocarcinoma. Most CRCs contain mutations in a component of this
pathway such as TGFβ receptor 2 (Markowitz et al., 1995) or SMAD2 and SMAD4 genes
(Takagi et al., 1996; Takagi et al., 1998; Thiagalingam et al., 1996) which affects
angiogenesis, cell proliferation and differentiation.
The next step in the adenoma carcinoma sequence is marked by the malignant
transformation from adenoma to carcinoma which is accompanied by loss of TP53, found in
at least 45 % CRCs (Baker et al., 1989; Delattre et al., 1989; Purdie et al., 1991; Iacopetta,
2003). This is a tumour suppressor gene that inhibits cell growth and stimulates cell death
hence; its inactivation has far reaching consequences on the genome integrity of intestinal
cells.
Additional pathways that have been implicated in CRC include those involving P13K,
receptor tyrosine kinases and phosphatases (Wang et al., 2004c; Samuels et al., 2004;
Parsons et al., 2005; Bardelli et al., 2003).
1.5.4. DNA mismatch repair defects
In hereditary syndromes such as HNPCC, there are mutations in DNA mismatch repair
genes such as hMLH1, hMSH2 or hMSH6. These genes are responsible for recognising
frameshift mutations and base pair substitutions that occur in short tandemly repeated
nucleotide sequences called microsatellites during DNA replication. Loss of function of

49 | P a g e
these genes is characterised by accumulation of single nucleotide mutations and length
alterations in repetitive microsatellite nucleotide sequences. Germ line defects in mismatch
repair genes confer a lifetime risk of colorectal cancer of 80 % in individuals with HNPCC
(Leach et al., 1993; Papadopoulos et al., 1994; Fishel et al., 1994; Bronner et al., 1994) and
are associated with an accelerated course of development of colorectal cancer with invasive
cancer emerging within 36 months of a normal colonoscopy.
In sporadic colorectal cancer, loss of one of the DNA repair genes, hMLH1 occurs through
hypermethylation of its CpG islands, which silences the genes and leads to microsatellite
instability. Defective mismatch repair function leads to the development of tumours that
have a proximal location, mucinous histology, poor differentiation and lymphocytic
infiltration. In sporadic cases, they are associated with older age and female sex. Genes that
contain mononucleotide or dinucleotide repeat sequences such as that for TGFβ receptor 2 or
BCL2-associated X protein can become inactive in individuals with mismatch repair
deficiency contributing to the carcinogenesis process.
The level of microsatellite instability is usually assessed using a standard panel of five
markers (BAT25, BAT26, D5S346, D2S123 and D17S250) defined by the National Cancer
Institute in 1998 (Boland et al., 1998). MSI-H (MSI high) is defined when two of the five
markers are mutated or unstable. MSI –L (MSI low) is present when only one of the five
markers is unstable. When none of the five markers are mutated, the tumour is described as
MSS (microsatellite stable).

50 | P a g e
1.5.5. CpG island methylator subtype.
Loss of gene function can occur through aberrant DNA methylation, which leads to
epigenetic silencing of genes. Cytosines within CpG dinucleotides are modified by DNA
methylases that attach a methyl group to carbon 5 of cytosine. Under normal circumstances,
cytosine methylation only occurs in areas of repetitive DNA sequences outside of exons
being excluded from the CpG islands in the promoter regions of half of all genes (Issa, 2004;
Tahara et al., 2014). In colorectal cancer, there is an overall reduction in cytosine
methylation, however, there is an increase in aberrant methylation within certain promoter
associated CpG islands responsible for epigenetic gene silencing. In sporadic CRC,
hypermethylation of MLH1 is responsible for loss of function of this DNA mismatch repair
gene. Hypermethylation of other genes usually occurs as a collective group that has led to
the term CpG island methylator phenotype (CIMP). However, the molecular mechanism that
underlies CIMP or the effects of epigenetic silencing of genes other than MLH1 remain to be
elucidated. There are three patterns of methylation: CIMP-high where a subgroup of genes
become hypermethylated, CIMP-low with an intermediate level of hypermethylation and
aberrant methylation of exon 1 of the gene encoding vimentin. The latter is not usually
expressed by colonic mucosa but aberrant methylation is found in 53-83 % of patients with
colorectal cancer in a pattern that is independent of CIMP (Chen et al., 2005; Zou et al.,
2007).
1.5.6. Newer emerging theories
A number of different pathways have recently emerged that explain a higher risk of CRC in
patients with particular types of adenoma.

51 | P a g e
Serrated polyposis refers to a condition whereby serrated polyps confer a high risk of CRC
that develops along a different pathway to the traditional adenoma-carcinoma sequence. The
current criteria for diagnosis (Snover et al., 2010) include –
1. at least five serrated polyps proximal to the sigmoid colon with two or more of these
being >10 mm
2. any number of serrated polyps proximal to the sigmoid colon in an individual who
has a first-degree relative with serrated polyposis
3. >20 serrated polyps of any size, but distributed throughout the colon. The implied
meaning of this last criterion is that the polyps are not all present in the rectum
It is associated with a five-fold increase in the risk of CRC to first degree relatives (Boparai
et al., 2010). Most cancers that arise in these patients are proximal (Yeoman et al., 2007),
however, in young onset (<50 years) individuals they are more likely to be distal (Buchanan
et al., 2010; Young & Jass, 2006). Somatic molecular alterations that have been associated
with serrated polyposis syndrome include BRAF (V600E) mutation, KRAS (codons 12 and
13) mutations, hMLH1 methylation, MGMT methylation, and CpG island methylator
phenotype (CIMP) (Rashid et al., 2000; O'Brien et al., 2006; Chan et al., 2003; O'Brien et
al., 2004b; Beach et al., 2005). The prevalence of each mutation varies with the subtype of
serrated polyp, however, in most instances, a somatic mutation in BRAF is the earliest event
detected in aberrant crypt foci (Rosenberg et al., 2007). The other characteristic of serrated
polyposis is widespread hypermethylation of gene promoters (CIMP) (Chan et al., 2002)
with or without MSI (Hawkins et al., 2000; Jass et al., 2000). This is evident even in normal
mucosa of young individuals suggesting that there is a widespread epigenetic regulatory
defect that leads to premature ageing of the mucosa and confers a higher risk of developing
CRC (Minoo et al., 2006; Wynter et al., 2004). At present, clinical management of patients
with these lesions is unclear and regular surveillance colonoscopy is advised.

52 | P a g e
1.6. Screening and treatment of colorectal cancer
At present, most patients with CRC are diagnosed when they become symptomatic with a
change in bowel habit, blood in the stool, abdominal mass or iron deficiency anaemia.
Hence, the condition is often detected at a later pathological stage when chances of cure are
less, resulting in the low observed survival rates. Consequently, population based screening
programs have been introduced that aim to detect CRC in asymptomatic patients at the
preneoplastic stage (adenomatous polyps) or early cancer stage. Current screening
modalities rely on detecting and removing adenomas from which 80 % of CRCs are believed
to arise. However, only a small proportion of these adenomas will eventually develop into a
cancer, hence, screening often results in overtreatment of patients and can cause
considerable morbidity to the patient.
1.6.1. Faecal occult blood test (FOBT)
In the UK, population based CRC screening commenced in 2006. The current protocol is
based on the guaiac based Faecal Occult Blood Test (gFOBT) with biennial testing of
individuals aged 60-74. In a systematic review, FOBT screening reduced CRC related
mortality by 16 % (Hewitson et al., 2007; Hewitson et al., 2008). If found to be positive,
individuals are offered a colonoscopy to establish a diagnosis. Results from the UK cancer
screening program have shown that only 52 % of individuals invited to participate
completed a FOBT and only around 50 % of those with a positive result underwent a
colonoscopy. Of those attending colonoscopy, only one in 10 were diagnosed with cancer.
Half of these patients had no abnormality and the remaining 40 % had polyps (Logan et al.,
2012). This suggests that the vast majority of those investigated by invasive tests such as
colonoscopy did not have cancer. Other tests that are currently being examined include the
immunochemical faecal occult blood test that has superior sensitivity with fewer samples
required and less interference from animal blood in the diet (Whitlock et al., 2008;

53 | P a g e
Castiglione et al., 2002). However, the optimum threshold for testing is currently unknown
and is being evaluated in several studies. In the UK, this test will be introduced into clinical
practice in 2016.
1.6.2. Flexible sigmoidoscopy
Other approaches to CRC screening rely on more invasive tests such as flexible
sigmoidoscopy or colonoscopy. As more than 60 % of cancers arise in the sigmoid colon
and rectum (Lieberman et al., 2000), they can be detected with a 60 cm flexible
sigmoidoscope. Three large randomised trials of once only flexible sigmoidoscopy have
been conducted in the UK (Atkin et al., 2002), Italy (Segnan et al., 2002) and Norway
(Gondal et al., 2003). Based on intention to treat analysis, the UK trial demonstrated a 23%
reduction in CRC incidence and 31 % reduction in mortality in the intervention group (Atkin
et al., 2010). In the first year of follow up after sigmoidoscopy, the incidence of distal
cancers is 4 % of expected which remains at 18 % expected at 4 years. In comparison to
FOBT, flexible sigmoidoscopy is able to detect three times as many adenomas (Brevinge et
al., 1997; Segnan et al., 2005). However, there are disadvantages with flexible
sigmoidoscopy screening. Referral rates for colonoscopy are higher at around 5-19 %
compared to the 1.2-2.1 % referral rates seen in FOBT trials. Similarly, compliance is lower
than that for FOBT screening, probably as these tests are invasive and require attendance at
hospital compared to FOBT tests, which can be performed at home. The overall compliance
rate in the UK trial was 39 % (Atkin et al., 2002) compared to the 54 % compliance rate
recorded in the first round of the FOBT trial.
At present, flexible sigmoidoscopy screening is being offered in six regions in the UK that
are piloting the test to determine its feasibility and cost effectiveness. There are plans to
offer the test on a more universal basis across UK by 2016.

54 | P a g e
1.6.3. Colonoscopy
In the USA, the most common method of screening is colonoscopy every 10 years (Rex et
al., 2000; Rex & Trustees, 2004) which has been shown to have little effect on reducing
rates of proximal cancers (Lakoff et al., 2008; Baxter et al., 2009) and can result in
considerable more morbidity to the patient than flexible sigmoidoscopy as it requires full
bowel preparation and sedation. There are no randomised controlled trials that demonstrate a
reduction in CRC related mortality if colonoscopy is utilised for screening. Most of the
evidence to support colonoscopy based screening has been extrapolated from case control
studies of sigmoidoscopy. These have demonstrated an 80 % risk reduction in death from
CRC in individuals who have undergone a flexible sigmoidoscopy compared to those that
have not (Newcomb et al., 1992; Selby et al., 1993). Similarly, there is a 70 % risk reduction
for CRC following negative colonoscopy which drops to 55 % at years and 28 % at 10 years
(Singh et al., 2006). This suggests that the benefits from a negative examination are long
lasting. However, as the detection rate for advanced adenomas in the younger age group (40-
49) drops to 3.5 %, screening below 50 years is not recommended in the USA (Imperiale et
al., 2002). The other disadvantage of colonoscopy is that up to 6 % of lesions, including
polyps < 10mm can sometimes be missed. In one study, 2 % of asymptomatic patients
undergoing screening had a missed polyp. Almost one quarter of these missed lesions were
found within 10 cm of the anal verge and the rest were on a fold in the colon (Pickhardt et
al., 2004). Given the huge demand on resources, colonoscopy based screening has not been
deemed cost effective in the UK and is therefore unlikely to be utilised in the future.
1.6.4. Emerging screening modalities
Current research into population based screening methods has therefore focussed on the
development of non-invasive tests. Several studies have investigated DNA based tests of
blood or stool (Link et al., 2010; Ahlquist et al., 2012; Summers et al., 2013). Cologuard has

55 | P a g e
recently been developed and is being used in USA. It is a stool based test that measures
KRAS mutations, aberrant NDRG4 and BMP3 methylation, and β-actin, plus a haemoglobin
immunoassay. Early studies have shown that it has a sensitivity of 92 % and specificity of 87
% (Imperiale et al., 2014). Its feasibility, cost effectiveness and long term impact needs to be
investigated further before it can be widely adopted.
Others have used novel strategies such as evaluation of metabolomic profile of urine or
faeces and breath with mass spectrometry or electronic devices that detect emitted volatile
gases such as the electronic nose (Arasaradnam et al., 2014; Westenbrink et al., 2015). Pilot
studies suggest that these technologies offer promise for the future development of more
accurate screening tests.
1.7. Cancer biology
Despite considerable advances in our understanding of how CRC develops, there are a
number of theoretical aspects of cancer formation that require consideration. Many different
theories of carcinogenesis have been proposed which have influenced the way in which CRC
pathogenesis has been explored. The fundamental concept that has been explored in greatest
depth and has dominated CRC research is the somatic mutation theory (Curtis, 1965; Hahn
& Weinberg, 2002) which proposes that cancer is a clonal, cell-based disease where
quiescence is the default state of the cell (Soto & Sonnenschein, 2004). Consequently,
investigators have focussed on characterising the genetic changes that take place in CRC in
order to identify both causative agents and methods for improved diagnosis and treatment.
Others have questioned this approach by challenging the very theoretical assumptions it is
based on and have proposed alternative hypotheses such as the tissue organisation theory
(Soto & Sonnenschein, 2011) or metabolic theory of cancer (WARBURG, 1956).
1.7.1. Multi-hit Hypothesis of cancer

56 | P a g e
The multi hit hypothesis of cancer was first described by Nordling (NORDLING, 1953) and
later popularised by Knudson (Knudson, 1971). A simple mutation is not sufficient to cause
cancer and it is the progressive accumulation of mutations in the cell’s DNA that result in
malignant growth. A three step process was described consisting of initiation, promotion and
progression. Initiation refers to the process where DNA is damaged through the action of
carcinogenic agents such as UV light, ionising radiation, thermal disruption or chemical
sources (de Gruijl et al., 2001). There are also endogenous carcinogens that cause cancer. In
CRC, the colonic epithelium is exposed to numerous toxins and microbial agents found in
food. Bile acids produced at high levels in individuals who have a high fat diet, damage
DNA and have been identified as initiators in CRC formation (Bernstein et al., 2011).
Similarly, presence of macrophages and neutrophils found in inflamed colonic mucosa are a
source of reactive oxygen species, which is also capable of damaging DNA (Katsurano et
al., 2012). There are five main types of DNA damage comprising oxidation of bases,
alkylation of bases, hydrolysis of bases, bulky adduct formation and mismatch of bases
during DNA replication. In the promotion phase, a promoter agent induces clonal expansion
of the cell generating a group of cells that harbour mutated genes. Further mutation and
genetic instability or epigenetic modulation contributes to drive the cells towards malignant
transformation in the progression phases. It has been estimated that at least seven mutations
are necessary for development of cancer (NORDLING, 1953). Only so called ‘driver’
mutations that confer selective growth advantage contribute to carcinogenesis; the remaining
vast majority of mutations found in malignant cells are actually innocent bystander
‘passenger’ mutations that occur because of genomic dysregulation. In CRC, 15 ‘driver’ and
60 ‘passenger’ mutations have been described (Wood et al., 2007).
The multi-hit hypothesis of cancer has developed further in the last decade. Hanahan and
Weinberg described 6 attributes of cancer cells in their seminal paper on ‘Hallmarks of
cancer’ (Hanahan & Weinberg, 2000):

57 | P a g e
i) Self –sufficiency of growth which leads to uncontrolled growth
ii) Evading growth suppressors
iii) Activating invasion and metastasis
iv) Replicative immortality (absence of senescence)
v) Induce angiogenesis
vi) Resist cell death
Consequently, tumours have been described as complex tissues of multiple cell types which
interact with each other rather than collections of proliferating cells (Centelles, 2012). Cells
need to acquire other attributes besides replicative ability to form a tumour and there are
multiple signalling pathways that are disrupted in cancer formation.
Several investigators have recently challenged Knudson’s two hit hypothesis. A number of
experimental approaches have demonstrated haploinsufficiency in cancers whereby
inactivation of one allele of a tumour suppressor gene is sufficient to cause tumour
formation (Fodde & Smits, 2002). Furthermore, the dominant negative effect describes how
one mutated copy of a tumour suppressor gene renders the other, wild-type copy non-
functional (Willis et al., 2004). Therefore, it appears that under certain circumstances, loss
of function of tumour suppressor genes can arise through mutational loss or epigenetic
marking of a single allele.

58 | P a g e
1.7.2. The stem cell theory
Fundamental to the concept that cancer arises from DNA damage and accumulation of
mutations is the concept of the cancer stem cell theory. This proposes that the different cells
found in a tumour originate from a single group of cells called cancer stem cells (CSCs) (see
figure 1.7.).

59 | P a g e
Figure 1.7. Stem cell theory of colorectal cancer formation demonstrating how a mutation
in the stem cells at the base of the crypt is acquired by daughter cells as they migrate
upwards along the crypt.
Stem cells at base of crypt
acquire genetic mutation
Mutation is inherited by all cells
in the crypt
Several crypts acquire mutation
through crypt fission resulting in
patch of dysplastic mucosa
Mutated cells undergo further
mutations developing the ability
to invade and metastasize

60 | P a g e
CSCs are pluripotent cells capable of self-renewal that divide and give rise to the cells found
in tumours. They may arise from transformation of normal adult stem cells or differentiated
cells. Evidence that they arise from normal adult stem cells is the following -
i) there is a positive correlation between the risk of developing a cancer and the
number of normal stem cell divisions taking place in the same tissue – this was
tested across 31 cancer types and extended across 5 orders of magnitude
(Tomasetti & Vogelstein, 2015).
ii) The increased incidence of cancer with age suggests that most cancers occur
because cells accumulate damage. DNA is the only cellular component that can
accumulate damage with age and stem cells are the only cells that can transmit
DNA from the zygote to the cells we have when we die (López-Lázaro, 2015).
The mutant cells compete for space and resources. The clonal evolution theory suggests that
only cells with mutations that give them a selective advantage over the other cells will
survive, similar to Darwinian evolution (Nowell, 1976; Cahill et al., 1999; Greaves &
Maley, 2012).
Both the cancer stem cell theory and the clonal evolution theory have been applied to CRC.
It has been proposed that stem cells at the bottom of a crypt acquire mutations. As these cells
divide and give rise to terminally differentiated cells, the daughter cells acquire the
mutations. Only cells that have a growth advantage over other cells survive and eventually
the crypt contains only mutated cells. These crypts divide by crypt fission resulting in a
tumour mass with cells that harbour the original mutations. It is also conceivable that due to
defective DNA repair mechanisms, the cells also develop different passenger mutations,
which gives rise to genetically heterogeneous populations of cells within the tumour that
share similarity in the driver mutations that they have acquired. This process has also been
termed bottom up histogenesis (Wright, 2000) whereby cells at the bottom of the crypt are
those that are responsible in giving rise to the malignancy.

61 | P a g e
1.7.3. Top down or bottom up histogenesis
Early studies where histological examination of pre-neoplastic lesions of the colon was
performed contradicted the bottom up histogenesis theory (Wright, 2000). These lesions
only contained dysplastic cells at the orifices and luminal surfaces of the crypts. If the
epithelial cells of the crypt were traced, there was an abrupt change to dysplastic cells
midway down the crypt axis (COLE & MCKALEN, 1963; Wiebecke et al., 1974; Nakamura
& Kino, 1984). Furthermore, cells at the base of these crypts exhibited normal proliferation
patterns whereas cells at the orifices had a similar proliferation pattern to neoplastic cells
(Lipkin, 1974; Maskens, 1979; Polyak et al., 1996). Several authors therefore proposed
alternative theories. The stem cells that give rise to cancer cells may reside in intercryptal
zones that lie between crypt orifices rather than at the base of the crypt (COLE &
MCKALEN, 1963). Others suggested that the cells at the base of the crypts were genetically
transformed but that the dysplastic appearance was only visible as cells migrate and become
terminally differentiated (LANE & LEV, 1963; Maskens, 1979). These historical studies
have led authors to investigate this phenomenon further, which has led some authors to
propose a top down morphogenesis model. This was based on the observation that dysplastic
cells at the top of the crypt contain genetic alterations in APC and have a neoplastic genetic
expression profile (Shih et al., 2001). Similar changes were not seen in the cells at the base
of the crypt nor was there any evidence to suggest that these cells have a common clonal
origin. The top down morphogenesis model implies that genetically altered cells are only
found in the superficial portions of the mucosa and not at the base. These abnormal cells
spread laterally and downward to form new crypts which connect to pre-existing crypts and
eventually replace them (Shih et al., 2001). Others have argued that crypt fission, as seen in
monocryptal adenomas (the earliest precursor lesion to adenomas) is the main mode of
adenoma progression, certainly in FAP (Chang & Whitener, 1989; Wasan et al., 1998) but
possibly in sporadic adenomas (Wong et al., 1999). Others have suggested that these two
theories may not be mutually exclusive whereby crypt fission occurs early in adenoma

62 | P a g e
formation and lateral, downward spread via the surface is a later phenomenon resulting in
cancer formation.
1.7.4. Other cancer theories
1.7.4.1 Tissue Organisation theory
Several other cancer theories have been proposed that question the somatic mutation theory
and cancer stem cell theory. Based on this premise, cancers are derived from a single
somatic cell which acquire multiple mutations in genes that control cell proliferation and
regulate the cell cycle (Alberts B et al., 2004). Thus, cancer is an irreversible process that
takes place at the DNA- level and the default state of the cell is assumed to be quiescent. In
comparison, the proponents of the tissue organisation theory state that cancer arises through
disruption of normal tissue architecture by carcinogenic agents resulting in alteration of cell-
to-cell signalling and genomic instability (Soto & Sonnenschein, 2005; Soto &
Sonnenschein, 2011). Hence, genetic mutations are the result rather than the cause for cancer
formation. This theory also assumes that the default state of the cell is proliferation and that
carcinogenesis is a reversible, curable process (Soto & Sonnenschein, 2005). Although both
theories appear to have a different philosophical stance, there have been attempts to ally
them by the proposition that neither process on its own is sufficient to cause a cancer to form
(Rosenfeld, 2013).
1.7.4.2 Chromosomal theory
In 2011, an alternative theory was proposed to explain the genomic instability observed in
cancers (Stephens et al., 2011). Instead of the slow accumulation of genetic mutations,
cancers arise after a single catastrophic event during which the chromosome or
chromosomal region shatters into tens to hundreds of pieces. The DNA repair machinery

63 | P a g e
stitches these fragments into a mosaic pattern, giving rise to genomic instability. Cells that
have acquired such genetic alteration usually undergo apoptosis, however, such remodelling
is expected to give the cell a survival advantage enabling the cells to proliferate and become
malignant.
1.7.4.3. Metabolic theory
Others have suggested that cancers arise due to metabolic dysfunction. Malignant, rapidly
dividing cells have glycolytic rates that can be up to 200 times higher than those of normal
tissues, despite the presence of oxygen (Gatenby & Gillies, 2004; Ferreira et al., 2012). This
has been termed the Warburg effect: there is a switch from energy needs being met by
oxidative phosphorylation to aerobic glycolysis followed by lactic acid fermentation in the
cytosol (Vander Heiden et al., 2009). This is necessary for cancer cells to meet the energy
demands when undergoing rapid rates of cell division. However, it leads to the generation
and accumulation of reactive oxygen species, which induces DNA damage and contributes
to cancer formation. The Warburg hypothesis stipulates that these metabolic changes are the
fundamental cause for cancer formation which is also referred to as the metabolic theory of
cancer (WARBURG, 1956). Others have argued that the Warburg effect is simply a
consequence of the mutations that have accumulated in cancer cells rather than being a
driving force for cancer formation itself (Senyilmaz & Teleman, 2015).
1.8. The role of the tumour microenvironment and supporting stroma
Several studies highlight the importance of the tumour microenvironment and the reciprocal
relationship between stromal cells and epithelial cells in driving cancer formation. Chronic
inflammation has been referred to as the seventh trait acquired by tumour cells (Mantovani
et al., 2008; Colotta et al., 2009; Hanahan & Weinberg, 2011). The tumour
microenvironment consists of tumour infiltrating cells (cells associated with inflammation

64 | P a g e
and immunity), vasculature, extracellular matrix and matrix-associated molecules.
Transformed epithelial cells attract pro-neoplastic stromal cells that will support cell growth
and help evasion of host defences enabling these cells to survive in hostile conditions.
1.8.1. Tumour infiltrating cells
Inflammation and release of soluble chemoattractants by the epithelial cells attract a number
of different cells to the tumour site (Tokunaga et al., 1998; Jedinak et al., 2010; Zins et al.,
2007; Wang et al., 2006b). The role of these cells in carcinogenesis appears to be dynamic.
Initially they are involved in protecting against tumour formation, however, with time, the
epithelial cells are able to modulate their activity to promote tumour cell proliferation,
survival and metastasis (de Visser et al., 2006). Some of the induced changes are reversible,
however, there have been studies showing loss of heterozygosity and microsatellite
instability in stromal cells suggesting that irreversible changes also occur (Ishiguro et al.,
2006).
Tumour associated macrophages (TAMs) have multiple roles that support tumour growth
including promoting angiogenesis through release of VEGF (Barbera-Guillem et al., 2002;
Pollard, 2004; Sickert et al., 2005), epithelial-mesenchymal transition through interaction
with TGFβ (Bates et al., 2004) and immunosuppression through release of cytokines that
inhibit T cell activation and proliferation (Mantovani et al., 1992; Baier et al., 2005). In
comparison, the role of neutrophils in CRC formation remains controversial. Some authors
suggest that they support angiogenesis by releasing factors such as oncostatin M which
stimulates production of VEGF by tumour cells (Queen et al., 2005). Others have proposed
that release of ROS, proteases and cytokines such as TNF-alpha and IL-1beta can kill
tumour cells directly (Di Carlo et al., 2001a; di Carlo et al., 2001b).

65 | P a g e
Macrophages are highly plastic and can adopt a different state depending upon the micro-
environment: either M1 (anti-tumour) or M2 (pro-tumour) polarisation states (Sica et al.,
2006; Mantovani et al., 2007; Mantovani et al., 2004; Van Ginderachter et al., 2008). In
tumours, the M2 polarisation state predominates (Mantovani et al., 2008; Coussens & Werb,
2002) which is usually induced by IL-4, IL-13, immunoglobulin complexes and Toll-like
receptor ligands. They are involved in scavenging debris, promoting angiogenesis, tissue
remodelling and repair. In comparison, M1 macrophages participate in the Th1 response
against intracellular pathogens including tumour cells. Similarly, a dual role for neutrophils
may also explain the opposing results seen across studies. N1-TANs have an anti-tumour
role by expressing higher levels of proinflammatory cytokines and are more cytotoxic to T
cells (Scapini et al., 2000). In contrast, N2-TANs do not produce pro-inflammatory
cytokines but instead produce large amounts of arginase that actually inactivates T cell
effector functions, disabling the host defences against tumour formation (Fridlender et al.,
2009).
The type, density and location of T cells is a better prognostic indicator in CRC compared to
conventional histopathological factors. Although, some CD8 T cells are reactive against
tumour antigens, the tumour microenvironment contains inhibitory cytokines that prevent T
cell activation thus contributing to evasion of the host immune response (Waldner et al.,
2006).
Despite being the main cellular constituent of the reactive stroma around CRC (Kalluri &
Zeisberg, 2006; Ostman & Augsten, 2009), cancer associated fibroblasts (CAFs) are poorly
understood. Generally, they are believed to arise from local tissue fibroblasts or fibroblast
precursors that have been stimulated by PDGF and TGFβ. In vitro studies have shown that
they are able to enhance tumour cell proliferation (Nakagawa et al., 2004) and in vivo, high

66 | P a g e
levels of stromal CAFs have been linked with greater potential to develop metastasis or
recurrence (Henry et al., 2007). CAFs have also been shown to release VEGF, FGF and
CXCL12 that are pro-angiogenic thereby supporting neovascularisation. Furthermore, CAFs
activate Wnt signalling through the Wnt ligands PDGF and PGE2 which leads to EMT and
maintenance of the cancer stem cell phenotype (Wang et al., 2004a; Wang et al., 2004b;
Eisinger et al., 2006; Eisinger et al., 2007).
1.8.2. Angiogenesis
Neovascularisation is a prerequisite for tumour growth and survival. Hypoxia of the tumour
leads to activation of hypoxia-induced factor 1, which increases expression of angiogenic
factors such as VEGF, bFGF and PDGF by the tumour cells. This is usually an early event in
carcinogenesis and may explain how microvascular density is a predictor of survival in CRC
patients (Choi et al., 1998).
1.8.3. Extracellular matrix
The extracellular matrix (ECM) is a highly complex, 3-dimensional structure that not only
maintains tissue integrity but regulates other cellular processes such as cell migration,
differentiation and proliferation, acting as a reservoir for cytokines and growth factors. There
are two components to the ECM: the basement membrane and the interstitial or stromal
matrix. The basement membrane consists of thin sheets of specialised ECM that surrounds
epithelial cells and separates it from the interstitial stroma. It is composed of laminin and
type IV collagen with invasion by malignant cells usually requiring dissolution of the
basement membrane through a complex process. The stromal matrix contains polysaccharide
gels, proteoglycans and various fibrous proteins. Several alterations in the ECM constituents
have been associated with CRC formation. Laminin 332 is commonly lost as a premalignant
lesion becomes invasive. This parallels inactivation of Smad4 which is a positive

67 | P a g e
transcriptional regulator of all three genes that encode subunits of Laminin 332 (Zapatka et
al., 2007). Similarly, Syndecan 1 (a transmembrane heparan sulphate proteoglycan) is lost in
human CRC and its levels have been correlated with several clinicopathological factors in
CRC including TNM stage, lymph node metastasis and EMT (Hashimoto et al., 2008).
Several molecules of the ECM such as fibronectin, laminin and collagen interact with
integrins which are cellular receptors. Binding of integrins to these ECM molecules
influences adhesion, migration and sequestration of growth factors. In CRC, increased
integrin mediated ECM interactions are found in poorly differentiated cancers with
disruption of this integrin mediated adhesion resulting in apoptosis and reduced PI3K
activity.
The ECM is degraded by a number of different proteases including metalloproteases. The
expression level of several of these metalloproteases (MMP 1, 2, 3, 7, 9 and 13) are
increased in CRC and correlates with stage of disease (Zucker & Vacirca, 2004). MMP9
released by neutrophils has been associated with release of VEGF from ECM and is
increased during the transition from adenoma to adenocarcinoma. MMPs are inhibited by
another group of molecules called Tissue Inhibitors of metalloproteinases (TIMPs). The
expression of TIMP-1 has been linked to increased resistance to chemotherapy and shorter
survival time (Davidsen et al., 2006; Sørensen et al., 2007).
Mucins are glycosylated proteins that have been linked to CRC (Perez et al., 2008).
1.8.4. Growth Factors

68 | P a g e
Communication between the stromal and epithelial cells relies on secreted factors such as
growth factors and cytokines. Although growth factors are not responsible for tumour
initiation, progression of the tumour beyond this stage relies upon growth factors, which
play a pivotal role in clonal expansion, invasion across tissue barriers, angiogenesis and
colonisation at distant sites. Often, the mutations that develop in cancer cells enable them to
survive and proliferate in the absence of growth factors. However, there is also evidence to
suggest that growth factors are involved in chemotherapy drug resistance suggesting that
treatments where they are targeted could also be of benefit at later stages of CRC.
Several different growth factors have been implicated in CRC formation. They are compact
polypeptides, which bind to transmembrane receptors with tyrosine kinase activity. Through
their action on tyrosine kinase receptors, most growth factors share downstream intracellular
signalling pathways. These include mitogen activated protein kinase (MAPK), the
phosphatidylinositol 3-kinase (PI3K), phospholipase C-gamma and transcription factors like
signal transducers and activators of transcription (STATs) or SMAD proteins.
1.8.4.1. Epidermal growth factor (EGF)
The EGF family consists of 11 growth factors (EGF, Transforming Growth Factor (TGF-α),
Neuregulin (NRG 1-4), Amphiregulin, Betacellulin, Epiregulin, Heparin binding EGF (HB-
EGF) and Epigen) which share a conserved EGF domain. They bind to a group of four
receptor tyrosine kinases called ErbB1-4: ErbB-1 is also known as EGFR and ErbB-2 as
HER-2. Mutations, amplification or dysregulation of at least one of the ErbB family
members is found in > 20 % solid tumours. EGFR overexpression has been detected in up to
80 % of CRCs (LeGolvan & Resnick, 2010) and has been correlated with early tumour
recurrence and extra-hepatic metastatases (Christophi et al., 2008). Consequently, anti-
EGFR agents have been developed and are currently used to treat metastatic cancer.

69 | P a g e
Although the benefit of single anti-EGFR treatments are marginal, when used in
combination with conventional chemotherapy, there has been a positive impact on survival
in patients with metastatic disease (Wanebo & Berz, 2010; Tol & Punt, 2010). As some
authors have shown that this benefit is independent of EGFR expression in the primary
tumour (Chung et al., 2005), it is possible that EGFR expression in metastatic tissue differs
from the primary tumour. Despite the use of anti-EGFR agents in clinical practice, the
precise mechanism of how EGFR signalling contributes to tumour aggressiveness and
metastatic spread is unknown.
1.8.4.2. Vascular endothelial growth factor (VEGF)
The VEGF family consists of five glycoproteins: VEGFA, VEGFB, VEGFC, VEGFD and
PGF (placenta growth factor). Alternative exon splicing results in four isoforms: VEGF 121,
165, 189 and 206. VEGF 121 and 165 are secreted whereas VEGF189 and 206 bind to cell
surface heparin like molecules. VEGFs act through one of three receptors, VEGFR 1-3.
They play a role in tumour cell survival, migration, invasion and angiogenesis. In solid
tumours, release of hypoxia-inducible factor 1α (HIF-1 α) (Kaur et al., 2005), EGF (Niu et
al., 2002) and HGF (Dong et al., 2001) leads to increased levels of VEGF. VEGF then
induces the release of factors such as stroma derived factor 1 (SDF-1) which attracts cancer
associated fibroblasts (Christophi et al., 2008; Kalluri & Zeisberg, 2006). VEGF is a
therapeutic target in CRC as anti-VEGF therapy has been found to be effective in the neo-
adjuvant setting for metastatic CRC (Wanebo & Berz, 2010; Tol & Punt, 2010).
1.8.4.3. Transforming growth factor β (TGF- β)
There are three isoforms of TGF-β (1-3), however, the extended superfamily consists of
more than 30 additional cytokines, classified into different subfamilies like bone
morphogenetic proteins, activins etc. Under normal conditions, TGF-β prevents cell cycle

70 | P a g e
progression, stimulates apoptosis and differentiation. During carcinogenesis, however,
genetic and epigenetic changes convert TGF-β into a tumour promoter. It activates
epithelial-mesenchymal transition through activation of the canonical and non-canonical
pathways. TGF- β is also able to regulate the expression of angiogenic factors such as FGF
and VEGF. In CRC, the antiproliferative effects of TGF-β are lost through mutations in the
genes that encode TGF-β, the type II receptor (TGF-β2) or SMAD proteins (Markowitz &
Bertagnolli, 2009).
1.8.4.4. Insulin like growth factors (IGF)
The IGF family consists of two ligands (IGF1 and IGF2), two cell surface receptors (IGF1R
and IGF2R), six high affinity IGF binding proteins and IGFBP degrading enzymes.
Although IGF 1 activity is not required for malignant transformation, there is evidence to
suggest that it is essential for survival of transformed cells. It recruits the PI3K-AKT
pathway to generate anti-apoptotic signals and is able to have an action on most cells as it is
expressed in most types of tumour. High IGF-1 serum levels have been linked with high
IGF-1 receptor (IGF-1R) expression in tumour cells and development of hepatic metastases.
IGF-1 attracts endothelial cells and stimulates production of VEGF thus leading to increased
angiogenesis and supporting tumour growth.
1.8.4.5. Fibroblast growth factors
Fibroblast growth factors (FGFs) consist of a family of 22 structurally related polypeptides
that share a common core of 140 amino acids. In developmental processes, they are
responsible for mesoderm induction, anterior-posterior patterning, limb development, neural
induction and neural development. In mature tissues, FGFs are involved in angiogenesis,
keratinocyte organisation and wound healing processes that play a key role in proliferation

71 | P a g e
and differentiation of a wide variety of cells and tissues (Ornitz & Itoh, 2015). They interact
with one of four receptor tyrosine kinases (FGFR1-4) and one kinase deficient receptor,
FGFR5 (Ornitz & Itoh, 2001; Sleeman et al., 2001; Eswarakumar et al., 2005). Binding of
FGFs to its receptor results in receptor homodimerisation, autophosphorylation and
recruitment of cytosolic adaptors such as fibroblast growth factor substrate 2 (FSR2) which
initiates multiple signalling pathways (Eswarakumar et al., 2005; Beenken & Mohammadi,
2009) (see figure 1.8.1.below). Dysregulation of this signalling axis has been shown to play
a significant role in tumour development and progression of several cancers (Sugiyama et
al., 2010; Frullanti et al., 2011; Miura et al., 2012).
Figure 1.8.1. Signalling cascades involved in FGF-FGFR interaction
PLCγ
Activates
DAG-PKC and
IP3 pathways FRS2
SHP2 GRB2
FGF
Receptor
GAB1
PI3K
AKT
PIP2
PIP3
GSK-3β
SNAIL FOXO
EMT Cell
survival
SOS
RAS
RAF
MAP3K
MAPK
Cell different-iation

72 | P a g e
Fibroblast growth factor receptors (FGFR) 1-4 consist of three extracellular
immunoglobulin-type domains (D1-D3), a single span transmembrane domain and an
intracellular split tyrosine kinase domain. Alternative mRNA splicing gives rise to b and c
variants of FGFR1-3 therefore there are 8 types of receptor that can be expressed at the cell
surface (Eswarakumar et al., 2005; Turner & Grose, 2010). FGFs bind to D2/D3domains
with D3 interaction being responsible for ligand binding specificity. Heparan sulfate (HS)
binding is conferred through the D2 domain and it is likely that FGFRs are permanently
complexed with heparan sulfate on the cell surface (Powell et al., 2002). Each FGF binds
different FGFRs with differing affinity (Ornitz & Itoh, 2015). The specificity of FGFs
binding to cellular targets will be influenced not only by the type of FGFRs expressed by the
cell but also by the pattern of heparan sulfate binding that is generated by the cellular
enzymes.
Most FGFs are only capable of a paracrine action as they are secreted proteins that bind
heparan sulfates and therefore are usually caught up in the extracellular matrix of tissues that
contain heparan sulfate proteoglycans (Itoh & Ornitz, 2011). In comparison, members of the
FGF19 subfamily (FGF15, FGF19, FGF21, and FGF23) have poor affinity with heparan
sulphate and therefore are able to diffuse through the HS-rich extracellular matrix to enter
into the bloodstream (Goetz et al., 2007). This enables them to have an endocrine action
such as is seen with FGF15/19 which is produced by intestinal cells but acts upon FGFR4
expressed in the liver to downregulate CYP7A1 in the bile acid synthesis pathway (Jones,
2012). Similarly, FGF23 is produced in the bone but acts upon FGFR1 expressing kidney
cells to regulate vitamin D synthesis and maintain phosphate homeostasis (Razzaque, 2009).

73 | P a g e
Furthermore, the FGF19 subfamily members have poor affinity for their cognate FGF
receptors and cannot bind to them and activate them in a solely HS-dependent fashion.
Therefore, they require members of the Klotho family of proteins for high affinity receptor
binding (Kurosu & Kuro-O, 2009). There are different types of Klotho proteins that interact
with FGFs: α-klotho is the cofactor for FGF23, β-klotho for FGF15/19 and FGF21 (Kurosu
et al., 2006; Kurosu et al., 2007; Urakawa et al., 2006; Ogawa et al., 2007; Wu et al.,
2007b). Despite having widespread tissue distribution, sites of action of the endocrine FGFs
are limited by the distribution of klotho proteins (Fon Tacer et al., 2010).
Aberrant FGF signalling is found in many different cancers including cancer of the prostate,
breast, lung, bladder and colon (Brooks et al., 2012; Turner & Grose, 2010). The most
widely studied FGF in CRC is FGF2 which has a synergistic action with VEGF on
angiogenesis and has been shown to have prognostic relevance (Elagoz et al., 2006). Other
fibroblast growth factors that have been implicated in CRC include FGF19 and FGF7. As
alluded to earlier, FGF19 belongs to the endocrine family of FGFs and usually plays a role
in bile acid, protein and glucose metabolism (see figure 1.8.2.).
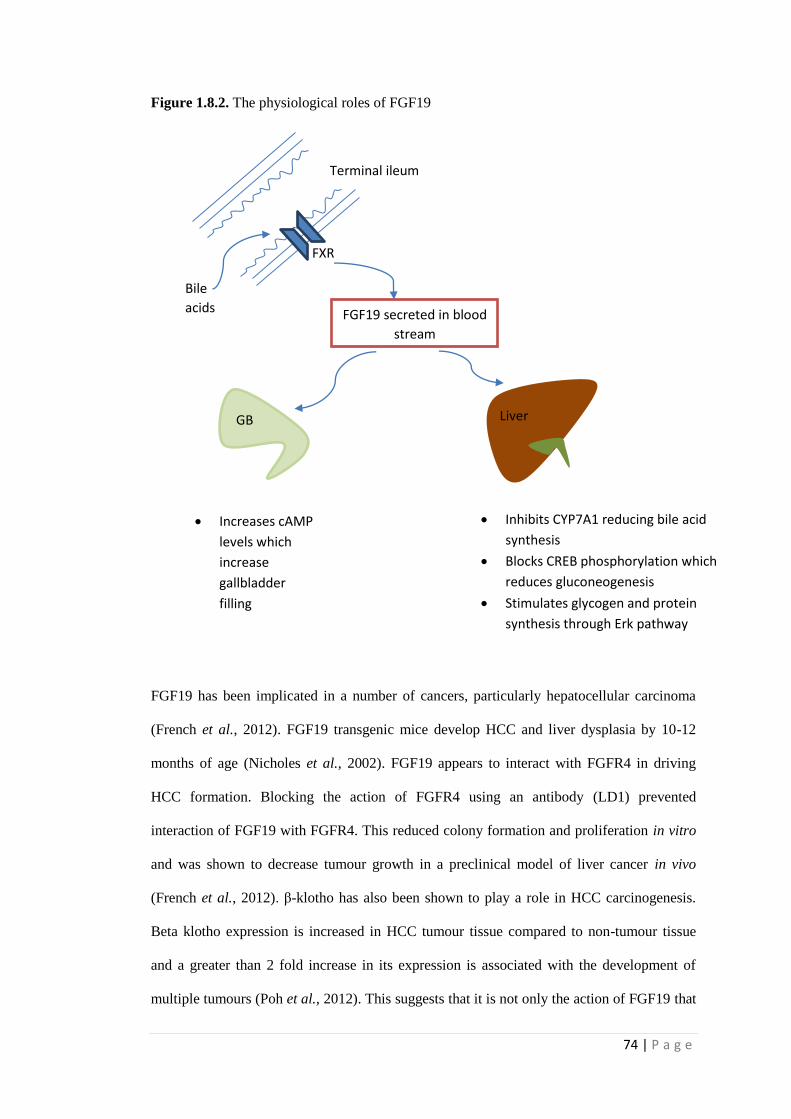
74 | P a g e
Figure 1.8.2. The physiological roles of FGF19
FGF19 has been implicated in a number of cancers, particularly hepatocellular carcinoma
(French et al., 2012). FGF19 transgenic mice develop HCC and liver dysplasia by 10-12
months of age (Nicholes et al., 2002). FGF19 appears to interact with FGFR4 in driving
HCC formation. Blocking the action of FGFR4 using an antibody (LD1) prevented
interaction of FGF19 with FGFR4. This reduced colony formation and proliferation in vitro
and was shown to decrease tumour growth in a preclinical model of liver cancer in vivo
(French et al., 2012). β-klotho has also been shown to play a role in HCC carcinogenesis.
Beta klotho expression is increased in HCC tumour tissue compared to non-tumour tissue
and a greater than 2 fold increase in its expression is associated with the development of
multiple tumours (Poh et al., 2012). This suggests that it is not only the action of FGF19 that
Bile
acids
FXR
Terminal ileum
FGF19 secreted in blood
stream
GB
Increases cAMP
levels which
increase
gallbladder
filling
Liver
Inhibits CYP7A1 reducing bile acid
synthesis
Blocks CREB phosphorylation which
reduces gluconeogenesis
Stimulates glycogen and protein
synthesis through Erk pathway

75 | P a g e
is important but that there is concurrent increase in the expression of its receptor and
cofactor that contribute to HCC formation.
Previous analysis suggests that FGF19 may also play a role in colorectal cancer by acting on
the wnt signalling pathway. Ectopic expression of FGF19 in transgenic mice results in
development of HCC and these liver tumours contain neoplastic cells with nuclear
localisation of beta-catenin indicative of activation. Co-activation of Wnt and FGF
signalling pathways in tumours leads to a more malignant phenotype and inhibition of beta
catenin using siRNA completely abolishes FGF19 expression in HCT116 cells suggesting
that beta-catenin influences FGF19 expression (Katoh, 2006).
Besides the direct action of FGF19 expression on tumour growth, modifications of its
receptor, FGFR4 have also been linked to carcinogenesis. Reduced expression of FGFR4
leads to upregulation of E-cadherin and downregulation of other epithelial-mesenchymal
transition (EMT) mediators such as SNAIL, TWIST and ZEB. E-cadherin loss has been
recognised as one of the central events in EMT as the study noted that such a change led to
an accompanied concurrent reduction in tumour growth both in vitro and in vivo models.
The in vivo tumours that were produced from FGFR4 silenced cells were not only smaller,
but consisted of a whitish aspect indicative of deficiency in angiogenesis (Peláez-García et
al., 2013). FGFR4 may also play a role in crosstalk between tumour associated fibroblasts
(TAF) that govern EMT and the tumour tissue itself. Upregulation of FGFR4 was observed
in CRC cells that were co-cultured with TAFs (Liu et al., 2013b). This study demonstrated
that inhibition of FGFR4 reduced TAF-induced signalling cascades including FRS2 and
ERK phosphorylation. Using both in vitro and in vivo models, suppression of FGFR4 was
able to reverse TAF-induced migration and invasion of CRC cells. The concept that was
proposed suggested that TAFs produce CCL2 which induces FGFR4 expression. FGFR4
overexpression leads to phosphorylation of beta catenin which translocates to the nucleus

76 | P a g e
and initiates expression of SNAIL. This represses expression of E-cadherin, which leads to
induction of EMT in CRC cells.
In contrast to FGF19, the studies investigating FGF7 and FGFR2b expression in cancer have
yielded conflicting results. Fibroblast growth factor 7 (FGF7), also known as keratinocyte
growth factor, is produced by cells of mesenchymal origin (Finch et al., 1989; Rubin et al.,
1989) and acts on epithelial cells through its interaction with a specific isoform of the FGF
receptor, FGFR2b (Miki et al., 1991). Generally, KGF is not expressed in epithelial cancer
cell lines (Dahiya et al., 1996; Iida et al., 1994; Knerer et al., 1998) except in a few cell lines
from pancreatic and breast cancer (Bansal et al., 1997; Siddiqi et al., 1995). In comparison,
tumour tissue usually expresses KGF. However, there is disagreement across the literature
with regards to whether KGF expression levels are higher (Siddiqi et al., 1995; Watanabe et
al., 2000) or lower (Knerer et al., 1998) in tumour tissue compared with paired normal
mucosa. Despite these differences, studies where in situ hybridisation is used to locate cells
expressing KGF have shown that it is usually expressed by stromal cells lying in close
proximity to cancer cells. Hence, cancer cells probably induce KGF production which
stimulates further epithelial cell proliferation.
FGFR2b is expressed in cancer cell lines including those of the breast, colon, stomach,
oesophagus, stomach, pancreas, prostate and oral mucosa. There is similar disagreement in
the literature with regards to whether expression levels are higher or lower in cancer tissue.
This is further complicated by the possibility of class switch. Reduced FGFR2b expression
has been associated with increased FGFR2IIIc expression, which confers a more malignant
phenotype and has been related to progression of prostate cancer and EMT in bladder cancer
cells (Carstens et al., 1997; Chaffer et al., 2006; Oltean et al., 2006). Conversely,
FGFR2IIIb and FGF7 have been shown to increase VEGF-A expression and are associated
with a poor prognosis in pancreatic cancer (Cho et al., 2007). Therefore, in certain

77 | P a g e
situations, FGFR2b actually helps to maintain differentiation, inhibit tumour growth and
tumour invasion and in others, it promotes venous invasion and tumour angiogenesis leading
to a more malignant form of cancer.
1.9 Genetic profiling in CRC
Genetic profiling refers to the process whereby a disease state is classified by a set of genetic
lesions that are consistently found across individuals with similar clinical disease and
tumour behaviour. It has the potential to identify patients with disease from healthy
individuals but also sub classify individuals believed to have the same disease based upon
pathological factors or response to treatment. As a consequence, it can be utilised to screen
amongst asymptomatic individuals and identify those at most risk of cancer. It can also be
translated to develop individual targeted molecular therapy where only agents known to act
upon the specific molecular subtype of cancer are given the therapy. The molecular
characteristics that are utilised to perform genetic profiling include differences at the -
i) chromosomal level (karyotype)
ii) nucleotide level (point mutations or variation of sequences)
iii) nucleotide-modification level (epigenetic features).
1.9.1. Techniques for genetic profiling
Multiple techniques have been previously employed to perform genetic profiling.
Conventionally, genetic analysis of patients with inherited syndromes with linkage analysis
has been effective at elucidating the genetic alterations that occur in diseases such as CRC
(Leppert et al., 1990; Lynch & de la Chapelle, 2003). This technique was effective at
identifying mutations in APC as the causative agent for FAP predisposition and highlighted
defective DNA mismatch repair genes in HNPCC.

78 | P a g e
Cytogenetics refers to ‘gross’ chromosomal analysis in which large deletions and initial gene
mapping is performed. This includes techniques such as G-band analysis, fluorescence in
situ hybridisation (FISH) and comparative genomic hybridisation (CGH). Based on the
analysis of 17p and 18q loci respectively, this approach discovered p53 and DCC in CRC
(Baker et al., 1989; Fearon et al., 1990; Jen et al., 1994). Cytogenetic evaluation has
identified two distinct modes of genetic instability in CRC, namely the microsatellite
instability pathway and chromosomal instability pathway (Lindblom, 2001).
Classical molecular analysis relies upon identification of mutations in individual genes that
then have to be associated with a specific disease state, have to satisfy the rules of causality
(as expressed by Koch) and be attributed to some clinicopathological feature of the disease
process such as diagnosis, prognosis or response to therapy. These techniques were effective
at elucidating the molecular changes that underpin the adenoma –carcinoma sequence as
described by Vogelstein (Vogelstein et al., 1988). The methods used to investigate multiple
genes in this manner include serial analysis of gene expression, micro-array and polymerase
chain reaction (PCR).
1.9.2. Micro-array analysis
Microarray technology has been utilised to investigate several aspects of CRC (Nannini et
al., 2009). Studies have investigated the carcinogenesis process itself by evaluating the
differences in gene expression between cancer tissue and control tissue. Genetic profiling
using micro-array methods has also enabled identification of genes that indicate a better
prognosis or can be utilised to determine if individuals will respond to chemotherapy agents.
The identification of genes or pathways in this way can contribute to the development of
biomarkers that detect disease, predict prognosis or determine outcome following treatment.

79 | P a g e
Previous investigators have demonstrated that it is possible to cluster individuals with
cancer, polyps and control based on gene expression profile of often a small number of
genes (Notterman et al., 2001; Kitahara et al., 2001; Grade et al., 2007). Furthermore,
studies have clearly identified that there is considerable molecular heterogeneity within CRC
patients that may explain the observed differences in prognosis and response to treatment
that cannot be justified based on existing clinicopathological features (Groene et al., 2006;
Perez-Villamil et al., 2012). Common processes that have been found to be dysregulated in
CRC across the studies include cell adhesion, cell communication, cell cycle regulation,
cellular and nuclei acid metabolism and cellular response to external stimuli. Although
microarray methods have been successful in this manner, it is important to realise that there
are some limitations to this approach.
There is little agreement in the genes that are identified in different studies and often
inconsistencies in the direction in which the change occurs. The authors of a recent review
propose that this may be explained by the use of different sample collection techniques or
different type of omics platform (Chan et al., 2008). There is no standardisation of
microarrays with some investigators custom making their chip and others using a
commercially available, though more expensive, chip. Similarly, there is no standardisation
of analytical techniques that are used for subsequent data analysis leading to variation in the
conclusions that are reached. Despite some of these shortcomings, microarray profiling has
led to the development of multiple gene marker panels that identify individuals most likely
to benefit from adjuvant therapy. Examples include Mammaprint (Agendia, Amsterdam,
Netherlands) and Oncotype Dx (Genomic Health, Redwood City, California) (Slodkowska
& Ross, 2009; Gray et al., 2011).

80 | P a g e
1.10. Field cancerisation
Most of the studies that have been conducted in colorectal cancer have focused on
describing the molecular changes found in cancer tissue itself and using these to develop
potential biomarkers for disease detection. Some investigators have argued that if one is
investigating early biomarkers of disease, the focus should be on the disease process rather
than the disease itself (Dakubo et al., 2007; Rubin, 2011). Therefore, using molecular
markers that are known to be mutated in CRC can lead to the identification of potential
targets that represent late changes in the disease process. Field cancerisation offers a
different approach to identify pathological changes that occur early on in the cancer process.
It refers to the concept that the genetic and environmental factors linked with colorectal
cancer inflict a diffuse field of injury that provides ‘fertile’ background upon which further
genetic and epigenetic events give rise to cancer. Therefore, the initial genetic or
environmental insult that preconditioned the colonic mucosa to cancer should not only be
detectable at the primary tumour site but should also be found throughout the entire colon.
These early changes do not give rise to a detectable difference in histological appearance of
the cells and therefore this process has been described as (Dakubo et al., 2007) –
"the process whereby cells in a particular tissue or organ are transformed, such that
genetically altered but histologically normal appearing cells predate the development of
neoplasia or coexist with malignant cells, irrespective of clonality".
The concept of field cancerisation was first introduced by Slaughter in 1953 (SLAUGHTER
et al., 1953) based upon a number of observations in head and neck squamous cell cancer –
i) Development of cancer in multifocal areas of precancerous change
ii) Abnormal tissue surrounds cancer
iii) Persistence of abnormal tissue after surgery may explain the local recurrence of
tumour at the same site

81 | P a g e
Since then, field cancerisation has been described in the colon as the ‘process whereby
colonic epithelial cells acquire pro-tumourigenic mutations that are insufficient to cause
morphological change but which predispose to tumour. It is the clonal expansion of these
mutant cells that results in large ‘patches’ or fields of tissue that are primed to become
neoplastic’ (Luo et al., 2014).
The ability to detect the early changes characteristic of field cancerisation could enable risk
stratification of both asymptomatic patients in the context of screening and aid development
of more accurate post cancer surveillance programs. Furthermore, at present,
chemoprevention trials investigating the use of pharmacotherapy in modulating a patient’s
risk of cancer rely upon the use the incidence of adenoma as a surrogate marker of colorectal
cancer. Consequently, a long period of follow up, often spanning many years, is required
reflecting the length of time it can take to form an adenoma. If an early marker of colorectal
cancer was identified, its use in such trials could considerably shorten the follow up period
required to determine efficacy.
1.10.1 Field defect in inflammatory bowel disease
In a similar manner to sporadic CRC, IBD-associated CRC also follows a multistep process
where inflamed, regenerative epithelium changes to hyperplastic epithelium, flat dysplasia
and eventually invasive adenocarcinoma (Riddell et al., 1983). Current screening of these
patients relies upon the identification of dysplastic lesions. Low-grade dysplasia is
associated with a risk of CRC of around 20 %, which warrants further surveillance
(Woolrich et al., 1992; Lennard-Jones et al., 1983; Levin et al., 1991). However, the
presence of high-grade dysplasia is indicative of a higher probability of coexisting cancer
and progression to carcinoma (around 60 %) which necessitates colectomy (Bernstein et al.,
1994; Connell et al., 1994). IBD associated neoplasia can therefore be used to risk stratify

82 | P a g e
patients and is indicative of colonic mucosa that had been preconditioned to form neoplasia.
As such, the field cancerisation theory has also been described for IBD as
‘the formation of a histologically indistinguishable area of clonally derived, mutant cells
within the inflamed segment of intestinal tract in IBD’ (Graham et al., 2011).
Molecular studies have found evidence to support a field defect in IBD. The same mutation
spectrum in either, TP53 and KRAS is seen in entire neoplastic lesions as well as non-
dysplastic crypts, suggesting that these mutant clones are involved in priming the colon for
cancer formation (Leedham et al., 2009; Graham et al., 2011). Further characterisation of
this field defect is necessary to aid risk stratification of these patients. Nevertheless, it
highlights that once dysplasia is identified in these patients, the entire colon is at risk of
developing cancer and warrants surgical removal.
1.10.2. Mechanism for field cancerisation
Several different mechanisms for how field cancerisation occurs in colorectal cancer have
been proposed (see figure 1.10. below). Based on the stem cell theory, a field defect may
occur when a epimutation or mutation occur in stem cells giving it reproductive advantage
so that it generates clonal descendants that outcompete neighbouring stem cells. These stem
cells replace all the stem cells in the crypt and through crypt fission, a patch of mucosa
containing several crypts with cells containing mutations is created. As further mutations
develop, a second patch of altered crypts is created within the first patch (Bernstein et al.,
2013). Eventually, a cell is generated that is capable of invasion and malignant growth.
Others have postulated that the widespread changes in methylation of genes found at distant
sites along the colon in cancer patients are explained by dietary exposure to vitamin B and

83 | P a g e
folate which alter the methylation state of macroscopically normal mucosa (Luo et al.,
2014). In contrast, there have been antagonists of field cancerisation who argue that these
changes occur in response to the tumour itself and do not predate malignant transformation
(Kuniyasu et al., 2000).
However, it has emerged that ‘more than 80 % of somatic mutations found in the mutator
phenotype of colorectal cancer occur before the onset of clonal expansion’ (Tsao et al.,
2000) and may be indicative of an underlying field defect. Furthermore, synchronous
cancers in the same individual have been shown to share similar epigenetic changes (Nosho
et al., 2009) suggesting that they may arise from the same mutated clone. There are three
theories that have been proposed to explain the common clonal origin of multiple primary
tumours (Braakhuis et al., 2003) –
i) Single cells or small clusters of cells migrate through the submucosa
ii) Cells are shed in the lumen of an organ at one place and grow at another which
has been used as a possible theory in oral cancer (Califano et al., 1999) or
bladder cancer (Bedi et al., 1996).
iii) There is a large contiguous genetically altered field in the epithelium in which
multiple clonally related neoplastic lesions develop.

84 | P a g e
Figure 1.10. Schematic representation of proposed mechanisms for formation of field
defect
1(a): A mutation or epigenetic alteration in a stem cell (depicted in red) is inherited by all
cells within the crypt through niche succession. Crypt fission results in several crypts
becoming biologically altered creating a patch defect. Further mutation within this field of
altered mucosa leads to malignant transformation.
1(b): Tumour secretes chemical signals that alter the adjacent mucosa resulting in a field
defect
1(c): Malignant cells shed from a tumour travel in the bloodstream and seed in a distant site
rendering the mucosa susceptible to malignant transformation

85 | P a g e
1.10.3. Field cancerisation in CRC
There is emerging molecular evidence to suggest that genetic changes seen in cancer tissue
can be detected in adjacent macroscopically normal appearing mucosa (MNM) of the colon
(Shen 2005, Chai 2009, Facista 2012, us 2015) lending support to the field cancerisation
theory. However, clarity regarding which cellular processes and genes are dysregulated in
the adjacent MNM are lacking. Furthermore, although some of the early studies attempting
to translate this concept into clinical practice are promising, the utility of field cancerisation
in a clinical setting needs further evaluation.
1.11. Summary
Colorectal cancer prognosis remains poor as it is usually diagnosed at a late stage when
patients present with symptoms. Despite considerable efforts to develop screening programs
to detect disease at an early stage in asymptomatic individuals, current tests lack specificity,
are invasive or poorly tolerated by the general population. There have been considerable
advances in our understanding of colorectal cancer formation, however, there is a relative
paucity of translation of these findings into the clinical arena. Some have criticised
investigators on focussing on the tumour tissue itself which has already undergone
malignant transformation and therefore harbours biological changes that occur relatively late
in the cancer pathway. Instead, a different perspective is required where the early changes
that occur prior to malignant transformation are identified. Field cancerisation offers such an
approach as it eludes that the ‘normal’ mucosa adjacent to cancer contains early biological
changes that contribute to cancer formation. Characterisation of this field ‘defect’ could thus
enable better screening tests to be developed and would facilitate more accurate estimation
of future neoplastic risk compared to existing modalities which rely upon detection of
polyps. In addition, individuals deemed to be at high risk could undergo targeted
pharmacotherapy, which would modulate their risk of colorectal cancer prior to the
development of any histological abnormality in their colon.

86 | P a g e
1.12. Research hypothesis, aims and objectives.
1.12.1. Research Hypothesis
The present research hypothesis is-
‘The macroscopically normal mucosa adjacent to polyps and cancers differs from that in
control subjects therefore field cancerisation takes place in the colon.’
1.12.2. Research aims
The research aims are –
i) to determine if colorectal adenomas are reliable markers of field effect in the
colon
ii) to characterise the global gene expression profile of macroscopically normal
mucosa (MNM) adjacent to cancer, adenomas and in control subjects
iii) to investigate the role of fibroblast growth factors in field cancerisation and
CRC formation
1.12.3. Research objectives
Although polyps are well established as a precursor lesion for CRC, evidence to support
their role in identifying individuals with a field defect are lacking. Thus, the first chapter will
investigate the utility of polyps as a biomarker of field cancerisation in CRC. The
assumption being that CRC survivors that develop polyps in the remaining bowel after
surgery are more likely to have a diffuse field of altered mucosa and therefore are at higher
risk of both polyp and cancer recurrence. Similarly, those with synchronous polyps at time
of diagnosis are also more likely to harbour a field defect and therefore would be expected to
exhibit poorer survival.

87 | P a g e
In the next chapter, the global gene expression profile of the macroscopically normal
mucosa around cancer or polyp will be compared to that found in control subjects using
micro-array technology. The findings from this study will help to identify important genes
that are dysregulated and this will then be validated in the subsequent chapter.
In the final chapter, the role of fibroblast growth factor 7 and 19 will be investigated to
determine the contribution of stromal elements to field cancerisation. As most of the studies
investigating field cancerisation have focussed on changes occurring in the epithelial cells
themselves, it will be important to evaluate how growth factors released by stromal cells
precondition the mucosa to CRC formation.

88 | P a g e
Section 2: Subjects,
Materials and Methods

89 | P a g e
2.1. Ethical approval
This was part of a prospective NIHR observational cohort study (FaMISHED- Food and
Fermentation using Metagenomics in Health and Disease designed to evaluate the role of
biomarkers in gastrointestinal diseases, including colorectal cancer. Ethical approval was
granted by Coventry and Warwick Local Research Ethics Committee (ref MREC ref no
09/H1211/38) and University Hospital Coventry & Warwickshire Research & Development
division. Funding was obtained from various sources including the Bowel Disease Research
Foundation and the Colorectal Cancer Research Fund at University Hospitals of Coventry
and Warwickshire NHS Trust
All participants provided written informed consent in accordance with the Declaration of
Helsinki.
2.2. Setting and participants
Subjects were either recruited at time of endoscopy (both screening and symptomatic) or at
time of surgery. Written informed consent was gained.
2.2.1. At endoscopy
Mucosal pinch biopsies were taken from the caecum and rectum in all subjects. Participants
who were diagnosed with polyps or a cancer also underwent biopsy of macroscopically
normal mucosa (MNM) within 1 cm of the lesion. This was classified as MNM adjacent to
polyp/cancer. Although biopsies were taken from cancer tissue itself, this was not possible
for polyps therefore the values of gene expression given under the name ‘polyp’ refer to
tissue adjacent to the polyp rather than the polyp tissue itself. Polyps that have been removed
endoscopically require histopathological analysis to determine there are no cancerous
elements, hence, it was not possible to use this tissue for research purposes.

90 | P a g e
2.2.2. At surgery
The colectomy specimen was collected after bowel resection and taken to the pathology
department. In conjunction with the histopathologist who would be examining the specimen,
the specimen was opened and mucosal biopsies were taken from the areas outlined in figure
2.2. The sample taken from the most distant margin to the tumour was utilised for analysis
as the nearer margin may contain altered mucosa through a field defect. In a subset of
patients, serial biopsies were taken at 3cm, 5 cm and 10 cm from the tumour edge. Patients
who had undergone neoadjuvant chemoradiotherapy were excluded from the study as this
has been shown to alter tumour biology and subsequent clinical outcome (Rödel et al.,
2005).
Figure 2.2. Sampling sites. Photo of right hemicolectomy specimen showing site of
sampling marked with crosses (white – tumour, blue – adjacent MNM, green- 3 cm distal to
tumour, black – 5 cm distal to tumour and yellow – distal resection margin.

91 | P a g e
2.2.3. Sample processing
Tissue samples were taken for three purposes; for RNA analysis, for protein analysis and for
immunohistochemistry. Hence, each biopsy was divided into three parts and stored in RNA
later (Fisher Scientific, UK), formalin or snap frozen using liquid nitrogen. All samples were
stored at -80 oC for long term storage.
2.2.4. Collection of blood samples
Blood samples were taken at time of endoscopy or on the day of surgery. In a subset of
patients, samples were collected after overnight fast on the morning of surgery/endoscopy
for the measurement of FGF19 which has both a diurnal variation and responds to oral
intake (Lundåsen et al., 2006; Reiche et al., 2010). Samples were collected in
ethylenediaminetetraacetic acid (EDTA) tubes and thrombin based clot serum separator
tubes (serum collection). Samples were spun at 25000 g for 15 mins and the supernatant was
aliquoted for serum and plasma analysis. These samples were stored at -80 oC for long term
storage.
2.2.5. Study design
For the purposes of gene expression analysis, patients with cancer were age and sex matched
with control subjects. Cancer patients with right sided tumours or polyps (caecum to mid
transverse) were matched to caecal samples taken from control subjects and patients with
left sided tumours/polyps (distal to mid transverse) were matched with rectal samples from
control subjects. This is because initial analysis revealed differences in the genes being
measured in the right colon compared to the left colon.

92 | P a g e
2.3. Micro-array methods
2.3.1 Participants
Subjects (n=16) were recruited into the study from December 2010 to April 2011. Informed
consent was obtained from all patients. Mucosal pinch biopsies were taken at time of
endoscopy from macroscopically normal mucosa within 1 cm of polyp (n=6) or cancer
(n=5). In healthy controls (n=5), biopsies were taken from the caecum and rectum.
Diagnosis was confirmed by histology and patients were divided into three groups: control,
polyp and cancer. The clinico-pathological characteristics of these patients are given in table
2.3. All tissue specimens were taken and immediately placed in Qiazol prior to being frozen
and stored at -80 deg C.
Table 2.3: Demographic and clinical details of patients that were included in the microarray
study. The reference numbers refer to each individual patient in the three groups. Patient
(Adc-5) did not undergo surgical resection therefore there is no TNM staging available for
this patient.
Sample
type
Reference
Number
Gender Age Indication/clinical details Histology
Control C1 M 82 Change in bowel habit Normal
C2 M 80 Acute diarrhoea Normal
C3 M 75 Change in bowel habit Normal
C4 F 67 Abdo pain, PR bleeding Not done
C5 F 83 Microcytic anaemia Not done
Polyp Pol-1 F 60 4 mm sigmoid sessile TVA + LGD
Pol-2 M 79 3 mm sigmoid sessile TA + LGD
Pol-3 F 71 4 mm sigmoid sessile TVA + LGD
Pol-4 M 61 3 mm transverse sessile Hyperplastic
Pol-5 M 53 Small rectal polyp TA + LGD
Pol-6 F 77 5 mm splenic pedunculated TA + LGD
Cancer Adc-1 M 53 Rectal T3N0M0
Adc-2 M 62 Rectal T2N0M0
Adc-3 M 66 Polyp cancer sigmoid T1
Adc-4 M 72 Hepatic flexure T3N0M0
Adc-5 F 81 Rectal Poorly diff cancer Abdo pain=abdominal pain, TVA – tubulovillous adenoma, TA – tubular adenoma, LGD – low grade dysplasia, Poorly diff =
poorly differentiated cancer. TNM staging used for cancers.

93 | P a g e
2.3.2. Experimental design
The SurePrint G3 Human Gene Expression 8x60K Gene Expression array was utilized. This
consists of 62, 976 probes of which 42, 405 are unique. Agilent have developed an inkjet
method which prints oligonucleotides onto the surface of a glass slide similar to a colour
printer where the four ink colours are replaced with the nucleotides ATCG. Based on
oligonucleotides of 60 bases in length, differences in gene expression between samples were
assessed in a 2 channel micro-array experiment (see fig 2.3.).
Figure 2.3. Two channel microarray experiment
RNA isolation
mRNA
Reverse transcription with
fluorescent tag labelling
cDNA (Red
fluorescent probe)
cDNA (Green
fluorescent probe)
Targets combined and hybridised against
micro-array chip to generate heat map

94 | P a g e
2.3.3. Isolation, purification and quantification of RNA
RNA was extracted from the mucosal biopsy tissue (approximately 0.2 mg) using Qiazol
(Qiagen, UK) and total RNA was extracted using a spin column (RNeasy Mini Tissue Kit:
Qiagen, UK) according to manufacturer’s instructions. Quantification was performed using a
spectrophotometer (Nanodrop ND-1000, Labtech, UK) by measuring absorbance at 260 nm
wavelength.
2.3.4. Genechip micro-array assay method
All experiments were performed in triplicate. Total RNA samples were quality checked on
an Agilent Bioanalyser 1200 (Agilent Technologies Inc, Santa Clara, CA, USA) and only
RNA Integrity numbers between 6.5 and 9.8 were selected. The RNA concentrations were
normalised to 100ng in 1.5µL and the Low Input QuickAmp Labelling Kit Protocol (Agilent
Technologies) was followed according to manufacturer’s instructions. This uses a T7 RNA
Polymerase to simultaneously amplify target material and incorporate cyanine 3 or cyanine 5
labelled CTP. A universal RNA reference was labelled with Cyanine 5-CTP. The samples
were labelled in randomised batches with Cyanine 3-CTP and yields and specific activities
were tested to ensure they were in the recommended ranges. The labelled cRNAs were
hybridised to SurePrint G3 Human Gene Expression 8x60K Gene Expression arrays
(AMADID 028004; Agilent Technologies) according to manufacturer’s instructions. The
arrays were washed in Gene Expression Wash Buffer 1 and Gene Expression Wash Buffer 2
and immediately scanned in an Agilent GA2565CA scanner at 2µm resolution. The data
were extracted using Feature Extraction v10.7.3.1 with default settings appropriate to the
array design.

95 | P a g e
2.3.5. Micro-array data analysis
Bioinformatic software was used to convert the output images into data for further analysis.
Data normalisation was performed both within array (Lowess) and between array
(Aquantile) using the Agilent microarray scanner. Summarisation was performed as despite
more than 62,000 probes, only 42, 405 probes were unique. The Bioconductor R package
was used for statistical analysis. In the lmFit function, either ‘ls’ (LIMMA) or ‘robust’ (RR)
were used for the two different types of data analysis to identify differentially expressed
genes (DEGs). Previous studies have utilised a similar approach with multiple statistical
methods to reduce the likelihood of false positives (Xu et al., 2013). For the functional
analysis, genes found with either statistical method were used as a larger pool of genes
would more likely represent the cellular processes that were dysregulated. Furthermore, two
different types of analysis were undertaken (Figure 1). In the first analysis, functional
analysis was performed using DAVID software (Huang et al., 2009a). Using DAVID
software, the genes were classified into biological functional terms. The enrichment ratio of
genes in each category was calculated as a means of determining how prevalent these genes
were compared to the background levels of expression. An enrichment ratio of greater than
1.33 was considered to be significant.
In the second analysis, functional analysis was undertaken using PANTHER software (Mi et
al., 2013). Three separate analyses were undertaken; cellular components, molecular
function and biological process. A statistical overrepresentation test was performed using the
DEGs in each category to identify biological processes that were overrepresented in the
DEGs list compared to the background level of gene expression. A p value of <0.05 was
considered significant.
Although both methods compare DEGs with background levels of gene expression, the way
in which the genes are clustered differs. The first analysis clusters genes according to
biological process only whereas the second analysis used molecular function and cellular

96 | P a g e
component. This enhanced the understanding of which cellular compartments were affected
along the adenoma-carcinoma sequence and enabled linkage of this to molecular/biological
function.
Figure 2.4: Analysis of micro-array data showing thresholds used for each statistical
method and details of the functional analysis. FC is fold change difference between the
groups being examined.
42,405 probes
Analysis 1
(DAVID)
LIMMA (n=16)
p<0.05, FC>1.5
RR(n=15)
Adj. p<0.05
Analysis 2
(PANTHER)
LIMMA (n=15)
p<0.05, FC>1.5
RR (n=15)
p<0.05, FC>1.5

97 | P a g e
2.4. Gene expression
2.4.1. RNA extraction and processing
RNA was extracted from mucosal biopsy tissue stored in RNA later (approximately 0.2 mg).
This was homogenised in 1 mL Qiazol (Qiagen, UK) and total RNA was extracted using a
column based isolation method (RNeasy Mini Tissue Kit: Qiagen, UK) according to
manufacturer’s instructions. This gave 30 µL of RNA. A DNase I Kit (Sigma) was utilised
to remove possible genomic DNA. 3.5 µL (1000 U/mL) DNase I digestion enzyme and 3.5
µL reaction buffer were added for 15 minutes at room temperature followed by 3.5 µL stop
solution (50mM EDTA). The solution was centrifuged for 8 seconds and heated to 70oC for
10 minutes then chilled on ice. Quantification was performed using a spectrophotometer
(Nanodrop, Labtech) at absorbance of 260 nm using 1.5 µL sample in duplicates. The ratio
between absorbance at 260/280 nm and at 260/230 nm were measured to determine RNA
purity. RNA with a value between 1.8 and 2.1 was deemed appropriate for use.
RNA integrity was also evaluated using agarose gel electrophoresis with ethidium bromide.
A 1.5 % agarose gel was made by adding 1.5 g agarose to 150 mL 1x TAE (Tris base, acetic
acid and EDTA). The agarose was dissolved by heating for 60 seconds in a 900-watt
microwave. The solution was cooled before adding 4 µL 1 µg/ml ethidium bromide. After
the gel had set, eight lanes with 2 µL RNA were loaded. 1x TAE was used as a buffer during
the 60-minute electrophoresis at 100 V. The gel was viewed under UV light to show
ethidium bromide incorporated DNA and images were taken (ChemiGenius). If there were
two sharp distinct bands representing 18S and 28S, the RNA was considered to be of
acceptable integrity for use.

98 | P a g e
2.4.2. Complimentary DNA (cDNA) synthesis
cDNA was synthesised using a Bioline kit (#BIO-65026). Based on quantification as
outlined above, 250 ng RNA per sample was used to make complimentary DNA (cDNA).
The following were added to a 200 µL sterile micro centrifuge tube –
RNA (250 ng)
1 µL random hexamers 50-250 ng (Bioline, UK)
1 µL 10 mM dNTP mix (Invitrogen, UK).
RNase free water
to a total volume of 10 µL.
Samples were vortexed, spun briefly and heated to 70 oC for 5 minutes and chilled on ice for
2 minutes. Samples were mixed with 10 µL reverse transcription master mix (4µL of 5X
reaction buffer, 1µL RNase inhibitor, 0.5 µL reverse transcriptase (200u/μL) made up to
10µL by adding RNase free water) giving a total volume of 20 µL. Each sample was mixed
thoroughly, briefly centrifuged and incubated at room temperature for 5 minutes. The
samples were transferred to a thermocycler (Biorad, UK). This enabled the samples to be
heated for 37 oC for 5 mins, 42 oC for 55 minutes and 70 oC for 15 minutes to make cDNA
which was stored at -20 oC until use.
2.4.3. Quantitative real-time Polymerase Chain Reaction (qRT-PCR).
This was carried out using an ABI 7500 standard Sequence Detection System (Applied
Biosystems, UK). Reactions were prepared to 25 µL volumes in a 96 well plate, each
containing the following –
Taqman universal PCR mastermix 12.5 µL (Applied Biosystems, UK)
cDNA 1 µL
Commercially available TaqmanTM Gene Expression Assay (Applied Biosystems,
UK).

99 | P a g e
Samples were processed in triplicate and a housekeeping gene 18 S (ribosomal RNA) was be
used as an endogenous control in each reaction. Reactions were carried out at 50 oC for 2
minutes, 95 oC for 10 minutes and then 40-44 cycles of 95 oC for 15 seconds, followed by 60
oC for 1 minute. Pre-designed Taqman primers were used (Applied Biosystems, UK, FGF7
(Hs00940253_m1); FGF19 (Hs00192780_m1); FGFR2 (Hs01552918_m1); FGFR4
(Hs01106908_m1); CXCL2 (Hs00601975_m1), FUT2 (Hs00704693_s1), MUC2
(Hs00894043_g1), MUC5AC (Hs00873651_mH), GADD45B (Hs00169587_m1), S100P
(Hs00195584_m1), SLC46A1 (Hs00560565_m1) and PSCA (Hs04177224_g1). All
reactions were multiplexed so that both the target gene primer and housekeeping gene
primer were included in the same well. Each sample was processed in triplicate. A ΔCt value
was determined for each well by subtracting the Ct value of the housekeeping gene from that
of the target gene. The mean ΔCt was calculated for each sample by taking the average of the
triplicates. All statistical analysis was performed using the inverse of the ΔCt which is a
measure of level of gene expression. Relative fold change difference in gene expression was
calculating by 2- ΔΔCt where ΔΔCt is ΔCt (control sample) subtracted from ΔCt (test sample,
that is cancer or polyp).
2.5. Protein expression
2.5.1. Protein extraction
Snap frozen colonic samples were homogenised and re-suspended in 1 mL of protein lysis
buffer. The latter consisted of 5mL of 1x radioimmunoprecipitation (Tripathi et al.)
(Millipore, UK) with 100µL of dissolved protease and phosphatase inhibitors (2 Roche
Complete Mini protease inhibitor cocktail tablets with 8 mg sodium fluoride (Fisher
Scientific) and 20 mg sodium vanadate (Acros Organics) in 2 mL 1x RIPA. Protein
concentration was measured using Bio-Rad detergent compatible protein assay kit (Bio-Rad
Laboratories, CA). A standard curve of absorbance against protein concentration was created
using a series of known dilutions of bovine serum albumin (BSA, fraction V, Sigma, UK) (2

100 | P a g e
µg/µL) in the range 0 to 6 µg/µL. The absorbance of both samples and standards was
measured at a wavelength of 595 nm, using a spectrophotometer (Tecan, UK), allowing the
protein concentration (µg/µL) of samples to be determined.
2.5.2. Western blot analysis
This was conducted in a manner similar to previously described (Alhusaini, et al., 2010).
25 – 30 µg of protein was loaded onto a 7.5 – 10% polyacrylamide gel (Geneflow Ltd,
Fradley, UK), under reducing conditions. Proteins were resolved by SDS-PAGE at 100V for
60 – 90 minutes and then transferred to Immobilon-P transfer membranes 0.45 μm pore size
(Fisher Scientific, UK). The membrane was blocked for 60 minutes in 0.2 % I-Block PBS-
tween (PBST) and was then incubated in primary rabbit-derived antibody diluted in 0.2 % I-
Block PBST (FRS2 1:1000, Abcam, UK; pFRS2 – 1:250; pErk 1:2000, Erk 1:2000, pAKT
1:1000 and AKT 1: 1000; β-actin 1:70,000 (Cell Signalling, UK) at 4ºC overnight. Equal
protein loading was determined by measuring β-actin expression. Membranes were washed
three times for ten minutes in PBST and were then incubated in anti-rabbit IgG (whole
molecule), horseradish peroxidase antibody produced in goat, IgG fraction of antiserum,
buffered aqueous solution (Sigma #A9169). A chemiluminescent detection system
ECL/ECL+ (GE Healthcare, UK) enabled visualization following exposure on hyperfilm MP
(Fisher Scientific, UK). Intensity was determined using densitometry (GeneTool software,
Syngene, UK) and expression values obtained were normalised against those of β-actin.
2.6. Serum analysis
Serum concentrations of FGF7 and FGF19 were measured using Quantikine ELISA FGF19
kit (intra-assay CV – 3.6-6.4%) and inter-assay CV – 4.5-5.5%) (R&D systems, UK) and
Quantikine ELISA FGF7 kit (intra-assay CV – 3-3.5% and inter-assay CV 5.2-7.7%) (R&D
systems, UK) according to manufacturer’s instructions. A standard curve was created using
serial dilutions of FGF19 standard or FGF7 standard (R&D systems, UK). 100 µL serum

101 | P a g e
was utilised in each reaction and the assay was performed in duplicates. The absorbance of
samples and standards was measured at a wavelength of 570 nm, using a spectrophotometer
(Tecan, UK) which enabled the concentration (pg/mL) of the samples to be determined by
comparison with the standard curve.
Serum concentration of CXCL2 was measured using the MIP2 (CXCL2) Human Simple
Step ELISA kit (intra-assay CV – 2.8 % and inter-assay CV – 3.5 %) (Abcam, UK -
ab184862). A standard curve was created using serial dilutions of CXCL2 in duplicates.
Serum samples were diluted at a ratio of 1:16 and 50 µL diluted serum was utilised in each
reaction. The assay was performed in duplicates and the absorbance was measured at a
wavelength of 450 nm using a spectrophotometer (Tecan, UK). The serum CXCL2
concentration was calculated based on the standard curve and dilution ratio.
2.7. Statistical analysis
Statistical analysis was undertaken using Microsoft Excel and IBM SPSS Statistics 21.0.
Parametric data were expressed as mean ± SEM and comparisons between groups have been
made using the unpaired two-tailed Student’s t test and within groups, using the paired
sample t test. Non-parametric data have been described using median ± interquartile range.
Multivariate logistic regression was utilised to determine which variables, including level of
gene expression, were predictive of cancer in subjects. A multivariate linear regression
model was utilised to determine patient and pathological factors that affect serum
concentration of the proteins measured. A p value < 0.05 was considered as statistically
significant and significance levels have been indicated as follows; *P<0.05, **P<0.01, ***P
<0.001.

102 | P a g e
Chapter 3: Colonic polyps
are biomarkers of field
cancerisation in colorectal
cancer

103 | P a g e
3.1 Introduction, aims and objectives
3.1.1 Introduction
A large body of epidemiological, post mortem, clinical and molecular evidence exists to
support the notion that adenomas are the precursors to colorectal cancer (Muto et al., 1975;
Stryker et al., 1987; Vogelstein et al., 1988; Winawer et al., 1993; Olsen et al., 1988). A
single adenoma develops into a cancer at a rate of approximately 0.25 % to 1 % per year
(Eide, 1986; Otchy et al., 1996; Morson & Bussey, 1985; Wilson & Lightwood, 2001). The
exact risk of progression into cancer varies with the number of polyps (Winawer et al., 1993;
Atkin et al., 1992), size (Muto et al., 1975; Stryker et al., 1987; Eide, 1986), histology (Eide,
1986; Yang et al., 1998), age and sex (Jensen et al., 1996; van Stolk et al., 1998; Noshirwani
et al., 2000; Martínez et al., 2001). Strategies aimed at reducing the incidence of adenomas,
such as screening colonoscopy, have successfully reduced colorectal cancer related mortality
confirming that removal of adenomas is important in preventing CRC formation (Thiis-
Evensen et al., 1999; Mandel et al., 1999; Scholefield et al., 2002; Atkin et al., 2010;
Jørgensen et al., 1993).
The role of adenoma detection in CRC survivors is less well understood. Although,
adenomas have been found to predict a higher rate of synchronous and metachronous cancer
(Chu et al., 1986; Neugut et al., 1996), the rate of adenoma recurrence in these patients
varies substantially between 8 % and 46 % across the literature (Khoury et al., 1996;
Patchett et al., 1993; Barlow & Thompson, 1993; McFall et al., 2003; Kawai et al., 2012),
depending upon the frequency of surveillance colonoscopy and mode of reporting outcomes.
If patients who undergo resection for CRC continue to develop polyps in the remaining
bowel, it suggests that they are at increased risk of developing a metachronous cancer.
Furthermore, it suggests that the mucosa is preconditioned to develop neoplasia as described
by the concept of field cancerisation. When field cancerisation was first described by

104 | P a g e
Slaughter (SLAUGHTER et al., 1953) , his theory was based on the observation that higher
rates of recurrent head and neck squamous cell cancer occurred at the site of previous
resection. Although there have been several reports investigating the factors that predispose
to polyp recurrence and metachronous colorectal cancer (Kawai et al., 2012; Huang et al.,
2015; Gervaz et al., 2005; Chu et al., 2003), few have examined the link between the
incidence of polyps and neoplastic risk, in terms of metachronous lesions and local
recurrence. Previous reports have found that patients who develop polyps in the remaining
bowel after CRC resection actually have an improved disease free survival (Kronborg et al.,
1986; Chu et al., 1986). The implications of this are twofold; firstly, polyps may not be an
early marker of a field defect but represent areas of mucosa that have already become
neoplastic. In other words, polyps are too far along the neoplastic process to represent field
change. To clarify this further, studies need to investigate the macroscopically normal
mucosa (MNM) around a polyp. If this mucosa contains aberrant cellular processes and
signalling, it would suggest that polyps, like cancer, also develop in fields of altered mucosa.
Secondly, these studies highlight that detection and removal of polyps is protective against
cancer development and this may be the reason for the improved survival. The group of
patients who do not develop polyps cannot benefit from endoscopic examination in the same
way and may be developing recurrence through alternative CRC pathways such as the
serrated polyposis pathway. Alternatively, patients with synchronous polyps are more likely
to have DNA mismatch repair and undetected HNPCC which confers a survival benefit
(Stigliano et al., 2008). In addition, there are a multitude of other factors that can have an
effect on survival and these have not been accounted for in the earlier reports. More recent
studies, however, have also demonstrated similar findings (Mattar et al., 2005).
Nevertheless, there is a body of literature which links synchronous polyps at time of
resection with a higher rate of metachronous polyps and cancers highlighting that polyps
could be marker of a field effect.

105 | P a g e
3.1.2. Aims and objectives
The objective of this study is to investigate if polyps or adenomas are an indicative marker
of field cancerisation in CRC. If they represent mucosa at risk of malignant transformation,
it would follow that presence of polyps or adenomas is associated with higher incidence of
metachronous neoplastic lesions and local recurrence thus, poorer survival of these patients
would be expected.
The aim of this study is to investigate the impact of
i) Synchronous adenomas (SA) (adenomas identified at preoperative colonoscopy)
ii) Metachronous adenomas (MA) (adenomas identified on surveillance
colonoscopy)
on local recurrence, 5 year overall and disease free survival of patients with CRC.
Patients undergoing colonoscopy where a polyp was found and either not removed or not
retrieved were classified as having no adenomas. Only patients in whom the polyp was
examined histologically and confirmed to contain adenomatous tissue were included in the
SA or MA group. Patients with hyperplastic, metaplastic or inflammatory polyps were not
included in the SA or MA groups.
3.2 Materials and methods
University Hospitals of Coventry and Warwickshire (UHCW) NHS Trust is a tertiary
referral centre with a catchment population of half a million. Over the last 12 months, 270
patients were diagnosed with CRC, of whom, 167 underwent major surgery. UHCW keeps a
prospective database of all patients diagnosed with CRC whom are discussed at the

106 | P a g e
multidisciplinary team (MDT) meeting. This database was utilised to identify patients with
CRC between 2006 and 2012. The following inclusion and exclusion criteria were applied –
Inclusion criteria
• Patients diagnosed with colorectal adenocarcinoma who have undergone
surgical resection at UHCW between 2006 and 2012.
• Any mode of presentation so that both screening and symptomatic patients were
included.
Exclusion criteria
• Patients with stage IV disease at time of diagnosis or at time of resection
• Patients with cancer confined to an adenoma
• Patients who have not had a surgical resection
• Patients that are known to have genetic predisposition to CRC
• Patients with inflammatory bowel disease
Hospital electronic records were scrutinised to obtain data on patient demographics,
operative details, pathological findings, endoscopic observations and survival.
The local Trust policy regarding follow up of CRC patients involves yearly clinic review
with routine blood tests including an annual serum carcinoembryogenic antigen (CEA). All
patients undergo inspection of their anastomosis within one year of surgery with either a
flexible sigmoidoscopy or colonoscopy depending upon site of surgery. A further
colonoscopy is performed at 5 years unless there are positive findings in the first
investigation. These patients undergo interval colonoscopies as per the polyp surveillance
guidelines. A CT scan is performed at 3 years and 5 years after surgery. Patients are usually
discharged after 5 years if they remain disease-free.

107 | P a g e
3.2.1. Data analysis
Synchronous polyps were defined as either polyps found at index colonoscopy or polyps
found in the resection specimen by the pathologist. The findings of the pre-operative
investigation were combined with the pathological details and the cumulative rate of
synchronous polyps (SP) with polyp and adenoma characteristics have been presented. Any
polyps that were discovered on subsequent colonoscopy after surgery were classified as
metachronous polyps (MPs). Short term (0-24 months) and mid-term outcomes (0-60
months) were calculated based on cumulative colonoscopy findings over this period of time.
Overall survival (OS) was calculated from the date of surgery to the date when the patient
was last seen alive in the hospital. Disease free survival (DFS) was calculated between the
date of surgery and the date when the patient was last seen without disease recurrence in the
oncology or surgical clinic. In patients with local recurrence or metastasis, the date when
this was diagnosed on imaging was utilised to calculate disease free survival.
Local recurrence was defined as either soft tissue growth at the anatomical site of previous
resection on CT or PET-CT or intraluminal recurrence at the anastomotic site on endoscopy.
Metastasis was defined as the presence of either of the following –
i) Peritoneal metastases
ii) Lymphatic metastases resulting in a nodal mass
iii) Distant organ spread to either liver, lung, bone or other intra-abdominal organ
3.2.2. Statistical data analysis
Differences in clinical variables amongst the different groups were tested with chi-squared
test. A multivariate logistic regression model was built to determine which factors affect
incidence of metachronous polyps/adenomas and local recurrence in CRC survivors.
Differences in survival outcome were tested using the log rank test. A multivariate Cox

108 | P a g e
regression model was designed to evaluate how different clinical variables affect overall and
disease free survival.
3.3 Results
Over the study period, 2101 patients were identified from the MDT database. Patients
(n=981) were excluded based on criteria shown in figure 3.1. Hence, 1120 patients were
identified for potential inclusion. After further investigation using electronic records, 393
patients were found not to meet the inclusion criteria. Patients who did not have complete
colonic examination prior to surgery were excluded, hence, 562 patients were included in the
final analysis. The demographic, operative and pathological details of these patients are
outlined in table 3.1.

109 | P a g e
Figure 3.1. Flow chart showing how patients were selected from the MDT database.
Number of patients identified (2006-2012)
N=2101
1273 patients
1120 patients identified for potential inclusion
727 patients met inclusion criteria
562 patients included
Not recorded as cancer (n=155)
No surgery (n=673)
Metastases at diagnosis (n=153)
Other cancers (n=72) Non resectional operative procedure (n=79) TEMS/TART (n=9) Metastases at surgery (n=34) Metastases in resection specimen (n=18) Polyp cancers (n=27) Primary treatment at a different hospital (n=48) Post-operative deaths (n=47) IBD cancers (n=12) Duplicate records (n=47)
Incomplete colonoscopy (n=6)
Flexible sigmoidoscopy (n=36)
No preoperative tests (n=123)

110 | P a g e
Table 3.1. Clinical, Operative and Pathological details of patients who met the inclusion
criteria (n=562).
Clinical details Operative details
Median age
(IQR)
Male: Female
(Right sided tumour)
(Left sided tumour)
69 yrs.
(62-77yrs)
323:239
105:131
218:108
Mode of surgery
Elective
Emergency
Scheduled
Urgent
335
9
173
45
Status of referral
Screening
2-week wait
Urgent
Routine
Emergency
Other
81
303
202
87
36
19
Operative Procedure
Anterior Resection
Extended Right Hemicolectomy
Left Hemicolectomy
Hartmann’s Procedure
Right Hemicolectomy
Sigmoid colectomy
Transverse colectomy
Subtotal colectomy
Panproctocolectomy
Laparotomy
Combined procedure
188
20
32
29
212
20
2
9
2
2
3
Pathological details
T-stage
pTx
pT0
pT1
pT2
pT3
pT4
5
4
22
83
355
91
N-stage
pNx
pN0
pN1
pN2
Median LN yield
(IQR)
1
377
120
64
19
(13-26)
Mucinous
Non-mucinous
Small focus
<50 % mucinous
>50 % mucinous
Missing
456
17
38
49
1
Extramural vascular invasion
Absent
Present
Missing
415
145
2

111 | P a g e
3.3.1. Characteristics of patients with synchronous polyps at presentation
Patients who had undergone complete colonic investigation with either a pre-operative
colonoscopy (n=532), CT pneumocolon (n=14) and barium enema (n=16) were included for
further analysis (see figure 3.2). Based on these preoperative investigations, 181 patients had
polyps. In the remaining 381 patients, there were 66 patients who had polyps found in the
resection specimen that were not identified at initial investigation. Thus, 247 patients had
synchronous polyps (SP) at time of diagnosis, of which, 197 had adenomas. Male gender
and older age was significantly associated with presence of SAs (p<0.001 and p=0.020
respectively) (see table 3.2. below). There were no significant differences in other clinical
and pathological parameters recorded.

112 | P a g e
Figure 3.2. Flow chart of patients included in analysis. SP-synchronous polyps, SA-
synchronous adenoma, MP- metachronous polyp, MA – metachronous adenoma
Colonoscopy – n=532
CT pneumocolon – n=14
Barium enema – n=16
SP on preoperative investigations (n=181)
SP on histological examination (n=66)
247 SP patients 315 non-SP patients
197 patients with SA 365 patients with no SAs
44 patients with MPs 46 patients with MPs
29 patients with MAs 24 patients with MAs
50 patients with MPs 66 patients with MPs
31/119 patients with MAs 39/248 patients with MAs
562 patients
At
Dia
gn
osi
s
0-2
4 m
on
ths
n=1
05
0-6
0 m
on
ths
(n=1
19
)
0-2
4 m
on
ths
n=1
96
0-6
0 m
on
ths
(n=2
48
)

113 | P a g e
Table 3.2. Clinical, operative and pathological details of SA and non-SA patients.
SA patients
(n=197)
Non-SA
patients
(n=365)
P value Odds ratio
Age
<60 years
>60 years
29
168
81
284
0.020*
0.605
M:F 139:58 184:181 <0.001*** 2.35 (Male)
Right sided
tumour
87/197 149/365 0.249 0.872
Mode of
operation
Elective
Emergency
Scheduled
Urgent
118
0
61
18
217
9
112
27
0.148
T-stage
pT0
pT1
pT2
pT3
pT4
5
7
31
130
24
5
15
52
226
67
0.328
N-stage
pN0
pN1
pN2
135
40
22
243
80
42
0.886
Mucinous content
None
Focus
<50 %
>50%
166
2
13
16
290
15
25
33
0.279
Metachronous
polyps
0-24 months FU
0-60 months FU
44/105
50/118
46/196
66/248
0.001***
0.002**
Metachronous
adenomas
0-24 months FU
0-60 months FU
29/105
31/118
24/196
39/248
0.001***
0.014*
2.74
1.91
Local recurrence
Present
3/193
26/361
0.002**
4.96
Overall survival
(months)
Mean
121
92
0.442
Disease –free
survival
(months)
Mean
79
89
0.530

114 | P a g e
3.3.2. Presence of synchronous adenomas indicates future risk of metachronous
adenomas
By 24 months, 301 patients underwent colonoscopy, of whom, 53 (18%) were found to have
metachronous adenomas (MAs). An additional 83 patients had incomplete examination with
a flexible sigmoidoscopy to inspect the anastomosis rather than for investigation of
metachronous lesions. The remainder did not undergo any endoscopic examination in this
period of time. SA patients were more likely to develop MAs than those without (28 %
versus 12 % respectively, Odds ratio 2.74, p=0.001).
In the first 5 years after surgery, 70/366 (19 %) patients who underwent colonic examination
had developed MA. SA patients were more likely to develop MA than non-SA patients (26
% versus 16 % respectively, Odds ratio 1.91, p=0.014).
In a multivariate logistic regression model, the only independent predictor of MA by 24
months was SA at presentation (see table 3.3.). In comparison, male gender and right sided
tumours were independent predictors of risk of developing MA over 60 months (see table
3.4.). Presence of SA at diagnosis was not an independent predictor of future MA in at
longer term follow-up. Gender, site of tumour and SA incidence were collinear which may
explain this result. Men were more likely to have SAs (Odds ratio 2.35) and made up a
larger proportion of patients with left sided tumours (M: F (right sided tumours): 72:73
versus M: F (left sided tumours): 153:69, p<0.001).

115 | P a g e
Table 3.3.1 Univariate and multivariate factors that predict the development of MAs in CRC
patients 0-24 months after surgery (n=301)
Variable MA present Univariate p
value
Odds ratio 95 % CI Multivariate
p value
Age <60 yrs-
13/74
>60 yrs-
40/227
0.573 0.830 0.399-1.728 0.619
Sex 39/189 M
14/112 F
0.049 0.552 0.272-1.126 0.102
Site of
tumour
29/131 R
24/170 L
0.049 0.566 0.294-1.092 0.090
Mucinous
content
39/251 none
14/50 present
0.032 2.132 0.995-4.567 0.052
Synchronous
adenoma
24/196 none
29/105
present
0.001 2.735 1.494-5.005 0.003**
Table 3.4. Univariate and multivariate factors that predict the development of MAs in CRC
patients 0-60 months after surgery (n=366)
Variable MA present Univariate p
value
Odds ratio 95 % CI Multivariate
p value
Age <60 yrs-
17/94
>60 yrs-
53/272
0.448 0.952 0.505-1.794 0.879
Sex 53/224 M
17/142 F
0.004 0.400 0.213-0.752 0.004**
Site of
tumour
36/144 R
34/222 L
0.016 0.469 0.266-0.829 0.009**
Mucinous
content
56/306 none
14/60 present
0.230 1.266 0.626-2.560 0.512
Synchronous
adenoma
39/248 none
31/118
present
0.018 1.910 1.120-3.257 0.104

116 | P a g e
3.3.3. Local recurrence is not affected by presence of adenomas
On univariate analysis, SA patients were significantly less likely to develop local recurrence
than non-SA patients (3/193 (1.5%) versus 26/361 (7.2%), p=0.004). However, with
multivariate logistic regression (see table 3.5), the independent predictors of local recurrence
included presence of an involved margin after surgery and extramural vascular invasion; the
presence of synchronous or metachronous adenomas did not affect the incidence of local
recurrence. There were 38 patients with an involved margin, of whom, 9 patients had a local
recurrence. If these 9 patients with involved margins were excluded from analysis, SA
patients had a significantly lower local recurrence rate compared to non-SA patients (2/188
(1%) versus 18/314 (5 %), p=0.008). In contrast, patients who developed MAs over 5 years
were more likely to develop recurrence of their cancer compared to those that did not (3/68
(4.4%) versus 7/279 (2.5%), p=0.309), however, this result did not reach statistical
significance.
Table 3.5. Univariate and multivariate factors that predict development of local recurrence
at site of previous resection
Variable Local
recurrence
Univariate p
value
Odds ratio 95 % CI Multivariate
p value
Age <60 yrs- 8/110
>60yrs 21/452
0.187 1.878 0.708-4.983 0.205
Sex 14/323 M
15/239 F
0.201 0.977 0.426-2.244 0.957
T-stage 1/121 T0-T2
51/605 T3-T4
0.001 0.252 0.032-1.974 0.189
N-stage 13/378 N0
16/168 N1-N2
0.009 0.762 0.316-1.840 0.546
Mucinous 20/455 none
9/107 present
0.496 0.496 0.193-1.275 0.145
EMVI 13/415 absent
15/128
present
0.001 0.383 0.155-0.944 0.037*
Involved
margin
9/38 involved
20/520 not
<0.001 0.146 0.055-0.383 <0.001**
Synchronous
adenoma
3/197 present
26/365 absent
0.002 3.366 0.951-
11.919
0.060

117 | P a g e
3.3.4. Overall and disease free survival do not differ with adenomas
After correction for age, sex and pathological T stage, there were no differences observed in
overall (OS) or disease free survival (DFS) between SA patients and non-SA patients
(Hazards Ratio 0.926, p=0.687 and Hazards ratio 2.367, p=0.460 respectively). Patients with
right sided tumours who presented with SAs were likely to survive longer than non-SA
patients (mean OS 118 months versus 90 months, p=0.587), however, this was non-
significant. In comparison, there was no difference in OS in patients with left sided tumours
with and without SAs (91 months versus 93 months, p=0.597). Patients who developed MAs
over the 5-year period after surgery had similar OS compared to those that did not (OS 99
months versus 102 months, p=0.504).
Figure 3.3. Kaplan-Meier survival analysis demonstrating overall survival (in months) in
patients with SAs and non-SAs.

118 | P a g e
Figure 3.4. Kaplan-Meier survival analysis demonstrating disease free survival (in months)
in patients with SAs and non-SAs.

119 | P a g e
3.4. Discussion
This study has highlighted that SAs are predictive for development of subsequent
metachronous lesions in patients who are undergoing surgery for colorectal cancer.
However, this does not appear to be related to increased risk of local recurrence nor is there
any difference in overall survival or disease free survival in patients who develop adenomas
compared to those that do not. This suggests that despite being pre-neoplastic, adenomas are
not a reliable marker of field cancerisation. Although they indicate which patients will
develop metachronous adenomas, they do not help to identify which patients will develop
local recurrence. Based on Slaughter’s field cancerisation concept (SLAUGHTER et al.,
1953), recurrence of cancer occurs in a field of altered mucosa. If adenomas are a marker of
field cancerisation, one would expect that they would be positively associated with the
development of local recurrence. In fact, in this study, univariate analysis has demonstrated
that patients with synchronous adenomas (SAs) were less likely to develop local recurrence
(LR). However, when multivariate analysis was performed, the only independent predictors
of local recurrence were an involved margin after surgery or extramural vascular invasion.
Patients with SAs were less likely to have an involved margin and this confounded the
relationship seen between SAs and LR. In order to counteract this, patients with an involved
margin were excluded from the analysis. SA patients were still significantly less likely to
develop local recurrence suggesting that other factors besides the presence of an involved
margin were responsible for this association. There are two possible explanations for this
observation: either adenomas are not a reliable indicative marker of field cancerisation or
field cancerisation does not predispose to local recurrence and may be responsible for
metachronous neoplastic lesions. Although the differences in survival were non-significant,
patients with right sided tumours and SAs had a longer OS. In comparison, patients with left
sided tumours did not exhibit such differences. Presence of SAs or subsequent development
of MAs did not impact upon OS and DFS in patients with CRC which contradicts previous
reports (Kronborg et al., 1986; Chu et al., 1986; Mattar et al., 2005).

120 | P a g e
The incidence of metachronous adenoma seen in this study (19%) is comparable to other
reports which quote rates varying between 8 % and 46 % (Khoury et al., 1996; Barlow &
Thompson, 1993; McFall et al., 2003; Kawai et al., 2012). There is considerable variation in
the literature because of differences in the surveillance protocols used. Despite the
publication of several meta-analyses (Rex et al., 2006; Desch et al., 2005; Jeffery et al.,
2007), there is no universally agreed consensus on how CRC patients should be followed up
(Scheer & Auer, 2009). Furthermore, there is variation introduced on an individual basis as
invasive tests such as colonoscopy are not offered to frail elderly or medically unfit patients.
This is reflected in the large proportion of patients that never underwent further endoscopic
examination after curative resection in the present study. Despite these shortcomings, this
study has highlighted that synchronous adenomas are more likely to develop in men and
older patients. Others have reported similar findings with obesity (Scarpa et al., 2014), male
gender (Mulder et al., 2011), mucinous cancer (Piñol et al., 2004), proximal tumours (Chen
& Sheen-Chen, 2000; Gervaz et al., 2005) and stage II disease (Piñol et al., 2004) being
significantly associated with synchronous lesions. Detection of SAs is important as it
enables identification of patients who are likely to develop metachronous lesions and
therefore helps to inform surveillance schedules. In a recent study addressing factors that are
predictive of MAs (Kawai et al., 2015), the only independent predictors identified were age
and presence of SAs at diagnosis; male gender was initially found to be predictive, however,
on multivariate analysis, there was no strong relationship. Similarly, in the present study, the
only predictive marker of MAs at short term follow up (0-24 months), was presence of SAs
at diagnosis. Others have also reported similar findings (Rajaratnam & Dennett, 2009;
Neugut et al., 1996). Over a longer period of follow up, male gender and right sided tumours
were independent predictors of subsequent development of MA. SAs in patients with right
sided tumours were related to a higher incidence of MA. For left sided tumours, presence of
SAs at diagnosis did not predict future risk of MA. Others have also reported that a proximal
location is associated with MA and MC in CRC (Gervaz et al., 2005), however, recent
reports have suggested that patients with distal tumours are more likely to develop MAs

121 | P a g e
(Borda et al., 2012). Previously, the link between SAs and subsequent development of MAs
was attributed to underlying undiagnosed HNPCC which is associated with multiple lesions
(Dykes et al., 2003; Bae et al., 2012; Nosho et al., 2009; Pedroni et al., 1999). However,
there have also been reports to suggest that risk of MAs is not linked to microsatellite
instability (MSI) (Ballesté et al., 2007) nor is the incidence of MA in patients with various
degrees of MSI different (Kang et al., 2010). Hence, the observed higher incidence of MAs
in patients with right sided tumours may reflect other differences in tumour biology
compared to distal tumours.
No SA characteristics were found to be predictive of MA patients in this study. A recent
report suggested that synchronous tubular adenomas were not predictive of MAs and only
advanced SAs (more than 1 cm, villous architecture or high grade dysplasia) were associated
with increased risk of finding MAs (Moon et al., 2010). Others have also shown that a single
nonadvanced adenoma has a very low risk of forming an advanced adenoma at follow up
(McFall et al., 2003). However, in this study, presence of any adenoma was associated with
increased risk of developing subsequent adenomas suggesting that it is the presence of
adenomas that is important rather than its appearance.
Previous reports have linked presence of SAs with increased incidence of MCs and proposed
that they can be utilised to identify patients at higher risk of malignant transformation
(Ballesté et al., 2007; Gervaz et al., 2005). However, incidence of metachronous lesions has
included both anastomotic recurrence and new cancers in a single category. In this study, no
relationship was observed between incidence of local recurrence and SAs after multivariate
analysis which contradicts these earlier reports. It appears that incomplete resection was
more important in predicting local recurrence than the presence of polyps at a distant site.

122 | P a g e
There were also no differences in overall and disease free survival between the SA patients
and the non-SA patients. As previously alluded to, there may be little survival benefit in
removing synchronous and metachronous lesions in the elderly population who undergo
CRC resection (McFall et al., 2003). Several large scale studies have failed to demonstrate a
survival benefit with removal of polys in CRC survivors. Also, a recent report has proposed
that patients with synchronous cancer have worse disease free survival if the primary tumour
is microsatellite stable (MSS). The presence of synchronous lesions in patients with MSI did
not affect outcome (Malesci et al., 2014). This implies that adenomas could be a marker of
neoplastic risk in MSS patients but not in MSI patients. In MSI patients, development of
adenomas could be a consequence of widespread epigenetic change in the colon rather than
indicating risk of malignant transformation. It is not possible to confirm nor refute such
reports based on the findings of the present study as microsatellite stability was not
examined in all cases. This is one of the limitations of this study. Furthermore, given the
time taken for a polyp to become cancerous (Eide, 1986; Otchy et al., 1996; Morson &
Bussey, 1985; Wilson & Lightwood, 2001), a longitudinal study with longer follow up
would be required to assess the impact of removing MAs in CRC survivors.
The other limitation of this study is that it is retrospective with some missing data that could
not be retrieved. However, this was less than one per cent and given the number of patients
included is unlikely to have significantly changed the findings. Those patients undergoing
CRC resection included in the study have considerable variation in follow up with a large
proportion never undergoing any endoscopic examination. This could have influenced the
outcome as patients who underwent colonoscopy and had polyps were more likely to
undergo further colonoscopy which would increase the number of MAs detected in this
group. However, the proportion of patients undergoing colonoscopy at 24 months is equal in
both SA and non-SA groups (around 55 %) and a larger proportion of patients in the non-SA
group compared to the SA group underwent colonoscopy by 60 months (42% versus 31%).

123 | P a g e
Furthermore, it was not the number of MAs that was utilised in the analysis but rather the
incidence of MA which is a binary outcome. Thus, it is unlikely that the results could have
been influenced by the number of procedures.
3.5 Summary and conclusions
SA patients were at increased risk of developing MAs after colorectal cancer
resection at short term (24 months) and long term (60 months) follow up.
SA patients were significantly less likely to develop local recurrence, however, the
only independent predictive markers of local recurrence were an involved margin
after surgery and extramural vascular involvement
No differences in overall or disease free survival were observed in patients who
develop adenomas compared to those that do not, including presence of SAs or
MAs.
Collectively, the data suggest that adenomas are poor markers of field cancerisation
and highlight the need for further investigation to identify more reliable biomarkers
indicative of neoplastic risk.
Adenomas are currently used as a surrogate endpoint for CRC chemoprevention
trials and due to the length of time it takes to develop adenomas, long periods of
follow up are required in these trials to determine therapeutic benefit.
A biomarker based on the field cancerisation concept could enable earlier diagnosis
and would be more effective as a surrogate marker of colonic mucosa at neoplastic
risk in chemoprevention trials.

124 | P a g e
Chapter 4:
Characterisation of the
gene expression profile of
the mucosal field around
colorectal cancer and
polyps

125 | P a g e
4.1. Introduction
Advances in molecular medicine have elucidated several different molecular phenotypes of
colorectal cancer (CRC) (Jass, 2007; Grady & Carethers, 2008; Sinicrope et al., 2015). CRC
is a complex disease characterised by dysregulation of multiple signalling pathways
(Sinicrope & Sargent, 2012; Phipps et al., 2015). Epigenetic modification further
complicates the disease process but has been recognized as an important mode of silencing
the many genes that protect against carcinogenesis (Ogino et al., 2009). Identification of the
genetic changes that occur in the tumour tissue has enabled development of targeted
molecular therapy (De Roock et al., 2010; Lièvre et al., 2008; Peeters et al., 2013;
Benvenuti et al., 2007). However, CRC prognosis remains poor unless patients are
diagnosed at an early stage (NCIN). Current screening modalities that are utilised lack
specificity and often lead to invasive tests being performed in individuals who do not have
cancer (Burch et al., 2007; Logan et al., 2012). Screening tests that are able to identify early
molecular changes indicative of CRC are therefore needed to enable more accurate diagnosis
and prevent unnecessary morbidity. The field cancerisation concept proposes that there are
genetic changes in the macroscopically normal colonic mucosa (MNM) around a cancer
(SLAUGHTER et al., 1953). This renders it premalignant but does not produce
morphological changes (Luo et al., 2014). Characterisation of these gene expression changes
could enable identification of the processes that are dysregulated in the early stages of CRC
formation with clear clinical implications.
4.1.1. Gene expression profiling in CRC
Previous studies have investigated the global expression profile of cancerous and non-
cancerous tissues comparing tumour tissue with paired normal mucosa (Lin et al., 2002;
Croner et al., 2005; Kitahara et al., 2001; Bertucci et al., 2004; Birkenkamp-Demtroder et
al., 2005). The assumption being that the paired ‘normal’ mucosa is in fact not biologically

126 | P a g e
altered. Based on the field cancerisation concept, many authors have shown that the ‘normal’
mucosa in cancer patients is biologically altered and this phenomenon is observed at
considerable distances from the tumour itself (Shen et al., 2005; Polley et al., 2006; Anti et
al., 2001). Previous studies have failed to identify changes that occur early in CRC
formation as the comparison is being made between MNM and tumour taken from the same
patient. If the MNM is altered in these individuals, only genetic changes that take place later
in the carcinogenesis pathway will be identified; the early genetic changes that take place
will be found in both the MNM and tumour and therefore will cancel each other out.
Others have adopted a different approach by taking colonic tissue from healthy individuals
as a control and have successfully demonstrated genetic dysregulation in a number of
cellular processes (Grade et al., 2007; Bianchini et al., 2006; Alon et al., 1999; Notterman et
al., 2001). However, it is difficult to ascertain where along the adenoma-carcinoma sequence
these abnormalities lie. This has been addressed in studies where the gene expression profile
of adenomas has also been characterised (Notterman et al., 2001; Lin et al., 2002; Lechner et
al., 2003). In many of these studies, similar genetic changes have been noted in adenomas
and tumours compared to healthy colonic mucosa. The level of expression of these genes
often lies in between that found in cancer and that in control subjects (Habermann et al.,
2007; Buckhaults et al., 2001; Galamb et al., 2006; Wang et al., 2005) lending support to the
adenoma-carcinoma sequence. However, it has been difficult to translate the findings from
these studies into molecular screening tests. The reason for this is that many adenomas do
not progress to CRC and some CRCs arise without a recognizable polyp stage. Additional
information regarding the molecular biology of adenomas is required if they are to be
utilised for screening. This could come from examination of the MNM as patients with a
field defect are at higher risk of malignant transformation therefore instead of identifying
polyps, the molecular makeup of the MNM around polyps and cancer should be examined.

127 | P a g e
This would enable better screening tests to be developed and assist in more accurate risk
stratification of patients who have already developed polyps or cancer.
Micro-array technology offers the opportunity to examine gene expression profiles in a
candidate-free approach and has the added benefit of being able to understand network
pathways through multiple gene analysis. One of the most successful genetic profiling
studies in CRC has been the discovery of an 18 gene signature that can be used to identify
patients with a poor prognostic CRC who require adjuvant chemotherapy (Salazar et al.,
2011). This suggests that gene expression profiling can be readily translated into the clinical
arena and may help elucidate how CRC can behave differently in different individuals.
Similarly, based on the field cancerisation concept, gene expression profiling could be
utilized to identify how the MNM around a cancer or a polyp is biologically altered. This
would aid our understanding of CRC pathogenesis and could enable more accurate screening
tools and targeted chemo preventative therapy to be developed.
4.1.2. Aims and objectives
The aims of this study were as follows –
i) To investigate field cancerisation in CRC by characterising the key cellular
processes and genes that are dysregulated in the MNM around cancer and polyp
compared to that found in control subjects
ii) To identify individual genes that may contribute to field cancerisation for further
investigation

128 | P a g e
4.2. Methods
Subjects (n=16) were recruited and mucosal pinch biopsies were taken at time of endoscopy.
Biopsies taken from the adjacent macroscopically normal mucosa (MNM) to tumour (n=5)
and polyp (n=6) were compared with biopsies of MNM in the caecum or rectum from
control subjects (n=5). A two channel micro-array experiment was performed as outlined in
section 2.3.
Two different types of statistical analysis referred to as lmFt (LIMMA) and robust
regression (RR) were performed to improve the reliability of the genes found to be
differentially expressed (Xu et al., 2013) (see section 2.3 for further details). Based on the
list of differentially expressed genes (DEGs), two different types of functional analysis were
conducted, either using DAVID software (Huang et al., 2009a) or the PANTHER database
(Mi et al., 2013) (see figure 2.4).
The cohort contained a patient with a hyperplastic polyp who was included in the initial
analysis using the LIMMA method, however, subsequently, was excluded in all other
analysis. As the aim of the study was to characterise the gene expression profile of
adenomas, it was felt that inclusion of a hyperplastic polyp in the group would be
inappropriate and therefore the patient was excluded. The initial analysis had already been
conducted at this stage therefore it was not possible to exclude this patient at the time.
The second analysis using PANTHER software focused on approaches to combine both
methods therefore the same threshold was set for both LIMMA and RR to prevent any one
statistical test identifying a large number of genes and would then be over-represented in the
analysis. Genes that were only identified using both statistical analyses, referred to as the

129 | P a g e
‘intersect’ region in the Venn diagrams were used to identify genes for further investigation.
These genes were ranked based on fold change and a combined rank was calculated by
averaging the individual ranks. The genes were then reordered based on the combined rank.
A list of 50 up and down regulated genes in each comparison (cancer versus control, polyp
versus control and cancer versus polyp) was created. Based on this list, only genes included
in at least two of the comparison categories were considered potential candidates for
validation.
In comparison, the ‘union’ DEGs, that is, those that were discovered using either method
were subject to functional analysis. A larger number of genes were preferred for this analysis
to ensure that all biological terms of relevance were identified. Three separate analyses were
performed based on cellular component, molecular function or biological process. The
statistical overrepresentation test (Mi et al., 2013) was then performed to identify biological
terms that were more ‘enriched’ in the list of DEGs compared to the background genes
found on the microarray chip. There are therefore two different types of comparison that
were made in the analysis. Firstly, differences in gene expression between the groups were
examined using fold change which is a logarithmic function of the mean difference in raw
expression values. Thus, it gives an indication of how gene expression of an individual gene
differs across the clinical groups. In contrast, fold enrichment is a value that indicates
whether a group of genes belonging to a particular cellular or biological function are over
expressed or under expressed in the list of DEGs compared to the background expression
that would be expected. In the DAVID analysis, a fold enrichment value of greater than 1.33
was considered significant. In the PANTHER analysis, the statistical overrepresentation test
was utilised to calculate fold enrichment and an associated p value. Fold enrichment greater
than 2 or a p value <0.05 were considered to be significant. Both fold change and fold
enrichment are important parameters to include in the analysis as they explain individual
gene differences and global functional differences respectively.

130 | P a g e
4.3. Results
4.3.1. The global gene expression profile of patients with adenomas and CRC differs
Based on the expression level of all probes tested in the micro-array experiment, there
appeared to be a clear distinction between MNM adjacent to a cancer compared to that next
to adenoma (see fig 4.1.). It was therefore possible to draw a hypothetical line that can
separate both groups based on the global gene expression profile of the samples examined.
In comparison, the global gene expression profile of samples taken from control subjects
overlaps the other two groups and is not as well demarcated.
Figure 4.1: Principal components analysis of the global gene expression profile of all 16
patients. A hypothetical line is able to demarcate the patients with adenomas from CRC.
C1-5 refers to samples from control subjects, Pol1-6 refers to samples from 6 polyp patients
and Adc 1-5 refers to samples from 5 cancer patients
Adc_1Adc_2
Adc_3
Adc_4
Adc_5
C_1
C_2
C_3C_4
C_5
Pol_1
Pol_2
Pol_3
Pol_4
Pol_5Pol_6
−100
−50
0
50
100
−100 −50 0 50 100 150
PC1
PC
2
PCA plot 16 samples

131 | P a g e
4.3.2. Multiple signalling pathways are dysregulated in the colonic field (DAVID
analysis)
LIMMA and RR methods were used to identify DEGs and biological processes that were
dysregulated as shown in figure 4.2. The biological processes that were identified were
ranked based on the enrichment score and are shown in Appendix 1.
4.3.2.1. Cancer versus control
Using the LIMMA method, only two functions were enriched. These included
transmembrane signalling and glycosylation; the numbers of genes included in these two
categories are shown in Appendix 1. No enriched terms were found using the robust method.
4.3.2.2 Polyp versus control
Using the LIMMA method, there were two terms that were enriched; these included
extracellular signalling and response to injury. Despite only 90 probes being differentially
expressed with the robust method, 5 terms were enriched: extracellular signalling,
coagulation, eye morphogenesis, signalling and cytoskeleton.
4.3.2.3 Polyp versus cancer
The most striking differences were observed between patients with cancer and polyp. Using
the LIMMA method, 8 enriched terms were found compared to a staggering 28 enriched
terms with the RR method. The details of the enriched terms using both methods are given in
Appendix 3. Key processes that are identified included chromatin organization, protein
assembly and RNA transport.

132 | P a g e
LIMMA RR
Figure 4.2. DAVID analysis. Number of DEGs identified using the two different statistical
methods and subsequent functional analysis with criteria for discrimination of individual
genes for further enquiry.
LIMMA Cancer
versus
control
Polyp
versus
control
Cancer
versus
polyp
Upregulated genes 220 151 383
Downregulated
genes
127 66 327
Genes for
validation
24 UP
25
DOWN
20 UP
21
DOWN
21 UP
22
DOWN
Genes in pathway
1
31 19 11
Genes in pathway
2
25 10 30
RR Cancer
versus
control
Polyp
versus
control
Cancer
versus
polyp
No of DEGs 84 90 2024
Upregulated genes 18 38 247
Downregulated
genes
20 8 188
Genes for
validation
16 UP 11
DOWN
20 UP 8
DOWN
22 UP 20
DOWN
Genes in pathway
1
13 30 196
Genes in pathway
2
3 3 190
Adc-Pol
1914
Pol-C
31
Adc-C
28
Adc-Pol
447
Pol-C
116
Adc-C
149
Genes for validation chosen based on –
i) Top 10-15 genes with highest fold change (up and down
regulated)
ii) Genes with highest fold change found in top two most
enriched pathways identified using DAVID
30 candidate genes identified for
qRT-PCR validation
Functional analysis of DEGs
using DAVID software
2 56 53 179
17
82
2
1

133 | P a g e
4.3.2.4. Selection of genes for validation and further enquiry
A list of candidate genes for further validation was created based upon the genes recorded
under the two most enriched terms of the functional analysis and a list of the top 10-15 genes
with the greatest fold change observed in each category. Based on a literature review to
explore biological relevance of these genes, 30 potential genes for validation were
formulated. These genes are shown in table 4.1. and are involved in a number of different
biological processes. From this list, MUC2, MUC5AC and GADD45B were chosen for
further validation using quantitative real time polymerase chain reaction (qRT-PCR). The
results of this are presented in chapter 5.

134 | P a g e
Table 4.1: Candidate genes for further validation with fold change differences, statistical
significance and biological function displayed. A short synopsis of the literature linking the
gene to cancer biology and CRC is also given. Numbers in brackets refer to the comparison
with 1=cancer versus control, 2=polyp versus control and 3=cancer versus polyp. Italicized
values refer to downregulated genes.
Gene Gene name Function Fold
change
(LIMM
A)
P value
(LIMMA)
Fold
change
(RR)
P value
(RR)
MUC2 Mucin 2 Goblet cell
derived mucin
1.60 (1)
1.58 (3)
0.0007 (1)
0.0007(3)
1.61 (3) 0.001(3)
MUC5AC Mucin 5,
subunit AC
Gastric
foveolar mucin
1.82 (1) 0.0005(1)
MUC4 Mucin 4 Integral
membrane
glycoprotein
1.52 (1)
1.74 (3)
0.028 (1)
0.014(3)
1.95 (3) 0.0003(3)
GADD45A Growth arrest
and DNA-
damage-
inducible
protein
GADD45
alpha
Stress
response
1.73 (3) 0.0001 (3) 1.74(3) 0.0003(3)
GADD45B Growth arrest
and DNA-
damage-
inducible
protein
GADD45 beta
Stress
response
1.79(1)
1.54 (3)
0.014(1)
0.049 (3)
1.96 (1)
1.82 (3)
<0.0001(1)
<0.0001(3)
MT1X Metallothionie
n 1X
Transcription
co-factor
2.26 (3)
1.83 (2)
0.005 (3)
0.030 (2)
COL3A1 Collagen, type
III, alpha 1
Component of
type III
collagen
1.66 (3)
1.88 (2)
0.009 (3)
0.002(2)
1.93 (3)
2.13(2)
0.0001(3)
<0.0001(2)
COL5A2 Collagen, type
III, alpha 2
Component of
fibrillar
collagen
1.51 (3)
1.70 (2)
<0.0001(3)
<0.0001(2)
FGL2 Fibrinogen-
like protein 2
Lymphocyte
function
2.02 (2) <0.0001(2)
CTSA Cathepsin A Autophagy/pla
telet activation
1.74 (2)
2.27(3)
<0.001 (2)
<0.0001(3)
CTSG Cathepsin G ECM
degradation
2.42 (3)
1.76(2)
<0.0004(3)
0.012 (2)
2.48 (3) 0.0003(3)
IL-17B Interleukin 17
B
Releases
TNFα and IL-
1-β
1.93 (3) 0.001 (3) 2.23 (2)
2.48 (3)
<0.001 (2)
<0.001 (3)
MMP1 Matrix
metalloprotein
ase 1
ECM
degradation
2.67 (2)
1.87 (3)
0.003(2)
0.045(3)
MMP12 Matrix
metalloprotein
ase 12
ECM
degradation
and
aneurysmal
2.32 (1)
2.08 (2)
0.027(1)
0.042 (2)

135 | P a g e
disease
FGFBP1 Fibroblast
growth factor
binding
protein 1
Cell
proliferation,
differentiation
migration,
growth
2.24 (2)
2.28 (3)
0.024 (2)
0.022 (3)
GREM1 Gremlin 1 BMP
antagonist
2.11 (2)
1.61 (3)
0.027 (2)
0.031 (3)
3.12 (3)
<0.001 (3)
SFRP1 Secreted
frizzled related
protein
Modulates
Wnt signalling
1.61 (2)
1.83 (3)
0.022 (2)
0.005 (3)
ELANE Neutrophil
elastase
Modifies
natural killer
cells
1.29 (1) <0.001 (1)
4.3.3. Multiple differences in cellular component, molecular function and biological
processes in the colonic field (PANTHER analysis)
4.3.3.1. Intersect genes
Using both LIMMA and RR identified similar number of genes to be upregulated and
downregulated in all three comparison groups (see figure 4.3.). Genes that were found using
both statistical tests (intersect genes) were ranked based on the fold change differences. The
individual rank values were then combined across the three categories of cancer versus
control, polyp versus control and cancer versus polyp. The top 50 genes identified based on
the combined rank value were investigated further for their biological relevance in CRC
formation (see table 4.2. for further details). Candidate genes (n=5) were identified from this
list using a stratified sampling approach where genes are selected at regular intervals along
the list.

136 | P a g e
LIMMA RR
INTERSECT DEGs UNION DEGs
Figure 4.3. PANTHER analysis. Number of DEGs identified using the two different
statistical methods. Details of subsequent functional analysis using PANTHER software and
analysis of intersect genes to identify candidate genes for further enquiry is also given.
LIMMA Cancer
versus
control
Polyp
versus
control
Cancer
versus
polyp
Upregulated
genes
220 151 383
Downregulated
genes
127 66 327
RR Cancer
versus
control
Polyp
versus
control
Cancer
versus
polyp
Upregulated
genes
204 190 442
Downregulated
genes
130 72 380
LIMMA
55
RR
58LIMMA
60
RR
86LIMMA
132
RR
144
INTERSECT genes – 1130 genes UNION genes – 1665 genes
PANTHER analysis –
Cellular component
Molecular function
Biological process
Top 50 up and down regulated genes
Genes in more than one category included
Combined rank based on fold change
calculated
Cancer versus control Polyp versus control Polyp versus cancer
276
278
176 678

137 | P a g e
Table 4.2.: Potential candidate genes for qRT-PCR validation. Top 20 genes identified
based on combined rank displayed with corresponding fold change (FC) differences and
statistical significance. Combined rank is given under each gene name. Numbers in brackets
refer to the comparison with 1=cancer versus control, 2=polyp versus control and 3=cancer
versus polyp. Italicized values refer to downregulated genes.
Gene name Combined rank
Gene name FC (LIMMA)
P value (LIMMA)
FC (RR)
p value (RR)
PSCA 2
Prostate Stem Cell Antigen
6.62(1) 7.23(3)
0.0006(1) 0.0004(3)
6.62(1) 7.35(3)
0.0032(1) 0.0022(3)
UGT2B15 3
UDP glucuronosyltransferase 2 family, polypeptide B15
5.11(2) 5.38(3)
0.0145(2) 0.0121(3)
2.66(2) 2.88(3)
0.0230(2) 0.0158(3)
PYY2 5
Peptide YY, 2 (pseudogene)
3.00(1) 2.88(3)
0.0001(1) 0.0002(3)
3.00(1) 2.82(3)
0.0018(1) 0.0030(3)
SLC46A1 11
Solute carrier family 46 (folate transporter) Member 1
2.06 (1) 2.78(3)
0.0027(1) 0.0001(3)
1.98(1) 2.87(3)
0.0065(1) 0.0002(3)
TMCC2 13
Transmembrane and coiled coil domain family 2
2.39(1) 2.38(3)
0.0036(1) 0.0039(3)
2.35(1) 2.43(3)
0.0074(1) 0.0062(3)
JAKMIP3 13
Janus kinase and microtubule interacting protein 3
2.45(1) 2.38(3)
0.0012(1) 0.0016(3)
2.30(1) 2.26(3)
0.0011(1) 0.0015(3)
TFF1 14
Trefoil factor 1
2.37(2) 2.29(3)
0.0146(2) 0.0182(3)
2.34(2) 2.26(3)
0.0296(2) 0.0356(3)
SLC1A7 15
Solute carrier family 1 (glutamate transporter), membrane 7
2.06(1) 2.40(3)
0.0486(1) 0.0198(3)
2.41(1) 2.55(3)
0.0036(1) 0.0030(3)
SDS 15
Serine dehydratase 2.85(1) 2.28(3)
0.0029(1) 0.0143(3)
3.28(1) 2.83 (3)
0.0003(1) 0.0002(3)
FUT2 16
Fucosyltransferase 2 2.05(1) 2.62(3)
0.0489(1) 0.0110(3)
1.78(1) 3.74(3)
0.0023(1) 0.0002(3)
KNG1 17
Kininogen 1 2.05(1) 2.30(2)
0.0022(1) 0.0006(2)
2.22(1) 2.50(2)
0.0010(1) 0.0003(2)
CTSG 18
Cathepsin G 1.92(2) 2.64(3)
0.0054(2) 0.0002(3)
1.91(2) 2.48(3)
0.0042(2) 0.0003(3)
CCL21 19
Chemokine (C-C Motif) Ligand 21
2.13(1) 2.27(3)
0.00008(1) 0.0029(3)
2.13(1) 2.25(3)
0.0002(1) 0.0025(3)
SECTM1 Secreted and 2.15(2) 0.0079(2) 2.28(2) 0.0070(2)

138 | P a g e
20 transmembrane 11 2.29(3) 0.0047(3) 2.42(3) 0.0043(3)
CYP3A4 20
Cytochrome 450, family 3, subfamily A, polypeptide 4
2.01(1) 2.26(3)
0.0186(1) 0.0075(3)
1.88(1) 2.11(3)
0.0044(1) 0.0012(3)
UGT2B11 23
UDP Glucuronosyltransferase 2 family, polypeptide B11
2.21(2) 2.16(3)
0.0150(2) 0.0178(3)
2.17(2) 2.23(3)
0.0120(2) 0.0107(3)
HSD11B1 24
Hydroxysteroid (11-Beta) Dehydrogenase 11
1.82(1) 2.44(2)
0.0241(1) 0.0018(2)
1.84(1) 2.27(2)
0.0168(1) 0.0026(2)
S100P 46
S100 Calcium Binding Protein P
2.05(2) 1.91(3)
0.0202(2) 0.0334(3)
2.15(2) 2.01(3)
0.0159(2) 0.0254(3)
CXCL2 48
Chemokine ligand 2/GRO-2
2.06(1) 1.85(3)
0.0107(1) 0.0261(3)
2.00(1) 1.80(3)
0.0203(1) 0.0449(3)
MUC2 50
Mucin 2 1.84(1) 1.98(3)
0.0014(1) 0.0006(3)
1.84(1) 2.00(3)
0.0031(1) 0.0001(3)
GREM1 66
Gremlin 1, DAN family BMP antagonist
1.64(2) 1.71(3)
0.0326(2) 0.0208(3)
1.76(2) 1.87(3)
0.0110(2) 0.0060(3)

139 | P a g e
4.3.3.2. PANTHER analysis of UNION genes
In total, 1665 genes were identified for functional analysis when genes identified using
either LIMMA or RR were combined. These genes were analysed using PANTHER
software to determine which cellular component the gene belongs to and ascertain its
biological and molecular function. A number of different biological processes were found to
be over or underrepresented in the list of DEGs compared to the number of genes found
under that function in the micro-array chip.
4.3.3.3. Cancer versus control
The cellular component analysis showed that the DEGs identified in this category were
responsible for intracellular and organelle function (see figure 4.4.). Genes involved in
chemokine and cytokine activity were more enriched compared to the background and there
was decreased structural molecular and nuclear acid activity (fold enrichment >5, p<0.001
and fold enrichment 0.5, p<0.001, respectively). In terms of biological processes, genes
involved in the immune response, antigen processing and natural killer cell activation were
more enriched (see table 4.3). The other terms that were enriched include glycolysis and
tricarboxylic acid cycle suggesting that there were changes in metabolic activity (fold
enrichment >5, p<0.001). Genes that were involved in regulating biological processes and
involved in mesoderm/ectoderm development were observed at a lower frequency than the
background level (fold enrichment 0.77, p<0.001 and fold enrichment 0.38. p<0.001
respectively).

140 | P a g e
Figure 4.4. PANTHER analysis of DEGs found between cancer and control (n=389)
showing which cellular component, molecular function and biological process these genes
belong to.
33%
9%
19%
9%
10%
18%
2%
Cell component
cell part
extracellular matrix
extracellular region
macromolecular complex
membrane
organelle
synapse
2% 3%
10% 3%
20%
7%
0%
8%7%
1%
24%
4%2%
9%
Biological Processapoptotic process
biological adhesion
biological regulation
cellular component organisation
cellular process
developmental process
growth
immune system process
localisation
locomotion
metabolic process
multicellular organismal process
reproduction
response to stimulus
36%
30%
4%
9%
10%
4%1%
6%
Molecular function
binding
catalytic activity
enzyme regulator activity
nucleic acid binding transcriptionfactor activity
receptor activity
structural molecular activity
translation regulator activity
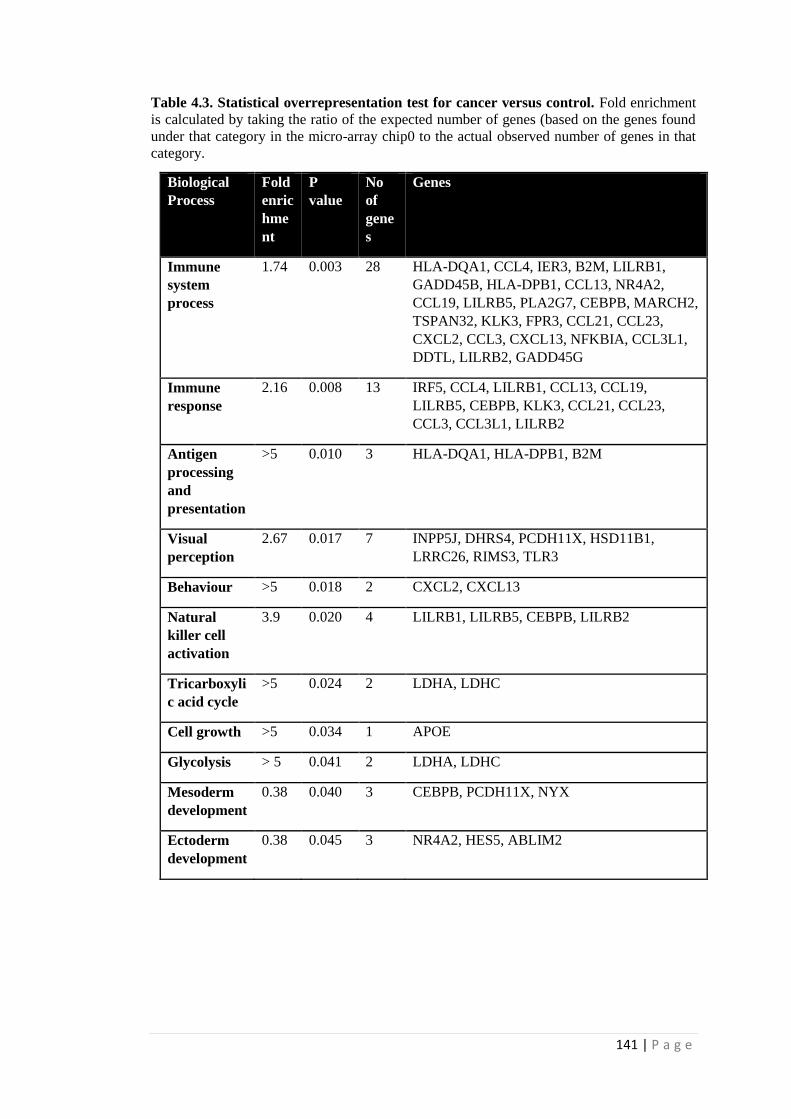
141 | P a g e
Table 4.3. Statistical overrepresentation test for cancer versus control. Fold enrichment
is calculated by taking the ratio of the expected number of genes (based on the genes found
under that category in the micro-array chip0 to the actual observed number of genes in that
category.
Biological
Process
Fold
enric
hme
nt
P
value
No
of
gene
s
Genes
Immune
system
process
1.74 0.003
28 HLA-DQA1, CCL4, IER3, B2M, LILRB1,
GADD45B, HLA-DPB1, CCL13, NR4A2,
CCL19, LILRB5, PLA2G7, CEBPB, MARCH2,
TSPAN32, KLK3, FPR3, CCL21, CCL23,
CXCL2, CCL3, CXCL13, NFKBIA, CCL3L1,
DDTL, LILRB2, GADD45G
Immune
response
2.16 0.008
13 IRF5, CCL4, LILRB1, CCL13, CCL19,
LILRB5, CEBPB, KLK3, CCL21, CCL23,
CCL3, CCL3L1, LILRB2
Antigen
processing
and
presentation
>5 0.010 3 HLA-DQA1, HLA-DPB1, B2M
Visual
perception
2.67 0.017 7 INPP5J, DHRS4, PCDH11X, HSD11B1,
LRRC26, RIMS3, TLR3
Behaviour >5 0.018 2 CXCL2, CXCL13
Natural
killer cell
activation
3.9 0.020 4 LILRB1, LILRB5, CEBPB, LILRB2
Tricarboxyli
c acid cycle
>5 0.024 2 LDHA, LDHC
Cell growth >5 0.034 1 APOE
Glycolysis > 5 0.041 2 LDHA, LDHC
Mesoderm
development
0.38 0.040 3 CEBPB, PCDH11X, NYX
Ectoderm
development
0.38 0.045 3 NR4A2, HES5, ABLIM2

142 | P a g e
4.3.3.4. Polyp versus control
The majority of the DEGs discovered between polyp and control were involved in the
cytoskeleton, both actin and microtubule components (fold enrichment 2.87, p<0.001). This
was again seen with the molecular function analysis which identified the following terms to
be more enriched than background: cytoskeletal protein binding, extracellular matrix (ECM)
structural constituents and growth factor activity (fold enrichment 3.26, p<0.001; 3.92,
p<0.001 and >5, p<0.001 respectively). Similar to the cancer versus control category, genes
involved in nucleic acid binding activity were less enriched amongst the list of DEGs (fold
enrichment 0.44, p<0.001). A large number of biological processes were found to be more
enriched including antigen processing, macrophage activation, complement activation, cell-
matrix adhesion and cellular process (see table 4.4.). The biological terms that were
highlighted could be broadly classified into three categories: cell adhesion, cell morphology
and cellular process. Genes that were involved in RNA metabolic process, transcription and
regulation of biological processes were less enriched when compared to the number of genes
found under these categories in the background.

143 | P a g e
Figure 4.5. PANTHER analysis of DEGs found between polyp and control (n=322)
showing which cellular component, molecular function and biological process these
1%
32%
13%
15%
10%
7%
21%
1%
Cellular component
cell junction
cell part
extracellular matrix
extracellular region
macromolecule complex
membrane
organelle
synapse
33%
28%5%
3%
1%
12%
13%
1%
4%
Molecular functionbinding
catalytic activity
enzyme regulator activity
nucleic acid binding transcriptionfactor activity
protein binding transcription factoractivity
receptor activity
structural molecule activity
translation regulator activity
transporter activity
1% 4%
8% 5%
23%
11%7%
7%0%
20%
6%
1%
7%
Biological Processapoptotic process
biological adhesion
biological regulation
cellular component organisation
cellular process
developmental process
immune system process
localisation
locomotion
metabolic process
multicellular organismal process
reproduction
response to stimulus

144 | P a g e
Table 4.4. Statistical overrepresentation test for polyp versus control. Fold enrichment is
calculated by taking the ratio of the expected number of genes based on the genes found
under that category in the micro-array chip and comparing this to the actual observed
number of genes in that category. Only biological processes with fold enrichment <0.5 or >2
have been shown.
Biological
Process
Fold
enric
hme
nt
P value No
of
gen
es
Genes
Anatomical
structure
morphogenes
is
2.29 <0.001
19 COL3A1, GPM6B, COL4A1,
CALD1,PLS3,LDB3,TPPP,TPPP3,
CCDC102B,ESPNL,AXIN2,PDLIM3,ACTL8,M
YOC,SYNAPO2,COL5A2,CFL2,TPM2,ACTA2.
Cellular
component
morphogenes
is
2.42 0.001
16 GPM6B, COL4A1, CALD1, PLS3, LDB3, TPPP,
TPPP3, ESPNL, PDLIM3, ACTLB, MYOC,
SYNAPO2, COL5A2, CFL2, TPM2, ACTA2
Biological
adhesion
2.2 0.002 18 LAMA2, COL4A1, LUM, CLEC4A, LEPREL1,
COL14A1, VCAM1, HAPLN1, FGL2, CTSK,
TNS1, TIMD4, COL5A2, PCDH18, LRRC66,
ADAMTS5, EMCN
Cell adhesion 2.17 0.003 17 LAMA2, COL4A1, LUM, CLEC4A, VCAM1,
FGL2, CTSK, TNS1, TIMD4, COL5A2,
PCDH18, LRRC66, CFB, ADAMTS5, EMCN,
FGF7
Muscle
contraction
3.05 0.003 9 PPP1R14A, VCAM1, EDNRA, LDB3,
CCDC102B, CCK, PDLIM3, CRYAB, TPM2
Homeostatic
process
2.88 0.007 8 COL3A1, COL4A1, ENRA, CCL23, COL5A2,
LRRC66, ATP12A, AGR2
Regulation of
liquid surface
tension
>5 0.008 4 COL3A1, COL4A1, COL5A2, AGR2
Steroid
metabolic
process
3.09 0.008 7 DHR7SC, CELA3A, CELA3B, CYP3A4,
HSD11B1, INSIG1, HSD17B6
Antigen
processing
and
presentation
>5 0.009 4 HLA-DQA1, HLA-DQA2, HLA-DPA1, HLA-F
Monosacchar
ide metabolic
process
3.27 0.011 6 UGTB11, UGTB10, UGTB15, EDRNRA, PCK1,
FUT2

145 | P a g e
Complement
activation
>5 0.020 3 C4BPB, CFB, SRPX
Cell-cell
adhesion
2.02 0.022 11 LAMA2, COL4A1, LUM, CLEC4A, LEPREL1,
FGL2, COL5A2, LRRC66, CFB, ADAMTS5
Macrophage
activation
2.64 0.028 6 COL3A1, CLEC4A, S100A14, DMBT1, GPB3,
PLEKHS1
Blood
coagulation
2.62 0.029 6 CLEC4A, COL14A1, PROCR, C4BPB, CFB,
SRPX
Cell-matrix
adhesion
3.19 0.038 4 LAMA2, COL14A1, FGL2, ADAMTS5
Cellular
defence
response
2.21 0.042 7 HLA-DQA1, CLEC4A, BTN3A2, PLEKHS1,
HLA-DPA1, STAT6, HLA-DQA2
Nucleobase
containing
compound
metabolic
process
0.5 <0.001 23 LUM, RUNXT1, ABCA8, S100A14, COL14A1,
RGS5, HOXB9, LDB3, APOBEC1, ISL1,
HIST1H4A, AXIN2, PDLIM3, BHLEH22,
S100P, PRRX1, TSEN2, MAOB, BMP3,
APOBEC3B, STAT6
RNA
metabolic
process
0.43 0.0001 13 LUM, RUNTX1, HOXB9, LDB3, APOBEC1,
ISL1, PDLIM3, BHLHE22, PRRX1, TSEN2,
BMP3, APOBEC3B, STAT6
Transcription 0.4 <0.001 10 LUM, CBFA2T1, HOXB9, LDB3, ISL1,
PDLIM3, BHLHE22, PRRX1, BMP3, STAT6
Ion transport 0.21 0.003 2 KCTD12, ATP12A
Cation
transport
0.26 0.017 2 KCTD12, ATP12A
Organelle
organisation
0.38 0.043 3 HIST1H4A, MAOB

146 | P a g e
4.3.3.5. Polyp versus cancer
In comparison to the changes found between cancer/polyp and control, most of the DEGs in
this category were associated with membrane structures or the extracellular matrix.
Similarly, genes that were involved in cell signalling (acetyltransferase activity), protein
degradation (cysteine type peptidase activity, racemase and epimerase activity) and
microtubule binding were more enriched (fold enrichment 3.01, p<0.001: 2.66, P<0.001 and
3.62, p<0.001, respectively). Similar to the previous analyses, genes involved in
transcription and nucleic acid binding were less enriched compared to the background. The
biological process analysis revealed enrichment of genes involved in metabolism
(tricarboxylic acid cycle, monosaccharide metabolic process and glycolysis) and reduced
enrichment of genes required for regulation of RNA transcription (RNA metabolic process,
transcription, mRNA process, nitrogen compound metabolic process and biological
regulation) (see table 4.5).

147 | P a g e
Figure 4.6. PANTHER analysis of DEGs found between polyp and cancer (n=954)
showing which cellular component, molecular function and biological process these genes
belong to.
0%
37%
6%12%
8%
11%
25%
1%
Cellular component
cell junction
cell part
extracellular matrix
extracellular region
macromolecular complex
membrane
organelle
synapse
31%
35%
5%
6%
1%
9%
6%
1%
6%
Molecular functionbinding
catalytic activity
enzyme regulator activity
nucleic acid binding transcriptionfactor activity
protein binding transcriptionfactor activity
receptor activity
structural molecule activity
translation regulator activity
transporter activity
2% 3%
10%4%
20%
9%6%
7%0%
26%
4%2%
7%
Biological Process
apoptotic process
biological adhesion
biological regulation
cellular component organisation
cellular process
developmental process
immune system process
localisation
locomotion
metabolic process
multicellular organismal process

148 | P a g e
Table 4.5. Statistical overrepresentation test for polyp versus cancer. Fold enrichment is
calculated by taking the ratio of the expected number of genes based on the genes found
under that category in the micro-array chip and comparing this to the actual observed
number of genes in that category. Biological processes with fold enrichment ratio >2 or
<0.66 have been shown.
Biological
Process
Fold
enric
hme
nt
P
value
No
of
gene
s
Genes
Chromatin
organisation
2.50 <0.001
25 LIN6,HIST1H3A, BRD3, SMC2, NAP1L,
SMC4,HIST1H4A,HIST1H2BC, HIST1H2AG,
HIST1H2AB, CARM1, H1FO, HIST2HAA3,
HIST1H1B, HIST1H2AC, HIST1H1D, TNRC18
Tricarboxylic
acid cycle
>5 0.001
5 LDHB, ACO2, ME1, LDHA, LDHC
Monosacchar
ide metabolic
process
2.17 0.015 11 LDHB, UGTB11, PPARG, PFKL, LDHA,
UGTB15, LDHC, FUT2, PMM2, INPPL1.
Glycolysis 4 0.019 4 LDHA, PFKL, LDHB, LDHC
mRNA
processing
0.3 <0.001 3 UPF1, PPP1CB, APOBEC3B
Nitrogen
compound
metabolic
process
0.66 0.009 26 BMP5, CDC42EP1, APOA1BP, MLXIP, SPDEF,
RGS5, PARP1, FOXA2, THNSL2, CYB5R2,
AXIN2, HIST1H2BC, CARM1, DHX34,
PPARGC1B, TSEN2, CYC5, MAGOHB, GPT,
ATP5D, POLR2E, DAB2IP, ABCA7, KIF13B,
TNRC18, FOXP4
RNA splicing <0.2 0.038 1 TSEN2

149 | P a g e
4.3.3.6. Several cellular processes are dysregulated in the colonic field
The findings from the study can be summarized as shown in figure 4.7. The mucosal field
around a polyp contains cells that have altered cytoskeleton and dysregulated growth factor
activity. Some of the genes highlighted by the functional analysis were involved in epithelial
–mesenchymal transition (EMT) suggesting that cell structure and interaction with
surrounding stromal cells may become modified early on in the carcinogenesis pathway.
Subsequently, cells acquire the ability to survive in poor nutrient conditions and evade the
host immune response as seen by the genes that were dysregulated between polyp and
cancer. In all three categories, there was less enrichment of genes that are involved in
regulation of RNA replication and transcription suggesting that the cells in the mucosal field
progressively accumulate disordered nuclear division.

150 | P a g e
Figure 4.7. Proposed cellular alterations in the colonic field during progression along the
adenoma-carcinoma sequence based upon genes identified in the PANTHER analysis.
HIST1H4A (Histone Cluster 1, H4A)
Biological regulation
Enzymatic function
APOBEC3B
MAOB
AXIN2
RGS5
RNA transcription factors
IRF5
TAF1L
E2F7
SREBF1
Metabolism
Elimination of toxins
UGTB15
UGTB11
Glycolysis
LDHA
LDHC
LDHB
Tricarboxylic acid cycle
ACO2
ME1
PFKL
Immune function Cell-cell interaction
Cell adhesion
LAMA2
CLEC4A1
TNS1
UGTB11
Cytoskeleton
PLS3
TPPP
TPPP3
Transcription factors
DACH1
HOXB9
STAT5
Transcription Co-factors
PRRX1
CSRP2
Chemokines
CCL3
CCL4
CCL13
CCL19
CCL21
CCL23
Macrophage function
LILRB1
CEBPB
IRF5
APOE
Mo
re e
nri
ched
gen
es
Less
en
rich
ed g
enes
Control versus Polyp Transition to cancer
FUT2 (Fucosyltransferase 2)
Adenoma Normal colon Cancer

151 | P a g e
4.3.3.6.1. Immune response
Several of the genes that were identified under the immune response category were related to
macrophage function included LILRB1, CEPB, IRF5 and APOE. LILRB1 is a leukocyte
immunoglobulin receptor which is found on immune cells where it binds to MHC class I
molecules on antigen presenting cells. CEBPB is a transcription factor that binds to certain
DNA regulatory elements on other acute phase and cytokine genes. IRF5 acts as a molecular
switch determining whether macrophages promote or inhibit inflammation.
The cytokines that were found to be more enriched in cancer versus control included CCL3,
CCL4, CCL13, CCL19, CCL21 and CCL23. CCL19 and CCL21 have homeostatic function,
being constitutively expressed in certain tissue and attracting leukocytes as part of normal
physiological function. In comparison, CCL3 and CCL4 are pro-inflammatory and are only
expressed under pathological conditions.
4.3.3.6.2. Metabolism
Enrichment of genes involved in cellular metabolism was found in all three groups,
however, only two terms were enriched in the polyp versus control comparison: steroid
metabolic process and monosaccharide metabolic process. UDP glucuronosyltransferase 2
family, polypeptide B15 (UGTB15) and UDP glucuronosyltransferase 2 family, polypeptide
B11(UGTB11) were found in both polyp versus control and polyp versus cancer. These
genes encode enzymes that are important for the conjugation and subsequent elimination of
potentially toxic xenobiotics and endogenous compounds.
In the cancer versus control and cancer versus polyp comparison, three common processes
were enriched which included glycolysis, tricarboxylic acid cycle (Hoy et al.) and lipid

152 | P a g e
metabolic process. In terms of glycolysis and TCA, lactate dehydrogenase A (LDHA) and C
(LDHC) were found in both of these categories whilst lactate dehydrogenase B (LDHB),
Aconitase 2 (ACO2), Malic enzyme (ME1) and Phosphofructokinase, Liver (PFKL) were
only found in the cancer versus polyp comparison.
Lipid metabolic process was the other biological term that was found to be enriched in the
analysis comparing cancer with control or polyp. However, only 8/50 genes found in the
cancer versus control category were also found in the cancer versus polyp category.
Fucosyltransferase 2 (FUT2) was the only gene that was identified in all three comparisons.
This gene encodes a protein that is a Golgi stack membrane protein, involved in the creation
of a precursor of the H antigen in body fluids and intestinal mucosa. The H antigen is an
oligosaccharide which acts as a carbon source and attachment site for intestinal bacteria.
4.3.3.6.3. Cell-cell interaction
Most of the genes that were identified under the polyp versus control category contribute to
cytoskeleton function, microtubule assembly, cell adhesion and cell proliferation. Key genes
identified included PLS3, TPPP, TPPP3, LAMA2, CLEC4A1, TNS1, HOXB9, STAT6,
PRRX1 and FGF7. PLS3 encodes an actin-bundling protein that inhibits cofilin mediated
depolymerisation of actin fibres. LAMA2 encodes the alpha 2 chain of laminin 2 and 4.
Laminin is an extracellular protein that is a component of the basement membrane and
interacts with other ECM constituents to mediate migration and attachment of cells. STAT6,
HOXB9 and PRRX1 are involved in transcription.

153 | P a g e
4.3.3.6.4. RNA transcription
In all three categories, the biological processes where genes were less enriched compared to
the background population included those involved in biological regulation or RNA
transcription suggesting dysregulation of homeostasis and production of proteins. Only one
gene which fell under these terms was found in all three categories; HIST1H4A (Histone
Cluster 1, H4A) which encodes a member of the Histone 4 (H4) family. Histone proteins
form an octamer around which DNA is wrapped. Despite the similarity in the terms that
were enriched, only 11/27 and 2/27 of the genes found in the control versus cancer
comparison were also found in the cancer versus polyp and polyp versus control categories
respectively. This suggests that different genes with variant cellular and biological functions
are dysregulated along the adenoma-carcinoma sequence. In the polyp versus control
category, most of the genes identified had enzymatic activity such as hydrolase activity
(APOBEC3B), oxidoreductase activity (MAOB), GTPase activity (AXIN2, RGS5). In
comparison, most of the genes identified in the cancer versus polyp category were
transcription factors or cofactors suggesting that altered transcription occurs later in the
cancer process.

154 | P a g e
4.4 Discussion
This study offers unique opportunity to examine the cellular processes that are altered in the
MNM and identify genes that may play a role in field cancerisation. Furthermore, it is
possible to cluster the patients that have polyps and cancers from controls based upon the
gene expression profile of MNM suggesting a possible role of field cancerisation in
screening and early diagnosis.
Micro-array analysis is an efficient way to measure gene expression and samples the genome
in an unbiased fashion enabling a candidate-free approach to identification of putative
biomarkers. In CRC, most studies have been conducted comparing normal mucosa with
cancer tissue to determine the molecular pathways that are involved in carcinogenesis (Alon
et al., 1999; Notterman et al., 2001; Birkenkamp-Demtroder et al., 2005; Grade et al., 2007;
Croner et al., 2005). Whilst these studies have been successful in clustering normal versus
tumour samples and to a lesser extent, different progression stages (Frederiksen et al., 2003;
Groene et al., 2006; Croner et al., 2008), MSI status (Kruhøffer et al., 2005; Banerjea et al.,
2004) and anatomical location (Bertucci et al., 2004; Komuro et al., 2005; Birkenkamp-
Demtroder et al., 2005), there have been few previous reports where the MNM in cancer
patients has been profiled. Although only a small fraction (approx. 2 %) of the genes used on
a microarray platform have been found to be differentially expressed between cancer and
control tissues (Cardoso et al., 2007), a number of common processes have been identified
across studies. Genes that are dysregulated between cancer and control are usually involved
in cell adhesion, cell communication, cell cycle regulation, cellular and nucleic acid
metabolism and the cellular response to external stimuli which includes the immune and
stress response (Cardoso et al., 2007). However, there are multiple genes that have been
highlighted in these studies which have no proven role in CRC and require further
investigation (Nannini et al., 2009).

155 | P a g e
Across the DEGS identified, the gene expression profile of adjacent MNM in cancer and
polyp patients varied the most. Amongst many of the DEGs found, there was an inverse
relationship between gene expression in cancer compared to polyp suggesting that either the
genes involved have a dual function similar to that found with TGFβ (Derynck et al., 2001;
Wakefield & Roberts, 2002) or that there are dynamic gene expression changes along the
adenoma-carcinoma pathway. In this setting, genes that play an integral role in polyp
formation may reach a threshold after which upregulation of the gene is of no further benefit
to the cell and consequently it is turned off.
A number of cellular processes were found to be dysregulated in the colonic field around
CRC and adenomas including the immune response, metabolism, epithelial-mesenchymal
transition (EMT) and cellular proliferation.
4.4.1. Immune response
Several of the genes highlighted under immune system response play a role in macrophage
function. In some studies, macrophages have been shown to enhance tumour growth and
progression. They are usually attracted by hypoxic and necrotic tumour cells and release
pro-inflammatory compounds such as TNF-alpha which activate NF-KB. NF-KB enters the
nucleus and switches on anti-apoptotic genes and genes that increase cell proliferation or
inflammation. Tumour growth is further augmented by the macrophages with release of pro-
angiogenic factors such as VEGF, GM-CSF and IL-1/IL-6 (Jedinak et al., 2010). However a
more recent study (Ong et al., 2012) has challenged this view and shown that tumour
associated macrophages in CRC exert a tumour suppressive effect and are pro-inflammatory.
In another study, it was possible to blunt the innate pro-tumoral effects of macrophages by
forcing IFN-alpha expression tumour infiltrating macrophages and convert the tumour

156 | P a g e
microenvironment towards more effective dendritic cell activation and immune effector T
cell cytotoxicity (Escobar et al., 2014).
The enrichment of genes involved in macrophage function was coupled by enriched genes
having chemokine/cytokine activity which reflects the requirement to attract
immune/inflammatory cells. The role of the immune system in carcinogenesis is supported
by the observation that there is an increased incidence of CRC amongst
immunocompromised individuals (Sint Nicolaas et al., 2010). Furthermore, an increase in
the inflammatory/immune component of a tumour has been associated with reduced risk of
recurrence and improved survival (Pagès et al., 2005; Nosho et al., 2010; deLeeuw et al.,
2012). This suggests that the immune system may be important in counteracting cancer
growth and if dysregulated, could contribute to invasion and the formation of metastasis.
This is of further interest as pharmacological manipulation of this immune response could
aid the host in fighting against cancer and can contribute to chemotherapy induced cell
death.
4.4.2. Metabolic process
Several of the genes that were dysregulated between cancer and control tissue played a role
in mitochondrial function and Tricarboxylic acid cycle (Hoy et al.). Several TCA genes have
been found to be mutated in hereditary and sporadic cancer (Gaude & Frezza, 2014). Under
normal physiological conditions, anaerobic respiration only occurs when there is insufficient
oxygen available. However, in cancer cells, there is increased LDHA activity which enables
cells to convert pyruvate into lactate even when there is sufficient oxygen. This has been
termed the Warburg effect (WARBURG, 1956) and explains how the energy demands of
rapidly dividing cells can be met without relying upon glucose delivery (Vander Heiden et
al., 2009). Increased lactate levels have been correlated with poor disease free survival and

157 | P a g e
increased incidence of metastases in a number of different cancers (Schwickert et al., 1995;
Walenta et al., 1997) including rectal cancer (Walenta et al., 2003).
Dysregulation of the TCA also leads to production of higher reactive oxygen species which
contributes to cancer formation. ME1 is found in the cytoplasm (in contrast to ME2 which is
mitochondrial) and catalyses the oxidate decarboxylation of malate into pyruvate. Malate
metabolism has been shown to be compartmentalized (Moreadith & Lehninger, 1984).
Malate generated in the mitochondrion proceeds through the TCA whereas cytosolic malate
is converted to pyruvate and then citrate, potentially fuelling fatty acid and cholesterol
biosynthesis, aiding tumour growth. ME1 and ME2 expression have been shown to be
regulated by p53 (Jiang et al., 2013) which is one of the key genes to be dysregulated in
CRC suggesting a potential role of ME1 in colorectal carcinogenesis.
4.4.3 Epithelial-mesenchymal transition (EMT)
Similar to previous reports (Lin et al., 2002), this study demonstrated that there are changes
in gene expression of genes encoding components of the cytoskeleton and extracellular
matrix in patients with polyps compared to controls. These changes could contribute to
epithelial mesenchymal transition (EMT) whereby epithelial cells become spindle shaped,
motile and develop the ability to invade the basement membrane. Contrary to previous
studies which have linked EMT with more aggressive, metastatic tumours (Tam &
Weinberg, 2013) or proposed that it facilitates drug resistance against chemotherapy agents
(Kim et al., 2015), this study did not find similar enriched terms in the other two
comparisons. The findings could suggest that EMT may be taking place earlier in the
colorectal cancer pathway than previously thought. Alternatively, changes in cell
morphology and adhesion could occur at the polyp stage with the complete process of EMT
only taking place once key genes, such as TGFβ are activated. A recent study (Yokobori et

158 | P a g e
al., 2013) identified elevated levels of PLS3 in circulating CRC cells and demonstrated that
it was independently associated with prognosis. The authors postulated that it plays a role in
driving EMT and therefore cancer cells with high expression have greater malignant
potential through acquiring a mesenchymal phenotype. A subsequent study (Sugimachi et
al., 2014) has shown that PLS3 induces EMT via activation of the TGFβ pathway and
confers the ability to invade. Similarly, TPPP and TPPP3 also bind tubulin and have
microtubule bundling activity and help maintain the integrity of the microtubule network.
Several of the other genes that were identified were involved in cell adhesion thus alterations
in these genes could also contribute to the process of EMT.
4.4.4. Cell proliferation
The other term that was found only to be enriched between polyp and control was ‘cellular
process’. Multiple different genes were included under this term including transcription
factors, transcription co factors and supportive growth factors such as FGF7. STAT6 is
induced by IL4 and upon phosphorylation, translocates to the nucleus where it induces the
expression of the anti-apoptotic proteins BCL2L1/BCL-X(L). In one study, CRC cell lines
where STAT6/IL4 are upregulated displayed increased resistance to apoptosis and increased
metastatic potential (Li et al., 2008). The authors went onto show that xenograft tumours of
STAT6 active HT29 cells displayed a predisposition to TH2 cytokines (IL-4 and IL5) and
were more pro-apoptotic and pro-metastatic (Li et al., 2012). HOXB9 encodes a protein with
a homeobox DNA-binding domain which acts as a sequence specific transcription factor
which is involved in cell proliferation and differentiation. HOXB9 expression has been
shown to correlate with poor survival and higher incidence of metastasis in CRC patients
(Huang et al., 2014). DACH1 is a chromatin associated protein that interacts with other
DNA-binding transcription factors to regulated gene expression and determine cell fate.
Expression of this gene has been shown to be lost in some forms of cancer including breast,

159 | P a g e
endometrial and prostate cancer (Nan et al., 2009; Wu et al., 2006; Wu et al., 2007a;
Yamada et al., 2008). In a recent study, DACH1 was found to be switched off by promoter
region hypermethylation in CRC and subsequent reduction in DACH1 expression correlated
with late tumour stage, poor differentiation grade and increased incidence of lymph node
metastasis (Yan et al., 2013). Loss of DACH1 expression lead to TGF-β induced EMT
which contributed to increased cell growth, motility and invasiveness (Wang, 2015).
4.4.5. Field cancerisation
Most of the previous studies that have investigated field cancerisation in CRC have shown
differences in cellular proliferation and apoptosis along the colon, at distant sites to the
primary tumour (Anti et al., 2001; Badvie et al., 2006; Anti et al., 1993). More recently,
investigators have demonstrated that there are methylation changes in the colonic field
around a CRC which mirror the epigenetic changes found in the tumour itself (Worthley et
al., 2010; Belshaw et al., 2008). Others have shown that there is reduced protein expression
of important DNA repair proteins up to 10 cm away from the tumour in the macroscopically
normal mucosa around a cancer (Facista et al., 2012). The differences in immune response,
cellular metabolism and cell-cell interaction that have been reported in this study have
previously not been investigated in the context of field cancerisation. Thus, a candidate free
approach was successful at identifying novel cellular processes that are dysregulated in the
colonic field. Although some of these genes have been implicated in CRC formation
previously, their role in being a marker of the field defect or driving biological alteration in
the colonic field has not been evaluated. Further validation of the genes identified could help
to elucidate if they can act as CRC biomarkers and help to risk stratify individuals based on
the field cancerisation concept.

160 | P a g e
4.4.6. Limitations
There are some limitations to this study that require further consideration. Although the
number of patients investigated may appear small, it is comparable to earlier microarray
exploratory studies designed to investigate global differences in gene expression (Kitahara et
al., 2001; Zou et al., 2002; Dai et al., 2012). The other limitation is that no molecular
subtyping of the CRC was performed. Previous studies investigating field cancerisation have
highlighted that gene expression changes in the MNM parallel those found in the tumour
itself suggesting that they may predate or contribute to the malignant process (Worthley et
al., 2010; Facista et al., 2012). This also implies that there may be differences in the various
molecular subtypes of CRC with field cancerisation being observed in only specific types.
However, there is insufficient evidence in the current literature to determine which
molecular subtypes of CRC are more important when investigating field cancerisation. Thus,
it was felt that it would be more important to ascertain which cellular processes are
dysregulated across several molecular subtypes of CRC rather than focusing on any
individual subtype.
One of the shortcomings of microarray technology has recently been highlighted in a meta-
analysis which found little overlap in the differentially expressed genes reported in different
studies. Amongst the genes that were reported by multiple studies, there were
inconsistencies in the direction in which the genes were changed. This may relate to
differences in sample collection and processing (with some using laser capture
microdissection), use of different array technology (cDNA versus oligonucleotide array) and
discrepancies in analysis techniques or definitions of what constitutes differential expression
(Cardoso et al., 2007). It highlights that individual genes that are identified by these studies
require validation using different experimental techniques to support the micro-array
findings.

161 | P a g e
4.5. Summary and conclusions
Multiple cellular processes were altered in the MNM around cancer and adenomas
supporting the field cancerisation concept
Several of the genes identified were related to the extracellular matrix, cytoskeletal
components, cell adhesion and epithelial-mesenchymal transition.
The transition to invasive malignancy was accompanied by alterations in immune
function and metabolism in the MNM around cancer.
Across all three groups, genes that regulate RNA transcription were under-
represented suggesting inactivation of these genes which could contribute to the
genomic instability observed in tumour tissue itself.
It is unclear whether these biological processes occur prior to or after the
development of cancer which requires further investigation
It is important to both validate and investigate the differences in global gene
expression observed in this study as this will facilitate identification of biomarkers
that can not only aid early diagnosis but could be utilised to risk stratify individuals
prior to the development of any histological abnormality.

162 | P a g e
Chapter 5: Differences in
gene expression in the
colonic field around
colorectal cancer and
polyps

163 | P a g e
5.1. Introduction, aims and objectives
5.1.1 Introduction
The concept of field cancerisation, first described by Slaughter (SLAUGHTER et al., 1953),
has been applied to several different cancers (Wong et al., 2001; Kim et al., 2006;
Grepmeier et al., 2005; Kakizoe, 2006; Kitago et al., 2004; Jonason et al., 1996) including
colorectal cancer (CRC). Over the last three decades, there has been a gradual increase in the
number of reports describing alterations in the macroscopically normal mucosa that could
potentially hold the clue to the process that underlies field cancerisation (Shen et al., 2005;
Polley et al., 2006; Badvie et al., 2006; Bernstein et al., 2013). There have been a few
attempts to translate these findings into the clinical arena enabling early CRC diagnosis
based upon biological changes detected at a distant site to the tumour (Gomes et al., 2009).
Despite these advances, the biological processes that underlie field cancerisation remain
poorly understood. In the previous chapter (chapter 4), a candidate free approach with
microarray technology was utilised to identify novel cellular processes and genes that were
dysregulated in the macroscopically normal mucosa (MNM) around CRC and colorectal
adenomas. A number of genes were identified based on the two different analytical methods
utilised (see chapter 4) including MUC2, MUC5AC, GADD45B, PSCA, FUT2, CXCL2,
S100P and SLC46A1 (see table 5.1.). These genes were chosen based on statistical
significance and biological relevance as discussed in chapter 4.

164 | P a g e
Table 5.1. Micro-array genes. Genes identified for further investigation based on the
microarray study findings. Information given regarding the family of genes to which the
gene belongs, its biological function and role in cancer biology. Gene General description Specific description Role in cancer
MUC2
Mucin 2
MUC5AC
Mucin 5,
subunit AC
Family of proteins (MUC1-
MUC21) containing tandem
repeat structures with high
proportion of prolines,
threonines and serines.
(Timpte et al., 1988; Gendler
et al., 1987)
Secreted mucins (MUC2,
MUC5AC and MUC6)
produce mucous gel -
physical barrier.
MUC2-colorectal
MUC5AC-bronchial
Implicated in lung, gallbladder
and GI tract cancer (López-
Ferrer et al., 2001; Yu et al.,
2005; Briggs et al., 2009).
Conflicting reports in tumour
vs control.
GADD45B
Growth
arrest DNA
damage
inducible 45,
subunit B
Small, conserved proteins
which act as stress sensors and
modulate the cellular response
to genotoxic or physiological
stress (Liebermann &
Hoffman, 2002). Interacts
with other proteins involved in
the stress response including
PCNA, p21, Cdc2/Cyclin B1,
MEKK4 and p38 kinase
GADD45B acts in co-
ordination with other
factors to inhibit cell
growth and promote
apoptosis
Implicated in human
hepatocellular carcinoma and
pituitary gonadotrope tumours
(Michaelis et al., 2011; Ou et
al., 2010; Qiu et al., 2003).
Role in CRC unclear.
CXCL-2
Growth
related
oncogene β
(GRO- β)
CXC family - group of small
proteins that modulate
leukocyte migration to sites of
inflammation (Charo &
Ransohoff, 2006) and in
tumours, induce angiogenesis
and modify host immune
response (Balkwill, 2012;
Koizumi et al., 2007)
CXCL-2 is an ELR (‘glu-
leu-arg’ ) positive
chemokine - pro-
angiogenic, able to attract
& activate neutrophils &
stimulates endothelial cell
migration
(Vandercappellen et al.,
2008; Strieter et al., 2006).
Possible role in CRC though
reports are conflicting
(Friederichs et al., 2005).
Possible role as a serum
biomarker of CRC (Zheng et
al., 2015)
SLC46A1
solute carrier
family 46
(folate
transporter),
member 1
Proton coupled folate
transporter (PCFT), involved
in intestinal absorption of
dietary folates (Hou &
Matherly, 2014; Zhao &
Goldman, 2007)
More active in the
stomach and tumour tissue
as requires a more acidic
environment
Linked to longer disease free
survival in CRC (Odin et al.,
2015)
S100P
S100
calcium
binding
protein P
95 amino acid residue protein,
member of EF-hand
superfamily of calcium
binding proteins which
mediate calcium dependent
signalling regulating cellular
processes such as cell cycle,
growth, differentiation and
metabolism (Donato,
2001)(Donato 2001)
Interacts with (RAGE) to
stimulate Erk and (NF)-κB
activity leading to cell
growth and migration
(Tóthová & Gibadulinová,
2013). Targets E2/EP4
receptor signalling
pathway leading to cell
invasion and motility
(Chandramouli et al.,
2010)
Implicated in several cancers
including cancer of the
pancreas (Dowen et al., 2005),
breast (Guerreiro Da Silva et
al., 2000), prostate (Wang et
al., 2007), lung (Rehbein et
al., 2008) and colon
(Birkenkamp-Demtroder et
al., 2005).
FUT2
Fucosyltrans
ferase
2
Secretor type of α(1,2)
fucosyltransferase-regulates
expression of H antigen
(Wang et al., 1994a; Wang et
al., 1994b; Masutani &
Kimura, 1995) (precursor of
essential A and B antigens)
Determine microbial flora
in colon thus provides link
between microbiota and
CRC
Glycosylation pattern of A/B
antigens changes during
malignant transformation
(Hakomori, 1989).
PSCA
Prostate
stem cell
antigen
Member of the LY-6 family of
surface proteins
High in prostate, bladder,
endometrium, kidney, lung &
pancreas cancer (Liu et al.,
2010; Cao et al., 2005;
Elsamman et al., 2006).

165 | P a g e
Early reports addressing the changes in the MNM adjacent to CRC (termed the transitional
mucosa) identified an increase in the number of goblet cells (Dawson & Filipe, 1976;
Riddell & Levin, 1977) with changes in sulfation of mucin that was present (Nieuw
Amerongen et al., 1998; Filipe & Branfoot, 1974). Therefore, it seems plausible that there
could be changes in mucin content in the adjacent MNM around cancer or polyp that could
play a role in field cancerisation. Several recent reports have highlighted defective DNA
repair in the MNM around CRC up to 10 cm from the tumour which could underlie field
cancerisation (Shen et al., 2005; Facista et al., 2012). Similarly, GADD45B which is usually
released in response to cellular stress, also helps to maintain genomic integrity by arresting
cell growth and promoting apoptosis. It has recently been identified in a 12 gene marker
panel utilised for risk stratification of stage II CRC patients (O'Connell et al., 2010; Gray et
al., 2011). This implies that it is a marker of risk of recurrence which could occur through
field cancerisation whereby individuals with a field defect are at higher risk of metachronous
lesions. Therefore, GADD45B could be an indicative marker of field cancerisation.
The other five genes that were selected for further investigation have previously not been
linked to field cancerisation, though a few of them have been implicated in CRC formation.
CXCL2 interacts with its receptor, CXCR2 to activate neutrophils and endothelial cells
(Strieter et al., 1995; Addison et al., 2000). There have been a few studies which have
linked expression of chemokines to increased metastatic potential and poor clinical outcome
in CRC (Kim et al., 2005; Schimanski et al., 2005; Günther et al., 2005; Kawada et al.,
2007; Kollmar et al., 2006; Yoshitake et al., 2008). However, studies in which CXCL2
expression in CRC has been examined have yielded conflicting results. Some have proposed
that it is increased in CRC (Doll et al., 2010), others have failed to demonstrate a difference
in expression levels (Cuenca et al., 1992; Wen et al., 2006) whilst there have been a few
reports to imply that it is actually anti-angiogenic (Cao et al., 1995). Further investigation is
necessary to elucidate the precise role of this chemokine in CRC.

166 | P a g e
SLC46A1 has been linked to improved disease free survival in CRC (Odin et al., 2015)
whereas S100P has been associated with increased tumourigenic activity and metastatic
potential in CRC suggesting that it may have a role in promoting carcinogenesis (Jiang et al.,
2011; Wang et al., 2012; Dong et al., 2014). In comparison, despite being linked to
susceptibility to infections such as Norovirus (Marionneau et al., 2005; Carlsson et al.,
2009) and HIV progression (Kindberg et al., 2006), the role of FUT2 in CRC is poorly
understood. In the foetus, ABH antigens are expressed equally along the length of the colon
(Dabelsteen et al., 1988; Szulman, 1987). At birth, ABH antigens are no longer expressed in
the distal colon which creates a proximal-distal gradient. Several studies have linked
differences in expression of H antigens to tumour progression in the distal colon and rectum
(Wiley et al., 1981; Yuan et al., 1985; Schoentag et al., 1987). However, there have also
been reports suggesting that cell surface fucosylation does not affect development of colon
tumours in mice (Domino et al., 2007)(Domino et al, 2007) questioning its role in
carcinogenesis.
PSCA had the highest fold change in both types of microarray analysis and was therefore
selected. It is usually overexpressed in prostate cancer, particularly with the more aggressive
form, (Gu et al., 2000). Reduced levels of expression have been found in bladder, gastric
and oesophageal cancer (Bahrenberg et al., 2000). There have only been a few reports
investigating the PSCA gene and colorectal cancer which have not yielded any conclusive
results.
Although these genes were identified with the previous microarray study, it is generally
accepted that validation of microarray findings is necessary. This is usually achieved by
examining gene expression in a separate cohort of patients to the original set or utilising
different experimental methods.

167 | P a g e
5.1.2 Aims and objectives
The aim of this study was to
i) Measure the gene expression level of MUC2, MUC5AC, GADD45B, PSCA,
SLC46A1, CXCL2, S100P and FUT2 in colorectal tumour tissue, adjacent
MNM, at the resection margin and in control subjects to elucidate if these genes
have any role in field cancerisation
ii) Validate the findings from the micro-array study (discussed in chapter 4) by
measuring mRNA expression of these genes and comparing it to levels
identified using micro-array
iii) Determine serum concentration of CXCL2 in control subjects and patients with
cancer to determine if it could be used as a serum biomarker

168 | P a g e
5.2. Materials and Methods
5.2.1 Setting and participants
Ethical approval was sought as detailed in Chapter 2. In brief, after gaining informed
consent from participants, mucosal tissue samples were taken from the tumour, adjacent to
the tumour and at the most distant resection margin of the colectomy specimen from
individuals undergoing surgery. These patients were age and sex matched to control subjects
who were recruited at the time of colonoscopy. Mucosal pinch biopsies were taken from the
caecal pole and rectum in these individuals. If a polyp was identified during the procedure, a
biopsy adjacent to the polyp was also taken. The samples taken from these patients were
used to examine field cancerisation around polyps. Only samples proven to be adenomatous
on histology were included in this cohort. Right sided polyps and cancers (proximal to mid-
transverse) were matched with caecal samples from control subjects and left sided polyps
and cancers were matched to rectal biopsies from control subjects. Patients with polyps also
had additional biopsies taken from the caecum or rectum that were tested concurrently. No
mucosal tissue was taken from the polyp itself as this is routinely analysed to exclude a
malignant component. Thus, the results that are presented under the term ‘polyp’ are actually
the gene expression levels of tissue found adjacent to the polyp.
In total, 225 samples were included in the analysis from 30 cancer patients, 29 control
patients and 23 patients with polyps. Due to the presence of synchronous lesions in some of
these patients, 36 cancers and 32 polyps were assessed in total. Demographic data for the
cancer and polyp patients are shown in table 5.2. In a subset of patients, serum CXCL2
levels were measured as outlined in chapter 2.

169 | P a g e
Table 5.2. Clinical and pathological details of patients included in the analysis
Control Subjects
(n=29)
Polyp patients
(n=23)
Cancer patients
(n=30)
Median Age
(IQR)
69 (60-76) 71 (64-78) 66 (57-73)
Male: Female 19:10 15:8 21:9
Mean BMI (+/- S.D.) 25.9 (3.9) 26.3 (5.2) 26.1 (5.5)
Smokers/Ex-
smokers (%)
6 (21%) 10 (43%) 9 (30%)
Diabetics (%) 4 (14%) 7 (30%) 3 (10 %)
Aspirin use (%) 3 (10%) 7 (30%) 3 (10%)
Statin use (%) 7 (24%) 5 (22%) 10 (33%)
Cancers (n=36)
Operation
Right
Hemicolectomy Extended R
hemicolectomy
Anterior Resection
Sigmoid colectomy
Left Hemicolectomy
Other
11
5
9
1
2
3
T staging
T1-T2
T3-T4
N staging
N0
N1-N2
Grade of tumour
Well/Mod
Poor
8
28
19
17
21
15
Polyps (n=32)
Type of polyp Sessile
Pedunculated
Villous
Histology of polyp
Tubular adenoma
Tubulovillous
adenoma
Serrated adenoma
Other
24
7
1
18
7
6
1
Size of polyp
< 10 mm
10-20 mm
>20 mm
Grade of dysplasia
Low
High
Hyperplastic
14
10
8
29
1
2
170 | P a g e
5.2.2. Experimental methods
The samples were stored in RNA later, kept at 4 oC overnight and subsequently stored at -20
oC for future processing. mRNA was extracted using Qiagen RNeasy tissue mini-extraction
kit and cDNA synthesis was performed with 250 ng cDNA as previously described (see
chapter 2 for further details). Quantitative real time PCR (qRT-PCR) was performed with
Taqman gene expression assays. The comparative 2-∆∆CT method was used to calculate
mRNA expression level of the genes compared to expression levels of 18S which was the
endogenous control. All values were log10 transformed prior to statistical analysis to
normalise the data. Changes in gene expression of MUC2, MUC5AC, GADD45B,
SLC46A1, FUT2, S100P and CXCL-2 were measured in all samples. To preserve the small
quantities of samples available, PSCA was measured only in a subset of the patients as it
was found to be expressed at very low levels, particularly in normal colonic tissue. Serum
CXCL2 levels were measured using the MIP2 Human Simple Step Elisa Kit (Abcam, UK)
as outlined in chapter 2.
5.2.3. Statistical analysis
Statistical analysis was performed using SPSS version 21 (SPSS Inc, Chicago, Illinois).
Normally-distributed variables were described as mean and standard deviation and non-
normally distributed variables as median and interquartile range. Categorical variables were
described as numbers and percentages. The test of significance to determine a difference
between groups was assessed using chi-squared with categorical variables, t test or Mann-
Whitney U test for ordinal variables. A p value of <0.05 was considered significant.
Multivariate linear regression analysis was used to identify patient and pathological factors
that affected expression levels of the genes examined.
The detailed analytical methods of the two types of analysis that were performed of the
microarray data has been described in chapter 2. Genes that were chosen for validation in

171 | P a g e
analysis 1 were based upon statistical significance and biological plausibility with scientific
reports linking the gene to field cancerisation. In the second analysis, genes were chosen
based on their statistical significance across different comparisons between cancer, adenoma
and control subjects. As alluded to previously, there was very little existing literature that
linked these genes to field cancerisation.

172 | P a g e
5.3. Results
5.3.1. Mucin expression is altered in CRC but GADD45B is no different
MUC2 was significantly downregulated (0.4 fold) in tumour tissue compared to control
subjects (∆∆CT (tumour) 11.41 versus ∆∆CT (controls) 10.04, p=0.003). However, expression
levels in the adjacent MNM and at the resection margin were no different to control subjects
(∆∆CT (adjacent MNM) 9.87 and ∆∆CT (margin) 10.09 versus ∆∆CT (controls) 10.04, p=0.467
and p=0.826 respectively).
In comparison, MUC5AC was significantly upregulated (12 fold) in tumour tissue compared
to control subjects (∆∆CT (tumour) 13.45 versus ∆∆CT (controls) 17.12, p<0.0001). Again, the
MUC5AC expression in the adjacent MNM and at the resection margin was similar to that
found in control subjects (∆∆CT (adjacent MNM) 17.83 and ∆∆CT (margin) 17.25 versus ∆∆CT
(controls) 17.12, p=0.408 and p=0.889 respectively).
In control subjects, there was a significant increase in expression of MUC2 and MUC5AC
along the colon with levels in the left colon being significantly higher than the right colon
(p<0.001 for both). MUC2 was significantly down regulated in the tumour tissue for left
sided tumours only (p=0.017) and MUC5AC was significantly upregulated for right sided
tumours only (p<0.001).
No significant differences in gene expression of GADD45B were found between the four
groups examined (∆∆CT (tumour) 15.65 versus ∆∆CT (controls) 15.96, p=0.201).

173 | P a g e
Figure 5.1.1. MUC2 expression levels
in control subjects compared to tumour
samples, MNM adjacent to tumour and
at the resection margin from the
colectomy specimen.
Figure 5.1.2 MUC5AC expression
levels in control subjects compared to
tumour samples, MNM adjacent to
tumour and at the resection margin from
the colectomy specimen.
Figure 5.1.3 GADD45B expression
levels in control subjects compared to
tumour samples, MNM adjacent to
tumour and at the resection margin
from the colectomy specimen.
0.05
0.06
0.07
0.08
0.09
0.1
0.11
control tumour adjacent margin
1/d
CT
Sample site
0.05
0.06
0.07
0.08
0.09
0.1
0.11
control tumour adjacent margin
1/d
CT
Sample site
0.05
0.06
0.07
0.08
0.09
0.1
0.11
control tumour adjacent margin
1/d
CT
Sample site
***
***
NS

174 | P a g e
Based on paired analysis of samples taken from the colectomy specimen, MUC2 was
significantly downregulated and MUC5AC was significantly upregulated in the tumour
compared to the resection margin (p=0.004 and p<0.0001 respectively). No differences were
found between the adjacent MNM and resection margin.
Across all three genes, there were no differences in mRNA expression in the adjacent MNM
around polyps compared to control subjects (MUC2 p=0.650, MUC5AC p=0.553 and
GADD45B p=0.511). However, if the MNM adjacent to polyp was compared to that around
cancers, MUC5AC was found to be significantly upregulated (∆∆CT (adjacent polyps) 15.73
versus ∆∆CT (cancer) 17.83, p=0.017).

175 | P a g e
Fig 5.1.4. MUC2 expression levels
in control subjects compared to
right colonic, left colonic and
adjacent MNM taken in patients
with polyps.
Fig 5.1.5. MUC5AC expression
levels in control subjects compared
to right colonic, left colonic and
adjacent MNM taken in patients
with polyps.
Fig 5.1.6. GADD45B expression
levels in control subjects compared
to right colonic, left colonic and
adjacent MNM taken in patients
with polyps.
0.04
0.05
0.06
0.07
0.08
0.09
0.1
0.11
control R colon Polyp L colon
1/d
CT
Sample site
0.04
0.05
0.06
0.07
0.08
0.09
0.1
0.11
control R colon Polyp L colon
1/d
CT
Sample Site
0.04
0.05
0.06
0.07
0.08
0.09
0.1
0.11
control R colon Polyp L colon
1/d
CT
Sample site
NS
NS
NS

176 | P a g e
5.3.2. CXCL2, S100P and FUT2 are dysregulated in CRC
PSCA was expressed at very low levels in colonic tissues (CT > 39 in 60 % samples tested).
Hence, only a small proportion of the cohort were included in the analysis. PSCA was
expressed in 10/12 tumours and there was no significant difference in expression levels in
control subjects compared to the cancer patients (p=0.121).
The expression levels of the other 4 genes are given in figure 5.3.1.6. Both CXCL2 and
S100P were significantly upregulated in tumour tissue compared to control subjects
(CXCL2: 60-fold difference, p<0.0001; S100P: 6-fold difference, p<0.001), FUT2 was
significantly downregulated (1.6-fold difference, p=0.002) and no differences were found
with SLC46A1 (p=0.115).
CXCL2 was significantly upregulated in the adjacent MNM and resection margin mucosa of
cancer patients compared to controls (4-fold difference and 5-fold difference respectively,
p<0.001 for both). SLC46 A1 was only upregulated in the adjacent mucosa and not at the
resection margin compared to control subjects. There were no differences in gene expression
of S100P and FUT2 in the adjacent mucosa or at the resection margin.
Using paired t tests, gene expression levels were also compared at the three sites of sampling
undertaken in patients with CRC. CXCL2 and S100P were significantly upregulated in the
tumour compared to the resection margin (p<0.0001 and p=0.009 respectively) and FUT2
was significantly downregulated (P<0.0001). No differences were found with SLC46A1
(p=0.666). The gene expression level of all four genes in the adjacent MNM was no different
to that at the resection margin.

177 | P a g e
Fig 5.2.1. Expression levels of CXCL2, FUT2, S100P and SLC46A1 in control subjects
compared to patients with cancer (samples taken from the tumour, adjacent MNM and at the
resection margin).
0.03
0.035
0.04
0.045
0.05
0.055
0.06
0.065
0.07
control tumour adjacentto tumour
resectionmargin
1/d
CT
Sample site
CXCL2
0.030.035
0.040.045
0.050.055
0.060.065
0.07
control tumour adjacentto
tumour
resectionmargin
1/d
CT
Sample site
FUT2
0.03
0.04
0.05
0.06
0.07
0.08
0.09
0.1
0.11
control tumour adjacentto tumour
resectionmargin
1/d
CT
Sample site
S100P
0.030.035
0.040.045
0.050.055
0.060.065
0.07
control tumour adjacentto
tumour
resectionmargin
1/d
CT
Sample site
SLC46A1
***
***
**
NS

178 | P a g e
With regards to patients who had polyps (see figure 5.3.1.7), CXCL2 was the only gene that
was found to be significantly upregulated (2.4 fold) in the mucosa adjacent to a polyp
compared to MNM taken from control subjects (∆∆CT (adjacent to polyp) 24.23 versus ∆∆CT
(controls) 25.52, p=0.013). The level of CXCL2 gene expression in paired samples taken at
distant points in the colon of patients with polyps did not differ from the level recorded in
MNM of control subjects. No differences in gene expression were recorded for FUT2,
S100P and SLC46A1 amongst the polyp patients.

179 | P a g e
Fig 5.2.2. Expression levels of CXCL2, FUT2, S100P and SLC46A1 in control subjects
compared to patients with polyps (samples taken from adjacent MNM around polyps
(labelled polyp), right colonic and left colonic biopsies).
0.03
0.04
0.05
0.06
0.07
control Rightcolon
Polyp Left colon
1/d
CT
Sample site
CXCL2
0.03
0.04
0.05
0.06
0.07
control Rightcolon
Polyp Left colon
1/d
CT
Sample site
FUT2
0.03
0.04
0.05
0.06
0.07
0.08
0.09
0.1
0.11
control Rightcolon
Polyp Left colon
1/d
CT
Sample site
S100P
0.03
0.035
0.04
0.045
0.05
0.055
0.06
0.065
0.07
control Rightcolon
Polyp Left colon
1/d
CT
Sample site
SLC46A1
*
NS
NS
NS

180 | P a g e
5.3.3. There is a gradient in gene expression along the colon comparing caecum to
rectum
However, paired analysis using samples taken at caecum and rectum from patients with
polyps revealed that CXCL2, S100P and SLC46A1 were significantly upregulated adjacent
to the polyp compared to expression levels in the caecum (p<0.001, p<0.001 and p=0.03
respectively) whereas FUT2 was significantly downregulated (p=0.003). No differences in
gene expression were seen if expressions levels adjacent to the polyp were compared to
rectal samples taken from control subjects (p=0.124, p=0.295. p=0.342 and p=0.352
respectively). S100P expression was significantly higher in the adjacent MNM of left sided
polyps compared to right sided polyps (p<0.001) and decreased with increasing number of
polyps (p=0.006). FUT2 expression in the adjacent MNM of polyps correlated with number
of polyps in the colon (p=0.006, r=0.422), size (p=0.034, r=-0.375) and morphology of the
polyps (p=0.035, r=-0.373).
If expression levels of the genes are compared in the caecum and rectum in controls
subjects, there are significant differences along the colon for all four genes (CXCL2
p<0.001, FUT2 p=0.003, S100P p<0.001 and SLC46A1 p=0.01). Due to this gradient in
gene expression, if right sided tumours are compared to caecal samples from control
subjects, all four genes are significantly different in the tumour compared to control subjects,
including SLC46A1 (p=0.006). If left sided tumours are compared to rectal samples from
control subjects, SLC46A1 is no longer upregulated in tumours (p=0.894). Despite this
gradient in gene expression, there are no differences in gene expression of right sided
tumours versus left sided tumours for all genes except FUT2. FUT2 is significantly
upregulated in right sided tumours compared to left sided tumours (p=0.02).

181 | P a g e
5.3.4. Serum CXCL2 levels do not differ between the three groups
Serum CXCL2 concentration was measured in 25 patients with cancer, 20 patients with
polyps and 29 control subjects. There was no difference in serum CXCL2 concentration in
patients with cancer compared to control subjects (mean concentration 401.7 +/- 46.8 pg/mL
versus 376.0 +/- 54.6 pg/mL, p=0.73). Similarly, no statistical difference was noted between
patients with polyps and control subjects (mean concentration 402.5 +/- 70.0 pg/mL versus
376.0 +/- 54.6 pg/mL, p=0.77).

182 | P a g e
5.4 Discussion
This study has identified significant differences in CXCL2 gene expression in the MNM
around a cancer and adenoma highlighting its potential role in field cancerisation in CRC. In
agreement with previous reports, it has also demonstrated differential gene expression of
mucin in tumour tissue.
Based on the qRT-PCR experiments, CXCL2 was significantly upregulated in the adjacent
MNM of both cancer and polyp patients, with slightly lower levels being observed in the
polyp patients. Previous studies have shown that CXCL2 gene expression increases in
colonic tumour tissue and adenomas (Doll et al., 2010; McLean et al., 2011), however, this
is the first study to demonstrate a difference in gene expression in the adjacent MNM of both
pre-neoplastic and neoplastic colorectal lesions suggesting a potential role in field
cancerisation. Inflammatory activity in CRC tumour tissue is a known predictor of prognosis
(Galon et al., 2006) and in vitro studies have shown that colonic tumour cells both secrete
cytokines and possess the receptors required to respond to them directly (Schimanski et al.,
2005; Sturm et al., 2005; Zipin-Roitman et al., 2007; Li et al., 2004). However, the point at
which an inflammatory environment promotes tumour formation is not known. The finding
that CXCL2 gene expression is increased in adenomatous lesions and this is accompanied by
increased numbers of macrophages, neutrophils and T cells in the stroma (McLean et al.,
2011) suggests that inflammatory changes are important early on in carcinogenesis. The
findings of this study, however, suggest that these changes may even predate the formation
of adenomas. CXCL2 has been shown to have both angiogenic and proliferative activity
(Wang et al., 2006a; Bruyère et al., 2011), hence, it is conceivable that changes in its levels
could contribute to the early processes that are necessary for malignant transformation.
However, there have been reports where no differences in gene expression of CXCL2 have
been found when comparing tumour tissue to control tissue (Cuenca et al., 1992; Li et al.,
2004; Wen et al., 2006) leading authors to propose that it may be the balance between pro-

183 | P a g e
angiogenic and anti-angiogenic cytokines that contributes to tumour formation rather than
levels of a single cytokine (Strieter et al., 1999). Nevertheless, this study has demonstrated
that CXCL2 gene expression at a distant site from the tumour could be utilised to identify
patients with cancer. However, these differences in expression were not detected in serum
samples taken from the three groups. This contradicts the findings of a recent study which
demonstrated higher serum CXCL2 concentration in cancer patients compared to control
subjects (Zheng et al., 2015) highlighting the potential role of CXCL2 as a serum biomarker
of CRC. Although this study demonstrated a statistical difference between cancer patients
and control subjects, there was wide variation in the serum CXCL2 concentration,
particularly in the cancer patients. This is similar to the findings of the present study where
wide variation was observed in all three groups. There are many factors that can contribute
to raised serum CXCL2 concentration (Bauer et al., 2006; Tsai et al., 2014) which may
explain the high levels detected in control subjects. Despite the recent report of its potential
role as a serum biomarker, given the wide variation observed across individuals, it would be
difficult to determine an appropriate cut-off for it to be used as a screening or diagnostic test.
In agreement with several previous reports (Blank et al., 1994; Ajioka et al., 1996; Weiss et
al., 1996; Perez et al., 2008; Sylvester et al., 2001; Börger et al., 2007), MUC2 was found to
be downregulated in tumour tissue and MUC5AC was upregulated (Losi et al., 2004; Walsh
et al., 2013; Arai et al., 2007; Park et al., 2006). In vitro studies have shown that loss of
MUC2 results in increased cell proliferation, reduced apoptosis and increased cell migration
(Velcich et al., 2002). Similarly, MUC2 knockout leads to a 65 % increased incidence of
tumours of the small intestine, colon and rectum within 1 year of birth in murine models
(Velcich et al., 2002). This study therefore suggests that MUC2 functions as a tumour
suppressor, hence, inactivation promotes tumour growth. However, several studies have also
shown that MUC2 and MUC5AC are more likely to be expressed in mucinous cancers with
microsatellite instability (MSI) (Bu et al., 2010; Biemer-Hüttmann et al., 2000), BRAF

184 | P a g e
mutation and cancers that are poorly differentiated, proximal or have a high lymphocytic
response (Walsh et al., 2013). Generally it is accepted that MUC2 is usually downregulated
in CRC (Aziz MA et al., 2014) except in a proportion of mucinous cancers where it can be
upregulated (Walsh et al., 2013). In the present study, MUC2 and MUC5AC gene
expression were not related to tumour characteristics such as differentiation grade, mucinous
histology or lymphocytic response. However, MUC2 was only downregulated in left sided
tumours rather than right sided tumours suggesting preserved function with more proximal
tumours as suggested in the literature. In contrast, MUC5AC gene expression was
significantly upregulated in proximal tumours only and there were no differences in gene
expression in left sided tumours compared to control subjects. A recent study which
evaluated MUC2 and MUC5AC expression using immunohistochemistry also showed that
MUC5AC expression was associated with proximal tumours and mismatch repair deficiency
(Imai et al., 2013). This supports the hypothesis that these mucins are more likely to be
expressed in proximal tumours which tend to develop along the MSI pathway rather than the
conventional CIN pathway. As the differences in gene expression of MUC2 and MUC5AC
were only observed at the tumour site and not in the adjacent MNM, these mucins are
unlikely to play a role in field cancerisation. On the other hand, in this study, the mucosa
adjacent to polyps demonstrated higher MUC5AC expression compared to adjacent MNM
around cancers. Previous reports where MUC5AC protein expression has been examined
along the colon have shown that there is variable staining of normal goblet cells in the MNM
in close proximity to the tumour but no staining of these cells at more distant sites from the
tumour (Walsh et al., 2013). This raises the possibility that MUC5AC may be indicative of
an early field defect particularly around pre-neoplastic polyps. However, in an earlier study
which was designed to evaluate the role of MUC5AC in field cancerisation around polyps,
MUC5AC was not detected in any of the samples taken adjacent to polyps which led the
authors to conclude that MUC5AC gene expression does not represent a ‘field change’
around polyps (Longman et al., 2000).

185 | P a g e
Similar to previous reports, this study also demonstrated that S100P is upregulated in
colorectal tumour tissue compared to control tissue (Birkenkamp-Demtroder et al., 2005;
Fuentes et al., 2007; Parkkila et al., 2008; Wang et al., 2012). S100P has been found to be
overexpressed in several other cancers suggesting that it may play a more generic role in
cancer formation by contributing to cell proliferation and migration (Dowen et al., 2005;
Guerreiro Da Silva et al., 2000; Wang et al., 2007; Rehbein et al., 2008). In vitro studies
have shown that S100P induces anchorage independence of tumour cells (Dowen et al.,
2005), increases proliferation (Fuentes et al., 2007), promotes migration, invasion and
decreases chemosensitivity to conventional agents such as 5-fluoruracil (Dong et al., 2014).
Conversely, blocking its action results in reduced cell growth, migration and invasion in
vitro and smaller tumours with fewer liver metastases in vivo. Interestingly, in the present
study S100P gene expression levels in the adjacent MNM around cancer were significantly
lower than that in adjacent MNM around adenomatous lesions. As the majority of the
downstream targets of S100P are cytoskeletal regulators, changes in cell anchorage and
migration in the adjacent MNM may be more important in the field around adenoma
formation compared to a neoplastic lesion as suggested by the findings of the microarray
study described in chapter 4.
In this study, FUT2 was upregulated in tumour tissue, however, no differences were found in
the adjacent MNM around polyp or cancer compared to control subjects. Previous reports
have shown altered gene expression of fucosyltransferases in colorectal cancer compared to
control subjects (Petretti et al., 2000). Aberrant fucosylation can lead to expression of
altered antigens on the cell surface which results in dysregulation of key cellular processes
and altered cell adhesion. Bacteria in the GI tract often utilise host cell surface molecules,
hence, genetic variation in the FUT2 gene has been implicated in susceptibility to several
bacterial infections such as Norovirus (Marionneau et al., 2005; Carlsson et al., 2009) and
Helicobacter Pylori (Ikehara et al., 2001). Loss of the FUT2 gene has also been linked to

186 | P a g e
increased incidence of Crohn’s disease suggesting that it plays a role in the host-microbial
interface (McGovern et al., 2010). Given the link between colonic microflora and CRC, it is
conceivable that disordered fucosylation could contribute to the malignant process.
Furthermore, in the present study, FUT2 gene expression was significantly different in right
sided lesions compared to left sided lesions. This may explain the differences observed in
expression of H antigens along the colon and in neoplastic tissues that have been reported in
a previous study (Fujitani et al., 2000).
There are some limitations to the present study that require consideration. Firstly, there has
been no attempt to subgroup the patients with cancer according to MSI status. Previous
reports on field cancerisation in CRC have shown that the most consistent changes at the
molecular level reported at distant sites along the colon include changes in methylation and
DNA repair (Shen et al., 2005; Worthley et al., 2010; Facista et al., 2012). This suggests that
cancers that develop along the conventional pathway with chromosomal instability are
potentially less likely to harbour a field defect. However, there is no conclusive evidence in
the literature to support this hypothesis. Given that the aim of the study was to identify
potential genes that could contribute to field cancerisation, it was felt that excluding patients
based on MSI status would mean that field cancerisation in conventional CRCs would not be
explored which form the majority of patients.
Secondly, this study has highlighted discrepancies in levels of expression measured using
micro-array technology compared to qRT-PCR demonstrating some of the limitations of
micro-array. The fact that no differences in gene expression were observed for the gene that
was found with the highest fold change on micro-array, PSCA, suggests that validation of
micro-array is necessary. Although there is general agreement amongst researchers that
micro-array data needs validation (Chuaqui et al., 2002; Firestein & Pisetsky, 2002; Benes
187 | P a g e
& Muckenthaler, 2003), few attempts have been made to describe the precise methods and
selection criteria for testing of individual genes (Brazma et al., 2001; Miron et al., 2006).
These protocols are poorly adhered to resulting in considerable variability of reported
outcomes across the literature (Cardoso et al., 2007) leading some authors to propose that
the focus of enquiry should be based on biological pathways rather than individual genes
(Chen et al., 2013b). Others have focussed on selecting genes with the largest effect, either
determined by fold change value or statistical significance (Chuaqui et al., 2002; Irizarry et
al., 2005; Larkin et al., 2005). However, this may not be the most optimal approach as
highlighted in a study which demonstrated that a random stratified sampling approach is
more effective at identifying genes for validation with qRT-PCR (Miron et al., 2006).
Furthermore, wide ranging correlations between microarray and qRT-PCR data have been
described in the literature (Beckman et al., 2004; Etienne et al., 2004; Larkin et al., 2005;
Dallas et al., 2005), particularly with genes that are expressed at low levels in the tissue
being examined (Czechowski et al., 2004). Other reasons for poor correlation include very
high expression levels, at the limits of detection (Etienne et al., 2004) or alternative
transcripts of the gene being detected by the two methods (Dallas et al., 2005). Despite these
shortcomings, the present study was successful at identifying CXCL2 as a biomarker
indicative of field cancerisation in colorectal cancer. As there have been no previous reports
linking CXCL2 to field cancerisation, these findings highlight the importance of adopting a
candidate free approach to evaluate global gene expression profiles in an exploratory study
of this kind.
5.5. Summary and conclusions
CXCL2 is upregulated in the adjacent MNM around both CRC and adenomas
compared to MNM in control subjects therefore it could be an indicative marker of
field defect

188 | P a g e
MUC2 is downregulated and MUC5AC is upregulated in the tumour tissue
compared to MNM in control subjects
There are no differences in expression of MUC2 or MUC5AC in the adjacent MNM
or resection margin of colectomy specimens compared to MNM from control
subjects
The findings highlight the importance of the inflammatory micro-environment in
supporting cell growth, invasion and metastasis, possibly at an earlier stage than
previously reported.

189 | P a g e
Chapter 6: The role of
fibroblast growth factors
in field cancerisation in
colorectal cancer

190 | P a g e
6.1. Introduction, aims and objectives
6.1. Introduction
There is emerging evidence to support the concept that the tumour microenvironment plays a
fundamental role in supporting tumour growth facilitating both invasion and metastasis
(O'Toole et al., 2014; Chen et al., 2015). Previous reports have demonstrated that there are
alterations in cell proliferation and apoptosis in the macroscopically normal colonic field
around colorectal cancer supporting the field cancerisation concept (Anti et al., 2001;
Badvie et al., 2006; Hanna-Morris et al., 2009). However, few have investigated how the
stromal compartment changes in the macroscopically normal mucosa (MNM) around
colorectal cancer (CRC) and adenomas (Despotović et al., 2014). The microarray study
described in chapter 4 (page 144) identified fibroblast growth factor 7 (FGF7) as being
dysregulated in the MNM adjacent to polyps compared to MNM taken from control
subjects. FGF7 is also known as keratinocyte growth factor and is a mitogen that is produced
by cells of mesenchymal origin (Finch et al., 1989; Rubin et al., 1989). It acts upon a
particular subtype of fibroblast growth factor receptor (FGFR) called FGFR2b which is
usually expressed by epithelial cells (Miki et al., 1991). There are 20 alternative splicing
variants of FGFR2 that have been identified (Katoh, 2008). The major splicing event occurs
in the carboxyl terminal half of the third Ig-like domain (D3) which results in two variants of
receptor (Eswarakumar et al., 2005) –
i) FGFR2IIIb which binds FGF 1, 3,7,10 and 22
ii) FGFR2IIIc which binds FGF 1,2,4,6,9,17,18.
The distribution of FGF7 and its receptor supports the proposal that it acts as a paracrine
signal and plays a role in epithelial-mesenchymal transition (EMT) (Finch & Rubin, 2004).
The downstream signalling pathways that are activated upon FGF7 binding to its receptor
involve mitogen-activated protein kinases (MAPK) including ERK-1 and ERK-2 (Katoh &
Nakagama, 2014).

191 | P a g e
FGF7 plays a role in epithelial repair in response to a toxic insult (Chen et al., 2004a; Farrell
et al., 1998; Ulich et al., 1997; Yi et al., 1998) by stimulating cell proliferation, migration,
differentiation, DNA repair and induction of enzymes that are involved in eradication of
reactive oxygen species (Finch & Rubin, 2004). FGF7 has been shown to be a mitogen that
increases epithelial cell proliferation in many different organs and therefore may augment
tumour cell growth (Housley et al., 1994; Nguyen et al., 1996; Ulich et al., 1994). It may
also protect malignant cells from the toxic effects of chemotherapy by enhancing cell
proliferation and increasing cell survival thus contribute to drug resistance.
In CRC, conflicting results have been observed amongst studies measuring expression levels
of FGF7 and FGFR2 with some investigators proposing that expression is higher in CRC
(Watanabe et al., 2000) and others finding it to be no different (Otte et al., 2000). Some
investigators have shown that expression of FGFR2IIIb confers a well differentiated
phenotype of CRC (Yoshino et al., 2005; Otte et al., 2000). Stronger FGFR2 expression was
detected in the invasive front of CRC cells compared to the surface or central area of
cancerous cells (Matsuda et al., 2011). If FGFR2 expression was blocked in CRC cell lines,
there was a reduction in cell migration, invasion and tumour growth highlighting the
potential role of FGF7 in augmenting CRC growth.
Several other fibroblast growth factors (FGFs) have also been implicated in CRC (Brooks et
al., 2012), most notably, fibroblast growth factor 1 (FGF1) (Dirix et al., 1996; Wang et al.,
2010). All four fibroblast growth factor receptors have been linked to cancer formation (Sato
et al., 2009; Jayson et al., 1999; Spinola et al., 2005; Jang et al., 2001). However, recent
reports have proposed that fibroblast growth factor 19 (FGF19) may also play a role in CRC
formation through interaction with the Wnt signalling cascade (Pai et al., 2008; Desnoyers et
al., 2008; Katoh, 2006; Liu et al., 2013b). FGF19 belongs to the endocrine family of
fibroblast growth factors (Kurosu & Kuro-O, 2009) and regulates bile acid (Holt et al.,

192 | P a g e
2003), glucose (Kir et al., 2011; Potthoff et al., 2011), lipid (Tomlinson et al., 2002) and
carbohydrate metabolism (Potthoff et al., 2012). FGF15/19 interacts with FGFR complexed
with a membrane bound protein called β-klotho (Goetz et al., 2007; Lin et al., 2007;
Tomiyama et al., 2010). If β-klotho is present, FGF19 can activate FGFR1c-3c and FGFR4
(Kurosu et al., 2007), however, most of its biological activities are mediated through FGFR4
as FGFR4 knockout mice show altered bile acid metabolism (Yu et al., 2000). Although
FGFR4 plays a role in hepatocyte proliferation and suppression of bile acid synthesis,
FGF19 is able to exert its effects on glucose and lipid metabolism independent of FGFR4
(Wu et al., 2011) suggesting that there are multiple pathways through which FGF19 can act
independent of the FGFR4 receptor. Several possible roles of FGF19 in driving CRC
formation have been proposed in the literature (Nicholes et al., 2002; Sawey et al., 2011;
Huang et al., 2009b). Several previous proteomic studies have identified FGFR4 as a
potential predictive serum biomarker of CRC (Babel et al., 2009; Barderas et al., 2012).
More recently it has emerged that FGFR4 activity drives epithelial-mesenchymal transition
in CRC (Peláez-García et al., 2013; Liu et al., 2013b). However, its role in field
cancerisation in CRC has previously not been investigated.
6.1.2 Aims and objectives
The aims of the study were as follows -
i) To determine if gene expression levels of FGF7/FGF19 and its receptors
FGFR2/FGFR4 differ between MNM adjacent to tumour, MNM adjacent to
polyps and MNM taken from control subjects.
ii) To ascertain if these changes in gene expression translate into discernible
differences in serum concentration
iii) To investigate which downstream pathways are affected by dysregulation of
FGF signalling

193 | P a g e
6.2 Materials and Methods
6.2.1. Setting and participants
This study was approved by the Coventry and Warwick Local Research Ethics Committee
(ref MREC ref no 09/H1211/38) and University Hospital Coventry & Warwickshire
Research & Development division. Informed consent was gained from all participants.
Mucosal tissue samples, serum, whole blood and plasma were collected from 117
participants as outlined in section 2.2. There were 37 CRC patients, 23 patients with
adenomas and 57 control subjects. The clinical and pathological details of these patients are
given in table 6.1.
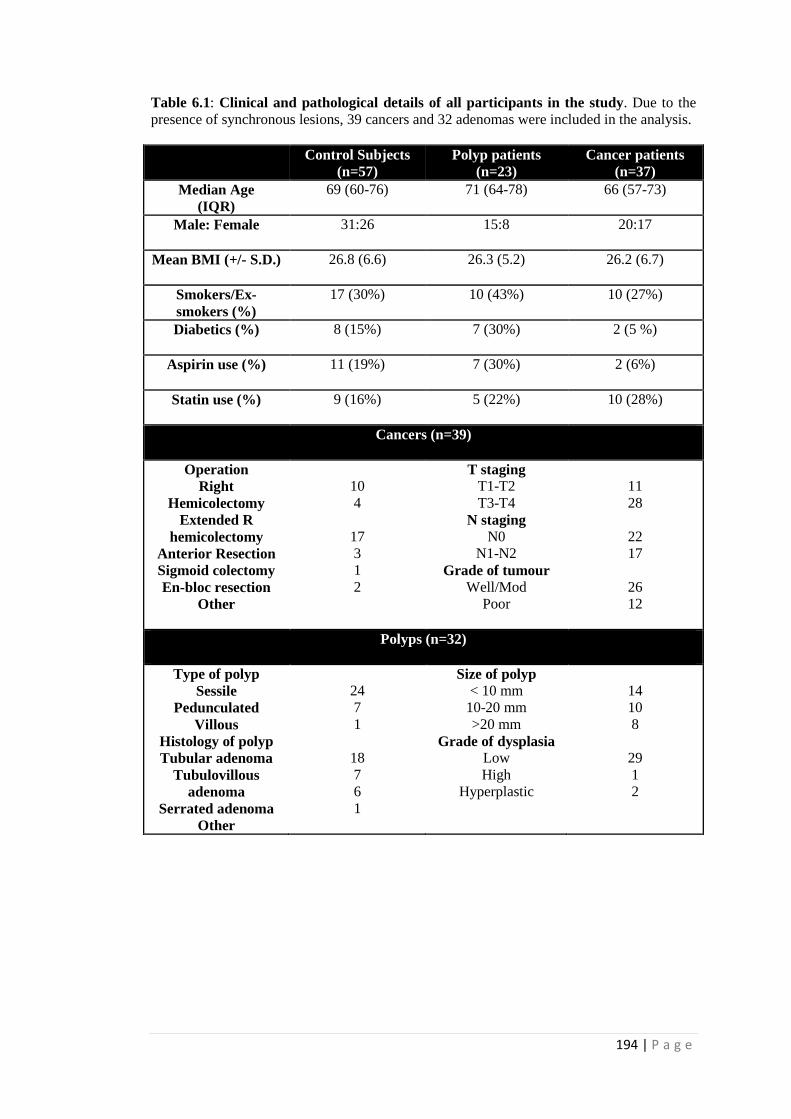
194 | P a g e
Table 6.1: Clinical and pathological details of all participants in the study. Due to the
presence of synchronous lesions, 39 cancers and 32 adenomas were included in the analysis.
Control Subjects
(n=57)
Polyp patients
(n=23)
Cancer patients
(n=37)
Median Age
(IQR)
69 (60-76) 71 (64-78) 66 (57-73)
Male: Female 31:26 15:8 20:17
Mean BMI (+/- S.D.) 26.8 (6.6) 26.3 (5.2) 26.2 (6.7)
Smokers/Ex-
smokers (%)
17 (30%) 10 (43%) 10 (27%)
Diabetics (%) 8 (15%) 7 (30%) 2 (5 %)
Aspirin use (%) 11 (19%) 7 (30%) 2 (6%)
Statin use (%) 9 (16%) 5 (22%) 10 (28%)
Cancers (n=39)
Operation
Right
Hemicolectomy
Extended R
hemicolectomy
Anterior Resection
Sigmoid colectomy
En-bloc resection
Other
10
4
17
3
1
2
T staging
T1-T2
T3-T4
N staging
N0
N1-N2
Grade of tumour
Well/Mod
Poor
11
28
22
17
26
12
Polyps (n=32)
Type of polyp
Sessile
Pedunculated
Villous
Histology of polyp
Tubular adenoma
Tubulovillous
adenoma
Serrated adenoma
Other
24
7
1
18
7
6
1
Size of polyp
< 10 mm
10-20 mm
>20 mm
Grade of dysplasia
Low
High
Hyperplastic
14
10
8
29
1
2

195 | P a g e
6.2.2. Experimental methods
Three different types of analysis were performed. Serum concentrations of proteins were
measured using standard ELISA kits (see chapter 2) in 77 participants for FGF19 and 36
participants for FGF7. As FGF19 is an endocrine FGF and is secreted into the bloodstream,
the aim of the study was to determine how it differs in CRC and whether it could be used to
identify patients with CRC. In comparison, FGF7 is not an endocrine FGF, thus, the aim of
the study was to ascertain if there were sufficient protein levels in the bloodstream for it to
be detected. If the results from this initial investigation were positive, then, further samples
would be analysed to determine if it could also be utilised as a diagnostic biomarker.
In a subset of patients, quantitative real time polymerase chain reaction (qRT-PCR) was
used to measure changes in gene expression of FGF7/FGF19 and its receptors,
FGFR2/FGFR4 respectively.
The first downstream target along the FGF7 signalling cascade is fibroblast receptor
substrate 2α (FRS2α) which is phosphorylated upon binding of FGF7 to its receptor FGFR2.
The other downstream targets of FRS2α involve Erk 1/2 and Akt, both of which are
phosphorylated upon activation (Eswarakumar et al., 2005). The protein expression levels of
FRS2α, phospho-FRS2α, Erk 1/2, phospho-Erk 1/2, Akt and phospho-Akt were measured
using Western blot analysis. Please see chapter 2 for detailed information regarding the
methodology used.
In total, 199 samples were analysed from 17 patients with CRC, 23 patients with polyps and
34 control subjects. The control subjects were age and sex matched to the CRC patients with
a 2:1 ratio. mRNA and protein expression were evaluated in the tumour tissue, MNM
adjacent to tumour and MNM at the resection margin. In patients with adenomas, caecal and
rectal samples were compared to MNM adjacent to the adenoma. There were no samples of
the actual adenoma available for analysis as they were utilised for routine histological

196 | P a g e
analysis to exclude a malignant component. Hence, the results that are presented under the
term ‘adenoma’ actually represent the expression levels detected in the MNM adjacent to the
adenoma and not the adenoma itself. Right sided cancers or polyps were matched with
caecal samples taken from control subjects and left sided lesions were matched with rectal
samples from control subjects.
6.2.3. Statistical analysis
All qRT-PCR data was log10 transformed prior to statistical analysis with SPSS version 21.0.
Mean expression levels between control subjects and cancer/polyp patients were compared
using the unpaired t test. The paired t test was utilised to determine differences in gene or
protein expression between samples taken at different sites from cancer patients.
Multivariate linear regression was used to ascertain how different variables relate to serum
FGF19 concentration. Statistical significance was based on p<0.05.

197 | P a g e
6.3. Results
6.3.1. FGF7 is upregulated in the colonic field
FGF7 was significantly upregulated in the tumour tissue itself (∆∆CT 21.4), its adjacent
MNM (∆∆CT 20.9) and the resection margin (∆∆CT 21.1) in patients with cancer compared
with control subjects (∆∆CT 22.6) (see figure 6.3.1). In comparison, there was significant
down regulation of its receptor, FGFR2 in the tumour tissue itself (∆∆CT 21.2 in tumour
versus 19.4 in controls, p <0.001). However, FGFR2 gene expression in the adjacent MNM
(∆∆CT 19.6) and resection margin (∆∆CT 19.4) of CRC patients was no different from that
found in control subjects.
With paired analysis of samples taken from CRC patients, FGF7 and FGFR2 were both
downregulated in the tumour tissue compared to the resection margin (p=0.036 for FGF7
and p=0.013 for FGFR2).
FGF7 FGFR2
Figure 6.1: Mean gene expression level of FGF7 and FGFR2 in caecal or rectal samples
taken from control subjects compared to samples taken from tumour tissue, adjacent MNM
and resection margin of colectomy specimen from CRC patients. Statistical analysis using
unpaired t test - P value < 0.05=*, <0.01= ** and <0.001= *** and NS=non-significant.
0.04
0.042
0.044
0.046
0.048
0.05
0.052
0.054
0.056
control tumour adjacent margin
1/D
CT (
MEAN
EXPRESSIO
N
LEVEL)
*
0.04
0.042
0.044
0.046
0.048
0.05
0.052
0.054
0.056
control tumour adjacent margin
1/D
CT (
MEAN
EXPRESSIO
N
LEVEL)
******
*** NS
NS

198 | P a g e
6.3.2. The FGF7-FGFR2 signalling axis is dysregulated in tumour tissue
FGF7 gene expression was negatively correlated with FGFR2 gene expression in samples
taken from control subjects. However, this relationship was lost in tumour tissue and no
correlation was detected between expression levels of the genes.
Control samples Tumour samples
Figure 6.2: FGF7 and FGFR2 correlation. Mean gene expression level of FGF7 and
FGFR2 plotted against each other for control samples (n=71) and tumour samples (n=19).
Pearson correlation coefficient and p value are displayed.
0.04
0.042
0.044
0.046
0.048
0.05
0.052
0.054
0.056
0.058
0.06
0.035 0.04 0.045 0.05 0.055
1/d
CT
FGFR
2
1/dCT FGF7
0.04
0.042
0.044
0.046
0.048
0.05
0.052
0.054
0.056
0.058
0.06
0.035 0.045 0.055 0.065
1/d
CT
FGFR
2
1/dCT FGF7
Pearson rho- -0.429,
p<0.001
Pearson rho- -0.210,
p=0.388

199 | P a g e
6.3.3. FGF7 and FGFR2 gene expression are no different in patients with polyps
FGF7 gene expression in the right colon was no different to the left colon, both in control
subjects and in patients with polyps. However, there was a significant difference in FGFR2
gene expression between right and left colon (∆∆CT 16.2 in right colon versus ∆∆CT 17.4 in
left colon, p=0.009).
There was no difference in gene expression of FGF7 adjacent to the polyp (∆∆CT 21.0)
compared to gene expression from samples taken from control subjects (∆∆CT 21.4)
(p=0.386) (see figure 6.3.). Similarly, there was no difference in FGFR2 gene expression
between the two groups (p=0.216).
Figure 6.3: FGF7 and FGFR2 gene expression in patients with polyps. Mean gene
expression level of FGF7 and FGFR2 in biopsies taken proximal, adjacent and distal to
polyp compared to matched samples taken from control subjects. Statistical analysis using
unpaired t test - P value < 0.05=*, <0.01= ** and <0.001= *** and NS=non-significant.
0.042
0.044
0.046
0.048
0.05
0.052
0.054
0.056
control proximalto polyp
polyp distal topolyp
NS
0.052
0.054
0.056
0.058
0.06
0.062
0.064
control proximalto polyp
polyp distal topolyp
NS
NS
NS
*
NS
FGF7 FGFR2

200 | P a g e
6.3.4. The FGF7-FGFR2 signalling axis is dampened in CRC tissue
Protein expression of both FRS2 and phospho-FRS2 was reduced in the tumour tissue
compared to the mucosa at the margin suggesting that the FGF7 signalling cascade was
dampened in the tumour tissue itself. This was accompanied by a reduction in Akt signalling
but no changes were observed in Erk 1/2 protein expression.
There was no significant difference in protein expression between the adjacent mucosa and
the resection margin.
Figure 6.4: Protein expression of FRS2α and pFRS2α measured using Western blot
analysis (n=6). Paired t test used to determine statistical difference between expression at
tumour site and adjacent to tumour compared to expression at resection margin. The ratio of
pFRS2/FRS2 comparing tumour and resection margin is displayed.
0
0.2
0.4
0.6
0.8
1
1.2
1.4
1.6
tumour adjacent margin
AU
pFRS2 FRS2
P=0.0048**
FRS2α
pFRS2α
Beta-actin

201 | P a g e
Figure 6.5: Protein expression of phospho-Erk (pErk), Erk, phospho-Akt (pAkt) and
Akt measured using Western blot analysis (n=6). Paired t test used to determine statistical
difference between expression at tumour site and adjacent to tumour compared to expression
at resection margin. The ratio of the phosphorylated form to unphosphorylated form was
used in the analysis. The p value comparing expression at the tumour site compared to the
resection margin is shown.
6.3.5. FGF7 serum concentration does not differ between cancer and control
No significant differences in FGF7 serum concentration were found between patients with
CRC compared to control subjects (mean concentration 33.16 (+/- 5.67) pg/mL versus 33.81
(+/- 5.43) pg/mL respectively, p= 0.72).
0
0.2
0.4
0.6
0.8
1
1.2
1.4
tumour adjacent margin
AU
pAkt Akt
0
0.2
0.4
0.6
0.8
1
1.2
1.4
tumour adjacent margin
AU
pErk 1/2 Erk 1/2
pErk
Erk
Beta-actin
pAkt
Akt
Beta-actin
P=0.017*
P=0.017* P=0.170

202 | P a g e
6.3.6. FGF19 is expressed at low levels in colonic tissue
Based on the results obtained with qRT-PCR, FGF19 was only expressed in 9/17 tumours at
a very low level (CT 30-38 cycles). Analysis of samples taken from control subjects did not
give reliable values for expression level across triplicates. Therefore, tissue samples taken
from control subjects were not analysed further for FGF19 gene expression due to limited
biopsy material available. However, FGFR4 was detected across all samples that were
examined. There were no differences in gene expression of FGFR4 in cancer tissue itself
(∆∆CT 20.3), its adjacent MNM (∆∆CT 20.6) and the tissue at the resection margin (∆∆CT 20.5)
compared to the expression levels in healthy colonic mucosa (∆∆CT 20.8) (p=0.175 for cancer
versus control). When patients with cancer were divided into two groups based on those
whose tumours expressed FGF19 (denoted FGF19 positive) and those that did not (denoted
FGF19 negative), there was no significant difference in expression of the receptor, FGFR4
(p=0.222).
6.3.7. FGF19 serum levels are lower in CRC patients with right sided tumours
Amongst the 77 patients whose serum FGF19 concentration was measured, there was no
significant difference between cancer patients and healthy controls (mean concentration
171.67 +/- 121.21 pg/mL versus 202.28+/- 113.46 pg/mL respectively, p=0.256). The only
clinical parameter with which there was an association with serum FGF19 concentration was
smoking (see table 6.3.7). There were 14 patients with right sided tumours and 25 patients
with left sided tumours. The mean serum FGF19 concentration was significantly lower in
patients with right sided tumours compared to left sided tumours (124.64+/-62.25 pg/mL
versus 198.0+/-138.38 pg/mL respectively, p=0.029).
There was no correlation between serum FGF19 concentration and gene expression of
FGFR4 in the colonic tissue (Pearson’s correlation coefficient, r=0.053, p=0.841). However,

203 | P a g e
if the patients with synchronous cancers are excluded as they appear to have one tumour
which expresses FGF19 and another that does not, serum FGF19 levels are lower in patients
whose tumours express FGF19 compared to those whose tumours do not (p=0.041).
Table 6.2: Serum FGF19 concentration and correlation with clinical factors.
Relationship between clinical variables and serum FGF19 concentration determined using
Pearson correlation in patients with cancer (n=37) and control subjects (n=57)
Clinical variable Pearson’s correlation
coefficient
p value
Age -0.172 0.134
Sex -0.034 0.767
BMI 0.040 0.730
Smoker 0.304 0.007*
Fasting sample -0.155 0.178
T stage -0.214 0.191
N stage -0.262 0.107
Grade of tumour -0.068 0.683

204 | P a g e
6.4. Discussion
Using a novel sampling strategy, this study has shown that FGF7 is significantly upregulated
along the colon in patients with CRC and could potentially act as a biomarker of field
cancerisation. This is accompanied by disruption of the FGF7-FGFR2 signalling axis in the
tumour tissue itself with reduced protein expression of some of its downstream targets. This
suggests that loss of FGF7 activity may contribute to malignant transformation of the
colonic mucosa. However, contrary to previous reports, there were no differences in gene
expression of FGF19 or its receptor, FGFR4.
FGF7 signalling was found to be disrupted in CRC patients with uncoupling of the negative
reciprocal relationship seen between a ligand and its receptor. Under normal physiological
conditions, when FGFRs are activated they undergo endocytosis which reduces the number
of receptors found in the membrane. This negative feedback loop is important in regulation
of FGFR activity and has recently emerged as a potential source of disruption in growth
factor activity and may contribute to cancer (Haugsten et al., 2005; Mosesson et al., 2008;
Haglund et al., 2007; Abella & Park, 2009). The authors of a recent study found that Src and
its phosphorylation target, Eps8 facilitate clathrin mediated endocytosis of FGFRs (Auciello
et al., 2013). FGFs increased the number of clathrin coated pits and events of clathrin
mediated endocytosis suggesting that an increase in FGF7 expression would be expected to
lead to downregulation of its receptor. Depletion of Eps8 inhibited FGFR trafficking with
FGFR being retained in peripheral early endosomes and led to a reduction in burst of Erk 1/2
activation suggesting that Eps8 is important for both FGFR trafficking and signalling. The
uncoupling of FGF7 and FGFR2 gene expression found in this study could be explained by
alterations in FGFR trafficking.

205 | P a g e
Previous studies have shown that FGF7 plays a role in the epithelial response to toxic injury.
IL-7 is produced by intraepithelial lymphocytes in response to a toxic insult which acts upon
the stromal cells to induce FGF7 release which drives epithelial cell proliferation. FGF7
treatment of intestinal cells led to increased expression of epithelial cell derived IL-7 in vitro
and in a mouse model (Cai et al., 2012). In a subsequent study, they showed that FGF7 also
increased Lovo cell proliferation and increased intestinal wet weight, villus height, crypt
depth and crypt cell proliferation in mice. With blockade of two further downstream targets
of FGF7, IRF-1 and IRF-2 there was a reciprocal reduction in IL-7 expression suggesting a
feedback loop where IL-7 induces epithelial cell growth through FGF7 (Cai et al., 2013).
The reduction in protein expression of the downstream targets of FGF7 that was observed in
this study could be explained by postulating that FGF7 protects against toxic injury and
regulates cell differentiation. Loss of the FGF7 signal would thus disable the epithelium
from responding appropriately to toxic/ inflammatory injury and could contribute to
uncontrolled growth and tumour formation. A previous study found higher FGFR2
expression in well differentiated tumours and those with shallow wall invasion (Yoshino et
al., 2005) compared to poorly differentiated tumours suggesting that the FGFR2 signal is
lost during malignant transformation into a more aggressive phenotype. Loss of FGFR2b
expression has also been found in other tumours including cancer of the prostate, bladder
and salivary gland (Diez de Medina et al., 1997; Naimi et al., 2002; Amann et al., 2010;
Zhang et al., 2001). Mutations where there is inactivation of the FGF7-FGFR2 axis have
also been reported in melanomas (Gartside et al., 2009). Thus, it is plausible that in certain
tumours, FGF7 protects against malignant transformation by contributing to cell
differentiation and a less aggressive phenotype.

206 | P a g e
In a further study, FGF7 was found to be a strong mitogen only for normal epithelial cells
and not tumour cells (Otte et al., 2000). Similarly, another study reported that recombinant
FGF7 was only able to stimulate growth of primary, immortalised keratinocytes and not
malignant head and neck squamous cancer cells (Hille et al., 2010). A neutralising antibody
against FGF7 only abolished cell proliferation of the keratinocytes and again, had no effect
on the malignant cells. FGFR2b was only expressed in the keratinocytes and not the
malignant cells. Thus, they postulated that FGF7 acts in a paracrine manner in normal cells,
however, it is unable to stimulate cell growth in malignant cells. Similar findings were
observed in the present study whereby there was loss of FGFR2 expression in the tumour
cells despite high expression of FGF7. This was accompanied by a reduction in Akt protein
expression and not Erk 1/2 expression. In a study using pancreatic duct cells, FGF7
stimulated proliferation through MEK-Erk 1/2 pathway and cell differentiation through the
Akt pathway (Uzan et al., 2009). Similarly, the Akt activity has been shown to be important
in driving cell differentiation in embryonal carcinoma cells (Chen et al., 2013a). Hence, loss
of Akt expression found in the tumour tissue in the present study could suggest that the
ability of FGF7 to regulate cell differentiation via Akt has been lost whilst its ability to
stimulate cell proliferation via Erk may have been retained. This may seem to contradict
previous reports which have associated Akt activation with more aggressive forms of cancer
(Agarwal et al., 2013) highlighting that Akt actually supports cell proliferation and tumour
growth. This dual role of Akt can be explained by different effects depending upon the
subcellular location of PI3K, its upstream activator. In sub confluent proliferating cells, the
p85 regulatory subunit of PI3K was distributed in the cytoplasm whereas in confluent cells,
it was found at cell-cell interfaces (Laprise et al., 2002). E-cadherin mediated cell-cell
contact led to increased Akt activity and suppressed Erk activity. If PI3K was blocked, AKT
activity was abolished and a sustained activation of Erk was observed in confluent
differentiating cells but not in undifferentiated proliferating cells (Laprise et al., 2004). The
authors proposed that PI3K-Akt activity supports proliferation in sub confluent dividing
cells and once confluence is reached, it drives cell differentiation. Thus, PI3K-Akt plays an

207 | P a g e
important role in mediating the transition between proliferation and differentiation. It is
therefore plausible that loss of its activity could render the cell in a permanent state of
proliferation and prevent its ability to undergo differentiation contributing to malignant
transformation.
There have been reports of increased expression of FGFR2 in CRC that contradicts our
findings. In one study, stronger FGFR2 expression was observed in the invasive front of
CRC cells compared to the surface/central area of cancerous cells (Matsuda et al., 2011).
Reduced expression of FGFR2 in CRC cells was met by a reduction in cell migration,
invasion and tumour growth in vitro and in vivo. FGFR2 may also play a role in tumour
angiogenesis by increasing VEGF-A production (Narita et al., 2009). Thus, it remains
unclear whether FGF7 acts to regulate angiogenesis and in so doing augment tumour growth
or restore regulated cell growth following inflammatory injury.
Under normal physiological conditions, FGF7 has also been implicated in epithelial-
mesenchymal transition therefore defective cell signalling through this pathway could lead
to altered cell-cell adhesion (Kudo et al., 2007). Using a FGF7 transfected CRC cell line, the
authors demonstrated a higher degree of adhesion to ECMs (type IV collagen, fibronectin),
enhanced ERK1/2 phosphorylation and increased focal adhesion kinase (FAK) expression.
Therefore, FGFR2 could play a role in preventing malignant seeding by enabling CRC cells
to adhere to underlying collagen. This may explain its association with less aggressive, well
differentiated tumours that has previously been observed. However, in this study, there was
no correlation between the histological differentiation grade of the tumour and FGF7 gene
expression thus suggesting that the role of FGFR2 in preventing metastasis may be less
likely.

208 | P a g e
Previous reports have demonstrated that FGF19 is overexpressed in human colon cancer
tissue and in colon cancer cell lines (Desnoyers et al., 2008). When FGF19 activity is
blocked with a neutralising antibody, the mouse tumour xenografts created using these cells
are significantly smaller than those using wild type cells suggesting that FGF19 augments
tumour growth. However, FGF19 was only expressed in 6/10 tumours tested suggesting that
in some tumours, it did not drive carcinogenesis. This is similar to the present study which
found that FGF19 was expressed in 9/17 tumours. As normal colonic tissue samples did not
express FGF19, detection of FGF19 in the tumour tissue itself suggests that it was
upregulated and therefore may contribute to malignant transformation. Similarly, no
differences in FGFR4 gene expression in the tumour, adjacent MNM or resection margin
were detected. This contradicts previous reports which have observed that FGFR4 is
upregulated in CRC (Heinzle et al., 2012) and many other cancers including breast (Jaakkola
et al., 1993), prostate (Sahadevan et al., 2007), gastric, rhabdomyosarcoma (Taylor et al.,
2009) and pituitary adenocarcinoma (Ezzat et al., 2002). However, FGFR4 was only
upregulated in 20/71 cancers tested in the former study suggesting that in many of the
colorectal tumours examined or investigated, FGFR4 was not upregulated. Similarly, in this
study, FGFR4 was also only upregulated in a proportion of the tumours examined
suggesting that it may not be a very good candidate for a clinical biomarker. This was
further confirmed with no differences being detected in serum FGF19 between cancer
patients and control subjects. Therefore, based on the findings of the present study, FGF19
does not appear to be a candidate for a clinical CRC biomarker.
There are some limitations to this study that require further consideration. The specific
isoform of the FGFR2 receptor with which FGF7 interacts was not measured in the qRT-
PCR experiments. Recent evidence has emerged to support the concept that there may be a
class switch from FGFR2IIIb isoform to FGFR2IIIc isoform in CRC which confers a more
malignant phenotype and contributes to the neoplastic process (Matsuda et al., 2012). This

209 | P a g e
highlights that it may not be the total expression level of the FGFR2 gene that is important
but the relative expression levels of its different isoforms. Despite this limitation, however,
there were significant differences observed in gene expression of FGFR2 supporting its role
in CRC.
6.5. Summary and conclusions
Using a novel sampling strategy in a well characterised cohort of patients, FGF7
was found to be upregulated throughout the resection specimen in cancer patients
compared to healthy controls.
Dysregulation of the FGF7/FGFR2 signalling cascade was only observed in tumour
tissue and not in the adjacent MNM suggesting that either decreased FGF7 activity
contributes to malignant growth or the transformed cells found in tumours contain
mutations that inactivate this pathway.
Reduced Akt signalling downstream of FGF7 suggests loss of cell differentiation
with preserved Erk signalling which is usually responsible for cell proliferation
FGF7 could play a role in field cancerisation and help to elucidate in whom risk of
neoplasia is greatest.
Pharmacotherapy aimed at restoring the FGF7 signal could be utilised in cancer
patients to restore regulation of cell differentiation and antagonise malignant growth.

210 | P a g e
Section 7: Discussion

211 | P a g e
7.1. Introduction
Colorectal cancer (CRC) remains a source of considerable health burden for most
communities worldwide. Despite substantial advances in our understanding of the molecular
biology that underpins CRC formation, patients are still diagnosed at a late stage with wide
heterogeneity in response to available chemotherapeutic agents (Ferlay et al., 2013;
Coleman et al., 2011). The field cancerisation concept (SLAUGHTER et al., 1953) offers an
alternative approach to solving some of the clinical challenges that remain in the modern
treatment of CRC. Improvements in our knowledge about the changes that occur in the
colonic field prior to development of histological abnormalities may aid earlier diagnosis of
CRC and could pave the way to unravelling some of the complexities that underlie this
disease. Better risk stratification of both screened and symptomatic patients can help to
develop more accurate screening and diagnostic tests. Assessment of risk in this manner may
also aid design of surveillance schedules for those already deemed at high risk, that is, those
with a genetic predisposition or CRC survivors. Furthermore, changes in the colonic field
could serve as a surrogate endpoint for chemoprevention trials where CRC risk is modulated
by various pharmacological interventions. With such wide application, it is important that
the field cancerisation concept in CRC is investigated further.
7.2. Field cancerisation in CRC – parallels between IBD and sporadic CRC
Field effects have readily been accepted in CRC associated with inflammatory bowel disease
(IBD-CRC) (Leedham et al., 2009; Risques et al., 2011; Katsurano et al., 2012), the reason
being that inflammation is believed to be the primary cause for the increased predisposition
to malignant transformation. In IBD-CRC, the presence of DALMs (dysplasia associated
lesion or mass) has been associated with malignant risk supporting this hypothesis
(Bernstein et al., 1994; Thomas et al., 2007). Studies using animal models corroborate this
observation by demonstrating molecular changes in the mucosa at distant sites to tumour
formation (Katsurano et al., 2012). In humans, mutations in KRAS, CDKN2A (p16) and

212 | P a g e
TP53 were observed in non-tumour, non-dysplastic and dysplastic epithelium of patients
with Crohn’s disease (Galandiuk et al., 2012). However, field cancerisation in sporadic CRC
is generally not as well accepted. The difference highlighted by investigators is that sporadic
CRCs occur in otherwise biologically normal colon. As there is no histological abnormality
in the mucosa, the assumption is made that this mucosa is ‘healthy’ and not biologically
altered. However, in a similar manner to IBD, pre-neoplastic lesions such as aberrant crypt
foci and adenomas are detected at multiple sites along the colon in patients who go onto
develop CRC (Morson, 1974; Bird, 1987). The findings presented in the first chapter of this
thesis demonstrated that there is a higher risk of developing metachronous lesions in the
residual bowel after cancer surgery if synchronous adenomas are present at time of
presentation. This implies that the colonic mucosa at sites distant to the tumour is also
preconditioned to tumour formation and this predilection does not disappear after the
primary tumour is removed. This has two implications; firstly, it supports the concept of
field cancerisation in CRC and secondly, it suggests that field changes in the colonic mucosa
are not a consequence of the presence of tumour itself and persist after curative resection
implying that they predate tumour development. Earlier antagonists of field cancerisation
had proposed that it was the presence of tumour which was inducing biological changes in
the surrounding mucosa (Kuniyasu et al., 2000). This contention is not supported by the
findings in the present study. It also suggests that a proportion of CRC patients may not
exhibit a field defect along their colon or that polyps are poor markers of field cancerisation
and different molecular changes should be sought.
7.3. Existing scientific evidence to support field cancerisation in CRC
There have been several reports that have demonstrated cellular, genetic and epigenetic
differences in the normal colonic mucosa at distant sites to the tumour supporting the field
cancerisation concept in CRC. Earlier studies that were conducted provided evidence that
the colonic field distant to the tumour exhibited differences in cell structure with altered

213 | P a g e
karyometry (Bibbo et al., 1990; Verhest et al., 1990; Alberts et al., 2007; Cherkezyan et al.,
2014), changes in crypt morphology (Dawson & Filipe, 1976; Riddell & Levin, 1977) and
altered cell kinetics (Terpstra et al., 1987; Anti et al., 2001; Badvie et al., 2006; Hanna-
Morris et al., 2009). Subsequent studies have sought to clarify how the genetic and protein
milieu of the cells in the colonic field around cancer differ from those found at distant sites
(Chen et al., 2004b; Hao et al., 2005; Polley et al., 2006). Most of the genetic alterations
proposed have been in DNA repair and methylation (Facista et al., 2012; Nguyen et al.,
2010; Shen et al., 2005; Ramírez et al., 2008). A recent study measured transcript expression
and chromosomal changes along the colon (Hawthorn et al., 2014). The authors showed that
although there were chromosomal abnormalities in the colonic field, these were much
smaller in number than those observed in the tumour and were not consistently seen at
distant sites from the tumour. There was variation in the abnormalities detected at 3,5 and 10
cm from the tumour in the same individual. The authors proposed that the findings supported
field cancerisation and could be explained by the mutator phenotype model for cancer
whereby cells within a tumour are heterogeneous and do not always share the same
mutations. Others have shown that that epigenetic makeup of cells in the colonic field
mirrors the epigenetic changes that have occurred in the tumour itself (Worthley et al., 2010)
suggesting that the tumour may have arisen within a field of biologically altered cells.
7.4. A candidate free approach to identify novel genes
The aim of this thesis was to investigate the concept of field cancerisation in CRC to
determine which cellular processes and genes are dysregulated in the colonic field around
cancer and adenomas. Although there have been reports identifying different epigenetic and
genetic changes that could play a role in field cancerisation, there have been no previous
studies which have taken a candidate free approach. It was felt that this would be the most
appropriate way to identify novel genes or signalling pathways that had not previously been
described. It would also enable a more general interrogation of the cellular machinery that

214 | P a g e
becomes altered in field cancerisation. Microarray technology was utilised to identify
differences in the global genomic expression profile of macroscopically normal mucosa
(MNM) taken from patients with cancer or polyps compared with control subjects. This
identified a number of different biological processes that were dysregulated including
immune response, metabolism and epithelial-mesenchymal transition. Interestingly, genes
that would be conventionally considered to contribute to tumourigenesis by regulating cell
proliferation or apoptosis were not identified. Amongst the genes that were further validated,
CXCL2 and FGF7 were both found to be significantly upregulated in the adjacent MNM to
cancer compared to the MNM taken from control subjects. In contrast to previous studies
which have shown that these field changes are limited to the immediate vicinity of the
tumour (Shen et al., 2005; Facista et al., 2012), both these genes were found to be
significantly upregulated at the resection margin compared to control subjects. This
highlights that field changes can occur at considerable distances along the colon from the
primary tumour indicating a wide field of biological change. With the use of protein
expression studies, FGF7 was upregulated along the colon, its receptor, FGFR2 was locally
downregulated at only the tumour site. This implied that disruption of this signalling axis
could contribute to malignant transformation and in response, FGF7 could be upregulated
along the colon. Protein expression studies confirmed down regulation of downstream
targets, pFRS2α and pAkt only in the tumour and not at the resection margin site nor in the
adjacent MNM. Based on these findings, FGF7 could play a role in contributing to CRC
formation. Moreover, its widespread upregulation only in the colonic mucosa of cancer
patients supports a potential role in field cancerisation.
7.5. Implications of the findings of this thesis
The findings of this thesis contribute to the existing body of scientific literature that
proposes field cancerisation in CRC. It highlights that there are multiple biological processes
that are dysregulated in the colonic field around a cancer or polyp. Although no field effect

215 | P a g e
around a polyp could be demonstrated with FGF7, the difference in CXCL2 expression
found adjacent to polyp was intermediate to that observed in the MNM adjacent to the
tumour and MNM in control subjects. This implies that there may be a field of altered
mucosa around polyps, however, the differences in expression are small suggesting that it is
closer to the mucosa in control subjects than the MNM found in cancer patients. Previous
studies which have investigated field cancerisation around polyps have also yielded
conflicting conclusions. In one study, an upward shift in the crypts’ replicative compartment
of rectal mucosa in patients with adenomas heralded a higher risk of adenoma recurrence
(Anti et al., 1993). However, in a subsequent study (Anti et al., 2001), no global changes in
cell proliferation and apoptosis were observed in individuals with adenomas compared to
those without. However, more recent studies where optical spectroscopy and light scattering
technology have been used to evaluate changes in microvasculature and cell ultrastructure
have highlighted important biological changes in the colonic field of patients with polyps. In
a study with 222 subjects, an endoscopically compatible polarisation gated spectroscopic
probe was used to measure changes in microvasculature around polyps. A gradient in the
measure of blood supply was observed up to 30 cm from the polyp suggesting that there was
a local increase around the polyp to support adenoma growth (Roy et al., 2008). In a
subsequent study, however, this measure of microvasculature was found in be increased by
50 % in the rectal mucosa of patients with adenomas compared to those without irrespective
of the adenoma site (Gomes et al., 2009). The authors proposed that rectal measurement of
microvasculature could be utilised to screen for patients with advanced adenomas without
having to perform complete colonic investigation. Findings from this thesis, however, would
suggest that the changes that take place in the field around polyps (as measured by CXCL2)
are a local phenomenon and are not found at distant sites along the colon. In contrast,
patients with CRC show evidence of upregulated FGF7 and CXCL2 at distant sites. Any
clinical application based on these findings could enable discrimination between cancer and
polyp patients using the gene expression of either FGF7 or CXCL2 taken from the distant
rectal mucosa.

216 | P a g e
Studies utilising light scattering technology have shown that there are ultrastructural changes
in the cells around polyps. The maximal difference between subjects with and without
adenoma was observed at 100 µm which correlates with changes in epithelial cells or the
extracellular matrix of the lamina propria (Radosevich et al., 2011; Radosevich et al.,
2012).. In the fourth chapter of this thesis, a large quantity of the genes identified to be
differentially expressed in the adjacent MNM around polyps were involved in the
extracellular matrix and lamina propria supporting the findings of these earlier reports.
The main biological processes that were identified to be dysregulated in the colonic field
around CRC were concerned with supporting epithelial cell growth rather than being
responsible for driving it. Similarly, FGF7 facilitates epithelial proliferation and CXCL2
attracts neutrophils which are pro-tumorigenic and angiogenic. Both of these genes represent
changes in stromal elements that interact with epithelial cells. Hence, changes in the stroma
maybe required earlier on in the carcinogenesis process than previously thought. Changes
may occur in the stroma in preparation for malignant growth with mutations arising in
conventional oncogenes and tumour suppressor genes later on. At present, most investigators
propose that changes in vasculature and metabolism occur after tumour formation has been
initiated to support increased cell proliferation (Hanahan & Folkman, 1996). Based on the
findings from this thesis, however, these supportive growth signals may actually be
important much earlier along the cancer pathway as they were detected in the colonic field
which harbours no evidence of tumour formation macroscopically.
7.6. Limitations
The findings from this thesis demonstrate that field cancerisation exists around CRC and can
be identified using FGF7 and CXCL2 at considerable distances from the tumour along the
resection specimen. However, there are some limitations that require further consideration.

217 | P a g e
Firstly, no causal relationship between the observed changes in gene expression and
subsequent tumour formation has been investigated. Previous studies utilising animal models
have shown that there are changes in the histologically normal mucosa that predates the
development of aberrant crypt foci (ACF) (Roy et al., 2004). Changes in light scattering
parameters of MNM were found 2 weeks prior to the development of ACF with changes
correlating both spatially and temporally with sites of subsequent development of ACF.
Investigation to prove a temporal, causal relationship in humans with sporadic CRC is
difficult to achieve, however, it has been described in a study on IBD-CRC. Mutations in
KRAS, TP53 and CDKN2A were observed in the histologically normal mucosa of patients
with Crohn’s disease up to 4 years before development of cancer suggesting that they
predated the formation of malignancy (Galandiuk et al., 2012).
Secondly, the focus has been on genomic profiling, however, it is important to realise that
post translational modification of proteins will play a significant role in governing which
signalling cascade is active in the cell. The studies on FGF7-FGFR2 interaction with protein
analysis were therefore helpful in elucidating how this signalling axis is disrupted in CRC.
Further investigation of CXCL2 would require similar evaluation with protein analysis.
The other aspect of gene modulation that should be considered is plasticity whereby a single
genotype can result in different phenotypes depending upon the local environment (Nieto,
2013). This is particularly important in cancer where the cells acquire the ability to survive
in hostile conditions and travel to distant organs, adopting a different phenotype to normal
cells.
7.7. Future directions
The findings in this thesis have provided the foundation for future work into field
cancerisation in CRC by highlighting two potential signalling pathways that could play a
role in contributing to a field defect. FGF7 shows promise as a marker of field cancerisation

218 | P a g e
whose function appears to be important for regulation of cell differentiation. Thus, loss of its
signal activity results in malignant transformation. CXCL2 is very significantly upregulated
in tumour tissue but also upregulated in the adjacent MNM around both cancer and polyp.
This implies that its expression could become altered much earlier on in the carcinogenesis
process and thus, it may translate into an earlier biomarker of cancer.
Whilst this thesis has been effective at highlighting the biological changes that occur in the
colonic field and provides a novel way of interrogating genes implicated in CRC
carcinogenesis, it does not elucidate the clinical implications of these findings. A
prospective observational clinical study in which the tissue expression levels of these genes
are correlated with clinical findings would help to characterise the clinical importance of a
field defect. The mRNA expression level determined using a rectal biopsy could be utilised
to cluster individuals with and without CRC. With longer follow up, the expression levels
could be correlated with future neoplastic risk in terms of development of adenomas or
cancer thereby elucidating if those with a field defect are at higher risk of recurrence. A
further study assessing field changes before and after surgery may help to discriminate if
these field changes are dependent upon tumour presence and could help identify its role as a
prognostic indicator. The relationship between colonic field changes and presence of polyps
is particularly interesting in this regard as polyps, at present, are the only means of risk
stratification of CRC risk in symptomatic individuals at present.
7.8. Final conclusion
Since the molecular characterisation of the adenoma-carcinoma sequence, there have been
considerable advances in our understanding of how CRC forms. However, there has been
little translation into effective diagnostic and therapeutic modalities. Researchers need to
address the cancer process in a different manner if we are to be successful at halting the
process. Field cancerisation offers promise of providing clues into the origins of CRC by

219 | P a g e
providing a means of investigating what happened before the onset of carcinogenesis. Future
investigation will not only need to demonstrate that field changes exist but provide ways in
which to link these changes in a causative manner to the cancer process. Several studies
have successfully shown that CRC is a heterogeneous cancer with several different pathways
and different phenotypes. Instead of addressing the very many different types of CRC, a
unified approach where the cancer is interrogated as a single disease may yield more
positive results for development of screening tests. The cellular and structural changes that
underpin cancer formation in several organs are similar in nature, hence, field cancerisation
offers such a united approach. Based on the field cancerisation concept, it would be possible
to discriminate between cancer patients and control subjects using distal rectal biopsies
obtained through a limited endoscopic examination. Such biopsies could be utilised to risk
stratify individuals with CRC or familial risk to inform surveillance schedules. If these genes
form the targets for pharmacological therapy, field cancerisation offers the opportunity to
not only identify high risk individuals but potentially enable modification of their neoplastic
risk prior to the development of any histological abnormality. If used in this clinical setting,
it would be possible to achieve prevention of CRC formation before any macroscopic
changes occur in the mucosa.
This thesis has demonstrated alterations in several biological processes in the colonic field
around CRC which support tumour formation providing evidence for the field cancerisation
concept in CRC. Growth signals (FGF7) and a pro-inflammatory environment (CXCL2)
appear to contribute to field cancerisation rather than alteration in known oncogenes and
tumour suppressors highlighting the importance of the stromal compartment in supporting
tumour growth. Future studies will need to establish a mechanistic relationship with in vitro
cell culture models and investigate the clinical implications of this field defect in
longitudinal observational cohort studies.

220 | P a g e
Bibliography
Abella, J. V. & Park, M. (2009) Breakdown of endocytosis in the oncogenic activation of receptor tyrosine kinases. Am J Physiol Endocrinol Metab, 296 (5): E973-984.
Addison, C. L., Daniel, T. O., Burdick, M. D., Liu, H., Ehlert, J. E., Xue, Y. Y., Buechi, L., Walz, A., Richmond, A. & Strieter, R. M. (2000) The CXC chemokine receptor 2, CXCR2, is the putative receptor for ELR+ CXC chemokine-induced angiogenic activity. J Immunol, 165 (9): 5269-5277.
Agarwal, E., Brattain, M. G. & Chowdhury, S. (2013) Cell survival and metastasis regulation by Akt signaling in colorectal cancer. Cell Signal, 25 (8): 1711-1719.
Ahlquist, D. A., Zou, H., Domanico, M., Mahoney, D. W., Yab, T. C., Taylor, W. R., Butz, M. L., Thibodeau, S. N., Rabeneck, L., Paszat, L. F., Kinzler, K. W., Vogelstein, B., Bjerregaard, N. C., Laurberg, S., Sørensen, H. T., Berger, B. M. & Lidgard, G. P. (2012) Next-generation stool DNA test accurately detects colorectal cancer and large adenomas. Gastroenterology, 142 (2): 248-256; quiz e225-246.
Ajioka, Y., Allison, L. J. & Jass, J. R. (1996) Significance of MUC1 and MUC2 mucin expression in colorectal cancer. J Clin Pathol, 49 (7): 560-564.
Al-Tassan, N., Chmiel, N. H., Maynard, J., Fleming, N., Livingston, A. L., Williams, G. T., Hodges, A. K., Davies, D. R., David, S. S., Sampson, J. R. & Cheadle, J. P. (2002) Inherited variants of MYH associated with somatic G:C-->T:A mutations in colorectal tumors. Nat Genet, 30 (2): 227-232.
Alberts B, Johnson A, Lewis J, Raff M, Roberts K & P., W. (2004) Molecular biology of the cell, 4th Edition. New York, NY: Garland Science.
Alberts, D. S., Einspahr, J. G., Krouse, R. S., Prasad, A., Ranger-Moore, J., Hamilton, P., Ismail, A., Lance, P., Goldschmid, S., Hess, L. M., Yozwiak, M., Bartels, H. G. & Bartels, P. H. (2007) Karyometry of the colonic mucosa. Cancer Epidemiol Biomarkers Prev, 16 (12): 2704-2716.
Alon, U., Barkai, N., Notterman, D. A., Gish, K., Ybarra, S., Mack, D. & Levine, A. J. (1999) Broad patterns of gene expression revealed by clustering analysis of tumor and normal colon tissues probed by oligonucleotide arrays. Proc Natl Acad Sci U S A, 96 (12): 6745-6750.
Amann, T., Bataille, F., Spruss, T., Dettmer, K., Wild, P., Liedtke, C., Mühlbauer, M., Kiefer, P., Oefner, P. J., Trautwein, C., Bosserhoff, A. K. & Hellerbrand, C. (2010) Reduced expression of fibroblast growth factor receptor 2IIIb in hepatocellular carcinoma induces a more aggressive growth. Am J Pathol, 176 (3): 1433-1442.

221 | P a g e
Andreyev, H. J., Norman, A. R., Cunningham, D., Oates, J., Dix, B. R., Iacopetta, B. J., Young, J., Walsh, T., Ward, R., Hawkins, N., Beranek, M., Jandik, P., Benamouzig, R., Jullian, E., Laurent-Puig, P., Olschwang, S., Muller, O., Hoffmann, I., Rabes, H. M., Zietz, C., Troungos, C., Valavanis, C., Yuen, S. T., Ho, J. W., Croke, C. T., O'Donoghue, D. P., Giaretti, W., Rapallo, A., Russo, A., Bazan, V., Tanaka, M., Omura, K., Azuma, T., Ohkusa, T., Fujimori, T., Ono, Y., Pauly, M., Faber, C., Glaesener, R., de Goeij, A. F., Arends, J. W., Andersen, S. N., Lövig, T., Breivik, J., Gaudernack, G., Clausen, O. P., De Angelis, P. D., Meling, G. I., Rognum, T. O., Smith, R., Goh, H. S., Font, A., Rosell, R., Sun, X. F., Zhang, H., Benhattar, J., Losi, L., Lee, J. Q., Wang, S. T., Clarke, P. A., Bell, S., Quirke, P., Bubb, V. J., Piris, J., Cruickshank, N. R., Morton, D., Fox, J. C., Al-Mulla, F., Lees, N., Hall, C. N., Snary, D., Wilkinson, K., Dillon, D., Costa, J., Pricolo, V. E., Finkelstein, S. D., Thebo, J. S., Senagore, A. J., Halter, S. A., Wadler, S., Malik, S., Krtolica, K. & Urosevic, N. (2001) Kirsten ras mutations in patients with colorectal cancer: the 'RASCAL II' study. Br J Cancer, 85 (5): 692-696.
Anon http://www.ncin.org.uk/publications/data_briefings/colorectal_cancer_survival_by_stage. [online] Available from: (Accessed
Anti, M., Armuzzi, A., Morini, S., Iascone, E., Pignataro, G., Coco, C., Lorenzetti, R., Paolucci, M., Covino, M., Gasbarrini, A., Vecchio, F. & Gasbarrini, G. (2001) Severe imbalance of cell proliferation and apoptosis in the left colon and in the rectosigmoid tract in subjects with a history of large adenomas. Gut, 48 (2): 238-246.
Anti, M., Marra, G., Armelao, F., Percesepe, A., Ficarelli, R., Ricciuto, G. M., Valenti, A., Rapaccini, G. L., De Vitis, I. & D'Agostino, G. (1993) Rectal epithelial cell proliferation patterns as predictors of adenomatous colorectal polyp recurrence. Gut, 34 (4): 525-530.
Arai, T., Kasahara, I., Sawabe, M., Kanazawa, N., Kuroiwa, K., Honma, N., Aida, J. & Takubo, K. (2007) Microsatellite-unstable mucinous colorectal carcinoma occurring in the elderly: comparison with medullary type poorly differentiated adenocarcinoma. Pathol Int, 57 (4): 205-212.
Arasaradnam, R. P., McFarlane, M. J., Ryan-Fisher, C., Westenbrink, E., Hodges, P., Thomas, M. G., Chambers, S., O'Connell, N., Bailey, C., Harmston, C., Nwokolo, C. U., Bardhan, K. D. & Covington, J. A. (2014) Detection of colorectal cancer (CRC) by urinary volatile organic compound analysis. PLoS One, 9 (9): e108750.
ASTLER, V. B. & COLLER, F. A. (1954) The prognostic significance of direct extension of carcinoma of the colon and rectum. Ann Surg, 139 (6): 846-852.
Atkin, W. S., Cook, C. F., Cuzick, J., Edwards, R., Northover, J. M., Wardle, J. & Investigators, U. F. S. S. T. (2002) Single flexible sigmoidoscopy screening to prevent colorectal cancer: baseline findings of a UK multicentre randomised trial. Lancet, 359 (9314): 1291-1300.
Atkin, W. S., Edwards, R., Kralj-Hans, I., Wooldrage, K., Hart, A. R., Northover, J. M., Parkin, D. M., Wardle, J., Duffy, S. W., Cuzick, J. & Investigators, U. F. S. T. (2010) Once-only flexible

222 | P a g e
sigmoidoscopy screening in prevention of colorectal cancer: a multicentre randomised controlled trial. Lancet, 375 (9726): 1624-1633.
Atkin, W. S., Morson, B. C. & Cuzick, J. (1992) Long-term risk of colorectal cancer after excision of rectosigmoid adenomas. N Engl J Med, 326 (10): 658-662.
Auciello, G., Cunningham, D. L., Tatar, T., Heath, J. K. & Rappoport, J. Z. (2013) Regulation of fibroblast growth factor receptor signalling and trafficking by Src and Eps8. J Cell Sci, 126 (Pt 2): 613-624.
Aune, D., Chan, D. S., Lau, R., Vieira, R., Greenwood, D. C., Kampman, E. & Norat, T. (2011) Dietary fibre, whole grains, and risk of colorectal cancer: systematic review and dose-response meta-analysis of prospective studies. BMJ, 343 d6617.
Aziz MA, AlOtaibi M, AlAbdulrahman A, Aldrees M & I., A. (2014) Mucin Family Genes are Downregulated in Colorectal Cancer Patients. J Carcinogene Mutagene, S10
Babel, I., Barderas, R., Díaz-Uriarte, R., Martínez-Torrecuadrada, J. L., Sánchez-Carbayo, M. & Casal, J. I. (2009) Identification of tumor-associated autoantigens for the diagnosis of colorectal cancer in serum using high density protein microarrays. Mol Cell Proteomics, 8 (10): 2382-2395.
Badvie, S., Hanna-Morris, A., Andreyev, H. J., Cohen, P., Saini, S. & Allen-Mersh, T. G. (2006) A "field change" of inhibited apoptosis occurs in colorectal mucosa adjacent to colorectal adenocarcinoma. J Clin Pathol, 59 (9): 942-946.
Bae, J. M., Cho, N. Y., Kim, T. Y. & Kang, G. H. (2012) Clinicopathologic and molecular characteristics of synchronous colorectal cancers: heterogeneity of clinical outcome depending on microsatellite instability status of individual tumors. Dis Colon Rectum, 55 (2): 181-190.
Bahrenberg, G., Brauers, A., Joost, H. G. & Jakse, G. (2000) Reduced expression of PSCA, a member of the LY-6 family of cell surface antigens, in bladder, esophagus, and stomach tumors. Biochem Biophys Res Commun, 275 (3): 783-788.
Baier, P. K., Wolff-Vorbeck, G., Eggstein, S., Baumgartner, U. & Hopt, U. T. (2005) Cytokine expression in colon carcinoma. Anticancer Res, 25 (3B): 2135-2139.
Baker, S. J., Fearon, E. R., Nigro, J. M., Hamilton, S. R., Preisinger, A. C., Jessup, J. M., vanTuinen, P., Ledbetter, D. H., Barker, D. F., Nakamura, Y., White, R. & Vogelstein, B. (1989) Chromosome 17 deletions and p53 gene mutations in colorectal carcinomas. Science, 244 (4901): 217-221.
Balkwill, F. R. (2012) The chemokine system and cancer. J Pathol, 226 (2): 148-157.

223 | P a g e
Ballesté, B., Bessa, X., Piñol, V., Castellví-Bel, S., Castells, A., Alenda, C., Paya, A., Jover, R., Xicola, R. M., Pons, E., Llor, X., Cordero, C., Fernandez-Bañares, F., de Castro, L., Reñé, J. M., Andreu, M. & Association, G. O. G. o. t. S. G. (2007) Detection of metachronous neoplasms in colorectal cancer patients: identification of risk factors. Dis Colon Rectum, 50 (7): 971-980.
Banerjea, A., Ahmed, S., Hands, R. E., Huang, F., Han, X., Shaw, P. M., Feakins, R., Bustin, S. A. & Dorudi, S. (2004) Colorectal cancers with microsatellite instability display mRNA expression signatures characteristic of increased immunogenicity. Mol Cancer, 3 21.
Bansal, G. S., Cox, H. C., Marsh, S., Gomm, J. J., Yiangou, C., Luqmani, Y., Coombes, R. C. & Johnston, C. L. (1997) Expression of keratinocyte growth factor and its receptor in human breast cancer. Br J Cancer, 75 (11): 1567-1574.
Barber, T. D., McManus, K., Yuen, K. W., Reis, M., Parmigiani, G., Shen, D., Barrett, I., Nouhi, Y., Spencer, F., Markowitz, S., Velculescu, V. E., Kinzler, K. W., Vogelstein, B., Lengauer, C. & Hieter, P. (2008) Chromatid cohesion defects may underlie chromosome instability in human colorectal cancers. Proc Natl Acad Sci U S A, 105 (9): 3443-3448.
Barbera-Guillem, E., Nyhus, J. K., Wolford, C. C., Friece, C. R. & Sampsel, J. W. (2002) Vascular endothelial growth factor secretion by tumor-infiltrating macrophages essentially supports tumor angiogenesis, and IgG immune complexes potentiate the process. Cancer Res, 62 (23): 7042-7049.
Bardelli, A., Parsons, D. W., Silliman, N., Ptak, J., Szabo, S., Saha, S., Markowitz, S., Willson, J. K., Parmigiani, G., Kinzler, K. W., Vogelstein, B. & Velculescu, V. E. (2003) Mutational analysis of the tyrosine kinome in colorectal cancers. Science, 300 (5621): 949.
Barderas, R., Babel, I., Díaz-Uriarte, R., Moreno, V., Suárez, A., Bonilla, F., Villar-Vázquez, R., Capellá, G. & Casal, J. I. (2012) An optimized predictor panel for colorectal cancer diagnosis based on the combination of tumor-associated antigens obtained from protein and phage microarrays. J Proteomics, 75 (15): 4647-4655.
Bardi, G., Sukhikh, T., Pandis, N., Fenger, C., Kronborg, O. & Heim, S. (1995) Karyotypic characterization of colorectal adenocarcinomas. Genes Chromosomes Cancer, 12 (2): 97-109.
Barlow, A. P. & Thompson, M. H. (1993) Colonoscopic follow-up after resection for colorectal cancer: a selective policy. Br J Surg, 80 (6): 781-784.
Barrow, E., Robinson, L., Alduaij, W., Shenton, A., Clancy, T., Lalloo, F., Hill, J. & Evans, D. G. (2009) Cumulative lifetime incidence of extracolonic cancers in Lynch syndrome: a report of 121 families with proven mutations. Clin Genet, 75 (2): 141-149.

224 | P a g e
Bates, R. C., DeLeo, M. J. & Mercurio, A. M. (2004) The epithelial-mesenchymal transition of colon carcinoma involves expression of IL-8 and CXCR-1-mediated chemotaxis. Exp Cell Res, 299 (2): 315-324.
Batlle, E., Henderson, J. T., Beghtel, H., van den Born, M. M., Sancho, E., Huls, G., Meeldijk, J., Robertson, J., van de Wetering, M., Pawson, T. & Clevers, H. (2002) Beta-catenin and TCF mediate cell positioning in the intestinal epithelium by controlling the expression of EphB/ephrinB. Cell, 111 (2): 251-263.
Bauer, J. W., Baechler, E. C., Petri, M., Batliwalla, F. M., Crawford, D., Ortmann, W. A., Espe, K. J., Li, W., Patel, D. D., Gregersen, P. K. & Behrens, T. W. (2006) Elevated serum levels of interferon-regulated chemokines are biomarkers for active human systemic lupus erythematosus. PLoS Med, 3 (12): e491.
Baxter, N. N., Goldwasser, M. A., Paszat, L. F., Saskin, R., Urbach, D. R. & Rabeneck, L. (2009) Association of colonoscopy and death from colorectal cancer. Ann Intern Med, 150 (1): 1-8.
Bazensky, I., Shoobridge-Moran, C. & Yoder, L. H. (2007) Colorectal cancer: an overview of the epidemiology, risk factors, symptoms, and screening guidelines. Medsurg Nurs, 16 (1): 46-51; quiz 52.
Beach, R., Chan, A. O., Wu, T. T., White, J. A., Morris, J. S., Lunagomez, S., Broaddus, R. R., Issa, J. P., Hamilton, S. R. & Rashid, A. (2005) BRAF mutations in aberrant crypt foci and hyperplastic polyposis. Am J Pathol, 166 (4): 1069-1075.
Beckman, K. B., Lee, K. Y., Golden, T. & Melov, S. (2004) Gene expression profiling in mitochondrial disease: assessment of microarray accuracy by high-throughput Q-PCR. Mitochondrion, 4 (5-6): 453-470.
Bedi, G. C., Westra, W. H., Gabrielson, E., Koch, W. & Sidransky, D. (1996) Multiple head and neck tumors: evidence for a common clonal origin. Cancer Res, 56 (11): 2484-2487.
Beenken, A. & Mohammadi, M. (2009) The FGF family: biology, pathophysiology and therapy. Nat Rev Drug Discov, 8 (3): 235-253.
Belshaw, N. J., Elliott, G. O., Foxall, R. J., Dainty, J. R., Pal, N., Coupe, A., Garg, D., Bradburn, D. M., Mathers, J. C. & Johnson, I. T. (2008) Profiling CpG island field methylation in both morphologically normal and neoplastic human colonic mucosa. Br J Cancer, 99 (1): 136-142.
Benes, V. & Muckenthaler, M. (2003) Standardization of protocols in cDNA microarray analysis. Trends Biochem Sci, 28 (5): 244-249.
Benvenuti, S., Sartore-Bianchi, A., Di Nicolantonio, F., Zanon, C., Moroni, M., Veronese, S., Siena, S. & Bardelli, A. (2007) Oncogenic activation of the RAS/RAF signaling pathway

225 | P a g e
impairs the response of metastatic colorectal cancers to anti-epidermal growth factor receptor antibody therapies. Cancer Res, 67 (6): 2643-2648.
Bernstein, C., Facista, A., Nguyen, H., Zaitlin, B., Hassounah, N., Loustaunau, C., Payne, C. M., Banerjee, B., Goldschmid, S., Tsikitis, V. L., Krouse, R. & Bernstein, H. (2010) Cancer and age related colonic crypt deficiencies in cytochrome c oxidase I. World J Gastrointest Oncol, 2 (12): 429-442.
Bernstein, C., Holubec, H., Bhattacharyya, A. K., Nguyen, H., Payne, C. M., Zaitlin, B. & Bernstein, H. (2011) Carcinogenicity of deoxycholate, a secondary bile acid. Arch Toxicol, 85 (8): 863-871.
Bernstein, C., Nfonsam, V., Prasad, A. R. & Bernstein, H. (2013) Epigenetic field defects in progression to cancer. World J Gastrointest Oncol, 5 (3): 43-49.
Bernstein, C. N., Blanchard, J. F., Kliewer, E. & Wajda, A. (2001) Cancer risk in patients with inflammatory bowel disease: a population-based study. Cancer, 91 (4): 854-862.
Bernstein, C. N., Shanahan, F. & Weinstein, W. M. (1994) Are we telling patients the truth about surveillance colonoscopy in ulcerative colitis? Lancet, 343 (8889): 71-74.
Bertucci, F., Salas, S., Eysteries, S., Nasser, V., Finetti, P., Ginestier, C., Charafe-Jauffret, E., Loriod, B., Bachelart, L., Montfort, J., Victorero, G., Viret, F., Ollendorff, V., Fert, V., Giovaninni, M., Delpero, J. R., Nguyen, C., Viens, P., Monges, G., Birnbaum, D. & Houlgatte, R. (2004) Gene expression profiling of colon cancer by DNA microarrays and correlation with histoclinical parameters. Oncogene, 23 (7): 1377-1391.
Bianchini, M., Levy, E., Zucchini, C., Pinski, V., Macagno, C., De Sanctis, P., Valvassori, L., Carinci, P. & Mordoh, J. (2006) Comparative study of gene expression by cDNA microarray in human colorectal cancer tissues and normal mucosa. Int J Oncol, 29 (1): 83-94.
Bibbo, M., Michelassi, F., Bartels, P. H., Dytch, H., Bania, C., Lerma, E. & Montag, A. G. (1990) Karyometric marker features in normal-appearing glands adjacent to human colonic adenocarcinoma. Cancer Res, 50 (1): 147-151.
Biemer-Hüttmann, A. E., Walsh, M. D., McGuckin, M. A., Simms, L. A., Young, J., Leggett, B. A. & Jass, J. R. (2000) Mucin core protein expression in colorectal cancers with high levels of microsatellite instability indicates a novel pathway of morphogenesis. Clin Cancer Res, 6 (5): 1909-1916.
Bingham, S. A., Luben, R., Day, N. E., Riboli, E. & Patterns, E. W. G. o. D. (2002) Plant polysaccharides, meat and colorectal cancer. IARC Sci Publ, 156 349-352.
Bird, R. P. (1987) Observation and quantification of aberrant crypts in the murine colon treated with a colon carcinogen: preliminary findings. Cancer Lett, 37 (2): 147-151.

226 | P a g e
Bird, R. P., McLellan, E. A. & Bruce, W. R. (1989) Aberrant crypts, putative precancerous lesions, in the study of the role of diet in the aetiology of colon cancer. Cancer Surv, 8 (1): 189-200.
Birkenkamp-Demtroder, K., Olesen, S. H., Sørensen, F. B., Laurberg, S., Laiho, P., Aaltonen, L. A. & Orntoft, T. F. (2005) Differential gene expression in colon cancer of the caecum versus the sigmoid and rectosigmoid. Gut, 54 (3): 374-384.
Blank, M., Klussmann, E., Krüger-Krasagakes, S., Schmitt-Gräff, A., Stolte, M., Bornhoeft, G., Stein, H., Xing, P. X., McKenzie, I. F. & Verstijnen, C. P. (1994) Expression of MUC2-mucin in colorectal adenomas and carcinomas of different histological types. Int J Cancer, 59 (3): 301-306.
Boland, C. R., Thibodeau, S. N., Hamilton, S. R., Sidransky, D., Eshleman, J. R., Burt, R. W., Meltzer, S. J., Rodriguez-Bigas, M. A., Fodde, R., Ranzani, G. N. & Srivastava, S. (1998) A National Cancer Institute Workshop on Microsatellite Instability for cancer detection and familial predisposition: development of international criteria for the determination of microsatellite instability in colorectal cancer. Cancer Res, 58 (22): 5248-5257.
Boparai, K. S., Mathus-Vliegen, E. M., Koornstra, J. J., Nagengast, F. M., van Leerdam, M., van Noesel, C. J., Houben, M., Cats, A., van Hest, L. P., Fockens, P. & Dekker, E. (2010) Increased colorectal cancer risk during follow-up in patients with hyperplastic polyposis syndrome: a multicentre cohort study. Gut, 59 (8): 1094-1100.
Borda, A., Martínez-Peñuela, J. M., Borda, F., Muñoz-Navas, M., Jiménez, F. J. & Carretero, C. (2012) Drawing up an individual risk index for development of metachronous neoplastic lesions in resected colorectal cancer. Rev Esp Enferm Dig, 104 (6): 291-297.
Börger, M. E., Gosens, M. J., Jeuken, J. W., van Kempen, L. C., van de Velde, C. J., van Krieken, J. H. & Nagtegaal, I. D. (2007) Signet ring cell differentiation in mucinous colorectal carcinoma. J Pathol, 212 (3): 278-286.
Bos, J. L., Fearon, E. R., Hamilton, S. R., Verlaan-de Vries, M., van Boom, J. H., van der Eb, A. J. & Vogelstein, B. (1987) Prevalence of ras gene mutations in human colorectal cancers. Nature, 327 (6120): 293-297.
Botteri, E., Iodice, S., Raimondi, S., Maisonneuve, P. & Lowenfels, A. B. (2008) Cigarette smoking and adenomatous polyps: a meta-analysis. Gastroenterology, 134 (2): 388-395.
Boyle, P. & Langman, J. S. (2000) ABC of colorectal cancer: Epidemiology. BMJ, 321 (7264): 805-808.
Braakhuis, B. J., Tabor, M. P., Kummer, J. A., Leemans, C. R. & Brakenhoff, R. H. (2003) A genetic explanation of Slaughter's concept of field cancerization: evidence and clinical implications. Cancer Res, 63 (8): 1727-1730.

227 | P a g e
Brazma, A., Hingamp, P., Quackenbush, J., Sherlock, G., Spellman, P., Stoeckert, C., Aach, J., Ansorge, W., Ball, C. A., Causton, H. C., Gaasterland, T., Glenisson, P., Holstege, F. C., Kim, I. F., Markowitz, V., Matese, J. C., Parkinson, H., Robinson, A., Sarkans, U., Schulze-Kremer, S., Stewart, J., Taylor, R., Vilo, J. & Vingron, M. (2001) Minimum information about a microarray experiment (MIAME)-toward standards for microarray data. Nat Genet, 29 (4): 365-371.
Brensinger, J. D., Laken, S. J., Luce, M. C., Powell, S. M., Vance, G. H., Ahnen, D. J., Petersen, G. M., Hamilton, S. R. & Giardiello, F. M. (1998) Variable phenotype of familial adenomatous polyposis in pedigrees with 3' mutation in the APC gene. Gut, 43 (4): 548-552.
Brevinge, H., Lindholm, E., Buntzen, S. & Kewenter, J. (1997) Screening for colorectal neoplasia with faecal occult blood testing compared with flexible sigmoidoscopy directly in a 55-56 years' old population. Int J Colorectal Dis, 12 (5): 291-295.
Briggs, C. D., Neal, C. P., Mann, C. D., Steward, W. P., Manson, M. M. & Berry, D. P. (2009) Prognostic molecular markers in cholangiocarcinoma: a systematic review. Eur J Cancer, 45 (1): 33-47.
Bronner, C. E., Baker, S. M., Morrison, P. T., Warren, G., Smith, L. G., Lescoe, M. K., Kane, M., Earabino, C., Lipford, J. & Lindblom, A. (1994) Mutation in the DNA mismatch repair gene homologue hMLH1 is associated with hereditary non-polyposis colon cancer. Nature, 368 (6468): 258-261.
Brooks, A. N., Kilgour, E. & Smith, P. D. (2012) Molecular pathways: fibroblast growth factor signaling: a new therapeutic opportunity in cancer. Clin Cancer Res, 18 (7): 1855-1862.
Bruyère, C., Lonez, C., Duray, A., Cludts, S., Ruysschaert, J. M., Saussez, S., Yeaton, P., Kiss, R. & Mijatovic, T. (2011) Considering temozolomide as a novel potential treatment for esophageal cancer. Cancer, 117 (9): 2004-2016.
Bu, X. D., Li, N., Tian, X. Q., Li, L., Wang, J. S., Yu, X. J. & Huang, P. L. (2010) Altered expression of MUC2 and MUC5AC in progression of colorectal carcinoma. World J Gastroenterol, 16 (32): 4089-4094.
Buchanan, D. D., Sweet, K., Drini, M., Jenkins, M. A., Win, A. K., English, D. R., Walsh, M. D., Clendenning, M., McKeone, D. M., Walters, R. J., Roberts, A., Pearson, S. A., Pavluk, E., Hopper, J. L., Gattas, M. R., Goldblatt, J., George, J., Suthers, G. K., Phillips, K. D., Woodall, S., Arnold, J., Tucker, K., Muir, A., Field, M., Greening, S., Gallinger, S., Perrier, R., Baron, J. A., Potter, J. D., Haile, R., Frankel, W., de la Chapelle, A., Macrae, F., Rosty, C., Walker, N. I., Parry, S. & Young, J. P. (2010) Risk factors for colorectal cancer in patients with multiple serrated polyps: a cross-sectional case series from genetics clinics. PLoS One, 5 (7): e11636.

228 | P a g e
Buckhaults, P., Rago, C., St Croix, B., Romans, K. E., Saha, S., Zhang, L., Vogelstein, B. & Kinzler, K. W. (2001) Secreted and cell surface genes expressed in benign and malignant colorectal tumors. Cancer Res, 61 (19): 6996-7001.
Bülow, S., Faurschou Nielsen, T., Bülow, C., Bisgaard, M. L., Karlsen, L. & Moesgaard, F. (1996) The incidence rate of familial adenomatous polyposis. Results from the Danish Polyposis Register. Int J Colorectal Dis, 11 (2): 88-91.
Burch, J. A., Soares-Weiser, K., St John, D. J., Duffy, S., Smith, S., Kleijnen, J. & Westwood, M. (2007) Diagnostic accuracy of faecal occult blood tests used in screening for colorectal cancer: a systematic review. J Med Screen, 14 (3): 132-137.
Butterworth, A. S., Higgins, J. P. & Pharoah, P. (2006) Relative and absolute risk of colorectal cancer for individuals with a family history: a meta-analysis. Eur J Cancer, 42 (2): 216-227.
Cady, B. & Stone, M. D. (1991) The role of surgical resection of liver metastases in colorectal carcinoma. Semin Oncol, 18 (4): 399-406.
Cahill, D. P., Kinzler, K. W., Vogelstein, B. & Lengauer, C. (1999) Genetic instability and darwinian selection in tumours. Trends Cell Biol, 9 (12): M57-60.
Cai, Y. J., Wang, W. S., Liang, H. Y., Sun, L. H., Teitelbaum, D. H. & Yang, H. (2012) Keratinocyte growth factor up-regulates Interleukin-7 expression following intestinal ischemia/reperfusion in vitro and in vivo. Int J Clin Exp Pathol, 5 (6): 569-580.
Cai, Y. J., Wang, W. S., Yang, Y., Sun, L. H., Teitelbaum, D. H. & Yang, H. (2013) Up-regulation of intestinal epithelial cell derived IL-7 expression by keratinocyte growth factor through STAT1/IRF-1, IRF-2 pathway. PLoS One, 8 (3): e58647.
Califano, J., Leong, P. L., Koch, W. M., Eisenberger, C. F., Sidransky, D. & Westra, W. H. (1999) Second esophageal tumors in patients with head and neck squamous cell carcinoma: an assessment of clonal relationships. Clin Cancer Res, 5 (7): 1862-1867.
Canavan, C., Abrams, K. R. & Mayberry, J. (2006) Meta-analysis: colorectal and small bowel cancer risk in patients with Crohn's disease. Aliment Pharmacol Ther, 23 (8): 1097-1104.
Cao, D., Ji, H. & Ronnett, B. M. (2005) Expression of mesothelin, fascin, and prostate stem cell antigen in primary ovarian mucinous tumors and their utility in differentiating primary ovarian mucinous tumors from metastatic pancreatic mucinous carcinomas in the ovary. Int J Gynecol Pathol, 24 (1): 67-72.
Cao, Y., Chen, C., Weatherbee, J. A., Tsang, M. & Folkman, J. (1995) gro-beta, a -C-X-C- chemokine, is an angiogenesis inhibitor that suppresses the growth of Lewis lung carcinoma in mice. J Exp Med, 182 (6): 2069-2077.

229 | P a g e
Cardoso, J., Boer, J., Morreau, H. & Fodde, R. (2007) Expression and genomic profiling of colorectal cancer. Biochim Biophys Acta, 1775 (1): 103-137.
Carlsson, B., Kindberg, E., Buesa, J., Rydell, G. E., Lidón, M. F., Montava, R., Abu Mallouh, R., Grahn, A., Rodríguez-Díaz, J., Bellido, J., Arnedo, A., Larson, G. & Svensson, L. (2009) The G428A nonsense mutation in FUT2 provides strong but not absolute protection against symptomatic GII.4 Norovirus infection. PLoS One, 4 (5): e5593.
Carstens, R. P., Eaton, J. V., Krigman, H. R., Walther, P. J. & Garcia-Blanco, M. A. (1997) Alternative splicing of fibroblast growth factor receptor 2 (FGF-R2) in human prostate cancer. Oncogene, 15 (25): 3059-3065.
Castiglione, G., Grazzini, G., Miccinesi, G., Rubeca, T., Sani, C., Turco, P. & Zappa, M. (2002) Basic variables at different positivity thresholds of a quantitative immunochemical test for faecal occult blood. J Med Screen, 9 (3): 99-103.
Centelles, J. J. (2012) General aspects of colorectal cancer. ISRN Oncol, 2012 139268.
Chaffer, C. L., Brennan, J. P., Slavin, J. L., Blick, T., Thompson, E. W. & Williams, E. D. (2006) Mesenchymal-to-epithelial transition facilitates bladder cancer metastasis: role of fibroblast growth factor receptor-2. Cancer Res, 66 (23): 11271-11278.
Chan, A. O., Issa, J. P., Morris, J. S., Hamilton, S. R. & Rashid, A. (2002) Concordant CpG island methylation in hyperplastic polyposis. Am J Pathol, 160 (2): 529-536.
Chan, S. K., Griffith, O. L., Tai, I. T. & Jones, S. J. (2008) Meta-analysis of colorectal cancer gene expression profiling studies identifies consistently reported candidate biomarkers. Cancer Epidemiol Biomarkers Prev, 17 (3): 543-552.
Chan, T. L., Curtis, L. C., Leung, S. Y., Farrington, S. M., Ho, J. W., Chan, A. S., Lam, P. W., Tse, C. W., Dunlop, M. G., Wyllie, A. H. & Yuen, S. T. (2001) Early-onset colorectal cancer with stable microsatellite DNA and near-diploid chromosomes. Oncogene, 20 (35): 4871-4876.
Chan, T. L., Zhao, W., Leung, S. Y., Yuen, S. T. & Project, C. G. (2003) BRAF and KRAS mutations in colorectal hyperplastic polyps and serrated adenomas. Cancer Res, 63 (16): 4878-4881.
Chandramouli, A., Mercado-Pimentel, M. E., Hutchinson, A., Gibadulinová, A., Olson, E. R., Dickinson, S., Shañas, R., Davenport, J., Owens, J., Bhattacharyya, A. K., Regan, J. W., Pastorekova, S., Arumugam, T., Logsdon, C. D. & Nelson, M. A. (2010) The induction of S100p expression by the Prostaglandin E₂ (PGE₂)/EP4 receptor signaling pathway in colon cancer cells. Cancer Biol Ther, 10 (10): 1056-1066.

230 | P a g e
Chang, W. W. & Whitener, C. J. (1989) Histogenesis of tubular adenomas in hereditary colonic adenomatous polyposis. Arch Pathol Lab Med, 113 (9): 1042-1049.
Charo, I. F. & Ransohoff, R. M. (2006) The many roles of chemokines and chemokine receptors in inflammation. N Engl J Med, 354 (6): 610-621.
Chen, B., Xue, Z., Yang, G., Shi, B., Yang, B., Yan, Y., Wang, X., Han, D., Huang, Y. & Dong, W. (2013a) Akt-signal integration is involved in the differentiation of embryonal carcinoma cells. PLoS One, 8 (6): e64877.
Chen, F., Zhuang, X., Lin, L., Yu, P., Wang, Y., Shi, Y., Hu, G. & Sun, Y. (2015) New horizons in tumor microenvironment biology: challenges and opportunities. BMC Med, 13 45.
Chen, H. S. & Sheen-Chen, S. M. (2000) Synchronous and "early" metachronous colorectal adenocarcinoma: analysis of prognosis and current trends. Dis Colon Rectum, 43 (8): 1093-1099.
Chen, J., Wang, Y., Shen, B. & Zhang, D. (2013b) Molecular signature of cancer at gene level or pathway level? Case studies of colorectal cancer and prostate cancer microarray data. Comput Math Methods Med, 2013 909525.
Chen, L., Brizel, D. M., Rabbani, Z. N., Samulski, T. V., Farrell, C. L., Larrier, N., Anscher, M. S. & Vujaskovic, Z. (2004a) The protective effect of recombinant human keratinocyte growth factor on radiation-induced pulmonary toxicity in rats. Int J Radiat Oncol Biol Phys, 60 (5): 1520-1529.
Chen, L. C., Hao, C. Y., Chiu, Y. S., Wong, P., Melnick, J. S., Brotman, M., Moretto, J., Mendes, F., Smith, A. P., Bennington, J. L., Moore, D. & Lee, N. M. (2004b) Alteration of gene expression in normal-appearing colon mucosa of APC(min) mice and human cancer patients. Cancer Res, 64 (10): 3694-3700.
Chen, W. D., Han, Z. J., Skoletsky, J., Olson, J., Sah, J., Myeroff, L., Platzer, P., Lu, S., Dawson, D., Willis, J., Pretlow, T. P., Lutterbaugh, J., Kasturi, L., Willson, J. K., Rao, J. S., Shuber, A. & Markowitz, S. D. (2005) Detection in fecal DNA of colon cancer-specific methylation of the nonexpressed vimentin gene. J Natl Cancer Inst, 97 (15): 1124-1132.
Cheng, H., Bjerknes, M. & Amar, J. (1984) Methods for the determination of epithelial cell kinetic parameters of human colonic epithelium isolated from surgical and biopsy specimens. Gastroenterology, 86 (1): 78-85.
Cherkezyan, L., Stypula-Cyrus, Y., Subramanian, H., White, C., Dela Cruz, M., Wali, R. K., Goldberg, M. J., Bianchi, L. K., Roy, H. K. & Backman, V. (2014) Nanoscale changes in chromatin organization represent the initial steps of tumorigenesis: a transmission electron microscopy study. BMC Cancer, 14 189.

231 | P a g e
Cho, K., Ishiwata, T., Uchida, E., Nakazawa, N., Korc, M., Naito, Z. & Tajiri, T. (2007) Enhanced expression of keratinocyte growth factor and its receptor correlates with venous invasion in pancreatic cancer. Am J Pathol, 170 (6): 1964-1974.
Cho, N. L., Redston, M., Zauber, A. G., Carothers, A. M., Hornick, J., Wilton, A., Sontag, S., Nishioka, N., Giardiello, F. M., Saltzman, J. R., Gostout, C., Eagle, C. J., Hawk, E. T. & Bertagnolli, M. M. (2008) Aberrant crypt foci in the adenoma prevention with celecoxib trial. Cancer Prev Res (Phila), 1 (1): 21-31.
Choi, H. J., Hyun, M. S., Jung, G. J., Kim, S. S. & Hong, S. H. (1998) Tumor angiogenesis as a prognostic predictor in colorectal carcinoma with special reference to mode of metastasis and recurrence. Oncology, 55 (6): 575-581.
Choti, M. A. (2009) Controversies in the management of hepatic colorectal metastases. Ann Surg Oncol, 16 (9): 2383-2384.
Christophi, C., Harun, N. & Fifis, T. (2008) Liver regeneration and tumor stimulation--a review of cytokine and angiogenic factors. J Gastrointest Surg, 12 (5): 966-980.
Chu, D. Z., Chansky, K., Alberts, D. S., Meyskens, F. L., Fenoglio-Preiser, C. M., Rivkin, S. E., Mills, G. M., Giguere, J. K., Goodman, G. E., Abbruzzese, J. L. & Lippman, S. M. (2003) Adenoma recurrences after resection of colorectal carcinoma: results from the Southwest Oncology Group 9041 calcium chemoprevention pilot study. Ann Surg Oncol, 10 (8): 870-875.
Chu, D. Z., Giacco, G., Martin, R. G. & Guinee, V. F. (1986) The significance of synchronous carcinoma and polyps in the colon and rectum. Cancer, 57 (3): 445-450.
Chuaqui, R. F., Bonner, R. F., Best, C. J., Gillespie, J. W., Flaig, M. J., Hewitt, S. M., Phillips, J. L., Krizman, D. B., Tangrea, M. A., Ahram, M., Linehan, W. M., Knezevic, V. & Emmert-Buck, M. R. (2002) Post-analysis follow-up and validation of microarray experiments. Nat Genet, 32 Suppl 509-514.
Chung, K. Y., Shia, J., Kemeny, N. E., Shah, M., Schwartz, G. K., Tse, A., Hamilton, A., Pan, D., Schrag, D., Schwartz, L., Klimstra, D. S., Fridman, D., Kelsen, D. P. & Saltz, L. B. (2005) Cetuximab shows activity in colorectal cancer patients with tumors that do not express the epidermal growth factor receptor by immunohistochemistry. J Clin Oncol, 23 (9): 1803-1810.
COLE, J. W. & MCKALEN, A. (1963) STUDIES ON THE MORPHOGENESIS OF ADENOMATOUS POLYPS IN THE HUMAN COLON. Cancer, 16 998-1002.
Coleman, M. P., Forman, D., Bryant, H., Butler, J., Rachet, B., Maringe, C., Nur, U., Tracey, E., Coory, M., Hatcher, J., McGahan, C. E., Turner, D., Marrett, L., Gjerstorff, M. L., Johannesen, T. B., Adolfsson, J., Lambe, M., Lawrence, G., Meechan, D., Morris, E. J., Middleton, R., Steward, J., Richards, M. A. & Group, I. M. W. (2011) Cancer survival in

232 | P a g e
Australia, Canada, Denmark, Norway, Sweden, and the UK, 1995-2007 (the International Cancer Benchmarking Partnership): an analysis of population-based cancer registry data. Lancet, 377 (9760): 127-138.
Colotta, F., Allavena, P., Sica, A., Garlanda, C. & Mantovani, A. (2009) Cancer-related inflammation, the seventh hallmark of cancer: links to genetic instability. Carcinogenesis, 30 (7): 1073-1081.
Connell, W. R., Lennard-Jones, J. E., Williams, C. B., Talbot, I. C., Price, A. B. & Wilkinson, K. H. (1994) Factors affecting the outcome of endoscopic surveillance for cancer in ulcerative colitis. Gastroenterology, 107 (4): 934-944.
Corpet, D. E. & Taché, S. (2002) Most effective colon cancer chemopreventive agents in rats: a systematic review of aberrant crypt foci and tumor data, ranked by potency. Nutr Cancer, 43 (1): 1-21.
Coussens, L. M. & Werb, Z. (2002) Inflammation and cancer. Nature, 420 (6917): 860-867.
Croner, R. S., Foertsch, T., Brueckl, W. M., Guenther, K., Siebenhaar, R., Stremmel, C., Matzel, K. E., Papadopoulos, T., Kirchner, T., Behrens, J., Klein-Hitpass, L., Stuerzl, M., Hohenberger, W. & Reingruber, B. (2005) Common denominator genes that distinguish colorectal carcinoma from normal mucosa. Int J Colorectal Dis, 20 (4): 353-362.
Croner, R. S., Förtsch, T., Brückl, W. M., Rödel, F., Rödel, C., Papadopoulos, T., Brabletz, T., Kirchner, T., Sachs, M., Behrens, J., Klein-Hitpass, L., Stürzl, M., Hohenberger, W. & Lausen, B. (2008) Molecular signature for lymphatic metastasis in colorectal carcinomas. Ann Surg, 247 (5): 803-810.
Crosnier, C., Stamataki, D. & Lewis, J. (2006) Organizing cell renewal in the intestine: stem cells, signals and combinatorial control. Nat Rev Genet, 7 (5): 349-359.
CRUK Cancer Research United Kingdom. [online] Available from: http://www.cancerresearchuk.org/health-professional/cancer-statistics/statistics-by-cancer-type/bowel-cancer (Accessed September 2015).
Cuenca, R. E., Azizkhan, R. G. & Haskill, S. (1992) Characterization of GRO alpha, beta and gamma expression in human colonic tumours: potential significance of cytokine involvement. Surg Oncol, 1 (4): 323-329.
Curtis, H. J. (1965) Formal discussion of: somatic mutations and carcinogenesis. Cancer Res, 25 (8): 1305-1308.
Czechowski, T., Bari, R. P., Stitt, M., Scheible, W. R. & Udvardi, M. K. (2004) Real-time RT-PCR profiling of over 1400 Arabidopsis transcription factors: unprecedented sensitivity reveals novel root- and shoot-specific genes. Plant J, 38 (2): 366-379.

233 | P a g e
Dabelsteen, E., Graem, N., Clausen, H. & Hakomori, S. (1988) Structural variations of blood group A antigens in human normal colon and carcinomas. Cancer Res, 48 (1): 181-187.
Dahiya, R., Lee, C., Haughney, P. C., Chui, R., Ho, R. & Deng, G. (1996) Differential gene expression of transforming growth factors alpha and beta, epidermal growth factor, keratinocyte growth factor, and their receptors in fetal and adult human prostatic tissues and cancer cell lines. Urology, 48 (6): 963-970.
Dai, Y. C., Zhu, X. S., Nan, Q. Z., Chen, Z. X., Xie, J. P., Fu, Y. K., Lin, Y. Y., Lian, Q. N., Sang, Q. F. & Zhan, X. J. (2012) Identification of differential gene expressions in colorectal cancer and polyp by cDNA microarray. World J Gastroenterol, 18 (6): 570-575.
Dakubo, G. D., Jakupciak, J. P., Birch-Machin, M. A. & Parr, R. L. (2007) Clinical implications and utility of field cancerization. Cancer Cell Int, 7 2.
Dallas, P. B., Gottardo, N. G., Firth, M. J., Beesley, A. H., Hoffmann, K., Terry, P. A., Freitas, J. R., Boag, J. M., Cummings, A. J. & Kees, U. R. (2005) Gene expression levels assessed by oligonucleotide microarray analysis and quantitative real-time RT-PCR -- how well do they correlate? BMC Genomics, 6 59.
Davidsen, M. L., Würtz, S., Rømer, M. U., Sørensen, N. M., Johansen, S. K., Christensen, I. J., Larsen, J. K., Offenberg, H., Brünner, N. & Lademann, U. (2006) TIMP-1 gene deficiency increases tumour cell sensitivity to chemotherapy-induced apoptosis. Br J Cancer, 95 (8): 1114-1120.
Davies, H., Bignell, G. R., Cox, C., Stephens, P., Edkins, S., Clegg, S., Teague, J., Woffendin, H., Garnett, M. J., Bottomley, W., Davis, N., Dicks, E., Ewing, R., Floyd, Y., Gray, K., Hall, S., Hawes, R., Hughes, J., Kosmidou, V., Menzies, A., Mould, C., Parker, A., Stevens, C., Watt, S., Hooper, S., Wilson, R., Jayatilake, H., Gusterson, B. A., Cooper, C., Shipley, J., Hargrave, D., Pritchard-Jones, K., Maitland, N., Chenevix-Trench, G., Riggins, G. J., Bigner, D. D., Palmieri, G., Cossu, A., Flanagan, A., Nicholson, A., Ho, J. W., Leung, S. Y., Yuen, S. T., Weber, B. L., Seigler, H. F., Darrow, T. L., Paterson, H., Marais, R., Marshall, C. J., Wooster, R., Stratton, M. R. & Futreal, P. A. (2002) Mutations of the BRAF gene in human cancer. Nature, 417 (6892): 949-954.
Dawson, P. A. & Filipe, M. I. (1976) An ultrastructural and histochemical study of the mucous membrane adjacent to and remote from carcinoma of the colon. Cancer, 37 (5): 2388-2398.
Day DW & BC., M. (1978) The pathogenesis of colorectal cancer. Philadelphia: WB Saunders.
de Gruijl, F. R., van Kranen, H. J. & Mullenders, L. H. (2001) UV-induced DNA damage, repair, mutations and oncogenic pathways in skin cancer. J Photochem Photobiol B, 63 (1-3): 19-27.

234 | P a g e
de Jong, A. E., Morreau, H., Nagengast, F. M., Mathus-Vliegen, E. M., Kleibeuker, J. H., Griffioen, G., Cats, A. & Vasen, H. F. (2005) Prevalence of adenomas among young individuals at average risk for colorectal cancer. Am J Gastroenterol, 100 (1): 139-143.
de la Chapelle, A. (2003) Microsatellite instability. N Engl J Med, 349 (3): 209-210.
De Roock, W., Claes, B., Bernasconi, D., De Schutter, J., Biesmans, B., Fountzilas, G., Kalogeras, K. T., Kotoula, V., Papamichael, D., Laurent-Puig, P., Penault-Llorca, F., Rougier, P., Vincenzi, B., Santini, D., Tonini, G., Cappuzzo, F., Frattini, M., Molinari, F., Saletti, P., De Dosso, S., Martini, M., Bardelli, A., Siena, S., Sartore-Bianchi, A., Tabernero, J., Macarulla, T., Di Fiore, F., Gangloff, A. O., Ciardiello, F., Pfeiffer, P., Qvortrup, C., Hansen, T. P., Van Cutsem, E., Piessevaux, H., Lambrechts, D., Delorenzi, M. & Tejpar, S. (2010) Effects of KRAS, BRAF, NRAS, and PIK3CA mutations on the efficacy of cetuximab plus chemotherapy in chemotherapy-refractory metastatic colorectal cancer: a retrospective consortium analysis. Lancet Oncol, 11 (8): 753-762.
de Visser, K. E., Eichten, A. & Coussens, L. M. (2006) Paradoxical roles of the immune system during cancer development. Nat Rev Cancer, 6 (1): 24-37.
Delattre, O., Olschwang, S., Law, D. J., Melot, T., Remvikos, Y., Salmon, R. J., Sastre, X., Validire, P., Feinberg, A. P. & Thomas, G. (1989) Multiple genetic alterations in distal and proximal colorectal cancer. Lancet, 2 (8659): 353-356.
deLeeuw, R. J., Kost, S. E., Kakal, J. A. & Nelson, B. H. (2012) The prognostic value of FoxP3+ tumor-infiltrating lymphocytes in cancer: a critical review of the literature. Clin Cancer Res, 18 (11): 3022-3029.
Derynck, R., Akhurst, R. J. & Balmain, A. (2001) TGF-beta signaling in tumor suppression and cancer progression. Nat Genet, 29 (2): 117-129.
Desch, C. E., Benson, A. B., Somerfield, M. R., Flynn, P. J., Krause, C., Loprinzi, C. L., Minsky, B. D., Pfister, D. G., Virgo, K. S., Petrelli, N. J. & Oncology, A. S. o. C. (2005) Colorectal cancer surveillance: 2005 update of an American Society of Clinical Oncology practice guideline. J Clin Oncol, 23 (33): 8512-8519.
Desnoyers, L. R., Pai, R., Ferrando, R. E., Hötzel, K., Le, T., Ross, J., Carano, R., D'Souza, A., Qing, J., Mohtashemi, I., Ashkenazi, A. & French, D. M. (2008) Targeting FGF19 inhibits tumor growth in colon cancer xenograft and FGF19 transgenic hepatocellular carcinoma models. Oncogene, 27 (1): 85-97.
Despotović, S. Z., Milićević, N. M., Milosević, D. P., Despotović, N., Erceg, P., Bojić, B., Bojić, D., Svorcan, P., Mihajlović, G., Dorđević, J., Lalić, I. M. & Milićević, Z. (2014) Morphometric study of uninvolved rectal mucosa 10 cm and 20 cm away from the malignant tumor. Histol Histopathol, 29 (2): 229-234.

235 | P a g e
Di Carlo, E., Forni, G., Lollini, P., Colombo, M. P., Modesti, A. & Musiani, P. (2001a) The intriguing role of polymorphonuclear neutrophils in antitumor reactions. Blood, 97 (2): 339-345.
di Carlo, E., Iezzi, M., Pannellini, T., Zaccardi, F., Modesti, A., Forni, G. & Musiani, P. (2001b) Neutrophils in anti-cancer immunological strategies: old players in new games. J Hematother Stem Cell Res, 10 (6): 739-748.
Diez de Medina, S. G., Chopin, D., El Marjou, A., Delouvée, A., LaRochelle, W. J., Hoznek, A., Abbou, C., Aaronson, S. A., Thiery, J. P. & Radvanyi, F. (1997) Decreased expression of keratinocyte growth factor receptor in a subset of human transitional cell bladder carcinomas. Oncogene, 14 (3): 323-330.
Dirix, L. Y., Vermeulen, P. B., Hubens, G., Benoy, I., Martin, M., De Pooter, C. & Van Oosterom, A. T. (1996) Serum basic fibroblast growth factor and vascular endothelial growth factor and tumour growth kinetics in advanced colorectal cancer. Ann Oncol, 7 (8): 843-848.
Doll, D., Keller, L., Maak, M., Boulesteix, A. L., Siewert, J. R., Holzmann, B. & Janssen, K. P. (2010) Differential expression of the chemokines GRO-2, GRO-3, and interleukin-8 in colon cancer and their impact on metastatic disease and survival. Int J Colorectal Dis, 25 (5): 573-581.
Domino, S. E., Karnak, D. M. & Hurd, E. A. (2007) Cell surface fucosylation does not affect development of colon tumors in mice with germline Smad3 mutation. Tumour Biol, 28 (2): 77-83.
Donato, R. (2001) S100: a multigenic family of calcium-modulated proteins of the EF-hand type with intracellular and extracellular functional roles. Int J Biochem Cell Biol, 33 (7): 637-668.
Dong, G., Chen, Z., Li, Z. Y., Yeh, N. T., Bancroft, C. C. & Van Waes, C. (2001) Hepatocyte growth factor/scatter factor-induced activation of MEK and PI3K signal pathways contributes to expression of proangiogenic cytokines interleukin-8 and vascular endothelial growth factor in head and neck squamous cell carcinoma. Cancer Res, 61 (15): 5911-5918.
Dong, L., Wang, F., Yin, X., Chen, L., Li, G., Lin, F., Ni, W., Wu, J., Jin, R. & Jiang, L. (2014) Overexpression of S100P promotes colorectal cancer metastasis and decreases chemosensitivity to 5-FU in vitro. Mol Cell Biochem, 389 (1-2): 257-264.
Dowen, S. E., Crnogorac-Jurcevic, T., Gangeswaran, R., Hansen, M., Eloranta, J. J., Bhakta, V., Brentnall, T. A., Lüttges, J., Klöppel, G. & Lemoine, N. R. (2005) Expression of S100P and its novel binding partner S100PBPR in early pancreatic cancer. Am J Pathol, 166 (1): 81-92.
DUKES, C. E. (1950) The relation of histology to spread in intestinal cancer. Br J Cancer, 4 (1): 59-62.

236 | P a g e
Dykes, S. L., Qui, H., Rothenberger, D. A. & García-Aguilar, J. (2003) Evidence of a preferred molecular pathway in patients with synchronous colorectal cancer. Cancer, 98 (1): 48-54.
Eaden, J. A., Abrams, K. R. & Mayberry, J. F. (2001) The risk of colorectal cancer in ulcerative colitis: a meta-analysis. Gut, 48 (4): 526-535.
Edge SB, Byrd DR, Compton CC, Fritz AG, Green FL & A., T. (2010) AJCC colorectal cancer staging manual (7th Edition). New York, NY.: Springer.
Eide, T. J. (1986) Risk of colorectal cancer in adenoma-bearing individuals within a defined population. Int J Cancer, 38 (2): 173-176.
Eisinger, A. L., Nadauld, L. D., Shelton, D. N., Peterson, P. W., Phelps, R. A., Chidester, S., Stafforini, D. M., Prescott, S. M. & Jones, D. A. (2006) The adenomatous polyposis coli tumor suppressor gene regulates expression of cyclooxygenase-2 by a mechanism that involves retinoic acid. J Biol Chem, 281 (29): 20474-20482.
Eisinger, A. L., Prescott, S. M., Jones, D. A. & Stafforini, D. M. (2007) The role of cyclooxygenase-2 and prostaglandins in colon cancer. Prostaglandins Other Lipid Mediat, 82 (1-4): 147-154.
Elagoz, S., Egilmez, R., Koyuncu, A., Muslehiddinoglu, A. & Arici, S. (2006) The intratumoral microvessel density and expression of bFGF and nm23-H1 in colorectal cancer. Pathol Oncol Res, 12 (1): 21-27.
Elsamman, E., Fukumori, T., Kasai, T., Nakatsuji, H., Nishitani, M. A., Toida, K., Ali, N. & Kanayama, H. O. (2006) Prostate stem cell antigen predicts tumour recurrence in superficial transitional cell carcinoma of the urinary bladder. BJU Int, 97 (6): 1202-1207.
Escobar, G., Gentner, B., Naldini, L. & Mazzieri, R. (2014) Engineered tumor-infiltrating macrophages as gene delivery vehicles for interferon-α activates immunity and inhibits breast cancer progression. Oncoimmunology, 3 e28696.
Eshleman, J. R., Casey, G., Kochera, M. E., Sedwick, W. D., Swinler, S. E., Veigl, M. L., Willson, J. K., Schwartz, S. & Markowitz, S. D. (1998) Chromosome number and structure both are markedly stable in RER colorectal cancers and are not destabilized by mutation of p53. Oncogene, 17 (6): 719-725.
Eswarakumar, V. P., Lax, I. & Schlessinger, J. (2005) Cellular signaling by fibroblast growth factor receptors. Cytokine Growth Factor Rev, 16 (2): 139-149.
Etienne, W., Meyer, M. H., Peppers, J. & Meyer, R. A. (2004) Comparison of mRNA gene expression by RT-PCR and DNA microarray. Biotechniques, 36 (4): 618-620, 622, 624-616.

237 | P a g e
Evans, D. G., Howard, E., Giblin, C., Clancy, T., Spencer, H., Huson, S. M. & Lalloo, F. (2010) Birth incidence and prevalence of tumor-prone syndromes: estimates from a UK family genetic register service. Am J Med Genet A, 152A (2): 327-332.
Ezzat, S., Zheng, L., Zhu, X. F., Wu, G. E. & Asa, S. L. (2002) Targeted expression of a human pituitary tumor-derived isoform of FGF receptor-4 recapitulates pituitary tumorigenesis. J Clin Invest, 109 (1): 69-78.
Facista, A., Nguyen, H., Lewis, C., Prasad, A. R., Ramsey, L., Zaitlin, B., Nfonsam, V., Krouse, R. S., Bernstein, H., Payne, C. M., Stern, S., Oatman, N., Banerjee, B. & Bernstein, C. (2012) Deficient expression of DNA repair enzymes in early progression to sporadic colon cancer. Genome Integr, 3 (1): 3.
Farrell, C. L., Bready, J. V., Rex, K. L., Chen, J. N., DiPalma, C. R., Whitcomb, K. L., Yin, S., Hill, D. C., Wiemann, B., Starnes, C. O., Havill, A. M., Lu, Z. N., Aukerman, S. L., Pierce, G. F., Thomason, A., Potten, C. S., Ulich, T. R. & Lacey, D. L. (1998) Keratinocyte growth factor protects mice from chemotherapy and radiation-induced gastrointestinal injury and mortality. Cancer Res, 58 (5): 933-939.
Fearnhead, N. S., Wilding, J. L. & Bodmer, W. F. (2002) Genetics of colorectal cancer: hereditary aspects and overview of colorectal tumorigenesis. Br Med Bull, 64 27-43.
Fearon, E. R., Cho, K. R., Nigro, J. M., Kern, S. E., Simons, J. W., Ruppert, J. M., Hamilton, S. R., Preisinger, A. C., Thomas, G. & Kinzler, K. W. (1990) Identification of a chromosome 18q gene that is altered in colorectal cancers. Science, 247 (4938): 49-56.
Ferlay J, Soerjomataram I, M, E. & al, e. (2013) Cancer incidence and mortality worldwide: IARC CancerBase No. 11. Lyon, France: International Agency for Research on Cancer 2013. [online] Available from: http://globocan.iarc.fr (Accessed
Ferlay, J., Steliarova-Foucher, E., Lortet-Tieulent, J., Rosso, S., Coebergh, J. W., Comber, H., Forman, D. & Bray, F. (2013) Cancer incidence and mortality patterns in Europe: estimates for 40 countries in 2012. Eur J Cancer, 49 (6): 1374-1403.
Ferreira, L. M., Hebrant, A. & Dumont, J. E. (2012) Metabolic reprogramming of the tumor. Oncogene, 31 (36): 3999-4011.
Fevr, T., Robine, S., Louvard, D. & Huelsken, J. (2007) Wnt/beta-catenin is essential for intestinal homeostasis and maintenance of intestinal stem cells. Mol Cell Biol, 27 (21): 7551-7559.
Filipe, M. I. & Branfoot, A. C. (1974) Abnormal patterns of mucus secretion in apparently normal mucosa of large intestine with carcinoma. Cancer, 34 (2): 282-290.

238 | P a g e
Finch, P. W. & Rubin, J. S. (2004) Keratinocyte growth factor/fibroblast growth factor 7, a homeostatic factor with therapeutic potential for epithelial protection and repair. Adv Cancer Res, 91 69-136.
Finch, P. W., Rubin, J. S., Miki, T., Ron, D. & Aaronson, S. A. (1989) Human KGF is FGF-related with properties of a paracrine effector of epithelial cell growth. Science, 245 (4919): 752-755.
Firestein, G. S. & Pisetsky, D. S. (2002) DNA microarrays: boundless technology or bound by technology? Guidelines for studies using microarray technology. Arthritis Rheum, 46 (4): 859-861.
Fishel, R., Lescoe, M. K., Rao, M. R., Copeland, N. G., Jenkins, N. A., Garber, J., Kane, M. & Kolodner, R. (1993) The human mutator gene homolog MSH2 and its association with hereditary nonpolyposis colon cancer. Cell, 75 (5): 1027-1038.
Fishel, R., Lescoe, M. K., Rao, M. R., Copeland, N. G., Jenkins, N. A., Garber, J., Kane, M. & Kolodner, R. (1994) The human mutator gene homolog MSH2 and its association with hereditary nonpolyposis colon cancer. Cell, 77 (1): 1 p following 166.
Fodde, R. & Smits, R. (2002) Cancer biology. A matter of dosage. Science, 298 (5594): 761-763.
Fon Tacer, K., Bookout, A. L., Ding, X., Kurosu, H., John, G. B., Wang, L., Goetz, R., Mohammadi, M., Kuro-o, M., Mangelsdorf, D. J. & Kliewer, S. A. (2010) Research resource: Comprehensive expression atlas of the fibroblast growth factor system in adult mouse. Mol Endocrinol, 24 (10): 2050-2064.
Fong, Y., Fortner, J., Sun, R. L., Brennan, M. F. & Blumgart, L. H. (1999) Clinical score for predicting recurrence after hepatic resection for metastatic colorectal cancer: analysis of 1001 consecutive cases. Ann Surg, 230 (3): 309-318; discussion 318-321.
Frederiksen, C. M., Knudsen, S., Laurberg, S. & Ørntoft, T. F. (2003) Classification of Dukes' B and C colorectal cancers using expression arrays. J Cancer Res Clin Oncol, 129 (5): 263-271.
French, D. M., Lin, B. C., Wang, M., Adams, C., Shek, T., Hötzel, K., Bolon, B., Ferrando, R., Blackmore, C., Schroeder, K., Rodriguez, L. A., Hristopoulos, M., Venook, R., Ashkenazi, A. & Desnoyers, L. R. (2012) Targeting FGFR4 inhibits hepatocellular carcinoma in preclinical mouse models. PLoS One, 7 (5): e36713.
Fridlender, Z. G., Sun, J., Kim, S., Kapoor, V., Cheng, G., Ling, L., Worthen, G. S. & Albelda, S. M. (2009) Polarization of tumor-associated neutrophil phenotype by TGF-beta: "N1" versus "N2" TAN. Cancer Cell, 16 (3): 183-194.

239 | P a g e
Friederichs, J., Rosenberg, R., Mages, J., Janssen, K. P., Maeckl, C., Nekarda, H., Holzmann, B. & Siewert, J. R. (2005) Gene expression profiles of different clinical stages of colorectal carcinoma: toward a molecular genetic understanding of tumor progression. Int J Colorectal Dis, 20 (5): 391-402.
Friedman, S., Rubin, P. H., Bodian, C., Harpaz, N. & Present, D. H. (2008) Screening and surveillance colonoscopy in chronic Crohn's colitis: results of a surveillance program spanning 25 years. Clin Gastroenterol Hepatol, 6 (9): 993-998; quiz 953-994.
Frullanti, E., Berking, C., Harbeck, N., Jézéquel, P., Haugen, A., Mawrin, C., Parise, O., Sasaki, H., Tsuchiya, N. & Dragani, T. A. (2011) Meta and pooled analyses of FGFR4 Gly388Arg polymorphism as a cancer prognostic factor. Eur J Cancer Prev, 20 (4): 340-347.
Fuentes, M. K., Nigavekar, S. S., Arumugam, T., Logsdon, C. D., Schmidt, A. M., Park, J. C. & Huang, E. H. (2007) RAGE activation by S100P in colon cancer stimulates growth, migration, and cell signaling pathways. Dis Colon Rectum, 50 (8): 1230-1240.
Fujitani, N., Liu, Y., Toda, S., Shirouzu, K., Okamura, T. & Kimura, H. (2000) Expression of H type 1 antigen of ABO histo-blood group in normal colon and aberrant expressions of H type 2 and H type 3/4 antigens in colon cancer. Glycoconj J, 17 (5): 331-338.
Galamb, O., Sipos, F., Dinya, E., Spisak, S., Tulassay, Z. & Molnar, B. (2006) mRNA expression, functional profiling and multivariate classification of colon biopsy specimen by cDNA overall glass microarray. World J Gastroenterol, 12 (43): 6998-7006.
Galandiuk, S., Rodriguez-Justo, M., Jeffery, R., Nicholson, A. M., Cheng, Y., Oukrif, D., Elia, G., Leedham, S. J., McDonald, S. A., Wright, N. A. & Graham, T. A. (2012) Field cancerization in the intestinal epithelium of patients with Crohn's ileocolitis. Gastroenterology, 142 (4): 855-864.e858.
Galon, J., Costes, A., Sanchez-Cabo, F., Kirilovsky, A., Mlecnik, B., Lagorce-Pagès, C., Tosolini, M., Camus, M., Berger, A., Wind, P., Zinzindohoué, F., Bruneval, P., Cugnenc, P. H., Trajanoski, Z., Fridman, W. H. & Pagès, F. (2006) Type, density, and location of immune cells within human colorectal tumors predict clinical outcome. Science, 313 (5795): 1960-1964.
Gartside, M. G., Chen, H., Ibrahimi, O. A., Byron, S. A., Curtis, A. V., Wellens, C. L., Bengston, A., Yudt, L. M., Eliseenkova, A. V., Ma, J., Curtin, J. A., Hyder, P., Harper, U. L., Riedesel, E., Mann, G. J., Trent, J. M., Bastian, B. C., Meltzer, P. S., Mohammadi, M. & Pollock, P. M. (2009) Loss-of-function fibroblast growth factor receptor-2 mutations in melanoma. Mol Cancer Res, 7 (1): 41-54.
Gatenby, R. A. & Gillies, R. J. (2004) Why do cancers have high aerobic glycolysis? Nat Rev Cancer, 4 (11): 891-899.
Gaude, E. & Frezza, C. (2014) Defects in mitochondrial metabolism and cancer. Cancer Metab, 2 10.

240 | P a g e
Gendler, S. J., Burchell, J. M., Duhig, T., Lamport, D., White, R., Parker, M. & Taylor-Papadimitriou, J. (1987) Cloning of partial cDNA encoding differentiation and tumor-associated mucin glycoproteins expressed by human mammary epithelium. Proc Natl Acad Sci U S A, 84 (17): 6060-6064.
Gervaz, P., Bucher, P., Neyroud-Caspar, I., Soravia, C. & Morel, P. (2005) Proximal location of colon cancer is a risk factor for development of metachronous colorectal cancer: a population-based study. Dis Colon Rectum, 48 (2): 227-232.
Gillen, C. D., Walmsley, R. S., Prior, P., Andrews, H. A. & Allan, R. N. (1994) Ulcerative colitis and Crohn's disease: a comparison of the colorectal cancer risk in extensive colitis. Gut, 35 (11): 1590-1592.
Goetz, R., Beenken, A., Ibrahimi, O. A., Kalinina, J., Olsen, S. K., Eliseenkova, A. V., Xu, C., Neubert, T. A., Zhang, F., Linhardt, R. J., Yu, X., White, K. E., Inagaki, T., Kliewer, S. A., Yamamoto, M., Kurosu, H., Ogawa, Y., Kuro-o, M., Lanske, B., Razzaque, M. S. & Mohammadi, M. (2007) Molecular insights into the klotho-dependent, endocrine mode of action of fibroblast growth factor 19 subfamily members. Mol Cell Biol, 27 (9): 3417-3428.
Gomes, A. J., Roy, H. K., Turzhitsky, V., Kim, Y., Rogers, J. D., Ruderman, S., Stoyneva, V., Goldberg, M. J., Bianchi, L. K., Yen, E., Kromine, A., Jameel, M. & Backman, V. (2009) Rectal mucosal microvascular blood supply increase is associated with colonic neoplasia. Clin Cancer Res, 15 (9): 3110-3117.
Gondal, G., Grotmol, T., Hofstad, B., Bretthauer, M., Eide, T. J. & Hoff, G. (2003) The Norwegian Colorectal Cancer Prevention (NORCCAP) screening study: baseline findings and implementations for clinical work-up in age groups 50-64 years. Scand J Gastroenterol, 38 (6): 635-642.
Grade, M., Hörmann, P., Becker, S., Hummon, A. B., Wangsa, D., Varma, S., Simon, R., Liersch, T., Becker, H., Difilippantonio, M. J., Ghadimi, B. M. & Ried, T. (2007) Gene expression profiling reveals a massive, aneuploidy-dependent transcriptional deregulation and distinct differences between lymph node-negative and lymph node-positive colon carcinomas. Cancer Res, 67 (1): 41-56.
Grady, W. M. & Carethers, J. M. (2008) Genomic and epigenetic instability in colorectal cancer pathogenesis. Gastroenterology, 135 (4): 1079-1099.
Graham, T. A., McDonald, S. A. & Wright, N. A. (2011) Field cancerization in the GI tract. Future Oncol, 7 (8): 981-993.
Gray, R. G., Quirke, P., Handley, K., Lopatin, M., Magill, L., Baehner, F. L., Beaumont, C., Clark-Langone, K. M., Yoshizawa, C. N., Lee, M., Watson, D., Shak, S. & Kerr, D. J. (2011) Validation study of a quantitative multigene reverse transcriptase-polymerase chain

241 | P a g e
reaction assay for assessment of recurrence risk in patients with stage II colon cancer. J Clin Oncol, 29 (35): 4611-4619.
Greaves, M. & Maley, C. C. (2012) Clonal evolution in cancer. Nature, 481 (7381): 306-313.
Grepmeier, U., Dietmaier, W., Merk, J., Wild, P. J., Obermann, E. C., Pfeifer, M., Hofstaedter, F., Hartmann, A. & Woenckhaus, M. (2005) Deletions at chromosome 2q and 12p are early and frequent molecular alterations in bronchial epithelium and NSCLC of long-term smokers. Int J Oncol, 27 (2): 481-488.
Groene, J., Mansmann, U., Meister, R., Staub, E., Roepcke, S., Heinze, M., Klaman, I., Brümmendorf, T., Hermann, K., Loddenkemper, C., Pilarsky, C., Mann, B., Adams, H. P., Buhr, H. J. & Rosenthal, A. (2006) Transcriptional census of 36 microdissected colorectal cancers yields a gene signature to distinguish UICC II and III. Int J Cancer, 119 (8): 1829-1836.
Grover, S., Kastrinos, F., Steyerberg, E. W., Cook, E. F., Dewanwala, A., Burbidge, L. A., Wenstrup, R. J. & Syngal, S. (2012) Prevalence and phenotypes of APC and MUTYH mutations in patients with multiple colorectal adenomas. JAMA, 308 (5): 485-492.
Gu, Z., Thomas, G., Yamashiro, J., Shintaku, I. P., Dorey, F., Raitano, A., Witte, O. N., Said, J. W., Loda, M. & Reiter, R. E. (2000) Prostate stem cell antigen (PSCA) expression increases with high gleason score, advanced stage and bone metastasis in prostate cancer. Oncogene, 19 (10): 1288-1296.
Guerreiro Da Silva, I. D., Hu, Y. F., Russo, I. H., Ao, X., Salicioni, A. M., Yang, X. & Russo, J. (2000) S100P calcium-binding protein overexpression is associated with immortalization of human breast epithelial cells in vitro and early stages of breast cancer development in vivo. Int J Oncol, 16 (2): 231-240.
Günther, K., Leier, J., Henning, G., Dimmler, A., Weissbach, R., Hohenberger, W. & Förster, R. (2005) Prediction of lymph node metastasis in colorectal carcinoma by expressionof chemokine receptor CCR7. Int J Cancer, 116 (5): 726-733.
Habermann, J. K., Paulsen, U., Roblick, U. J., Upender, M. B., McShane, L. M., Korn, E. L., Wangsa, D., Krüger, S., Duchrow, M., Bruch, H. P., Auer, G. & Ried, T. (2007) Stage-specific alterations of the genome, transcriptome, and proteome during colorectal carcinogenesis. Genes Chromosomes Cancer, 46 (1): 10-26.
Haglund, K., Rusten, T. E. & Stenmark, H. (2007) Aberrant receptor signaling and trafficking as mechanisms in oncogenesis. Crit Rev Oncog, 13 (1): 39-74.
Hahn, W. C. & Weinberg, R. A. (2002) Modelling the molecular circuitry of cancer. Nat Rev Cancer, 2 (5): 331-341.

242 | P a g e
Hakomori, S. (1989) Aberrant glycosylation in tumors and tumor-associated carbohydrate antigens. Adv Cancer Res, 52 257-331.
Half, E., Bercovich, D. & Rozen, P. (2009) Familial adenomatous polyposis. Orphanet J Rare Dis, 4 22.
Hampel, H., Frankel, W. L., Martin, E., Arnold, M., Khanduja, K., Kuebler, P., Clendenning, M., Sotamaa, K., Prior, T., Westman, J. A., Panescu, J., Fix, D., Lockman, J., LaJeunesse, J., Comeras, I. & de la Chapelle, A. (2008) Feasibility of screening for Lynch syndrome among patients with colorectal cancer. J Clin Oncol, 26 (35): 5783-5788.
Hanahan, D. & Folkman, J. (1996) Patterns and emerging mechanisms of the angiogenic switch during tumorigenesis. Cell, 86 (3): 353-364.
Hanahan, D. & Weinberg, R. A. (2000) The hallmarks of cancer. Cell, 100 (1): 57-70.
Hanahan, D. & Weinberg, R. A. (2011) Hallmarks of cancer: the next generation. Cell, 144 (5): 646-674.
Hanna-Morris, A., Badvie, S., Cohen, P., McCullough, T., Andreyev, H. J. & Allen-Mersh, T. G. (2009) Minichromosome maintenance protein 2 (MCM2) is a stronger discriminator of increased proliferation in mucosa adjacent to colorectal cancer than Ki-67. J Clin Pathol, 62 (4): 325-330.
Hao, C. Y., Moore, D. H., Chiu, Y. S., Wong, P., Bennington, J. L., Smith, A. P., Chen, L. C. & Lee, N. M. (2005) Altered gene expression in normal colonic mucosa of individuals with polyps of the colon. Dis Colon Rectum, 48 (12): 2329-2335.
Harriss, D. J., Atkinson, G., Batterham, A., George, K., Cable, N. T., Reilly, T., Haboubi, N., Renehan, A. G. & Colorectal Cancer, L., E.ercise And Research Group (2009a) Lifestyle factors and colorectal cancer risk (2): a systematic review and meta-analysis of associations with leisure-time physical activity. Colorectal Dis, 11 (7): 689-701.
Harriss, D. J., Atkinson, G., George, K., Cable, N. T., Reilly, T., Haboubi, N., Zwahlen, M., Egger, M., Renehan, A. G. & group, C.-C. (2009b) Lifestyle factors and colorectal cancer risk (1): systematic review and meta-analysis of associations with body mass index. Colorectal Dis, 11 (6): 547-563.
Hashimoto, Y., Skacel, M. & Adams, J. C. (2008) Association of loss of epithelial syndecan-1 with stage and local metastasis of colorectal adenocarcinomas: an immunohistochemical study of clinically annotated tumors. BMC Cancer, 8 185.
Haugsten, E. M., Sørensen, V., Brech, A., Olsnes, S. & Wesche, J. (2005) Different intracellular trafficking of FGF1 endocytosed by the four homologous FGF receptors. J Cell Sci, 118 (Pt 17): 3869-3881.

243 | P a g e
Hawkins, N. J., Gorman, P., Tomlinson, I. P., Bullpitt, P. & Ward, R. L. (2000) Colorectal carcinomas arising in the hyperplastic polyposis syndrome progress through the chromosomal instability pathway. Am J Pathol, 157 (2): 385-392.
Hawthorn, L., Lan, L. & Mojica, W. (2014) Evidence for field effect cancerization in colorectal cancer. Genomics, 103 (2-3): 211-221.
Heald, R. J. & Bussey, H. J. (1975) Clinical experiences at St. Mark's Hospital with multiple synchronous cancers of the colon and rectum. Dis Colon Rectum, 18 (1): 6-10.
Heinzle, C., Gsur, A., Hunjadi, M., Erdem, Z., Gauglhofer, C., Stättner, S., Karner, J., Klimpfinger, M., Wrba, F., Reti, A., Hegedus, B., Baierl, A., Grasl-Kraupp, B., Holzmann, K., Grusch, M., Berger, W. & Marian, B. (2012) Differential effects of polymorphic alleles of FGF receptor 4 on colon cancer growth and metastasis. Cancer Res, 72 (22): 5767-5777.
Hendriks, Y. M., Wagner, A., Morreau, H., Menko, F., Stormorken, A., Quehenberger, F., Sandkuijl, L., Møller, P., Genuardi, M., Van Houwelingen, H., Tops, C., Van Puijenbroek, M., Verkuijlen, P., Kenter, G., Van Mil, A., Meijers-Heijboer, H., Tan, G. B., Breuning, M. H., Fodde, R., Wijnen, J. T., Bröcker-Vriends, A. H. & Vasen, H. (2004) Cancer risk in hereditary nonpolyposis colorectal cancer due to MSH6 mutations: impact on counseling and surveillance. Gastroenterology, 127 (1): 17-25.
Henry, L. R., Lee, H. O., Lee, J. S., Klein-Szanto, A., Watts, P., Ross, E. A., Chen, W. T. & Cheng, J. D. (2007) Clinical implications of fibroblast activation protein in patients with colon cancer. Clin Cancer Res, 13 (6): 1736-1741.
Hewitson, P., Glasziou, P., Irwig, L., Towler, B. & Watson, E. (2007) Screening for colorectal cancer using the faecal occult blood test, Hemoccult. Cochrane Database Syst Rev, (1): CD001216.
Hewitson, P., Glasziou, P., Watson, E., Towler, B. & Irwig, L. (2008) Cochrane systematic review of colorectal cancer screening using the fecal occult blood test (hemoccult): an update. Am J Gastroenterol, 103 (6): 1541-1549.
Hille, A., Grüger, S., Christiansen, H., Wolff, H. A., Volkmer, B., Lehmann, J., Dörr, W. & Rave-Fränk, M. (2010) Effect of tumour-cell-derived or recombinant keratinocyte growth factor (KGF) on proliferation and radioresponse of human epithelial tumour cells (HNSCC) and normal keratinocytes in vitro. Radiat Environ Biophys, 49 (2): 261-270.
Holt, J. A., Luo, G., Billin, A. N., Bisi, J., McNeill, Y. Y., Kozarsky, K. F., Donahee, M., Wang, D. Y., Mansfield, T. A., Kliewer, S. A., Goodwin, B. & Jones, S. A. (2003) Definition of a novel growth factor-dependent signal cascade for the suppression of bile acid biosynthesis. Genes Dev, 17 (13): 1581-1591.

244 | P a g e
Hou, Z. & Matherly, L. H. (2014) Biology of the major facilitative folate transporters SLC19A1 and SLC46A1. Curr Top Membr, 73 175-204.
Housley, R. M., Morris, C. F., Boyle, W., Ring, B., Biltz, R., Tarpley, J. E., Aukerman, S. L., Devine, P. L., Whitehead, R. H. & Pierce, G. F. (1994) Keratinocyte growth factor induces proliferation of hepatocytes and epithelial cells throughout the rat gastrointestinal tract. J Clin Invest, 94 (5): 1764-1777.
Hoy, N. Y., Metcalfe, P. & Kiddoo, D. A. (2013) Outcomes following fecal continence procedures in patients with neurogenic bowel dysfunction. J Urol, 189 (6): 2293-2297.
Huang, C. S., Yang, S. H., Lin, C. C., Lan, Y. T., Chang, S. C., Wang, H. S., Chen, W. S., Lin, T. C., Lin, J. K. & Jiang, J. K. (2015) Synchronous and metachronous colorectal cancers: distinct disease entities or different disease courses? Hepatogastroenterology, 62 (138): 286-290.
Huang, d. W., Sherman, B. T. & Lempicki, R. A. (2009a) Systematic and integrative analysis of large gene lists using DAVID bioinformatics resources. Nat Protoc, 4 (1): 44-57.
Huang, K., Yuan, R., Wang, K., Hu, J., Huang, Z., Yan, C., Shen, W. & Shao, J. (2014) Overexpression of HOXB9 promotes metastasis and indicates poor prognosis in colon cancer. Chin J Cancer Res, 26 (1): 72-80.
Huang, X., Yang, C., Jin, C., Luo, Y., Wang, F. & McKeehan, W. L. (2009b) Resident hepatocyte fibroblast growth factor receptor 4 limits hepatocarcinogenesis. Mol Carcinog, 48 (6): 553-562.
Iacopetta, B. (2003) TP53 mutation in colorectal cancer. Hum Mutat, 21 (3): 271-276.
Iida, S., Katoh, O., Tokunaga, A. & Terada, M. (1994) Expression of fibroblast growth factor gene family and its receptor gene family in the human upper gastrointestinal tract. Biochem Biophys Res Commun, 199 (3): 1113-1119.
Ikehara, Y., Nishihara, S., Yasutomi, H., Kitamura, T., Matsuo, K., Shimizu, N., Inada, K., Kodera, Y., Yamamura, Y., Narimatsu, H., Hamajima, N. & Tatematsu, M. (2001) Polymorphisms of two fucosyltransferase genes (Lewis and Secretor genes) involving type I Lewis antigens are associated with the presence of anti-Helicobacter pylori IgG antibody. Cancer Epidemiol Biomarkers Prev, 10 (9): 971-977.
Imai, Y., Yamagishi, H., Fukuda, K., Ono, Y., Inoue, T. & Ueda, Y. (2013) Differential mucin phenotypes and their significance in a variation of colorectal carcinoma. World J Gastroenterol, 19 (25): 3957-3968.
Imperiale, T. F., Ransohoff, D. F., Itzkowitz, S. H., Levin, T. R., Lavin, P., Lidgard, G. P., Ahlquist, D. A. & Berger, B. M. (2014) Multitarget stool DNA testing for colorectal-cancer screening. N Engl J Med, 370 (14): 1287-1297.

245 | P a g e
Imperiale, T. F., Wagner, D. R., Lin, C. Y., Larkin, G. N., Rogge, J. D. & Ransohoff, D. F. (2002) Results of screening colonoscopy among persons 40 to 49 years of age. N Engl J Med, 346 (23): 1781-1785.
Irizarry, R. A., Warren, D., Spencer, F., Kim, I. F., Biswal, S., Frank, B. C., Gabrielson, E., Garcia, J. G., Geoghegan, J., Germino, G., Griffin, C., Hilmer, S. C., Hoffman, E., Jedlicka, A. E., Kawasaki, E., Martínez-Murillo, F., Morsberger, L., Lee, H., Petersen, D., Quackenbush, J., Scott, A., Wilson, M., Yang, Y., Ye, S. Q. & Yu, W. (2005) Multiple-laboratory comparison of microarray platforms. Nat Methods, 2 (5): 345-350.
Ishiguro, K., Yoshida, T., Yagishita, H., Numata, Y. & Okayasu, T. (2006) Epithelial and stromal genetic instability contributes to genesis of colorectal adenomas. Gut, 55 (5): 695-702.
Issa, J. P. (2004) CpG island methylator phenotype in cancer. Nat Rev Cancer, 4 (12): 988-993.
Itoh, N. & Ornitz, D. M. (2011) Fibroblast growth factors: from molecular evolution to roles in development, metabolism and disease. J Biochem, 149 (2): 121-130.
Jaakkola, S., Salmikangas, P., Nylund, S., Partanen, J., Armstrong, E., Pyrhönen, S., Lehtovirta, P. & Nevanlinna, H. (1993) Amplification of fgfr4 gene in human breast and gynecological cancers. Int J Cancer, 54 (3): 378-382.
Jang, J. H., Shin, K. H. & Park, J. G. (2001) Mutations in fibroblast growth factor receptor 2 and fibroblast growth factor receptor 3 genes associated with human gastric and colorectal cancers. Cancer Res, 61 (9): 3541-3543.
Jass, J. R. (2001) Hyperplastic polyps of the colorectum-innocent or guilty? Dis Colon Rectum, 44 (2): 163-166.
Jass, J. R. (2007) Classification of colorectal cancer based on correlation of clinical, morphological and molecular features. Histopathology, 50 (1): 113-130.
Jass, J. R., Iino, H., Ruszkiewicz, A., Painter, D., Solomon, M. J., Koorey, D. J., Cohn, D., Furlong, K. L., Walsh, M. D., Palazzo, J., Edmonston, T. B., Fishel, R., Young, J. & Leggett, B. A. (2000) Neoplastic progression occurs through mutator pathways in hyperplastic polyposis of the colorectum. Gut, 47 (1): 43-49.
Jayson, G. C., Vives, C., Paraskeva, C., Schofield, K., Coutts, J., Fleetwood, A. & Gallagher, J. T. (1999) Coordinated modulation of the fibroblast growth factor dual receptor mechanism during transformation from human colon adenoma to carcinoma. Int J Cancer, 82 (2): 298-304.

246 | P a g e
Jedinak, A., Dudhgaonkar, S. & Sliva, D. (2010) Activated macrophages induce metastatic behavior of colon cancer cells. Immunobiology, 215 (3): 242-249.
Jeevaratnam, P., Cottier, D. S., Browett, P. J., Van De Water, N. S., Pokos, V. & Jass, J. R. (1996) Familial giant hyperplastic polyposis predisposing to colorectal cancer: a new hereditary bowel cancer syndrome. J Pathol, 179 (1): 20-25.
Jeffery, M., Hickey, B. E. & Hider, P. N. (2007) Follow-up strategies for patients treated for non-metastatic colorectal cancer. Cochrane Database Syst Rev, (1): CD002200.
Jen, J., Kim, H., Piantadosi, S., Liu, Z. F., Levitt, R. C., Sistonen, P., Kinzler, K. W., Vogelstein, B. & Hamilton, S. R. (1994) Allelic loss of chromosome 18q and prognosis in colorectal cancer. N Engl J Med, 331 (4): 213-221.
Jensen, P., Krogsgaard, M. R. & Christiansen, J. (1996) Prognostic model for patients treated for colorectal adenomas with regard to development of recurrent adenomas and carcinoma. Eur J Surg, 162 (3): 229-234; discussion 235.
Jiang, L., Lai, Y. K., Zhang, J., Wang, H., Lin, M. C., He, M. L. & Kung, H. F. (2011) Targeting S100P inhibits colon cancer growth and metastasis by Lentivirus-mediated RNA interference and proteomic analysis. Mol Med, 17 (7-8): 709-716.
Jiang, P., Du, W., Mancuso, A., Wellen, K. E. & Yang, X. (2013) Reciprocal regulation of p53 and malic enzymes modulates metabolism and senescence. Nature, 493 (7434): 689-693.
Johns, L. E. & Houlston, R. S. (2001) A systematic review and meta-analysis of familial colorectal cancer risk. Am J Gastroenterol, 96 (10): 2992-3003.
Johnson, I. T. & Lund, E. K. (2007) Review article: nutrition, obesity and colorectal cancer. Aliment Pharmacol Ther, 26 (2): 161-181.
Jonason, A. S., Kunala, S., Price, G. J., Restifo, R. J., Spinelli, H. M., Persing, J. A., Leffell, D. J., Tarone, R. E. & Brash, D. E. (1996) Frequent clones of p53-mutated keratinocytes in normal human skin. Proc Natl Acad Sci U S A, 93 (24): 14025-14029.
Jones, A. M., Morris, E., Thomas, J., Forman, D., Melia, J. & Moss, S. M. (2009) Evaluation of bowel cancer registration data in England, 1996-2004. Br J Cancer, 101 (8): 1269-1273.
Jones, S. A. (2012) Physiology of FGF15/19. Adv Exp Med Biol, 728 171-182.
Jørgensen, O. D., Kronborg, O. & Fenger, C. (1993) The Funen Adenoma Follow-up Study. Incidence and death from colorectal carcinoma in an adenoma surveillance program. Scand J Gastroenterol, 28 (10): 869-874.

247 | P a g e
Kakizoe, T. (2006) Development and progression of urothelial carcinoma. Cancer Sci, 97 (9): 821-828.
Kalluri, R. & Zeisberg, M. (2006) Fibroblasts in cancer. Nat Rev Cancer, 6 (5): 392-401.
Kanemitsu, Y., Kato, T., Hirai, T. & Yasui, K. (2004) Preoperative probability model for predicting overall survival after resection of pulmonary metastases from colorectal cancer. Br J Surg, 91 (1): 112-120.
Kang, K. J., Sinn, D. H., Park, S. H., Kim, J. Y., Chang, D. K., Son, H. J., Rhee, P. L., Kim, J. J., Rhee, J. C., Chun, H. K. & Kim, Y. H. (2010) Adenoma incidence after resection of sporadic colorectal cancer with microsatellite instability. J Surg Oncol, 101 (7): 577-581.
Kastrinos, F. & Syngal, S. (2007) Recently identified colon cancer predispositions: MYH and MSH6 mutations. Semin Oncol, 34 (5): 418-424.
Katoh, M. (2006) Cross-talk of WNT and FGF signaling pathways at GSK3beta to regulate beta-catenin and SNAIL signaling cascades. Cancer Biol Ther, 5 (9): 1059-1064.
Katoh, M. (2008) Cancer genomics and genetics of FGFR2 (Review). Int J Oncol, 33 (2): 233-237.
Katoh, M. & Nakagama, H. (2014) FGF receptors: cancer biology and therapeutics. Med Res Rev, 34 (2): 280-300.
Katsurano, M., Niwa, T., Yasui, Y., Shigematsu, Y., Yamashita, S., Takeshima, H., Lee, M. S., Kim, Y. J., Tanaka, T. & Ushijima, T. (2012) Early-stage formation of an epigenetic field defect in a mouse colitis model, and non-essential roles of T- and B-cells in DNA methylation induction. Oncogene, 31 (3): 342-351.
Kaur, B., Khwaja, F. W., Severson, E. A., Matheny, S. L., Brat, D. J. & Van Meir, E. G. (2005) Hypoxia and the hypoxia-inducible-factor pathway in glioma growth and angiogenesis. Neuro Oncol, 7 (2): 134-153.
Kawada, K., Hosogi, H., Sonoshita, M., Sakashita, H., Manabe, T., Shimahara, Y., Sakai, Y., Takabayashi, A., Oshima, M. & Taketo, M. M. (2007) Chemokine receptor CXCR3 promotes colon cancer metastasis to lymph nodes. Oncogene, 26 (32): 4679-4688.
Kawai, K., Ishihara, S., Yamaguchi, H., Sunami, E., Kitayama, J., Miyata, H. & Watanabe, T. (2015) Nomogram prediction of metachronous colorectal neoplasms in patients with colorectal cancer. Ann Surg, 261 (5): 926-932.
Kawai, K., Sunami, E., Tsuno, N. H., Kitayama, J. & Watanabe, T. (2012) Polyp surveillance after surgery for colorectal cancer. Int J Colorectal Dis, 27 (8): 1087-1093.

248 | P a g e
Khoury, D. A., Opelka, F. G., Beck, D. E., Hicks, T. C., Timmcke, A. E. & Gathright, J. B. (1996) Colon surveillance after colorectal cancer surgery. Dis Colon Rectum, 39 (3): 252-256.
Kim, A. Y., Kwak, J. H., Je, N. K., Lee, Y. H. & Jung, Y. S. (2015) Epithelial-mesenchymal Transition is Associated with Acquired Resistance to 5-Fluorocuracil in HT-29 Colon Cancer Cells. Toxicol Res, 31 (2): 151-156.
Kim, J., Takeuchi, H., Lam, S. T., Turner, R. R., Wang, H. J., Kuo, C., Foshag, L., Bilchik, A. J. & Hoon, D. S. (2005) Chemokine receptor CXCR4 expression in colorectal cancer patients increases the risk for recurrence and for poor survival. J Clin Oncol, 23 (12): 2744-2753.
Kim, S. K., Jang, H. R., Kim, J. H., Noh, S. M., Song, K. S., Kim, M. R., Kim, S. Y., Yeom, Y. I., Kim, N. S., Yoo, H. S. & Kim, Y. S. (2006) The epigenetic silencing of LIMS2 in gastric cancer and its inhibitory effect on cell migration. Biochem Biophys Res Commun, 349 (3): 1032-1040.
Kindberg, E., Hejdeman, B., Bratt, G., Wahren, B., Lindblom, B., Hinkula, J. & Svensson, L. (2006) A nonsense mutation (428G-->A) in the fucosyltransferase FUT2 gene affects the progression of HIV-1 infection. AIDS, 20 (5): 685-689.
Kir, S., Beddow, S. A., Samuel, V. T., Miller, P., Previs, S. F., Suino-Powell, K., Xu, H. E., Shulman, G. I., Kliewer, S. A. & Mangelsdorf, D. J. (2011) FGF19 as a postprandial, insulin-independent activator of hepatic protein and glycogen synthesis. Science, 331 (6024): 1621-1624.
Kitago, M., Ueda, M., Aiura, K., Suzuki, K., Hoshimoto, S., Takahashi, S., Mukai, M. & Kitajima, M. (2004) Comparison of K-ras point mutation distributions in intraductal papillary-mucinous tumors and ductal adenocarcinoma of the pancreas. Int J Cancer, 110 (2): 177-182.
Kitahara, O., Furukawa, Y., Tanaka, T., Kihara, C., Ono, K., Yanagawa, R., Nita, M. E., Takagi, T., Nakamura, Y. & Tsunoda, T. (2001) Alterations of gene expression during colorectal carcinogenesis revealed by cDNA microarrays after laser-capture microdissection of tumor tissues and normal epithelia. Cancer Res, 61 (9): 3544-3549.
Knerer, B., Formanek, M., Schickinger, B., Martinek, H. & Kornfehl, J. (1998) Different KGF expression in squamous cell carcinomas of the head and neck and in normal mucosa. Acta Otolaryngol, 118 (3): 438-442.
Knudsen, A. L., Bisgaard, M. L. & Bülow, S. (2003) Attenuated familial adenomatous polyposis (AFAP). A review of the literature. Fam Cancer, 2 (1): 43-55.
Knudson, A. G. (1971) Mutation and cancer: statistical study of retinoblastoma. Proc Natl Acad Sci U S A, 68 (4): 820-823.

249 | P a g e
Koizumi, K., Hojo, S., Akashi, T., Yasumoto, K. & Saiki, I. (2007) Chemokine receptors in cancer metastasis and cancer cell-derived chemokines in host immune response. Cancer Sci, 98 (11): 1652-1658.
Kollmar, O., Scheuer, C., Menger, M. D. & Schilling, M. K. (2006) Macrophage inflammatory protein-2 promotes angiogenesis, cell migration, and tumor growth in hepatic metastasis. Ann Surg Oncol, 13 (2): 263-275.
Komuro, K., Tada, M., Tamoto, E., Kawakami, A., Matsunaga, A., Teramoto, K., Shindoh, G., Takada, M., Murakawa, K., Kanai, M., Kobayashi, N., Fujiwara, Y., Nishimura, N., Hamada, J., Ishizu, A., Ikeda, H., Kondo, S., Katoh, H., Moriuchi, T. & Yoshiki, T. (2005) Right- and left-sided colorectal cancers display distinct expression profiles and the anatomical stratification allows a high accuracy prediction of lymph node metastasis. J Surg Res, 124 (2): 216-224.
Kosinski, C., Li, V. S., Chan, A. S., Zhang, J., Ho, C., Tsui, W. Y., Chan, T. L., Mifflin, R. C., Powell, D. W., Yuen, S. T., Leung, S. Y. & Chen, X. (2007) Gene expression patterns of human colon tops and basal crypts and BMP antagonists as intestinal stem cell niche factors. Proc Natl Acad Sci U S A, 104 (39): 15418-15423.
Kronborg, O., Hage, E., Fenger, C. & Deichgraeber, E. (1986) Do synchronous adenomas influence prognosis after radical surgery for colorectal carcinoma? A prospective study. Int J Colorectal Dis, 1 (2): 99-103.
Kruhøffer, M., Jensen, J. L., Laiho, P., Dyrskjøt, L., Salovaara, R., Arango, D., Birkenkamp-Demtroder, K., Sørensen, F. B., Christensen, L. L., Buhl, L., Mecklin, J. P., Järvinen, H., Thykjaer, T., Wikman, F. P., Bech-Knudsen, F., Juhola, M., Nupponen, N. N., Laurberg, S., Andersen, C. L., Aaltonen, L. A. & Ørntoft, T. F. (2005) Gene expression signatures for colorectal cancer microsatellite status and HNPCC. Br J Cancer, 92 (12): 2240-2248.
Kudo, M., Ishiwata, T., Nakazawa, N., Kawahara, K., Fujii, T., Teduka, K. & Naito, Z. (2007) Keratinocyte growth factor-transfection-stimulated adhesion of colorectal cancer cells to extracellular matrices. Exp Mol Pathol, 83 (3): 443-452.
Kuniyasu, H., Yasui, W., Shinohara, H., Yano, S., Ellis, L. M., Wilson, M. R., Bucana, C. D., Rikita, T., Tahara, E. & Fidler, I. J. (2000) Induction of angiogenesis by hyperplastic colonic mucosa adjacent to colon cancer. Am J Pathol, 157 (5): 1523-1535.
Kurosu, H., Choi, M., Ogawa, Y., Dickson, A. S., Goetz, R., Eliseenkova, A. V., Mohammadi, M., Rosenblatt, K. P., Kliewer, S. A. & Kuro-o, M. (2007) Tissue-specific expression of betaKlotho and fibroblast growth factor (FGF) receptor isoforms determines metabolic activity of FGF19 and FGF21. J Biol Chem, 282 (37): 26687-26695.
Kurosu, H. & Kuro-O, M. (2009) Endocrine fibroblast growth factors as regulators of metabolic homeostasis. Biofactors, 35 (1): 52-60.

250 | P a g e
Kurosu, H., Ogawa, Y., Miyoshi, M., Yamamoto, M., Nandi, A., Rosenblatt, K. P., Baum, M. G., Schiavi, S., Hu, M. C., Moe, O. W. & Kuro-o, M. (2006) Regulation of fibroblast growth factor-23 signaling by klotho. J Biol Chem, 281 (10): 6120-6123.
Lakoff, J., Paszat, L. F., Saskin, R. & Rabeneck, L. (2008) Risk of developing proximal versus distal colorectal cancer after a negative colonoscopy: a population-based study. Clin Gastroenterol Hepatol, 6 (10): 1117-1121; quiz 1064.
Lammi, L., Arte, S., Somer, M., Jarvinen, H., Lahermo, P., Thesleff, I., Pirinen, S. & Nieminen, P. (2004) Mutations in AXIN2 cause familial tooth agenesis and predispose to colorectal cancer. Am J Hum Genet, 74 (5): 1043-1050.
Lance, P. & Hamilton, S. R. (2008) Sporadic aberrant crypt foci are not a surrogate endpoint for colorectal adenoma prevention. Cancer Prev Res (Phila), 1 (1): 4-8.
LANE, N. & LEV, R. (1963) Observations on the origin of adenomatous epithelium of the colon. Serial section of minute polyps in familial polyposis. Cancer, 16 751-764.
Laprise, P., Chailler, P., Houde, M., Beaulieu, J. F., Boucher, M. J. & Rivard, N. (2002) Phosphatidylinositol 3-kinase controls human intestinal epithelial cell differentiation by promoting adherens junction assembly and p38 MAPK activation. J Biol Chem, 277 (10): 8226-8234.
Laprise, P., Langlois, M. J., Boucher, M. J., Jobin, C. & Rivard, N. (2004) Down-regulation of MEK/ERK signaling by E-cadherin-dependent PI3K/Akt pathway in differentiating intestinal epithelial cells. J Cell Physiol, 199 (1): 32-39.
Larkin, J. E., Frank, B. C., Gavras, H., Sultana, R. & Quackenbush, J. (2005) Independence and reproducibility across microarray platforms. Nat Methods, 2 (5): 337-344.
Larsson, S. C. & Wolk, A. (2006) Meat consumption and risk of colorectal cancer: a meta-analysis of prospective studies. Int J Cancer, 119 (11): 2657-2664.
Laukoetter, M. G., Mennigen, R., Hannig, C. M., Osada, N., Rijcken, E., Vowinkel, T., Krieglstein, C. F., Senninger, N., Anthoni, C. & Bruewer, M. (2011) Intestinal cancer risk in Crohn's disease: a meta-analysis. J Gastrointest Surg, 15 (4): 576-583.
Leach, F. S., Nicolaides, N. C., Papadopoulos, N., Liu, B., Jen, J., Parsons, R., Peltomäki, P., Sistonen, P., Aaltonen, L. A. & Nyström-Lahti, M. (1993) Mutations of a mutS homolog in hereditary nonpolyposis colorectal cancer. Cell, 75 (6): 1215-1225.
Leary, R. J., Lin, J. C., Cummins, J., Boca, S., Wood, L. D., Parsons, D. W., Jones, S., Sjöblom, T., Park, B. H., Parsons, R., Willis, J., Dawson, D., Willson, J. K., Nikolskaya, T., Nikolsky, Y., Kopelovich, L., Papadopoulos, N., Pennacchio, L. A., Wang, T. L., Markowitz, S. D.,

251 | P a g e
Parmigiani, G., Kinzler, K. W., Vogelstein, B. & Velculescu, V. E. (2008) Integrated analysis of homozygous deletions, focal amplifications, and sequence alterations in breast and colorectal cancers. Proc Natl Acad Sci U S A, 105 (42): 16224-16229.
Lechner, S., Müller-Ladner, U., Renke, B., Schölmerich, J., Rüschoff, J. & Kullmann, F. (2003) Gene expression pattern of laser microdissected colonic crypts of adenomas with low grade dysplasia. Gut, 52 (8): 1148-1153.
Lee, K. J., Inoue, M., Otani, T., Iwasaki, M., Sasazuki, S., Tsugane, S. & Group, J. S. (2007) Physical activity and risk of colorectal cancer in Japanese men and women: the Japan Public Health Center-based prospective study. Cancer Causes Control, 18 (2): 199-209.
Leedham, S. J., Graham, T. A., Oukrif, D., McDonald, S. A., Rodriguez-Justo, M., Harrison, R. F., Shepherd, N. A., Novelli, M. R., Jankowski, J. A. & Wright, N. A. (2009) Clonality, founder mutations, and field cancerization in human ulcerative colitis-associated neoplasia. Gastroenterology, 136 (2): 542-550.e546.
LeGolvan, M. P. & Resnick, M. (2010) Pathobiology of colorectal cancer hepatic metastases with an emphasis on prognostic factors. J Surg Oncol, 102 (8): 898-908.
Lengauer, C., Kinzler, K. W. & Vogelstein, B. (1998) Genetic instabilities in human cancers. Nature, 396 (6712): 643-649.
Lennard-Jones, J. E., Morson, B. C., Ritchie, J. K. & Williams, C. B. (1983) Cancer surveillance in ulcerative colitis. Experience over 15 years. Lancet, 2 (8342): 149-152.
Leppert, M., Burt, R., Hughes, J. P., Samowitz, W., Nakamura, Y., Woodward, S., Gardner, E., Lalouel, J. M. & White, R. (1990) Genetic analysis of an inherited predisposition to colon cancer in a family with a variable number of adenomatous polyps. N Engl J Med, 322 (13): 904-908.
Levi, F., Randimbison, L., Blanc-Moya, R., Maspoli-Conconi, M., Rosato, V., Bosetti, C. & La Vecchia, C. (2013) High constant incidence of second primary colorectal cancer. Int J Cancer, 132 (7): 1679-1682.
Levin, B., Lennard-Jones, J., Riddell, R. H., Sachar, D. & Winawer, S. J. (1991) Surveillance of patients with chronic ulcerative colitis. WHO Collaborating Centre for the Prevention of Colorectal Cancer. Bull World Health Organ, 69 (1): 121-126.
Li, A., Varney, M. L. & Singh, R. K. (2004) Constitutive expression of growth regulated oncogene (gro) in human colon carcinoma cells with different metastatic potential and its role in regulating their metastatic phenotype. Clin Exp Metastasis, 21 (7): 571-579.

252 | P a g e
Li, B. H., Xu, S. B., Li, F., Zou, X. G., Saimaiti, A., Simayi, D., Wang, Y. H., Zhang, Y., Yuan, J. & Zhang, W. J. (2012) Stat6 activity-related Th2 cytokine profile and tumor growth advantage of human colorectal cancer cells in vitro and in vivo. Cell Signal, 24 (3): 718-725.
Li, B. H., Yang, X. Z., Li, P. D., Yuan, Q., Liu, X. H., Yuan, J. & Zhang, W. J. (2008) IL-4/Stat6 activities correlate with apoptosis and metastasis in colon cancer cells. Biochem Biophys Res Commun, 369 (2): 554-560.
Liang, P. S., Chen, T. Y. & Giovannucci, E. (2009) Cigarette smoking and colorectal cancer incidence and mortality: systematic review and meta-analysis. Int J Cancer, 124 (10): 2406-2415.
Liang, W. & Binns, C. W. (2009) Fruit, vegetables, and colorectal cancer risk: the European Prospective Investigation into Cancer and Nutrition. Am J Clin Nutr, 90 (4): 1112; author reply 1112-1114.
Lieberman, D. A., Weiss, D. G., Bond, J. H., Ahnen, D. J., Garewal, H. & Chejfec, G. (2000) Use of colonoscopy to screen asymptomatic adults for colorectal cancer. Veterans Affairs Cooperative Study Group 380. N Engl J Med, 343 (3): 162-168.
Liebermann, D. A. & Hoffman, B. (2002) Myeloid differentiation (MyD)/growth arrest DNA damage (GADD) genes in tumor suppression, immunity and inflammation. Leukemia, 16 (4): 527-541.
Lièvre, A., Bachet, J. B., Boige, V., Cayre, A., Le Corre, D., Buc, E., Ychou, M., Bouché, O., Landi, B., Louvet, C., André, T., Bibeau, F., Diebold, M. D., Rougier, P., Ducreux, M., Tomasic, G., Emile, J. F., Penault-Llorca, F. & Laurent-Puig, P. (2008) KRAS mutations as an independent prognostic factor in patients with advanced colorectal cancer treated with cetuximab. J Clin Oncol, 26 (3): 374-379.
Lin, B. C., Wang, M., Blackmore, C. & Desnoyers, L. R. (2007) Liver-specific activities of FGF19 require Klotho beta. J Biol Chem, 282 (37): 27277-27284.
Lin, Y. M., Furukawa, Y., Tsunoda, T., Yue, C. T., Yang, K. C. & Nakamura, Y. (2002) Molecular diagnosis of colorectal tumors by expression profiles of 50 genes expressed differentially in adenomas and carcinomas. Oncogene, 21 (26): 4120-4128.
Lindblom, A. (2001) Different mechanisms in the tumorigenesis of proximal and distal colon cancers. Curr Opin Oncol, 13 (1): 63-69.
Link, A., Balaguer, F., Shen, Y., Nagasaka, T., Lozano, J. J., Boland, C. R. & Goel, A. (2010) Fecal MicroRNAs as novel biomarkers for colon cancer screening. Cancer Epidemiol Biomarkers Prev, 19 (7): 1766-1774.

253 | P a g e
Lipkin, M. (1974) Phase 1 and phase 2 proliferative lesions of colonic epithelial cells in diseases leading to colonic cancer. Cancer, 34 (3): suppl:878-888.
Liu, L., Lemmens, V. E., De Hingh, I. H., de Vries, E., Roukema, J. A., van Leerdam, M. E., Coebergh, J. W. & Soerjomataram, I. (2013a) Second primary cancers in subsites of colon and rectum in patients with previous colorectal cancer. Dis Colon Rectum, 56 (2): 158-168.
Liu, R., Li, J., Xie, K., Zhang, T., Lei, Y., Chen, Y., Zhang, L., Huang, K., Wang, K., Wu, H., Wu, M., Nice, E. C., Huang, C. & Wei, Y. (2013b) FGFR4 promotes stroma-induced epithelial-to-mesenchymal transition in colorectal cancer. Cancer Res, 73 (19): 5926-5935.
Liu, W. K., Jiang, X. Y. & Zhang, Z. X. (2010) Expression of PSCA, PIWIL1, and TBX2 in endometrial adenocarcinoma. Onkologie, 33 (5): 241-245.
Logan, R. F., Patnick, J., Nickerson, C., Coleman, L., Rutter, M. D., von Wagner, C. & Committee, E. B. C. S. E. (2012) Outcomes of the Bowel Cancer Screening Programme (BCSP) in England after the first 1 million tests. Gut, 61 (10): 1439-1446.
Longman, R. J., Douthwaite, J., Sylvester, P. A., O'Leary, D., Warren, B. F., Corfield, A. P. & Thomas, M. G. (2000) Lack of mucin MUC5AC field change expression associated with tubulovillous and villous colorectal adenomas. J Clin Pathol, 53 (2): 100-104.
López-Ferrer, A., Curull, V., Barranco, C., Garrido, M., Lloreta, J., Real, F. X. & de Bolós C (2001) Mucins as differentiation markers in bronchial epithelium. Squamous cell carcinoma and adenocarcinoma display similar expression patterns. Am J Respir Cell Mol Biol, 24 (1): 22-29.
López-Lázaro, M. (2015) Stem cell division theory of cancer. Cell Cycle, 14 (16): 2547-2548.
Losi, L., Scarselli, A., Benatti, P., Ponz de Leon, M., Roncucci, L., Pedroni, M., Borghi, F., Lamberti, I., Rossi, G., Marino, M., Ponti, G., Zangardi, G., Menigatti, M. & Di Gregorio, C. (2004) Relationship between MUC5AC and altered expression of MLH1 protein in mucinous and non-mucinous colorectal carcinomas. Pathol Res Pract, 200 (5): 371-377.
Lundåsen, T., Gälman, C., Angelin, B. & Rudling, M. (2006) Circulating intestinal fibroblast growth factor 19 has a pronounced diurnal variation and modulates hepatic bile acid synthesis in man. J Intern Med, 260 (6): 530-536.
Luo, Y., Yu, M. & Grady, W. M. (2014) Field cancerization in the colon: a role for aberrant DNA methylation? Gastroenterol Rep (Oxf), 2 (1): 16-20.
Lynch, H. T. & de la Chapelle, A. (2003) Hereditary colorectal cancer. N Engl J Med, 348 (10): 919-932.

254 | P a g e
Lynch, H. T., Lynch, P. M., Lanspa, S. J., Snyder, C. L., Lynch, J. F. & Boland, C. R. (2009) Review of the Lynch syndrome: history, molecular genetics, screening, differential diagnosis, and medicolegal ramifications. Clin Genet, 76 (1): 1-18.
Magalhães, B., Peleteiro, B. & Lunet, N. (2012) Dietary patterns and colorectal cancer: systematic review and meta-analysis. Eur J Cancer Prev, 21 (1): 15-23.
Malesci, A., Basso, G., Bianchi, P., Fini, L., Grizzi, F., Celesti, G., Di Caro, G., Delconte, G., Dattola, F., Repici, A., Roncalli, M., Montorsi, M. & Laghi, L. (2014) Molecular heterogeneity and prognostic implications of synchronous advanced colorectal neoplasia. Br J Cancer, 110 (5): 1228-1235.
Mandel, J. S., Church, T. R., Ederer, F. & Bond, J. H. (1999) Colorectal cancer mortality: effectiveness of biennial screening for fecal occult blood. J Natl Cancer Inst, 91 (5): 434-437.
Mantovani, A., Allavena, P., Sica, A. & Balkwill, F. (2008) Cancer-related inflammation. Nature, 454 (7203): 436-444.
Mantovani, A., Bottazzi, B., Colotta, F., Sozzani, S. & Ruco, L. (1992) The origin and function of tumor-associated macrophages. Immunol Today, 13 (7): 265-270.
Mantovani, A., Sica, A. & Locati, M. (2007) New vistas on macrophage differentiation and activation. Eur J Immunol, 37 (1): 14-16.
Mantovani, A., Sica, A., Sozzani, S., Allavena, P., Vecchi, A. & Locati, M. (2004) The chemokine system in diverse forms of macrophage activation and polarization. Trends Immunol, 25 (12): 677-686.
Marionneau, S., Airaud, F., Bovin, N. V., Le Pendu, J. & Ruvoën-Clouet, N. (2005) Influence of the combined ABO, FUT2, and FUT3 polymorphism on susceptibility to Norwalk virus attachment. J Infect Dis, 192 (6): 1071-1077.
Markowitz, S., Wang, J., Myeroff, L., Parsons, R., Sun, L., Lutterbaugh, J., Fan, R. S., Zborowska, E., Kinzler, K. W. & Vogelstein, B. (1995) Inactivation of the type II TGF-beta receptor in colon cancer cells with microsatellite instability. Science, 268 (5215): 1336-1338.
Markowitz, S. D. & Bertagnolli, M. M. (2009) Molecular origins of cancer: Molecular basis of colorectal cancer. N Engl J Med, 361 (25): 2449-2460.
Martínez, M. E., Sampliner, R., Marshall, J. R., Bhattacharyya, A. K., Reid, M. E. & Alberts, D. S. (2001) Adenoma characteristics as risk factors for recurrence of advanced adenomas. Gastroenterology, 120 (5): 1077-1083.

255 | P a g e
Maskens, A. P. (1979) Histogenesis of adenomatous polyps in the human large intestine. Gastroenterology, 77 (6): 1245-1251.
Masutani, H. & Kimura, H. (1995) Purification and characterization of secretory-type GDP-L-fucose: beta-D-galactoside 2-alpha-L-fucosyltransferase from human gastric mucosa. J Biochem, 118 (3): 541-545.
Matsuda, Y., Hagio, M., Seya, T. & Ishiwata, T. (2012) Fibroblast growth factor receptor 2 IIIc as a therapeutic target for colorectal cancer cells. Mol Cancer Ther, 11 (9): 2010-2020.
Matsuda, Y., Ishiwata, T., Yamahatsu, K., Kawahara, K., Hagio, M., Peng, W. X., Yamamoto, T., Nakazawa, N., Seya, T., Ohaki, Y. & Naito, Z. (2011) Overexpressed fibroblast growth factor receptor 2 in the invasive front of colorectal cancer: a potential therapeutic target in colorectal cancer. Cancer Lett, 309 (2): 209-219.
Mattar, M., Frankel, P., David, D., Clarke, K. O., Chu, D. Z., Jiang, C. & Yen, Y. (2005) Clinicopathologic significance of synchronous and metachronous adenomas in colorectal cancer. Clin Colorectal Cancer, 5 (4): 274-278.
Maykel, J. A., Hagerman, G., Mellgren, A. F., Li, S. Y., Alavi, K., Baxter, N. N. & Madoff, R. D. (2006) Crohn's colitis: the incidence of dysplasia and adenocarcinoma in surgical patients. Dis Colon Rectum, 49 (7): 950-957.
McFall, M. R., Woods, W. G. & Miles, W. F. (2003) Colonoscopic surveillance after curative colorectal resection: results of an empirical surveillance programme. Colorectal Dis, 5 (3): 233-240.
McGovern, D. P., Jones, M. R., Taylor, K. D., Marciante, K., Yan, X., Dubinsky, M., Ippoliti, A., Vasiliauskas, E., Berel, D., Derkowski, C., Dutridge, D., Fleshner, P., Shih, D. Q., Melmed, G., Mengesha, E., King, L., Pressman, S., Haritunians, T., Guo, X., Targan, S. R., Rotter, J. I. & Consortium, I. I. G. (2010) Fucosyltransferase 2 (FUT2) non-secretor status is associated with Crohn's disease. Hum Mol Genet, 19 (17): 3468-3476.
McLean, M. H., Murray, G. I., Stewart, K. N., Norrie, G., Mayer, C., Hold, G. L., Thomson, J., Fyfe, N., Hope, M., Mowat, N. A., Drew, J. E. & El-Omar, E. M. (2011) The inflammatory microenvironment in colorectal neoplasia. PLoS One, 6 (1): e15366.
Mi, H., Muruganujan, A., Casagrande, J. T. & Thomas, P. D. (2013) Large-scale gene function analysis with the PANTHER classification system. Nat Protoc, 8 (8): 1551-1566.
Michaelis, K. A., Knox, A. J., Xu, M., Kiseljak-Vassiliades, K., Edwards, M. G., Geraci, M., Kleinschmidt-DeMasters, B. K., Lillehei, K. O. & Wierman, M. E. (2011) Identification of growth arrest and DNA-damage-inducible gene beta (GADD45beta) as a novel tumor suppressor in pituitary gonadotrope tumors. Endocrinology, 152 (10): 3603-3613.

256 | P a g e
Miki, T., Fleming, T. P., Bottaro, D. P., Rubin, J. S., Ron, D. & Aaronson, S. A. (1991) Expression cDNA cloning of the KGF receptor by creation of a transforming autocrine loop. Science, 251 (4989): 72-75.
Minoo, P., Baker, K., Goswami, R., Chong, G., Foulkes, W. D., Ruszkiewicz, A. R., Barker, M., Buchanan, D., Young, J. & Jass, J. R. (2006) Extensive DNA methylation in normal colorectal mucosa in hyperplastic polyposis. Gut, 55 (10): 1467-1474.
Miron, M., Woody, O. Z., Marcil, A., Murie, C., Sladek, R. & Nadon, R. (2006) A methodology for global validation of microarray experiments. BMC Bioinformatics, 7 333.
Miura, S., Mitsuhashi, N., Shimizu, H., Kimura, F., Yoshidome, H., Otsuka, M., Kato, A., Shida, T., Okamura, D. & Miyazaki, M. (2012) Fibroblast growth factor 19 expression correlates with tumor progression and poorer prognosis of hepatocellular carcinoma. BMC Cancer, 12 56.
Miyoshi, H., Nakau, M., Ishikawa, T. O., Seldin, M. F., Oshima, M. & Taketo, M. M. (2002) Gastrointestinal hamartomatous polyposis in Lkb1 heterozygous knockout mice. Cancer Res, 62 (8): 2261-2266.
Montgomery, E. (2004) Serrated colorectal polyps: emerging evidence suggests the need for a reappraisal. Adv Anat Pathol, 11 (3): 143-149.
Moon, C. M., Cheon, J. H., Choi, E. H., Kim, E. S., Park, J. J., Han, S. Y., Kim, D. H., Kim, T. I. & Kim, W. H. (2010) Advanced synchronous adenoma but not simple adenoma predicts the future development of metachronous neoplasia in patients with resected colorectal cancer. J Clin Gastroenterol, 44 (7): 495-501.
Moreadith, R. W. & Lehninger, A. L. (1984) The pathways of glutamate and glutamine oxidation by tumor cell mitochondria. Role of mitochondrial NAD(P)+-dependent malic enzyme. J Biol Chem, 259 (10): 6215-6221.
Morson, B. (1974) President's address. The polyp-cancer sequence in the large bowel. Proc R Soc Med, 67 (6 Pt 1): 451-457.
Morson, B. C. & Bussey, H. J. (1985) Magnitude of risk for cancer in patients with colorectal adenomas. Br J Surg, 72 Suppl S23-25.
Mosesson, Y., Mills, G. B. & Yarden, Y. (2008) Derailed endocytosis: an emerging feature of cancer. Nat Rev Cancer, 8 (11): 835-850.
Mulder, S. A., Kranse, R., Damhuis, R. A., de Wilt, J. H., Ouwendijk, R. J., Kuipers, E. J. & van Leerdam, M. E. (2011) Prevalence and prognosis of synchronous colorectal cancer: a Dutch population-based study. Cancer Epidemiol, 35 (5): 442-447.

257 | P a g e
Mulder, S. A., Kranse, R., Damhuis, R. A., Ouwendijk, R. J., Kuipers, E. J. & van Leerdam, M. E. (2012) The incidence and risk factors of metachronous colorectal cancer: an indication for follow-up. Dis Colon Rectum, 55 (5): 522-531.
Muleris, M., Salmon, R. J. & Dutrillaux, B. (1990) Cytogenetics of colorectal adenocarcinomas. Cancer Genet Cytogenet, 46 (2): 143-156.
Müller, A. D. & Sonnenberg, A. (1995) Prevention of colorectal cancer by flexible endoscopy and polypectomy. A case-control study of 32,702 veterans. Ann Intern Med, 123 (12): 904-910.
Muto, T., Bussey, H. J. & Morson, B. C. (1975) The evolution of cancer of the colon and rectum. Cancer, 36 (6): 2251-2270.
Naimi, B., Latil, A., Fournier, G., Mangin, P., Cussenot, O. & Berthon, P. (2002) Down-regulation of (IIIb) and (IIIc) isoforms of fibroblast growth factor receptor 2 (FGFR2) is associated with malignant progression in human prostate. Prostate, 52 (3): 245-252.
Nakagawa, H., Liyanarachchi, S., Davuluri, R. V., Auer, H., Martin, E. W., de la Chapelle, A. & Frankel, W. L. (2004) Role of cancer-associated stromal fibroblasts in metastatic colon cancer to the liver and their expression profiles. Oncogene, 23 (44): 7366-7377.
Nakamura, S. & Kino, I. (1984) Morphogenesis of minute adenomas in familial polyposis coli. J Natl Cancer Inst, 73 (1): 41-49.
Nan, F., Lü, Q., Zhou, J., Cheng, L., Popov, V. M., Wei, S., Kong, B., Pestell, R. G., Lisanti, M. P., Jiang, J. & Wang, C. (2009) Altered expression of DACH1 and cyclin D1 in endometrial cancer. Cancer Biol Ther, 8 (16): 1534-1539.
Nannini, M., Pantaleo, M. A., Maleddu, A., Astolfi, A., Formica, S. & Biasco, G. (2009) Gene expression profiling in colorectal cancer using microarray technologies: results and perspectives. Cancer Treat Rev, 35 (3): 201-209.
Narita, K., Fujii, T., Ishiwata, T., Yamamoto, T., Kawamoto, Y., Kawahara, K., Nakazawa, N. & Naito, Z. (2009) Keratinocyte growth factor induces vascular endothelial growth factor-A expression in colorectal cancer cells. Int J Oncol, 34 (2): 355-360.
NCIN National Cancer Intelligence Network. [online] Available from: http://www.ncin.org.uk/cancer_information_tools/eatlas/ (Accessed September 2015).
Neugut, A. I., Jacobson, J. S. & De Vivo, I. (1993) Epidemiology of colorectal adenomatous polyps. Cancer Epidemiol Biomarkers Prev, 2 (2): 159-176.

258 | P a g e
Neugut, A. I., Lautenbach, E., Abi-Rached, B. & Forde, K. A. (1996) Incidence of adenomas after curative resection for colorectal cancer. Am J Gastroenterol, 91 (10): 2096-2098.
Newcomb, P. A., Norfleet, R. G., Storer, B. E., Surawicz, T. S. & Marcus, P. M. (1992) Screening sigmoidoscopy and colorectal cancer mortality. J Natl Cancer Inst, 84 (20): 1572-1575.
Nguyen, H., Loustaunau, C., Facista, A., Ramsey, L., Hassounah, N., Taylor, H., Krouse, R., Payne, C. M., Tsikitis, V. L., Goldschmid, S., Banerjee, B., Perini, R. F. & Bernstein, C. (2010) Deficient Pms2, ERCC1, Ku86, CcOI in field defects during progression to colon cancer. J Vis Exp, (41):
Nguyen, H. Q., Danilenko, D. M., Bucay, N., DeRose, M. L., Van, G. Y., Thomason, A. & Simonet, W. S. (1996) Expression of keratinocyte growth factor in embryonic liver of transgenic mice causes changes in epithelial growth and differentiation resulting in polycystic kidneys and other organ malformations. Oncogene, 12 (10): 2109-2119.
Nicholes, K., Guillet, S., Tomlinson, E., Hillan, K., Wright, B., Frantz, G. D., Pham, T. A., Dillard-Telm, L., Tsai, S. P., Stephan, J. P., Stinson, J., Stewart, T. & French, D. M. (2002) A mouse model of hepatocellular carcinoma: ectopic expression of fibroblast growth factor 19 in skeletal muscle of transgenic mice. Am J Pathol, 160 (6): 2295-2307.
Nicolaides, N. C., Papadopoulos, N., Liu, B., Wei, Y. F., Carter, K. C., Ruben, S. M., Rosen, C. A., Haseltine, W. A., Fleischmann, R. D. & Fraser, C. M. (1994) Mutations of two PMS homologues in hereditary nonpolyposis colon cancer. Nature, 371 (6492): 75-80.
Nicolas, P., Kim, K. M., Shibata, D. & Tavaré, S. (2007) The stem cell population of the human colon crypt: analysis via methylation patterns. PLoS Comput Biol, 3 (3): e28.
Nieto, M. A. (2013) Epithelial plasticity: a common theme in embryonic and cancer cells. Science, 342 (6159): 1234850.
Nieuw Amerongen, A. V., Bolscher, J. G., Bloemena, E. & Veerman, E. C. (1998) Sulfomucins in the human body. Biol Chem, 379 (1): 1-18.
Niu, G., Wright, K. L., Huang, M., Song, L., Haura, E., Turkson, J., Zhang, S., Wang, T., Sinibaldi, D., Coppola, D., Heller, R., Ellis, L. M., Karras, J., Bromberg, J., Pardoll, D., Jove, R. & Yu, H. (2002) Constitutive Stat3 activity up-regulates VEGF expression and tumor angiogenesis. Oncogene, 21 (13): 2000-2008.
Nooteboom, M., Johnson, R., Taylor, R. W., Wright, N. A., Lightowlers, R. N., Kirkwood, T. B., Mathers, J. C., Turnbull, D. M. & Greaves, L. C. (2010) Age-associated mitochondrial DNA mutations lead to small but significant changes in cell proliferation and apoptosis in human colonic crypts. Aging Cell, 9 (1): 96-99.

259 | P a g e
NORDLING, C. O. (1953) A new theory on cancer-inducing mechanism. Br J Cancer, 7 (1): 68-72.
Noshirwani, K. C., van Stolk, R. U., Rybicki, L. A. & Beck, G. J. (2000) Adenoma size and number are predictive of adenoma recurrence: implications for surveillance colonoscopy. Gastrointest Endosc, 51 (4 Pt 1): 433-437.
Nosho, K., Baba, Y., Tanaka, N., Shima, K., Hayashi, M., Meyerhardt, J. A., Giovannucci, E., Dranoff, G., Fuchs, C. S. & Ogino, S. (2010) Tumour-infiltrating T-cell subsets, molecular changes in colorectal cancer, and prognosis: cohort study and literature review. J Pathol, 222 (4): 350-366.
Nosho, K., Kure, S., Irahara, N., Shima, K., Baba, Y., Spiegelman, D., Meyerhardt, J. A., Giovannucci, E. L., Fuchs, C. S. & Ogino, S. (2009) A prospective cohort study shows unique epigenetic, genetic, and prognostic features of synchronous colorectal cancers. Gastroenterology, 137 (5): 1609-1620.e1601-1603.
Notterman, D. A., Alon, U., Sierk, A. J. & Levine, A. J. (2001) Transcriptional gene expression profiles of colorectal adenoma, adenocarcinoma, and normal tissue examined by oligonucleotide arrays. Cancer Res, 61 (7): 3124-3130.
Nowell, P. C. (1976) The clonal evolution of tumor cell populations. Science, 194 (4260): 23-28.
O'brien, M. J., Winawer, S. J., Zauber, A. G., Bushey, M. T., Sternberg, S. S., Gottlieb, L. S., Bond, J. H., Waye, J. D., Schapiro, M. & Workgroup, N. P. S. (2004a) Flat adenomas in the National Polyp Study: is there increased risk for high-grade dysplasia initially or during surveillance? Clin Gastroenterol Hepatol, 2 (10): 905-911.
O'Brien, M. J., Yang, S., Clebanoff, J. L., Mulcahy, E., Farraye, F. A., Amorosino, M. & Swan, N. (2004b) Hyperplastic (serrated) polyps of the colorectum: relationship of CpG island methylator phenotype and K-ras mutation to location and histologic subtype. Am J Surg Pathol, 28 (4): 423-434.
O'Brien, M. J., Yang, S., Mack, C., Xu, H., Huang, C. S., Mulcahy, E., Amorosino, M. & Farraye, F. A. (2006) Comparison of microsatellite instability, CpG island methylation phenotype, BRAF and KRAS status in serrated polyps and traditional adenomas indicates separate pathways to distinct colorectal carcinoma end points. Am J Surg Pathol, 30 (12): 1491-1501.
O'Connell, M. J., Lavery, I., Yothers, G., Paik, S., Clark-Langone, K. M., Lopatin, M., Watson, D., Baehner, F. L., Shak, S., Baker, J., Cowens, J. W. & Wolmark, N. (2010) Relationship between tumor gene expression and recurrence in four independent studies of patients with stage II/III colon cancer treated with surgery alone or surgery plus adjuvant fluorouracil plus leucovorin. J Clin Oncol, 28 (25): 3937-3944.

260 | P a g e
O'Toole, A., Michielsen, A. J., Nolan, B., Tosetto, M., Sheahan, K., Mulcahy, H. E., Winter, D. C., Hyland, J. M., O'Connell, P. R., Fennelly, D., O'Donoghue, D., O'Sullivan, J., Doherty, G. A. & Ryan, E. J. (2014) Tumour microenvironment of both early- and late-stage colorectal cancer is equally immunosuppressive. Br J Cancer, 111 (5): 927-932.
Odin, E., Sondén, A., Gustavsson, B., Carlsson, G. & Wettergren, Y. (2015) Expression of Folate Pathway Genes in Stage III Colorectal Cancer Correlates with Recurrence Status following Adjuvant Bolus 5-FU-Based Chemotherapy. Mol Med,
Ogawa, Y., Kurosu, H., Yamamoto, M., Nandi, A., Rosenblatt, K. P., Goetz, R., Eliseenkova, A. V., Mohammadi, M. & Kuro-o, M. (2007) BetaKlotho is required for metabolic activity of fibroblast growth factor 21. Proc Natl Acad Sci U S A, 104 (18): 7432-7437.
Ogino, S., Nosho, K., Kirkner, G. J., Kawasaki, T., Meyerhardt, J. A., Loda, M., Giovannucci, E. L. & Fuchs, C. S. (2009) CpG island methylator phenotype, microsatellite instability, BRAF mutation and clinical outcome in colon cancer. Gut, 58 (1): 90-96.
Olsen, H. W., Lawrence, W. A., Snook, C. W. & Mutch, W. M. (1988) Risk factors and screening techniques in 500 patients with benign and malignant colon polyps. An urban community experience. Dis Colon Rectum, 31 (3): 216-221.
Oltean, S., Sorg, B. S., Albrecht, T., Bonano, V. I., Brazas, R. M., Dewhirst, M. W. & Garcia-Blanco, M. A. (2006) Alternative inclusion of fibroblast growth factor receptor 2 exon IIIc in Dunning prostate tumors reveals unexpected epithelial mesenchymal plasticity. Proc Natl Acad Sci U S A, 103 (38): 14116-14121.
Ong, S. M., Tan, Y. C., Beretta, O., Jiang, D., Yeap, W. H., Tai, J. J., Wong, W. C., Yang, H., Schwarz, H., Lim, K. H., Koh, P. K., Ling, K. L. & Wong, S. C. (2012) Macrophages in human colorectal cancer are pro-inflammatory and prime T cells towards an anti-tumour type-1 inflammatory response. Eur J Immunol, 42 (1): 89-100.
Ornitz, D. M. & Itoh, N. (2001) Fibroblast growth factors. Genome Biol, 2 (3): REVIEWS3005.
Ornitz, D. M. & Itoh, N. (2015) The Fibroblast Growth Factor signaling pathway. Wiley Interdiscip Rev Dev Biol, 4 (3): 215-266.
Ostman, A. & Augsten, M. (2009) Cancer-associated fibroblasts and tumor growth--bystanders turning into key players. Curr Opin Genet Dev, 19 (1): 67-73.
Otchy, D. P., Ransohoff, D. F., Wolff, B. G., Weaver, A., Ilstrup, D., Carlson, H. & Rademacher, D. (1996) Metachronous colon cancer in persons who have had a large adenomatous polyp. Am J Gastroenterol, 91 (3): 448-454.

261 | P a g e
Otte, J. M., Schmitz, F., Banasiewicz, T., Drews, M., Fölsch, U. R. & Herzig, K. H. (2000) Expression of keratinocyte growth factor and its receptor in colorectal cancer. Eur J Clin Invest, 30 (3): 222-229.
Ou, D. L., Shen, Y. C., Yu, S. L., Chen, K. F., Yeh, P. Y., Fan, H. H., Feng, W. C., Wang, C. T., Lin, L. I., Hsu, C. & Cheng, A. L. (2010) Induction of DNA damage-inducible gene GADD45beta contributes to sorafenib-induced apoptosis in hepatocellular carcinoma cells. Cancer Res, 70 (22): 9309-9318.
Oving, I. M. & Clevers, H. C. (2002) Molecular causes of colon cancer. Eur J Clin Invest, 32 (6): 448-457.
Pagès, F., Berger, A., Camus, M., Sanchez-Cabo, F., Costes, A., Molidor, R., Mlecnik, B., Kirilovsky, A., Nilsson, M., Damotte, D., Meatchi, T., Bruneval, P., Cugnenc, P. H., Trajanoski, Z., Fridman, W. H. & Galon, J. (2005) Effector memory T cells, early metastasis, and survival in colorectal cancer. N Engl J Med, 353 (25): 2654-2666.
Pai, R., Dunlap, D., Qing, J., Mohtashemi, I., Hotzel, K. & French, D. M. (2008) Inhibition of fibroblast growth factor 19 reduces tumor growth by modulating beta-catenin signaling. Cancer Res, 68 (13): 5086-5095.
Papadopoulos, N., Nicolaides, N. C., Wei, Y. F., Ruben, S. M., Carter, K. C., Rosen, C. A., Haseltine, W. A., Fleischmann, R. D., Fraser, C. M. & Adams, M. D. (1994) Mutation of a mutL homolog in hereditary colon cancer. Science, 263 (5153): 1625-1629.
Park, S. Y., Lee, H. S., Choe, G., Chung, J. H. & Kim, W. H. (2006) Clinicopathological characteristics, microsatellite instability, and expression of mucin core proteins and p53 in colorectal mucinous adenocarcinomas in relation to location. Virchows Arch, 449 (1): 40-47.
Parkkila, S., Pan, P. W., Ward, A., Gibadulinova, A., Oveckova, I., Pastorekova, S., Pastorek, J., Martinez, A. R., Helin, H. O. & Isola, J. (2008) The calcium-binding protein S100P in normal and malignant human tissues. BMC Clin Pathol, 8 2.
Parry, S., Win, A. K., Parry, B., Macrae, F. A., Gurrin, L. C., Church, J. M., Baron, J. A., Giles, G. G., Leggett, B. A., Winship, I., Lipton, L., Young, G. P., Young, J. P., Lodge, C. J., Southey, M. C., Newcomb, P. A., Le Marchand, L., Haile, R. W., Lindor, N. M., Gallinger, S., Hopper, J. L. & Jenkins, M. A. (2011) Metachronous colorectal cancer risk for mismatch repair gene mutation carriers: the advantage of more extensive colon surgery. Gut, 60 (7): 950-957.
Parsons, D. W., Wang, T. L., Samuels, Y., Bardelli, A., Cummins, J. M., DeLong, L., Silliman, N., Ptak, J., Szabo, S., Willson, J. K., Markowitz, S., Kinzler, K. W., Vogelstein, B., Lengauer, C. & Velculescu, V. E. (2005) Colorectal cancer: mutations in a signalling pathway. Nature, 436 (7052): 792.

262 | P a g e
Parsons, R., Li, G. M., Longley, M. J., Fang, W. H., Papadopoulos, N., Jen, J., de la Chapelle, A., Kinzler, K. W., Vogelstein, B. & Modrich, P. (1993) Hypermutability and mismatch repair deficiency in RER+ tumor cells. Cell, 75 (6): 1227-1236.
Patchett, S. E., Mulcahy, H. E. & O'Donoghue, D. P. (1993) Colonoscopic surveillance after curative resection for colorectal cancer. Br J Surg, 80 (10): 1330-1332.
Pedroni, M., Tamassia, M. G., Percesepe, A., Roncucci, L., Benatti, P., Lanza, G., Gafà, R., Di Gregorio, C., Fante, R., Losi, L., Gallinari, L., Scorcioni, F., Vaccina, F., Rossi, G., Cesinaro, A. M. & Ponz de Leon, M. (1999) Microsatellite instability in multiple colorectal tumors. Int J Cancer, 81 (1): 1-5.
Peeters, M., Douillard, J. Y., Van Cutsem, E., Siena, S., Zhang, K., Williams, R. & Wiezorek, J. (2013) Mutant KRAS codon 12 and 13 alleles in patients with metastatic colorectal cancer: assessment as prognostic and predictive biomarkers of response to panitumumab. J Clin Oncol, 31 (6): 759-765.
Peláez-García, A., Barderas, R., Torres, S., Hernández-Varas, P., Teixidó, J., Bonilla, F., de Herreros, A. G. & Casal, J. I. (2013) FGFR4 role in epithelial-mesenchymal transition and its therapeutic value in colorectal cancer. PLoS One, 8 (5): e63695.
Perez-Villamil, B., Romera-Lopez, A., Hernandez-Prieto, S., Lopez-Campos, G., Calles, A., Lopez-Asenjo, J. A., Sanz-Ortega, J., Fernandez-Perez, C., Sastre, J., Alfonso, R., Caldes, T., Martin-Sanchez, F. & Diaz-Rubio, E. (2012) Colon cancer molecular subtypes identified by expression profiling and associated to stroma, mucinous type and different clinical behavior. BMC Cancer, 12 260.
Perez, R. O., Bresciani, B. H., Bresciani, C., Proscurshim, I., Kiss, D., Gama-Rodrigues, J., Pereira, D. D., Rawet, V., Cecconnello, I. & Habr-Gama, A. (2008) Mucinous colorectal adenocarcinoma: influence of mucin expression (Muc1, 2 and 5) on clinico-pathological features and prognosis. Int J Colorectal Dis, 23 (8): 757-765.
Petretti, T., Kemmner, W., Schulze, B. & Schlag, P. M. (2000) Altered mRNA expression of glycosyltransferases in human colorectal carcinomas and liver metastases. Gut, 46 (3): 359-366.
Phipps, A. I., Limburg, P. J., Baron, J. A., Burnett-Hartman, A. N., Weisenberger, D. J., Laird, P. W., Sinicrope, F. A., Rosty, C., Buchanan, D. D., Potter, J. D. & Newcomb, P. A. (2015) Association between molecular subtypes of colorectal cancer and patient survival. Gastroenterology, 148 (1): 77-87.e72.
Pickhardt, P. J., Nugent, P. A., Mysliwiec, P. A., Choi, J. R. & Schindler, W. R. (2004) Location of adenomas missed by optical colonoscopy. Ann Intern Med, 141 (5): 352-359.

263 | P a g e
Piñol, V., Andreu, M., Castells, A., Payá, A., Bessa, X., Jover, R. & Association, G. O. G. o. t. S. G. (2004) Synchronous colorectal neoplasms in patients with colorectal cancer: predisposing individual and familial factors. Dis Colon Rectum, 47 (7): 1192-1200.
Piñol, V., Castells, A., Andreu, M., Castellví-Bel, S., Alenda, C., Llor, X., Xicola, R. M., Rodríguez-Moranta, F., Payá, A., Jover, R., Bessa, X. & Association, G. O. G. o. t. S. G. (2005) Accuracy of revised Bethesda guidelines, microsatellite instability, and immunohistochemistry for the identification of patients with hereditary nonpolyposis colorectal cancer. JAMA, 293 (16): 1986-1994.
Poh, W., Wong, W., Ong, H., Aung, M. O., Lim, S. G., Chua, B. T. & Ho, H. K. (2012) Klotho-beta overexpression as a novel target for suppressing proliferation and fibroblast growth factor receptor-4 signaling in hepatocellular carcinoma. Mol Cancer, 11 14.
Polakis, P., Hart, M. & Rubinfeld, B. (1999) Defects in the regulation of beta-catenin in colorectal cancer. Adv Exp Med Biol, 470 23-32.
Pollard, J. W. (2004) Tumour-educated macrophages promote tumour progression and metastasis. Nat Rev Cancer, 4 (1): 71-78.
Polley, A. C., Mulholland, F., Pin, C., Williams, E. A., Bradburn, D. M., Mills, S. J., Mathers, J. C. & Johnson, I. T. (2006) Proteomic analysis reveals field-wide changes in protein expression in the morphologically normal mucosa of patients with colorectal neoplasia. Cancer Res, 66 (13): 6553-6562.
Polyak, K., Hamilton, S. R., Vogelstein, B. & Kinzler, K. W. (1996) Early alteration of cell-cycle-regulated gene expression in colorectal neoplasia. Am J Pathol, 149 (2): 381-387.
Potten, C. S., Kellett, M., Rew, D. A. & Roberts, S. A. (1992) Proliferation in human gastrointestinal epithelium using bromodeoxyuridine in vivo: data for different sites, proximity to a tumour, and polyposis coli. Gut, 33 (4): 524-529.
Potthoff, M. J., Boney-Montoya, J., Choi, M., He, T., Sunny, N. E., Satapati, S., Suino-Powell, K., Xu, H. E., Gerard, R. D., Finck, B. N., Burgess, S. C., Mangelsdorf, D. J. & Kliewer, S. A. (2011) FGF15/19 regulates hepatic glucose metabolism by inhibiting the CREB-PGC-1α pathway. Cell Metab, 13 (6): 729-738.
Potthoff, M. J., Kliewer, S. A. & Mangelsdorf, D. J. (2012) Endocrine fibroblast growth factors 15/19 and 21: from feast to famine. Genes Dev, 26 (4): 312-324.
Powell, A. K., Fernig, D. G. & Turnbull, J. E. (2002) Fibroblast growth factor receptors 1 and 2 interact differently with heparin/heparan sulfate. Implications for dynamic assembly of a ternary signaling complex. J Biol Chem, 277 (32): 28554-28563.

264 | P a g e
Purdie, C. A., O'Grady, J., Piris, J., Wyllie, A. H. & Bird, C. C. (1991) p53 expression in colorectal tumors. Am J Pathol, 138 (4): 807-813.
Qiu, W., David, D., Zhou, B., Chu, P. G., Zhang, B., Wu, M., Xiao, J., Han, T., Zhu, Z., Wang, T., Liu, X., Lopez, R., Frankel, P., Jong, A. & Yen, Y. (2003) Down-regulation of growth arrest DNA damage-inducible gene 45beta expression is associated with human hepatocellular carcinoma. Am J Pathol, 162 (6): 1961-1974.
Queen, M. M., Ryan, R. E., Holzer, R. G., Keller-Peck, C. R. & Jorcyk, C. L. (2005) Breast cancer cells stimulate neutrophils to produce oncostatin M: potential implications for tumor progression. Cancer Res, 65 (19): 8896-8904.
Quinn, M., Cooper, N. & Rowan, S. (2005) Cancer atlas of the United Kingdom and Ireland 1991-2000. [online] Available from: http://www.ons.gov.uk/ons/rel/cancer-unit/cancer-atlas-of-the-united-kingdom-and-ireland/1991---2000/index.html (Accessed
Radosevich, A. J., Mutyal, N. N., Turzhitsky, V., Rogers, J. D., Yi, J., Taflove, A. & Backman, V. (2011) Measurement of the spatial backscattering impulse-response at short length scales with polarized enhanced backscattering. Opt Lett, 36 (24): 4737-4739.
Radosevich, A. J., Rogers, J. D., Turzhitsky, V., Mutyal, N. N., Yi, J., Roy, H. K. & Backman, V. (2012) Polarized Enhanced Backscattering Spectroscopy for Characterization of Biological Tissues at Subdiffusion Length-scales. IEEE J Sel Top Quantum Electron, 18 (4): 1313-1325.
Radtke, F. & Clevers, H. (2005) Self-renewal and cancer of the gut: two sides of a coin. Science, 307 (5717): 1904-1909.
Rajagopalan, H., Bardelli, A., Lengauer, C., Kinzler, K. W., Vogelstein, B. & Velculescu, V. E. (2002) Tumorigenesis: RAF/RAS oncogenes and mismatch-repair status. Nature, 418 (6901): 934.
Rajaratnam, S. G. & Dennett, E. R. (2009) Development of metachronous neoplasms after colorectal cancer resection: absence of synchronous neoplasms predicts a lower risk. N Z Med J, 122 (1294): 61-66.
Raju, J. (2008) Azoxymethane-induced rat aberrant crypt foci: relevance in studying chemoprevention of colon cancer. World J Gastroenterol, 14 (43): 6632-6635.
Ramírez, N., Bandrés, E., Navarro, A., Pons, A., Jansa, S., Moreno, I., Martínez-Rodenas, F., Zárate, R., Bitarte, N., Monzó, M. & García-Foncillas, J. (2008) Epigenetic events in normal colonic mucosa surrounding colorectal cancer lesions. Eur J Cancer, 44 (17): 2689-2695.
Rashid, A., Houlihan, P. S., Booker, S., Petersen, G. M., Giardiello, F. M. & Hamilton, S. R. (2000) Phenotypic and molecular characteristics of hyperplastic polyposis. Gastroenterology, 119 (2): 323-332.

265 | P a g e
Razzaque, M. S. (2009) The FGF23-Klotho axis: endocrine regulation of phosphate homeostasis. Nat Rev Endocrinol, 5 (11): 611-619.
Rehbein, G., Simm, A., Hofmann, H. S., Silber, R. E. & Bartling, B. (2008) Molecular regulation of S100P in human lung adenocarcinomas. Int J Mol Med, 22 (1): 69-77.
Reiche, M., Bachmann, A., Lössner, U., Blüher, M., Stumvoll, M. & Fasshauer, M. (2010) Fibroblast growth factor 19 serum levels: relation to renal function and metabolic parameters. Horm Metab Res, 42 (3): 178-181.
Rex, D. K., Johnson, D. A., Lieberman, D. A., Burt, R. W. & Sonnenberg, A. (2000) Colorectal cancer prevention 2000: screening recommendations of the American College of Gastroenterology. American College of Gastroenterology. Am J Gastroenterol, 95 (4): 868-877.
Rex, D. K., Kahi, C. J., Levin, B., Smith, R. A., Bond, J. H., Brooks, D., Burt, R. W., Byers, T., Fletcher, R. H., Hyman, N., Johnson, D., Kirk, L., Lieberman, D. A., Levin, T. R., O'Brien, M. J., Simmang, C., Thorson, A. G., Winawer, S. J., Society, A. C. & Cancer, U. M.-S. T. F. o. C. (2006) Guidelines for colonoscopy surveillance after cancer resection: a consensus update by the American Cancer Society and the US Multi-Society Task Force on Colorectal Cancer. Gastroenterology, 130 (6): 1865-1871.
Rex, D. K. & Trustees, A. B. o. (2004) American College of Gastroenterology action plan for colorectal cancer prevention. Am J Gastroenterol, 99 (4): 574-577.
Riddell, R. H., Goldman, H., Ransohoff, D. F., Appelman, H. D., Fenoglio, C. M., Haggitt, R. C., Ahren, C., Correa, P., Hamilton, S. R. & Morson, B. C. (1983) Dysplasia in inflammatory bowel disease: standardized classification with provisional clinical applications. Hum Pathol, 14 (11): 931-968.
Riddell, R. H. & Levin, B. (1977) Ultrastructure of the "transitional" mucosa adjacent to large bowel carcinoma. Cancer, 40 (5 Suppl): 2509-2522.
Rijcken, F. E., Hollema, H. & Kleibeuker, J. H. (2002) Proximal adenomas in hereditary non-polyposis colorectal cancer are prone to rapid malignant transformation. Gut, 50 (3): 382-386.
Rijcken, F. E., Koornstra, J. J., van der Sluis, T., Boersma-van, E. W., Kleibeuker, J. H. & Hollema, H. (2008) Early carcinogenic events in HNPCC adenomas: differences with sporadic adenomas. Dig Dis Sci, 53 (6): 1660-1668.
Risques, R. A., Lai, L. A., Himmetoglu, C., Ebaee, A., Li, L., Feng, Z., Bronner, M. P., Al-Lahham, B., Kowdley, K. V., Lindor, K. D., Rabinovitch, P. S. & Brentnall, T. A. (2011) Ulcerative colitis-associated colorectal cancer arises in a field of short telomeres, senescence, and inflammation. Cancer Res, 71 (5): 1669-1679.

266 | P a g e
Rödel, C., Martus, P., Papadoupolos, T., Füzesi, L., Klimpfinger, M., Fietkau, R., Liersch, T., Hohenberger, W., Raab, R., Sauer, R. & Wittekind, C. (2005) Prognostic significance of tumor regression after preoperative chemoradiotherapy for rectal cancer. J Clin Oncol, 23 (34): 8688-8696.
Rosenberg, D. W., Yang, S., Pleau, D. C., Greenspan, E. J., Stevens, R. G., Rajan, T. V., Heinen, C. D., Levine, J., Zhou, Y. & O'Brien, M. J. (2007) Mutations in BRAF and KRAS differentially distinguish serrated versus non-serrated hyperplastic aberrant crypt foci in humans. Cancer Res, 67 (8): 3551-3554.
Rosenfeld, S. (2013) Are the somatic mutation and tissue organization field theories of carcinogenesis incompatible? Cancer Inform, 12 221-229.
Roy, H. K., Gomes, A., Turzhitsky, V., Goldberg, M. J., Rogers, J., Ruderman, S., Young, K. L., Kromine, A., Brand, R. E., Jameel, M., Vakil, P., Hasabou, N. & Backman, V. (2008) Spectroscopic microvascular blood detection from the endoscopically normal colonic mucosa: biomarker for neoplasia risk. Gastroenterology, 135 (4): 1069-1078.
Roy, H. K., Liu, Y., Wali, R. K., Kim, Y. L., Kromine, A. K., Goldberg, M. J. & Backman, V. (2004) Four-dimensional elastic light-scattering fingerprints as preneoplastic markers in the rat model of colon carcinogenesis. Gastroenterology, 126 (4): 1071-1081; discussion 1948.
Rubin, H. (2011) Fields and field cancerization: the preneoplastic origins of cancer: asymptomatic hyperplastic fields are precursors of neoplasia, and their progression to tumors can be tracked by saturation density in culture. Bioessays, 33 (3): 224-231.
Rubin, J. S., Osada, H., Finch, P. W., Taylor, W. G., Rudikoff, S. & Aaronson, S. A. (1989) Purification and characterization of a newly identified growth factor specific for epithelial cells. Proc Natl Acad Sci U S A, 86 (3): 802-806.
Sahadevan, K., Darby, S., Leung, H. Y., Mathers, M. E., Robson, C. N. & Gnanapragasam, V. J. (2007) Selective over-expression of fibroblast growth factor receptors 1 and 4 in clinical prostate cancer. J Pathol, 213 (1): 82-90.
Salazar, R., Roepman, P., Capella, G., Moreno, V., Simon, I., Dreezen, C., Lopez-Doriga, A., Santos, C., Marijnen, C., Westerga, J., Bruin, S., Kerr, D., Kuppen, P., van de Velde, C., Morreau, H., Van Velthuysen, L., Glas, A. M., Van't Veer, L. J. & Tollenaar, R. (2011) Gene expression signature to improve prognosis prediction of stage II and III colorectal cancer. J Clin Oncol, 29 (1): 17-24.
Samuels, Y., Wang, Z., Bardelli, A., Silliman, N., Ptak, J., Szabo, S., Yan, H., Gazdar, A., Powell, S. M., Riggins, G. J., Willson, J. K., Markowitz, S., Kinzler, K. W., Vogelstein, B. & Velculescu, V. E. (2004) High frequency of mutations of the PIK3CA gene in human cancers. Science, 304 (5670): 554.

267 | P a g e
Sant, M., Allemani, C., Santaquilani, M., Knijn, A., Marchesi, F., Capocaccia, R. & Group, E. W. (2009) EUROCARE-4. Survival of cancer patients diagnosed in 1995-1999. Results and commentary. Eur J Cancer, 45 (6): 931-991.
Santarelli, R. L., Pierre, F. & Corpet, D. E. (2008) Processed meat and colorectal cancer: a review of epidemiologic and experimental evidence. Nutr Cancer, 60 (2): 131-144.
Sato, T., Oshima, T., Yoshihara, K., Yamamoto, N., Yamada, R., Nagano, Y., Fujii, S., Kunisaki, C., Shiozawa, M., Akaike, M., Rino, Y., Tanaka, K., Masuda, M. & Imada, T. (2009) Overexpression of the fibroblast growth factor receptor-1 gene correlates with liver metastasis in colorectal cancer. Oncol Rep, 21 (1): 211-216.
Sawey, E. T., Chanrion, M., Cai, C., Wu, G., Zhang, J., Zender, L., Zhao, A., Busuttil, R. W., Yee, H., Stein, L., French, D. M., Finn, R. S., Lowe, S. W. & Powers, S. (2011) Identification of a therapeutic strategy targeting amplified FGF19 in liver cancer by Oncogenomic screening. Cancer Cell, 19 (3): 347-358.
Scapini, P., Lapinet-Vera, J. A., Gasperini, S., Calzetti, F., Bazzoni, F. & Cassatella, M. A. (2000) The neutrophil as a cellular source of chemokines. Immunol Rev, 177 195-203.
Scarpa, M., Ruffolo, C., Erroi, F., Fiorot, A., Basato, S., Pozza, A., Canal, F., Massani, M., Cavallin, F., Antoniutti, M., Bassi, N. & Castoro, C. (2014) Obesity is a risk factor for multifocal disease and recurrence after colorectal cancer surgery: a case-control study. Anticancer Res, 34 (10): 5735-5741.
Scheer, A. & Auer, R. A. (2009) Surveillance after curative resection of colorectal cancer. Clin Colon Rectal Surg, 22 (4): 242-250.
Schimanski, C. C., Schwald, S., Simiantonaki, N., Jayasinghe, C., Gönner, U., Wilsberg, V., Junginger, T., Berger, M. R., Galle, P. R. & Moehler, M. (2005) Effect of chemokine receptors CXCR4 and CCR7 on the metastatic behavior of human colorectal cancer. Clin Cancer Res, 11 (5): 1743-1750.
Schoentag, R., Primus, F. J. & Kuhns, W. (1987) ABH and Lewis blood group expression in colorectal carcinoma. Cancer Res, 47 (6): 1695-1700.
Scholefield, J. H., Moss, S., Sufi, F., Mangham, C. M. & Hardcastle, J. D. (2002) Effect of faecal occult blood screening on mortality from colorectal cancer: results from a randomised controlled trial. Gut, 50 (6): 840-844.
Schwickert, G., Walenta, S., Sundfør, K., Rofstad, E. K. & Mueller-Klieser, W. (1995) Correlation of high lactate levels in human cervical cancer with incidence of metastasis. Cancer Res, 55 (21): 4757-4759.

268 | P a g e
Segnan, N., Senore, C., Andreoni, B., Arrigoni, A., Bisanti, L., Cardelli, A., Castiglione, G., Crosta, C., DiPlacido, R., Ferrari, A., Ferraris, R., Ferrero, F., Fracchia, M., Gasperoni, S., Malfitana, G., Recchia, S., Risio, M., Rizzetto, M., Saracco, G., Spandre, M., Turco, D., Turco, P., Zappa, M. & Group-Italy, S. W. (2005) Randomized trial of different screening strategies for colorectal cancer: patient response and detection rates. J Natl Cancer Inst, 97 (5): 347-357.
Segnan, N., Senore, C., Andreoni, B., Aste, H., Bonelli, L., Crosta, C., Ferraris, R., Gasperoni, S., Penna, A., Risio, M., Rossini, F. P., Sciallero, S., Zappa, M., Atkin, W. S. & Group--Italy, S. W. (2002) Baseline findings of the Italian multicenter randomized controlled trial of "once-only sigmoidoscopy"--SCORE. J Natl Cancer Inst, 94 (23): 1763-1772.
Seitz, H. K. & Mueller, S. (2015) Alcohol and cancer: an overview with special emphasis on the role of acetaldehyde and cytochrome P450 2E1. Adv Exp Med Biol, 815 59-70.
Selby, J. V., Friedman, G. D., Quesenberry, C. P. & Weiss, N. S. (1993) Effect of fecal occult blood testing on mortality from colorectal cancer. A case-control study. Ann Intern Med, 118 (1): 1-6.
Senter, L., Clendenning, M., Sotamaa, K., Hampel, H., Green, J., Potter, J. D., Lindblom, A., Lagerstedt, K., Thibodeau, S. N., Lindor, N. M., Young, J., Winship, I., Dowty, J. G., White, D. M., Hopper, J. L., Baglietto, L., Jenkins, M. A. & de la Chapelle, A. (2008) The clinical phenotype of Lynch syndrome due to germ-line PMS2 mutations. Gastroenterology, 135 (2): 419-428.
Senyilmaz, D. & Teleman, A. A. (2015) Chicken or the egg: Warburg effect and mitochondrial dysfunction. F1000Prime Rep, 7 41.
Shen, L., Kondo, Y., Rosner, G. L., Xiao, L., Hernandez, N. S., Vilaythong, J., Houlihan, P. S., Krouse, R. S., Prasad, A. R., Einspahr, J. G., Buckmeier, J., Alberts, D. S., Hamilton, S. R. & Issa, J. P. (2005) MGMT promoter methylation and field defect in sporadic colorectal cancer. J Natl Cancer Inst, 97 (18): 1330-1338.
Shih, I. M., Wang, T. L., Traverso, G., Romans, K., Hamilton, S. R., Ben-Sasson, S., Kinzler, K. W. & Vogelstein, B. (2001) Top-down morphogenesis of colorectal tumors. Proc Natl Acad Sci U S A, 98 (5): 2640-2645.
Sica, A., Schioppa, T., Mantovani, A. & Allavena, P. (2006) Tumour-associated macrophages are a distinct M2 polarised population promoting tumour progression: potential targets of anti-cancer therapy. Eur J Cancer, 42 (6): 717-727.
Sickert, D., Aust, D. E., Langer, S., Haupt, I., Baretton, G. B. & Dieter, P. (2005) Characterization of macrophage subpopulations in colon cancer using tissue microarrays. Histopathology, 46 (5): 515-521.

269 | P a g e
Siddiqi, I., Funatomi, H., Kobrin, M. S., Friess, H., Buchler, M. W. & Korc, M. (1995) Increased expression of keratinocyte growth factor in human pancreatic cancer. Biochem Biophys Res Commun, 215 (1): 309-315.
Singh, H., Turner, D., Xue, L., Targownik, L. E. & Bernstein, C. N. (2006) Risk of developing colorectal cancer following a negative colonoscopy examination: evidence for a 10-year interval between colonoscopies. JAMA, 295 (20): 2366-2373.
Sinha, R. (2002) An epidemiologic approach to studying heterocyclic amines. Mutat Res, 506-507 197-204.
Sinicrope, F. A. & Sargent, D. J. (2012) Molecular pathways: microsatellite instability in colorectal cancer: prognostic, predictive, and therapeutic implications. Clin Cancer Res, 18 (6): 1506-1512.
Sinicrope, F. A., Shi, Q., Smyrk, T. C., Thibodeau, S. N., Dienstmann, R., Guinney, J., Bot, B. M., Tejpar, S., Delorenzi, M., Goldberg, R. M., Mahoney, M., Sargent, D. J. & Alberts, S. R. (2015) Molecular markers identify subtypes of stage III colon cancer associated with patient outcomes. Gastroenterology, 148 (1): 88-99.
Sint Nicolaas, J., de Jonge, V., Steyerberg, E. W., Kuipers, E. J., van Leerdam, M. E. & Veldhuyzen-van Zanten, S. J. (2010) Risk of colorectal carcinoma in post-liver transplant patients: a systematic review and meta-analysis. Am J Transplant, 10 (4): 868-876.
SLAUGHTER, D. P., SOUTHWICK, H. W. & SMEJKAL, W. (1953) Field cancerization in oral stratified squamous epithelium; clinical implications of multicentric origin. Cancer, 6 (5): 963-968.
Sleeman, M., Fraser, J., McDonald, M., Yuan, S., White, D., Grandison, P., Kumble, K., Watson, J. D. & Murison, J. G. (2001) Identification of a new fibroblast growth factor receptor, FGFR5. Gene, 271 (2): 171-182.
Slodkowska, E. A. & Ross, J. S. (2009) MammaPrint 70-gene signature: another milestone in personalized medical care for breast cancer patients. Expert Rev Mol Diagn, 9 (5): 417-422.
Snover, D., Burt, A. & Odze, R. (2010) Serrated polyps of the colon and rectum and serrated polyposis, WHO Classification of Tumours of the Digestive System, 4th Edition. Lyon, France: IARC.
Sørensen, N. M., Byström, P., Christensen, I. J., Berglund, A., Nielsen, H. J., Brünner, N. & Glimelius, B. (2007) TIMP-1 is significantly associated with objective response and survival in metastatic colorectal cancer patients receiving combination of irinotecan, 5-fluorouracil, and folinic acid. Clin Cancer Res, 13 (14): 4117-4122.

270 | P a g e
Soto, A. M. & Sonnenschein, C. (2004) The somatic mutation theory of cancer: growing problems with the paradigm? Bioessays, 26 (10): 1097-1107.
Soto, A. M. & Sonnenschein, C. (2005) Emergentism as a default: cancer as a problem of tissue organization. J Biosci, 30 (1): 103-118.
Soto, A. M. & Sonnenschein, C. (2011) The tissue organization field theory of cancer: a testable replacement for the somatic mutation theory. Bioessays, 33 (5): 332-340.
Spinola, M., Leoni, V. P., Tanuma, J., Pettinicchio, A., Frattini, M., Signoroni, S., Agresti, R., Giovanazzi, R., Pilotti, S., Bertario, L., Ravagnani, F. & Dragani, T. A. (2005) FGFR4 Gly388Arg polymorphism and prognosis of breast and colorectal cancer. Oncol Rep, 14 (2): 415-419.
Stephens, P. J., Greenman, C. D., Fu, B., Yang, F., Bignell, G. R., Mudie, L. J., Pleasance, E. D., Lau, K. W., Beare, D., Stebbings, L. A., McLaren, S., Lin, M. L., McBride, D. J., Varela, I., Nik-Zainal, S., Leroy, C., Jia, M., Menzies, A., Butler, A. P., Teague, J. W., Quail, M. A., Burton, J., Swerdlow, H., Carter, N. P., Morsberger, L. A., Iacobuzio-Donahue, C., Follows, G. A., Green, A. R., Flanagan, A. M., Stratton, M. R., Futreal, P. A. & Campbell, P. J. (2011) Massive genomic rearrangement acquired in a single catastrophic event during cancer development. Cell, 144 (1): 27-40.
Stigliano, V., Assisi, D., Cosimelli, M., Palmirotta, R., Giannarelli, D., Mottolese, M., Mete, L. S., Mancini, R. & Casale, V. (2008) Survival of hereditary non-polyposis colorectal cancer patients compared with sporadic colorectal cancer patients. J Exp Clin Cancer Res, 27 39.
Strieter, R. M., Addison, C. L., Ehlert, J. E., Keane, M. P., Belperio, J. A., Burdick, M. D. & Arenberg, D. A. (1999) Use of Immunodeficient Mice for the Evaluation of CXC Chemokines in the Regulation of Tumor-associated Angiogenesis. ILAR J, 40 (4): 175-182.
Strieter, R. M., Burdick, M. D., Mestas, J., Gomperts, B., Keane, M. P. & Belperio, J. A. (2006) Cancer CXC chemokine networks and tumour angiogenesis. Eur J Cancer, 42 (6): 768-778.
Strieter, R. M., Polverini, P. J., Kunkel, S. L., Arenberg, D. A., Burdick, M. D., Kasper, J., Dzuiba, J., Van Damme, J., Walz, A. & Marriott, D. (1995) The functional role of the ELR motif in CXC chemokine-mediated angiogenesis. J Biol Chem, 270 (45): 27348-27357.
Stryker, S. J., Wolff, B. G., Culp, C. E., Libbe, S. D., Ilstrup, D. M. & MacCarty, R. L. (1987) Natural history of untreated colonic polyps. Gastroenterology, 93 (5): 1009-1013.
Sturm, A., Baumgart, D. C., d'Heureuse, J. H., Hotz, A., Wiedenmann, B. & Dignass, A. U. (2005) CXCL8 modulates human intestinal epithelial cells through a CXCR1 dependent pathway. Cytokine, 29 (1): 42-48.
Sugimachi, K., Yokobori, T., Iinuma, H., Ueda, M., Ueo, H., Shinden, Y., Eguchi, H., Sudo, T., Suzuki, A., Maehara, Y., Mori, M. & Mimori, K. (2014) Aberrant expression of plastin-3 via

271 | P a g e
copy number gain induces the epithelial-mesenchymal transition in circulating colorectal cancer cells. Ann Surg Oncol, 21 (11): 3680-3690.
Sugita, A., Sachar, D. B., Bodian, C., Ribeiro, M. B., Aufses, A. H. & Greenstein, A. J. (1991) Colorectal cancer in ulcerative colitis. Influence of anatomical extent and age at onset on colitis-cancer interval. Gut, 32 (2): 167-169.
Sugiyama, N., Varjosalo, M., Meller, P., Lohi, J., Hyytiäinen, M., Kilpinen, S., Kallioniemi, O., Ingvarsen, S., Engelholm, L. H., Taipale, J., Alitalo, K., Keski-Oja, J. & Lehti, K. (2010) Fibroblast growth factor receptor 4 regulates tumor invasion by coupling fibroblast growth factor signaling to extracellular matrix degradation. Cancer Res, 70 (20): 7851-7861.
Summers, T., Langan, R. C., Nissan, A., Brücher, B. L., Bilchik, A. J., Protic, M., Daumer, M., Avital, I. & Stojadinovic, A. (2013) Serum-based DNA methylation biomarkers in colorectal cancer: potential for screening and early detection. J Cancer, 4 (3): 210-216.
Sylvester, P. A., Myerscough, N., Warren, B. F., Carlstedt, I., Corfield, A. P., Durdey, P. & Thomas, M. G. (2001) Differential expression of the chromosome 11 mucin genes in colorectal cancer. J Pathol, 195 (3): 327-335.
Szulman, A. E. (1987) Evolution of ABH blood group antigens during embryogenesis. Ann Inst Pasteur Immunol, 138 (6): 845-847.
Tahara, T., Yamamoto, E., Madireddi, P., Suzuki, H., Maruyama, R., Chung, W., Garriga, J., Jelinek, J., Yamano, H. O., Sugai, T., Kondo, Y., Toyota, M., Issa, J. P. & Estécio, M. R. (2014) Colorectal carcinomas with CpG island methylator phenotype 1 frequently contain mutations in chromatin regulators. Gastroenterology, 146 (2): 530-538.e535.
Takagi, Y., Kohmura, H., Futamura, M., Kida, H., Tanemura, H., Shimokawa, K. & Saji, S. (1996) Somatic alterations of the DPC4 gene in human colorectal cancers in vivo. Gastroenterology, 111 (5): 1369-1372.
Takagi, Y., Koumura, H., Futamura, M., Aoki, S., Ymaguchi, K., Kida, H., Tanemura, H., Shimokawa, K. & Saji, S. (1998) Somatic alterations of the SMAD-2 gene in human colorectal cancers. Br J Cancer, 78 (9): 1152-1155.
Takayama, T., Ohi, M., Hayashi, T., Miyanishi, K., Nobuoka, A., Nakajima, T., Satoh, T., Takimoto, R., Kato, J., Sakamaki, S. & Niitsu, Y. (2001) Analysis of K-ras, APC, and beta-catenin in aberrant crypt foci in sporadic adenoma, cancer, and familial adenomatous polyposis. Gastroenterology, 121 (3): 599-611.
Tam, W. L. & Weinberg, R. A. (2013) The epigenetics of epithelial-mesenchymal plasticity in cancer. Nat Med, 19 (11): 1438-1449.

272 | P a g e
Taylor, J. G., Cheuk, A. T., Tsang, P. S., Chung, J. Y., Song, Y. K., Desai, K., Yu, Y., Chen, Q. R., Shah, K., Youngblood, V., Fang, J., Kim, S. Y., Yeung, C., Helman, L. J., Mendoza, A., Ngo, V., Staudt, L. M., Wei, J. S., Khanna, C., Catchpoole, D., Qualman, S. J., Hewitt, S. M., Merlino, G., Chanock, S. J. & Khan, J. (2009) Identification of FGFR4-activating mutations in human rhabdomyosarcomas that promote metastasis in xenotransplanted models. J Clin Invest, 119 (11): 3395-3407.
Terpstra, O. T., van Blankenstein, M., Dees, J. & Eilers, G. A. (1987) Abnormal pattern of cell proliferation in the entire colonic mucosa of patients with colon adenoma or cancer. Gastroenterology, 92 (3): 704-708.
Thiagalingam, S., Laken, S., Willson, J. K., Markowitz, S. D., Kinzler, K. W., Vogelstein, B. & Lengauer, C. (2001) Mechanisms underlying losses of heterozygosity in human colorectal cancers. Proc Natl Acad Sci U S A, 98 (5): 2698-2702.
Thiagalingam, S., Lengauer, C., Leach, F. S., Schutte, M., Hahn, S. A., Overhauser, J., Willson, J. K., Markowitz, S., Hamilton, S. R., Kern, S. E., Kinzler, K. W. & Vogelstein, B. (1996) Evaluation of candidate tumour suppressor genes on chromosome 18 in colorectal cancers. Nat Genet, 13 (3): 343-346.
Thibodeau, S. N., Bren, G. & Schaid, D. (1993) Microsatellite instability in cancer of the proximal colon. Science, 260 (5109): 816-819.
Thiis-Evensen, E., Hoff, G. S., Sauar, J., Langmark, F., Majak, B. M. & Vatn, M. H. (1999) Population-based surveillance by colonoscopy: effect on the incidence of colorectal cancer. Telemark Polyp Study I. Scand J Gastroenterol, 34 (4): 414-420.
Thomas, T., Abrams, K. A., Robinson, R. J. & Mayberry, J. F. (2007) Meta-analysis: cancer risk of low-grade dysplasia in chronic ulcerative colitis. Aliment Pharmacol Ther, 25 (6): 657-668.
Timpte, C. S., Eckhardt, A. E., Abernethy, J. L. & Hill, R. L. (1988) Porcine submaxillary gland apomucin contains tandemly repeated, identical sequences of 81 residues. J Biol Chem, 263 (2): 1081-1088.
Tokunaga, T., Oshika, Y., Abe, Y., Ozeki, Y., Sadahiro, S., Kijima, H., Tsuchida, T., Yamazaki, H., Ueyama, Y., Tamaoki, N. & Nakamura, M. (1998) Vascular endothelial growth factor (VEGF) mRNA isoform expression pattern is correlated with liver metastasis and poor prognosis in colon cancer. Br J Cancer, 77 (6): 998-1002.
Tol, J. & Punt, C. J. (2010) Monoclonal antibodies in the treatment of metastatic colorectal cancer: a review. Clin Ther, 32 (3): 437-453.
Tomasetti, C. & Vogelstein, B. (2015) Cancer etiology. Variation in cancer risk among tissues can be explained by the number of stem cell divisions. Science, 347 (6217): 78-81.

273 | P a g e
Tomiyama, K., Maeda, R., Urakawa, I., Yamazaki, Y., Tanaka, T., Ito, S., Nabeshima, Y., Tomita, T., Odori, S., Hosoda, K., Nakao, K. & Imura, A. (2010) Relevant use of Klotho in FGF19 subfamily signaling system in vivo. Proc Natl Acad Sci U S A, 107 (4): 1666-1671.
Tomlinson, E., Fu, L., John, L., Hultgren, B., Huang, X., Renz, M., Stephan, J. P., Tsai, S. P., Powell-Braxton, L., French, D. & Stewart, T. A. (2002) Transgenic mice expressing human fibroblast growth factor-19 display increased metabolic rate and decreased adiposity. Endocrinology, 143 (5): 1741-1747.
Tóthová, V. & Gibadulinová, A. (2013) S100P, a peculiar member of S100 family of calcium-binding proteins implicated in cancer. Acta Virol, 57 (2): 238-246.
Tripathi, M., Billet, S. & Bhowmick, N. A. (2012) Understanding the role of stromal fibroblasts in cancer progression. Cell Adh Migr, 6 (3): 231-235.
Tsai, H. C., Ye, S. Y., Lee, S. S., Wann, S. R. & Chen, Y. S. (2014) Expression of CXCL2 in the serum and cerebrospinal fluid of patients with HIV and syphilis or neurosyphilis. Inflammation, 37 (3): 950-955.
Tsao, J. L., Yatabe, Y., Salovaara, R., Järvinen, H. J., Mecklin, J. P., Aaltonen, L. A., Tavaré, S. & Shibata, D. (2000) Genetic reconstruction of individual colorectal tumor histories. Proc Natl Acad Sci U S A, 97 (3): 1236-1241.
Tsong, W. H., Koh, W. P., Yuan, J. M., Wang, R., Sun, C. L. & Yu, M. C. (2007) Cigarettes and alcohol in relation to colorectal cancer: the Singapore Chinese Health Study. Br J Cancer, 96 (5): 821-827.
Turner, N. & Grose, R. (2010) Fibroblast growth factor signalling: from development to cancer. Nat Rev Cancer, 10 (2): 116-129.
Ulich, T. R., Whitcomb, L., Tang, W., O'Conner Tressel, P., Tarpley, J., Yi, E. S. & Lacey, D. (1997) Keratinocyte growth factor ameliorates cyclophosphamide-induced ulcerative hemorrhagic cystitis. Cancer Res, 57 (3): 472-475.
Ulich, T. R., Yi, E. S., Longmuir, K., Yin, S., Biltz, R., Morris, C. F., Housley, R. M. & Pierce, G. F. (1994) Keratinocyte growth factor is a growth factor for type II pneumocytes in vivo. J Clin Invest, 93 (3): 1298-1306.
Umar, A., Boland, C. R., Terdiman, J. P., Syngal, S., de la Chapelle, A., Rüschoff, J., Fishel, R., Lindor, N. M., Burgart, L. J., Hamelin, R., Hamilton, S. R., Hiatt, R. A., Jass, J., Lindblom, A., Lynch, H. T., Peltomaki, P., Ramsey, S. D., Rodriguez-Bigas, M. A., Vasen, H. F., Hawk, E. T., Barrett, J. C., Freedman, A. N. & Srivastava, S. (2004) Revised Bethesda Guidelines for hereditary nonpolyposis colorectal cancer (Lynch syndrome) and microsatellite instability. J Natl Cancer Inst, 96 (4): 261-268.

274 | P a g e
Urakawa, I., Yamazaki, Y., Shimada, T., Iijima, K., Hasegawa, H., Okawa, K., Fujita, T., Fukumoto, S. & Yamashita, T. (2006) Klotho converts canonical FGF receptor into a specific receptor for FGF23. Nature, 444 (7120): 770-774.
Uzan, B., Figeac, F., Portha, B. & Movassat, J. (2009) Mechanisms of KGF mediated signaling in pancreatic duct cell proliferation and differentiation. PLoS One, 4 (3): e4734.
van Es, J. H. & Clevers, H. (2005) Notch and Wnt inhibitors as potential new drugs for intestinal neoplastic disease. Trends Mol Med, 11 (11): 496-502.
Van Ginderachter, J. A., Movahedi, K., Van den Bossche, J. & De Baetselier, P. (2008) Macrophages, PPARs, and Cancer. PPAR Res, 2008 169414.
van Stolk, R. U., Beck, G. J., Baron, J. A., Haile, R. & Summers, R. (1998) Adenoma characteristics at first colonoscopy as predictors of adenoma recurrence and characteristics at follow-up. The Polyp Prevention Study Group. Gastroenterology, 115 (1): 13-18.
Vander Heiden, M. G., Cantley, L. C. & Thompson, C. B. (2009) Understanding the Warburg effect: the metabolic requirements of cell proliferation. Science, 324 (5930): 1029-1033.
Vandercappellen, J., Van Damme, J. & Struyf, S. (2008) The role of CXC chemokines and their receptors in cancer. Cancer Lett, 267 (2): 226-244.
Vasen, H. F., Watson, P., Mecklin, J. P. & Lynch, H. T. (1999) New clinical criteria for hereditary nonpolyposis colorectal cancer (HNPCC, Lynch syndrome) proposed by the International Collaborative group on HNPCC. Gastroenterology, 116 (6): 1453-1456.
Velcich, A., Yang, W., Heyer, J., Fragale, A., Nicholas, C., Viani, S., Kucherlapati, R., Lipkin, M., Yang, K. & Augenlicht, L. (2002) Colorectal cancer in mice genetically deficient in the mucin Muc2. Science, 295 (5560): 1726-1729.
Verhest, A., Kiss, R., d'Olne, D., Larsimont, D., Salmon, I., de Launoit, Y., Fourneau, C., Pasteels, J. L. & Pector, J. C. (1990) Characterization of human colorectal mucosa, polyps, and cancers by means of computerized morphonuclear image analyses. Cancer, 65 (9): 2047-2054.
Vogelsang, H., Haas, S., Hierholzer, C., Berger, U., Siewert, J. R. & Präuer, H. (2004) Factors influencing survival after resection of pulmonary metastases from colorectal cancer. Br J Surg, 91 (8): 1066-1071.
Vogelstein, B., Fearon, E. R., Hamilton, S. R., Kern, S. E., Preisinger, A. C., Leppert, M., Nakamura, Y., White, R., Smits, A. M. & Bos, J. L. (1988) Genetic alterations during colorectal-tumor development. N Engl J Med, 319 (9): 525-532.

275 | P a g e
von Roon, A. C., Reese, G., Teare, J., Constantinides, V., Darzi, A. W. & Tekkis, P. P. (2007) The risk of cancer in patients with Crohn's disease. Dis Colon Rectum, 50 (6): 839-855.
Wakefield, L. M. & Roberts, A. B. (2002) TGF-β signaling: positive and negative effects on tumorigenesis. Current Opinion in Genetics & Development, 12 (1): 22-29.
Waldner, M., Schimanski, C. C. & Neurath, M. F. (2006) Colon cancer and the immune system: the role of tumor invading T cells. World J Gastroenterol, 12 (45): 7233-7238.
Walenta, S., Chau, T. V., Schroeder, T., Lehr, H. A., Kunz-Schughart, L. A., Fuerst, A. & Mueller-Klieser, W. (2003) Metabolic classification of human rectal adenocarcinomas: a novel guideline for clinical oncologists? J Cancer Res Clin Oncol, 129 (6): 321-326.
Walenta, S., Salameh, A., Lyng, H., Evensen, J. F., Mitze, M., Rofstad, E. K. & Mueller-Klieser, W. (1997) Correlation of high lactate levels in head and neck tumors with incidence of metastasis. Am J Pathol, 150 (2): 409-415.
Walsh, M. D., Clendenning, M., Williamson, E., Pearson, S. A., Walters, R. J., Nagler, B., Packenas, D., Win, A. K., Hopper, J. L., Jenkins, M. A., Haydon, A. M., Rosty, C., English, D. R., Giles, G. G., McGuckin, M. A., Young, J. P. & Buchanan, D. D. (2013) Expression of MUC2, MUC5AC, MUC5B, and MUC6 mucins in colorectal cancers and their association with the CpG island methylator phenotype. Mod Pathol, 26 (12): 1642-1656.
Wanebo, H. J. & Berz, D. (2010) The neoadjuvant therapy of colorectal hepatic metastases and the role of biologic sensitizing and resistance factors. J Surg Oncol, 102 (8): 891-897.
Wang, B., Akiyama, K., Jia, J. T. & Kimura, H. (1994a) Measuring H type 1 and H type 2 antigens in human saliva by immunoassay using artificial antigens as standard substances. Forensic Sci Int, 67 (1): 1-8.
Wang, B., Akiyama, K. & Kimura, H. (1994b) Quantitative analysis of Le(a) and Le(b) antigens in human saliva. Vox Sang, 66 (4): 280-286.
Wang, B., Hendricks, D. T., Wamunyokoli, F. & Parker, M. I. (2006a) A growth-related oncogene/CXC chemokine receptor 2 autocrine loop contributes to cellular proliferation in esophageal cancer. Cancer Res, 66 (6): 3071-3077.
Wang, C., Lin, S., Nie, Y., Jia, X., Wang, J., Xiao, J., Wu, J., Li, X. & Wu, X. (2010) Mechanism of antitumor effect of a novel bFGF binding peptide on human colon cancer cells. Cancer Sci, 101 (5): 1212-1218.
Wang, D., Mann, J. R. & DuBois, R. N. (2004a) WNT and cyclooxygenase-2 cross-talk accelerates adenoma growth. Cell Cycle, 3 (12): 1512-1515.

276 | P a g e
Wang, D., Wang, H., Brown, J., Daikoku, T., Ning, W., Shi, Q., Richmond, A., Strieter, R., Dey, S. K. & DuBois, R. N. (2006b) CXCL1 induced by prostaglandin E2 promotes angiogenesis in colorectal cancer. J Exp Med, 203 (4): 941-951.
Wang, D., Wang, H., Shi, Q., Katkuri, S., Walhi, W., Desvergne, B., Das, S. K., Dey, S. K. & DuBois, R. N. (2004b) Prostaglandin E(2) promotes colorectal adenoma growth via transactivation of the nuclear peroxisome proliferator-activated receptor delta. Cancer Cell, 6 (3): 285-295.
Wang, J. Y., Yeh, C. S., Tzou, W. S., Hsieh, J. S., Chen, F. M., Lu, C. Y., Yu, F. J., Cheng, T. L., Huang, T. J. & Lin, S. R. (2005) Analysis of progressively overexpressed genes in tumorigenesis of colorectal cancers using cDNA microarray. Oncol Rep, 14 (1): 65-72.
Wang, P. (2015) Suppression of DACH1 promotes migration and invasion of colorectal cancer via activating TGF-β-mediated epithelial-mesenchymal transition. Biochem Biophys Res Commun, 460 (2): 314-319.
Wang, Q., Williamson, M., Bott, S., Brookman-Amissah, N., Freeman, A., Nariculam, J., Hubank, M. J., Ahmed, A. & Masters, J. R. (2007) Hypomethylation of WNT5A, CRIP1 and S100P in prostate cancer. Oncogene, 26 (45): 6560-6565.
Wang, Q., Zhang, Y. N., Lin, G. L., Qiu, H. Z., Wu, B., Wu, H. Y., Zhao, Y., Chen, Y. J. & Lu, C. M. (2012) S100P, a potential novel prognostic marker in colorectal cancer. Oncol Rep, 28 (1): 303-310.
Wang, Z., Li, Y., Liu, E. T. & Yu, Q. (2004c) Susceptibility to cell death induced by blockade of MAPK pathway in human colorectal cancer cells carrying Ras mutations is dependent on p53 status. Biochem Biophys Res Commun, 322 (2): 609-613.
WARBURG, O. (1956) On the origin of cancer cells. Science, 123 (3191): 309-314.
Wasan, H. S., Park, H. S., Liu, K. C., Mandir, N. K., Winnett, A., Sasieni, P., Bodmer, W. F., Goodlad, R. A. & Wright, N. A. (1998) APC in the regulation of intestinal crypt fission. J Pathol, 185 (3): 246-255.
Watanabe, M., Ishiwata, T., Nishigai, K., Moriyama, Y. & Asano, G. (2000) Overexpression of keratinocyte growth factor in cancer cells and enterochromaffin cells in human colorectal cancer. Pathol Int, 50 (5): 363-372.
Watson, P., Vasen, H. F., Mecklin, J. P., Bernstein, I., Aarnio, M., Järvinen, H. J., Myrhøj, T., Sunde, L., Wijnen, J. T. & Lynch, H. T. (2008) The risk of extra-colonic, extra-endometrial cancer in the Lynch syndrome. Int J Cancer, 123 (2): 444-449.

277 | P a g e
Weiss, A. A., Babyatsky, M. W., Ogata, S., Chen, A. & Itzkowitz, S. H. (1996) Expression of MUC2 and MUC3 mRNA in human normal, malignant, and inflammatory intestinal tissues. J Histochem Cytochem, 44 (10): 1161-1166.
Wen, Y., Giardina, S. F., Hamming, D., Greenman, J., Zachariah, E., Bacolod, M. D., Liu, H., Shia, J., Amenta, P. S., Barany, F., Paty, P., Gerald, W. & Notterman, D. (2006) GROalpha is highly expressed in adenocarcinoma of the colon and down-regulates fibulin-1. Clin Cancer Res, 12 (20 Pt 1): 5951-5959.
Westenbrink, E., Arasaradnam, R. P., O'Connell, N., Bailey, C., Nwokolo, C., Bardhan, K. D. & Covington, J. A. (2015) Development and application of a new electronic nose instrument for the detection of colorectal cancer. Biosens Bioelectron, 67 733-738.
Whitlock, E. P., Lin, J. S., Liles, E., Beil, T. L. & Fu, R. (2008) Screening for colorectal cancer: a targeted, updated systematic review for the U.S. Preventive Services Task Force. Ann Intern Med, 149 (9): 638-658.
Wiebecke, B., Brandts, A. & Eder, M. (1974) Epithelial proliferation and morphogenesis of hyperplastic adenomatous and villous polyps of the human colon. Virchows Arch A Pathol Anat Histol, 364 (1): 35-49.
Wiley, E. L., Murphy, P., Mendelsohn, G. & Eggleston, J. C. (1981) Distribution of blood group substances in normal human colon. Use of the unlabeled antibody (PAP) immunoperoxidase technic to identify A and B blood group substances. Am J Clin Pathol, 76 (6): 806-809.
Willis, A., Jung, E. J., Wakefield, T. & Chen, X. (2004) Mutant p53 exerts a dominant negative effect by preventing wild-type p53 from binding to the promoter of its target genes. Oncogene, 23 (13): 2330-2338.
Willis, N. D., Przyborski, S. A., Hutchison, C. J. & Wilson, R. G. (2008) Colonic and colorectal cancer stem cells: progress in the search for putative biomarkers. J Anat, 213 (1): 59-65.
Wilson, L. S. & Lightwood, J. (2001) Model of estimated rates of colorectal cancer from polyp growth by year of surveillance. J Med Screen, 8 (4): 187-196.
Winawer, S. J., Zauber, A. G., Ho, M. N., O'Brien, M. J., Gottlieb, L. S., Sternberg, S. S., Waye, J. D., Schapiro, M., Bond, J. H. & Panish, J. F. (1993) Prevention of colorectal cancer by colonoscopic polypectomy. The National Polyp Study Workgroup. N Engl J Med, 329 (27): 1977-1981.
Wong, D. J., Paulson, T. G., Prevo, L. J., Galipeau, P. C., Longton, G., Blount, P. L. & Reid, B. J. (2001) p16(INK4a) lesions are common, early abnormalities that undergo clonal expansion in Barrett's metaplastic epithelium. Cancer Res, 61 (22): 8284-8289.

278 | P a g e
Wong, W. M., Garcia, S. B. & Wright, N. A. (1999) Origins and morphogenesis of colorectal neoplasms. APMIS, 107 (6): 535-544.
Wood, L. D., Parsons, D. W., Jones, S., Lin, J., Sjöblom, T., Leary, R. J., Shen, D., Boca, S. M., Barber, T., Ptak, J., Silliman, N., Szabo, S., Dezso, Z., Ustyanksky, V., Nikolskaya, T., Nikolsky, Y., Karchin, R., Wilson, P. A., Kaminker, J. S., Zhang, Z., Croshaw, R., Willis, J., Dawson, D., Shipitsin, M., Willson, J. K., Sukumar, S., Polyak, K., Park, B. H., Pethiyagoda, C. L., Pant, P. V., Ballinger, D. G., Sparks, A. B., Hartigan, J., Smith, D. R., Suh, E., Papadopoulos, N., Buckhaults, P., Markowitz, S. D., Parmigiani, G., Kinzler, K. W., Velculescu, V. E. & Vogelstein, B. (2007) The genomic landscapes of human breast and colorectal cancers. Science, 318 (5853): 1108-1113.
Woodman, C. B., Gibbs, A., Scott, N., Haboubi, N. Y. & Collins, S. (2001) Are differences in stage at presentation a credible explanation for reported differences in the survival of patients with colorectal cancer in Europe? Br J Cancer, 85 (6): 787-790.
Woolrich, A. J., DaSilva, M. D. & Korelitz, B. I. (1992) Surveillance in the routine management of ulcerative colitis: the predictive value of low-grade dysplasia. Gastroenterology, 103 (2): 431-438.
Worthley, D. L., Whitehall, V. L., Buttenshaw, R. L., Irahara, N., Greco, S. A., Ramsnes, I., Mallitt, K. A., Le Leu, R. K., Winter, J., Hu, Y., Ogino, S., Young, G. P. & Leggett, B. A. (2010) DNA methylation within the normal colorectal mucosa is associated with pathway-specific predisposition to cancer. Oncogene, 29 (11): 1653-1662.
Wright, N. A. (2000) Epithelial stem cell repertoire in the gut: clues to the origin of cell lineages, proliferative units and cancer. Int J Exp Pathol, 81 (2): 117-143.
Wu, A. L., Coulter, S., Liddle, C., Wong, A., Eastham-Anderson, J., French, D. M., Peterson, A. S. & Sonoda, J. (2011) FGF19 regulates cell proliferation, glucose and bile acid metabolism via FGFR4-dependent and independent pathways. PLoS One, 6 (3): e17868.
Wu, K., Li, A., Rao, M., Liu, M., Dailey, V., Yang, Y., Di Vizio, D., Wang, C., Lisanti, M. P., Sauter, G., Russell, R. G., Cvekl, A. & Pestell, R. G. (2006) DACH1 is a cell fate determination factor that inhibits cyclin D1 and breast tumor growth. Mol Cell Biol, 26 (19): 7116-7129.
Wu, K., Liu, M., Li, A., Donninger, H., Rao, M., Jiao, X., Lisanti, M. P., Cvekl, A., Birrer, M. & Pestell, R. G. (2007a) Cell fate determination factor DACH1 inhibits c-Jun-induced contact-independent growth. Mol Biol Cell, 18 (3): 755-767.
Wu, X., Ge, H., Gupte, J., Weiszmann, J., Shimamoto, G., Stevens, J., Hawkins, N., Lemon, B., Shen, W., Xu, J., Veniant, M. M., Li, Y. S., Lindberg, R., Chen, J. L., Tian, H. & Li, Y. (2007b) Co-receptor requirements for fibroblast growth factor-19 signaling. J Biol Chem, 282 (40): 29069-29072.

279 | P a g e
Wynter, C. V., Walsh, M. D., Higuchi, T., Leggett, B. A., Young, J. & Jass, J. R. (2004) Methylation patterns define two types of hyperplastic polyp associated with colorectal cancer. Gut, 53 (4): 573-580.
Xu, L., Feng, B., Wang, H. & Li, X. (2013) Multiple statistical methods for assessing differential gene expression in microarray data of diabetic model rats to predict the molecular mechanism of atorvastatin on anti-atherogenesis. Exp Clin Endocrinol Diabetes, 121 (5): 272-279.
Yamada, Y., Arao, T., Gotoda, T., Taniguchi, H., Oda, I., Shirao, K., Shimada, Y., Hamaguchi, T., Kato, K., Hamano, T., Koizumi, F., Tamura, T., Saito, D., Shimoda, T., Saka, M., Fukagawa, T., Katai, H., Sano, T., Sasako, M. & Nishio, K. (2008) Identification of prognostic biomarkers in gastric cancer using endoscopic biopsy samples. Cancer Sci, 99 (11): 2193-2199.
Yan, W., Wu, K., Herman, J. G., Brock, M. V., Fuks, F., Yang, L., Zhu, H., Li, Y., Yang, Y. & Guo, M. (2013) Epigenetic regulation of DACH1, a novel Wnt signaling component in colorectal cancer. Epigenetics, 8 (12): 1373-1383.
Yang, G., Zheng, W., Sun, Q. R., Shu, X. O., Li, W. D., Yu, H., Shen, G. F., Shen, Y. Z., Potter, J. D. & Zheng, S. (1998) Pathologic features of initial adenomas as predictors for metachronous adenomas of the rectum. J Natl Cancer Inst, 90 (21): 1661-1665.
Yeoman, A., Young, J., Arnold, J., Jass, J. & Parry, S. (2007) Hyperplastic polyposis in the New Zealand population: a condition associated with increased colorectal cancer risk and European ancestry. N Z Med J, 120 (1266): U2827.
Yi, E. S., Salgado, M., Williams, S., Kim, S. J., Masliah, E., Yin, S. & Ulich, T. R. (1998) Keratinocyte growth factor decreases pulmonary edema, transforming growth factor-beta and platelet-derived growth factor-BB expression, and alveolar type II cell loss in bleomycin-induced lung injury. Inflammation, 22 (3): 315-325.
Yokobori, T., Iinuma, H., Shimamura, T., Imoto, S., Sugimachi, K., Ishii, H., Iwatsuki, M., Ota, D., Ohkuma, M., Iwaya, T., Nishida, N., Kogo, R., Sudo, T., Tanaka, F., Shibata, K., Toh, H., Sato, T., Barnard, G. F., Fukagawa, T., Yamamoto, S., Nakanishi, H., Sasaki, S., Miyano, S., Watanabe, T., Kuwano, H., Mimori, K., Pantel, K. & Mori, M. (2013) Plastin3 is a novel marker for circulating tumor cells undergoing the epithelial-mesenchymal transition and is associated with colorectal cancer prognosis. Cancer Res, 73 (7): 2059-2069.
Yoshino, M., Ishiwata, T., Watanabe, M., Komine, O., Shibuya, T., Tokunaga, A. & Naito, Z. (2005) Keratinocyte growth factor receptor expression in normal colorectal epithelial cells and differentiated type of colorectal cancer. Oncol Rep, 13 (2): 247-252.
Yoshitake, N., Fukui, H., Yamagishi, H., Sekikawa, A., Fujii, S., Tomita, S., Ichikawa, K., Imura, J., Hiraishi, H. & Fujimori, T. (2008) Expression of SDF-1 alpha and nuclear CXCR4 predicts lymph node metastasis in colorectal cancer. Br J Cancer, 98 (10): 1682-1689.

280 | P a g e
Young, J. & Jass, J. R. (2006) The case for a genetic predisposition to serrated neoplasia in the colorectum: hypothesis and review of the literature. Cancer Epidemiol Biomarkers Prev, 15 (10): 1778-1784.
Yu, C., Wang, F., Kan, M., Jin, C., Jones, R. B., Weinstein, M., Deng, C. X. & McKeehan, W. L. (2000) Elevated cholesterol metabolism and bile acid synthesis in mice lacking membrane tyrosine kinase receptor FGFR4. J Biol Chem, 275 (20): 15482-15489.
Yu, C. J., Shih, J. Y., Lee, Y. C., Shun, C. T., Yuan, A. & Yang, P. C. (2005) Sialyl Lewis antigens: association with MUC5AC protein and correlation with post-operative recurrence of non-small cell lung cancer. Lung Cancer, 47 (1): 59-67.
Yuan, M., Itzkowitz, S. H., Palekar, A., Shamsuddin, A. M., Phelps, P. C., Trump, B. F. & Kim, Y. S. (1985) Distribution of blood group antigens A, B, H, Lewisa, and Lewisb in human normal, fetal, and malignant colonic tissue. Cancer Res, 45 (9): 4499-4511.
Zapatka, M., Zboralski, D., Radacz, Y., Böckmann, M., Arnold, C., Schöneck, A., Hoppe, S., Tannapfel, A., Schmiegel, W., Simon-Assmann, P. & Schwarte-Waldhoff, I. (2007) Basement membrane component laminin-5 is a target of the tumor suppressor Smad4. Oncogene, 26 (10): 1417-1427.
Zhang, Y., Wang, H., Toratani, S., Sato, J. D., Kan, M., McKeehan, W. L. & Okamoto, T. (2001) Growth inhibition by keratinocyte growth factor receptor of human salivary adenocarcinoma cells through induction of differentiation and apoptosis. Proc Natl Acad Sci U S A, 98 (20): 11336-11340.
Zhao, R. & Goldman, I. D. (2007) The molecular identity and characterization of a Proton-coupled Folate Transporter--PCFT; biological ramifications and impact on the activity of pemetrexed. Cancer Metastasis Rev, 26 (1): 129-139.
Zheng, Z., Zheng, M., Bi, J., Feng, Q., Yue, Z., Zhou, Y., Hu, W., Zhang, H. & Gao, H. (2015) Serum GROβ: a potential tumor-associated biomarker for colorectal cancer. Int J Clin Exp Med, 8 (2): 2526-2535.
Zins, K., Abraham, D., Sioud, M. & Aharinejad, S. (2007) Colon cancer cell-derived tumor necrosis factor-alpha mediates the tumor growth-promoting response in macrophages by up-regulating the colony-stimulating factor-1 pathway. Cancer Res, 67 (3): 1038-1045.
Zipin-Roitman, A., Meshel, T., Sagi-Assif, O., Shalmon, B., Avivi, C., Pfeffer, R. M., Witz, I. P. & Ben-Baruch, A. (2007) CXCL10 promotes invasion-related properties in human colorectal carcinoma cells. Cancer Res, 67 (7): 3396-3405.
Zisman, A. L., Nickolov, A., Brand, R. E., Gorchow, A. & Roy, H. K. (2006) Associations between the age at diagnosis and location of colorectal cancer and the use of alcohol and tobacco: implications for screening. Arch Intern Med, 166 (6): 629-634.

281 | P a g e
Zou, H., Harrington, J. J., Shire, A. M., Rego, R. L., Wang, L., Campbell, M. E., Oberg, A. L. & Ahlquist, D. A. (2007) Highly methylated genes in colorectal neoplasia: implications for screening. Cancer Epidemiol Biomarkers Prev, 16 (12): 2686-2696.
Zou, T. T., Selaru, F. M., Xu, Y., Shustova, V., Yin, J., Mori, Y., Shibata, D., Sato, F., Wang, S., Olaru, A., Deacu, E., Liu, T. C., Abraham, J. M. & Meltzer, S. J. (2002) Application of cDNA microarrays to generate a molecular taxonomy capable of distinguishing between colon cancer and normal colon. Oncogene, 21 (31): 4855-4862.
Zucker, S. & Vacirca, J. (2004) Role of matrix metalloproteinases (MMPs) in colorectal cancer. Cancer Metastasis Rev, 23 (1-2): 101-117.

282 | P a g e
Appendix I: DAVID analysis
Table showing pathways that were found to be enriched using DAVID software.
Cancer versus control
LIMMA Robust Regression
Function Enrichment
ratio
Number of
genes
Function Enrichment
ratio
Number of
genes
Transmembrane
signalling
2.05 29 No enriched
functions
Glycosylation 1.34 23
Polyp versus control
LIMMA Robust Regression
Function Enrichment
ratio
Number of
genes
Function Enrichment
ratio
Number of
genes
Extracellular
signalling
4.27 16 Extracellular
signalling
3.95 26
Glycosylation 1.88 7 Coagulation 2.46 3
Eye
morphogenesis
1.68 4
Signalling 1.47 6
Cytoskeleton 1.38 5

283 | P a g e
Cancer versus polyp
LIMMA Robust Regression
Function Enrichment
ratio
Number of
genes
Function Enrichment
ratio
Number of
genes
Response to
DNA
damage
2.71 8 Nucleoplasm 6.35 184
Cell cycle 2.65 23 DNA packaging 6.06 65
DNA
packaging
2.41 17 Protein
assembly
4.58 57
Metal ion
binding
2.20 3 Cell cycle 4.34 90
Regulation
of cell cycle
1.76 16 Histone
assembly
3.93 18
DNA repair 1.51 16 RNA
processing
3.60 68
Cytoskeleton 1.43 31 Cytoskeleton 3.51 217
Lysosome 1.40 8 Microtubule 3.09 29
GTP binding 1.53 36 Chromosome 2.64 19
Protein
maintenance
1.49 10 Mitochondria 2.62 102
Cell cycle
regulation
1.46 39 Nucleotide 2.60 169
ATP
dependent
activity
1.46 31 Protein
localisation
2.58 86
Tissue
homeostasis
1.40 12 Monosaccharide
metabolic
process
2.53 29
Helicase
activity
1.36 6 DNA repair 2.33 58
Response to
nutrients
1.34 22 Nuclear
transport
2.21 15
Heat shock
protein
2.06 16
DNA damage 2.05 16
Biological
regulation
1.70 30
Transcription 1.66 48
Microtubule
cytoskeleton
1.64 67

284 | P a g e
Appendix II: Patient information sheet
Department of Gastroenterology
University Hospital
Clifford Bridge Road
Walsgrave
Coventry
CV2 2DX
Tel: 024 7696 6087(sec)
Fax 024 7696 6090
www.uhcw.nhs.uk
A study to look at how bowel fermentation and
diet affect other diseases
PATIENT INFORMATION SHEET
1. Invitation
You are being invited to take part in a research study. Before you decide if you want to take part, you may wish to consider two things: firstly, why the research is being done and secondly what you would have to do. Please take time to read the information below and talk it over with someone else if you want to. If anything is not clear or you would like to know more, please ask. Please also note that some aspects of this information sheet may not be relevant to yourself. It would largely depend on the specific condition in which you are consulting your specialist. The reason is that this is a large study that covers several different areas of medicine.
Version 6 (RPA)
Dec 2014

285 | P a g e
Thank you for reading this.
2. What is the reason for the study?
Bowel problems are common and diet is known to be important in certain diseases of the large bowel (colon). Within the bowel there are large number of bacteria which help in the process of fermentation. Changes in diet may result in changes in fermentation which is thought to be contributory not only to certain bowel diseases but other metabolic diseases such as diabetes and obesity and even kidney, bladder, joint and heart disease. We hope that this study will give us a better understanding of the relationship between diet and bowel fermentation and its effects on other diseases. Food is digested by bacteria within our bowels and produces certain gasses (fermentation). These gasses are unique to certain diseases and we detect these using specialised instruments (electronic nose). It is hoped that this study will lead to early diagnosis and avoid invasive tests in the future.
3. Why have I been chosen?
Due to the specific nature of your illness, which is the subject of study in this
research, your consultant has invited you to participate in this research.
4. Do I have to take part?
It is for you to decide whether you wish to take part. If you do decide to take part, you will be given this information sheet to keep. You will be asked to sign a consent form. Even if you decide to take part you can withdraw at any time. If you decide to withdraw, you do not need to tell us why and it will not change your treatment in any way. 5. What will happen to me if I take part? If you agree to take part, we will invite you to sign a consent form to allow us to take samples of tissue. Depending on your medical condition we will collect certain tissue sample types e.g. urine, blood, breath or bowel tissue. However, not all may be relevant to yourself. We also seek permission to look at your medical records. Information sought from your medical records will be your medical history and medication. For those attending Endoscopy To obtain bowel tissue, an Endoscopic procedure is required (sigmoidoscopy/colonoscopy). This may already be a pre-requisite as part of your routine clinical investigation. At the time of examination, the doctor doing the test will take pieces of tissue for examination under a microscope (this is known as taking a biopsy). An extra 3 to 4 small pieces of tissue will be taken (each being the size of a grain of rice). Taking these extra biopsies

286 | P a g e
will not affect your care or add any significant risk. Your flexible sigmoidoscopy/colonoscopy will be the same whether or not you take part in the study. The doctor will discuss the results of your test either during or after the examination. After the examination, a doctor who is part of the research team, will take a sample of blood and urine as well as a breath sample. We will also ask that you complete a food and lifestyle questionnaire which should take about 20 min. This can often be completed when you attend for your clinic visit or for an endoscopic examination. If this is not possible, the form can be completed at home and posted back to us. Recordings of your height, weight, hip and waist circumference will also be made (if not already done on your clinic visit). After this, you may go home with follow up, if necessary, as planned by your consultant. We will also provide you with a stool pot to provide a stool specimen. A member of the research team will contact you 7 days after your test to arrange a suitable time and place (of your convenience) to collect the stool specimen. If you attend follow-up clinic, we may ask you again for further samples (e.g. urine, stool or blood). You will not be required to make an additional visit to the hospital for this purpose. Below is a chart of what will happen. Blue text indicates what is additional as a result of this study.
If you agree to participate, Sign CONSENT form
Clinic visit – sampling of blood, urine, breath & completion of questionnaire as well
as height/weight measurements
Endoscopy – biopsy tissue sampling (depending on clinical condition).
[ PN: If you attend directly for your endoscopic examination then we will collect the
above samples and take measurements during this visit. You will not be required to
attend a separate visit for this purpose to minimise inconvenience to yourself]
A pot will be provided for stool
specimen collection. After 7 days we
will contact you to arrange a
convenient time and place to
yourself to collect the stool
specimen. Further sampling may be
required at clinic visit.
For those with stomach/gastric
symptoms, you will be invited to a
breath test after your endoscopy
(whilst in recovery). A special sugary
drink will be provided and breath
sampled 15 -30 min later.

287 | P a g e
6. What do I have to do?
You need do nothing until you attend for your test. At this point, if you agree to participate, one of the doctors from the research team will discuss this with you and obtain your consent. If you have any questions beforehand, please see no 14.
7. What are the possible disadvantages and risks of taking part?
a) Bleeding very rarely occurs following biopsies and the risk of bleeding is small. (In one study [1], there was one case of bleeding noted after 5000 consecutive biopsies i.e. 0.02% risk). Our own experience in a previous study had no immediate complications following 4500 consecutive biopsies in 500 individuals (Arasaradnam et al PhD Thesis 2007; University of
Newcastle)
b) Taking a blood sample can be a little uncomfortable and occasionally for some there is a little bruising.
c) The additional biopsies required will add only 3-5 minutes to the procedure.
d) It is hoped that all necessary information can be obtained during the clinic or endoscopic visit and if not this will add no more than 10-15 min to your overall visit.
8. What happens to the samples taken? Samples of stool will be analysed for changes in fermentation within the bowel and analysis of type of bacteria. The blood, urine and breath will be analysed in a similar manner to look for similarities in pattern compared with stool. The blood and urine samples give us more information about your diet. Samples from bowel tissue will be used to analyse gene, cell and protein changes and compared with the fermentation changes. Specifically, these gene changes include molecular changes such as ‘methylation’, ‘acetylation’ and markers of ‘mitochondrial’ damage. We will then try to link these changes with your diet from the information you gave us in the questionnaire. We value your anonymity hence all samples will be anonymised which means that in the event of any research related findings that come to light from this research study, the results cannot be traced to yourself. However significant clinical findings which relate directly to your care will be fed back to your overseeing consultant and to your GP. We will also request permission to store some of the bowel tissue, blood urine and breath samples indefinitely. This is because in the future, newer techniques may become available which will allow us to perform more up to date testing. As mentioned above, these samples will be anonymised and therefore cannot be traced back to you.
9. What are the possible benefits of taking part?

288 | P a g e
We hope that the information we get from this study will help us understand more about how diet affects certain genes and proteins in the normal bowel. In the future this may help us understand more about how certain diseases develop and perhaps even how to better prevent this through alteration in diet.
10. Will my taking part in this study be kept confidential?
All the information we have about you from this study is strictly confidential. This information will be kept securely while the study is taking place. Only the research doctors will be able to see it. Any information about you that leaves the hospital as part of a research report will have your name, address and any other personal information removed so that you cannot be identified from it. Your GP and your hospital consultant will be told that you are taking part in the study if you wish. 11. What if something goes wrong? In the unlikely event that something goes wrong, there are no special compensation arrangements. If you are harmed due to someone’s negligence, then you may have grounds for a legal action but you may have to pay for it. Regardless of this, if you wish to complain, or have any concerns about any aspect of the way you have been approached or treated during the course of this study, the normal National Health Service (NHS) complaints mechanisms will be available to you.
12. Who is organising and funding the research?
This study has been organised and will be done at UHCW in conjunction with the University of Warwick. The chief investigator is Dr R P Arasaradnam. None of the researchers will be paid in person nor will they receive any financial gain for doing this study. Sponsorship in the form of a Research Grants have been obtained from local charities, research networks and collaborative bids (commercial and non-commercial). 13. Who has reviewed the study?
The Warwickshire Research Ethics Committee has reviewed and approved the
study
14. Contact for Further Information or Complaints

289 | P a g e
Dr R P Arasaradnam
Assoc. Prof of Gastroenterology,
Department of Gastroenterology,
University Hospital Coventry & Warwickshire,
Clifford Bridge Rd,
Coventry CV2 2DX
Tel: 02476 966087
E mail: [email protected] or Nicola.O’[email protected]
Thank you for taking part in the above study.
A copy of the information sheet and signed consent form is available for your
records.
Reference:
1. Macrae FA, Tan KG, Williams CB. Towards safer colonoscopy: a report on the complications of diagnostic or therapeutic colonoscopies. Gut 1983
May;24(5):376-83

290 | P a g e
Appendix III: Consent form
Department of Gastroenterology
University Hospital Clifford Bridge Road
Walsgrave Coventry
CV2 2DX
RPA Version 5 August 2015
Consent for removal and storage of Human Tissue, Blood, Urine, Faeces and breath for Research
Thank you for reading the information about our research project. If you would like to take part, please read and sign this form.
Study number: Patient identification number for this study:
Food and fermentation using metagenomics in
health and disease (FaMIsHED study) Title of
project:……………………………………………………………………………………………………. Dr R P Arasaradnam, Dr M Pharaoh, Dr G Williams, Prof. C Nwokolo, Prof. K D Bardhan and Prof S Kumar Name of researcher
(s):…………………………………………………………………………………………
02476 966087 or e mail: [email protected] Contact details for research team:…………………………………………………………………………..
Please initial boxes
1. I have read the attached information sheet on this project, dated…December
2014… (Version 6) and have been given a copy to keep if I wish. I have been able to ask
questions about the project and I understand why the research is being done and any risks involved.

291 | P a g e
2. I agree to give samples of tissue including bowel, blood, urine, faeces and breath
for this research project. I understand how the samples will be collected, that giving
samples for this research is voluntary and that I am free to withdraw my approval up to
the point of anonymisation, for the use of the sample at any time without giving a reason
and without my medical treatment or legal rights being affected. I am aware that the
samples given will be analysed for gaseous products, gene and protein changes. I
understand that the samples given for research purposes will be anonymised and
therefore cannot be traced back to myself. Clinical findings will be fed back to my
consultant and GP.
3. I give permission for someone from the research team to review my medical
records. I understand the information will be kept confidential. I do/do not wish for the
research team to inform my GP of my participation in this study.
4. I understand that I will not benefit financially if this research leads to the development
of a new treatment or medical test.
Thank you for agreeing to participate in this research
RPA Version 5 August 2015
………………………………………… ……………………… …………………………………… Name of patient (BLOCK CAPITALS)
Date Signature
………………………………………. …………………… …………………………………… Name of person taking consent (if different from researcher)
Date Signature
…………………………………….. …………………… …………………………………. Name of researcher Date Signature