Download (30Mb) - Warwick WRAP
610
warwick.ac.uk/lib-publications A Thesis Submitted for the Degree of PhD at the University of Warwick Permanent WRAP URL: http://wrap.warwick.ac.uk/152948 Copyright and reuse: This thesis is made available online and is protected by original copyright. Please scroll down to view the document itself. Please refer to the repository record for this item for information to help you to cite it. Our policy information is available from the repository home page. For more information, please contact the WRAP Team at: [email protected]
-
Upload
khangminh22 -
Category
Documents
-
view
1 -
download
0
Transcript of Download (30Mb) - Warwick WRAP

warwick.ac.uk/lib-publications
A Thesis Submitted for the Degree of PhD at the University of Warwick
Permanent WRAP URL:
http://wrap.warwick.ac.uk/152948
Copyright and reuse:
This thesis is made available online and is protected by original copyright.
Please scroll down to view the document itself.
Please refer to the repository record for this item for information to help you to cite it.
Our policy information is available from the repository home page.
For more information, please contact the WRAP Team at: [email protected]

i
Body schema in adolescent idiopathic scoliosis
Peter J Heine
A thesis presented for the degree of
Doctor of Philosophy
Volume I of II
Department of Health Sciences
University of Warwick
UK
May 2019

ii
Acknowledgements
First and foremost, I would like to thank all the participants who willingly volunteered to take
part in this research project and generously gave their time and effort to make it happen. This
project would be nothing without you.
I would also like to thank the research clinicians based at the NHS trusts who recruited and
collected data from all the participants with scoliosis: Wendy Bertram, Laura Bird, Tamsin
Hughes and Cheryl Honeyman.
Similarly, I wish to express my gratitude to the research clinicians who assisted me in collecting
data from the participants without scoliosis: Sarah Bridgewater, Emma Eyre, Janet Lowe,
Elizabeth Russell and Jackie Todd; and to all the head teachers and staff that allowed me access
to their schools.
Support and friendship has been amply provided by many at the Warwick Clinical Trials Unit
and the Oxford Clinical Trials Research Unit, especially my colleagues and fore-runners Dr Mark
Williams and Dr Esther Williamson.
I wish to thank Professor James Tresilian for agreeing to be my third supervisor. And to
Professor Sallie Lamb and Professor Ben Wand, my long suffering main supervisors who have
demonstrated more than their fair share of patience and tolerance, I appreciate enormously
the expertise, advice and motivation you have provided.
Finally, I wish to express my love and gratitude to Maria and Carles who have given me the
time and space to complete this project. It has been a shared endeavour.
iii
Table of Contents
Acknowledgements .............................................................................................................. ii
Table of Contents................................................................................................................. iii
List of Tables ....................................................................................................................... xii
List of Figures .................................................................................................................... xviii
Declaration ........................................................................................................................ xxv
Abstract ............................................................................................................................ xxvi
List of abbreviations ........................................................................................................ xxvii
Introduction ......................................................................................................................... 1
1 What is Adolescent Idiopathic Scoliosis? ............................................................................ 4
1.1 Scoliosis ............................................................................................................................ 4
1.2 Types of scoliosis ............................................................................................................. 8
1.3 Adolescent idiopathic scoliosis ........................................................................................ 8
1.3.1 Prevalence ..................................................................................................................... 9
1.3.2 Effects of AIS ................................................................................................................ 10
1.3.3 Management of AIS ..................................................................................................... 11
1.3.4 Causes of AIS ............................................................................................................... 13
2 What is body schema? ..................................................................................................... 16
2.1 Body representations - ‘bodies-in-the-brain’ ................................................................ 16
2.1.1 Models of body representation .................................................................................. 18
2.1.2 Body schema ............................................................................................................... 20
2.1.3 Body image .................................................................................................................. 22
2.1.4 Body model / structural description ........................................................................... 23
2.2 Disruption of body schema ............................................................................................ 23
2.2.1 Deafferentation ........................................................................................................... 23
2.2.2 Phantom limbs ............................................................................................................ 25
2.2.3 Bodily illusions ............................................................................................................. 26
2.2.4 Chronic pain conditions ............................................................................................... 29
2.3 Body schema in adolescence ......................................................................................... 35
2.4 Body schema in AIS ........................................................................................................ 36
2.5 Summary ........................................................................................................................ 38
iv
3 Perceptual deficits in AIS - a systematic review ................................................................. 40
3.1 Materials and methods ................................................................................................. 40
3.1.1 Data sources and searches .......................................................................................... 40
3.1.2 Study selection ............................................................................................................ 40
3.1.3 Data extraction ............................................................................................................ 41
3.1.4 Risk of bias ................................................................................................................... 41
3.1.5 Data analysis ................................................................................................................ 42
3.2 Results ............................................................................................................................ 43
3.2.1 Search results .............................................................................................................. 43
3.2.2 Balance ........................................................................................................................ 44
3.2.3 Proprioception............................................................................................................. 54
3.2.4 Vibration threshold ..................................................................................................... 57
3.2.5 Perception of vertical .................................................................................................. 61
3.2.6 Vestibular testing ........................................................................................................ 63
3.2.7 Brain testing ................................................................................................................ 70
3.2.8 Other ........................................................................................................................... 76
3.3 Discussion ...................................................................................................................... 78
3.3.1 Previous reviews ......................................................................................................... 79
3.3.2 Limitations ................................................................................................................... 80
3.3.3 Summary ..................................................................................................................... 80
4 How to measure body schema ......................................................................................... 90
4.1 Tactile acuity .................................................................................................................. 90
4.1.1 Two point discrimination threshold testing ................................................................ 90
4.1.2 Localisation .................................................................................................................. 95
4.2 Laterality discrimination ................................................................................................ 98
4.2.1 Normative data ........................................................................................................... 99
4.2.2 Measurement properties ............................................................................................ 99
4.3 Spatial perception ........................................................................................................ 102
4.3.1 Normative values ...................................................................................................... 103
4.3.2 Measurement properties .......................................................................................... 104
4.4 Proprioception ............................................................................................................. 107
4.4.1 Position matching ...................................................................................................... 108
4.5 Summary ...................................................................................................................... 111
5 Research question 1 - case control study (methods) ....................................................... 113
5.1 Overview ...................................................................................................................... 113

v
5.1.1 Research question ..................................................................................................... 113
5.1.2 Hypothesis tested ...................................................................................................... 113
5.1.3 Study outline ............................................................................................................. 114
5.2 Methods - case control study ...................................................................................... 114
5.2.1 Study design .............................................................................................................. 114
5.2.2 Setting ....................................................................................................................... 114
5.2.3 Participants ................................................................................................................ 115
5.2.4 Variables .................................................................................................................... 118
5.2.5 Demographics ............................................................................................................ 121
5.2.6 Self-report questionnaires ........................................................................................ 121
5.2.7 Physical measures of body schema ........................................................................... 136
5.2.8 Bias ............................................................................................................................ 136
5.2.9 Statistical analysis ...................................................................................................... 138
5.2.10 Ethics ....................................................................................................................... 138
6 Research question 1 - case control study (results) ........................................................... 139
6.1 Participants .................................................................................................................. 139
6.1.1 Cases .......................................................................................................................... 139
6.1.2 Controls ..................................................................................................................... 141
6.1.3 Matching.................................................................................................................... 142
6.2 Demographics .............................................................................................................. 145
6.2.1 Matching variables .................................................................................................... 145
6.2.2 Other demographic variables .................................................................................... 146
6.2.3 Spinal deformity characteristics - cases .................................................................... 149
6.3 Spinal Appearance Questionnaire (SAQ) ..................................................................... 152
6.3.1 Appearance scale ...................................................................................................... 152
6.3.2 Expectations scale ..................................................................................................... 152
6.3.3 Total score ................................................................................................................. 152
6.4 Kinaesthetic & Proprioceptive Awareness Questionnaire (KPAQ) .............................. 156
6.5 Scoliosis Research Society questionnaire (SRS-22r) .................................................... 158
6.5.1 Function scale ............................................................................................................ 158
6.5.2 Pain scale ................................................................................................................... 158
6.5.3 Self-image scale ......................................................................................................... 158
6.5.4 Mental health scale ................................................................................................... 159
6.5.5 Subtotal score ............................................................................................................ 159
6.6 EQ 5D - 3L .................................................................................................................... 164

vi
6.6.1 Mobility ..................................................................................................................... 164
6.6.2 Self-care ..................................................................................................................... 164
6.6.3 Usual activities .......................................................................................................... 165
6.6.4 Pain or discomfort ..................................................................................................... 165
6.6.5 Anxiety or depression................................................................................................ 166
6.6.6 Health state VAS ........................................................................................................ 166
6.7 Paediatric Outcomes Data Collection Instrument (PODCI) ......................................... 172
6.7.1 Upper extremity and physical function ..................................................................... 172
6.7.2 Transfers and basic mobility ..................................................................................... 172
6.7.3 Sports and physical functioning ................................................................................ 172
6.7.4 Pain/comfort ............................................................................................................. 173
6.7.5 Global function .......................................................................................................... 173
6.7.6 Happiness .................................................................................................................. 174
6.8 Two point discrimination ............................................................................................. 180
6.8.1 Left v Right ................................................................................................................. 180
6.8.2 Affected v Unaffected side ........................................................................................ 183
6.8.3 Case v Control ............................................................................................................ 186
6.9 Localisation .................................................................................................................. 188
6.9.1 Left v Right ................................................................................................................. 188
6.9.2 Affected v Unaffected ............................................................................................... 191
6.9.3 Case v Control ............................................................................................................ 194
6.10 Laterality discrimination .......................................................................................... 198
6.10.1 Accuracy (hands) ..................................................................................................... 198
6.10.2 Accuracy (back) ....................................................................................................... 206
6.10.3 Reaction time (hands) ............................................................................................. 214
6.10.4 Reaction time (back) ............................................................................................... 225
6.11 Line bisection testing ............................................................................................... 236
6.11.1 Left v right hand ...................................................................................................... 236
6.11.2 Test paper position - Left v Centre v Right .............................................................. 239
6.11.3 Line length - 200mm v 225mm v 250mm ............................................................... 243
6.11.4 Affected v unaffected side ...................................................................................... 247
6.11.5 Body line v standard lines ....................................................................................... 253
6.11.6 Case v control .......................................................................................................... 256
6.12 Trunk proprioception (position matching) .............................................................. 258
6.12.1 Left v Right ............................................................................................................... 258

vii
6.12.2 Affected v unaffected .............................................................................................. 261
6.12.3 Case v control .......................................................................................................... 264
6.13 Dynamic standing balance ....................................................................................... 266
6.13.1 Left v right ............................................................................................................... 266
6.13.2 Affected v unaffected side ...................................................................................... 270
6.13.3 Case v control .......................................................................................................... 273
6.14 Summary .................................................................................................................. 276
6.14.1 Demographics.......................................................................................................... 276
6.14.2 Spinal characteristics - cases ................................................................................... 276
6.14.3 Perceived trunk symmetry ...................................................................................... 277
6.14.4 Body Awareness ...................................................................................................... 277
6.14.5 Health related quality of life (HRQoL) ..................................................................... 277
6.14.6 Generic function ...................................................................................................... 280
6.14.7 Tactile acuity ........................................................................................................... 280
6.14.8 Left/right judgement ............................................................................................... 281
6.14.9 Spatial perception ................................................................................................... 283
6.14.10 Proprioception ...................................................................................................... 284
6.14.11 Balance .................................................................................................................. 284
6.14.12 Limitations ............................................................................................................. 284
6.14.13 Conclusion ............................................................................................................. 286
7 Research question 2 - correlational analysis (methods) ................................................... 287
7.1 Overview ...................................................................................................................... 287
7.1.1 Research question ..................................................................................................... 287
7.1.2 Hypothesis tested ...................................................................................................... 287
7.2 Methods ....................................................................................................................... 288
7.2.1 Study design .............................................................................................................. 288
7.2.2 Variables .................................................................................................................... 288
7.2.3 Statistical analysis ...................................................................................................... 291
8 Research question 2 - correlational analysis (results) ...................................................... 292
8.1 Participants .................................................................................................................. 292
8.2 Imaging information .................................................................................................... 293
8.2.1 X-ray v ISIS-2 .............................................................................................................. 295
8.3 Spinal deformity v body schema measures ................................................................. 298
8.3.1 X-ray v body schema measures ................................................................................. 298
8.3.2 ISIS-2 v body schema measures ................................................................................ 298

viii
8.4 Spinal deformity v other measures ............................................................................. 304
8.4.1 X-ray v other measures ............................................................................................. 304
8.4.2 ISIS-2 v other measures ............................................................................................. 307
8.4.3 Perceived spinal deformity........................................................................................ 313
8.5 Summary ...................................................................................................................... 318
8.5.1 Spinal deformity v body schema measures .............................................................. 318
8.5.2 Spinal deformity v other measures ........................................................................... 319
8.5.3 Perceived spinal deformity........................................................................................ 319
8.5.4 Limitations ................................................................................................................. 320
8.5.5 Conclusion ................................................................................................................. 321
9 Research question 3 - longitudinal analysis (methods) .................................................... 322
9.1 Overview ...................................................................................................................... 322
9.1.1 Research question ..................................................................................................... 322
9.1.2 Hypothesis tested ...................................................................................................... 322
9.2 Methods - longitudinal study ...................................................................................... 323
9.2.1 Study design .............................................................................................................. 323
9.2.2 Variables .................................................................................................................... 324
9.2.3 Statistical analysis ...................................................................................................... 324
10 Research question 3 - longitudinal analysis (results) ..................................................... 326
10.1 Participants .............................................................................................................. 326
10.1.1 Follow-up ................................................................................................................. 326
10.1.2 Baseline characteristics - Completers v non-completers ........................................ 328
10.1.3 Data analysis - participants available ...................................................................... 334
10.2 Spinal deformity ....................................................................................................... 335
10.2.1 Cobb angle ............................................................................................................... 336
10.2.2 Coronal balance ....................................................................................................... 337
10.2.3 Sagittal balance ....................................................................................................... 338
10.3 Self-report Measures ............................................................................................... 345
10.3.1 Spinal Appearance Questionnaire (SAQ) ................................................................ 345
10.3.2 Kinaesthetic & Proprioceptive Awareness Questionnaire (KPAQ) ......................... 355
10.3.3 Scoliosis Research Society questionnaire (SRS-22r) ................................................ 358
10.3.4 EQ5D - 3L ................................................................................................................. 373
10.3.5 Paediatric Outcomes Data Collection Instrument (PODCI) ..................................... 379
10.4 Physical measures of body schema ......................................................................... 395
10.4.1 Two point discrimination ........................................................................................ 395

ix
10.4.2 Localisation .............................................................................................................. 396
10.4.3 Laterality discrimination (left/right judgement) ..................................................... 397
10.4.4 Line bisection........................................................................................................... 401
10.4.5 Proprioception ........................................................................................................ 402
10.4.6 Dynamic standing balance ...................................................................................... 403
10.5 Correlations .............................................................................................................. 422
10.5.1 Cobb angle v measures of body schema ................................................................. 422
10.5.2 Cobb angle v other measures.................................................................................. 425
10.6 Summary .................................................................................................................. 427
10.6.1 Spinal deformity ...................................................................................................... 427
10.6.2 Body schema measures ........................................................................................... 427
10.6.3 Other measures ....................................................................................................... 428
10.6.4 Limitations ............................................................................................................... 428
10.6.5 Conclusion ............................................................................................................... 429
11 Discussion .................................................................................................................... 431
11.1 Body schema and adolescent idiopathic scoliosis ................................................... 431
11.2 Other measures and adolescent idiopathic scoliosis............................................... 432
11.2.1 Perceived trunk symmetry/deformity .................................................................... 432
11.2.2 Self image ................................................................................................................ 433
11.2.3 Pain .......................................................................................................................... 433
11.2.4 Function ................................................................................................................... 434
11.3 Limitations ................................................................................................................ 435
11.4 Future directions ...................................................................................................... 436
11.5 Conclusion ................................................................................................................ 437
References ........................................................................................................................ 439
Introduction ............................................................................................................................ 439
Chapter 1 ................................................................................................................................ 439
Chapter 2 ................................................................................................................................ 442
Chapter 3 ................................................................................................................................ 447
Chapter 4 ................................................................................................................................ 452
Chapter 5 ................................................................................................................................ 458
Chapter 6 ................................................................................................................................ 461
Chapter 7 ................................................................................................................................ 463
Chapter 8 ................................................................................................................................ 464
Chapter 9 ................................................................................................................................ 464
Chapter 10 .............................................................................................................................. 464
Chapter 11 .............................................................................................................................. 465
Appendices ....................................................................................................................... 467
x
Appendix 1 Systematic review search strategies ................................................................ 468
Appendix 2 Participant information sheets (cases) ............................................................ 480
A2.1 Older child participant information sheet (cases) ..................................................... 480
A2.2 Younger child participant information sheet (cases) ................................................. 485
A2.3 Parent participant information sheet (cases) ............................................................ 489
Appendix 3 Participant information sheets (controls) ........................................................ 495
A3.1 Older child participant information sheet (controls) ................................................. 495
A3.2 Younger child participant information sheet (controls) ............................................ 499
A3.3 Parent participant information sheet (controls) ....................................................... 504
Appendix 4 Consent & eligibility forms .............................................................................. 508
A4.1 Child consent form (cases) ......................................................................................... 508
A4.2 Parent consent form (cases) ...................................................................................... 509
A4.3 Eligibility checklist (cases) .......................................................................................... 510
A4.4 Consent & eligibility form (controls) .......................................................................... 512
Appendix 5 Demographic questions (cases) ....................................................................... 514
Appendix 6 Demographic questions (controls) .................................................................. 518
Appendix 7 X-ray information (cases) ................................................................................ 522
A7.1 Case report form ........................................................................................................ 522
A7.2 X-ray instructions ....................................................................................................... 523
Appendix 8 Spinal Appearance Questionnaire (SAQ) ......................................................... 525
A8.1 SAQ questions ............................................................................................................ 525
A8.2 SAQ scoring ................................................................................................................ 528
Appendix 9 Scoliosis Research Society questionnaire (SRS-22r).......................................... 529
A9.1 SRS-22r questions ...................................................................................................... 529
A9.2 SRS-22r scoring (example) ......................................................................................... 533
Appendix 10 EuroQol EQ5D-3L .......................................................................................... 534
Appendix 11 Paediatric Outcomes Data Collection (PODCI) ............................................... 536
A11.1 PODCI questions ....................................................................................................... 536
A11.2 PODCI scoring ........................................................................................................... 539
Appendix 12 Kinaesthetic & proprioceptive questionnaire (KPAQ) .................................... 541
A12.1 KPAQ questions ........................................................................................................ 541
A12.2 KPAQ scoring ............................................................................................................ 541
Appendix 13 Marking up instructions ................................................................................ 542
Appendix 14 Two point discrimination testing (TPDT)........................................................ 543
A14.1 TPDT case report form ............................................................................................. 543
A14.2 TPDT instructions ..................................................................................................... 544

xi
A14.3 TPDT scoring ............................................................................................................. 545
Appendix 15 Localisation .................................................................................................. 546
A15.1 Localisation case report form .................................................................................. 546
A15.2 Localisation instructions .......................................................................................... 547
A15.3 Localisation scoring .................................................................................................. 548
Appendix 16 Laterality discrimination instructions ............................................................ 549
A16.1 Laterality scoring ...................................................................................................... 553
Appendix 17 Proprioception ............................................................................................. 554
A17.1 Proprioception case report form ............................................................................. 554
A17.2 Proprioception instructions ..................................................................................... 556
A17.3 Proprioception scoring ............................................................................................. 558
Appendix 18 Line bisection test (LBT) ................................................................................ 559
A18.1 LBT case report form -standard (example) .............................................................. 559
A18.2 LBT case report form - body (example) ................................................................... 560
A18.3 LBT instructions ........................................................................................................ 561
A18.4 LBT scoring ............................................................................................................... 562
Appendix 19 Dynamic balance .......................................................................................... 563
A19.1 Balance scoring ........................................................................................................ 564
Appendix 20 ISIS 2 ............................................................................................................ 565
A20.1 ISIS 2 parameters ..................................................................................................... 566
A20.1.1 Height map ........................................................................................................... 566
A20.1.2 Contour plot ......................................................................................................... 566
A20.1.3 Tranverse.............................................................................................................. 566
A20.1.4 Coronal ................................................................................................................. 566
A20.1.5 Sagittal .................................................................................................................. 567
A20.1.6 Bilateral asymmetry maps ................................................................................... 567
xii
List of Tables
TABLE 1.1 REPORTED PREVALENCE RATES FOR AIS ................................................................................................................ 10
TABLE 3.1 STUDY ELIGIBILITY CRITERIA ................................................................................................................................ 41
TABLE 3.2 STUDY RISK OF BIAS CRITERIA .............................................................................................................................. 42
TABLE 3.3 SUMMARY OF FINDINGS - BALANCE ..................................................................................................................... 81
TABLE 3.4 SUMMARY OF FINDINGS - PROPRIOCEPTION .......................................................................................................... 83
TABLE 3.5 SUMMARY OF FINDINGS - VIBRATION ................................................................................................................... 83
TABLE 3.6 SUMMARY OF FINDINGS - PERCEPTION OF VERTICAL ................................................................................................ 84
TABLE 3.7 SUMMARY OF FINDINGS - VESTIBULAR FUNCTION ................................................................................................... 85
TABLE 3.8 SUMMARY OF FINDINGS - BRAIN FUNCTION ........................................................................................................... 86
TABLE 3.9 SUMMARY OF FINDINGS - OTHER ........................................................................................................................ 87
TABLE 3.10 RISK OF BIAS - BALANCE................................................................................................................................... 87
TABLE 3.11 RISK OF BIAS - PROPRIOCEPTION, VIBRATION THRESHOLD AND PERCEPTION OF VERTICAL............................................. 88
TABLE 3.12 RISK OF BIAS - VESTIBULAR FUNCTION, BRAIN FUNCTION AND OTHER ....................................................................... 89
TABLE 4.1 NORMATIVE VALUES FOR TPDT, MEAN MM (SD) ................................................................................................... 92
TABLE 4.2 NORMATIVE VALUES FOR LATERALITY DISCRIMINATION ............................................................................................ 99
TABLE 4.3 TEST-RETEST RELIABILITY FOR TRUNK LATERALITY DISCRIMINATION TESTING, ICC (95% CI) ........................................... 100
TABLE 4.4 NORMATIVE VALUES FOR LBT % ERROR (MEAN, SD) ............................................................................................ 105
TABLE 4.5 NORMATIVE VALUES FOR LBT BY AGE, % ERROR (MEAN, SE) .................................................................................. 106
TABLE 4.6 FACTORS THAT INFLUENCE LINE BISECTION TEST .................................................................................................... 107
TABLE 4.7 POSITION MATCHING IN HEALTHY CONTROLS - ABSOLUTE ERROR .............................................................................. 110
TABLE 4.8 TEST-RETEST RELIABILITY OF TRUNK POSITION MATCHING ABILITY ............................................................................. 111
TABLE 5.1 RESEARCH QUESTION - CASE CONTROL STUDY ...................................................................................................... 113
TABLE 5.2 VARIABLES - SELF-REPORT QUESTIONNAIRES & PHYSICAL MEASURES OF BODY SCHEMA ................................................ 119
TABLE 5.3 VARIABLES - SELF-REPORT QUESTIONNAIRES & PHYSICAL MEASURES OF BODY SCHEMA ................................................ 120
TABLE 5.4 RELIABILITY & INTERNAL CONSISTENCY SAQ ........................................................................................................ 124
TABLE 5.5 CONVERGENT VALIDITY - SAQ VERSUS CURVE MAGNITUDE AND SRS-22 .................................................................. 124
TABLE 5.6 DIVERGENT VALIDITY - SAQ VERSUS OTHER SRS-22 SCALES ................................................................................... 124
TABLE 5.7 DISCRIMINANT VALIDITY - MEAN (SD) SAQ SCORE BY GROUP ................................................................................ 125
TABLE 5.8 RESPONSIVENESS TO CHANGE FOLLOWING SURGERY - SAQ .................................................................................... 125
TABLE 5.9 RELIABILITY & INTERNAL CONSISTENCY SRS-22R .................................................................................................. 126
TABLE 5.10 CONVERGENT VALIDITY SRS-22R .................................................................................................................... 128
TABLE 5.11 DISCRIMINATIVE ABILITY & RESPONSIVENESS TO CHANGE FOLLOWING SURGERY SRS-22R .......................................... 129
TABLE 5.12 MCID OF SRS-22R ...................................................................................................................................... 130
TABLE 5.13 RELIABILITY & INTERNAL CONSISTENCY EQ-5D IN AIS ......................................................................................... 131
TABLE 5.14 CONVERGENT VALIDITY EQ-5D WITH SPINAL DEFORMITY MEASURES ...................................................................... 131
TABLE 5.15 RELIABILITY - PODCI .................................................................................................................................... 133

xiii
TABLE 5.16 CONSTRUCT VALIDITY PODCI ......................................................................................................................... 134
TABLE 5.17 DISCRIMINATIVE ABILITY OF PODCI IN AIS ........................................................................................................ 134
TABLE 5.18 CORRELATION BETWEEN COMBINED KPAQ/BAQ* SCORE & TRUNK REPOSITIONING ERROR ....................................... 136
TABLE 6.1 CASES RECRUITED BY SITE ................................................................................................................................. 139
TABLE 6.2 NUMBER OF SCHOOLS INVOLVED IN CONTROL PARTICIPANT RECRUITMENT, N (NUMBER CONTACTED) ............................. 141
TABLE 6.3 CONTROL RECRUITMENT BY SITE ........................................................................................................................ 142
TABLE 6.4 SEX.............................................................................................................................................................. 145
TABLE 6.5 AGE (YEARS) ................................................................................................................................................. 145
TABLE 6.6 OTHER DEMOGRAPHIC VARIABLES 1 ................................................................................................................... 147
TABLE 6.7 OTHER DEMOGRAPHIC VARIABLES 2 ................................................................................................................... 148
TABLE 6.8 BRACE USE & SPINAL DEFORMITY CHARACTERISTICS OF 58 CASE PARTICIPANTS ........................................................... 149
TABLE 6.9 COBB ANGLE (MAIN CURVE) AND SPINAL BALANCE (ABSOLUTE VALUES) - DESCRIPTIVE STATISTICS ................................... 150
TABLE 6.10 SAQ DESCRIPTIVE STATISTICS .......................................................................................................................... 153
TABLE 6.11 SAQ - RESULTS OF STATISTICAL ANALYSES ......................................................................................................... 155
TABLE 6.12 KPAQ DESCRIPTIVE STATISTICS (12 WORST - 60 BEST) ........................................................................................ 156
TABLE 6.13 KPAQ - RESULTS OF STATISTICAL ANALYSES ....................................................................................................... 157
TABLE 6.14 SRS-22R SCORES ......................................................................................................................................... 160
TABLE 6.15 SRS-22R - RESULTS OF STATISTICAL ANALYSES ................................................................................................... 163
TABLE 6.16 EQ5D 3L OBSERVED COUNTS ......................................................................................................................... 167
TABLE 6.17 EQ5D 3L COMBINED PROBLEMS - EXPECTED COUNTS, PROPORTIONS & ODDS RATIO ................................................ 169
TABLE 6.18 EQ5D HEALTH STATE DESCRIPTIVE STATISTICS .................................................................................................... 170
TABLE 6.19 EQ5D - RESULTS OF STATISTICAL ANALYSES ....................................................................................................... 171
TABLE 6.20 PODCI SCORES ............................................................................................................................................ 175
TABLE 6.21 PODCI - RESULTS OF STATISTICAL ANALYSES ...................................................................................................... 179
TABLE 6.22 TWO-POINT DISCRIMINATION THRESHOLD DESCRIPTIVE STATISTICS - LEFT V RIGHT WITHIN GROUPS (MM) ..................... 181
TABLE 6.23 TPDT LEFT V RIGHT - STATISTICAL ANALYSES ..................................................................................................... 182
TABLE 6.24 TWO POINT DISCRIMINATION THRESHOLD DESCRIPTIVE STATISTICS- AFFECTED V UNAFFECTED SIDE WITHIN GROUPS ........ 183
TABLE 6.25 TPDT AFFECTED V UNAFFECTED - STATISTICAL ANALYSES ..................................................................................... 185
TABLE 6.26 TWO POINT DISCRIMINATION THRESHOLD - CASE V CONTROL BETWEEN GROUPS ...................................................... 186
TABLE 6.27 TWO-POINT DISCRIMINATION THRESHOLD - RESULTS OF STATISTICAL ANALYSES ........................................................ 187
TABLE 6.28 CORRELATION BETWEEN TPDT AND GROUP - CASE CONTROL ................................................................................ 187
TABLE 6.29 LOCALISATION DESCRIPTIVE STATISTICS - LEFT V RIGHT (NUMBER CORRECT; MAX = 12).............................................. 188
TABLE 6.30 LOCALISATION LEFT V RIGHT - STATISTICAL ANALYSES .......................................................................................... 190
TABLE 6.31 LOCALISATION DESCRIPTIVE STATISTICS - AFFECTED V UNAFFECTED SIDE .................................................................. 191
TABLE 6.32 LOCALISATION AFFECTED V UNAFFECTED - STATISTICAL ANALYSES .......................................................................... 193
TABLE 6.33 LOCALISATION DESCRIPTIVE STATISTICS - CASE V CONTROL LOCATION (MAX=30) ...................................................... 194
TABLE 6.34 LOCALISATION CASE V CONTROL - STATISTICAL ANALYSES ..................................................................................... 195
TABLE 6.35 CORRELATION GROUP TYPE V LOCALISATION ACCURACY ....................................................................................... 195
TABLE 6.36 LOCALISATION DESCRIPTIVE STATISTICS - CASE V CONTROL SIDE (MAX=30) .............................................................. 196

xiv
TABLE 6.37 LOCALISATION - RESULTS OF STATISTICAL ANALYSES ............................................................................................. 197
TABLE 6.38 CORRELATION BETWEEN LOCALISATION ACCURACY AND GROUP (CASE/CONTROL) ..................................................... 197
TABLE 6.39 LATERALITY DISCRIMINATION DESCRIPTIVE STATISTICS - ACCURACY LEFT V RIGHT HANDS ............................................ 198
TABLE 6.40 LATERALITY DISCRIMINATION ACCURACY LEFT V RIGHT HANDS - STATISTICAL ANALYSES ............................................. 200
TABLE 6.41 LATERALITY DISCRIMINATION DESCRIPTIVE STATISTICS - ACCURACY AFFECTED V UNAFFECTED HANDS ............................ 201
TABLE 6.42 LATERALITY DISCRIMINATION ACCURACY AFFECTED V UNAFFECTED HANDS - STATISTICAL RESULTS ............................... 203
TABLE 6.43 LATERALITY DISCRIMINATION DESCRIPTIVE STATISTICS - ACCURACY CASE V CONTROL HANDS ....................................... 204
TABLE 6.44 LATERALITY DISCRIMINATION HAND ACCURACY CASE V CONTROL- STATISTICAL ANALYSES ............................................ 205
TABLE 6.45 CORRELATION BETWEEN GROUP TYPE AND HAND ACCURACY - LATERALITY DISCRIMINATION ....................................... 205
TABLE 6.46 LATERALITY DISCRIMINATION DESCRIPTIVE STATISTICS - ACCURACY LEFT V RIGHT BACK (% CORRECT) ............................ 206
TABLE 6.47 LATERALITY DISCRIMINATION BACK ACCURACY LEFT V RIGHT - STATISTICAL ANALYSES ................................................ 208
TABLE 6.48 LATERALITY DISCRIMINATION DESCRIPTIVE STATISTICS - ACCURACY AFFECTED V UNAFFECTED BACK .............................. 209
TABLE 6.49 LATERALITY DISCRIMINATION BACK ACCURACY AFFECTED V UNAFFECTED - STATISTICAL ANALYSES ................................ 211
TABLE 6.50 LATERALITY DISCRIMINATION DESCRIPTIVE STATISTICS - ACCURACY CASE V CONTROL BACK ......................................... 212
TABLE 6.51 LATERALITY DISCRIMINATION ACCURACY BACK - RESULTS OF STATISTICAL ANALYSES ................................................... 213
TABLE 6.52 CORRELATION OF GROUP AND BACK ACCURACY - LATERALITY DISCRIMINATION ......................................................... 213
TABLE 6.53 LATERALITY DISCRIMINATION DESCRIPTIVE STATISTICS - ACCURACY LEFT V RIGHT HANDS (SEC) .................................... 214
TABLE 6.54 LATERALITY DISCRIMINATION REACTION TIME HANDS - LEFT V RIGHT STATISTICAL ANALYSES ........................................ 216
TABLE 6.55 LATERALITY DISCRIMINATION DESCRIPTIVE STATISTICS - REACTION TIME AFFECTED V UNAFFECTED HANDS (SEC) ............. 217
TABLE 6.56 LATERALITY DISCRIMINATION REACTION TIME HANDS - AFFECTED V UNAFFECTED STATISTICAL ANALYSES ...................... 219
TABLE 6.57 LATERALITY DISCRIMINATION DESCRIPTIVE STATISTICS - REACTION TIME CASE V CONTROL HANDS ................................ 220
TABLE 6.58 LATERALITY DISCRIMINATION REACTION TIME HANDS - CASE V CONTROL STATISTICAL ANALYSES ................................... 221
TABLE 6.59 CORRELATION BETWEEN GROUP TYPE AND REACTION TIME HANDS - LATERALITY DISCRIMINATION ............................... 221
TABLE 6.60 LATERALITY DISCRIMINATION DESCRIPTIVE STATISTICS - REACTION TIMES CORRECT V INCORRECT HANDS (SEC)................ 222
TABLE 6.61 LATERALITY DISCRIMINATION REACTION TIME HANDS - CORRECT V INCORRECT STATISTICAL ANALYSES........................... 224
TABLE 6.62 LATERALITY DISCRIMINATION DESCRIPTIVE STATISTICS - REACTION TIMES LEFT V RIGHT BACK (SEC) ............................... 225
TABLE 6.63 LATERALITY DISCRIMINATION REACTION TIME BACK - LEFT V RIGHT STATISTICAL ANALYSES ......................................... 227
TABLE 6.64 LATERALITY DISCRIMINATION DESCRIPTIVE STATISTICS - REACTION TIME AFFECTED V UNAFFECTED BACK ........................ 228
TABLE 6.65 LATERALITY DISCRIMINATION REACTION TIME BACK - AFFECTED V UNAFFECTED STATISTICAL ANALYSES ......................... 230
TABLE 6.66 LATERALITY DISCRIMINATION DESCRIPTIVE STATISTICS - REACTION TIME CASE V CONTROL BACK (SEC) ........................... 231
TABLE 6.67 LATERALITY DISCRIMINATION REACTION TIME BACK - CASE V CONTROL STATISTICAL ANALYSES ..................................... 232
TABLE 6.68 CORRELATION BETWEEN GROUP TYPE AND REACTION TIME (BACK) - LATERALITY DISCRIMINATION ............................... 232
TABLE 6.69 LATERALITY DISCRIMINATION DESCRIPTIVE STATISTICS - REACTION TIMES CORRECT V INCORRECT BACK (SEC) .................. 233
TABLE 6.70 LATERALITY DISCRIMINATION REACTION TIME BACK - CORRECT V INCORRECT STATISTICAL ANALYSES ............................ 235
TABLE 6.71 LINE BISECTION DESCRIPTIVE STATISTICS - RIGHT V LEFT WITHIN GROUPS ................................................................. 236
TABLE 6.72 LINE BISECTION LEFT V RIGHT HAND - RESULTS OF STATISTICAL ANALYSES ................................................................ 238
TABLE 6.73 LINE BISECTION DESCRIPTIVE STATISTICS - TEST PAPER POSITION RELATIVE ERROR (%) ................................................ 240
TABLE 6.74 LINE BISECTION TEST PAPER POSITION - RESULTS OF STATISTICAL ANALYSES .............................................................. 240
TABLE 6.75 LINE BISECTION DESCRIPTIVE STATISTICS - LINE LENGTH AEADJUSTED (%) ..................................................................... 244

xv
TABLE 6.76 LINE BISECTION LINE LENGTHS - RESULTS OF STATISTICAL ANALYSES ........................................................................ 244
TABLE 6.77 LINE BISECTION DESCRIPTIVE STATISTICS- AFFECTED V UNAFFECTED (HAND) WITHIN GROUPS ....................................... 248
TABLE 6.78 LINE BISECTION AFFECTED V UNAFFECTED HAND - STATISTICAL ANALYSES ................................................................ 249
TABLE 6.79 LINE BISECTION DESCRIPTIVE STATISTICS- AFFECTED V UNAFFECTED (PAPER POSITION) WITHIN GROUPS ......................... 250
TABLE 6.80 LINE BISECTION AFFECTED V UNAFFECTED (PAPER POSITION) - STATISTICAL ANALYSES ................................................ 252
TABLE 6.81 LINE BISECTION DESCRIPTIVE STATISTICS - BODY V STANDARD LINES WITHIN GROUPS .................................................. 253
TABLE 6.82 LINE BISECTION BODY V STANDARD LINES - STATISTICAL ANALYSES .......................................................................... 255
TABLE 6.83 LINE BISECTION DESCRIPTIVE STATISTICS- CASE V CONTROL COMBINED AEADJUSTED (%) ................................................. 256
TABLE 6.84 LINE BISECTION CASE V CONTROL - STATISTICAL ANALYSES .................................................................................... 257
TABLE 6.85 CORRELATION BETWEEN GROUP TYPE AND LINE BISECTION ERROR ......................................................................... 257
TABLE 6.86 TRUNK PROPRIOCEPTION DESCRIPTIVE STATISTICS - LEFT V RIGHT-COMBINED TESTS (AEADJUSTED %) ............................... 258
TABLE 6.87 PROPRIOCEPTION LEFT V RIGHT - STATISTICAL ANALYSES ...................................................................................... 260
TABLE 6.88 TRUNK PROPRIOCEPTION DESCRIPTIVE STATISTICS - AFFECTED V UNAFFECTED SIDE .................................................... 261
TABLE 6.89 PROPRIOCEPTION AFFECTED V UNAFFECTED SIDE - STATISTICAL ANALYSES ............................................................... 263
TABLE 6.90 TRUNK PROPRIOCEPTION DESCRIPTIVE STATISTICS - CASE V CONTROL ..................................................................... 264
TABLE 6.91 TRUNK PROPRIOCEPTION CASE V CONTROL - STATISTICAL L ANALYSES ..................................................................... 265
TABLE 6.92 CORRELATION BETWEEN GROUP TYPE AND PROPRIOCEPTION................................................................................. 265
TABLE 6.93 DYNAMIC STANDING BALANCE - EXTREME SCORES ............................................................................................... 266
TABLE 6.94 DYNAMIC STANDING BALANCE DESCRIPTIVE STATISTICS - LEFT V RIGHT (SEC) ............................................................ 267
TABLE 6.95 DYNAMIC STANDING BALANCE LEFT V RIGHT - STATISTICAL ANALYSES ..................................................................... 267
TABLE 6.96 EXTREME SCORES ......................................................................................................................................... 270
TABLE 6.97 DYNAMIC STANDING BALANCE DESCRIPTIVE STATISTICS - AFFECTED V UNAFFECTED SIDE ............................................. 271
TABLE 6.98 DYNAMIC STANDING BALANCE AFFECTED V UNAFFECTED SIDE - STATISTICAL ANALYSIS ............................................... 272
TABLE 6.99 DYNAMIC STANDING BALANCE DESCRIPTIVE STATISTICS- CASE V CONTROL (UNTRANSFORMED AND LOG10) ..................... 274
TABLE 6.100 DYNAMIC STANDING BALANCE CASE V CONTROL- STATISTICAL ANALYSES ............................................................... 275
TABLE 6.101 CORRELATION BETWEEN GROUP TYPE AND BALANCE .......................................................................................... 275
TABLE 6.102 PROPORTION OF PEOPLE REPORTING PROBLEMS (%) AND MEAN VAS SCORE ......................................................... 278
TABLE 7.1 RESEARCH QUESTION - CORRELATION STUDY ........................................................................................................ 287
TABLE 7.2 X-RAY VARIABLES ........................................................................................................................................... 288
TABLE 7.3 ISIS2 VARIABLES ............................................................................................................................................ 289
TABLE 7.4 NORMATIVE VALUES FOR ISIS MEASUREMENTS .................................................................................................... 290
TABLE 8.1 X-RAY AND ISIS-2 INFORMATION AVAILABLE BY SITE ............................................................................................. 292
TABLE 8.2 ISIS-2 MEASURES - DESCRIPTIVE STATISTICS ......................................................................................................... 293
TABLE 8.3 X-RAY V ISIS-2 VARIABLES - CORRELATIONS ......................................................................................................... 296
TABLE 8.4 X-RAY V MEASURES OF BODY SCHEMA - CORRELATIONS ......................................................................................... 300
TABLE 8.5 ISIS-2 VARIABLES V MEASURES OF BODY SCHEMA - CORRELATIONS .......................................................................... 301
TABLE 8.6 X-RAY V OTHER MEASURES - CORRELATIONS ........................................................................................................ 305
TABLE 8.7 ISIS-2 V OTHER MEASURES - CORRELATIONS ........................................................................................................ 309
TABLE 8.8 CORRELATIONS BETWEEN SAQ SCALES AND SRS-22R SCALES ................................................................................. 314

xvi
TABLE 8.9 CORRELATIONS BETWEEN SAQ SCALES AND PODCI SCALES .................................................................................... 315
TABLE 8.10 CORRELATIONS BETWEEN SAQ SCALES AND EQ5D DOMAINS ............................................................................... 316
TABLE 9.1 RESEARCH QUESTION - LONGITUDINAL STUDY ...................................................................................................... 322
TABLE 10.1 FOLLOW-UP BY RECRUITMENT SITE .................................................................................................................. 326
TABLE 10.2 MISSING DATA BY OUTCOME TYPE ................................................................................................................... 328
TABLE 10.3 PARTICIPANT BASELINE DEMOGRAPHIC VARIABLES BY RESPONDER TYPE ................................................................... 329
TABLE 10.4 PARTICIPANT BASELINE COBB ANGLE (MAIN CURVE) BY RESPONDER TYPE ................................................................. 332
TABLE 10.5 PARTICIPANT BASELINE BRACE USE & SPINAL DEFORMITY CHARACTERISTICS BY RESPONDER TYPE .................................. 334
TABLE 10.6 COBB ANGLE - DESCRIPTIVE STATISTICS ............................................................................................................. 337
TABLE 10.7 X-RAY CORONAL BALANCE - DESCRIPTIVE STATISTICS ............................................................................................ 337
TABLE 10.8 X-RAY SAGITTAL BALANCE - DESCRIPTIVE STATISTICS ............................................................................................ 338
TABLE 10.9 SUMMARY OF STATISTICAL ANALYSES - X-RAY ..................................................................................................... 338
TABLE 10.10 SAQ APPEARANCE SCORE - DESCRIPTIVE STATISTICS .......................................................................................... 345
TABLE 10.11 SAQ EXPECTATIONS SCORE - DESCRIPTIVE STATISTICS ........................................................................................ 346
TABLE 10.12 SAQ TOTAL SCORE - DESCRIPTIVE STATISTICS ................................................................................................... 347
TABLE 10.13 SUMMARY OF STATISTICAL ANALYSES - SAQ .................................................................................................... 347
TABLE 10.14 KPAQ - DESCRIPTIVE STATISTICS ................................................................................................................... 355
TABLE 10.15 SUMMARY OF STATISTICAL ANALYSES - KPAQ .................................................................................................. 355
TABLE 10.16 SRS22R FUNCTION SCALE - DESCRIPTIVE STATISTICS .......................................................................................... 358
TABLE 10.17 SRS22R PAIN SCALE - DESCRIPTIVE STATISTICS ................................................................................................. 359
TABLE 10.18 SRS22R SELF-IMAGE SCALE - DESCRIPTIVE STATISTICS ........................................................................................ 360
TABLE 10.19 SRS22R MENTAL HEALTH SCALE - DESCRIPTIVE STATISTICS .................................................................................. 360
TABLE 10.20 SRS22R SUBTOTAL - DESCRIPTIVE STATISTICS ................................................................................................... 361
TABLE 10.21 SUMMARY OF STATISTICAL ANALYSES - SRS-22R .............................................................................................. 362
TABLE 10.22 EQ5D HEALTH STATE VAS - DESCRIPTIVE STATISTICS ......................................................................................... 373
TABLE 10.23 EQ5D - 3L FREQUENCIES ............................................................................................................................ 374
TABLE 10.24 SUMMARY OF STATISTICAL ANALYSES - EQ5D DOMAINS .................................................................................... 375
TABLE 10.25 PODCI UPPER EXTREMITY & PHYSICAL FUNCTION SCORES - DESCRIPTIVE STATISTICS ............................................... 379
TABLE 10.26 PODCI SCALE SCORES - DESCRIPTIVE STATISTICS ............................................................................................... 380
TABLE 10.27 PODCI PAIN/COMFORT & HAPPINESS SCORES - DESCRIPTIVE STATISTICS .............................................................. 381
TABLE 10.28 SUMMARY OF STATISTICAL ANALYSES 1 - PODCI SCALES .................................................................................... 382
TABLE 10.29 SUMMARY OF STATISTICAL ANALYSES 2 - PODCI PAIN AND HAPPINESS SCALES ....................................................... 382
TABLE 10.30 TPDT - DESCRIPTIVE STATISTICS .................................................................................................................... 395
TABLE 10.31 TWO POINT DISCRIMINATION THRESHOLD - STATISTICAL ANALYSES ....................................................................... 395
TABLE 10.32 LOCALISATION - DESCRIPTIVE STATISTICS ......................................................................................................... 396
TABLE 10.33 LOCALISATION - STATISTICAL ANALYSES ........................................................................................................... 396
TABLE 10.34 LATERALITY DISCRIMINATION HANDS ACCURACY - DESCRIPTIVE STATISTICS ............................................................. 397
TABLE 10.35 LATERALITY DISCRIMINATION BACK ACCURACY - DESCRIPTIVE STATISTICS ............................................................... 398
TABLE 10.36 LATERALITY DISCRIMINATION REACTION TIMES - DESCRIPTIVE STATISTICS ............................................................... 399

xvii
TABLE 10.37 LATERALITY DISCRIMINATION - STATISTICAL ANALYSES ........................................................................................ 400
TABLE 10.38 LATERALITY DISCRIMINATION ACCURACY BACK - STATISTICAL ANALYSIS ................................................................. 400
TABLE 10.39 LINE BISECTION TESTING - DESCRIPTIVE STATISTICS ............................................................................................ 401
TABLE 10.40 LINE BISECTION - STATISTICAL ANALYSIS .......................................................................................................... 401
TABLE 10.41 TRUNK PROPRIOCEPTION - DESCRIPTIVE STATISTICS ........................................................................................... 402
TABLE 10.42 TRUNK PROPRIOCEPTION - STATISTICAL ANALYSES ............................................................................................. 402
TABLE 10.43 DYNAMIC STANDING BALANCE - DESCRIPTIVE STATISTICS .................................................................................... 403
TABLE 10.44 DYNAMIC BALANCE - STATISTICAL ANALYSES .................................................................................................... 403
TABLE 10.45 CORRELATIONS - COBB ANGLE V BODY SCHEMA MEASURES ................................................................................. 423
TABLE 10.46 CORRELATIONS - COBB V SAQ AND KPAQ ..................................................................................................... 425

xviii
List of Figures
FIGURE 1.1 SCOLIOTIC SPINE AND ANATOMICAL PLANES ........................................................................................................... 4
FIGURE 1.2 ADAM’S FORWARD BENDING TEST ........................................................................................................................ 5
FIGURE 1.3 CALCULATING COBB ANGLE ................................................................................................................................ 6
FIGURE 1.4 SURFACE TOPOGRAPHY USING ISIS-2 ................................................................................................................... 6
FIGURE 1.5 TYPE OF CURVES ............................................................................................................................................... 7
FIGURE 1.6 SPINAL BALANCE FRONTAL AND SAGITTAL .............................................................................................................. 8
FIGURE 1.7 TYPES OF SCOLIOSIS ........................................................................................................................................... 9
FIGURE 1.8 ABNORMALITIES INCLUDED IN SCHLOSSER ET AL REVIEW ......................................................................................... 14
FIGURE 2.1 PENFIELD’S SENSORY HOMUNCULUS ILLUSTRATING HOW BODY PARTS ARE REPRESENTED IN THE PRIMARY SOMATOSENSORY
CORTEX. ............................................................................................................................................................... 17
FIGURE 2.2 BODY REPRESENTATION CONTINUUM .................................................................................................................. 19
FIGURE 2.3 RUBBER HAND ILLUSION ................................................................................................................................... 27
FIGURE 2.4 PINOCCHIO ILLUSION ....................................................................................................................................... 28
FIGURE 2.5 TRAINING PROGRAMME FOR CLBP AS USED BY WAND ET AL 2011 .......................................................................... 33
FIGURE 2.6 PROPOSED PROCESS OF SCOLIOSIS INITIATION ....................................................................................................... 37
FIGURE 3.1 CONSORT DIAGRAM - SEARCH AND INCLUSION DETAILS ........................................................................................... 44
FIGURE 3.2 FOREST PLOT FOR STATIC BALANCE (STANDING) - SWAY AREA EYES OPEN ................................................................... 46
FIGURE 3.3 FOREST PLOT FOR STATIC BALANCE (STANDING) - SWAY AREA EYES CLOSED ................................................................. 47
FIGURE 3.4 FOREST PLOT FOR STATIC BALANCE (STANDING) - SAGITTAL MOVEMENT .................................................................... 48
FIGURE 3.5 FOREST PLOT FOR STATIC BALANCE (STANDING) - LATERAL MOVEMENT ...................................................................... 49
FIGURE 3.6 FOREST PLOT FOR DYNAMIC BALANCE - EYES OPEN ................................................................................................. 50
FIGURE 3.7 FOREST PLOT FOR 1 LEG STANDING BALANCE ........................................................................................................ 51
FIGURE 3.8 FOREST PLOT FOR TANDEM STANDING BALANCE - COMBINED ................................................................................... 52
FIGURE 3.9 FOREST PLOTS OF VIBRATION THRESHOLD ............................................................................................................ 59
FIGURE 3.10 FOREST PLOT SUBJECTIVE VISUAL VERTICAL ......................................................................................................... 63
FIGURE 3.11 FOREST PLOTS OF VOR GAIN........................................................................................................................... 66
FIGURE 3.12 FOREST PLOTS FOR CORTICAL SEP CONDUCTION TIME (MS) ................................................................................... 72
FIGURE 4.1 EXAMPLE OF INSTRUMENT USED FOR TPDT TESTING ............................................................................................. 91
FIGURE 4.2 TEST REGIONS FOR TACTILE LOCALISATION EVALUATION .......................................................................................... 96
FIGURE 6.1 CONSORT DIAGRAM CASE CONTROL STUDY*....................................................................................................... 140
FIGURE 6.2 CONTROLS PER CASE (BY ID) ........................................................................................................................... 143
FIGURE 6.3 CONTROLS PER CASE (BY AGE) ......................................................................................................................... 143
FIGURE 6.4 A) CASE AND HOSPITAL LOCATIONS B) CONTROL AND SCHOOL LOCATIONS ........................................................ 144
FIGURE 6.5 HISTOGRAM & BOXPLOT OF AGE BY GROUP ....................................................................................................... 146
FIGURE 6.6 COBB ANGLE PRIMARY CURVE - HISTOGRAM & BOXPLOT....................................................................................... 150
FIGURE 6.7 CORONAL BALANCE - HISTOGRAM & BOXPLOT .................................................................................................... 151

xix
FIGURE 6.8 SAGITTAL BALANCE - HISTOGRAM & BOXPLOT .................................................................................................... 151
FIGURE 6.9 SAQ APPEARANCE HISTOGRAM AND BOX PLOT ................................................................................................... 154
FIGURE 6.10 SAQ EXPECTATIONS HISTOGRAM AND BOXPLOT ................................................................................................ 154
FIGURE 6.11 SAQ TOTAL SCORE HISTOGRAM & BOXPLOT ..................................................................................................... 155
FIGURE 6.12 KPAQ HISTOGRAMS & BOXPLOT ................................................................................................................... 157
FIGURE 6.13 SRS-22R FUNCTION HISTOGRAM & BOXPLOT ................................................................................................... 161
FIGURE 6.14 SRS-22R PAIN HISTOGRAM & BOXPLOT .......................................................................................................... 161
FIGURE 6.15 SRS-22R SELF-IMAGE HISTOGRAM & BOXPLOT ................................................................................................ 162
FIGURE 6.16 SRS-22R MENTAL HEALTH HISTOGRAM & BOXPLOT .......................................................................................... 162
FIGURE 6.17 SRS-22R TOTAL SCORE HISTOGRAM & BOXPLOT ............................................................................................... 163
FIGURE 6.18 EQ5D - 3L DOMAINS .................................................................................................................................. 168
FIGURE 6.19 EQ5D HEALTH STATE HISTOGRAMS & BOXPLOT ................................................................................................ 170
FIGURE 6.20 PODCI UPPER EXTREMITY & PHYSICAL FUNCTION - HISTOGRAM & BOXPLOT .......................................................... 176
FIGURE 6.21 PODCI TRANSFERS & BASIC MOBILITY - HISTOGRAM & BOX PLOT ........................................................................ 176
FIGURE 6.22 PODCI SPORTS & PHYSICAL FUNCTIONING - HISTOGRAM & BOXPLOT ................................................................... 177
FIGURE 6.23 PODCI PAIN/COMFORT - HISTOGRAM & BOXPLOT ............................................................................................ 177
FIGURE 6.24 PODCI GLOBAL FUNCTION - HISTOGRAM & BOXPLOT ........................................................................................ 178
FIGURE 6.25 PODCI HAPPINESS WITH PHYSICAL CONDITION - HISTOGRAM & BOXPLOT .............................................................. 178
FIGURE 6.26 TWO POINT DISCRIMINATION THRESHOLD HISTOGRAMS & BOXPLOTS - LEFT V RIGHT WITHIN GROUPS ......................... 181
FIGURE 6.27 TWO POINT DISCRIMINATION THRESHOLD MEANS (95% CI) - LEFT V RIGHT WITHIN GROUPS ..................................... 182
FIGURE 6.28 TWO POINT DISCRIMINATION THRESHOLD HISTOGRAMS & BOXPLOTS - AFFECTED V UNAFFECTED SIDE WITHIN GROUPS .. 184
FIGURE 6.29 TWO POINT DISCRIMINATION THRESHOLD MEANS (95% CI) - AFFECTED V UNAFFECTED ........................................... 185
FIGURE 6.30 TWO POINT DISCRIMINATION THRESHOLD - HISTOGRAMS, BOXPLOTS & MEANS (95% CI) CASE V CONTROL ................. 187
FIGURE 6.31 LOCALISATION HISTOGRAMS & BOXPLOTS - LEFT V RIGHT WITHIN GROUPS ............................................................. 189
FIGURE 6.32 LOCALISATION MEANS (95% CI) - LEFT V RIGHT ............................................................................................... 190
FIGURE 6.33 LOCALISATION HISTOGRAM & BOXPLOTS - AFFECTED - UNAFFECTED SIDE .............................................................. 192
FIGURE 6.34 LOCALISATION MEANS (95% CI) - AFFECTED V UNAFFECTED SIDE ........................................................................ 193
FIGURE 6.35 LOCALISATION HISTOGRAMS, BOXPLOTS & MEANS (95% CI) - CASE V CONTROL LOCATION ....................................... 195
FIGURE 6.36 LOCALISATION HISTOGRAMS, BOXPLOTS & MEANS (95% CI) - CASE V CONTROL (SIDE) ............................................ 197
FIGURE 6.37 LATERALITY DISCRIMINATION HISTOGRAMS & BOXPLOTS - ACCURACY LEFT V RIGHT HANDS ....................................... 199
FIGURE 6.38 LATERALITY DISCRIMINATION MEANS (95% CI) - ACCURACY LEFT V RIGHT HANDS ................................................... 200
FIGURE 6.39 LATERALITY DISCRIMINATION HISTOGRAMS & BOXPLOTS - ACCURACY AFFECTED V UNAFFECTED HANDS ...................... 202
FIGURE 6.40 LATERALITY DISCRIMINATION MEANS (95% CI) - ACCURACY AFFECTED V UNAFFECTED HANDS .................................. 203
FIGURE 6.41 LATERALITY DISCRIMINATION HISTOGRAMS, BOXPLOTS & MEANS (95% CI) - ACCURACY CASE V CONTROL HANDS ........ 205
FIGURE 6.42 LATERALITY DISCRIMINATION HISTOGRAMS & BOXPLOTS - ACCURACY LEFT V RIGHT BACK ......................................... 207
FIGURE 6.43 LATERALITY DISCRIMINATION MEANS (95% CI) - ACCURACY LEFT V RIGHT ............................................................. 208
FIGURE 6.44 LATERALITY DISCRIMINATION HISTOGRAMS & BOXPLOTS - ACCURACY AFFECTED V UNAFFECTED BACK ......................... 210
FIGURE 6.45 LATERALITY DISCRIMINATION MEANS (95% CI) - ACCURACY AFFECTED V UNAFFECTED BACK .................................... 211
FIGURE 6.46 LATERALITY DISCRIMINATION HISTOGRAMS, BOXPLOTS & MEANS (95% CI) - ACCURACY CASE V CONTROL BACK ........... 213
xx
FIGURE 6.47 LATERALITY DISCRIMINATION HISTOGRAMS & BOXPLOTS - REACTION TIMES LEFT V RIGHT HANDS ............................... 215
FIGURE 6.48 LATERALITY DISCRIMINATION MEANS (95% CI) - REACTION TIMES LEFT V RIGHT HANDS ........................................... 216
FIGURE 6.49 LATERALITY DISCRIMINATION HISTOGRAMS & BOXPLOTS - REACTION TIME AFFECTED V UNAFFECTED HANDS ................ 218
FIGURE 6.50 LATERALITY DISCRIMINATION MEANS (95% CI) - REACTION TIME AFFECTED V UNAFFECTED HANDS ............................ 219
FIGURE 6.51 LATERALITY DISCRIMINATION HISTOGRAMS, BOXPLOTS & MEANS (95% CI) - REACTION TIME CASE V CONTROL HANDS .. 221
FIGURE 6.52 LATERALITY DISCRIMINATION HISTOGRAMS & BOXPLOTS - REACTION TIMES CORRECT V INCORRECT HANDS .................. 223
FIGURE 6.53 LATERALITY DISCRIMINATION MEANS (95% CI) - REACTION TIMES CORRECT V INCORRECT HANDS .............................. 224
FIGURE 6.54 LATERALITY DISCRIMINATION HISTOGRAMS & BOXPLOTS - REACTION TIMES LEFT V RIGHT BACK ................................. 226
FIGURE 6.55 LATERALITY DISCRIMINATION MEANS (95% CI) - REACTION TIMES LEFT V RIGHT BACK ............................................. 227
FIGURE 6.56 LATERALITY DISCRIMINATION HISTOGRAMS & BOXPLOTS - REACTION TIME AFFECTED V UNAFFECTED BACK .................. 229
FIGURE 6.57 LATERALITY DISCRIMINATION MEANS (95% CI) - REACTION TIME AFFECTED V UNAFFECTED BACK .............................. 230
FIGURE 6.58 LATERALITY DISCRIMINATION HISTOGRAMS, BOXPLOTS & MEANS (95% CI) - REACTION TIME CASE V CONTROL BACK .... 232
FIGURE 6.59 LATERALITY DISCRIMINATION HISTOGRAMS & BOXPLOTS - REACTION TIMES CORRECT V INCORRECT BACK .................... 234
FIGURE 6.60 LATERALITY DISCRIMINATION MEANS (95% CI) - REACTION TIMES CORRECT V INCORRECT BACK ................................ 235
FIGURE 6.61 LINE BISECTION HISTOGRAMS & BOXPLOTS - RIGHT V LEFT WITHIN GROUPS ............................................................ 237
FIGURE 6.62 LINE BISECTION MEANS (95% CI) - RIGHT V LEFT WITHIN GROUPS ........................................................................ 238
FIGURE 6.63 LINE BISECTION HISTOGRAMS - TEST PAPER POSITION WITHIN GROUPS ................................................................... 241
FIGURE 6.64 LINE BISECTION BOXPLOTS AND MEANS (95% CI) - TEST PAPER POSITION WITHIN GROUPS ........................................ 242
FIGURE 6.65 LINE BISECTION HISTOGRAMS - LINE LENGTH WITHIN GROUPS .............................................................................. 245
FIGURE 6.66 LINE BISECTION BOXPLOTS AND MEANS (95% CI) - LINE LENGTH WITHIN GROUPS (OUTLIER EXCLUDED) ...................... 246
FIGURE 6.67 LINE BISECTION HISTOGRAMS & BOXPLOTS - AFFECTED V UNAFFECTED (HAND) WITHIN GROUPS ................................. 248
FIGURE 6.68 LINE BISECTION MEANS (95% CI) - AFFECTED V UNAFFECTED SIDES (HAND) ........................................................... 249
FIGURE 6.69 LINE BISECTION HISTOGRAMS & BOXPLOTS - AFFECTED V UNAFFECTED (PAPER POSITION) WITHIN GROUPS ................... 251
FIGURE 6.70 LINE BISECTION MEANS (95% CI) - AFFECTED V UNAFFECTED (PAPER POSITION) WITHIN GROUPS ............................... 252
FIGURE 6.71 LINE BISECTION HISTOGRAMS & BOXPLOTS - BODY V STANDARD LINES WITHIN GROUPS ............................................ 254
FIGURE 6.72 LINE BISECTION MEANS (95%CI) - BODY V STANDARD LINES WITHIN GROUPS ......................................................... 255
FIGURE 6.73 LINE BISECTION HISTOGRAMS, BOXPLOTS AND MEANS (95% CI) - CASE V CONTROL ................................................. 257
FIGURE 6.74 TRUNK PROPRIOCEPTION HISTOGRAMS & BOXPLOTS - LEFT V RIGHT COMBINED TESTS.............................................. 259
FIGURE 6.75 TRUNK PROPRIOCEPTION MEAN (95% CI) - LEFT V RIGHT .................................................................................. 260
FIGURE 6.76 TRUNK PROPRIOCEPTION HISTOGRAMS & BOXPLOTS - AFFECTED V UNAFFECTED ..................................................... 262
FIGURE 6.77 TRUNK PROPRIOCEPTION MEAN (95% CI) - AFFECTED V UNAFFECTED SIDE MEAN (95% CI) ..................................... 263
FIGURE 6.78 TRUNK PROPRIOCEPTION HISTOGRAMS & BOXPLOTS - CASE V CONTROL ................................................................ 265
FIGURE 6.79 DYNAMIC STANDING BALANCE HISTOGRAMS & BOXPLOTS - LEFT V RIGHT .............................................................. 268
FIGURE 6.80 DYNAMIC STANDING BALANCE MEAN (95% CI) - LEFT V RIGHT BALANCE TIME ....................................................... 269
FIGURE 6.81 DYNAMIC STANDING BALANCE HISTOGRAMS & BOXPLOTS - AFFECTED V UNAFFECTED SIDE ........................................ 271
FIGURE 6.82 DYNAMIC STANDING BALANCE MEANS (95% CI) - AFFECTED V UNAFFECTED SIDE .................................................... 272
FIGURE 6.83 DYNAMIC STANDING BALANCE HISTOGRAMS, BOXPLOTS & MEANS (95% CI) - CASE V CONTROL ................................ 274
FIGURE 6.84 DYNAMIC STANDING BALANCE HISTOGRAMS, BOXPLOTS & MEANS- CASE V CONTROL LOG10 TRANSFORMATION........... 275
FIGURE 8.1 ISIS-2 LATERAL ASYMMETRY - HISTOGRAM & BOXPLOT ....................................................................................... 293

xxi
FIGURE 8.2 ISIS-2 VOLUMETRIC ASYMMETRY - HISTOGRAM & BOXPLOT ................................................................................. 294
FIGURE 8.3 ISIS-2 CORONAL BALANCE (ABSOLUTE VALUES) - HISTOGRAMS & BOXPLOTS ............................................................ 294
FIGURE 8.4 ISIS-2 TRANSVERSE ROTATION (ABSOLUTE VALUES) - HISTOGRAM & BOXPLOT ......................................................... 294
FIGURE 8.5 ISIS-2 FLEXION ANGLE (ABSOLUTE VALUE) - HISTOGRAM & BOXPLOT...................................................................... 295
FIGURE 8.6 X-RAY COBB ANGLE V ISIS-2 VARIABLES - SCATTERPLOTS ...................................................................................... 297
FIGURE 8.7 X-RAY CORONAL BALANCE V ISIS-2 VARIABLES - SCATTERPLOTS ............................................................................. 297
FIGURE 8.8 ISIS-2 CORONAL BALANCE V BODY SCHEMA MEASURES - SCATTERPLOTS .................................................................. 303
FIGURE 8.9 ISIS-2 TRANSVERSE ROTATION V BODY SCHEMA MEASURES - SCATTERPLOTS ............................................................ 303
FIGURE 8.10 ISIS-2 V SRS-22R - SCATTER PLOTS ............................................................................................................... 307
FIGURE 8.11 ISIS-2 V PODCI - SCATTER PLOTS .................................................................................................................. 308
FIGURE 8.12 SCATTERPLOTS SAQ APPEARANCE V PAIN, SELF-IMAGE & HAPPINESS WITH PHYSICAL CONDITION ............................... 317
FIGURE 8.13 SCATTERPLOTS SAQ APPEARANCE V FUNCTION MEASURES .................................................................................. 317
FIGURE 10.1 CONSORT DIAGRAM LONGITUDINAL STUDY ...................................................................................................... 327
FIGURE 10.2 COBB ANGLE - HISTOGRAM ........................................................................................................................... 339
FIGURE 10.3 COBB ANGLE - BOXPLOTS .............................................................................................................................. 340
FIGURE 10.4 COBB ANGLE - MEANS (95% CI) .................................................................................................................... 340
FIGURE 10.5 X-RAY CORONAL BALANCE - HISTOGRAMS ........................................................................................................ 341
FIGURE 10.6 X-RAY CORONAL BALANCE - BOXPLOTS ............................................................................................................ 342
FIGURE 10.7 X-RAY CORONAL BALANCE - MEANS (95% CI) .................................................................................................. 342
FIGURE 10.8 X-RAY SAGITTAL BALANCE - HISTOGRAMS ........................................................................................................ 343
FIGURE 10.9 X-RAY SAGITTAL BALANCE - BOXPLOTS............................................................................................................. 344
FIGURE 10.10 X-RAY SAGITTAL BALANCE - MEANS (95% CI) ................................................................................................. 344
FIGURE 10.11 INTERACTION GRAPHS - TIMEPOINT * ARM ..................................................................................................... 348
FIGURE 10.12 SAQ APPEARANCE SCORE - ALL RESPONDERS HISTOGRAM ................................................................................ 349
FIGURE 10.13 SAQ APPEARANCE SCORE - 12 MTH COMPLETERS ONLY HISTOGRAM .................................................................. 349
FIGURE 10.14 SAQ APPEARANCE SCORE - BOXPLOTS ........................................................................................................... 350
FIGURE 10.15 SAQ APPEARANCE SCORE - MEANS (95% CI) ................................................................................................. 350
FIGURE 10.16 SAQ EXPECTATIONS SCORE - ALL RESPONDERS HISTOGRAMS ............................................................................ 351
FIGURE 10.17 SAQ EXPECTATIONS SCORE - 12 MTH COMPLETERS ONLY HISTOGRAMS ............................................................... 351
FIGURE 10.18 SAQ EXPECTATIONS SCORE - BOXPLOTS ......................................................................................................... 352
FIGURE 10.19 SAQ EXPECTATIONS SCORE - MEANS (95% CI) ............................................................................................... 352
FIGURE 10.20 SAQ TOTAL SCORE - ALL RESPONDERS HISTOGRAMS........................................................................................ 353
FIGURE 10.21 SAQ TOTAL SCORE - 12 MTH COMPLETERS ONLY HISTOGRAMS .......................................................................... 353
FIGURE 10.22 SAQ TOTAL SCORE - BOXPLOTS .................................................................................................................... 354
FIGURE 10.23 SAQ TOTAL SCORE - MEANS (95% CI) .......................................................................................................... 354
FIGURE 10.24 KPAQ SCORE - ALL RESPONDERS HISTOGRAMS .............................................................................................. 356
FIGURE 10.25 KPAQ SCORE - 12 MTH COMPLETERS ONLY HISTOGRAMS ................................................................................ 356
FIGURE 10.26 KPAQ - BOXPLOTS .................................................................................................................................... 357
FIGURE 10.27 KPAQ - MEANS (95% CI) ALL TIME POINTS ................................................................................................... 357
xxii
FIGURE 10.28 SRS-22R FUNCTION SCORE - ALL RESPONDERS HISTOGRAMS ALL TIME POINTS ..................................................... 363
FIGURE 10.29 SRS-22R FUNCTION SCORE - 12 MTH COMPLETERS ONLY HISTOGRAMS .............................................................. 363
FIGURE 10.30 SRS22R FUNCTION SCALE - BOXPLOTS .......................................................................................................... 364
FIGURE 10.31 SRS22R FUNCTION SCALE - MEANS (95% CI) ................................................................................................ 364
FIGURE 10.32 SRS22R PAIN SCORE - ALL RESPONDERS HISTOGRAMS ..................................................................................... 365
FIGURE 10.33 SRS22R PAIN SCORE - 12 MTH COMPLETERS ONLY HISTOGRAMS ....................................................................... 365
FIGURE 10.34 SRS22R PAIN SCALE - BOXPLOTS .................................................................................................................. 366
FIGURE 10.35 SRS22R PAIN SCALE - MEANS (95% CI) ........................................................................................................ 366
FIGURE 10.36 SRS22R SELF-IMAGE SCORE - ALL RESPONDERS HISTOGRAMS ........................................................................... 367
FIGURE 10.37 SRS22R SELF-IMAGE SCORE - 12 MTH COMPLETERS ONLY HISTOGRAMS ............................................................. 367
FIGURE 10.38 SRS22R SELF-IMAGE SCALE - BOXPLOTS ........................................................................................................ 368
FIGURE 10.39 SRS22R SELF-IMAGE SCALE - MEANS (95% CI) .............................................................................................. 368
FIGURE 10.40 SRS22R MENTAL HEALTH SCORE - ALL RESPONDERS HISTOGRAMS ..................................................................... 369
FIGURE 10.41 SRS22R MENTAL HEALTH SCORE - 12 MTH COMPLETERS ONLY HISTOGRAMS ....................................................... 369
FIGURE 10.42 SRS22R MENTAL HEALTH SCALE - BOXPLOTS .................................................................................................. 370
FIGURE 10.43 SRS22R MENTAL HEALTH SCALE - MEANS (95% CI) ........................................................................................ 370
FIGURE 10.44 SRS22R TOTAL SCORE - ALL RESPONDERS HISTOGRAMS ................................................................................... 371
FIGURE 10.45 SRS22R TOTAL SCORE - 12 MTH COMPLETERS ONLY ....................................................................................... 371
FIGURE 10.46 SRS22R TOTAL SCORE - BOXPLOTS ............................................................................................................... 372
FIGURE 10.47 SRS22R TOTAL SCORE - MEANS (95% CI) ..................................................................................................... 372
FIGURE 10.48 EQ5D MOBILITY ...................................................................................................................................... 375
FIGURE 10.49 EQ5D SELF-CARE ..................................................................................................................................... 375
FIGURE 10.50 EQ5D USUAL ACTIVITIES ........................................................................................................................... 376
FIGURE 10.51 EQ5D PAIN ............................................................................................................................................ 376
FIGURE 10.52 EQ5D ANXIETY / DEPRESSION..................................................................................................................... 376
FIGURE 10.53 EQ5D HEALTH STATE - ALL RESPONDERS HISTOGRAMS .................................................................................... 377
FIGURE 10.54 EQ5D HEALTH STATE - 12 MTH COMPLETERS ONLY HISTOGRAMS ...................................................................... 377
FIGURE 10.55 EQ5D HEALTH STATE - BOXPLOTS ................................................................................................................ 378
FIGURE 10.56 EQ5D HEALTH STATE - MEANS (95% CI) ...................................................................................................... 378
FIGURE 10.57 PODCI UPPER EXTREMITY & PHYSICAL FUNCTION - ALL RESPONDERS HISTOGRAMS ............................................... 383
FIGURE 10.58 PODCI UPPER EXTREMITY & PHYSICAL FUNCTION - 12 MTH COMPLETERS ONLY HISTOGRAMS ................................. 383
FIGURE 10.59 PODCI UPPER EXTREMITY & PHYSICAL FUNCTION - BOXPLOTS ........................................................................... 384
FIGURE 10.60 PODCI UPPER EXTREMITY & PHYSICAL FUNCTION - MEANS (95% CI) ................................................................. 384
FIGURE 10.61 PODCI TRANSFERS & BASIC MOBILITY - ALL RESPONDERS HISTOGRAMS .............................................................. 385
FIGURE 10.62 PODCI TRANSFERS & BASIC MOBILITY - 12 MTH COMPLETERS ONLY HISTOGRAMS ................................................ 385
FIGURE 10.63 PODCI TRANSFERS & BASIC MOBILITY - BOXPLOTS .......................................................................................... 386
FIGURE 10.64 PODCI TRANSFERS & BASIC MOBILITY - MEANS (95% CI) ................................................................................ 386
FIGURE 10.65 PODCI SPORT & PHYSICAL FUNCTIONING - ALL RESPONDERS HISTOGRAMS ......................................................... 387
FIGURE 10.66 PODCI SPORT & PHYSICAL FUNCTIONING - 12 MTH COMPLETERS ONLY HISTOGRAMS ............................................ 387

xxiii
FIGURE 10.67 PODCI SPORTS & PHYSICAL FUNCTIONING SCORES - BOXPLOTS ......................................................................... 388
FIGURE 10.68 PODCI SPORTS & PHYSICAL FUNCTIONING SCORES - MEANS (95% CI) ............................................................... 388
FIGURE 10.69 PODCI PAIN COMFORT - ALL RESPONDERS HISTOGRAMS ................................................................................. 389
FIGURE 10.70 PODCI PAIN COMFORT - 12 MTH COMPLETERS ONLY HISTOGRAMS ................................................................... 389
FIGURE 10.71 PODCI PAIN/COMFORT SCORES - BOXPLOTS ................................................................................................. 390
FIGURE 10.72 PODCI PAIN/COMFORT SCORES - MEANS (95% CI) ........................................................................................ 390
FIGURE 10.73 PODCI GLOBAL FUNCTION - ALL RESPONDERS HISTOGRAMS ............................................................................. 391
FIGURE 10.74 PODCI GLOBAL FUNCTION - 12 MTH COMPLETERS ONLY HISTOGRAMS ............................................................... 391
FIGURE 10.75 PODCI GLOBAL FUNCTION SCORE - BOXPLOTS ............................................................................................... 392
FIGURE 10.76 PODCI GLOBAL FUNCTION SCORE - MEANS (95% CI) ..................................................................................... 392
FIGURE 10.77 PODCI HAPPINESS - ALL RESPONDERS HISTOGRAMS ....................................................................................... 393
FIGURE 10.78 PODCI HAPPINESS - 12 MTH COMPLETERS ONLY HISTOGRAMS ......................................................................... 393
FIGURE 10.79 PODCI HAPPINESS SCORE - BOXPLOTS .......................................................................................................... 394
FIGURE 10.80 PODCI HAPPINESS SCORE - MEANS (95% CI) ................................................................................................ 394
FIGURE 10.81 TPDT - HISTOGRAMS ................................................................................................................................ 404
FIGURE 10.82 TPDT - BOXPLOTS .................................................................................................................................... 405
FIGURE 10.83 TPDT - MEANS (95% CI)........................................................................................................................... 405
FIGURE 10.84 LOCALISATION - HISTOGRAMS ..................................................................................................................... 406
FIGURE 10.85 LOCALISATION - BOXPLOTS.......................................................................................................................... 407
FIGURE 10.86 LOCALISATION - MEANS (95% CI) ................................................................................................................ 407
FIGURE 10.87 LATERALITY DISCRIMINATION - HANDS ACCURACY HISTOGRAMS ......................................................................... 408
FIGURE 10.88 LATERALITY DISCRIMINATION HANDS ACCURACY - BOXPLOTS ............................................................................. 409
FIGURE 10.89 LATERALITY DISCRIMINATION HANDS ACCURACY - MEANS (95% CI) ................................................................... 409
FIGURE 10.90 LATERALITY DISCRIMINATION BACK ACCURACY - HISTOGRAMS ........................................................................... 410
FIGURE 10.91 LATERALITY DISCRIMINATION BACK ACCURACY - BOXPLOTS ............................................................................... 411
FIGURE 10.92 LATERALITY DISCRIMINATION BACK ACCURACY - MEANS (95% CI) ...................................................................... 411
FIGURE 10.93 LATERALITY DISCRIMINATION REACTION TIME HANDS - HISTOGRAMS .................................................................. 412
FIGURE 10.94 LATERALITY DISCRIMINATION REACTION TIME HANDS - BOXPLOTS ...................................................................... 413
FIGURE 10.95 LATERALITY DISCRIMINATION REACTION TIME HANDS - MEANS (95% CI) ............................................................ 413
FIGURE 10.96 LATERALITY DISCRIMINATION REACTION TIME BACK - HISTOGRAMS .................................................................... 414
FIGURE 10.97 LATERALITY DISCRIMINATION REACTION TIME BACK - BOXPLOTS ........................................................................ 415
FIGURE 10.98 LATERALITY DISCRIMINATION REACTION TIME BACK - MEANS (95% CI) ............................................................... 415
FIGURE 10.99 LINE BISECTION - HISTOGRAMS .................................................................................................................... 416
FIGURE 10.100 LINE BISECTION - BOXPLOTS ...................................................................................................................... 417
FIGURE 10.101 LINE BISECTION - MEANS (95% CI) ............................................................................................................ 417
FIGURE 10.102 PROPRIOCEPTION - HISTOGRAMS ............................................................................................................... 418
FIGURE 10.103 PROPRIOCEPTION - BOXPLOTS ................................................................................................................... 419
FIGURE 10.104 PROPRIOCEPTION - MEANS (95% CI) ......................................................................................................... 419
FIGURE 10.105 DYNAMIC STANDING BALANCE - HISTOGRAMS .............................................................................................. 420

xxiv
FIGURE 10.106 DYNAMIC STANDING BALANCE - BOXPLOTS................................................................................................... 421
FIGURE 10.107 DYNAMIC STANDING BALANCE - MEANS (95% CI) ......................................................................................... 421
FIGURE 10.108 SCATTERPLOTS - COBB ANGLE V LOCALISATION ABILITY ................................................................................... 424
FIGURE 10.109 SCATTERPLOTS - COBB ANGLE V SAQ APPEARANCE ....................................................................................... 426

xxv
Declaration
This thesis is submitted to the University of Warwick in support of my application for the
degree of Doctor of Philosophy. It has been composed by myself and has not been submitted
in any previous application for a degree at any other institution. The work presented (including
data generation and data analysis) was carried out by myself apart from the cases listed below:
Wendy Bertram, Laura Bird, Cheryl Honeyman and Tamsin Hughes were responsible for
the recruitment of the participants with AIS from their respective NHS hospital trusts
and subsequent data collection.
Sarah Bridgewater, Emma Eyre, Janet Lowe, Elizabeth Russell and Jackie Todd assisted
the author with data collection from control participants.
This dissertation contains fewer than 80,000 words exclusive of appendices, bibliography,
tables and equations.

xxvi
Abstract
This thesis documents the studies and analyses conducted as part of a research project whose
principal aim was to evaluate the role of body schema in the development of adolescent
idiopathic scoliosis (AIS). There were three main research questions:
1. do adolescents with AIS differ from non-scoliotic adolescents with regard to
mechanisms that are thought to underpin body schema?
2. in adolescents with AIS, is there any relationship between the mechanisms thought to
underpin body schema and the magnitude of spinal deformity?
3. is there any relationship between changes in body schema and progression of the
spinal deformity in AIS over time?
To answer these questions, a systematic review of neurophysiological deficits in AIS and a case-
control study involving patients with AIS and non-scoliotic controls was performed along with a
series of correlational and longitudinal analyses. Fifty-eight participants with AIS (cases) were
recruited along with 197 age and sex-matched control participants from schools in
Warwickshire, Oxfordshire, Leicestershire and Coventry. Measures of body schema as well as
other self-report measures were collected at baseline for both groups. Cases were followed up
at 6 and 12 months. Imaging data of spinal deformity was also collected for case participants.
The results of the systematic review and case-control analysis indicated that people with AIS
did not differ significantly from non-scoliotic controls with regard to measures of body schema.
The correlational and longitudinal analyses confirmed the lack of association between these
two sets of parameters with no relationship between the magnitude of spinal deformity and
body schema over a period of 12 months.
Secondary analyses did reveal differences between case and control participants with regard to
perceived spinal deformity, pain, self-image and, to a lesser extent, function. Correlational and
longitudinal analyses revealed that these differences were not related to the magnitude of
spinal deformity and that perceptions of spinal deformity may be more important than the
actual bony changes themselves.

xxvii
List of abbreviations
AIS adolescent idiopathic scoliosis AUC area under curve BAQ Body Awareness Questionnaire BCa bias corrected and accelerated (bootstrap interval) BMI body mass index BSREC Biomedical and Scientific Research Ethics Committee C7 7th cervical vertebra CHQ-CF-87 Child Health Questionnaire - children’s form (87 items) CI confidence interval CLBP chronic low back pain CNS central nervous system CoE Church of England CRPS chronic regional pain syndrome CV cardiovascular deg degrees EHI Edinburgh Handedness Inventory F female fMRI functional magnetic resonance imaging GOT grating orientation task HRQoL health-related quality of life ICC intra-class correlation coefficient IQR inter-quartile range ISIS-2 Integrated Shape Imaging System ISRCTN International Standard Randomised Controlled Trial Number JCUH James Cook University Hospital, Middlesbrough JIS juvenile idiopathic scoliosis LBP low back pain LBT line bisection test M male MCID minimal clinically important difference MDC minimal detectable change MDT movement detection threshold MSOA middle layer super output areas n number NHS National Health Service NICE National Institute for Health and Care Excellence NIHR National Institute of Health Research NOC Nuffield Orthopaedic Centre, Oxford NRES National Research Ethics Service PLP phantom limb pain POTSI posterior trunk symmetry index RCT randomised controlled trial ROC receiver operating characteristics ROH Royal Orthopaedic Hospital, Birmingham S1 1st sacral vertebra

xxviii
SAQ Spinal Appearance Questionnaire SAUK Scoliosis Association, United Kingdom SCI spinal cord injury SD standard deviation SDT sensory discrimination testing SE standard error SEAS Scientific Exercise Approach to Scoliosis SEM standard error of measurement SRS-22r Scoliosis Research Society questionnaire - 22 items (revised) SSE scoliosis-specific exercise SVV subjective visual vertical T1 1st thoracic vertebra TAPS trunk appearance perception scale TPDT two point discrimination threshold TrA Transverse abdominis VAS visual analogue scale WRVAS Walter-Reed visual assessment scale

1
Introduction
A definitive cause for the development of adolescent idiopathic scoliosis (AIS) has yet to be
identified. The aim of this thesis is to determine whether there is any association between
body schema and the development of adolescent idiopathic scoliosis as has previously been
hypothesised. The objective of establishing a relationship is to facilitate novel approaches to
treatment of this condition without the necessity of resorting to highly intrusive and costly
interventions such as spinal fixation surgery or bracing. In doing so, it is hoped that outcomes
for this patient group will be improved.
The research questions that this thesis has set out to answer are:
1. do adolescents with AIS differ from non-scoliotic adolescents with regard to
mechanisms that are thought to underpin body schema?
2. in adolescents with AIS, is there any relationship between the mechanisms thought to
underpin body schema and the magnitude of spinal deformity?
3. is there any relationship between changes in body schema and progression of the
spinal deformity in AIS over time?
To answer these questions, four linked studies/analyses were conducted:
1. a systematic review of neurophysiological measures in people with AIS and non-
scoliotic controls (research question 1).
2. a case control study involving patients with AIS and non-scoliotic controls to investigate
research question 1.
3. a cross-sectional correlation analysis of baseline data from participants with AIS to
assess question 2.
4. a longitudinal analysis of 6 and 12 month follow-up data from participants with AIS to
evaluate question 3.
Because an observational study forms the basis of this thesis, any findings of an association
between measures of body schema and AIS does not prove causality. Therefore, in order to
judge whether body schema is a potential causal factor in AIS, a number of criteria will need to
be met as set out by Bradford-Hill [1]. Firstly, a plausible and strong relationship will need to be
established between deficits in measures of body schema and AIS (study 1 and 2: systematic
2
review and case control study), consistency of findings will need to be demonstrated across a
range of studies linking measures of body schema and AIS (study 1: systematic review), a dose-
response or biological gradient will need to be confirmed between measures of body schema
and differing magnitudes of AIS (3: cross-sectional correlation analysis) and specificity and
temporality in response in that changes in measures of body schema should result in changes
in AIS ( 4: longitudinal analysis).
This thesis consists of two volumes and is structured into five broad sections.
Volume I
The first section details the background to the subsequent studies:
Chapter 1 provides an introduction to AIS and an overview of current treatment and
knowledge regarding its aetiology.
Chapter 2 introduces the concept of body schema, its definition and role in other
clinical conditions, as well as its potential role in AIS.
Chapter 3 details a systematic review conducted to elucidate neurophysiological
changes associated with AIS and provides a rationale as to why body schema is a
potential factor in the development of AIS.
Chapter 4 describes the various methods that have been used to test body schema and
provides a rationale for the testing methodology subsequently employed in the studies
that form part of this thesis.
Section two describes the case control study conducted as part of this thesis with the aim of
answering research question 1:
Chapter 5 describes the methodology used in the case control study conducted as part
of this thesis, including participant recruitment and testing protocols.
Chapter 6 details the results of the case control study along with a brief summary and
discussion.
Section three explains the cross-sectional correlational analyses conducted to answer research
question 2:

3
Chapter 7 details the methodology used in the correlational analyses.
Chapter 8 presents the results of the correlational analyses and a brief discussion of the
findings.
Section 4 discusses the longitudinal analyses performed to answer research question 3:
Chapter 9 explains the methodology used in the longitudinal analyses.
Chapter 10 contains the results of the longitudinal analyses with a brief discussion of
the findings.
Volume II
The final section draws the results of all the analyses together:
Chapter 11 discusses the findings of the various analyses and studies conducted as part
of this thesis and explores their research and clinical implications.
Appendices detailing the recruitment paperwork (participant information sheets,
consent and eligibility forms) and the measures used for this research project.

4
1 What is Adolescent Idiopathic Scoliosis?
The aim of this chapter is to introduce the condition of adolescent idiopathic scoliosis, give a
broad overview of what is currently known regarding its aetiology and management, and detail
the issues that provide the rationale for this thesis.
1.1 Scoliosis
Scoliosis is a three dimensional deformity which involves a combination of bending and
twisting of the spine [1]. It is usually characterised by the degree of lateral curvature in the
frontal plane (
Figure 1.1) although the most noticeable changes in body shape (e.g. rib ‘hump’) are more
commonly associated with changes in the sagittal and transverse planes (due to altered
kyphosis/lordosis and axial rotation of the spine respectively).
Figure 1.1 Scoliotic spine and anatomical planes
(from [2, 3])
Scoliosis is often first suspected due to asymmetries in torso shape, scapular positioning or in
the level of the shoulders and/or pelvis. Clinical testing involves observation of the entire
spinal region for such changes and Adam’s forward bending test (Figure 1.2). Deviation off to

5
one side during the test or unilateral raised prominences (due to rotation of the vertebral
bodies and associated ribs and/or paravertebral musculature) are indicative of a possible
underlying deformity [4].
Figure 1.2 Adam’s forward bending test
(from: [5])
Definitive diagnosis is provided through imaging studies with full length standing lateral and
postero-anterior radiological studies typically used [6]. Despite being three-dimensional, the
magnitude of the deformity is usually described by the size of the curvature in the frontal
plane. A series of measurements are taken from x-ray images, either manually or via computer
software, and a formula used to calculate the Cobb angle (Figure 1.3) [7]. To be classified as
scoliosis, the Cobb angle must be > 10 degrees [8]. Anything less than 10 degrees is considered
to be within the limits of normal variation and/or within the margin of error for calculating the
Cobb angle.
Other measurement tools have been designed in an attempt to categorise the degree of
deformity in all three planes and are used to varying extents. These include surface topography
measures (e.g. Quantec, ISIS) which attempt to capture the changes in torso shape (Figure 1.4).
Topography measures provide a contour-like map of the back surface highlighting the cosmetic
changes which often are of greater concern to the patient than the size of the Cobb angle itself
[9]. However, in clinical terms, the Cobb angle remains the most widely used measure.

6
Figure 1.3 Calculating Cobb angle
Figure 1.4 Surface topography using ISIS-2
(from [10])

7
A number of classification systems have been devised but at its simplest, scoliosis is
categorised by the number of curves (single, double or, more rarely, triple), their location
(thoracic, thoracolumbar or lumbar) and the Cobb angle (Figure 1.5). The severity is generally
described as mild (Cobb angle ≤ 25 degrees), moderate (25 to 45 degrees) or severe (> 45
degrees) [11].
The degree of balance (i.e. the extent to which upper spine/neck is in line with the sacrum) in
both frontal and sagittal planes is another factor commonly used in classification (Figure 1.6).
Coronal balance measures are obtained by drawing vertical plumb lines down from the spinous
process of C7 and upwards from the centre of S1 on x-rays. The distance between these two
lines indicates the magnitude of coronal imbalance with 0 mm signifying they are perfectly in
line and therefore ‘in balance’. Sagittal balance is obtained by a similar process using plumb
lines drawn down from the centre of T1 and upwards from the posterior-superior aspect of the
S1 vertebral body.
Figure 1.5 Type of curves
(from [12])
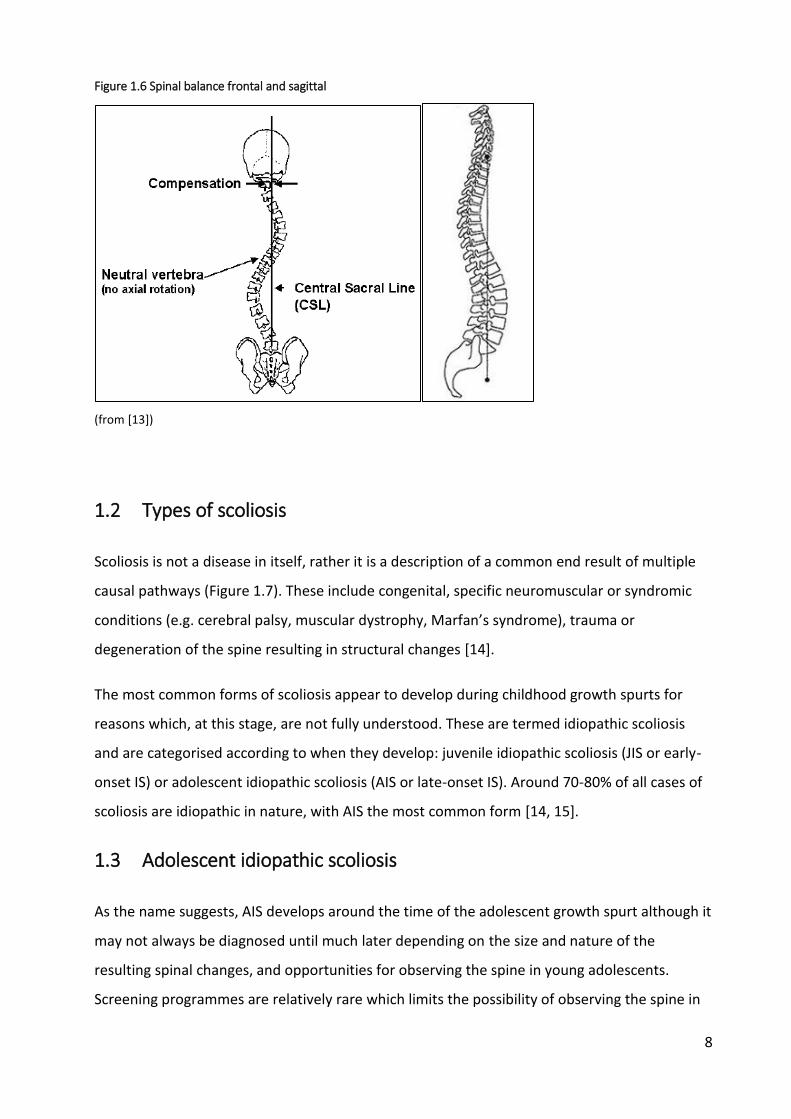
8
Figure 1.6 Spinal balance frontal and sagittal
(from [13])
1.2 Types of scoliosis
Scoliosis is not a disease in itself, rather it is a description of a common end result of multiple
causal pathways (Figure 1.7). These include congenital, specific neuromuscular or syndromic
conditions (e.g. cerebral palsy, muscular dystrophy, Marfan’s syndrome), trauma or
degeneration of the spine resulting in structural changes [14].
The most common forms of scoliosis appear to develop during childhood growth spurts for
reasons which, at this stage, are not fully understood. These are termed idiopathic scoliosis
and are categorised according to when they develop: juvenile idiopathic scoliosis (JIS or early-
onset IS) or adolescent idiopathic scoliosis (AIS or late-onset IS). Around 70-80% of all cases of
scoliosis are idiopathic in nature, with AIS the most common form [14, 15].
1.3 Adolescent idiopathic scoliosis
As the name suggests, AIS develops around the time of the adolescent growth spurt although it
may not always be diagnosed until much later depending on the size and nature of the
resulting spinal changes, and opportunities for observing the spine in young adolescents.
Screening programmes are relatively rare which limits the possibility of observing the spine in

9
this age group, especially amongst young females as they pass through a particularly sensitive
phase of physical and psychological development.
Figure 1.7 Types of scoliosis
1.3.1 Prevalence
Reported prevalence figures for AIS range from 0.5 to 4.3% (Table 1.1) although larger curves
are less common [16].
The disparity in estimates is likely to be a reflection of the different populations, age groups,
diagnostic criteria and data collection methods used. For children aged 10-16 years, prevalence
rates of 2-3% are often reported [31], implying that there are 100,000 - 150,000 people with
AIS in the UK [32]. Females suffer to a greater extent than males, with overall ratios of
between 2 to 4:1 reported in the literature. With larger curves (>30 degrees), the difference
becomes more extreme with ratios of between 7 to 10 females for every male [16, 31].
Scoliosis
idiopathic
congenital
syndromic trauma
degenerative
neuromuscular

10
Table 1.1 Reported prevalence rates for AIS
Authors Year country age group Prevalence* (%)
Stirling et al [17] 1996 England 6-14yrs 0.5
Wong et al [18] 2005 Singapore 6-14yrs 0.6
Ueno et al [19] 2011 Japan 11-14yrs 0.9
Span et al [20] 1976 Israel 10-16yrs 1.5
Soucacos et al [21] 1997 Greece 9-14yrs 1.7
Morais et al [22] 1985 Canada 8-15yrs 1.8
O'Brien & Van Akkerveeken [23] 1977 England 11-14yrs 2.0
Robitaille et al [24] 1984 Canada children 2.1
do Espirito Santo et al [25] 2011 Brazil children 2.2
Dickson et al [26] 1980 England 13-14yrs 2.5
Smyrnis et al [27] 1979 Greece 11-12yrs 2.7
Dickson [28] 1983 England children 2.8
Suh et al [29] 2011 Korea 10-14yrs 3.3
de Souza et al [30] 2013 Brazil 10-14yrs 4.3
* Cobb angle >10 degrees
1.3.2 Effects of AIS
The most common and potentially noticeable effect of AIS is the physical change to the shape
of the torso. This does not always directly correlate with the size of the curve as defined by the
Cobb angle. While the Cobb angle captures the degree of lateral curvature, often it is the
degree of axial rotation along with kyphotic/lordotic changes of the spine that lead to greater
visible effects [10]. These cosmetic changes are usually of greatest concern to the patient, and
can lead to emotional and psychological issues related to body image, self-esteem and overall
quality of life at a particularly vulnerable time [14].
Despite the general clinical consensus that pain is not a major feature, the literature is less
definitive with numerous reports suggesting that pain along with the cosmetic changes are the
principal features of AIS [33]. However, it is difficult to determine whether the pain that is
reported in AIS is a direct result of the condition itself or whether it merely reflects the normal
prevalence figures for back pain in the wider adolescent population [6, 8].

11
Alterations in normal function and cardiovascular (CV) capacity are not normally associated
with AIS [6]. It is only when the degree of spinal deformity reaches extreme levels, often
associated with other forms of scoliosis but rarely seen in AIS, that function and CV capacity
may be compromised. Accordingly, patients are typically advised to continue with normal
activities and not to limit physical activity [15, 34].
The last major effect of AIS is the potential for the curve to progress in adulthood. This is a
major consideration with regard to possible treatment options. Once skeletal maturity has
been reached, the potential for the deformity to further increase is limited but still possible
and may require ongoing treatment. This depends on the magnitude and nature of the
scoliotic changes once the growth phase has ended. Curves with Cobb angles greater than 30
degrees are particularly susceptible to further progress in adulthood [11].
1.3.3 Management of AIS
Current treatment options for AIS are very limited and, in severe cases, extremely invasive in
nature. The primary aim is to prevent curve progression past a point where further
complications may ensue, including further progression in adulthood.
Treatment generally consists of:
monitoring (‘watchful waiting’)
bracing and/or exercise
surgery
The regular monitoring of patients, even those who do not undergo more intensive measures,
involves frequent x-rays. Six or 12 monthly check-ups are a common scenario with subsequent
exposure to large doses of radiation at a particularly vulnerable growth stage [10]. Although
steps have been taken to limit the amount of radiation exposure as much as possible, including
the use of other forms of imaging, x-rays remain a fundamental component of monitoring
condition progression and decision-making.
Part of the reason for frequent monitoring is the difficulty in determining which cases will go
on to develop deformities that require more intensive intervention. Predictive factors include
the size of Cobb angle and maturity (usually determined by age, Risser sign and, in females,
menarchal status) at initial presentation, along with sex and curve type. Greater Cobb angle,
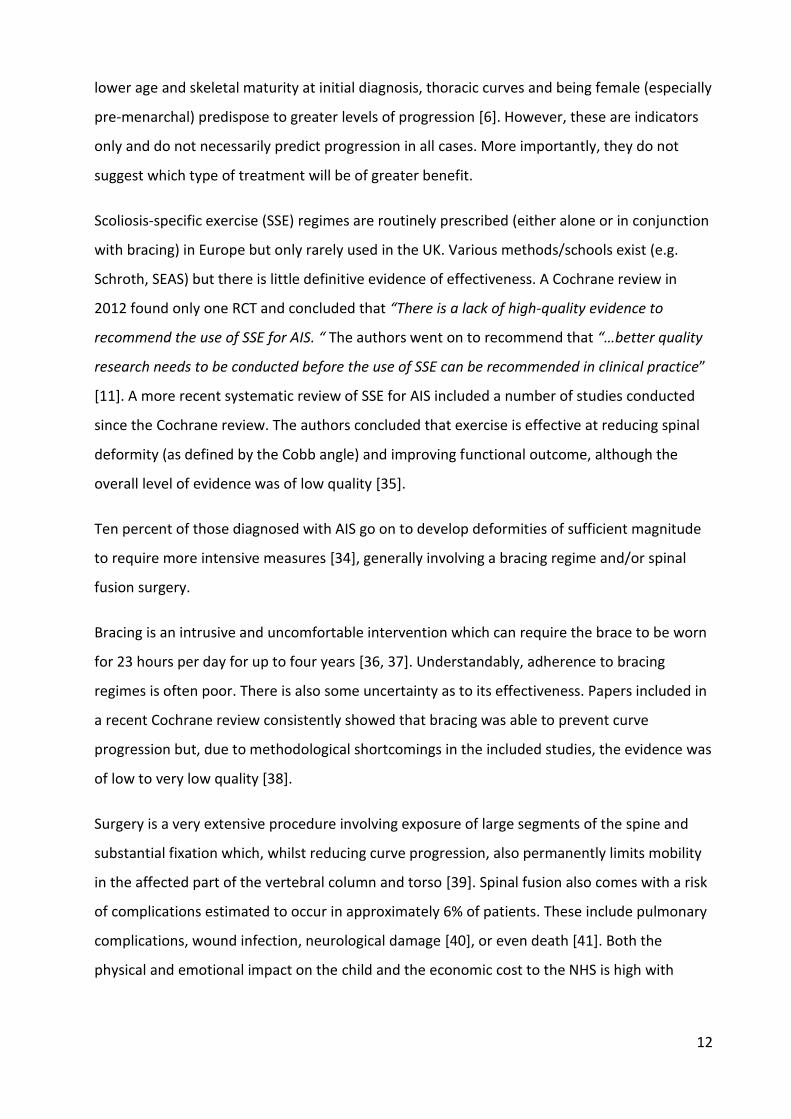
12
lower age and skeletal maturity at initial diagnosis, thoracic curves and being female (especially
pre-menarchal) predispose to greater levels of progression [6]. However, these are indicators
only and do not necessarily predict progression in all cases. More importantly, they do not
suggest which type of treatment will be of greater benefit.
Scoliosis-specific exercise (SSE) regimes are routinely prescribed (either alone or in conjunction
with bracing) in Europe but only rarely used in the UK. Various methods/schools exist (e.g.
Schroth, SEAS) but there is little definitive evidence of effectiveness. A Cochrane review in
2012 found only one RCT and concluded that “There is a lack of high-quality evidence to
recommend the use of SSE for AIS. “ The authors went on to recommend that “…better quality
research needs to be conducted before the use of SSE can be recommended in clinical practice”
[11]. A more recent systematic review of SSE for AIS included a number of studies conducted
since the Cochrane review. The authors concluded that exercise is effective at reducing spinal
deformity (as defined by the Cobb angle) and improving functional outcome, although the
overall level of evidence was of low quality [35].
Ten percent of those diagnosed with AIS go on to develop deformities of sufficient magnitude
to require more intensive measures [34], generally involving a bracing regime and/or spinal
fusion surgery.
Bracing is an intrusive and uncomfortable intervention which can require the brace to be worn
for 23 hours per day for up to four years [36, 37]. Understandably, adherence to bracing
regimes is often poor. There is also some uncertainty as to its effectiveness. Papers included in
a recent Cochrane review consistently showed that bracing was able to prevent curve
progression but, due to methodological shortcomings in the included studies, the evidence was
of low to very low quality [38].
Surgery is a very extensive procedure involving exposure of large segments of the spine and
substantial fixation which, whilst reducing curve progression, also permanently limits mobility
in the affected part of the vertebral column and torso [39]. Spinal fusion also comes with a risk
of complications estimated to occur in approximately 6% of patients. These include pulmonary
complications, wound infection, neurological damage [40], or even death [41]. Both the
physical and emotional impact on the child and the economic cost to the NHS is high with

13
surgical costs alone reaching up to £20,000, plus a post-op inpatient stay of 5-7 days and
subsequent follow-up [42].
1.3.4 Causes of AIS
As implied by the name, the cause of AIS is unknown although it is likely that it is multi-factorial
[43]. It is defined by the age of onset and the absence of any identifiable cause rather than the
presence of any particular factor. It has also been suggested that there may be two different
sets of mechanisms at work: those that are involved in the initial development of the curve,
and those related to subsequent progression [44-46].
The majority of factors that have been implicated in AIS can be grouped under the following
headings:
1) genetic
2) musculoskeletal
3) metabolic
4) hormonal
5) neurological
These have been explored to a greater or lesser extent in the literature although no definitive
cause has as yet been identified. Many of the differences found in AIS during investigation of
these factors appear to be secondary rather than causal.
1.3.4.1 Genetic
Although there appears to be some genetic component, with increased incidence amongst
relatives (particularly twins), the specific nature of the link has yet to be established. More
progress has been made in deleting potential suspect genes than in identifying specific
pathways of inheritance [47]. The general conclusions of most reviews on this subject agree
that AIS “… may be most consistent with a multifactorial inheritance model involving several to
many genes, interplaying with unknown environmental factors…..while families with dominant
inheritance may exist, [A]IS is generally a ‘complex’ genetic disease that is not easily explained
by existing inheritance models” [48].

14
1.3.4.2 Other factors
Despite the enormous amount of investigation into other factors involved in the pathogenesis
of AIS, few concrete conclusions have been reached. The wide-ranging hunt for possible causes
has led one reviewer to comment that “In attempting to develop a logistical model for
causality on the basis of information in the literature, one is impressed by the volume of data
that do not appear to be interrelated” [49].
In an attempt to clarify existing research, Schlosser et al [50] conducted a systematic review of
studies comparing untreated AIS patients with healthy adolescents on abnormalities other
than genetics and the deformity of the spine itself. Of the initial 88 eligible studies, only 21
were included in their final synthesis. Of the other 67 studies, 47 involved a high risk-of-bias
and 20 did not report quantitative data in enough detail. The included studies examined 14
factors thought to be involved in the pathogenesis of AIS, categorised under the broad
headings of neuromuscular, metabolic and anthropometric factors (Figure 1.8).
Figure 1.8 Abnormalities included in Schlosser et al review

15
The authors stated that as a result of their best-evidence analysis, they “were unable to find
both strong evidence and a consistent pattern of occurrence for AIS and any of these
abnormalities….. The relevance [of the available literature] for understanding the multifactorial
[a]etiology of AIS is very limited” as “systematic analysis of the best available data showed that
several abnormalities that were initially described as associated with AIS in the literature, were
classified as not associated with AIS, or as ‘insufficient evidence’ after the critical evaluation.”
They also reported that “For most of the reported anomalies it remains unclear whether they
occur during the development of scoliosis simultaneously with the spinal curvature and to what
extent they also occur in scoliosis with a known cause, such as congenital and neuromuscular
scoliosis. For multiple abnormalities….significant correlations with Cobb’s angle or other
severity measures has been documented, suggesting that they occur as a result rather than the
cause of the deformity.”
Subsequent studies examining some of the areas highlighted by Schlosser et al (e.g. vestibular
morphometry) again suggested differences between AIS and non-AIS populations [51].
However, they have done little to refute the overall conclusions and, to date, no definitive
cause(s) of AIS has been identified.
One possible factor that has been mentioned in the literature as potentially being involved in
the aetiology of AIS but has not as yet undergone any serious study, is that of altered body
schema. This topic will form the basis of the next chapter.

16
2 What is body schema?
The previous chapter described AIS and the uncertainties regarding the mechanisms and
aetiology of the condition.
This chapter will define what is meant by the term body representation, in particular the
representation commonly referred to as body schema, which has been suggested as a
potential factor in the development of AIS. It will describe its role and how it relates to other
representations of the body such as body image.
It will then look at disruptions to the body schema that have been reported as a result of
injury, experimentally-induced illusions and chronic pain conditions. The changes seen in these
examples indicate that it is possible to induce alterations in body schema.
The chapter will conclude by discussing changes in body schema during adolescence and how
this may be implicated in the development of AIS.
2.1 Body representations - ‘bodies-in-the-brain’
In order to function and perform physical actions in the external environment, as well as have
some sense of self-embodiment or self-awareness as a physical being, it is necessary for the
brain to have knowledge of all the constituent parts that go to make up the body, their form,
location and how they interact and move in relation to each other, and their position both in
relation to every other part of the body as well as to the external space/environment in which
they operate. This knowledge is provided by afferent information from every kind of sensory
receptor, as well as copies of the efferent information directed to the muscles that cause us to
move. Thus, the continual bombardment of sensory input allied with the cycle of movement
and response provides a constant flow of information about the state of our body which is
continually updated to reflect the actions and reactions that occur.
All this information is combined and integrated within multiple diverse parts of the brain
allowing the construction of various types of body representations or body ‘maps’
corresponding to different functional and cognitive requirements. At its most basic level, these
maps provide a blueprint for the distribution of sensory receptors in the periphery. For
example, by stimulating distinct regions of the primary somatosensory cortex (S1) in conscious

17
patients and registering which body part they could ‘feel’ being touched, Penfield was able to
construct a sensory map linking each section of S1 to its corresponding body area, giving rise to
‘homuncular man’ (Figure 2.1) [1]. Similar motor maps were produced from the primary motor
cortex. Evidence of other maps or ‘bodies-in-the-brain’, displaying their own stereotypical
distortions, comes from a variety of investigations of sensory perception [2].
Figure 2.1 Penfield’s sensory Homunculus illustrating how body parts are represented in the primary somatosensory cortex.
(from [3])
Results from neurological and psychological studies suggest that primary information from
these low-level body maps is integrated and processed further in other areas of the brain
creating higher-order internal representations of the body. They “differ from primary maps in
providing a supramodal, coherent scheme for body representation and skilled action” [4] and
play a vital role in activities as diverse as movement planning, determining location of sensory
input and judgements related to body size and shape [5]. The fact that we view our bodies in a
more conventionally proportioned manner than that of the ‘deformed’ primary maps is one
indication that these higher level representations are at work [2].
Investigators have proposed a number of distinct higher-order body representations, each
responsible for a different aspect of how the body is represented in the brain. These include

18
how we perceive our body with regard to physical location and posture as well as the
emotions, beliefs and attitudes towards our body in particular and the knowledge we have
about bodies in general [6].
2.1.1 Models of body representation
The most commonly described body representations are the body schema, body image and the
body model (or structural description of the body) and together they constitute what is
generally considered the standard model. However, attempts to define them, in particular
what they constitute, their respective boundaries and how they inter-relate with each other
and other aspects of the brain and behaviour, has been the subject of much debate.
To make matters worse, a range of authors have used distinct terminology to describe broadly
similar ideas. Even when common terminology has been utilised, the concepts they describe
can be significantly different, while at other times terms have been used interchangeably
(particularly, body schema and body image) [7]. Some authors have further subdivided these
categories into smaller and smaller classes of representations or postulated alternative
separations based on different criteria (e.g., functional role, temporal characteristics, sensory
weighting) [8].
Part of the problem is that reductionist approaches, based on detecting ever new forms of
body representation, could theoretically lead to an almost infinite number of ‘separate’
representations as the brain can be damaged (or in the case of intact brains, ‘fooled’) in a
myriad of ways with a virtually unlimited number of possible resulting deficits [9]. This has
prompted calls for some form of rationalisation. As a result, two alternative methods of
conceptualising the manner in which the body is represented in the brain have been proposed.
One view of the standard model argues for a division based on implicit (non-conscious, action
oriented) versus explicit (conscious, cognitive) body representations. However, rather than a
dichotomous relationship, implicit and explicit representations should be considered as
different ends of a single continuum. At the implicit end of the continuum lie the lower-order
body maps (e.g., those in the primary somatosensory cortex) and the body model, while at the
other end is the conscious experience of the body “…as a coherent volumetric object in the
world”, i.e., the ‘explicit’ body image (Figure 2.2). Higher order body representations along the
continuum will be characterized by different weightings of afferent information (e.g., visual,
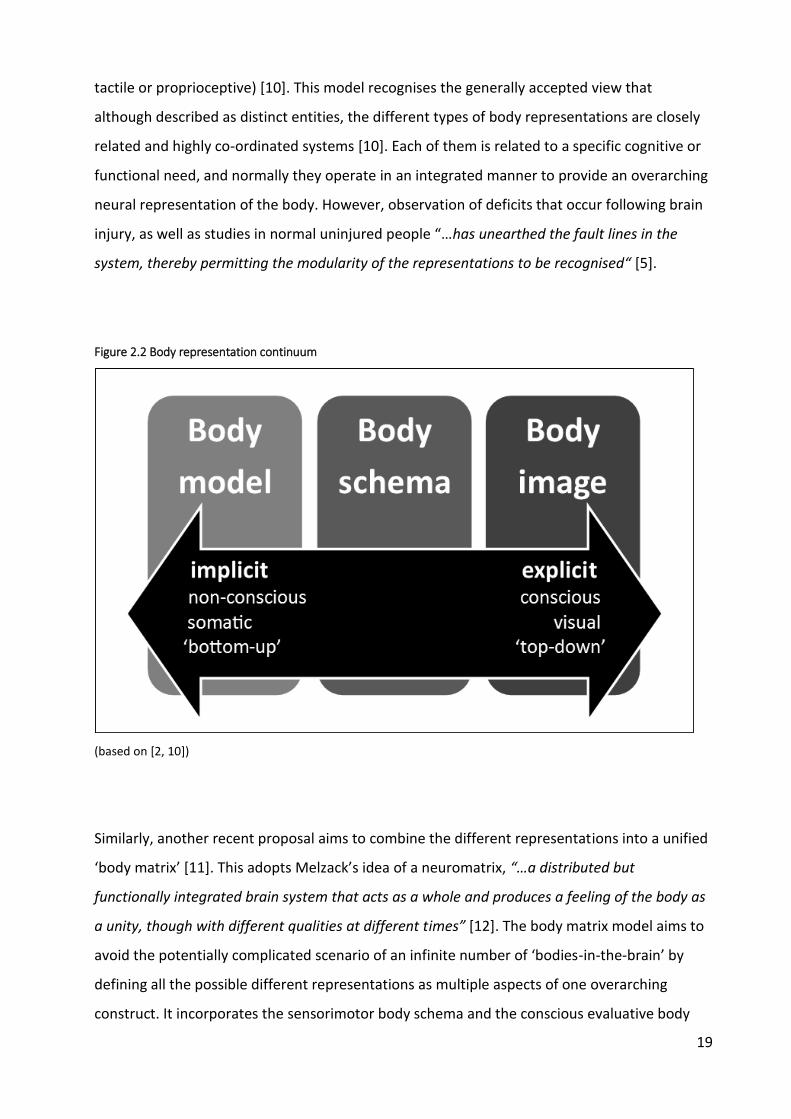
19
tactile or proprioceptive) [10]. This model recognises the generally accepted view that
although described as distinct entities, the different types of body representations are closely
related and highly co-ordinated systems [10]. Each of them is related to a specific cognitive or
functional need, and normally they operate in an integrated manner to provide an overarching
neural representation of the body. However, observation of deficits that occur following brain
injury, as well as studies in normal uninjured people “…has unearthed the fault lines in the
system, thereby permitting the modularity of the representations to be recognised“ [5].
Figure 2.2 Body representation continuum
(based on [2, 10])
Similarly, another recent proposal aims to combine the different representations into a unified
‘body matrix’ [11]. This adopts Melzack’s idea of a neuromatrix, “…a distributed but
functionally integrated brain system that acts as a whole and produces a feeling of the body as
a unity, though with different qualities at different times” [12]. The body matrix model aims to
avoid the potentially complicated scenario of an infinite number of ‘bodies-in-the-brain’ by
defining all the possible different representations as multiple aspects of one overarching
construct. It incorporates the sensorimotor body schema and the conscious evaluative body

20
image as parts of an overall network that extends to include homeostatic function (e.g.
thermoregulation) and the space immediately around the body, and which serves to maintain
the integrity of the body both physically and psychologically. The body is therefore defined by
multiple cortical representations, all of which combine to form the body matrix [11].
A full evaluation of all the issues surrounding the classification of body representations is
beyond the scope of this discussion. However, the concepts of body schema and body image in
particular are still widely accepted, appear to have a neurophysiological basis and serve as
useful ways of thinking about at least some of the ways the body is represented within the
brain which are of particular relevance to this thesis. Therefore, it would be beneficial to
describe some of the history of the development of our knowledge of these neural
representations of the body and to provide some working definitions of the concepts that will
be investigated further in this and subsequent chapters. In particular, the concept of body
schema, body image and the body model will be discussed.
2.1.2 Body schema
In the 1890’s, the physiologist Hermann Munk was one of the earliest to consider how the
brain was capable of establishing the body’s posture and position in space. He pictured a series
of movement ‘images’ stored in memory, based on afferent input produced by active
movement and from other sensory inputs such as touch. This concept was adopted by the
neurologist Carl Wernicke who used the name ‘body consciousness’ to refer to an awareness
of spatial orientation of the body and the location of sensory input [13].
The term ‘schema’ is thought to have first been introduced by Pierre Bonnier in the early 20th
Century and was further popularised by the influential work of Arnold Pick, Henry Head and
Gordon Holmes [13]. They suggested that a number of schema (or schemata) existed to
account for different representations of the body. For example, Head and Holmes defined a
‘postural schema’ as the internal model “against which all subsequent changes of posture are
measured before they enter consciousness……By means of perpetual alterations in position we
are always building up a postural model of ourselves which constantly changes.” [14].
A further schema was concerned with the localisation of tactile input to the skin. The
description of this resulted from observations of neurological patients who could not localise
the site of tactile stimulation despite recognising that they had been touched, indicating that a

21
deficit had occurred in a higher-order representation. They suggested that the affected part
related to an internal body map or schema specific to localisation of sensory stimulation of the
skin which they termed the ‘superficial schema’ [14]. An important aspect to note in Head and
Holmes’ description of these body ‘schemata’ are their unconscious nature, i.e. they operate at
a level below that of conscious awareness.
Current descriptions of body schema owe much to the earlier work of Head and Holmes and
focus on its essential role in movement. It is commonly defined as a system of sensory‐motor
processes that constantly regulates posture and movement and operates without awareness
or the necessity of conscious monitoring [7]. This body schema integrates proprioceptive,
motor and homeostatic functions with perceptual and sensory functions to provide the brain
with an on-line dynamic representation (or map) of body configuration [15] and a frame of
reference allowing the execution and constant monitoring of movement and postural control
[16].
This allows the brain to know where each part of the body is at any one time, both in relation
to other parts of the body and the external environment. This is an essential first step in motor
planning as, in order to move, it is essential to know the starting point from which movement
will occur. Secondly, it allows the performance of movement without the need for conscious
attention to each step of the movement itself, allowing the brain to concentrate on other more
important tasks. For example, in order to pick up an object, the brain is able to focus its
conscious awareness on the object itself rather than the series of movements, postures and
actions that occur unconsciously throughout the body to place the hand in the required
position to grasp the object. Without a body schema, maintenance of posture and the
performance of movement would require conscious step-by-step planning for even the most
basic of movements [17].
Other fundamental properties ascribed to body schema include coherence and adaptability.
The former ensures a coherent picture or map of the body even in situations of sensory conflict
or discrepancies. This struggle to maintain coherence can lead to bodily illusions under certain
experimental conditions. The body schema is also able to adapt to account for changes in body
shape and size (e.g. growth during childhood) or even tool use [4]. Tools utilised in the
performance of tasks can be incorporated into the body schema along with peripersonal space
(i.e., the space immediately outside of the body within which actions can be performed). The

22
limits of this space are determined by the task, body part involved and the type of tool utilised
[18].
2.1.3 Body image
As conscious beings, humans have the ability to think about their own body and be consciously
aware of its presence. These thoughts can be influenced by other cognitive processes (e.g.
emotions) such that our perception can be ‘coloured’ to a greater or lesser extent. This ability
has been broadly encapsulated by a higher-order body representation commonly described as
the body ‘image’ [19]. As opposed to the largely non-conscious online map of the body’s
physical location and orientation provided by the body schema, body image is concerned more
with the conscious perception or image we have of what our body is like. This includes
attitudes, beliefs, emotions [7] and an understanding of bodies in general (e.g. scientific
knowledge) [20] which ultimately results in how the body is viewed as a physical and biological
entity in itself [21]. External factors such as societal and cultural norms can also influence this
perception [19].
Some authors have further subdivided body image into distinct components (e.g. body
percept, body concept, body affect) to account for the various aspects described above [5, 7]
but for the sake of simplicity, within this thesis they have been all grouped under the concept
of body image. Other authors have also included knowledge of the names of each body part
and their functions (i.e. how they are used or ‘work’) as part of the overall concept of body
image [16].
One of the key features of body image is the issue of consciousness. In general, body schema is
thought to operate below the level of consciousness whereas body image is thought to be a
conscious construct (implicit versus explicit in accordance with Longo’s model). This has led to
the description of body image as a more abstract representation, heavily influenced as it is by
other cognitive processes, as opposed to the more ‘concrete’ map of physical locations
provided by the body schema [20].
The weighting of sensory input is also thought to be different. Non-visual input (e.g.,
proprioception, kinaesthetic, somatosensory, vestibular) is likely to be of greater importance
for the body schema as it provides direct information on position and dynamics of the body. In
contrast, visual input is often suggested as a key driver of body image [7, 13, 22].

23
2.1.4 Body model / structural description
Alongside the classic dualistic model of body representation described by the body schema and
body image, some authors have proposed a third category referred to as the body structural
description [5] or body model [2]. This contains information regarding the physical structure of
the body and how it is organised anatomically, including information regarding metric
properties (e.g., length and shape). The rationale behind this concept is that afferent
information from muscle, joint and other peripheral structures provide information regarding
joint angles (i.e., the position of one body part relative to another) which is insufficient to
locate each part in external space. Information regarding the length of body segments is also
required. As there are no receptors that provide such data, investigators have suggested a
separate system that stores these details about the body [2]. The body model is also thought
to contain information regarding the available range and degrees of freedom of movement for
each joint, i.e. how far and in what directions it is possible to move each joint.
In summary, the terminology associated with body representations is still open to debate and
definitive models have yet to be established. However, the concept of a representation that
encompasses what has commonly been called the ‘body schema’ serves as a convenient way of
defining and testing the underlying properties that this thesis is seeking to investigate.
Therefore, the term body schema, and the definition provided above, will be used throughout
as short-hand for the type of body representation this thesis has set out to investigate with
relation to its possible association with the development of AIS.
2.2 Disruption of body schema
Evidence to suggest that body representations such as body schema can be disrupted is
provided through various distinct methodologies. Examples include abnormalities that may
occur after neurological damage (e.g., deafferentation, phantom limbs), experimentally-
induced illusions such as the rubber hand and nose lengthening illusions, and chronic pain
conditions.
2.2.1 Deafferentation
Although rare, cases where people have lost virtually all sensation provide an extreme example
of disruption to information that is vital to construction and updating of the body schema as

24
well as an excellent insight into the importance of the body schema in normal functioning and
movement.
In probably the most famous case of deafferentation, a person suffered a large diameter
sensory neuropathy following a viral illness resulting in complete loss of proprioceptive,
kinaesthetic and tactile sensation from the neck down [17]. Motor commands and sensory
information conveyed by small-diameter fibres (e.g., nociception, temperature, muscle fatigue)
remained unaffected, along with visual and vestibular input. This left the patient in a
‘disembodied’ state in that their body effectively ‘disappeared’ if they closed their eyes or
turned off the light at night (causing them to collapse or fall). Without visual input, they could
not determine location of their body parts in space or in relation to other parts of their body,
nor could they sense tactile stimulation. The lack of necessary background information
provided by proprioceptive, kinaesthetic and tactile sensory input effectively extinguished the
normal body schema, resulting in almost complete reliance on the visual, and to a lesser
extent, the vestibular systems to provide information regarding where the different parts of
the body were in relation to each other and the external environment.
This had profound implications for motor planning as in order to move, they must be able to
see the relevant parts of the body at all times requiring continuous visual and mental
concentration. As well as the desired movement, they must also take into account, and
consciously control, the compensatory actions required in order to make the movement
possible (e.g. shifting body weight and altering posture to compensate for moving the arm).
Maintaining any posture, apart from lying down, is a task rather than an automatic process
[17].
Initially, the patient had no control over their movement. Over time, and in contrast to other
people who had suffered similar injuries, they regained a high degree of function although
movements were slow and not smoothly performed [17]. In this case, each individual element
of an action has to be planned and actively attended to (including compensatory actions to
maintain stability) as part of an overall movement sequence, in contrast to the automatic, non-
conscious nature of most normal movement. The lack of automatic processes previously dealt
with by the body schema resulted in movement being limited in a number of ways:

25
1) the limited number of items to which attention can be paid at any one time
mean that not all aspects of movement can be attended to. Any distractions
limit this still further or render movement impossible.
2) the need for conscious planning and monitoring of movement slows the process
down resulting in an inability to perform rapid movements and tasks that
require rapidly alternating and repetitive movement (e.g. brushing teeth).
3) the mental effort required to perform even the most basic movements limits
the duration of motor activity.
4) activities that require more than one task to be performed simultaneously
(carrying an egg while walking) or that involve complications imposed by the
external environment (walking over rough ground) are intensely difficult and
require more concentration and energy to perform [17].
In this unique case, the patient has been able to reconstruct a limited form of the body
schema, one which relies almost exclusively on visual perception to replace the lack of
proprioceptive and other sensory input. However in most cases of deafferentation, people are
unable to rebuild the body schema to any extent, preventing the performance of functional
movement and normal activities (e.g. walking) almost entirely. These examples vividly illustrate
the vital role body schema plays in normal function whilst demonstrating the maximal
disruption possible, i.e., a ‘missing’ or disabled body schema.
2.2.2 Phantom limbs
The phenomena of phantom limbs provides another example of dysfunctional body schema
following neurological damage. They may occur following limb amputation, deafferentation or
spinal cord injury (SCI) [20]. In such cases, the body schema fails to adapt to changes in the
structure of the physical body. Phantoms can also occur in aplasia, the congenital absence of
limbs, suggesting that the body schema is to some extent innate [23]. However, the fact that
they are more common when amputation occurs in adults as opposed to children, suggests
that the body schema may become more entrenched with time.
Phantom limbs are generally perceived to occupy space and to adopt postures characteristic of
the ‘lost’ limb (e.g. in SCI, the lower limbs are often perceived as extended at the knees and
slightly flexed at the hips) although they may also occupy unrealistic or even anatomically

26
impossible postures [20]. Often, the position of the phantom reflects the last seen position of
the actual limb prior to injury. People with phantom limbs may also modify their interaction
with the environment to accommodate the presence of the phantom (e.g., making extra space
when moving around, walking through doorways side-on) or may perceive their phantom limb
as shrinking or disappearing if it ‘contacts’ external objects [20]. At times, they even attempt to
use the missing body part (e.g., a lower limb amputee attempting to walk with the phantom
leg), illustrating the extent to which the body schema remains unchanged [7].
Another class of phantom limbs can occur in cases of central nervous system damage.
Sometimes extra or supernumerary limbs are perceived although duplication is generally of a
physical limb that has been deafferented or paralysed. It is suggested that the presence of
supernumerary limbs indicates the brain’s attempt to reconcile differences between copies of
efferent movement input and proprioception. The mismatch between intended and actual
location of the limb causes the brain to conjure up an extra limb in order to account for the
two perceived locations, thereby maintaining a coherent representation of the body [20].
The example of deafferentation and phantom limbs described above are illustrations as to how
the body schema is able to be disrupted following injury and that this disruption can take
various forms, and have different consequences, depending on the nature of the injury itself.
2.2.3 Bodily illusions
As well as changes described above following neurological damage, temporary disruptions in
the body schema can be induced in normal healthy people under certain experimental
conditions. By generating a mismatch between different sensory streams, a change in the body
schema is produced creating a bodily illusion, such as the Rubber Hand or the Pinocchio
illusion. These demonstrate the plasticity of the body schema.
2.2.3.1 Rubber hand illusion
In the rubber hand illusion, volunteers sit at a table with a sheet or similar placed so that one
forearm or hand remains visible and the other is hidden. A rubber limb is placed in position to
mimic the hidden hand. Simultaneous stroking of the rubber and hidden hand induces the
perception that the rubber hand is in fact their real hand (Figure 2.3). In this case, the
combination of visual and tactile sensation overcomes proprioceptive information and causes
the artificial limb to be incorporated into the body schema. Evidence that the fake hand is

27
incorporated is provided by the increase in stress response recorded when a threat to the fake
hand is perceived (e.g., hitting the fake hand with a hammer) [24].
The illusion is most effectively evoked when the fake hand is in an anatomically feasible
position, in close proximity (within 30 cm) and orientation to the actual hidden hand, and
when the same tactile stimulation is applied in a synchronised manner to both hands,
preferably with random and unpredictable timings. However, it is not necessary for the fake
hand to closely resemble the real hand [20]. It has also been suggested that the fake hand does
not even need to be visible - the act of seeing the fake hand being covered up is enough once
appropriate tactile stimulus is applied to both real and fake hands.
Blindfolded subjects can even induce the illusion themselves by stroking the rubber hand
whilst the real hand is synchronously stroked by someone else [20].
Figure 2.3 Rubber hand illusion

28
2.2.3.2 Pinocchio illusion
In the Pinocchio or nose-lengthening illusion, a blindfolded subject is positioned behind
another person. The subject taps the nose of the other person whilst their own nose is tapped
simultaneously by either the other or a third person (or in some versions, the subject
themselves) (Figure 2.4). Without the corrective effect of vision, the subject perceives that the
tip of the nose is further away than normal and thus, that the nose has increased in length
[20].
A modified version of this involves the subject holding their own nose while the biceps tendon
is subjected to mechanical vibration. Normally this would result in reflex flexion of the elbow
courtesy of the tonic vibration reflex. However, if the motion of the arm is physically
restrained, the majority of subjects perceive their nose, fingers or both as elongating. By
preventing reflex flexion of the arm, the brain perceives apparent extension – as the fingers
remain in contact with the nose, either the nose, fingers or both ‘must’ be lengthening.
Conversely, vibration of the triceps tendon results in the opposite effect with subjects
reporting their nose shortening (to the extent of being pushed inside their heads), their fingers
passing through their nose to be located inside their head, or their head being pushed
backwards (figure 2.5). The tendon vibration alters proprioceptive input regarding joint angles,
inducing the feeling of movement and resulting changes in the body schema and the perceived
shape and orientation of the body [25].
Figure 2.4 Pinocchio illusion
(from: a) [26]; b) [27])

29
Similar illusions using tendon vibration have been used to induce the sensation of shrinking or
expanding waist lines, altered neck or limb length, and altered posture or orientation of the
body itself [25]. These illusions again demonstrate how the brain attempts to maintain a
coherent body representation, often with bizarre consequences.
Overall, these illusions suggest that body schema is highly labile and, depending on the nature
of sensory input, the internal representation of the body can be disrupted temporarily even to
the point of accepting physically impossible postures or fake body parts.
2.2.4 Chronic pain conditions
Although a distinct class of conditions, chronic pain states such as phantom limb pain (PLP),
chronic regional pain syndrome (CRPS) and chronic low back pain provide a useful conceptual
model for body schema in AIS. There is increasing evidence that central nervous system (CNS)
changes play a major role in the pathogenesis and maintenance of chronic pain states and that
disruptions to body representations such as body schema have been associated with these
conditions.
As this thesis is concerned with AIS, which primarily involves changes to the trunk and spine,
this overview will focus on studies examining body schema in chronic spinal pain. It will discuss
the evidence for both cortical and perceptual changes that are thought to underlie disruptions
to cortical body representations in chronic low back pain, as well as treatment strategies aimed
at reversing the alterations and, ultimately, restoring body representations including body
schema.
2.2.4.1 Cortical changes
Numerous studies have reported cortical changes in chronic pain conditions such as CRPS and
PLP. Similarly, studies using a variety of brain imaging techniques have reported reorganisation
of the somatosensory and motor cortices in chronic low back pain (CLBP), with the cortical area
representing the lower back expanding to invade other nearby areas (e.g., the area
representing the leg). This induces a ‘blurring’ of the boundaries of the representation of the
lower back region within the cortex. The degree to which this occurs appears to be related to
the duration of symptoms [28]. Cortical maps of individual sub-regions of the lower back have
also been shown to lack definition, indicating that the ‘blurring’ described above is not
30
confined to the boundaries but may involve the entire lumbar cortical representation in
patients with CLBP [29]. This has implications regarding the ability to pinpoint the location and
properties of sensory input from these regions. Similarly, a shift in the cortical representation
of individual spinal muscle groups resulting in overlapping or ‘smudging’ has been reported in
LBP patients [30]. The magnitude of these changes appears to be associated with the severity
of LBP symptoms [31] and may compromise the ability to control discrete muscle groups
separately. Although it is unlikely that these changes are the cause of LBP, there is evidence to
suggest that they contribute to the development and maintenance of chronicity [28].
As well as these organisational changes, there have also been reports of neurochemical and
structural changes in the cortex associated with CLBP in comparison with non-LBP controls.
These include altered neurochemical profiles and reduced grey matter in various brain areas,
the magnitude of which have been reported to correlate positively with pain duration and/or
intensity [32, 33].
The changes in cortical organisation do not appear to be confined to nociceptive input. A
recent fMRI study of non-painful mechanical stimulation of the lumbar spine also revealed
maladaptive changes in higher-order processing of sensory information and cortical
representation of the lumbar spine in patients with CLBP when compared to controls. They
concluded that these changes may affect body perception with subsequent effects on the
functioning of the spine [29].
2.2.4.2 Perceptual changes
The cortical changes described above are manifested by changes in the way the spine is
perceived by people with CLBP. Tactile acuity (i.e. the precision with which we are able to
judge different properties of touch) has been a topic of particular attention. A systematic
review evaluated different aspects of tactile acuity in patients with chronic pain [34]. The
pooled results from four studies which measured two point discrimination thresholds (TPDTs)
suggested that they were larger in CLBP patients as compared to controls indicating worse
tactile acuity (mean difference 11.7mm, 5.5 to 17.8mm 95% CI; % difference 26%, 12 to 39%
95% CI; effect estimate 1.14, 0.54 to 1.74 95% CI, p=0.0002). These results were confirmed by a
more recent systematic review involving 19 studies [35].

31
This affect appears to be specific to the painful area. Three studies measured TPDTs on either
side of the spine in patients with unilateral CLBP. The pooled results suggest that the threshold
for detection of two point stimulus was larger on the affected versus the unaffected side
(mean difference = 1.4mm, 0.7 to 2.0mm 95% CI; % difference = 58%, 29 to 86% 95% CI; effect
estimate 1.85, 0.95 to 2.75 95% CI, p<0.00001). This finding is further supported by a study
which looked at forearm TPDTs and found no statistically significant differences between CLBP
patients and controls [34].
Investigations of other properties of tactile acuity have also reported deficits in CLBP patients,
for example in localisation of stimulus and temporal order judgement (judging which stimulus
was applied first when two asynchronous stimuli are applied to either side of the spine) [36].
Alterations in standing balance, laterality discrimination (judging direction of trunk movement
from a series of pictures of the trunk in various postures) [36], postural control [37],
proprioception and difficulty delineating the outline of associated body segments [32] are
among other perceptual changes that have been reported in this patient population. This latter
finding appears to relate to painful regions of the back which exhibit reduced tactile acuity
[36]. Some patients even report that they have difficulty locating or ‘feeling’ the presence of
their back [38].
Caution should be taken with interpreting these results as, in general, most studies had small
sample sizes and are likely to be underpowered. However, taken together, these alterations in
perception provide further evidence of changes in the way the body is represented in the brain
and highlight the various sensori-motor manifestations that occur as a result of these changes.
2.2.4.3 Treatment
Approaches to address altered body schema in CRPS and PLP, using programmes aimed at
activating cortical motor and pre-motor networks, have shown promise with resolution of
symptoms and normalisation of neurophysiological findings [38] including brain changes [37,
39, 40]. Interventions used include tactile discrimination and laterality recognition training as
means to achieve these changes. The basic premise common to all these programmes is the
attempt to `reformat' or rewire the brain's internal body maps. In comparison, very few studies
have investigated the use of similar approaches in CLBP.
32
One study investigated the use of a motor skill training programme which involved isolated
voluntary contractions of transversus abdominus (TrA) in patients with recurrent LBP [37]. This
was in response to previous work which suggested alterations both in the motor performance
and the cortical representation of TrA in the motor cortex in LBP patients [41]. After two
weeks, the motor skill training group (n=10) experienced a shift in the cortical representation
of TrA towards the location observed in healthy non-LBP participants. Importantly, these
changes were reflected by improved motor performance of TrA. Neither of these changes were
observed in the control (self-paced walking) group (n=10).
The lack of any statistically significant differences in pain scores between groups, nor any
change in symptom-related function scores pre-post intervention, calls into question the role
of TrA in recurrent LBP, although longer time-frames may be required to see any effect.
However, the study does reveal that programmes targeted at optimising motor behaviour (in
this case, a type of motor ‘discrimination’ training) can induce favourable reorganisation of the
motor cortex and reveal reversibility of earlier maladaptive changes.
Using an approach more akin to that used in previous CRPS and PLP trials, a single case
experimental design was conducted with three participants suffering from CLBP [42]. An initial
baseline monitoring period of up to 5 weeks was followed by at least 10 weeks of an
individualised, progressive sensori-motor training programme. Data was collected weekly
during the intervention period and for one month post-intervention. The intervention
consisted of localisation training (determine location and type of stimuli applied to lower back
region), graphesthesia training (identification of alphanumeric figures ‘traced’ on back),
laterality recognition (identifying side or direction of trunk movement from a series of images),
and motor training using a graded approach as described in Figure 2.5.
All three participants reported reduced pain intensity, pain interference and disability during
the intervention and this effect was maintained for at least one month once treatment had
finished.
Two other case studies [43], plus a cross-over trial (n=25) which used acupuncture as a form of
sensory discrimination training [44], also reported positive effects using strategies targeting
cortical reorganisation.
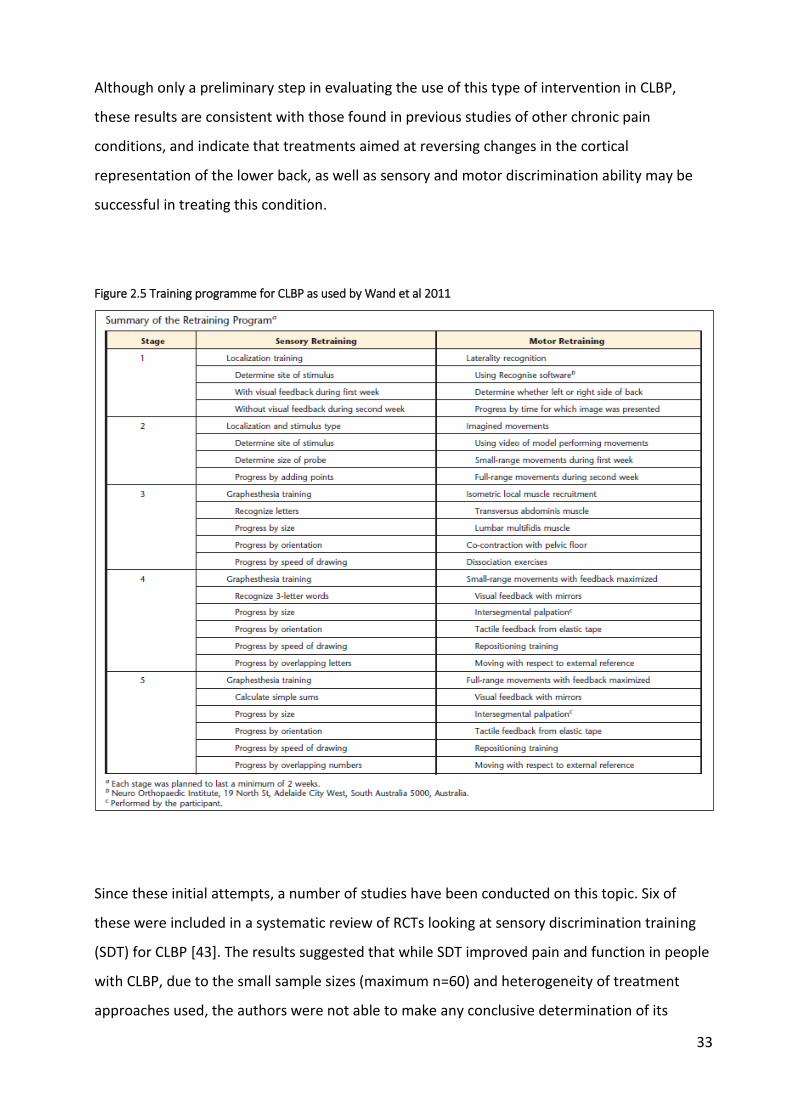
33
Although only a preliminary step in evaluating the use of this type of intervention in CLBP,
these results are consistent with those found in previous studies of other chronic pain
conditions, and indicate that treatments aimed at reversing changes in the cortical
representation of the lower back, as well as sensory and motor discrimination ability may be
successful in treating this condition.
Figure 2.5 Training programme for CLBP as used by Wand et al 2011
Since these initial attempts, a number of studies have been conducted on this topic. Six of
these were included in a systematic review of RCTs looking at sensory discrimination training
(SDT) for CLBP [43]. The results suggested that while SDT improved pain and function in people
with CLBP, due to the small sample sizes (maximum n=60) and heterogeneity of treatment
approaches used, the authors were not able to make any conclusive determination of its

34
effectiveness compared to other forms of treatment. It should be noted that 5 of the 6
included studies used very different treatment modalities to the case series reported above,
which followed similar methods to those in previous studies of CRPS and PLP. The single study
that used a comparable approach was a pilot study that relied largely on a home-based
intervention with ‘carers’ conducting the intervention. The small initial sample size and high
drop-out rate, particularly in the control (placebo) group, may have been key factors in the lack
of difference found between groups in this trial [45]. The lack of definitive evidence found by
the authors of this review echoes the findings of an earlier review that investigated all
treatment methods targeting cortical remapping in CLBP [46]. They also reported
methodological problems with the majority of studies included and commented on the paucity
of high-quality trials available for evaluation. In-line with the recommendations of both these
systematic reviews, it is hoped that further evidence as to the effectiveness of SDT and other
cortical remapping strategies in CLBP will be provided by larger, better-powered studies such
as that proposed by Walti et al [47] or the RESOLVE trial currently underway [48].
2.2.4.4 Implications for body representations
In summary, the discussion of the literature relating to CLBP and body representations
highlights that:
1) there is direct evidence from brain imaging studies that in the presence of CLBP, the sensori-
motor cortices associated with the spinal region undergo reorganisation.
2) this is supported by perceptual alterations that are associated with both the changes in the
cortical representations as well as pain intensity and chronicity of CLBP. The fact that these
perceptual changes cannot be explained by deficits in sensory detection or transmission, as
well as the range of sensory inputs affected, provide further evidence that they are
manifestations of cortical reorganisation involving the representations of the spine in the brain
[34].
3) The final key plank linking CLBP and brain disruption relates to treatment strategies aimed at
reversing the perceptual changes and cortical reorganisation. Taken overall, to date there is
little evidence for interventions that aim to achieve these goals. However, in the few
preliminary studies that have mimicked the interventions used in successful trials of other
more-studied, chronic pain conditions (e.g. CRPS, PLP), similarly favourable outcomes have

35
been achieved. Caution in extrapolating these findings needs to be taken until stronger
evidence is provided, but they do suggest that appropriate, specifically targeted therapies may
be successful in CLBP as they have been in these other chronic pain conditions.
Together, these findings suggest that CLBP involves alterations of lower-level body maps as
well as higher-order sensory processing with implications for body representations, particularly
the body schema, and the functioning of the lower back [29]. Impaired control of muscle
tension has been associated with chronic pain conditions [36] and, along with other motor
abnormalities observed in CLBP, suggest how an altered body schema may affect the spinal
musculature [30,31,32], an important consideration in the following discussion of how a
disrupted body schema may be implicated in AIS.
2.3 Body schema in adolescence
The ability of neonates to imitate facial expressions and gestures suggests that body schema is
innate due to the coordination of visual and tactile-kinaesthetic information required to
recognise and then reproduce a movement. As mentioned previously, further support for an
innate body schema is provided by the presence of phantom limbs in some children with a
congenital absence of limb and therefore, who have never experienced the actual limb as part
of their physical body [7, 22]. During the progression through childhood to adolescence and
early adulthood, the body schema gradually matures with greater experience and integration
as both the body and the brain undergo different stages of growth and reorganisation.
Adolescence is a critical period of growth in which rapid changes occur in body size, shape and
composition over a relatively short period of time. It is also a time when the brain undergoes a
major phase of maturation involving synaptic ‘pruning’ and myelination, and consequent
reorganisation of cortical networks [22]. It has been suggested that the rapid physical changes
of the body outpace the development of the corresponding body schema resulting in
systematic mislocation of body parts in space [21], evidenced by the ‘clumsiness’ and lack of
neuromuscular co-ordination characteristic of adolescence. Findings from studies investigating
body schema development suggest that it does not fully mature until early adulthood.
As previously described, the body schema, with both sensory and efferent motor input, plays
an important role in motor planning and acts as an interface between perception and action.

36
Using various methodologies (e.g., postural disturbance, motor imagery, illusory movement), it
is possible to establish its efficiency and effectiveness in performing this role across different
age groups. The results of these studies revealed notable differences between adolescents and
young adults on both a postural and perceptual level [22], suggesting that the body schema
undergoes a long maturation process throughout adolescence and into early adulthood.
Reports that development of the body schema tended to occur 1-2 years earlier in girls is
consistent with the earlier onset of puberty and physical maturation in females [49].
It is also interesting to note that in studies looking at dynamic proprioception and postural
control, it was principally the trunk area that was disturbed in adolescents in comparison to
adults, indicating a “…transient loss of reference point, which was probably linked to a
disturbance of body schema.” This is consistent with peak proprioceptive ability not being
achieved until early adulthood making it difficult for adolescents to control their movements
by proprioception alone (i.e., without visual input) [22].
The fact that the trunk was the region exhibiting the greatest lack of control may be significant
when considering the potential role of a dysfunctional body schema in adolescent idiopathic
scoliosis (AIS).
2.4 Body schema in AIS
An alteration or maladaptation of the body schema as part of a sequence of pathological
events has been proposed as a possible mechanism in the development of AIS.
Herman et al [50] originally proposed that idiopathic scoliosis was due to impaired neural
control of the axial (spinal) motor control system. They suggested that changes in vertebral
alignment may result from altered sensory information or “…by modified perceptual analysis of
sensory data describing erect vertebral alignment…the net effect of impaired integration would
engender disturbances in vertical orientation of the vertebral spine.” In other words, the sense
of upright posture, which is dependent on normal integration of visual, vestibular and
proprioceptive feedback, is altered such that the brain perceives non-erect vertical alignment
of the spine as ‘erect' or ‘straight' (and vice versa). This is consistent with anecdotal
observations that at the time of diagnosis, most patients are unaware that they have a scoliosis
despite there being a significant curve or structural deformity [51].

37
Subsequent motor adaptation of the axial motor system to this altered cortical representation
of the body generates an asymmetry in muscle forces applied to the spine [50, 52]. It is not
clear whether this is sufficient on its own to cause the structural deformation characteristic of
scoliosis, or if it merely triggers a process where growth and biomechanical factors contribute
to its progression [53, 54], in which case individual susceptibility may vary depending on other
factors [55] (Figure 2.6).
Figure 2.6 Proposed process of scoliosis initiation
It is thought that adolescence is a particularly vulnerable period for such maladaptation due to
the rapidly growing and changing musculoskeletal system and large reorganisation of the
brain, allied with the late maturation of the body schema as previously described [56]. A delay
in the maturation of the body schema, or an inability to keep up-to-date with the pace of
change, is suggested to be a precursor to the development of the spinal deformity. From this
perspective, the higher incidence of AIS in females may be explained by the earlier and more
rapid growth spurt they undergo during adolescence as compared to males [53, 55].

38
Reported abnormalities of vestibular function [57], perception of vertical [58, 59],
proprioception [60-64], postural control (particularly dynamic balance under sensory
challenge) [50, 65-74] and other perceptual changes [75, 76] in AIS lend support to the
hypothesis of altered sensory input/processing.
Despite these investigations, to date there have been no attempts to directly investigate the
role of body schema in AIS. One study which did purport to examine this issue used a template
matching protocol where participants diagnosed with AIS were shown a series of line drawings
of scoliotic curves progressively increasing from 0 to 50 degrees in the thoracic, thoracolumbar
and lumbar regions of the spine [77]. Participants were asked to select the image that
corresponded to their perceived spinal alignment in each region and this was then compared
to the actual Cobb angle as calculated from x-rays. The authors reported that subjects tended
to overestimate the size of the curve in the thoracic and lumbar regions while underestimating
curve size in the thoracolumbar region. They therefore concluded that AIS is associated with an
altered corporeal awareness of trunk alignment. However, despite the stated aim of
investigating body schema, the assessment tool required participants to make a conscious
judgement of the alignment of their spine which is more likely to relate to a type of body
representation previously defined as body image rather than that of a non-conscious body
schema as used and investigated in this thesis.
2.5 Summary
In summary, the terminology associated with body representations is confusing and still ill-
defined. However, the concept of a representation that encompasses what has commonly
been called the ‘body schema’ serves as a reasonable way of defining and testing the
underlying properties that this thesis is seeking to investigate.
Therefore, for the purposes of this thesis, body schema can be defined as either one of a
number of higher-order representations of the body or one aspect of an overall body matrix. It
integrates sensory information from somatic, proprioceptive, vestibular, visual and efferent
sources, and is responsible specifically for maintaining a sense of where the body is in external
space, its orientation and posture as well as assisting motor planning.

39
Evidence from observational studies using various methodologies indicates that the body
schema is malleable and subject to disruption in cases of brain or peripheral nerve damage as
well as chronic pain, but also in normal people under certain conditions.
Development of the body schema through childhood and up to early adulthood involves a slow
process of maturation. Adolescence in particular appears to be a critical period with rapid
changes occurring both in the body and the brain and suggestions that the body schema is
unable to keep pace with the speed of these changes.
It has been proposed that this delay in maturation and inability to maintain a coherent body
schema at a time of rapid growth might be the trigger that initiates the musculoskeletal
changes characteristic of scoliosis via the spinal motor system.
To date, the only study that has sought to directly assess body schema in AIS is of poor quality
and does not appear to use appropriate testing methodology. However, there have been
reports from a variety of studies of perceptual deficits in AIS that are relevant to body schema.
In order to understand this area in greater detail and to determine if altered body schema
plays a roles in AIS, it is necessary to evaluate the literature around theses reported deficits.
This issue forms the basis of the next chapter which details a systematic review conducted to
elucidate neurophysiological changes associated with AIS and provides a rationale as to why
body schema is a potential factor in the development of AIS.

40
3 Perceptual deficits in AIS - a systematic review
Previous chapters have defined what is meant by the terms AIS and body schema. They have
also highlighted that although suggested as a possible factor in the development of AIS, no
studies have so far been conducted to investigate this possible link.
One method of assessing a potential link between body schema and AIS is to review the
literature regarding neurophysiological changes or deficits associated with AIS that are also
important in the construction of the body schema. If these are observed, then it will provide
further evidence as to the possibility of alterations in body schema playing a role in the
development of AIS.
Therefore, this chapter details a systematic review that was conducted to elucidate
neurophysiological changes associated with AIS and which may provide a rationale for the role
of body schema in AIS.
3.1 Materials and methods
This systematic review was conducted and is reported according to the PRISMA guidelines [1].
3.1.1 Data sources and searches
The following databases were searched from inception to 14 November 2018 for studies
examining neurophysiological measures in people with AIS compared to controls: Medline,
EMBASE, PsycINFO, CDAS, CINAHL, PEDro, and SPORTDiscus. All potentially relevant abstracts
were screened using the study inclusion criteria and full text articles were obtained for those
that appeared eligible. These were assessed by two independent reviewers for eligibility.
The actual search strategies for each database are described in Appendix 1. Hand searches of
references from screened full text articles were also conducted.
3.1.2 Study selection
This review targeted observational studies that used case-control and cross-sectional designs
to evaluate neurophysiological function in participants with AIS and non-scoliotic control
participants. Studies that examined neuro-anatomical or morphological changes, or

41
musculoskeletal changes attributable to the spinal deformity itself, were not included. The
study inclusion and exclusion criteria for this review are described in Table 3.1.
Table 3.1 Study eligibility criteria
Inclusion
All original studies of people with AIS that reported neurophysiological measures (e.g. proprioception, balance, sensation/perception, sensorimotor performance).
Where studies include participants with AIS amongst other diagnostic groups, able to extract AIS-specific results.
Age of participants between 10 years and skeletal maturity (females, approximately 15 - 17 years; males, 16 - 19 years of age).
AIS diagnosed by appropriate clinician based on radiological/MRI imaging
Cobb angle of main curve ≥ 10 degrees using recognised measuring technique (e.g. from radiographic or MRI images)
Must contain a suitable control group (e.g. healthy adolescents)
Peer-reviewed studies published as full-text
Exclusion
Non-AIS scoliosis (e.g. congenital, neuromuscular or syndromic scoliosis)
Studies of genetic, musculoskeletal or neuroanatomical changes or differences (e.g. bone/muscle, brain morphology).
Studies of people with AIS who underwent treatment (e.g. surgery) that may impact on the abnormality being investigated.
Studies written in other languages where an adequate translation could not be obtained
3.1.3 Data extraction
Data regarding participant characteristics (e.g. age, sex, curve size and type, prior treatment),
observed variables, testing procedure and results were extracted independently for each
eligible study.
3.1.4 Risk of bias
All included studies were assessed for risk of bias at the study level using criteria devised for
this review (Table 3.2). These criteria were based on the STROBE guidelines [2], Critical
Appraisal Skills Training Programme (CASP) checklist [3], Scottish Intercollegiate Guidelines
Network (SIGN) methodology checklist [4], Newcastle-Ottawa case control assessment study
scale [5], and a specifically designed tool used in similar reviews [6]. Studies were categorised

42
as at high, low or uncertain risk of bias according to the information described in the study
reports:
Low risk of bias - if all key bias domains were considered to be low risk
High risk of bias - if one or more key domains were considered to be high risk
Uncertain risk of bias - if one or more key domains were considered to be of uncertain
risk or unreported.
Table 3.2 Study risk of bias criteria
Selection bias
are cases representative of AIS population?
are controls representative of general adolescent population, and comparable to cases?
Were the same inclusion/exclusion criteria (except for the spinal deformity) used for AIS and healthy adolescents?
Classification bias
clearly established that controls are non-cases (as well as possible)?
Was other pathology excluded that possibly influences the outcome?
Measurement bias
Was the data collection performed in the same standardized way for AIS cases and healthy adolescents?
Were the observers blinded to AIS/healthy adolescent status?
Reporting bias
Free of selective reporting of outcomes?
Potential confounders identified and taken into account?
3.1.5 Data analysis
Where appropriate, data from studies that evaluated the same parameters were combined
and meta-analysis performed using Review Manager (RevMan version 5.3). Mean differences
(MD) and standard deviations (SD) were extracted for continuous measures and 95%
confidence intervals (CI) calculated. Where direct comparison was not possible or feasible due

43
to different units or different tools to evaluate the same parameter, standardised mean
differences (SMD) were calculated.
Clinical heterogeneity was judged on similarities between study protocols, participants and
measured parameters. Statistical heterogeneity was evaluated using the Chi2 test and I2
statistic, both generated by the meta-analysis programme. The findings were interpreted as
follows according to the I2 statistic (RevMan Handbook]:
0% to 40%: might not be important
30% to 60%: may represent moderate heterogeneity
50% to 90%: may represent substantial heterogeneity
75% to 100%: considerable heterogeneity
Random effects models were used if heterogeneity was moderate or above (I2 > 30%). Fixed
effect models were used if there was no clinical and no important statistical heterogeneity.
Sensitivity analyses were also performed if heterogeneity was excessive.
Where it was not possible to combine results, a narrative analysis was conducted.
3.2 Results
3.2.1 Search results
Searches of electronic databases yielded 9521 results. After removing duplicates and initial
screening of abstracts, 77 articles were retrieved for full text screening. This resulted in 36
studies that met the eligibility criteria and were included in this review (Figure 3.1). The
included studies investigated the areas of balance (n=14), proprioception (n=2), perception of
vertical (n=4), vibration threshold (n=3), vestibular function (n=6), cortical and nervous system
function (n=6) and other forms of perception (n=1) in people with AIS compared to controls.
Due to the diverse nature of the neurophysiological measures evaluated in the included
studies, each will be discussed separately.

44
Figure 3.1 Consort diagram - search and inclusion details
3.2.2 Balance
Thirty-five studies were identified that evaluated balance in AIS and control participants.
Twenty one were excluded due to a variety of reasons: 14 studies were excluded to lack of
sufficient information to make an accurate comparison [7-20], 3 studies used inappropriate
participants as a control group [21-23], 3 studies included participants in the AIS group that did
not conform to standard definitions of AIS [24-26], and one study included a significant
proportion of AIS participants that had undergone surgery [27]. It should be noted that only
studies that measured balance ability rather than parameters associated with postural
alignment (e.g. position of centre of pressure) were included.
(i) Characteristics of included studies
Summaries of the included studies are provided in Table 3.3. Studies were conducted in the
USA [28-31], Taiwan [32-35], Hong Kong [36], Turkey [37], Canada [38], South Korea [39] and
France [40, 41] with sample sizes ranging from 12 [40] to 128 [39] AIS and 12 [40] to 81 [41]
control participants. The age of the participants ranged from 7 to 21yrs with mean ages
ranging from 11.3yrs to 16.8yrs. Six studies matched participants by age [28, 29, 32, 34, 35,

45
41]. Five studies only included female participants [28, 30, 31, 36, 38], 5 studies reported the
proportion of female participants between 77% to 93% and 64% to 86% for the AIS and control
groups respectively [29, 32, 33, 37, 41], and 3 studies did not provide any details regarding
female:male ratio [34, 35, 39]. One study included only female AIS participants but did not
report details of the control group [40].
Amongst AIS participants, the mean Cobb angle ranged between 17.9 to 39.5 degrees and
included participants with Cobb angles ranging from 7 to 67 degrees. Four studies did not
provide details of curve type [30, 36, 37, 39], 2 used the King classification system with curves
ranging from type I to V [29, 33], 2 studies only included right thoracic curves [40, 41], 3 studies
only included double curves [32, 34, 35] and the remaining 3 studies included curves of both
directions and various spinal locations [28, 31, 38]. Five studies reported that AIS participants
had not received treatment [31-33, 37, 38], 3 studies reported participants had not undergone
spinal correction surgery [29, 34, 35], and 4 studies did not provide any details regarding
treatment [30, 36, 39, 41]. One study reported that AIS participants had received
physiotherapy and bracing [40], and one study reported participants receiving either bracing
and/or electrical stimulation [28].
A variety of different balance testing methodologies were used. Eight studies assessed static
standing balance using a force plate [28, 31-33, 36-39], one study assessed static sitting
balance using a force plate [29], two studies measured dynamic standing balance [34, 35], two
studies measured one leg and tandem stance standing times [30, 41], and two studies
measured response to an external perturbation in either sitting [40] or standing [35].
(ii) Risk of bias assessment
Evaluations of the included studies for risk of bias are summarised in Table 3.10. In general,
most studies were at uncertain risk of bias across all domains. Specifically, of 14 studies, two
studies were considered to be at low risk of selection bias [28, 32], 4 studies were at low risk of
classification bias [34-37], 1 study was at low risk [30] and one study was at high risk [40] of
measurement bias and all studies were at uncertain risk of reporting bias.

46
(iii) Results
Due to the differences between studies, the results will be presented according to
methodology type.
Static balance (standing) - 7 studies measured static balance in quiet standing with a force
plate. Six studies measured overall centre-of-pressure (COP) sway area [28, 31-33, 37, 38] and
four studies measured COP movement in the sagittal and lateral directions separately [31, 33,
37, 39]. Some studies measured these parameters with eyes open and/or eyes closed (Table
3.3). Results were combined and meta-analysis performed for each parameter. Due to the
differences in units and how measurements were calculated, standardised mean differences
were used in the meta-analysis.
When all relevant studies were considered, the results of the meta-analysis for sway area (eyes
open) indicated no difference in quiet standing balance between AIS and control participants
(SMD 0.17, 95% CI -0.51 to 0.86, p=0.62, I2=89%) (Figure 3.2a). Due to considerable
heterogeneity, a sensitivity analysis was performed with the study by Adler et al [28] removed
(Figure 3.2b). The new analysis indicated that sway area (eyes open) was greater on average
for AIS participants, a sign of poorer balance (SMD 0.45, 95% CI 0.13 to 0.78, p=0.006, I2 =28%).
Figure 3.2 Forest plot for static balance (standing) - sway area eyes open
a) all studies

47
b) sensitivity analysis
Only three studies measured sway area with the eyes closed (Figure 3.3a). The results for the
meta-analysis suggest no difference between AIS and control participants (SMD -0.85, 95% CI -
3.41 to 1.71, p=0.52, I2=98%). As with eyes open, a considerable degree of heterogeneity was
reduced by removing the study by Adler et al [28]. However, the overall conclusion of no
between-group differences remained the same (SMD 0.38, 95% CI -0.05 to 0.81, p=0.08, I2=0%)
(Figure 3.3b).
The study by Adler et al [28] measured sway area by calculating a dispersion co-efficient,
reported to reflect the movement of the COP from a central point of origin. This was in
contrast to other studies that, in general, measured the area of COP movement directly, and
may account for the heterogeneity between their results and the remaining studies.
Figure 3.3 Forest plot for static balance (standing) - sway area eyes closed
a) all studies
b) sensitivity analysis

48
The amount of COP movement in the sagittal plane (anterior-posterior) during quiet standing
with eyes open was measured by four studies. The meta-analysis of the combined results
indicates that on average, the COP of AIS participants moved to a greater extent in the sagittal
plane, suggesting poorer balance (SMD 0.40, 95% CI 0.10 to 0.71, p=0.009, I2=0) (Figure 3.4a).
Only two studies measured the same parameter with eyes closed (Figure 3.4b). The results of
the meta-analysis indicate no difference in sagittal COP movement between AIS and control
participants (SMD 0.20, 95% CI -0.22 to 0.62, p=0.35, I2=0).
Figure 3.4 Forest plot for static balance (standing) - sagittal movement
a) eyes open
b) eyes closed
The same studies measured COP movement during quiet standing in the lateral direction. With
eyes open, combined results indicate that the COP moves laterally to a greater extent in AIS
participants than control participants, suggesting poorer balance (SMD 0.57, 95% CI 0.19 to
0.96, p=0.003, I2=36%). Removing the results of either Park et al [39] or Kinikli et al [37] in
sensitivity analyses reduced the heterogeneity to zero but did not alter the overall findings of
greater lateral movement in the AIS group. Therefore, the forest plot with all studies retained
is displayed (Figure 3.5a).

49
With eyes closed, meta-analysis of the combined results from three studies indicates that
there was no difference between AIS and control participants in lateral COP movement (Figure
3.5b). Again, substantial heterogeneity between studies was apparent.
Figure 3.5 Forest plot for static balance (standing) - lateral movement
a) eyes open
b) eyes closed
Static balance (sitting) - Only one study examined static balance in sitting to isolate trunk
postural sway from whole body sway as tested in standing [29]. The study included 14 AIS and
12 control participants. The results (normalised to account for height) suggested that overall
trunk movement (as measured by trunk sway, and sagittal and lateral COP movement) was less
on average for AIS participants than for control participants, indicating better trunk stability in
the AIS group (Table 3.3).
Dynamic balance (standing) - Two studies evaluated dynamic standing balance by asking
participants to maintain quiet standing on an unstable platform [34, 35]. One study tested this
under three conditions: eyes open, eyes closed or while standing on a sponge balance pad [34],
while the other used eyes open only [35]. Rather than recording COP, the tilting angle of the
platform was measured in sagittal and lateral directions. As well as these parameters, one
study used this information to calculate a balance index [34]. High balance index scores reflect
greater movement and therefore poorer balance.

50
The results of two studies for tilt angles in the eyes open condition were combined for meta-
analysis and are illustrated in Figure 3.6a and b. These suggest that sagittal tilt angles were
lower for AIS participants than controls, and that these differences were statistically significant
(MD -1.79, 95% CI -3.12 to -0.46, p=0.008, I2=76%). For lateral tilt angles, no statistically
significant difference was seen between the two groups (MD -2.86, 95% CI -5.78 to 0.05,
p=0.05, I2=97%). Again of note is the considerable heterogeneity between the two studies
despite using similar methodologies.
Figure 3.6 Forest plot for dynamic balance - eyes open
a) sagittal tilt
b) lateral tilt
The results from one study [34] for eyes closed and sponge pad conditions (Table 3.3) indicate
that on average tilt angles were lower in both directions for AIS participants compared to
controls, and these differences were statistically significant. Differences between AIS and
control participants for the derived balance index reflected the results for tilt angles with AIS
participants demonstrating statistically significant lower index scores (i.e. better balance) than
controls for eyes closed and sponge pad conditions, although not for eyes open condition.
Overall, these results suggest that AIS participants had better dynamic standing balance than
control participants.
One leg static standing balance - one leg standing balance ability was evaluated in two studies.
Driscoll et al [30] timed participants in the test position (eyes closed) for a maximum of 30

51
seconds as they performed 5 trials for each leg. The results of each trial for each leg were
summed to give a maximum possible score of 150 seconds for each leg. A similar procedure
was used by Le Berre et al [41] although only 1-2 trials were conducted for each leg, and the
longest time for each trial was recorded. Results were combined and meta-analyses were
performed for each leg separately and for both legs combined (Figure 3.7a, b, c). Due to the
differences in calculating stance time, standardised mean differences were used. The forest
plots indicate that there was no difference in 1 leg static standing balance ability between AIS
and control participants (combined leg SMD -0.13, 95% CI -0.39 to 0.12, p=0.30, I2=0%).
Figure 3.7 Forest plot for 1 leg standing balance
a) Left leg
b) Right leg
c) combined
Tandem stance (Sharpened Romberg test) - the same two studies timed balance ability during
tandem standing. Driscoll et al [30] asked participants to perform 4 trials for a maximum of 60
seconds each. The time for each trial was summed to give a maximum possible time of 240
seconds. Le Berre at al [41] only used 1-2 trials for each leg up to a maximum of 30 seconds.

52
Results were recorded for the longest trial. For the purpose of this analysis, results for left-foot
forward and right-foot forward were combined (Figure 3.8). Standardised mean differences
were used due to differences in measuring procedures. The result of the meta-analysis of
combined results indicates that on average there was no difference in tandem standing
balance ability between AIS and control participants (SMD -0.16, 95% CI -0.41 to 0.10, p=0.22,
I2=0%).
Figure 3.8 Forest plot for tandem standing balance - combined
Destabilisation testing - two studies examined participant balance response to perturbation or
destabilisation. Bruyneel et al [40] asked participants to maintain seated balance after
destabilisation in an anterio-posterior direction. Ground reaction forces in the sagittal and
lateral directions were measured with a force plate mounted underneath the seating device
and the total force used in each direction to maintain stability after destabilisation were
calculated. The test was performed with eyes open and eyes closed. The results (Table 3.3)
indicate that AIS participants generated greater forces in both directions to maintain stability
than control participants across all conditions and in both directions, and these differences
were statistically significant. The authors concluded that it required more effort for AIS
participants to maintain balance when challenged.
In a second study, Kuo et al [35] evaluated participants’ response to backward perturbation in
standing. Participants stood on a moveable platform and the platform was destabilised in the
posterior direction. Lateral and sagittal tilt angles of the platform were recorded. The authors
reported that the platform tilt angles following perturbation were on average less in both
directions for AIS participants than those for the control participants, indicating greater
stability, and that these differences were statistically significant (Table 3.3).

53
Other - in one study, static and dynamic standing balance was evaluated under reduced or
conflicting sensory conditions [36]. Six different visual and support surface conditions involving
eyes open and closed, stable or ‘sway-referenced’ (i.e. moved in same direction and magnitude
as subjects’ body sway) platform, and static or moving visual background were scored from 0-
100 (Table 3.3). By combining scores from certain conditions, somatosensory, visual and
vestibular ratios were calculated. The somatosensory ratio quantified differences in balance
scores between eyes open and eyes closed on a fixed platform (i.e. reliant on somatosensory
information to maintain balance); the visual ratio quantified differences in balance scores
between a fixed and a sway-referenced moving support surface (i.e. reliant on visual
information); the vestibular ratio quantified the differences in balance scores between eyes
open on fixed surface and eyes closed on a sway-referenced moving platform (i.e. reliant
predominantly on vestibular information). The authors reported that there were no statistically
significant differences between AIS and control participants for any of the calculated balance
ratios.
(iv) Summary
Despite the large number of studies that have investigated balance in people with AIS
compared to people without AIS, the results to date are inconclusive. The studies included in
this review have evaluated different aspects of balance with contrasting results. Attempts to
combine results in meta-analyses have allowed some comparisons between studies to be
made but a lack of consistency in testing methodologies and parameters measured has limited
their effectiveness. In summary:
Seven studies of static standing balance provided some evidence of poorer balance
amongst AIS participants compared to controls for all sway parameters measured when
the eyes were open, but not with eyes closed.
One small study of static sitting balance reported better balance amongst AIS
participants.
Two studies of dynamic standing balance reported better performance by AIS
participants for 3 out of 4 tested conditions.

54
Two studies of 1 leg and tandem standing balance reported no difference between
groups.
Two studies of balance response following destabilisation produced contrasting results
with one study reporting worse performance by AIS participants and the other
reporting the reverse.
There appears to be some evidence to suggest that people with AIS have poorer static standing
balance than people without AIS, although this only seems to apply when eyes are open rather
than eyes closed. This may be because the smaller number of studies and participants involved
in evaluating eyes closed compared to eyes open resulted in insufficient power to detect any
differences.
Apart from static standing balance, most outcomes were only evaluated by one or two studies.
The majority of included studies involved small sample sizes and less than half made any
attempts to match AIS and control participants. All studies were also at uncertain risk of bias
for most key domains and there was often considerable heterogeneity between studies. Until
these issues are addressed, and greater consistency in outcome measures and testing
procedures is achieved, the question of differences in balance between people with AIS and
people without AIS will remain unanswered. Further research of this nature is therefore likely
to have an important effect on the current evidence base and may change this evaluation.
3.2.3 Proprioception
Five studies were identified that evaluated proprioception in AIS and control participants.
Three of these were excluded: Yekutiel et al [42] did not report sufficient data to make a true
comparison between participant groups; both Cook et al [43] and Keessen et al [44] included
participants that had undergone spinal correction surgery and, in the former study, the control
group was on average 4 years older than the AIS group, both factors which could have affected
the results.
(i) Characteristics of included studies
Summaries of the included studies are provided in Table 3.4. Studies were conducted in the
USA [45] and France [46] with sample sizes ranging from 17 [45] to 30 [46] AIS and 12 [45] to

55
14 [46] control participants. The age of the participants was similar between studies (mean AIS
group: 14.8yrs and 15.5yrs; mean control group: unknown and 14.6yrs). Barrack et al [45] did
not provide details of the control group although they did state that they matched cases and
controls by age. Details of the ratio of female:male participants was poorly reported by both
studies with information only provided for the AIS group in Barrack et al [45] and for neither
group in Guyot et al [46].
Amongst AIS participants, the mean Cobb angle was similar between the studies ranging
between 26.8 and 24.8 degrees. Guyot et al [46] included participants with a range of curve
types (i.e. thoracic, thoracolumbar, lumbar and double curves) and in both directions (left and
right) in varying proportions. In contrast, Barrack et al [45] only included participants with
right-sided thoracic curves. Guyot et al [46] did not describe whether any of the AIS
participants had undergone treatment, whereas some of the participants in Barrack et al [45]
had received surgery or bracing. During sub-group analysis of the results, Barrack et al [45]
reported that there were no differences in results between AIS participants by treatment
group, information that was not provided by Cook et al [43] and Keessen et al [44] and
therefore caused their exclusion from the review.
(ii) Risk of bias assessment
Evaluations of the included studies for risk of bias are summarised in Table 3.11. In general, as
with many older studies, lack of reporting of key details by Barrack et al [45] resulted in
uncertainty as to how at risk the study was across all types of potential bias. The study by
Guyot et al [46] was reported to a higher standard and was judged at low risk of classification
bias. However, a lack of information regarding control participants and whether assessors were
blinded led to the study being at uncertain risk of selection and measurement bias and at high
risk of reporting bias.
(iii) Results
The two included studies investigated the ability of participants to reproduce joint angles
either in the knee [45] or the neck [46] (Table 3.4]. This involved the joint being moved
(passively or actively) to a specified angle(s) and then returned to the start position. The
participant then had to move their knee or neck and attempt to reproduce the initial position.
Discrepancies (error) between the initial and estimated position were recorded in degrees.
56
Barrack et al [45] also examined the threshold for detection of movement in the knee which
involved participants having to indicate when they first noticed the knee being passively
moved.
Joint angle reproduction - due to the different body parts tested and differences in testing
methodology, the results of these two studies were summarised as part of a narrative analysis.
Barrack et al [45] reported a statistically significant difference in mean error between groups
with AIS participants recording almost double the amount of error on average than control
participants across both limbs (AIS: mean 5.1 degrees, SD 2.5; control: mean 2.7 degrees, SD
1.5; MD 2.4 degrees, 95% CI 0.74 to 4.06, p=0.006). In contrast, in the neck, there was no
statistically significant difference between groups when both movement directions were
combined (MD 0.22 degrees, 95% CI -0.77 to 1.21, p=0.66). Guyot et al [46] further reported
that 40% (12/30) of AIS participants had average errors in neck reproduction ability of more
than 4.5 degrees, which they defined as pathological. No difference in curve severity or age
was found between AIS participants with ‘pathological’ and ‘non-pathological’ error. Post-hoc
sub-group analyses revealed statistically significant differences between groups of AIS1
(‘pathological’), and AIS2 (‘non-pathological’) and control participants (AIS1: mean 4.6 degrees,
SD 1.2; AIS2: mean 2.8 degrees, SD 0.7; controls: mean 3.3 degrees, SD 1.7 respectively).
Unfortunately, no information was provided regarding whether any control participants
recorded errors greater than 4.5 degrees, therefore it is difficult to know if this sub-group
analysis is valid. Even with this subgrouping, the mean differences in error between groups
reported in both studies was small (1.3 to 2.4 degrees) which calls into question how much of a
practical difference there would be between people with and without AIS.
Movement detection threshold - Barrack et al [45] also evaluated differences in the threshold
of movement detection of the knee with AIS participants on average recording thresholds
almost double (i.e. less sensitive) those of control participants (AIS: 2.6 degrees, SD 1.8;
control: 1.4 degrees, SD 0.6; MD 1.2 degrees, 95% CI 0.09 to 2.31, p=0.04). With no other
studies measuring this variable, it is difficult to make any definitive conclusions regarding
movement detection ability in people with AIS.

57
(iv) Summary
From the limited amount of evidence available, the joint angle reproduction ability of people
with AIS appears to be reduced by a small amount in the knee but not in the neck compared to
people without AIS. The ability to detect knee movement also appears to be reduced in AIS
participants. These findings are based on only two studies with small sample sizes, uncertain to
high risk of bias across key domains, and with contrasting results, therefore no final judgement
can as yet be made as to whether people with AIS have reduced proprioceptive function.
Further research is likely to have an important impact on currently available evidence and may
change this evaluation.
3.2.4 Vibration threshold
Following reports of altered proprioception in AIS, numerous studies have attempted to
evaluate functioning of the posterior column of the spinal cord as proprioceptive information is
conducted primarily through these pathways [47]. Testing of vibratory threshold is one method
used to evaluate posterior column function [48]. Testing involves applying a vibration stimulus
to a bony prominence and slowly increasing the magnitude of vibration until the stimulus is
perceived. The lower the threshold, the greater the ability to detect vibration.
Four studies were evaluated for testing of the vibration threshold in AIS and control
participants. One of these was excluded as participants in both groups were not adolescents
(mean age > 30 years old) and a third of AIS participants had undergone spinal correction
surgery [24].
(i) Characteristics of included studies
Summaries of the included studies are provided in Table 3.5. Studies were conducted in the
USA [47, 48] and Canada [49] with sample sizes ranging from 14 to 58 AIS and 20 to 57 control
participants. The age of the participants was similar between studies (mean AIS group: 14.4yrs
to 15.4yrs; mean control group: 13.6yrs and 14.5yrs). All participants were female which
reflects the higher incidence of AIS amongst the female population. Only one study described
matching of AIS and control participants, in this case by age and sex [47].
Amongst AIS participants, the mean Cobb angle was similar between the studies ranging
between 30 and 35 degrees. Two studies [48, 49] included participants with a range of curve

58
types, predominantly to the right. Barrack et al [47] did not give details as to curve type. None
of the studies provided details as to current or previous treatment of AIS participants.
(ii) Risk of bias assessment
Evaluations of the included studies for risk of bias are summarised in Table 3.11. In general, all
included studies were judged to be at uncertain risk of bias due to lack of reporting of key
domains. Uncertainty was particularly evident in relation to the areas of selection and
reporting bias due to insufficient information participants (e.g treatment details, recruitment
source, inclusion criteria) and lack of reporting of any potential confounders. Barrack et al [47]
was judged to be at low risk of measurement bias, McInnes et al [49] was judged at low risk of
classification and measurement bias and Wyatt et al [48] was at uncertain risk of bias for all
domains.
(iii) Results
The three included studies measured vibration thresholds at a number of body locations: ulnar
styloid (n=2), great toe (n=2), 1st metatarsal-phalangeal joint (MTP) (n=3) and medial malleolus
(n=1) (Table 3.5). As the testing methodology was similar for all three studies, results were
combined and a meta-analysis conducted for testing of the ulnar styloid, great toe and 1st MTP.
An overall meta-analysis was also performed by combining the results of each location.
Ulnar styloid and great toe - Forest plots for the two studies that evaluated vibration threshold
at the ulnar styloid and great toe [47, 48] are shown in Figure 3.9a and b. These indicate that
AIS participants had lower thresholds (i.e. more sensitive) to detect vibration than control
participants (ulnar styloid: MD 0.08, 95% CI -.014 to -0.02, n=146; great toe: MD -0.12, 95% CI -
0.18 to -0.05, n=146). However, these findings should be interpreted with caution due to the
considerable statistical heterogeneity as revealed by the χ2 and I2 values.
1st MTP - Forest plots for the three studies that evaluated vibration threshold at the 1st MTP
[47-49] are shown in Figure 3.9c. The results for Wyatt et al and Barrack et al [47, 48] favoured
lower thresholds in AIS participants whereas McInnes et al [49] reported the reverse. Overall,
these suggest that there is no difference in vibration detection thresholds between AIS
participants and controls (MD: -0.08, 95% CI -0.19 to 0.02, n=182). Due to the contrasting
results and considerable heterogeneity, a further analysis was performed without McInnes et

59
al [49] (Figure 3.9d). Although this indicated that AIS participants had lower vibration detection
thresholds than controls (MD -0.12, 95% CI -0.19 to -0.05, n=146), consistent with the results
for the ulnar styloid and great toe, the level of heterogeneity remained considerable and
therefore, results should be interpreted with caution.
Overall - Combining results for each location (including medial malleolus) allowed an analysis
of overall vibration detection ability (Figure 3.9e). The results of this were similar to those for
the 1st MTP, with the results of Wyatt et al [48] and Barrack et al [47] in conflict with McInnes
et al [49], suggesting that there was no difference between the groups (MD -0.06, 95% CI -0.18
to 0.06, n=182). A further sensitivity analysis was performed by removing the results of
McInnes et al (Figure 3.9f). The results of this indicated that AIS participants had a lower
vibration detection threshold than control participants (MD: -0.10, 95% CI -0.15 to -0.04,
n=146). These results can be interpreted with greater confidence due to the lower levels of
heterogeneity (I2=30%) indicating greater consistency between the studies.
Figure 3.9 Forest plots of vibration threshold
a) ulnar styloid
b) great toe
c) 1st MTP

60
d) 1st MTP less McInnes et al
e) overall
f) overall less McInnes et al
(iv) Summary
Meta-analysis of the evidence from the three included studies indicates that vibration
detection ability is increased in people with AIS by a small amount compared to people without
AIS. These findings need to be interpreted with caution due to the conflicting results between
the studies, the uncertain risk of bias across key domains, small sample sizes, and the
considerable heterogeneity reported in the meta-analyses, apart from the sensitivity analysis
of overall results. It is also not clear whether the magnitude of differences seen is sufficient to
result in changes of functional significance. Further research is likely to have an important
impact on currently available evidence and may change this evaluation.

61
3.2.5 Perception of vertical
Alterations in spatial orientation have been proposed as a possible factor in AIS, with flow on
effects resulting in altered spinal muscle activation. One method of assessing spatial
orientation is to examine the ability to judge vertical alignment.
Five studies investigated the ability to judge vertical alignment in participants with AIS
compared to control participants. Two of these were excluded due to insufficient reporting of
data which prevented an accurate comparison between groups [50, 51].
(i) Characteristics of included studies
A summary of the three included studies is provided in Table 3.6. Studies were conducted in
the Czech Republic [52], Taiwan [32] and France [53] with sample sizes ranging from 13 to 30
for both AIS and control participants. The age of the participants was similar between studies
with mean ages ranging from 13.9yrs to 15.7yrs. One study included only female participants
[53], whereas the proportion of females in the other studies ranged from 69% to 78%. All three
studies described matching of AIS and control participants by at least age with Cakrt et al [52]
also matching by sex and Le Berre et al [53] by BMI, handedness and stage of puberty (Tanner
stage).
All studies included AIS participants with a wide range of curve severity. Two studies [32, 52]
included participants with curves up to 30 to 40 degrees, while one study [53] included curves
sizes up to 74 degrees. One study [53] only included AIS participants with right thoracic curves
whereas [32, 52] included a range of curve types in both directions. One study [53] provided no
details as to current or previous treatment of AIS participants. Two studies [32, 52] stated that
participants had not undergone spinal correction surgery or active treatment respectively.
Each of the studies used different methodologies to assess participants’ ability to perceive
verticality. Cakrt et al [52] asked participants to judge the verticality of a line drawn on the
inside of a rotating drum. Chang et al [32] used a modified rod-and-frame test where
participants had to assess the verticality of a line visualised on a computer screen. Le Berre et
al [53] asked participants to move a line projected onto a wall until it was vertical using a
joystick. In a separate experiment, they also asked blindfolded participants to judge the
verticality of their body whilst seated in a rotating drum-like apparatus.

62
(ii) Risk of bias assessment
Evaluations of the included studies for risk of bias are summarised in Table 3.11. Two studies
were judged overall to be at uncertain risk of bias and one study at high risk of bias. Two
studies were at low risk of selection bias [32, 52], two studies were at low risk of classification
bias [52, 53], and one study was deemed to be at high risk of bias due to lack of assessor
blinding [52]. The remaining domains of each study were judged to be of uncertain risk of bias
due to lack of information.
(iii) Results
Subjective visual vertical (SVV) - Participants in the study by Chang et al [32] were asked to
judge whether lines presented on a computer screen were vertical by answering yes on no via
a computer keyboard (Table 3.6). Reaction times in making correct decisions were also
recorded. They reported that there was no difference in either accuracy or reaction time
between AIS and control participants (correct response: MD 2%, 95% CI -9.3 to 13.3, p=0.72;
mean reaction time: MD 24.3 ms, 95% CI -86.7 to 135.4, p=0.66).
The other two studies measured the difference (i.e. error) between actual and estimated
vertical lines using a variety of methodologies [52, 53]. Therefore, the results of these were
combined in a meta-analysis (Figure 3.10) using absolute error values. The forest plot reveals
the contrasting results of the two studies and suggests that there is no difference between
people with and without AIS (MD 0.32 degrees, 95% CI -0.65 to 1.29, n=106). It should be
noted that considerable heterogeneity exists, possibly due to the differences in testing
methodologies, and therefore these results should be interpreted with caution.
Le Berre et al [53] also reported on SVV with a rotating pattern in the background to the
projected line which was not included in the meta-analysis. The results indicate that both
groups were more accurate under this condition but with no statistically significant difference
between AIS participants and control participants (MD 0.12 degrees, 95% CI -1.74 to 1.98,
p=0.898).

63
Figure 3.10 Forest plot subjective visual vertical
Subjective postural vertical (SPV) - as well as visual estimates of verticality, one study [53] also
asked participants to estimate whether their body was in vertical alignment whilst blindfolded
and seated in a rotating drum-like apparatus. In contrast to their results for SVV, they reported
that AIS participants were less accurate than control participants in their estimates of actual
vertical (MD 2.05, 95% CI 1.09 to 3.01, p=0.001).
(iv) Summary
The results of the three included studies suggest that there is no difference in perception of
vertical in people with AIS compared to people without AIS, at least as far as testing of SVV is
concerned. There is some evidence to suggest that people with AIS were less accurate when
they were asked to judge body alignment without visual information compared to people
without AIS. All of these studies were at uncertain to high risk of bias, involved small sample
sizes, and had conflicting results. Each study also used different testing methodologies and
combining results from two of the studies resulted in considerable heterogeneity. Therefore, it
is likely that further research will have an important impact and may change this evaluation.
3.2.6 Vestibular testing
A number of studies have utilised different methods to assess vestibular function in AIS. These
included testing of the semicircular canals, vestibular-ocular reflex and the otolith system.
These will be reviewed separately in the following sections.
3.2.6.1 Semicircular canal testing
Six studies were identified that evaluated the effects of direct stimulation of the semicircular
canals (SCC). Four studies were excluded: three studies used an inappropriate control group (a
cohort from >10 years previously) [22, 23, 54]; one study did not provide sufficient data to
allow an accurate comparison between groups [55].

64
(i) Characteristics of included studies
Summaries of the included studies are provided in Table 3.7. The two included studies were
conducted in the USA [56] and France [57]. Sample sizes ranged from 17 to 18 AIS and 9 to 25
control participants. One study reported mean ages of the participants of 15.5yrs and 16.7 yrs
(AIS and control groups respectively) [57], whereas the other study reported age-matched
participants between 11-15yrs [56]. One study only included female participants [56]. The
other study reported the proportion of female participants as between 67 to 76% in the AIS
and control group respectively [57].
Amongst AIS participants, Jensen et al [56] reported Cobb angle of between 5-45 degrees with
curves in both directions (predominantly right side) and across all locations. In the study by
Hitier et al [57], Cobb angles ranged from 15-40 degrees (mean 26.7 degrees, SD 8.3). No
information was provided regarding previous treatment in one study [56]; the other study
stated that AIS participants had not received any treatment [57].
(ii) Risk of bias assessment
Evaluations of the included studies for risk of bias are summarised in Table 3.12. All included
studies were deemed to be at uncertain risk of bias overall. Jensen et al [56] was at low risk of
classification bias, and uncertain risk of selection, measurement and reporting bias. Hitier et al
[57] was at low risk of classification bias and uncertain risk across other domains.
(iii) Results
The two included studies used different methods of SCC stimulation (Table 3.7). Different
properties of the resulting nystagmus were evaluated, therefore they will be considered
separately.
Jensen et al [56] used the Southern Californian postrotatory nystagmus test (SCPNT) which
involved inducing nystagmus by rotating the participant whilst seated. Nystagmus duration
time was measured as well as categorisation of excursion distance and rhythm into normal and
abnormal responses. They reported statistically significant differences between AIS and control
participants in nystagmus duration for mean clockwise, counter-clockwise and the sum of
combined (clockwise and counter-clockwise) rotation, with shorter duration in AIS participants
compared to controls (Table 3.7). Statistical analysis of between-group differences in

65
nystagmus excursion and rhythm were not provided but was performed for the purposes of
this review. The results indicated that there were no differences in the frequency of normal or
abnormal responses for either excursion or rhythm (for combined, clockwise or
counterclockwise rotation) between AIS and control participants (excursion combined: χ2=2.66,
p=0.10; rhythm combined: χ2=1.84, p=0.18).
Hitier et al [57] measured mean eye speed, directional preponderance and the canal paresis
index (i.e. right versus left SCC) using electro-nystagmography following caloric stimulation of
the SCC. In essence, this involves inducing nystagmus by pouring water into the inner ear and
measuring the resulting eye movement induced by the reflex response. They reported no
difference between AIS and control participants for any functional measures (Table 3.7).
3.2.6.2 Vestibular-ocular reflex testing
Three studies were identified that evaluated the effects of vestibular-ocular reflex (VOR)
testing. One study was excluded due to insufficient information for between-group
comparisons and an inappropriate control group (age range AIS: 8-16yrs; controls: all 12yrs)
[58].
(i) Characteristics of included studies
Summaries of the included studies are provided in Table 3.7. The two included studies were
conducted in Canada [59, 60] with sample sizes ranging from 10 to 36 AIS and 13 to 16 control
participants. Both studies reported similar mean ages of participants of between 14.6yrs to
17.4yrs with one study reporting age-matching of AIS and control participants [59]. The
proportion of female participants was also similar in the two studies ranging from 78% to 90%.
Simoneau et al [59] reported that Cobb angle amongst AIS participants ranged from 28-51
degrees, all of which were right thoracic curves. AIS participants in the other study [60] had a
mean Cobb angle of 27.9 degrees but no details were provided as to direction or location.
None of the participants in one study had received any treatment [59] whereas in the other
study, 21 had undergone bracing and a further 6 had received other conservative treatments,
although the exact nature of these was not specified [60].

66
(ii) Risk of bias assessment
Evaluations of the included studies for risk of bias are summarised in Table 3.12. Both studies
were overall at uncertain risk of bias with poor reporting resulting in a lack of information
particularly with regard to the key domains of selection and classification bias.
(iii) Results
Both studies calculated VOR gain following rotational tasks in which eye movements were
recorded using electro-oculography. Due to the similarities in testing procedures and
measured parameters, results were combined in a meta-analysis.
Forest plots for the two included studies that measured VOR gain for left, right and combined
directions are illustrated in Figure 3.11a, b and c. These indicate that there was no overall
difference between AIS and control participants (MD 0.01, 95% CI -0.01 to 0.03), nor for the
right rotation task (MD 0.0, 95% CI -0.02 to 0.02). A small but statistically significant difference
was observed between AIS and control participants for the left rotation task (MD 0.02, 95% CI
0.0 to 0.03) although the lower boundary of the 95% CI was almost equivalent to zero (i.e. no
effect).
Figure 3.11 Forest plots of VOR gain
a) Left
b) Right

67
c) Combined directions
3.2.6.3 Otolith testing
Two studies were identified that tested otolith function in AIS and control participants. Otolith
function was evaluated as it has an important role in regulating postural control of the spine,
therefore potentially being involved in the development of AIS.
(ii) Characteristics of studies
One study was conducted in France [61] and the second study in Israel [62]. They included
similar numbers of participants in each group (AIS n=29 and 30; controls n=12 and 19). The
mean age of participants was similar between studies although the range was different both
within- and between studies. One study reported participant ages of 6.5 to 15yrs and 11-15yrs
for AIS and control groups respectively [61], while the other study reported AIS participants
ranging from 9-23yrs [62]. No details were provided with controls for this study although they
reported that control participants were age-matched with AIS participants. Similar proportions
of female participants in each group were reported by one study (90% and 83% AIS and control
groups respectively) [61]. In contrast, the other study reported a large difference with 86% and
47% female participants in AIS and control groups respectively [62].
Both studies included a wide range of curve severity with Cobb angles ranging from 10-85
degrees in one study [61] and 28-72 degrees in the other [62]. The mean Cobb angles indicate
that AIS participants in Pollak et al [62] tended to have on average curves that would be
classified as severe. Both studies included curves in both directions and in a variety of spinal
regions, though no information was reported in either study regarding previous treatment.
(ii) Risk of bias assessment
Evaluations of the included studies for risk of bias are summarised in Table 3.12. Both studies
were considered at high risk of selection bias due to disparities between their respective AIS

68
and control groups. Control participants in Wiener-Vacher et al [61] had a different age profile
to AIS participants. In the study by Pollak et al [62], the proportion of female control
participants was far lower than their corresponding AIS group. Wiener-Vacher et al was also at
high risk of reporting bias due to failure to report the results of certain parameters. Both
groups were at uncertain risk of bias for most other domains due to lack of reporting of key
information.
(iii) Results
The two included studies used different methodologies for evaluating otolith function and
measured different parameters (Table 3.7). Therefore, the results of these will be discussed
separately.
Wiener-Vacher et al [61] evaluated asymmetry in otolith function using the off-vertical axis
rotation (OVAR) test. Differences between both horizontal and vertical eye movement velocity
obtained by clockwise and counterclockwise rotation were measured by electro-oculography,
and directional preponderance was calculated for both horizontal and vertical components of
eye direction. They reported a statistically significant difference between AIS and control
participants for absolute horizontal directional preponderance (MD 0.68 degrees/sec, 95% CI
0.26 to 1.10, p=0.004) with AIS participants on average having a greater difference in
horizontal eye movement velocity when rotated in one direction than the other. In contrast,
they did not observe a statistically significant difference in directional preponderance for
vertical eye movement velocity (MD 0.08, 95% CI -0.48 to 0.64). No association was reported
between these results and the magnitude or direction of the spinal curve. The authors went on
to state that AIS participants had a greater frequency of higher directional preponderance
results although no statistical analysis was performed to determine if this difference was
statistically significant.
Pollak et al [62] used cervical vestibular-evoked myogenic potential (VEMP) testing to evaluate
otolith function. This procedure involves recording cervical muscle reflex activity following
auditory stimulation, a process facilitated by the otolith system. Latencies of the first positive
(P13) and negative (N23) wave were recorded along with amplitude, and an amplitude
asymmetry ratio was calculated to evaluate side-to-side differences. The authors reported no
between group differences in P13 latency or amplitude asymmetry ratios. A statistically

69
significant difference in mean N23 wave latency (MD 1.9 ms, 95% CI 0.43 to 3.37, p<0.05) and
mean wave amplitude (MD 23.2 microV, 95% CI 1.75 to 44.65, p<0.05) was reported between
AIS and control participants, with AIS participants recording longer latencies and larger
amplitudes. No within group differences were observed for side-to-side differences for either
group. The authors concluded that some between group differences were apparent indicating
possible vestibular abnormalities in AIS participants.
3.2.6.4 Summary
The six studies of vestibular function included in this review have used a variety of
methodologies. These have involved only two studies for each methodology type, been poorly
reported and consequently of uncertain to high risk of bias. All of the six studies have involved
very small sample sizes with only one study containing a group exceeding 30 participants
[Pialasse et al].
To summarise:
One study of rotatory stimulation of SCC reported reduced duration of nystagmus
response in AIS participants compared to controls with no differences in other
measured parameters. A second study reported no differences in any measured
parameter following caloric stimulation of the SCC.
Meta-analysis of two studies that evaluated VOR revealed no difference in VOR gain for
combined and right rotation tasks, and a small difference for the left rotation task that
bordered on statistical insignificance.
One study that used off-vertical rotation to evaluate otolith function reported greater
side-to-side asymmetry in response for AIS participants as evidenced by a higher
horizontal directional preponderance, but no difference in vertical asymmetry between
groups. A second study that evaluated cervical muscle reflex activity following otolith
stimulation reported no differences between or within groups for the majority of
measured parameters.

70
The studies included in this review have reported small and inconsistent differences in various
measures but overall, the majority of evidence suggests no major differences between AIS and
control participants in vestibular function. The small body of evidence that does exist is, in the
main, poorly reported and involves very small sample sizes, therefore it is likely that further
research will have an important impact on the current evidence base and may lead to a change
in this evaluation.
3.2.7 Brain testing
A number of studies have utilised different methods to assess cortical function in AIS. These
included electroencephalograms (EEG), transcranial magnetic stimulation (TMS), and testing of
somatosensory-evoked potentials (SEP). These will be reviewed separately in the following
sections.
3.2.7.1 Somatosensory-evoked potentials (SEP)
SEPs are used to assess somatosensory system function and can identify sensory abnormalities
at the spinal and cortical level. Seven studies that tested SEPs in AIS and control participants
were identified. Three studies were excluded due to insufficient information to make an
accurate comparison [63-65]. One was excluded because the ages of the control group and AIS
participants were not sufficiently similar to make a fair comparison - all controls were 12 yrs
old whereas AIS participants ranged from 10-20yrs [66]. The ratio of female: male participants
was also very different between the two groups.
(i) Characteristics of included studies
Summaries of the included studies are provided in Table 3.8. Studies were conducted in the
USA [67], Spain [68] and Hong Kong [69]. Sample sizes ranged from 12 to 91 AIS and 12 to 49
control participants. The age of the participants was similar between studies ranging from 14.4
to 15.4yrs. All studies matched groups by age with further matching by height, sex and ethnic
origin in two studies [67, 68]. Details of the ratio of female:male participants were not
reported by one study [67] and one study only included female participants [69]. Fernandez-
Bermejo et al [68] reported a difference in the proportion of females between groups with 54%
and 77% in the control and AIS group respectively.

71
Amongst AIS participants, the mean Cobb angle was similar in two studies ranging between 36
[67] and 38.5 [69] degrees. The third study did not report the mean Cobb angle but stated that
65% of AIS participants had angles between 10-19 degrees with the remaining 35% between
20-35 degrees [68]. Reporting of curve types and direction was inconsistent with one study not
reporting on this category at all [67], one reporting only location but not direction [68] and the
third providing details of both, indicating a predominance of right thoracic curves. One study
stated that none of the AIS participants had undergone spinal correction surgery [68]. The
other two studies provided no details in this regard [67, 69].
(ii) Risk of bias assessment
Evaluations of the included studies for risk of bias are summarised in Table 3.12. All included
studies were deemed to be at uncertain risk of bias overall. Brinker et al [67] was judged at low
risk of classification, measurement and reporting bias but at uncertain risk of selection bias due
to insufficient information regarding AIS and control participants. Fernandez-Bermejo et al [68]
was at uncertain risk across all categories of selection, classification, measurement and
reporting biases due to lack of relevant information, whereas Chau et al [69] was at low risk of
selection and classification bias but at uncertain risk of measurement and reporting bias as
they did not provide complete details of assessor blinding and data collection procedures.
(iii) Results
Included studies either reported on conduction velocity or conduction time following
peripheral nerve stimulation. Due to the difference in outcome measures, they were reviewed
separately.
SEP velocity - Brinker et al [67] evaluated conduction velocity at the spinal and cortical levels
following stimulation of the posterior tibial and median nerves respectively. Results from both
tests suggested no differences between AIS and control participants and no indication of any
asymmetry between left and right sides (Spinal combined sides: MD -3.1 m/sec, 95% CI -9.51 to
3.31; cortical combined: MD 3.8 m/sec, 95% CI -0.08 to 7.68).
SEP conduction time - Two studies reported SEP conduction time following stimulation of the
posterior tibial nerve [68, 69]. Fernandez-Bermejo et al [68] reported results at the both the
spinal and cortical level whereas Chau et al [69] only reported on cortical conduction times.

72
At the spinal level, no differences were reported between AIS and control participants for
measurements at T12 and L3 (T12: MD 0.13 ms, 95% CI -0.54 to 0.8; L3: MD 0.14 ms, 95% CI -
0.51 to 0.79) [68].
The results of two studies that evaluated cortical SEPs were combined in a meta-analysis [68,
69] and forest plots displayed in Figure 3.12a and b. The two plots are for the first positive
(P37) and negative (N45) components of the SEP which normally occur around 37 and 45ms
post-stimulus respectively. These indicate that there is no difference between AIS and control
participants in SEP conduction time (P37: MD 0.35 ms, 95% CI -0.33 to 1.02, n=220; N45: MD
0.36 ms, 95% CI -0.33 to 1.05, n=220).
Figure 3.12 Forest plots for cortical SEP conduction time (ms)
a) P37
b) N45
3.2.7.2 Transcranial magnetic stimulation (TMS)
Two studies were identified that used TMS to investigate the motor cortex in AIS and control
participants.
(i) Characteristics of included studies
Summaries of the included studies are provided in Table 3.8. Studies were conducted in Greece
[70] and Spain [71] with sample sizes ranging from 9 to 43 AIS and 8 to 31 control participants.

73
The age of the participants was similar between studies (mean AIS group: 13yrs and 14.3yrs;
mean control group: 12yrs and 14.0yrs) with Domenech et al [71] matching AIS and control
participants by age. One study included female participants only [70] while the other provided
no details regarding sex of the participants [71].
One study included AIS participants with right sided curves and Cobb angles between 20-40
degrees [70]. In contrast, AIS participants in Domenech et al [71] had right sided curves with
Cobb angles ranging from 43 to 68 degrees (mean Cobb 47 degrees). All of these were in the
thoracic region whereas Kimikidis et al [70] did not specify curve location in their report.
Kimikidis et al also did not describe whether any of the AIS participants had undergone
treatment, whereas 1 participant in Domenech et al had received surgery and 7 used braces.
(ii) Risk of bias assessment
Evaluations of the included studies for risk of bias are summarised in Table 3.12. One study was
at uncertain risk of selection, classification and measurement bias due to poor reporting of key
domains, and at high risk of reporting bias due to a failure to report all outcomes fully [70]. The
other study was at low risk of classification bias and uncertain risk of selection and
measurement bias. They were also at high risk of reporting bias as they failed to provide results
from all measures undertaken [71].
(iii) Results
Although the two included studies used TMS to assess the motor system, they used different
testing procedures and evaluated different outcomes. Therefore, the results of each will be
discussed separately.
The primary objective of Kimiskidis et al [70] was to investigate whether cerebral asymmetries
are implicated in AIS by recording EMG responses in the upper and lower limb following TMS
stimulation of the motor cortex (Table 3.8). Parameters investigated included corticomotor
thresholds, cortex-to-muscle latency, and wave characteristics including amplitudes. Measures
were conducted unilaterally to allow side-to-side comparisons. Their results suggested no
statistically significant differences, either side-to-side or combined, between AIS and control
participants for any measured upper or lower limb parameters. Note that the results of
measures were inconsistently reported across both upper and lower limb.

74
Domenech et al [71] investigated motor cortico-cortical excitability by measuring motor-
evoked potentials (MEP) in the upper limb following conditioning and test stimuli at various
interstimulus intervals using paired-pulse TMS. Short interstimulus intervals result in inhibition
of MEPs and lower amplitudes whereas longer intervals facilitate MEPS and result in larger
amplitudes. The authors did not report comparisons between AIS and control participants for
combined left and right hemisphere stimulation. These were performed for this review using
the available study data, the results of which suggest no overall differences on average
between AIS and control participants (MD 51.92, 95% CI -6.1to 110). In contrast, when
interstimulus intervals were sub-grouped into short intervals of 1-6ms characteristic of
intracortical inhibition (SICI), and long intervals of 8-20ms (intracortical facilitation, ICF),
statistically significant differences were calculated, with AIS participants recording larger
amplitudes than control participants for both SICI and ICF interstimulus interval groups (SICI:
MD 46.9, 95% CI 3.5 to 90.3; ICF: MD 58.2, 95% CI 3.6 to 112.8).
The authors did report statistically significant differences between AIS and control participants
in MEP amplitude following left cerebral hemisphere stimulation (Table 3.8), with mean
amplitudes for AIS participants greater than control participants for combined interstimulus
intervals (AIS left combined: mean 149.5, SD 48.9; control left combined: mean 73.7, SD 39.4,
p=0.02; MD 75.8, 95% CI 33.8 to 117.8) and SICI and ICF interstimulus interval groups. They
reported no statistically significant between-group differences following right hemisphere
stimulation.
Combined with their reporting of statistically significant side-to-side within-group differences
in AIS participants (but not controls), the authors concluded that this demonstrated significant
hemispheric asymmetry of cortical excitability in AIS participants. However, summary statistics
were not provided for within-group analyses and reanalysis of the data for this review revealed
that there were no side-to-side differences for overall (MD 48.9, 95% CI -10.5 to 108.4, n=9)
and SICI intervals (MD 44.1, 95% CI -3.9 to 92.2) in AIS participants. The only significant
differences were for ICF intervals (MD 55.0, 95% CI 3.6 to 106.4, n=9).
3.2.7.3 Electroencephalograms
Four studies were identified that used electroencephalograms (EEG) to assess brain function in
AIS and control participants. Three of these were excluded: two studies used an inappropriate

75
control group (a cohort from >10 years previously) [23, 72], and in one study, over 50% of AIS
participants had undergone spinal correction surgery [73].
(i) Characteristics of included studies
A summary of the included study is provided in Table 3.8. The one included study [74] was
conducted in Greece and included 67 AIS and 42 age-matched control participants aged
between 11-16yrs (AIS: mean 14yrs SD 0.7; controls: mean 14.1yrs SD 1.0). However, the
proportion of females was different between the AIS (76%) and control (48%) groups. No
details were provided of the curve types amongst AIS participants. 51% of AIS participants had
mild curves (10-15 degrees) and the remaining 49% had curves of greater than 15 degrees
although no information was provided regarding whether they were moderate or major.
(ii) Risk of bias assessment
Evaluation of the included study for risk of bias is summarised in Table 3.12. The one included
study [74] was judged as at uncertain risk of bias across all key domains due to insufficient
information.
(iii) Results
Qualitative evaluation of EEG recordings were made and results were categorised as normal or
abnormal. A similar process was undertaken for EEGs following a provocation test. Dretakis et
al [74] reported that a greater proportion of AIS participants had abnormal EEG recordings
compared to control participants and this difference was statistically significant (AIS: 33%
(22/67); controls 14% (6/42), p<0.005). Similar results were reported following provocation
tests (AIS: 57% (38/67); controls: 22% (9/45), p<0.001).
3.2.7.4 Summary
The studies of brain function included in this review have used a variety of methodologies to
investigate the motor and somatosensory systems due to suggestions that AIS may be the
expression of a sub-clinical disorder of the CNS. These have generally involved only one or two
studies for each methodology type, been poorly reported and consequently of uncertain to
high risk of bias, and three of the seven studies have involved very small sample sizes (≤12 in
each group).

76
To summarise:
One study of overall brain function using EEG concluded that AIS participants display a
greater frequency of EEG abnormalities than non-scoliotic controls.
Three studies of the somatosensory system using SEP suggest that there are no
significant sensory abnormalities in people with AIS.
Two studies that examined the motor cortex with TMS had conflicting results with one
study with a larger sample size concluding there were no differences between AIS and
control participants; the other study reported some differences between AIS and
control participants but failed to report other comparisons that revealed no difference,
and made errors with other analyses which, after re-analysis for this review, also
provided results that suggested little to no cortical asymmetry within AIS participants.
The very small sample size (17 in total) and consequent large variation (demonstrated
by the wide confidence intervals), also call into question the validity of their results.
Therefore, it remains uncertain whether there are any alterations in brain function associated
with AIS based on the results of the included studies. Further research is likely to have an
important impact on the evidence base and may lead to a change in this evaluation.
3.2.8 Other
Three studies assessed other forms of neurophysiological measures in AIS and control
participants. Two of these were excluded due to insufficient reporting of data [75, 76]. One
study evaluated a non-spinal perceptual system using dichotic listening [77].
(i) Characteristics of included studies
A summary of the included study [77] is provided in Table 3.9. It was conducted in Ireland with
a sample size of 31 AIS and 20 control participants, each group predominantly female. The age
of the participants was similar between groups with mean ages ranging from 14.1yrs to
14.5yrs. No matching of AIS and control participants was reported.

77
Curve severity ranged from 11-68 degrees and included both directions and all curve locations.
No details as to current or previous treatment of AIS participants were provided.
Dichotic listening involves simultaneous presentation of separate words or sounds to each ear.
Subjects generally only consciously perceive one of the word-pairs. The difference in attention
to left or right stimuli indicates the degree of lateralisation of the brain areas related to speech
perception, which in this study, was considered a proxy for asymmetrical organisation of the
perceptual system as a whole.
(ii) Risk of bias assessment
Goldberg et al [77] was considered to be at low risk of selection bias and at uncertain risk of
classification, measurement and reporting bias (Table 3.12).
(iii) Results
The results of the dichotic listening test were summarised using an asymmetry index where
zero is equivalent to perfect symmetry and 1 indicates complete asymmetry (i.e. recognition of
words presented to only of the ears). A statistically significant difference was reported
between groups suggesting that AIS participants displayed greater asymmetry in speech
perception than control participants (AIS: mean 0.43, SD 0.22; controls: 0.30, SD 0.20, between
mean difference 0.13, 95% CI 0.01 to 0.25, p=0.035). No analysis was performed to test
whether this was associated with the severity or direction of the spinal curve.
(iv) Summary
The results of one study suggest that greater asymmetry of speech perception is found in
people with AIS compared to people without AIS. This study has not been repeated to date,
has a relatively small sample size, and is at uncertain risk of bias. The validity of the assumption
that asymmetry in speech perception is an indicator of asymmetry in the perceptual and
cortical system as a whole is also unclear. Therefore, the results of this study should be
interpreted with caution and further research is likely to have a substantial impact on the
evidence base.

78
3.3 Discussion
The aim of this systematic review was to establish whether there were any neurophysiological
differences between people with AIS and people without AIS. If present, they may provide
evidence indicating potential alterations in body schema in people with AIS and provide some
rationale as to how an altered body schema may be involved in the development of AIS.
Seven main areas were identified in the literature, each of which were evaluated and where
possible meta-anlayses conducted. The results for these suggest the following:
Balance - the results of meta-analyses suggest there is some evidence that people with AIS
have poorer static standing balance than people without AIS, although this applied to eyes
open condition only. Other measures of balance revealed inconsistent results.
Proprioception - there were inconsistent findings from two studies with one providing some
evidence of reduced proprioception in the knee in people with AIS and a second study
reporting no difference in testing of the neck.
Vibration testing - the result of meta-analyses of 3 studies suggest some evidence to suggest
that people with IAS have lower vibration detection thresholds than people without AIS.
Perception of vertical - the result of meta-analyses of 2 studies suggested no differences
between AIS and control participants although one study provided some evidence for poorer
subjective postural alignment in people with AIS when tested with eyes closed.
Vestibular function - two studies each of SCC and otolith function produced inconsistent results
and meta-analyses of VOR activity suggested no differences between people with AIS and
people without AIS.
Brain function - meta-analyses of 2 studies of SEP suggested no difference between AIS and
control participants; 2 studies of TMS produced inconsistent results and 1 study of EEG
provided some evidence to suggest that there is a greater frequency of abnormal EEGs in
people with AIS compared to people without AIS.
Other - one study of a non-spinal perceptual system reported significant asymmetry in speech
perception in people with AIS although it is not clear of the relevance of these findings to AIS.

79
Looking at these results overall, the evidence regarding neurophysiological deficits in AIS is
very limited and does not offer any definitive conclusion as to their presence or not. Apart
from balance, there were generally few studies informing each subject area of the review. Even
when more than one study was available, the differences in measured outcomes and
methodologies made it very difficult to compare results and conduct meta-analyses, and
resulted in significant clinical and statistical heterogeneity. Differences that were reported
were often small and of uncertain clinical significance. Very poor reporting across most studies
led to almost universal uncertainty in risk of bias and further reduced confidence in study
findings. The majority of studies also involved very small sample sizes and it was often not clear
whether AIS and control participants were representative of their respective populations, nor
whether they were appropriately matched. All these limitations resulted in uncertainty as to
whether the studies were powered sufficiently and conducted well enough to be able to detect
any differences.
3.3.1 Previous reviews
Three previous reviews examined some of the areas covered in this systematic review.
Catanzariti et al [78] conducted a systematic review of studies of vestibular function and SVV in
people with AIS. Their findings of inconsistency in study results were similar to those of this
current review, with the authors concluding that there was not enough evidence to determine
any association between vestibular dysfunction and AIS. It should be noted that they did not
attempt any meta-analyses.
Dufvenberg et al [79] conducted a systematic literature review and meta-analysis of studies of
postural stability in people with AIS. Their results are consistent with the balance findings of
this review with moderate evidence suggesting that people with AIS demonstrate poorer static
standing balance than controls.
An earlier review by Schlosser et al [6] conducted a best-evidence synthesis of studies of
abnormalities associated with AIS, including SEP and dynamic balance. They concluded that
there was weak evidence for asymmetry of SEP and moderate evidence of poorer balance
control in people with AIS compared to people without AIS.

80
3.3.2 Limitations
Although this review followed the PRISMA guidelines [1] there were a number of limitations.
Only studies in English or with an English translation were included. The grey literature was not
explored and the small number of studies involved meant that it was not possible to
investigate potential publication bias or bias due to missing results. Previously mentioned
limitations with the included studies prevented meta-analysis of many outcomes and reduced
the strength of any findings.
3.3.3 Summary
This review found some evidence that static standing balance control is reduced in people with
AIS. Inconsistency of results and limitations of included studies resulted in no definitive
conclusions regarding the presence of other neurophysiological deficits. Well conducted and
well reported studies using an agreed set of common outcomes for each area of study, along
with greater care in selecting and matching case and control participants, are required to make
definitive conclusions about neurophysiological abnormalities in AIS. As it is likely that any
differences that occur in people with AIS are likely to be very small and sub-clinical in nature, it
is important that any testing methodology is well designed and sensitive enough to detect
small differences, and that sufficient sample sizes are used to be able to provide sufficient
power to produce results with any level of confidence.
The findings of this review have implications for the role of body schema in AIS. It weakens the
argument that altered body schema plays a role in the development of AIS as no definitive
findings of deficits in neurophysiological function relevant to body schema have been
identified to date in AIS. This does not prove that these deficits do not exist, just as a causal
effect would not be established if the findings of this review had encountered evidence linking
body schema and AIS, due to the studies involved being observational in nature. However, it
also highlights the lack of well conducted and well reported studies examining this area of
study and paves the way for further research to improve the current evidence base.

81
Table 3.3 Summary of findings - Balance
study group n age (yrs)sex
(F:M)
Cobb
(degrees)
curve
type(s)
prior
treatmentother description
n
(analysed)result authors' conclusion
AIS 3112.9 (2),
range 9-1631:0
24.6 (11.5),
range 7-55? ? - 31
a
1. 158 (78.8), 2. 9.4
(4.1), 3. 13.4 (11.6). 4.
44.2 (46.9), 5a. 82
(49.9), 5b. 80.6 (49.4)
control 2311.3 (2.4),
range 7-1523:0 NA NA NA - 23a
1. 168 (77.2), 2. 11.7
(4.1), 3. 21 (17.4), 4.
53 (53.8), 5a. 95 (52),
5b. 83 (48)
AIS 9112.6 (1.5),
range 9-1691:0
23.2 (10.9),
range 5-57
40 R, 11 L,
21 double,
19 ?
observation,
bracing,
electrical
stimulation
risser sign
1.6 (1.6),
tanner stage
3.4,
menarche
52%
91
1a. 6.0 (0.2), 1b. 6.8
(0.2)*, 2a. 13.6 (0.4),
2b. 19.4 (0.5)
control 5712.6 (1.5),
range 9-1657:0 NA NA NA age matched 57
1a. 6.2 (0.2), 1b. 7.6
(0.3)*, 2a. 14.1 (0.5),
2b. 20.3 (0.6)
AIS 3016.6 (3.8),
range 11-2128:2
range 22-
67
King type
I: 8, II: 11,
III: 4, IV:
3, V: 4
untreated - 30a
1a. 765 (419)*, 1b.
791 (425)*, 2a. 17
(6.8)*, 2b. 18 (7.4)*,
3a. 25.9 (13.2), 3b.
26.3 (15.7), 4a. 9.3
(3.9)*, 4b. 8.9 (2.7)
control 1516.8 (3.1)
range 14-2013:2 NA NA NA - 15
a
1a. 447 (98)*, 1b. 558
(215)*, 2a. 13.4 (5.1)*,
2b. 12.2 (3.8)*, 3a.
20.4 (4.2), 3b. 23.2
(7.1), 4a. 7.3 (2.7)*,
4b. 8.1 (3.1)
AIS 43 12.5 (1.7) 43:029 (12),
range 7-52
39 RT, 2
RTL, 2 RL
no active
treatment- 43
a a. 27.4 (15.4)*, b.
21.8 (13.4)*
control 38 12.9 (2) 38:0 NA NA NA - 38a a. 19.0 (12.4)*, b.
13.7 (8.4)*
AIS 14 14 (2.1) 12:2 range 5-35
King type
I: 4, II: 6,
III: 4
no surgery - 14a
a. 0.13 (0.01)*, b.
2.73 (1.1)*, c. 1.89
(0.69)*
control 12 13.7 (1.8) 8:4 NA NA NA age matched 12a
a. 0.43 (0.46)*, b.
4.18 (2.6)*, c. 3.05
(1.57)*
AIS 105 range 11-14 105:0range 10-
35? ? - 105
a. 0.98 (0.03), b. 0.76
(0.13), c. 0.52 (0.19)
control 57 range 11-14 57:0 NA NA NA - 57a. 0.98 (0.02), b. 0.77
(0.13), c. 0.52 (0.17)
AIS 12 11.8 (0.8) 12:0
30.2 (9.7),
range 19-
45
12 RTbrace &
physiotherapy
Risser sign
1.4 (0.6)12a
1a. 26.8 (23.2)*, 1b.
23.4 (16.5)*, 2a. 10
(5.2)*, 2b. 9.4 (4.5)*
control 15 13.0 (0.8) ? NA NA NA - 15a
1a. 7.5 (4.3)*, 1b. 7.4
(4.3)*, 2a. 4.5 (1.6)*,
2b. 4.4 (2.1)*
all values mean (SD) unless stated
a assumed as not actually statedb data combined for this review, e.g. both limbs, both directions
c data in text and tables inconsistent
* statistically significant difference between groups
Guo et al
2006
Force plate testing
COP - Sensory
Organisation Test
(SOT), a)
somatosensory ratio;
b) visual ratio; c)
vestibular ratio
no sig diff between groups.
LT=left thoracic, RT=right thoracic, LTL=left thoracolumbar, RTL=right thoracolumbar, LL=left lumbar, RL=right lumbar
EO = eyes open; EC = eyes closed; COP = centre of pressure; COM = centre of mass
Force plate testing
COP - Quiet standing
EO, a) COP sway area
(cm2); b) COM sway
area (cm2)
The scoliotic group was
characterized by a decrease in
standing stability, as indicated
by a 44% and 60% statistically
significant increase in the COP
and COM sway area
respectively compared with
that of the able-bodied
subjects.
Bennett
et al 2004
participant characteristics observed variables
Driscoll et
al 1984
Static balance, 1)
Sharpened Romberg
(sec), 2) Beam walk
(steps), 3) Beam
stand EO (sec), 4)
Beam stand EC (sec),
5) 1 leg stand EC
(sec), a) right, b) left
No sig diff among the groups
on any of the tests. This test
battery could not distinguish
the control group from the
experimental group. No
correlation between balance
score and degree of curvature
in AIS subjects.
Force plate testing
COP - quiet sitting EC,
a) normalised sway
area (x10-3); b)
normalised sagittal
sway (x10-3); c)
normalised lateral
sway (x10-3)
The area of the 85% ellipse of
the controls was more than
three times larger than that of
the children with scoliosis (P
<0.02). The root mean square
values of the normalized COP
for the control group were
more than 50% larger in both
the ML (P<0.02) and the AP
directions (P<0.05).
Adler et al
1986
Force plate testing
COP 1) Quiet
standing (dispersion)
a) EO, b) EC; 2)
Romberg test
(dispersion), a) EO, b)
EC
with EC, AIS subjects showed
sig less postural sway on static
balance tests (p<0.05). No sig
diff for AIS subjects between
types of treatment.
Bruyneel
et al 2010
Force plate testing
dynamic balance -
seated destabilisation
task (N), 1) Sagittal
sway, a) EO, b) EC; 2)
Lateral sway, a) EO,
b) EC
The adaptive spatio-temporal
responses to destabilisation
by AIS subjects in the seated
position observed here were
characterised by an increase
in the excursion of the GRF
and an increase in the
variability of the parameters
analysed compared to
controls (p<0.001 all).
Chen et al
1998
Force plate testing
COP - Quiet standing
1) sway area (cm2), a)
EO, b) EC; 2) lateral
sway (cm), a) EO, b)
EC; 3) sagittal sway
(cm), a) EO, b) EC; 4)
sway radius (cm), a)
EO, b) EC
sagittal sway (AP direction)
was not significantly different
between normal subjects and
AIS patients for both eyes
opened and closed. However,
the difference
in lateral sway was significant.
Nault et al
2002

82
study group n age (yrs) sex Cobb curve prior other description n result authors' conclusion
AIS 2213.91 (1.54),
range 11-17?
T: 28 (9.9),
range 8-42;
L: 26.2 (9),
range 10-
45
22 double
(RT/LL)no surgery - 22a
1a. 0.95 (0.5) 1b. 3.8
(1.9)*, 1c. 0.76 (0.3)*,
2a. 3.1 (1.6)*, 2b. 9.2
(5.0)*, 2c. 2.73
(1.26)*, 3a. 2.9 (1.3)*,
3b. 9.0 (5.4)*, 3c. 2.60
control 2214.5 (1.0),
range 13-16? NA NA NA age matched 22
a
1a. 1.1 (0.3) 1b. 6.6
(2.0)*, 1c. 1.05 (0.4)*,
2a. 4.3 (1)*, 2b. 16.5
(3.7)*, 2c. 5.52 (3.1)*,
3a. 7.3 (2)*, 3b. 16.3
(1.1)*, 3c. 3.70 (1.98)*
AIS 3213.7 (2),
range 9-17?
T: 26.6
(10.5),
range 6-42;
L: 25.8
(8.7), range
10-45
32 double
(RT/LL)no surgery
Risser sign
2.3 (1.1)32
1a. 3.0 (1.3)*, 1b. 2.8
(1.2)*, 2a. 15.33
(4.66)*, 2b. 4.32
(1.15)*
control 2314.6 (1),
range 13-16? NA NA NA age matched 23
1a. 5.5 (2.3)*, 1b. 4.2
(0.3)*, 2a. 18.36 (4)*,
2b. 8.52 (3.47)*
AIS 2014.5 (2.2),
range 10-1817:3 36.4 (16) ?
no active
treatment- 20
1a. 210.4 (196.8), 1b.
648.8 (580.2), 2a.
210.4 (151.7), 2b.
648.8 (553.9)
control 2815.1 (1.7),
range 10-1818:10 NA NA NA - 28
1a. 192.7 (120.9), 1b.
558.5 (411.9), 2a.
191.3 (89.8), 2b. 567
(346.0)
AIS 36 12.5 (2) 36:0
1o: 39.5
(16.1); 2o:
31.2 (13.4);
3o: 23.6
(11.7)
2 single
curves, 15
double
curves, 19
triple
curves
18 pre-
bracing, 18
pre-surgery
- 361. 2.8 (1.1), 2. 2.9
(2.6)*, 3. 373 (40)*
control 10 11.9 (2.8) 10:0 NA NA NA - 101. 2.5 (1.2), 2. 1.7
(0.7)*, 3. 348 (38)*
AIS 128 15.4 (1.8) ? 22.3 (10.3) ? ? - 1281. 19.7 (14.3)*, 2. 12.7
(10.5)*
control 15 14.7 (1.7) ? NA NA NA - 151. 10.4 (8.5)*, 2. 2.4
(2)*
AIS 1315.7, range
12-1810:3
T: 17.9
(8.3); TL:
25.2 (9.4);
range 7-40
9 RT/LL, 4
LT/RL
no active
treatment- 13
a
1a. 21.8 (5.9), 1b.
47.5 (23.0), 1c. 145.2
(48.7)
control 1315.5, range
12-189:4 NA NA NA age matched 13a
1a. 22.6 (9.1), 1b.
49.1 (16), 1c. 159.7
(69.8)
AIS 114 14.5 (1.9) 94:20 35.7 (15.3) 114 RT ? - 114a
1a. 22.3 (9.5), 1b.
23.7 (8.7), 2a. 19.1
(10.4), 2b. 19.5 (10.4)
control 81 14.1 (1.9) 69:12 NA NA NA age matched 81a
1a. 24.1 (8.4), 1b.
24.6 (8.5), 2a. 20 (9.6),
2b. 21.2 (9.1)
all values mean (SD) unless stated
* statistically significant difference between groups
LT=left thoracic, RT=right thoracic, LTL=left thoracolumbar, RTL=right thoracolumbar, LL=left lumbar, RL=right lumbar
EO = eyes open; EC = eyes closed; COP = centre of pressure; COM = centre of massa assumed as not actually statedb data combined for this review, e.g. both limbs, both directions
c data in text and tables inconsistent
Chang et
al 2017
Force plate testing
COP - quiet standing ,
1) Sway (mm), a)
normal standing, b)
feet together, c)
tandem standing
A non-significant main effect
of group (F = 0.35, p = 0.56) on
postural stability was found.
Le Berre
et al 2017
Static balance, 1)
Sharpened Romberg
(sec), a) right, b) left;
2) 1 leg stand EC
(sec), a) right, b) left
There was no significant
difference between the two
groups regarding the static
tests (right and left Romberg
tests and right and left
unipedal stance tests).
Kinikli et
al 2011
Force plate testing
COP quiet standing,
1) Sagittal balance
indexb, a) EO, b) EC;
2) Lateral balance
indexb, a) EO, b) EC
There
was no statistical difference in
BI score between patients
with AIS and healthy controls
during eyes open and eyes
closed conditions (p>0.05).
Kuo et al
2010
Force plate testing
COP dynamic
balance, 1a) Balance
index, a) EO, b) EC, c)
sponge pad; 2)
Sagittal tilt angle
(degrees), a) EO, b)
EC, c) sponge pad; 3)
Lateral tilt angle
(degrees), a) EO, b)
EC, c) sponge pad
AIS patients achieved smaller
posture tilting angle for all
conditions (p<0.05) and a
lower balance index (ie better
balance) than normal subjects
with EC (p<0.05).
Kuo et al
2011
Force plate testing
COP dynamic
balance EO, 1a)
Sagittal tilt angle
(degrees); 1b) lateral
tilt angle (degrees); 2)
Destabilisation
(degrees), a) sagittal
tilt, b) lateral tilt
the AIS group had less tilting
angle than the control group
(P <0.05) but higher muscle
activities than normal subjects
participant characteristics observed variables
Park et al
2013
Force plate testing
COP target area
(kg/m2), 1) Sagittal
balance; 2) Lateral
balance
scoliosis groups’ left and right
lateral and forward/backward
balance was unstable
compared to the normal
group (p<0.01)
Gruber et
al 2011
Force plate testing
COP quiet standing,
1) Sagittal sway (cm);
2) Lateral sway (cm);
3) Sway area (cm2)
AIS had greater lateral sway
(p=0.025) and total sway area
(p=0.005) compared to
controls

83
Table 3.4 Summary of findings - Proprioception
Table 3.5 Summary of findings - Vibration
study group n age (yrs)sex
(F:M)
Cobb
(degrees)
curve
type(s)
prior
treatmentother description
n
(analysed)result authors' conclusion
AIS 17 mean 14.8 14:3 mean 26.8 17 RT
7 brace, 3
surgery, 7
none
- 17a 1. mean 5.1 (SD 2.5)*;
2. mean 2.6 (SD 1.8)*
control 12 ? ? NA NA NAage
matched12a 1. mean 2.7 (SD 1.5)*;
2. mean 1.4 (SD 0.6)*
AIS 30mean 15.5
(SD 1.5)?
mean 24.8
(SD 9.5)
11 RT, 13
LL or LTL, 6
RL or RTL
? - 30 mean 3.52 (SD 1.31)
control 14c mean 14.6
(SD 2.0)? NA NA NA - 12
c mean 3.30 (SD 1.72)
all values mean (SD) unless stated
* statistically significant difference between groups
c data in text and tables inconsistent
b data combined for this review, e.g. both limbs, both directions
a assumed as not actually stated
LT=left thoracic, RT=right thoracic, LTL=left thoracolumbar, RTL=right thoracolumbar, LL=left lumbar, RL=right lumbar
joint angle
reproduction - neck:
mean difference
between actual and
estimated angle
(degrees)b,c
40% (12/30) AIS subjects, error
was pathological (>4.5
degrees); significant
difference in mean error
between these and remaining
AIS (p=0.00048) and controls
(p=0.034)
Guyot
et al
2016
participant characteristics observed variables
1. Joint angle
reproduction - knee:
mean difference
between actual and
estimated angle
(degrees)b; 2. motion
detection threshold -
knee: mean distance
moved before
movement detected
(degrees)b
AIS greater error in
reproducing knee joint angle
(p<0.01) and higher knee
motion detection threshold
(p<0.05) than controls
Barrack
et al
1984
study group n age (yrs)sex
(F:M)
Cobb
(degrees)
curve
type(s)
prior
treatmentother description n (analysed) result authors' conclusion
AIS 2014.4, range
12.4 to 16.120:0
30, range
20 to 44
11 double
(RT/LL), 7
RTL, 2 RT
? -20 (40
sides)
1a. 0.27 (0.07), 1b.
0.33 (0.01), 1c. 0.27
(0.10), 1d. 0.52 (0.16);
2a. 0.06 (0.04), 2b.
0.07 (0.09), 2c. 0.05
(0.06), 2d. 0.07 (0.06)
control 2014.5, range
12.4 to 16.120:0 NA NA NA -
20 (40
sides)
1a. 0.38 (0.01), 1b.
0.48 (0.09), 1c. 0.43
(0.08), 1d. 0.67 (0.15);
2a. 0.04 (0.03), 2b.
0.03 (0.02), 2c. 0.02
(0.02), 2d. 0.08 (0.08)
AIS 5815.4, range
11.8 to 18.758:0
35, range
20-52? ? - 58
a. 0.25 (0.09), b. 0.29
(0.12), c. 0.25 (0.11)
control 5714.5, range
11.9 to 18.857:0 NA NA NA
age/sex
matched48a a. 0.30 (0.08), b. 0.37
(0.10), c. 0.34 (0.10)
AIS 14 14.6 (1.1) 14:0
35 (14),
range 15
to 56
6 RT, 3 LTL,
2 LL, 2
double
(RT/LL)
? - 14 0.76 (0.52)
control 22 13.6 (1.7) 22:0 NA NA NA - 22 0.45 (0.28)
all values mean (SD) unless stated
Participant characteristics observed variables
* statistically significant difference between groups
a 9 later suspected of scoliosis
L=left convex, R=right convex, LT=left thoracic, RT=right thoracic, LTL=left thoracolumbar, RTL=right thoracolumbar, LL=left lumbar, RL=right lumbar
all values mean (SD) unless noted
McInnes
et al
1991
Sensitivity - threshold
for vibration
detection at 1st MTP
joint (microns)
Vibratory thresholds were
significantly higher in AIS than
controls (p=0.05). No sig
asymmtery for AIS or control
group. Because of questions
regarding the reliability of the
equiment, we believe that
neither our results nor those
of Wyatt et al can be used to
support the hypothesis that a
lesion of the posterior column
is a cause of AIS.
Wyatt et
al 1986
1. Sensitivity -
threshold for
vibration detection
(microns), a) ulnar
styloid, b) great toe,
c) 1st MTP joint, d)
medial malleolus; 2.
symmetry - absolute
diff between L/R sides
(microns), a) ulnar
styloid, b) great toe,
c) 1st MTP joint, d)
medial malleolus
At all four test sites, the
scoliotics were more senstive
in ability to detect vibration,
showing significantly lower
thresholds (p<0.001). Greater
asymmetry in 2/4 test sites for
AIS than controls (p=0.007 and
0.011) - not correlated with
curve magnitude/direction.
No sig diff at other two sites.
Barrack
et al
1988
Sensitivity - threshold
for vibration
detection (microns),
a) ulnar styloid, b)
great toe, c) 1st MTP
joint
scoliotic group was more
sensitive than controls,
demonstrating significantly
lower threshold values
(p<0.001) at all test sites.
Significant asymmetry not
found in AIS compared to
controls.

84
Table 3.6 Summary of findings - Perception of vertical
study group n age (yrs)sex
(F:M)
Cobb
(degrees)curve type(s)
prior
treatmentother description
n
(analysed)result authors' conclusion
AIS 23
mean 14.5
(SD 2.5),
range 8-18
18:5
mean 21.4
(SD 8.8),
range 11-36
7 RT, 2 LT, 5
RTL, 9 LTLno surgery - 23c
1. mean 0.86 (SD
1.39)*; 2. mean 2.46
(SD 0.82)*
control 23mean 14.0
(SD 2.9)18:5 NA NA NA
age/sex
matched23
c
1. mean -0.04 (SD
0.64)*; 2. mean 1.50
(SD 0.94)*
AIS 13mean 15.65,
range 12-1810:3
mean
thoracic
17.88 (SD
8.29), mean
TL 25.18 (SD
9.44), overall
range 7 to 40
9 RT-LL, 4 LT-
RL (9 double
curve, 1 single
curve, 3 triple
curves)
no active
intervention- 13c
1.mean 76 (SD 17); 2.
mean 650.58 (SD
156.03)
control 13mean 15.54,
range 12-189:4 NA NA NA age matched 13c
1. mean 78 (SD 10); 2.
mean 626.24 (SD
115.3)
AIS 30mean 14.23
(SD 1.75)30:0
mean 31.97
(SD 12.88),
range 17-74
30 RT ? 30
1a. Mean 0.23 (SD
1.49), range -4.75 to
4.17; 1b. 0.06 (SD
2.85), range -6.5 to
6.45b; 2. 2.13 (SD
2.22)*, range -1.67 to
7.93
control 30mean 13.93
(SD 1.85)30:0 NA NA NA 30
1a. Mean -0.40 (SD
0.9), range -2.57 to
1.55; 1b. 0.18 (SD
4.23), range -9.88 to
11.88b; 2. -0.08 (SD
1.4)*, range -2.13 to
3.13
all values mean (SD) unless stated
L=left convex, R=right convex, LT=left thoracic, RT=right thoracic, LTL=left thoracolumbar, RTL=right thoracolumbar, LL=left lumbar, RL=right lumbara 10-16yr old participants onlyb data combined for this review, e.g. both limbs, both directions, age groupsc assumed as not actually stated
* statistically significant difference between groups
Cakrt et
al 2011
1. Subjective visual
vertical (SVV) -
difference between
perceived and actual
vertical (degrees); 2.
SVV variable error -
variability of
difference between
perceived and actual
vertical (degrees)
The groups differed
significantly on SVV deviation
(p < 0.01) and SVV uncertainty
(variable error) (p < 0.001).
The main finding is that
patients with IS have
abnormal SVV perception.
participant characteristics observed variables
Le Berre
et al
2019
1. Subjective visual
vertical, a) static, b)
dynamic - difference
between perceived
and actual vertical
(degrees); 2.
Subjective postural
vertical - difference
between perceived
postural vertical and
actual vertical
(degrees)
For SVV-S and SVV-D, no
significant difference between
the AIS and control group. For
SPV, difference with the
control group was very
significant: p=.00023. The
number of AIS patients with
abnormal SPV was 10-fold
that observed in controls.
matched by
age ( ±1 year),
body mass
index (±10%),
right- or left-
handedness,
and maturity
using Tanner
staging (±1)
Chang et
al 2017
1. SVV - number of
correct evaluations
(% correct) ; 2. SVV
reaction time - time
to make valid
evaluation (ms)
No main effect of group (F =
0.17, p = 0.69) on SVV
accuracy. The SVV accuracy of
the AIS group was comparable
to that of the controls. For
reaction times, no simple main
effect of
group was noted (p > 0.05).

85
Table 3.7 Summary of findings - Vestibular Function
study group n age (yrs)sex
(F:M)
Cobb
(degrees)
curve
type(s)
prior
treatmentother description
n
(analysed)result authors' conclusion
AIS 18 range 11-15 18:0 range 5 to 45
10 RT, 2
RTL, 1 LT, 4
LTL, 1 LL
? - 18
1a. 43.9 (12.5)*, range
27 to 71.2; 1b. 25%
'normal' excursionb;
1c. 27.8% 'normal'
rhythmb
control 25 range 11-15 25:0 NA NA NAage
matched25
1a. 52.0 (11.3)*, range
30 to 81; 1b. 42%
'normal' excursionb;
1c. 42% 'normal'
rhythmb
AIS 17 15.5 (1.8) 13:426.7 (8.3),
range 15-40
8 T, 4 TL, 5 L
(8 R, 6 L, 3
double)
untreated 16
a. 34 (15.6), b. 1.95
(1.8), c. 18.3 (4.1), d.
37.5% (6/16)
control 9 16.7 (1.5) 6:3 NA NA NA
recruited
from
schools
9
a. 41.8 (15.4), b. 2.03
(2.03), c. 11.6 (1.7), d.
11.1% (1/9)
AIS 10 17.4 9:1 range 28-51 RT untreated - 10a. 0.99 (0.06), b. 1.02
(0.07), c. 1.01 (0.07)
control 13 16.4 11:2 NA NA NAage
matched12
a. 1.00 (0.1), b. 1.02
(0.1), c. 1.01 (0.09)
AIS 36 15.2 (1.6) 28:8 27.9 (10.1) ?
21 brace,
6
conservati
ve
Risser sign
4.0 (1.1),
menarche
32/36
36a. 0.92 (0.03), b. 0.95
(0.05), c. 0.94 (0.04)
control 16 14.6 (2.8) 13:3 NA NA NAmenarche
15/1614
a. 0.90 (0.02), b. 0.95
(0.03), c. 0.93 (0.04)
AIS 30
12 (median
12), range
6.5-15
27:3
37.5 (median
35), range 10-
85
16 T, 5 TL, 9
L (18 R, 12
L)
? - 30a. 1.3 (1.1), b. 0.98
(1.1)
control 12
12 (median
12.5), range
11-15
10:2 NA NA NA - 12a. 0.4 (0.3), b. 0.9
(0.7)
AIS 2913.5 (2.5),
range 9-2325:4
50, range 28-
72
23 double, 6
T (27 R, 2 L)? - 29
a. 13.5 (1.5), b. 21.5
(2.3)*, c. 70.9 (38.1)*,
d. 22.5 (15.9)
control 19 ? 9:10 NA NA NAage
matched19
a. 13.1 (2.3), b. 19.6
(2.7)*, c. 47.7 (36.4)*,
d. 31.9 (19.8)
all values mean (SD) unless indicated
all values mean (SD) unless stated
* statistically significant difference between groups
b data combined for this review, e.g. both limbs, both directions, age groups
a assumed as not actually stated
VOR = vestibulo-ocular reflex; OVAR = off-vertical axis rotation
L=left convex, R=right convex, LT=left thoracic, RT=right thoracic, LTL=left thoracolumbar, RTL=right thoracolumbar, LL=left lumbar, RL=right lumbar
Jensen &
Wilson 1979
1. Southern
California
postrotatory
nystagmus test
(SCPNT), a) duration -
sum of both
directions (secs), b)
excursion category
(%), c) rhythm
category (%)
diff between AIS and controls
in postrotatory nystgamus -
duration sig decreased and
increased frequency of
abnormal excursion and
rhythm in AIS compared to
controls.
SCC
dir
ect
stim
ula
tio
nparticipant characteristics observed variables
Hitier et al
2015
Caloric tests - a)
mean eye speed
(degrees/sec), b) diff
in mean eye speed
R/L direction, c) canal
paresis (%), d)
participants with
abnormal canal
paresis (%)
no sig diff in measures (p=
0.25, 0.26 and 0.52
respectively). Higher freq AIS
had abnormal (>15%) canal
paresis but difference to
controls not statistically
significant
Wiener-
Vacher &
Mazda 1998
OVAR test - a)
difference in mean
horizontal eye speed
R/L direction
(degrees/sec), b)
difference in mean
vertical eye speed
up/down direction
(degrees/sec)
mean value of horizontal DP in
AIS sig greater than controls
(p=0.004). No sig diff in
vertical DP. Greater
proportion of AIS displayed
'abnormal' responses than
controls (66.7% 20/30 v 0/12).
VO
R t
esti
ng
Pollak et al
2013
vestibular-evoked
myogenic potentials
(VEMP)b, a) P13
latency (ms), b) N23
latency (ms), c)
amplitude (microV),
d) amplitude
asymmetry ratio
P13 latencies comparable
both groups, AIS significantly
longer N23 latencies than
controls both sides. VEMP
amplitudes significantly higher
AIS (i.e. better response) than
controls. The amplitude
Asymmetry Ratio was similar
in both groups.
Oto
lith
test
ing
Simoneau
et al 2009
VOR gain, a) Left
rotation, b) Right
rotation, c)
combined
AIS underestimated magnitude
of rotation to greater extent
than controls (p<0.05).
Pialasse et
al 2015
VOR gain, a) Left
rotation, b) Right
rotation
no main effect of Group (F(2,
47) = 0.52, p > 0.05) or
Direction (F(1, 47) = 2.2, p >
0.05); no Group by Direction
interaction (F(2, 47) = 0.73, p >
0.05).

86
Table 3.8 Summary of findings - Brain function
study group n age (yrs)sex
(F:M)
Cobb
(degrees)
curve
type(s)
prior
treatmentother description
n
(analysed)result authors' conclusion
AIS 12
14.6,
range 12
to 16.6)
?36 (6), range
30 to 52? ? - 12a
1a. 37.6 (4.9), 1b.
40.3 (4.1), 1c. 39.0
(4.7); 2a. 54.3 (4.1),
2b. 53.5 (6.5); 2c.
53.9 (5.5)
control 12
14.7,
range 12.2
to 16.4
? 0 NA NA
age, sex,
height and
race
matched
12a
1a. 41.5 (10.6), 1b.
42.6 (9.9), 1c. 42.1
(10.3) ; 2a. 50.0 (3.7),
2b. 50.1 (4.4), 2c. 50.1
(4.1)
AIS 52
14.9 (1.7),
range 13-
19
40:12
34
participants
10-19
degrees; 18
participants
20-35
degrees
9 T, 14
TL, 13
double,
12 L, 4
other
no surgery
44
participants
Risser 3-5
and/or post-
pubertal
52a
1a. 17.23 (1.43), 1b.
17.87 (1.52); 2a.
36.17 (2.17), 2b.
44.88 (2.24)
control 28
15.4 (1.6),
range 13-
19
15:13 NA NA NA
age, height,
population
origin
matched
28a
1a. 17.09 (1.42), 1b.
17.74 (1.43); 2a.
35.89 (2.18), 2b.
44.58 (2.35)
AIS 91 14.4 91:0 38.5 (20.7)
64 RT, 12
L, 15
double
? - 91a. 34.8 (2.9), b. 42.8
(2.8)
control 49 14.6 49:0 NA NA NA age matched 49a. 34.4 (2.5), b. 42.4
(2.5)
AIS 43 13 (2) 43:0 range 20-40 43 R ? - 43a
1. 40.1 (7.8), 2. 127.5
(34.9), 3a. 3.8 (0.7),
3b. 13.2 (3.1), 4a.
39.1 (2.5), 4b. 38.0
(2.8), 5a. -2.4 (1.3),
5b. -1.9 (1.3)
control 31 12 (2) 31:0 NA NA NA - 31a
1. 43.5 (7.1), 2. 130.7
(34.9), 3a. 3.7 (0.7),
3b. 13.4 (1.6), 4a.
39.0 (2.5), 4b. 37.8
(2.9), 5a. -1.9 (1.2),
5b. -1.8 (1.2)
AIS 9 14.3 (1.6) ?47, range 43-
689 RT
1 surgery, 7
brace
Risser sign
<49
1a. 149.5 (48.9)*, 1b.
100.5 (40.5), 2a. 112.6
(29.5)*, 2b. 68.5
(18.5), 3a. 195.7
(9.8)*, 3b. 140.6 (8)
control 8 14.0 (0.7) ? NA NA NA age matched 8
1a. 73.7 (39.4)*, 1b.
72.5 (40.8), 2a. 44.7
(25.3)*, 2b. 42.4
(21.8), 3a. 109.8
(12.2)*, 3b. 110.1
(20.5)
AIS 67
14.1 (1),
range 11-
16
51:16
10-15
degrees: 34,
>15 degrees:
33
? ? - 67
1a. 45/67 (67%), 1b.
22/67 (33%)*, 2a.
29/67 (43%), 2b.
38/67 (57%)*
control 42
14.5 (1),
range 11-
16
20:22 NA NA NA age-matched 22
1a. 36/42 (86%), 1b.
6/42 (14%)*, 2a.
33/42 (78%), 2b. 9/42
(22%)*
L = left convex, R = right convex, LT=left thoracic, RT=right thoracic, LTL=left thoracolumbar, RTL=right thoracolumbar, LL=left lumbar, RL=right lumbar
all values mean (SD) unless stated
* statistically significant difference between groups
b data combined for this review, e.g. both limbs, both directions
a assumed as not actually stated
TMS = transcranial magnetic stimulation; MEP = motor-evoked potential; SICI = short-interval intracortical inhibition; ICF = intracortical facilitation; CMCT = central motor conduction time
no sig diff (p>0.05) were found
between scoliotic and control
children for SSEP conduction
velocities in either the spinal
cord or proximal to the Cx
spine (centrally). No
significant asymmetry in
conduction velocities was
found in either group.
Fernandez-
Bermejo et al
1993
1. Spinal levelsb -
conduction time of
SEP following
stimulation of
posterior tibial nerve
(msec) at, a) L3, b)
T12; 2. Cortical
levelsb - conduction
time of SEP following
stimulation of
posterior tibial nerve
(msec), a) P37, b) N45
no stat sig diff observed for
any parameter when AIS
compared to controls. No
assymmetry in conduction
times for either AIS or control
groups.
Chau et al
2016
Cortical levelsb -
conduction time of
SEP following
stimulation of
posterior tibial nerve
(ms), a) P37, b) N45
Severe AIS with major right
thoracic curve and Cobb angle
of over 40 degrees showed
significant prolonged SEP
latency on the right side
compared to controls and
increased inter-side P37
latency difference compared
to moderate AIS and controls.
SEP
EEGDretakis et al
1988
participant characteristics observed variables
Brinker et al
1992
1. Spinal levels -
conduction velocity of
SEP following
stimulation of
posterior tibial nerve
(m/sec), a) Right, b)
Left, c) combined; 2.
Cortical levels -
conduction velocity of
SEP following
stimulation of median
nerve (m/sec), a)
Right, b) Left, c)
combined
1) EEG results (n, %),
a) normal, b)
abnormal; 2) EEG
results post
provocation (n, %), a)
normal, b) abnormal
Kimiskidis et
al 2007
1) Cortico-motor
thresholdb, upper
limb; 2) Silent period
(ms)b, upper limb; 3)
CMCT (ms)b, a) upper
limb, b) lower limb;
4) Cortex-muscle
latency - lower limb
(ms)b, a) rest, b)
facilitated 5) MEP
amplitude - lower
limbb, a) rest, b)
facilitated
Detailed upper limb testing
revealed normal findings.
Therefore, our results do not
support the concept of a
generalized brain asymmetry
in IS or the existence of
pathological alterations in the
corticospinal tracts to upper
limbs.
TMS
results show that scoliotic
children had sig greater
incidence of abnormal EEGS
compared to controls (p<0.05;
provoked p<0.001).
Domenech et
al 2010
Cortical excitability -
TMS induced MEP
abductor pollicis
brevis (% baseline test
stimuli), 1) Overall, a)
Left hemisphere; b)
Right hemisphere; 2)
SICI, a) Left
hemisphere, b) Right
hemisphere; 3) ICF,
a) Left, b) Right
AIS greater MEP amplitude
post-left hemispheric
stimulation compared to
controls (p=0.02). Right
hemisphere, IS slight increase
all ISI potentials but no
statistical significance
(p=0.06). SICI left hemisphere
significantly greater AIS than
controls. SICI right hemisphere
greater in AIS than controls,
but no statistical significance.
ICF larger left hemisphere AIS
as compared to controls.
Right ICF greater AIS but this
no statistical significance.

87
Table 3.9 Summary of findings - Other
Table 3.10 Risk of bias - Balance
study group n age (yrs)sex
(F:M)
Cobb
(degrees)
curve
type(s)
prior
treatmentother description
n
(analysedresult authors' conclusion
AIS 31
14.5
(1.8),
range
11-18
29:2
31.0
(13.8),
range 11-
68
23 RT, 2
LT, 1 RTL,
4 LTL, 1
LL
? - 31 0.43 (0.22)*
control 20
14.1
(2.4),
range
11-20
19:1 NA NA NA - 20 0.30 (0.20)*
all values mean (SD) unless stated
* statistically significant difference between groups
particicpant characteristics observed variables
LT=left thoracic, RT=right thoracic, LTL=left thoracolumbar, RTL=right thoracolumbar, LL=left lumbar, RL=right lumbar
Goldberg
et al
1995
Dichotic listening test
- asymmetry index
the results demonstrate
greater asymmetrical cortical
function (in this case,
cognitive linguistic function) in
AIS compared to controls
(p=0.035) suggesting
asymmetry of cortical
structures and
interconnections
criteria
Adl
er e
t al
1986
Che
n e
t al
1998
Nau
lt e
t al
2002
Kini
kli e
t al
2011
Gru
ber
et a
l
2011
Cha
ng e
t al
2017
Park
et
al
2013
Kuo
et
al
2010
Guo
et
al
2006
Ben
nett
et
al 2
004
Dri
sco
ll et
al 1
984
Le B
erre
et
al 2
017
Bru
ynee
l et
al 2
010
Kuo
et
al
2011
are cases clearly defined and
representative?✓ ✓ ✓ ? ✓ ✓ ? ? ? ✓ ? ? ✓ ?
are controls representative of
general adolescent population, and
comparable to cases?✓ ? ? ? ? ✓ ? ? ? ? ? ? ? ?
Were the same incl/exclusion criteria
used for AIS and healthy adolescents?? ? ? ✓ ? ? ? ? ✓ ? ? ✓ ? ?
clearly established that controls are
non-cases (as well as possible)?✓ ? ? ✓ ? ? ? ✓ ✓ ? ✓ ? ? ✓
Was other pathology excluded that
possibly influences the outcome?? ? ? ✓ ✓ ? ? ✓ ✓ ? ? ✓ ? ✓
Was the data collection performed in
the same standardized way for AIS
cases and healthy adolescents?? ? ✓ ✓ ✓ ? ✓ ✓ ✓ ? ✓ ✓ ✓ ✓
Were the observers blinded to
AIS/healthy adolescent status?? ? ? ? ? ? ? ? ? ? ✓ ? X ?
Free of selective reporting of
outcomes?✓ ✓ ✓ ✓ ✓ ✓ ✓ ✓ ✓ ✓ ✓ ✓ ✓ ✓
Potential confounders identified and
taken into account?? ? ? ? ? ? ? ? ? ? ? ? ? ?
Risk of Bias verdict: unclear unclear unclear unclear unclear unclear unclear unclear unclear unclear unclear unclear high risk unclear
Balance

88
Table 3.11 Risk of bias - Proprioception, Vibration Threshold and Perception of Vertical
criteria
Bar
rack
et
al 1
98
4
Gu
yot
et a
l
20
16
Wya
tt e
t al
19
86
Bar
rack
et
al 1
98
8
McI
nn
es e
t
al 1
99
1
Ch
eun
g et
al 2
00
2
Cak
rt e
t al
20
11
Ch
ang
et a
l
20
17
Le B
erre
et
al 2
01
9
are cases clearly defined and
representative?? ✓ ? ? ? ? ✓ ✓ ?
are controls representative of
general adolescent population, and
comparable to cases?? ? ? ? ? ? ✓ ✓ ?
Were the same incl/exclusion criteria
used for AIS and healthy adolescents?? ✓ ? ? ? ? ? ? ✓
clearly established that controls are
non-cases (as well as possible)?? ✓ ✓ ✓ ✓ ? ✓ ? ✓
Was other pathology excluded that
possibly influences the outcome?? ✓ ? ? ✓ ✓ ✓ ? ✓
Was the data collection performed in
the same standardized way for AIS
cases and healthy adolescents?✓ ✓ ✓ ✓ ✓ ✓ ✓ ? ?
Were the observers blinded to
AIS/healthy adolescent status?? ? ? ✓ ✓ ? X ? ?
Free of selective reporting of
outcomes?✓ X ✓ ✓ ✓ ✓ ✓ ✓ ✓
Potential confounders identified and
taken into account?? ? ? ? ? ? ? ? ✓
Risk of Bias verdict: unclear unclear unclear unclear unclear unclearhigh
riskunclear
high
risk
Perception of verticalProprioception Vibration threshold

89
Table 3.12 Risk of bias - Vestibular function, Brain function and Other
EEG other
criteria
Jen
sen
&
Wils
on
19
79
Hit
ier
et a
l
20
15
Sim
on
eau
et a
l 20
09
Pia
lass
e et
al 2
01
5
Wie
ner
-
Vac
her
et
al
19
98
Po
llak
et a
l
20
13
Bri
nke
r et
al
19
92
Fern
and
ez-
Ber
mej
o e
t
al 1
99
3
Ch
au e
t al
20
16
Kim
ikid
is e
t
al 2
00
7
Do
men
ech
et a
l 20
10
Dre
taki
s et
al 1
98
8
Go
ldb
erg
et
al 1
99
5
are cases clearly defined and
representative?? ✓ ? ✓ ✓ ? ? ✓ ✓ ? ✓ ? ✓
are controls representative of
general adolescent population, and
comparable to cases?? ? ? ? X X ? ? ✓ ? ? ? ✓
Were the same incl/exclusion criteria
used for AIS and healthy adolescents?✓ ✓ ? ? ✓ ? ? ? ? ? ? ? ?
clearly established that controls are
non-cases (as well as possible)?✓ ✓ ? ? ? ? ✓ ? ✓ ? ✓ ? ✓
Was other pathology excluded that
possibly influences the outcome?✓ ✓ ✓ ? ✓ ? ✓ ✓ ✓ ? ✓ ? ?
Was the data collection performed in
the same standardized way for AIS
cases and healthy adolescents?✓ ? ✓ ✓ ✓ ? ✓ ? ? ? ? ? ?
Were the observers blinded to
AIS/healthy adolescent status?? ? ? ? ? ? ✓ ? ? ? ? ✓ ?
Free of selective reporting of
outcomes?✓ ✓ ✓ ✓ X ✓ ✓ ? ✓ X X ✓ ✓
Potential confounders identified and
taken into account?? ? ? ? ? ? ✓ ? ? ? ? ? ?
Risk of Bias verdict: unclear unclear unclear unclear high risk high risk unclear unclear unclear high risk high risk unclear unclear
SCC VOR Otolith SEP TMS

90
4 How to measure body schema
The previous chapter described a systematic review of neurophysiological function in people
with AIS compared to non-scoliotic controls. Some of the outcomes included in the review are
of relevance in the study of body schema. The question then becomes, how best to measure
body schema in AIS.
As described in Chapter 2, investigations of body schema in chronic pain conditions provide a
useful model for testing of body schema in scoliosis. Various methodologies have been utilised
in chronic pain conditions to describe aspects of sensorimotor performance that are thought to
be associated with body schema. These include tests of tactile acuity, left/right judgement
(laterality discrimination), spatial perception and proprioception. Some tests of these
properties involve equipment and protocols that are only possible to conduct in a laboratory-
type environment, and require extensive knowledge and experience along with appropriate
financial resources to perform testing reliably. The setting in which recruitment and testing
was conducted for the studies that form the basis of this thesis did not allow for such
sophisticated evaluations. Therefore, this chapter will describe testing methodologies that are
better suited to a clinical environment and that were able to be used to gather data on body
schema in people with AIS for the studies that contribute to this thesis.
4.1 Tactile acuity
Tactile acuity refers to the precision or accuracy in determining various properties of touch
sensation. Testing of tactile acuity has used a number of different methodologies. Two of the
most common of these include testing two point discrimination thresholds and ability to locate
the site of stimuli applied to relevant parts of the body.
4.1.1 Two point discrimination threshold testing
Two point discrimination threshold (TPDT) testing is a test of tactile spatial acuity and was
initially designed for assessing neural recovery following injury and/or surgery to the nerves of
the hand/fingers. It involves the application of two mechanical stimuli simultaneously to the
skin using calipers or similar devices (Figure 4.1). Depending on a variety of factors, the points
will either be perceived as two separate stimuli or a single stimulus. Repeated testing using

91
different distances between the two points enables the determination of a ‘threshold’ distance
- stimuli applied with a distance between them greater than the threshold will generally be
perceived as two separate stimuli, whereas if the distance is less than threshold, the brain will
not be able to distinguish accurately between them and it will be perceived as a single
stimulus. The initial premise was that the lower the threshold, the greater the level of neural
repair and potential for return of function.
Figure 4.1 Example of instrument used for TPDT testing
The threshold distance varies depending on the part of the body being tested. For example,
the lips and the hands are much more sensitive (and therefore have a lower threshold) than
the back. This is largely due to variations in the density and distribution of the touch receptors
in the skin and is also reflected in the size of the area specific to each body part in the primary
sensory cortex, illustrated by the ‘homuncular man’ of chapter 2 (Figure 2.1). As such, TPDT
also depends on the integrity of the cortical representation of the body area being tested [1].
For this reason, TPDT testing has been used not just as a measure of peripheral nerve function,
but also as a means of assessing the state of the representation of the body within the
somatosensory cortex and therefore, as a measure of body schema [2].

92
The following sections will examine the measurement properties and procedures of TPDT
testing with an emphasis on the trunk and spinal regions.
4.1.1.1 Normative values
Normative TPDT values for the spine have been reported as part of a recent reliability study by
Catley et al [3] involving 28 healthy, pain-free subjects. Mean thresholds for the neck (C7
region) and lumbar spine (L3 region) were 45.9 mm (SD 18.4) and 55.5 mm (SD 12.7)
respectively. This is in accordance with other studies that have evaluated the spine (Table 4.1)
[1, 3-12].
Table 4.1 Normative values for TPDT, mean mm (SD)
Study n (sex, age) Lumbar spine Thoracic
spine Neck
Nolan 1985 43
(26M, age 20-24yrs) 49.9(12.7) 52.2 (12.6) 55.4 (20)
Moseley 2008 10
(5M, 29-58 years) 50.1 (6.33) - -
Wand et al 2010 19
(5M, age 34 yrs SD 12.1) 44.2 (13.7) - -
Luomajoki & Moseley 2011
45 (20M, age 41 yrs SD 10)
vertical 43.2 (14.8) horizontal 45.0 (11.3)
- -
Stanton et al 2013
18 (7M, age 41 yrs SD 11)
45.28 (5.12) - -
Catley et al 2013 28
(19M, age 24.1 yrs SD 4.7) 55.5 (12.7) - 45.9 (18.4)
Elsig et al 2014 30
(5M, age 37.2 yrs SD 13.5) - - 29.75 (7.0)
Falling & Mani 2016
group I: 23 (8M, age 23 yrs SD3.4)
60.7 (17.9) - -
group II: 20 (11M, age 34.9 yrs SD 2.6)
60.05 (14.85) - -
group III: 18 (11M, age 45.5 yrs SD 3.0)
69.1 (10.14) - -
group IV: 18 (10M, age 54.2 yrs SD 2.4)
76.9 (14.21) - -
Elgueta-Cancino et al 2017
20 (9M, age 28.5 yrs SD 5)
vertical 32.5 (9.63) horizontal 51.0 (11.9)
- -
Spahr et al 2017 20 (age 39 yrs SD 9.91) 49.8 (6.5) - -
Harvie et al 2017
22 (12M, age 23.9 yrs SD 6.8)-
- - 35.2 (9.6)
93
4.1.1.2 Measurement properties
Catley et al [3] also evaluated intra- and inter-rater reliability of TPDT testing of the neck and
lumbar spine in 28 clinicians with varying levels of experience. For the neck, results indicated
good reliability for both intra- and inter-rater testing (intra: Intraclass correlation coefficient
(ICC) 0.79, 0.59-0.90 95% CI; inter: ICC 0.81, 0.63-0.91 95% CI). For the lumbar spine, the
results suggested good and moderate reliability respectively (intra: ICC 0.81, 0.63-0.91 95% CI;
inter: ICC 0.66, 0.38-0.82 95% CI). Results did not differ according to level of clinician expertise.
However, the wide confidence intervals for lumbar spine inter-rater reliability suggests that,
where possible, only one clinician should be involved in evaluating TPDT in the lower back. A
more recent study evaluated test-retest reliability in the neck region. One trained rater
assessed 22 healthy participants twice, with a 30 minute interval between tests [12]. The
results were similar those described above (ICC 0.85, 0.67 to 0.94 95% CI, p<0.001).
The minimal detectable change for the lumbar spine and neck has been calculated at 15mm
and 24mm respectively [3]. There was a large difference between repeat evaluations indicating
that TPDT testing, although reliable, is not very precise. Similar results were reported by Wand
et al [13] who calculated that a change of at least 13-17mm would be required to provide 95%
reliability of a true difference in TPDT in the lumbar spine. The same authors suggested that, in
an effort to reduce inter-subject variation when testing clinical populations, differences could
be analysed between the painful and the non-painful side in the case of unilateral conditions,
or to other adjacent non-painful body regions (e.g. contralateral side or the thoracic spine for
unilateral or bilateral CLBP respectively).
The large variability reported in these studies could be due to other factors that have been
shown to influence the threshold distance. Skin type, age, temperature, level of attention and
testing methodology have all been reported to affect testing results [3] along with increased
body mass index [9]. Frequent testing or practice may also result in a learning effect although
this appears to be short lived and require intensive repetition (e.g. [14]). Other studies
evaluating TPDT in the lumbar spine have not found evidence for either fatigue or a learning
effect under normal, less intensive testing conditions [3].

94
4.1.1.3 Testing procedures
Most studies involving TPDT testing use procedures based on those of Moberg [15] for the
hand and fingers. These have since been developed further and applied to other parts of the
body with more accurate or purpose-designed instrumentation. Currently, the standard format
for TPDT testing is to use a series of alternating ascending and descending trials, often referred
to as the ‘staircase’ method (e.g. [2]). This involves starting with a set distance between the
two points and then gradually increasing or decreasing the distance by a set amount at each
subsequent test. Variations to this include gradually reducing the size of the ‘step’ (i.e. the
change in distance between the points) between each set of trials in an attempt to more finely
pinpoint the threshold.
Despite widespread use, there have been some criticisms of this methodology. For example, it
is possible that subjects may understand the principle of the method and therefore be able to
anticipate the sequence of stimuli being applied during an ascending or descending trial,
potentially biasing their responses [16]. To this end, ‘catch’ trials are also often included. This
involves tests where just one point is used to ensure participants are not guessing. However,
these do not completely control for the potential response bias.
Peters & Schmidt [17] proposed using a different approach entirely. Rather than starting at a
set distance between the two points and then gradually increasing or decreasing by a set
distance as per standard practice, they randomised the order that each point-to-point distance
was presented, thereby eliminating the possibility of anticipation by the subject. Disguising the
true intention and the mechanics of the testing procedure from the subject is another method
of attempting to reduce response bias.
Another potential criticism of TPDT testing is that responses may also be biased when the two
points are not presented simultaneously. Even a small time gap can provide temporal cues that
allow the subject to more accurately determine that two points have been presented rather
than one. To this end, subjects are routinely instructed to inform the tester if they feel two
points as a result of them not being applied at the same time. However, it is unclear as to how
effective these instructions are in minimising this effect.
Other, more rigorous methods of testing tactile spatial acuity have been proposed to counter
the effect of temporal bias, such as the Grating Orientation Task (GOT) [18]. Although now

95
considered the gold standard, the equipment required render it impractical to use in most
clinical situations and has not been tested in the trunk or spinal regions.
A test that attempts to combine the simplicity of standard TPDT testing with the rigour of the
GOT has also been developed. The Two Point Orientation Discrimination Threshold test [19]
requires subjects to determine whether the twin points of a caliper are orientated in a vertical
or horizontal direction as opposed to distinguishing between one or two points as in traditional
TPDT testing. The threshold is thus determined by the distance at which they are unable to
distinguish the orientation thereby eliminating the possibility of temporal cues that may occur
in traditional TPDT testing when the points are not applied simultaneously. Unfortunately, the
study describing this test was published towards the end of recruitment and testing for this
thesis and thus was not utilised.
4.1.2 Localisation
To localise where the body has been touched requires knowledge of the location and
distribution of sensory receptors in the skin, anatomical knowledge (e.g. body size, shape and
configuration), as well as the position of the relevant body part, both in relation to other parts
of the body and to the external environment. This involves higher-order body representations
that integrate information from multiple sensory modalities [20, 21], which matches the
definition of body schema as defined in chapter two. Therefore, localisation represents one
method of measuring the properties of body schema [21].
Tactile localisation has been investigated extensively in the hand and forearm but rarely in
other parts of the body. Typically, studies have focussed on the distance between the actual
and perceived stimulus locations, and have used specialist equipment that generally is not
practical for clinical settings [20]. Recently, two studies have used a simpler methodology to
assess the distance between perceived and actual stimulation site in the lower back and neck
regions [22, 12]
Tactile localisation has also been used as a treatment modality in chronic pain conditions such
as phantom limb pain [23], CRPS [24] and CLBP [25]. These studies have evaluated the effect of
tactile discrimination training on pain, function and cortical reorganisation with promising
results. However, few studies have investigated localisation ability as an outcome in these
conditions.

96
4.1.2.1 Normative values
In the only known study assessing tactile localisation of the back, 24 patients with CLBP were
tested along with an equal number of healthy controls [26]. The posterior surface of the trunk
and upper thigh were divided into 7 regions and a stimulus was applied twice to each of these
in random order resulting in 14 trials overall per participant (Figure 4.2). The participants were
asked to name the site of each stimulus by referring to a schematic body diagram illustrating
the site of possible stimulus locations.
Figure 4.2 Test regions for tactile localisation evaluation
(from [26])

97
Rather than measuring the distance between actual and perceived stimulus location, this
protocol measured whether participants were able to name the correct body region, with the
resulting number of errors recorded. CLBP patients were assessed on the most painful side
whereas the side for controls was randomly assigned.
Although ostensibly investigating referred sensations, data was also collected for correct and
incorrect responses. From a total of 336 trials in each group (14 trials x 24 participants), 326
correct and 10 incorrect responses were recorded for the control participants (97% correct)
versus 294 and 42 respectively for the CLBP patients (87.5% correct). They reported that 66.7%
(16/24) of CLBP patients made at least one error compared to only 25% (6/24) of control
participants (Fisher exact p=0.034). Statistics for accuracy were not provided but could be
calculated by extracting the required data from the published results. This resulted in figures
for mean accuracy per participant of 98.3% (96.8-99.7% CI 95%) and 92.7% (90-95.5% CI 95%)
for controls and CLBP patients respectively. This equated to a mean of 0.4 errors per
participant in the control group versus 1.75 in the CLBP group. The results of this trial
represent the only normative data of localisation accuracy available for the back region.
However, a study evaluating localisation accuracy in the neck has recently been conducted by
Harvie et al [12]. This study involved 12 vibrotactile stimulators applied to the skin of the neck
in a grid-like arrangement. Thirty separate stimuli were applied in random order and
participants were asked to indicate the location of each via a computer tablet with the grid-
pattern superimposed on a photo of the neck. The mean accuracy in locating the stimulated
site was 54.9% (SD 13.9) which was much less than the localisation accuracy for the back
region described above. The differences probably reflect the size of the test regions used in
each trial and therefore, the distance between stimulus locations that participants were asked
to distinguish between. In the back study, the distance between stimulation sites was very
large, whereas for the neck study, the distance between sites was small.
4.1.2.2 Measurement properties
Two studies have attempted to evaluate the reliability of localisation testing. The first was of
the forearm and used a protocol of measuring distance between perceived and actual stimulus
location [21]. This involved 10 healthy participants (7 M, mean age 26yrs, SD 3) who
underwent testing on successive days. On each occasion, seven sites were stimulated sixty
times each resulting in a total of 420 stimuli. The participant indicated the site of stimulation

98
by tapping on an image of their arm presented on a computer tablet. The authors concluded
that test-retest reliability was high based on the high level of correspondence between the
results of each days’ testing (0.68 to 0.93 ICC at each site).
Only one study has investigated reliability in the spinal region. Participants in the neck
localisation accuracy study (n=22) by Harvie et al were tested again 30 minutes after initial
assessment [12]. Test-retest results indicated good reliability although confidence intervals
were very wide (ICC 0.60, 0.25 to 0.81 95% CI, p=0.002).
A number of factors have been reported as influencing localisation ability. There are reports
that, when faced with uncertainty in determining stimulus location, participants demonstrate a
bias towards the centre of the relevant body part [20]. This effect is especially pronounced for
weak stimulus intensities. When higher intensities are used, participant responses are more
consistent and accurate [27]. It is thought that increasing the area and duration of stimulus has
a similar effect [27].
Studies of the forearm have also reported greater localisation accuracy when a stimulus is
applied nearer to body part boundaries (e.g. the elbow or wrist) [20]. Age is another factor
with reports of localisation accuracy reaching maturity at age 10 to 12 years [28]. Vision of the
affected body part, posture and direction of gaze have also been reported as influencing
localisation ability [21]. None of these factors have been investigated in the trunk or spinal
regions.
4.2 Laterality discrimination
Laterality discrimination is the ability to identify right from left sides of the body. It is usually
tested by viewing a series of images of relevant left and right-sided body parts in different
positions and orientations, and measuring the accuracy and reaction time required to make a
judgement. A correct response requires mental spatial transformation of an internal
representation of the relevant body part to correspond with the viewed image. Therefore, an
accurate and timely response is dependent on an intact body schema [29].
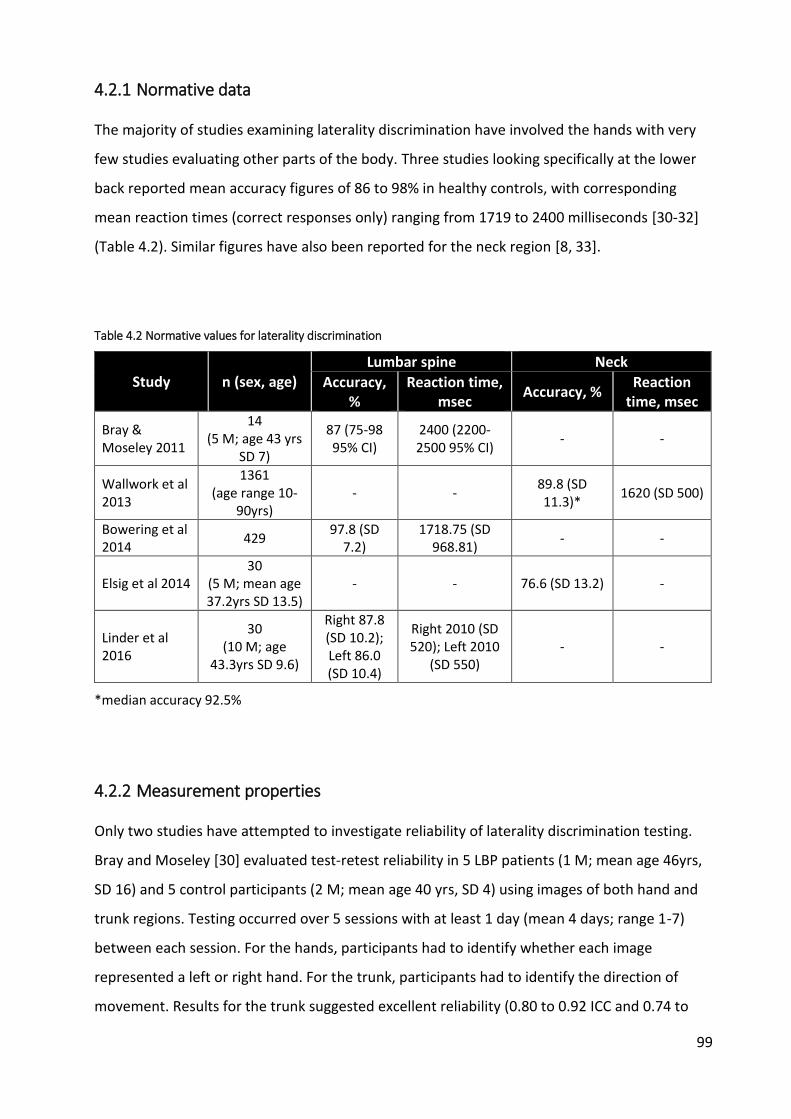
99
4.2.1 Normative data
The majority of studies examining laterality discrimination have involved the hands with very
few studies evaluating other parts of the body. Three studies looking specifically at the lower
back reported mean accuracy figures of 86 to 98% in healthy controls, with corresponding
mean reaction times (correct responses only) ranging from 1719 to 2400 milliseconds [30-32]
(Table 4.2). Similar figures have also been reported for the neck region [8, 33].
Table 4.2 Normative values for laterality discrimination
Study n (sex, age) Lumbar spine Neck
Accuracy, %
Reaction time, msec
Accuracy, % Reaction
time, msec
Bray & Moseley 2011
14 (5 M; age 43 yrs
SD 7)
87 (75-98 95% CI)
2400 (2200-2500 95% CI)
- -
Wallwork et al 2013
1361 (age range 10-
90yrs) - -
89.8 (SD 11.3)*
1620 (SD 500)
Bowering et al 2014
429 97.8 (SD
7.2) 1718.75 (SD
968.81) - -
Elsig et al 2014 30
(5 M; mean age 37.2yrs SD 13.5)
- - 76.6 (SD 13.2) -
Linder et al 2016
30 (10 M; age
43.3yrs SD 9.6)
Right 87.8 (SD 10.2); Left 86.0 (SD 10.4)
Right 2010 (SD 520); Left 2010
(SD 550) - -
*median accuracy 92.5%
4.2.2 Measurement properties
Only two studies have attempted to investigate reliability of laterality discrimination testing.
Bray and Moseley [30] evaluated test-retest reliability in 5 LBP patients (1 M; mean age 46yrs,
SD 16) and 5 control participants (2 M; mean age 40 yrs, SD 4) using images of both hand and
trunk regions. Testing occurred over 5 sessions with at least 1 day (mean 4 days; range 1-7)
between each session. For the hands, participants had to identify whether each image
represented a left or right hand. For the trunk, participants had to identify the direction of
movement. Results for the trunk suggested excellent reliability (0.80 to 0.92 ICC and 0.74 to

100
0.87 ICC for accuracy and reaction times respectively). These were similar to reliability
estimates for the hands (Table 4.3).
Linder et al [32] used a similar protocol to evaluate test-retest reliability for laterality
discrimination in the trunk and feet in LBP patients and healthy controls. Testing was
performed on 3 separate occasions, with a mean of 2.2 days (range 2-5 days) between session
1 and 2, and a mean of 2.4 days (range 1 to 11 days) between sessions 2 and 3. In general, they
reported lower estimates than Bray & Moseley [30] with fair-to-excellent reliability for reaction
times in the trunk, but only fair-to-good reliability for retesting of accuracy (0.51 to 0.91 ICC
and 0.51 to 0.71 respectively). A similar pattern was seen for reliability testing of the feet.
Both of these studies reported large variability in some of the reliability estimates, indicated by
wide 95% confidence intervals. The lower limits of some of these intervals were below
acceptable levels of reliability [34]. This may be due to the relatively low numbers of
participants included in the studies.
Table 4.3 Test-retest reliability for trunk laterality discrimination testing, ICC (95% CI)
Trunk LBP (n=5) Control (n=5) -
Accuracy 0.92 (0.83-0.97) 0.80 (0.59-0.97) -
RT 0.87 (0.73-0.95) 0.74 (0.45-0.90) -
Hands LBP (n=5) Control (n=5) -
Accuracy 0.92 (0.85-0.97) 0.87 (0.74-0.94) -
RT 0.70 (0.36-0.88) 0.95 (0.90-098) -
Trunk LBP (n=25) Control (n=27) overall (n=52)
Accuracy 0.71 (0.44-0.86) 0.59 (0.28-0.79) 0.64 (0.45-0.78)
RT 0.51 (0.15-0.75) 0.82 (0.64-0.91) 0.72 (0.56-0.83)
Feet LBP (n=24) Control (n=26) overall (n=50)
Accuracy 0.61 (0.29-0.81) 0.82 (0.54-0.89) 0.71 (0.54-0.82)
RT 0.75 (0.50-0.88) 0.85 (0.69-0.93) 0.83 (0.71-0.90)
Trunk LBP (n=22) Control (n=25) overall (n=47)
Accuracy 0.69 (0.39-0.86) 0.51 (0.15-0.75) 0.59 (0.36-0.75)
RT 0.91 (0.79-0.96) 0.81 (0.61-0.91) 0.82 (0.70-0.90)
Feet LBP (n=21) Control (n=23) overall (n=44)
Accuracy 0.77 (0.52-0.90) 0.84 (0.66-0.93) 0.90 (0.82-0.94)
RT 0.63 (0.28-0.83) 0.89 (0.77-0.95) 0.85 (0.74-0.91)
Bray & Moseley 2011
Linder et al 2016
Reliability
between
Test 1 & 2
Reliability
between
Test 2 & 3
Reliability
over all
test
sessions

101
Numerous factors have been reported as influencing laterality discrimination testing. The
magnitude of image rotation (from 0 to 180 degrees) is positively correlated with increased
reaction time and negatively correlated with accuracy. This effect has been described for the
hands (e.g. [35]), the neck [33] and the trunk [31]. The increased reaction time and reduced
accuracy is thought to reflect the extra time and difficulty required to mentally transform the
internal body representation to match that of the viewed image. This links with findings that
greater reaction times are correlated with lower accuracy in laterality discrimination [33, 35].
In contrast to previous studies that have reported improved performance when viewing
images that correspond to the dominant side [36], testing of laterality discrimination ability in
the hands [35] and feet [32] has revealed faster reaction times for images of the right
hand/foot compared to the left regardless of handedness, although there was no effect on
accuracy. Conversely, images of neck movement to the right were associated with greater
accuracy, with no effect on reaction times. This bias for right-sided image processing may
reflect an asymmetry in sensorimotor performance [33]. It has yet to be evaluated in the trunk.
In testing laterality discrimination of the neck in adults, increasing age was associated with
increased reaction times and reduced accuracy. The same study also reported increased
reaction times for female participants compared to males, and left-handers compared to right-
handers [33]. These effects of age, gender and handedness have not been found in the trunk or
lower back [31, 32].
Two studies have evaluated laterality discrimination in children and young adolescents, both
involving testing of the hands. Caeyenberghs et al [37] undertook testing in 58 healthy children
divided by age into 3 groups: 7-8, 9-10 and 11-12 years. They reported that 7-8 year olds were
significantly slower and less accurate than older age groups but that performance gradually
improved with increasing age until 11-12 years, when children reach adult levels of
performance.
Similar improvements in accuracy with increasing age were also reported in a study of 57
children (26 M; mean age 11 years, SD 3), although no effect was seen on reaction time [38].
Interestingly, compared to adults, no effect of gender was noted, nor did there appear to be
any relation between levels of sporting activity and laterality discrimination ability.

102
A learning effect has been reported for laterality discrimination. When testing was repeated in
33 healthy adults after 3 weeks, an 8-20% decrease in reaction times and a 3% increase in
accuracy was reported for a hand left/right judgement task [39]. Similarly, an improvement in
performance, particularly of reaction times, was reported for testing in the lower back [32],
with obvious connotations with regard to repeated measures over time in participants.
The posture or position of the body/trunk during testing has not been investigated as a
possible confounder in studies involving the trunk or spinal regions, although there have been
reports that resting hand position influences reaction times for left/right hand judgement tasks
[33]. This may be particularly important when considering hand position while using computers
where the participant is required to press a key on a computer keyboard to indicate left and
right sides. The most commonly used software for laterality testing allows participants to
indicate the side an image corresponds to by either using the left and right arrow keys, which
are normally situated to the right of centre, or the ‘a’ and ‘d’ keys, which are situated to the
left. There is some evidence to suggest that body representations are based on body-centred
rather than hand or limb-centred frames of reference, i.e. they are not dependent on whether
the right or left hand is used, but on whether the hands are situated in the left or right side of
the body reference frame [40]. Therefore, the location of the keys in relation to the body
midline may introduce a response bias if not controlled for.
4.3 Spatial perception
As described in Chapter 2, it is thought that a disruption or distortion of body representation
plays a role in chronic pain conditions, a process that is likely driven by cortical reorganisation
and/or disrupted sensory information. Reports of some of the resulting symptoms that occur in
these conditions bear some resemblance to those suffered by patients with hemispatial
neglect following brain injury. For example, there have been numerous reports of patients
describing a lack of ‘ownership’ or control, reduced ability to localise the site of touch stimuli
and increased difficulty with movement of the affected body part [1, 41]. Alterations in spatial
perception, in particular that of body space as defined by judgement of body midline, have also
been reported [42] further suggesting a neglect-like process at work.
The ability to accurately perceive the spatial characteristics of both the external environment
and the body are crucial to orienting oneself in space and therefore plays a fundamental role in

103
body schema [43]. Various methodologies have been used in different clinical populations to
investigate these properties. They range from laboratory-based direct investigations of
perceived body midline to paper-based tests of spatially-orientated attention. Results of
testing in patients with hemispatial neglect generally reveal a corresponding response bias to
the ipsilateral side of the lesion due to the reduced awareness or attention to the contralateral
side (i.e. the side controlled by the injured side of the brain). As this deficit is more commonly
seen following injury to the right cerebral hemisphere, results of testing generally involve large
deviations to the right of true centre. However in the normal population, despite some
inconsistency, most participants reveal a smaller leftward bias, often termed ‘pseudo-neglect’,
which is thought to be due to dominance of the right cerebral hemisphere for spatial tasks [43-
45].
Details of studies that have investigated spatial perception in AIS are described in the
systematic review in Chapter 3.
The simplest, and most widely used, clinical test for spatially-orientated attention is the line
bisection test (LBT) which was initially devised as a test for hemispatial neglect [46]. In its
classical form, the LBT is a paper-based test where participants are asked to mark the centre of
a horizontal line. The difference between the perceived and actual centre, along with the
direction, is measured and often converted to a relative error percentage based on the line
length.
4.3.1 Normative values
There have been reports of considerable variation between individuals in performance of the
LBT [47, 48]. These have been linked to the wide array of testing protocols that have been used
and differences in sample populations. In an attempt to address this issue, an extensive review
and meta-analysis was conducted by Jewell & McCourt [45]. Overall, the results confirmed a
statistically significant leftward bisection error when performed by neurologically normal
subjects. Estimates as to the magnitude of this leftward deviation were not provided.
Establishment of normative values for the magnitude of the deviation is challenging due to
considerable variation in the way that different studies have calculated the distance between
perceived and actual centre-point of the line. However, a number of studies have used
comparable methods that provide some guidance regarding the amount of deviation in healthy

104
participants (Table 4.4). In these studies, the difference between perceived and actual line
centre has been transformed into relative error using the formula:
Relative error (%) = ((measured left half - true half)/true half) x 100
This accounts for the different line lengths that have been used both within and between
studies. Overall, the relative error is quite low with figures of between 0 to 4.5% in healthy
participants [48-55]. Some studies have also looked at relative error in different age groups as
summarised in Table 4.5 [48, 54].
4.3.2 Measurement properties
In a recent study of test-retest reliability, 50 healthy adults (15 M, mean age 22.6 yrs, SD 4.46,
range 18-38yrs) repeated a series of spatial attention tasks on two occasions at least 24 hours
apart [44]. The tasks included a computer version of the LBT where lines were randomly
presented in 9 different positions. Each position was repeated 12 times resulting in a total of
108 tests per participant. Their results confirmed the leftward bias seen in previous
investigations of the LBT in healthy adults and that this effect was seen in both testing
sessions. Test-retest reliability of the magnitude of the deviation was calculated between
session 1 and 2 using Pearson’s r correlation (r = 0.846, p<0.001). Earlier studies of test-retest
reliability have reported lower correlation coefficients following re-testing at longer time
intervals (≥ 2 weeks) [56, 57].
A number of different factors have been reported as influencing the LBT. These were
investigated as part of the review by Jewell & McCourt [45] and can be categorised as factors
relating to the participant (e.g. age) and those that relate to the test itself (e.g. line length). A
summary of the findings is presented in Table 4.6.

105
Table 4.4 Normative values for LBT % error (mean, SD)
study n Line position Left hand* Right hand* Combined
Scarisbrick et al 1987
42 (17 M,
1st year
University
students)
Combined -1.81 -0.41 -
Left -1.06 2.13 0.54 (3.86)
Centre 0.53 2.64 1.59 (3.66)
Right 0.18 1.84 1.01 (3.46)
Combined -0.12 (3.69) 2.20 (3.27) 1.04 (3.66)
Brodie & Pettigrew 1996 18 (9 M) Combined -2 (6) -3 (4) -
Varnava et al 2002
40 (11 M,
age range 18-
41 yrs)
Combined - - -0.31 (2.22)
Left −2.85 (0.53) −3.05 (0.49) -
Centre −2.60 (0.42) −1.61 (0.41) -
Right −1.32 (0.49) 0.13 (0.50) -
Combined −2.30 (0.39) −1.52 (0.34) -
Left -2.91 (0.83) -1.04 (0.87) -
Centre -2.28 (0.68) 0.10 (1.34) -
Right -1.53 (0.89) 0.75 (1.53) -
Combined -2.24 (0.62) -0.04 (1.05) -
Left -2 (6) -3 (4) -
Centre 1 (6) 0 (6) -
Right 2 (5) 2 (6) -
Left −4.47 (0.8) −2.49 (0.51) -
Centre −1.90 (0.63) 1.95 (0.64) -
Right 0.93 (0.88) 4.37 (0.81) -
Combined −1.81 (0.52) 1.27 (0.46) -
Fukatsu et al 1990
24 (12 M,
age range 50-
70 yrs)
negative values indicate deviation to left
*left and right hand indicates hand used; **mean (SE)
46 (19 M,
age range 8-
18yrs)
Pulsipher et al 2009**
38 (19 M,
age range 22-
49 yrs)
Hausmann et al 2002
18Forderreuther et al 2004
Hausmann et al 2003**
98 (age
range 10-53
yrs)

106
Table 4.5 Normative values for LBT by age, % error (mean, SE)
Left Hand Right Hand Left Hand Right Hand
Left - - −1.01 (1.72) −1.77 (1.18)
Centre - - −1.30 (1.47) 1.79 (1.46)
Right - - 2.84 (2.01) 3.51 (1.89)
Combined - - 0.18 (1.13) 1.18 (1.06)
Left �-3.04 (1.12) �-0.09 (0.96) −4.88 (1.29) −3.05 (0.89)
Centre �-2.10 (0.81) 2.16 (0.93) -2.35 (1.10) 0.75 (1.11)
Right �-1.79 (1.08) 2.57 (1.08) 0.00 (1.51) 4.67 (1.41)
Combined �-2.28 (0.73) 1.62 (0.67) −2.41 (0.85) 0.79 (0.80)
Left �-2.72 (0.66) �-1.18 (0.62) −7.14 (1.56) −2.13 (1.07)
Centre �-2.52 (0.55) 0.10 (0.81) −2.15 (1.33) 3.05 (1.32)
Right �-2.02 (0.71) �-0.57 (0.83) −0.53 (1.82) 3.91 (1.71)
Combined �-2.44 (0.48) �-0.48 (0.60) −3.26 (1.02) 1.61 (0.96)
Left - - −3.97 (1.63) −2.67 (1.12)
Centre - - −1.43 (1.39) 2.79 (1.39)
Right - - 2.32 (1.91) 5.18 (1.79)
Combined - - −1.03 (1.07) 1.76 (1.01)
Left �-2.68 (0.78) �-1.41 (0.68) - -
Centre �-2.16 (0.72) �-0.89 (0.46) - -
Right �-1.04 (0.82) 1.55 (0.76) - -
Combined �-1.98 (0.66) �-0.33 (0.48) - -
Left �-3.18 (0.62) �-1.34 (0.50) - -
Centre �-2.32 (0.57) �-0.65 (0.38) - -
Right �-1.33 (0.54) �-0.29 (0.68) - -
Combined �-2.28 (0.51) �-0.74 (0.39) - -
negative values indicate deviation to left
age group Line positionHand used Hand used
16–18 years
18–21 years
24–53 years
8–9 years
10–12 years
13–15 years
Hausmann et al 2003
n n
27
9
16
11
10
-
-
Pulsipher et al 2009
-
22
24
-
25
Age is a key factor in LBT performance. There have been consistent reports that the typical
leftward deviation which characterises pseudo-neglect tends to reduce and even reverse in
direction to the right with increasing age in older adults [45, 58].
However, testing in children has produced contrasting results. Classically, younger children are
thought to deviate from true centre according to the hand used such that they tend to have a
left response bias when using the left hand and a right bias for the right hand. As they develop,
their responses progressively move towards the pseudo-neglect seen in adults where they
deviate to the left regardless of which hand is used. More recent studies have questioned this
with results revealing considerable variation both in the directional bias and the magnitude of
the deviation from true centre across different age groups [48].

107
Table 4.6 Factors that influence line bisection test
Factor Effect
Age Deviation progressively shifts rightward with increasing age in adults
Sex No effect
Handedness Right handers greater deviation to the left than Left handers
Reading direction Leftward deviation in left-to-right readers (e.g. English) v rightward deviation in right-to-left readers (e.g. Hebrew)
Hand used Greater deviation to the left when using Left hand vs Right hand, especially for Right handers
Scanning direction Greater left deviation when scanning from left-to-right vs right-to-left
Gaze direction Leftward deviation with gazing to left v rightward deviation with gazing to right
Line position
Greater left deviation when line positioned to left of midline of paper/screen Greater left deviation when paper/screen containing line is presented in left hemispace vs right hemispace
Line length Greater deviation to left with longer line lengths
Other factors that have subsequently been identified as relevant to LBT performance include
viewing distance. For example, a progressive shift from a leftward to a rightward bias has been
reported as the distance between the participant and the line was increased from 30cm to
150cm (i.e. going from near to far-space) [52, 59]. Numerous interactions between these
different variables have also been investigated with varying effects on LBT (e.g. [53, 60]).
It is clear from these reports that these factors need to be taken into account when conducting
the LBT and in comparing results with previous findings.
4.4 Proprioception
Proprioception refers to the ability to perceive the posture of one’s body in external space and
the position of different body parts relative to each other. As such, it is essential in
constructing up-to-date body representations such as body schema.
Unlike other properties of body schema described in this chapter, proprioception has been
tested previously in AIS as described in the systematic review in Chapter 3, both in terms of
joint angle reproduction and movement detection threshold (MDT). To date, evaluation of

108
MDT has not been undertaken in the trunk in AIS. This is partly due to practical difficulties in
being able to conduct testing using passive movement in this region. MDT testing also requires
specialised equipment that makes it unfeasible to conduct outside of a specialist centre. In
contrast, position matching methodologies do not require such sophisticated equipment and
can be easily performed in a clinical setting. They are also able to test joint position sense in
areas of the body that are more difficult for MDT testing such as the trunk and spine.
4.4.1 Position matching
Position matching evaluates the ability of a subject to be able to match a previously
determined target position. This is performed whilst blindfolded to remove visual cues. The
closer they are able to reproduce the target position, the more accurate they are. The
difference between the actual and the perceived target position is described as the
repositioning error.
4.4.1.1 Normative values
Position matching ability in the trunk or spine has not been evaluated in people with AIS
although it has been evaluated in adult scoliosis. Bissolotti et al [64] reported mean absolute
repositioning errors of 3.4 degrees (SD 1.5) during sideflexion in 40 people with adult scoliosis
(10 M, mean age 61.8yrs SD 11.5). Unfortunately, few details were provided as to the testing
procedures and measurement tools used.
Testing of position matching has also been conducted extensively in the lumbar spine of
healthy non-scoliotic people, usually in comparison with LBP patients. These include studies
evaluating repositioning error in lumbar flexion [65-77], sideflexion [67, 68, 70, 71, 74, 75, 77]
and rotation [71, 74, 75, 78], with absolute errors ranging from 1.6 degrees to 5.2 degrees
depending on direction of movement (Table 4.7). A further study calculated overall
repositioning error involving all directions of movement [72]. In general, testing in rotation and
sideflexion appear to involve less absolute error than flexion. The variation in results reported
by these trials are most likely due to differences in test protocols, measurement equipment
and subjects. Note that only trials involving gross spinal movement and that measured angular
displacement (degrees) were included in Table 4.7. Those that investigated pelvic tilt or specific
spinal curves in isolation were not included.

109
4.4.1.2 Measurement properties
Test-retest reliability in the trunk has been investigated by a number of authors (Table 4.8) [65,
67, 70]. Due to the large variations in the reported ICC figures (and the lack of reporting of 95%
CI in some studies), it is unclear as to how reliable testing is. Some of the reported confidence
intervals are very low suggesting poor reliability. It would appear that, in general, testing of
position matching with spinal rotation is the most reliable followed by flexion. The differences
reported are most likely due to the differences in testing procedures and measurement tools.
Various factors have been reported to affect position matching ability. A number of studies
have reported reduced error when repositioning is done through active rather than passive
movement [74, 78]. It is presumed that greater sensory feedback from muscle contraction
contributes to the greater accuracy in active movement. There are some reports that the
position in which testing is conducted can also affect performance. Sitting has been reported
as involving greater repositioning error than standing [72], possibly due to reduced movement
occurring in the lower limbs, and therefore reduced proprioceptive feedback.
There is some uncertainty regarding the effect of where the target position is within the overall
range of movement (i.e., how far the subject has to move) on repositioning error with some
studies describing greater accuracy with smaller movements [73, 79], and others reporting no
effect [66, 68, 69, 80] or even greater accuracy with larger movements [81]. There is also some
doubt as to the effect of movement direction with some reports of an effect on repositioning
error [82], while others report no effect [69]. For testing involving side-bending or rotation
tests, no significant differences between right and left side positioning accuracies were found
[83].

110
Table 4.7 Position matching in healthy controls - absolute error
Flexion Sideflexion Rotation
Gill & Callaghan 1998 Healthy controls20 (7M, mean age
32.9yrs, range 24-53) 20 deg 4.45 (3.41) - -
Swinkels & Dolan 1998 Healthy controls20 (12M, mean age
33.6yrs range 23-52)50% max ROM 4.35 (3.90) 2.23 (2.24) -
McNair & Heine 1999 Healthy controls40 (20M, mean age
26.3yrs SD 6)
random
throughout ROM3.62 (1.7) - -
Swinkels & Dolan 2000 Healthy controls20 (8M, mean age
30.6yrs range 23-44)
33, 50 & 66% max
ROM
3.50 (2.35) /
4.34 (2.50) /
4.14 (2.25)
1.84 (1.47) /
1.86 (1.43) /
1.87 (1.40)
-
LBP20 (8M, mean age
39.3yrs SD 11.4)
Healthy controls20 (7M, mean age
39.1yrs SD 11.3)
Koumantakis et al 2002 Healthy controls18 (8M, mean age
24.6yrs SD 4.0)
flexion 20 deg /
sideflexion 15 deg3.46 (2.04) 2.36 (1.36) -
Feipel et al 2003 Healthy controls21 (16M, mean age
40yrs SD 10)50% max ROM 4.5 (3.9) 2.1 (2.6) 1.6 (1.5)
Preuss et al 2003** Healthy controls70 (70M, mean age
34.5yrs SD 8.7)
return to neutral
from max ROM:
sitting / standing
3.6 (2.3) / 2.5
(1.2)- -
Healthy controls15 (9M, mean age
38.2yrs SD 10.7)
LBP16 (11M, mean age
41.1 yrs SD 11.37)
Silfies et al 2007 Healthy controls232 (117M, mean
age 19.3yrs SD 1.3)
Return to neutral
from 20 deg- - 1.6 (0.8)
Lee et al 2010 Healthy controls24 (14M, mean age
42.4yrs SD 9.0)
Return to neutral
from 15 deg2.3 (1.3) 1.8 (0.9) 1.7 (0.9)
Tsai et al 2010 Healthy controls16 (16M, mean age
47.9yrs SD 8.3)80% max ROM 2.1 (0.9) 1.65 (0.61) 2.35 (0.77)
Georgy 2011 Healthy controls15 (mean age
38.5yrs SD 5.85)30 deg 2.8 (0.94) - -
Gong 2014 Healthy controls30 (2M, mean age
22.45yrs SD 0.52)
flexion 35 deg /
sideflexion 30 deg1.83 (1.28) 1.72 (1.26) -
** overall mean repositioning error from flexion, sideflexion L & R, rotation L & R tests
* combined results as no statistically significant difference between groups
study group n Target positionAbsolute error,degrees (mean, SD)
Newcomer et al 2000* 50% max ROM 2.4 - -
- -Descarreaux et al 2005* 15, 30 & 60 deg
2.13 (0.23) /
2.82 (0.27) /
5.20 (0.62)

111
Table 4.8 Test-retest reliability of trunk position matching ability
Flexion Sideflexion Rotation
Gill & Callaghan 1998LBP (n=5);
Control (n=5)12 weeks 0.852 - -
LBP (n=62) minimum 5 days 0.41 (0.02-0.64)
L: 0.24 (0-0.54) /
R: 0.42 (0.04-
0.65)
L: 0.51 (0.17-0.71) /
R: 0.58 (0.29-0.75)
Control (n=18)
3 sessions with
1 week
between each
0.76 (0.47-0.90)L: 0.48 (0-0.79) /
R: 0.22 (0-0.68)
L: 0.80 (0.57-0.92) /
R: 0.76 (0.48-0.90)
Swinkels & Dolan
1998Control (n=20) 2 weeks 0.790 - 0.898
L: 0.339-0.709 /
R: 0.428-0.682-
Koumantakis et al
2002
studyinterval
between testsgroup
Intraclass Correlation Coefficient (95% CI)
Most studies have reported no differences in repositioning error in the trunk according to age
or gender [65, 69-71]. These studies did not specifically investigate position matching ability in
older adults. In contrast, repositioning error was increased in older adults in testing of the
cervical spine [84], the upper limb [85] and the knee [86-88].
Changes in trunk positioning accuracy have been reported with age in children and adolescents
[89]. Healthy school children (n=253, 132 M) between the ages of 7-18 years were asked to
return to a neutral (reference) standing position following trunk side flexion to the left or right.
Repositioning error was calculated between the perceived and reference position and
expressed in degrees. Accuracy was reported as improving with increased age (7 years: mean
absolute error 2.5 deg SD 1.1; 18 years: 0.9 deg SD 0.6). Interestingly, they noted a relative
decrease in positioning accuracy between the ages of 11-15 years, a period that corresponds
with the adolescent growth spurt. Accuracy increases again after this period with the authors
suggesting that trunk proprioception reaches adult levels of accuracy at approximately 15-16
years of age.
4.5 Summary
In summary, there are a number of different properties thought to be associated with body
schema. These include tactile acuity, laterality discrimination, spatial perception and
proprioception.
A number of tests have been utilised in evaluating these properties in chronic pain conditions.
These include TPDT, localisation, left/right judgement, LBT and position matching. They have

112
generally involved equipment and procedures that are practical to use in a clinical setting
rather than a lab-type environment, which is consistent with the type of studies that form the
basis of this thesis. None have been used previously in testing people with AIS apart from
proprioceptive testing, although this involved the knee and elbow rather than the spine.
Where possible normative data and psychometric properties have been presented. Because
this is a relatively new area of investigation, there are few studies that have investigated this in
any great detail. It is only recently that research has been conducted in this direction which has
provided sufficient information to inform test selection and interpretation, including
identifying factors that need to be taken into account when conducting these tests.
The next chapter will go on to describe the methods used in the first of the studies which form
part of this thesis examining body schema in AIS.

113
5 Research question 1 - case control study (methods)
This chapter describes the methodology used in the case-control study conducted as part of
this thesis. A brief overview of the research question the study is addressing is provided
initially. The rest of this chapter then focuses specifically on the case-control methods with the
results described in chapter 5.
Reporting in this and subsequent chapters is in accordance with the STROBE guidelines for the
reporting of observational studies [1, 2].
5.1 Overview
5.1.1 Research question
The research questions that this thesis is seeking to answer are listed below (Table 5.1). The
initial study is concerned with answering the first of these questions.
Table 5.1 Research question - Case control study
Research questions
1 do adolescents with AIS (cases) differ from non-scoliotic adolescents (controls) with regard to mechanisms that are thought to underpin body schema?
2 in adolescents with AIS, is there any relationship between the mechanisms thought to underpin body schema and the magnitude of spinal deformity?
3 is there any relationship between changes in body schema and progression of the spinal deformity in AIS over time?
5.1.2 Hypothesis tested
The hypothesis derived from the above question is that:
H1: adolescents with AIS differ from non-scoliotic controls with regard to mechanisms
that are thought to underpin body schema
The null hypothesis (Ho) is that there are no differences in underlying mechanisms of body
schema between adolescents with or without AIS.
114
5.1.3 Study outline
To test this hypothesis, a case control comparison of body schema between AIS patients and
controls was conducted. Data for cases was obtained from participants with AIS during a
recent NIHR-funded feasibility study with which this PhD project was linked [3]. Although
nested within the feasibility study, this doctoral project addressed distinct outcomes over a
longer time-frame (i.e. 12 months rather than 6 months). Data from control participants was
collected separately as part of this doctoral project.
5.2 Methods - case control study
5.2.1 Study design
As described previously in Chapter 1, AIS is relatively rare therefore studies that attempt to
determine differences between people with AIS and those without need to take this into
account. A traditional cohort study would be impractical due to the time required to recruit
sufficient people with AIS. For this reason, a case-control design was used. In contrast to typical
case-control studies, this study used a cross sectional approach by recruiting participants
prospectively and making observations at one time point only.
5.2.2 Setting
Cases were recruited from spinal and/or scoliosis clinics at 4 NHS specialist centres in the UK
(Royal Orthopaedic Hospital, Solihull; Nuffield Orthopaedic Centre, Oxford; Frenchay Hospital,
Bristol; James Cook University Hospital, Middlesbrough) as part of the NIHR-funded feasibility
study described previously [3]. The centres were amongst 35 listed by Scoliosis Association UK
(SAUK) and the British Scoliosis Research Foundation as having clinicians actively managing and
performing surgery for patients with scoliosis. Recruitment took place between December
2012 and October 2013.
Control participants were sourced from schools. The advantage of using schools is that there is
a large group of potential participants neatly divided into groups by age. Students are likely to
be representative of the population from which cases are drawn, thereby reducing the chance
of selection bias [4]. They are also more than likely to be well and therefore unlikely to suffer
from conditions that would result in exclusion, or from other conditions that may act as
confounders. Sourcing controls from hospitals runs the risk of including participants whose

115
condition has an effect on the outcome measures. The disadvantage of using schools is the
potential difficulty in gaining permission from head-teachers to approach their students. Also,
school students are less likely to be motivated to participate in a study which is not seen to be
directly relevant to them. The reduced level of uptake amongst students is balanced to some
extent by the large pool of potential recruits.
Where possible it is preferable to source controls from the same geographical area as cases [4].
Therefore, schools in Coventry, Warwickshire and Oxfordshire were approached as sources of
recruitment for control participants as these regions fall within the catchment of two of the
hospitals from which cases were recruited. It should be noted that the hospitals themselves
were specialist scoliosis centres which treat patients from a wide area and therefore, potential
case participants do not necessarily live in close proximity to the hospitals. Recruitment of
controls took place between October 2014 and February 2016.
5.2.3 Participants
5.2.3.1 Cases
Only patients with a diagnosis of AIS made by an orthopaedic consultant specialising in
scoliosis and confirmed by medical imaging (x-ray or MRI) were asked to participate. The
inclusion criteria for cases were:
age 10-16 yrs old
a diagnosis of mild to moderate AIS (i.e. a Cobb angle between 10 - 50 degrees assessed
radiographically).
Exclusion criteria were:
Cobb angle <10 degrees or >50 degrees
previous spinal surgery or on waiting list for spinal surgery within next 12 months
non-idiopathic scoliosis (e.g. congenital malformations, syringomyelia,
neurofibromatosis, spina bifida)

116
A curvature of at least 10 degrees is necessary for a diagnosis of AIS, therefore any deformity
less than this threshold was excluded. Severe scoliosis (i.e. Cobb angle > 50o) is usually
managed surgically, therefore patients with curves greater than this threshold were also
excluded. Non-idiopathic scoliosis generally involves some form of neurological or
developmental problem that may have a confounding effect on the properties of body schema
that were tested in this study, hence people with these problems were not included.
Conservative treatments potentially received by participants in the past, including bracing and
exercise, did not form part of the exclusion criteria. Neither of these are commonly utilised in
the UK.
Potential participants were initially approached by clinicians supported by trained research
staff (nurses or physiotherapists). The screening and recruitment systems were tailored to
individual sites. In some sites, research clinicians would be present in clinic and discuss the
study with patients. At others, clinicians would perform the screening and pass details to the
research clinicians to contact patients and families at a later date. At one site (JCUH), a
specialist nurse used hospital records of patients who were due to attend a new patient or
review clinic appointment and approached patients who appeared to be potentially eligible. At
all centres, interested patients were provided with written information about the study
(Appendix 2). If they were interested and willing to participate, they were booked in for a
designated research clinic appointment with a research clinician where eligibility was
confirmed, formal consent taken (Appendix 4) and baseline questionnaires and physical
measures completed (Appendices 5, 7-20). Consent was obtained by trained research clinicians
following Medical Research Council guidelines [5] and was provided by the child where capable
or the parents/carers. Regardless of who provided consent, agreement (or assent) to
participate was required from both the child and the parents/carers to ensure all parties were
willing to be involved.
5.2.3.2 Controls
Head teachers of all secondary schools in Coventry, Warwickshire and Oxfordshire, and all
primary schools in Coventry (192 schools in total) with students of eligible age were contacted
by letter, email or both for permission to approach students and invite them to participate. At
schools which gave permission, students of relevant class years were given written information
about the study (Appendix 3) along with an eligibility checklist and consent form to take home
117
and discuss with parents (Appendix 4.4). Consent/assent was obtained according to the same
principles as for case participants. Those that returned forms were then checked to see if they
matched with any of the controls according to age and sex. Participants who met the eligibility
criteria and that were able to be matched were then asked to complete questionnaires at
home and to attend a research appointment where eligibility was confirmed, questionnaires
were checked for completeness and physical measures taken (Appendices 6, 8-19).
Inclusion criteria for the control group were:
age 10-16 years
matched according to age (±3 months) and sex with a case participant
Exclusion criteria were:
scoliosis (as determined by clinical testing)
other spinal pathology or neurological condition.
other condition/injury where unable to complete tests
Clinical testing for presence of spinal deformity (Adam’s test [6] and observation of
spine/posture) were included as part of the physical testing to exclude any potential cases of
AIS or other spinal conditions. It was performed by a single physiotherapist (the author) with
relevant spinal and musculoskeletal training and experience. Any potential participant with
significant spinal or trunk asymmetry which may indicate the presence of scoliosis was
excluded along with any other condition which may influence study outcomes or prevent their
participation in physical testing (e.g. broken leg). When scoliosis was suspected, the child was
advised that the findings were only preliminary and a letter sent to the parents/carers advising
them to seek further investigation. Assessment by medical imaging to confirm non-scoliotic
status was not possible due to ethical and practical considerations.
5.2.3.3 Matching
The aim was to match controls to cases in a ratio of between 2 to 4:1 using sex and age at
baseline assessment as the matching variables. Greater numbers of controls per case has been

118
shown to increase the statistical power although the added benefit drops significantly after 4:1
[7].
These matching variables were chosen because of the different rates of physical and/or mental
development occurring during adolescence between sexes as well as the large differences
between age groups during this stage of rapid development [8-10]. AIS is also more prevalent
amongst females [11]. Age of each control was restricted to the age of their matching case ± 3
months.
5.2.4 Variables
Information collected from participants for the case-control analysis is listed in Table 5.2 and
Table 5.3. These can be broken down into 3 broad categories of:
demographics
self-reported function, health-related quality of life (HRQoL) and body
awareness/perception
physical measures related to body schema
Note that the measures listed only include those relevant to the case-control study, i.e. all
those collected from controls and a subset of measures from cases. Copies of all measures are
provided in appendices 5 to 20.
Other data that were also collected from cases as part of the cohort study are listed separately
in the relevant chapters that follow.

119
Table 5.2 Variables - self-report questionnaires & physical measures of body schema
Domain Instrument / test data type units / rangeCases /
controlsAge* Participant reported continuous months
Sex* Participant reported categorical (binary) Female/Male
Ethnic group Participant reported categorical
Handedness Edinburgh Hand Inventory (EHI) categorical Left/Right/Mixed
Onset of puberty - participant reported categorical (binary) Yes/No
Age of occurrence - participant reported continuous years
Family history of scoliosis Participant reported categorical (binary) Yes/No
Postcode income estimate continuous £
Parent income - participant reported categorical
Standing height (m) continuous m
Weight (kg) continuous kg
Curve type categorical Single/Double/Triple
Curve direction¥ categorical (binary) Left/Right
Cobb angle¥ continuous degrees
Curve location¥ categorical thoracic/thoracolumbar/lumbar
Coronal balance continuous mm
Sagittal balance continuous mm
Risser sign categorical 0 to 5
Current bracing status - participant reported categorical (binary) Yes/No
Previous exercise treatments received - participant reported categorical
Duration of condition Age at diagnosis - participant reported continuous years
* matching variables
¥ primary curve
Height, weight, BMI
Family income
Treatments received
Dem
ogr
aph
ics
Sco
liosi
s ch
arac
teri
stic
s
Pubescent statusboth
X-ray
cases

120
Table 5.3 Variables - self-report questionnaires & physical measures of body schema
Domain Instrument / test data type units / range Cases / controls
Spinal Appearance Questionnaire (SAQ-14) total continuous 14 (best) to 70 (worst)
appearance continuous 10 (best) to 50 (worst)
expectations continuous 4 (best) to 20 (worst)
Scoliosis Research Society Questionnaire (SRS-22) total* continuous 1 (worst) to 5 (best)
function continuous 1 (worst) to 5 (best)
self image continuous 1 (worst) to 5 (best)
pain continuous 1 (worst) to 5 (best)
mental health continuous 1 (worst) to 5 (best)
EQ5D - 3L
mobility categorical
self-care categorical
usual activities categorical
pain/discomfort categorical
anxiety/depresssion categorical
Health Status continuous 0 (worst) to 100 (best)
Paediatric Outcomes Data Collection Instrument (PODCI)¥ continuous 1 (worst) to 100 (best)
upper extremity & physical function continuous 1 (worst) to 100 (best)
transfers & basic mobility continuous 1 (worst) to 100 (best)
sports & physical functioning continuous 1 (worst) to 100 (best)
comfort/pain continuous 1 (worst) to 100 (best)
global function continuous 1 (worst) to 100 (best)
happiness with physical condition continuous 1 (worst) to 100 (best)
Body awareness Kinaesthetic & Proprioceptive Awareness Questionnaire (KPAQ) continuous 12 (worst) to 60 (best)
Balance Dynamic standing balance continuous seconds
Spatial perception Line bisection test continuous mm (converted to relative error, %)
Laterality discrimination accuracy - back & hands continuous % correct
Laterality discrimination reaction time - back & hands continuous msec
Two point discrimination continuous mm
Localisation continuous % correct
Trunk proprioception Position matching - side flexion continuous degrees (converted to relative error, %)
Generic function
Generic HRQoL
Perceived spinal
deformity
* questions related to treatment not included as part of case-control analysis
¥ questions related to expectations following treatment not included as part of case-control analysis
Ph
ysic
al m
easu
res
Tactile acuity
both
Fun
ctio
n, Q
oL,
bo
dy
awar
enes
s
Scoliosis-specific HRQoL
Left / right awareness
both

121
5.2.5 Demographics
Age, sex, ethnicity, handedness, puberty status, family income, family history of scoliosis, and
height/weight were collected as part of demographic data (Appendices 5 and 6).
5.2.5.1 Handedness
Handedness was calculated using a modified version of the Edinburgh Hand Inventory (EHI).
Subjects are asked to state which hand they routinely use for 8 different tasks (section 2,
Appendices 5 and 6). Each item is scored from -50 (always left) to +50 (always right) and
subjects are then assigned to categories of principally right- handed, left handed or mixed
based on the total score [12].
5.2.5.2 Income
Gross weekly income figures were derived from postcodes and corresponding ONS estimates
of average weekly household income for middle layer super output areas (MSOAs) in England
and Wales. MSOAs are geographical regions consisting of between 2000 to 6000 households
(5000 to 15000 people). These estimates provide the average household income for small
areas within England and Wales, i.e. the income a household receives from wages and salaries,
self-employment, benefits, pensions, plus any other sources of income [13].
5.2.5.3 Body mass index (BMI)
BMI was calculated from height (m) and weight (kg) using the following formula [14]:
BMI = weight / height2
5.2.5.4 Radiological imaging
X-ray information for cases from the most recent radiographic assessment was also collected
from hospital records to give an overview of the type and severity of the spinal deformities
involved (Appendix 6). Case participants did not undergo additional x-rays as part of this study.
5.2.6 Self-report questionnaires
All self-report questionnaires used in the case control study, along with scoring instructions,
are contained Appendices 8 to 12.

122
5.2.6.1 Perceived trunk symmetry/spinal deformity
There are a number of instruments available that address the concept of self-image. However,
these tend to measure self-image as an overall concept. Very few have focussed specifically on
perceptions of the trunk/spinal region, especially with regard to examining perceived
symmetry or deformity which is of particular interest to people with scoliosis. Measures that
have been developed include the Spinal Appearance Questionnaire (SAQ), Walter-Reed Visual
Assessment Scale (WRVAS), on which the SAQ was initially based, and the Trunk Appearance
Perception Scale (TAPS). The WRVAS has been reported to have a number of deficiencies,
including lack of validity and problems with understandability by younger age groups [15],
which is why the SAQ was developed. TAPS is similar to the SAQ although it has fewer items
and does not measure expectations regarding trunk shape/symmetry. It has not been used as
widely in scoliosis research and therefore, there is less information regarding its psychometric
properties in comparison with the SAQ [15].
5.2.6.2 Spinal Appearance Questionnaire (SAQ-14)
The SAQ-14 is a self-report measure of perceived self-image (specifically, spinal/trunk
symmetry). It was originally developed from the WRVAS and has undergone several iterations
before arriving at the current 14 item questionnaire (Appendix 8) [15].
The SAQ consists of two scales (appearance and expectations) and uses a 5 point Likert-style
scoring system [16, 17]. The appearance scale consists of 10 separate items. Each item relates
to a specific component of trunk/spinal symmetry and displays a series of 5 images of
increasing asymmetry/deformity. Participants are asked to choose the image which they
believe they resemble the most. Scoring ranges from 1 to 5 for each item giving a total score
for the scale of 10 (best) to 50 (worst).
The expectations scale is a series of four statements related to expectations or desires
regarding trunk/spinal symmetry. Participants are asked to rate how well each statement
applies to them (1-not true to 5-very true). Total score for the scale ranges from 4 (best) to 20
(worst).
Combining the appearance and expectations scales produces an overall total score ranging
from 14 (best) to 70 (worst).

123
Psychometric properties of the current 14 item version of the SAQ were first evaluated in
1,802 North American adolescents with AIS who were undergoing either monitoring only,
bracing, or were listed for surgical correction (mean Cobb angle 55.8o; SD 13.7o; range 0 to
123o). The subscales and total score were reported as having good to excellent test-retest
reliability and high internal consistency (Table 5.4) suggesting that it is reproducible and that,
within each domain, individual items appear to measure the same construct [16]. A later study
in 80 Spanish participants with IS (mean Cobb angle 45.9o; range 25.1 to 77.2o) produced very
similar results [18].
No floor or ceiling effects were reported for the appearance and total scores. However, the
expectations scale demonstrated significant ceiling effect with over a 1/3 of participants
scoring the maximum (i.e. with greatest desire for change in trunk symmetry) [16].
Evaluation of convergent validity has produced differing results when comparing SAQ scores
with curve magnitude and SRS22 self-image scores (Table 5.5). It is unclear as to why such
differences exist between the two studies although the Spanish cohort included a wider age
range with a mean age approximately 6 years older (mean 20.3 years, range 10-40 years) than
the North American cohort (14.8 years, SD 2.1). It also included participants with other forms
of IS rather than specifically AIS. Respondents in the Spanish study completed the
questionnaire without any assistance whereas parental help was “neither encouraged nor
discouraged” for the North American cohort.
Assessment of divergent validity also produced contrasting results between the two studies
(Table 5.6). Again, the Spanish study reported greater correlations than the North American
cohort which makes evaluation of overall construct validity difficult.
The SAQ appears to be able to discriminate between surgical and non-surgical candidates with
Carreon et al [16] reporting statistically significant differences in SAQ scores between
participants who were under observation or braced and surgical candidates (p≤0.002).
Similarly, Matamalas et al [18] reported that SAQ appearance and total scores were able to
discriminate between participants with Cobb angles ≥45o and those with Cobb angles <45o
(Table 5.7). This threshold is often the point at which surgical treatment is recommended.
Responsiveness to change of the SAQ was evaluated in a separate study amongst a
retrospective cohort of 126 AIS participants (mean age 14.9 years; SD 2.0 yrs; mean pre-op

124
Cobb angle 53.7o; SD 12.8; range 40 to 95o) who underwent surgical correction of the spinal
deformity. Pre-operative scores were compared to scores 2 years post-surgery (Table 5.8) with
statistically significant differences reported for both scale and total scores. The large effect
sizes and standardised response means also indicate that the SAQ appearance and expectation
scales, as well as the SAQ total score, are highly sensitive to change following surgery [17]. No
testing of SAQ responsiveness has been performed in AIS patients with lesser initial Cobb
angles or undergoing more conservative forms of treatment.
Table 5.4 Reliability & internal consistency SAQ
Property study SAQ appearance SAQ expectations SAQ total score
Test-retest reliability Carreron et al 2011 0.81 0.91 0.89
Carreron et al 2011 0.89 0.88 0.88
Matamalas et al 2014 0.89 0.87 0.88Cronbach’s α
Table 5.5 Convergent validity - SAQ versus curve magnitude and SRS-22
property variable study SAQ appearance SAQ expectations SAQ total score
Carreon et al 2011 0.361* 0.148 -0.324*
Matamalas et al 2014 0.61* 0.24* 0.55*
Carreon et al 2011 -0.393* -0.324* -0.438*
Matamalas et al 2014 -0.67* -0.55* -
correlation, r
Cobb angle
SRS22 self-image
* statistically significant
Table 5.6 Divergent validity - SAQ versus other SRS-22 scales
property variable study SAQ appearance SAQ expectations SAQ total score
Carreon et al 2011 -0.193 -0.117 -0.191
Matamalas et al 2014 -0.49* -0.24* -
Carreon et al 2011 -0.239 -0.09 -0.217
Matamalas et al 2014 -0.60* -0.29* -
Carreon et al 2011 -0.151 -0.093 -0.153
Matamalas et al 2014 -0.43* -0.2 -
Carreon et al 2011 -0.332 -0.205 -0.335
Matamalas et al 2014 - - -
* statistically significant; NB: p-values for Carreon et al not reported
correlation, r
SRS22 pain
SRS22 function
SRS22 mental
health
SRS22 total score

125
Table 5.7 Discriminant validity - Mean (SD) SAQ score by group
study groupmean Cobb angle (SD
or range)SAQ appearance SAQ expectations SAQ total score
observed 24.48 (7.57) 15.88 (3.13) 8.78 (4.78) 24.66 (6.47)
braced 29.42 (11.97) 16.17 (3.33) 11.33 (5.63) 27.50 (7.57)
surgical 56.42 (12.97) 25.16 (3.33)** 15.89 (4.6)** 40.91 (9.22)**
Cobb < 45o 35.2 (25.1-44.2) 20.33 (5.6) 14.50 (5.2) 34.80 (9.3)
Cobb ≥ 45o 56.6 (45-77.2) 28.18 (6.7)* 16.20 (4.5) 44.30 (9.2)*
combined 45.9 (25.1-77.2) 24.27 (5.0) 15.3 (7.3) 39.6 (14-61)
Carreron et
al 2011
Matamalas
et al 2014
* statistically significant difference between groups <45o and ≥45
o
** statistically significant difference between observed/braced and surgical groups
Table 5.8 Responsiveness to change following surgery - SAQ
SAQ scores Cobb angle, o SAQ appearance SAQ expectations SAQ total score
Pre-op 53.7 (12.8) 24.6 (6.0) 15.3 (4.9) 39.9 (9.1)
2yrs post-op 20.1 (10.5) 15.1 (4.5)* 8.2 (4.8)* 23.3 (7.9)*
effect size (Cohen’s d ) 2.6 1.7 1.5 1.8
Standardised response mean 1.4 1.2 1.5
* p<0.0001 difference in scores preop v postop; italics = effect size calculated by thesis author
In summary, despite some concerns with comprehension and interpretation in younger age-
groups [19], the SAQ appears to have excellent test-retest reliability and internal consistency.
It also appears to be able to discriminate between groups with differing severity of AIS by
distinguishing surgical versus non-surgical candidates, and is sensitive to changes following
surgical correction. There is some uncertainty as to construct validity, with contrasting results
reported for convergent and divergent validity by the only two studies to have evaluated these
properties. This may reflect age, curve and selection differences between the two cohorts.
No studies have evaluated the minimal clinically important difference (MCID) to date.
5.2.6.3 Health-related quality of life (HRQoL)
There are a wide variety of generic HRQoL instruments in use (e.g. SF-36, EQ5D). However, in
the scoliosis literature, the Scoliosis Research Society questionnaire is used almost to the

126
exclusion of all other measures, and contains items that reflect issues that are of particular
concern to people with scoliosis. The EQ5D was also included to provide a generic measure of
HRQoL. It has the advantages of being widely used and understood, as well as being relatively
concise.
(i) Scoliosis Research Society questionnaire (SRS-22r)
The SRS-22r is a disease-specific measure of HRQoL (Appendix 9). It consists of 22 items across
5 domains - function/activity, pain, self-image, mental health (5 items each) and satisfaction
with treatment (2 items) [20]. The satisfaction with treatment scale was not used for the case-
control analysis reducing the questionnaire to 20 items. Each item uses a 5 point Likert-style
scoring system which is converted to give a score of between 1 (worst) to 5 (best) for each
scale as well as for an overall summary (mean) score.
Psychometric testing has been conducted in both children and adults with AIS. Test-retest
reliability has been reported as excellent in a group of adults who had previously undergone
surgery for IS as adolescents [21]. The same study also described internal consistency as good
to excellent for all the SRS-22r subscales. Similar results have been reported by other authors
in both adults and younger age groups (Table 5.9) [18, 20, 22, 23].
Table 5.9 Reliability & internal consistency SRS-22r
property test study function self image painmental
health
Test-retest reliability intra-class coefficient Asher et al 2003a 0.90¥ 0.9 0.96 0.87
Asher et al 2003a 0.86¥ 0.75 0.92 0.9
Asher et al 2003b 0.61¥ 0.71 0.86 0.85
Asher et al 2006 0.78 0.77 0.85 0.82
Lai et al 2010 0.83 0.8 0.87 0.9
Matamalas et al 2014 - 0.78 - -
Internal consistency Cronbach's α
¥ = using unrevised function scale
Convergent validity of the SRS-22r has been tested with Cobb angle and other self-report
questionnaires (Table 5.10). Comparison with Cobb angle reveals some variability with studies

127
reporting correlations that suggest medium to large effects [18, 24] while others report
weaker correlations [16].
Correlation of the SRS-22r self-image scale with the SAQ has been described in the previous
section (Table 5.5) with medium to large associations reported [16, 18]. Even stronger
relationships have been demonstrated with relevant scales of generic HRQoL instruments such
as the SF-36 [21] and the Child Health Questionnaire (CHQ-CF 87) [25]. Medium to strong
associations were also reported with the overall EQ5D index scores and health state visual
analogue scale. The two pain scales demonstrated a moderate correlation as did the SRS-22r
self-image scale with the EQ5D anxiety/depression score (r=0.49 and 0.42 respectively).
Interestingly, only weak, non-statistically significant correlations were reported between the
SRS-22r function scale and the EQ5D mobility and usual activity scales. There was a stronger
association with the EQ5D self-care scale indicating that the two questionnaires may capture
distinct aspects of function [26].
The SRS-22r has been reported to be able to discriminate between mild/moderate and more
severe scoliosis as defined by Cobb angle and/or treatment group (i.e. surgical candidates
versus non-surgical) [16, 18, 24, 27, 28]. However, it appears less able to distinguish between
smaller intervals of curve magnitude [28] or non-scoliotic controls from scoliosis patients with
smaller curves (Table 5.11) [24], possibly because smaller curves do not impact on quality of
life.
Responsiveness to change of the SRS-22r following surgery to correct the spinal deformity has
been evaluated although only a few authors have investigated this amongst adolescents (Table
5.11). Large changes in the self-image scale indicate that it is highly responsive following
surgery and this appears to be the main driver of the responsiveness reported for the SRS-22r
total score. Although significant differences were reported by some authors for other scales
pre- and post-surgery, none of them demonstrated more than a small effect size [17, 22, 27,
29]. Interestingly, statistically significant differences were not reported for function following
surgery by any of the studies. No study has looked at responsiveness to change following more
conservative treatment options.
The MCID following spinal fusion in adolescents has been estimated for various subscales by
two studies with reasonably consistent results (Table 5.12). The estimates indicate the change
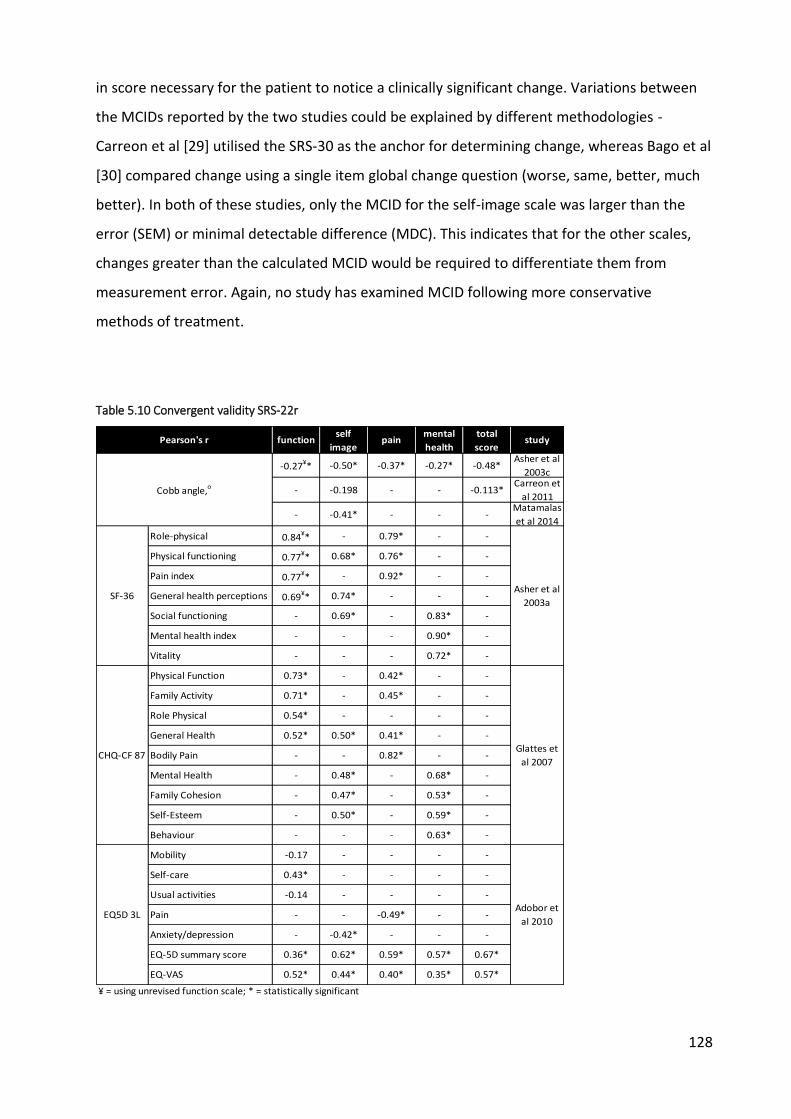
128
in score necessary for the patient to notice a clinically significant change. Variations between
the MCIDs reported by the two studies could be explained by different methodologies -
Carreon et al [29] utilised the SRS-30 as the anchor for determining change, whereas Bago et al
[30] compared change using a single item global change question (worse, same, better, much
better). In both of these studies, only the MCID for the self-image scale was larger than the
error (SEM) or minimal detectable difference (MDC). This indicates that for the other scales,
changes greater than the calculated MCID would be required to differentiate them from
measurement error. Again, no study has examined MCID following more conservative
methods of treatment.
Table 5.10 Convergent validity SRS-22r
functionself
imagepain
mental
health
total
scorestudy
-0.27¥* -0.50* -0.37* -0.27* -0.48*Asher et al
2003c
- -0.198 - - -0.113*Carreon et
al 2011
- -0.41* - - -Matamalas
et al 2014
Role-physical 0.84¥* - 0.79* - -
Physical functioning 0.77¥* 0.68* 0.76* - -
Pain index 0.77¥* - 0.92* - -
General health perceptions 0.69¥* 0.74* - - -
Social functioning - 0.69* - 0.83* -
Mental health index - - - 0.90* -
Vitality - - - 0.72* -
Physical Function 0.73* - 0.42* - -
Family Activity 0.71* - 0.45* - -
Role Physical 0.54* - - - -
General Health 0.52* 0.50* 0.41* - -
Bodily Pain - - 0.82* - -
Mental Health - 0.48* - 0.68* -
Family Cohesion - 0.47* - 0.53* -
Self-Esteem - 0.50* - 0.59* -
Behaviour - - - 0.63* -
Mobility -0.17 - - - -
Self-care 0.43* - - - -
Usual activities -0.14 - - - -
Pain - - -0.49* - -
Anxiety/depression - -0.42* - - -
EQ-5D summary score 0.36* 0.62* 0.59* 0.57* 0.67*
EQ-VAS 0.52* 0.44* 0.40* 0.35* 0.57*
¥ = using unrevised function scale; * = statistically significant
Pearson's r
Cobb angle,o
SF-36Asher et al
2003a
CHQ-CF 87Glattes et
al 2007
EQ5D 3LAdobor et
al 2010

129
Table 5.11 Discriminative ability & responsiveness to change following surgery SRS-22r
property study group function self image pain mental health total score Cobb angle, o
suspected AIS 4.5 (0.35)¥ 4.3 (0.59) 4.7 (0.44) 4.5 (0.48) 4.5 (0.35)
Non-surgical 4.4 (0.36)¥ 4.2 (0.50) 4.6 (0.54) 4.4 (0.54) 4.4 (0.33)
surgical 4.2 (0.42)¥ 3.4 (0.77)* 4.2 (0.75)* 4.0 (0.77)* 3.9 (0.54)*
observed 4.45 (0.29) 4.28 (0.58) 4.50 (0.48) 4.27 (0.53) 4.37 (0.40)
braced 4.60 (0.31) 4.09 (0.47) 4.78 (0.29) 4.27 (0.48) 4.41 (0.31)
surgical 4.12 (0.56)* 3.28 (0.66)* 4.09 (0.72)* 3.96 (0.68)* 3.84 (0.47)*
non-surgical Cobb < 20o 4.5 (0.47) 4.1 (0.44) 4.6 (0.58) 4.4 (0.56) 4.4 (0.36)
non-surgical Cobb 20-40o 4.4 (0.37) 4.0 (0.54) 4.6 (0.51) 4.2 (0.64) 4.3 (0.38)
surgical Cobb 41-50o 4.1 (0.69) 3.5 (0.59)* 4.1 (0.72)* 4.1 (0.58) 3.9 (0.48)*
surgical Cobb 51-60o 4.2 (0.54) 3.3 (0.58)* 4.3 (0.65) 4.0 (058) 3.9 (0.44)*
surgical Cobb > 60o 4.3 (0.55) 3.5 (0.57)* 4.1 (0.91) 4.0 (0.80) 4.0 (0.53)**
Cobb < 45o - 3.43 (0.6) - - -
Cobb ≥ 45o - 3.0 (0.8)* - - -
Cobb < 45o 4.6 (0.5) 4.1 (0.7) 4.2 (0.7) 4.0 (0.7) 4.0 (0.5)
Cobb ≥ 80o 4.2 (0.7)* 3.5 (0.7)* 3.8 (0.9)* 3.8 (0.7)* 3.7 (0.5)*
pre-op 4.1 (0.58)¥ 3.3 (0.67) 3.9 (0.93) 4.0 (0.70) 3.8 (0.58) 63 (range 40 to 137)
2yrs post-op 4.3 (0.36)¥ 4.1 (0.61)* 4.3 (0.68)* 4.3 (0.48) 4.3 (0.42)* -
Effect size (Cohen's d) 0.3 ¥ 1.2 0.4 0.4 0.9 -
pre-op 4.15 (0.55) 3.29 (0.64) 4.10 (0.71) 3.96 (0.69) 3.86 (0.46) 53 (18)
1yr post-op 4.23 (0.46) 4.29 (0.58)* 4.35 (0.61)* 4.22 (0.64)* 4.30 (0.41)* -
Effect size (Cohen's d) 0.1 1.6 0.4 0.3 1 -
Pre-op 4.2 (0.5) 3.4 (0.7) 4.3 (0.7) 4.1 (0.7) 3.9 (0.4) 53.7 (12.8)
2yrs post-op 4.3 (0.4) 4.2 (0.6)* 4.4 (0.6) 4.3 (0.5) 4.3 (0.4)* 20.1 (10.5)
Effect size (Cohen’s d) 0 1.2 0.2 0.3 0.8 2.6
pre-op 4.5 (0.56) 3.4 (0.67) 4.1 (0.7) 4.0 (0.68) 3.9 (0.48) 55 (13)
2yrs post-op 4.6 (0.48) 4.4 (0.56) 4.4 (0.62) 4.2 (0.67) 4.4 (0.46) 20 (9)
Effect size (Cohen’s d) 0.2 1.5 0.4 0.3 1 2.7
Dis
crim
inat
ive
abili
ty (
mea
n sc
ore
s, S
D) Asher et al 2003c
Carreon et al 2011
Berliner et al 2012
Matamalas et al 2014
Bastrom et al 2015
* = statistically significant; § = p-values not reported
Res
pons
iven
ess
(mea
n sc
ore
s, S
D)
Asher et al 2003b
Carreon et al 2010
Carreon et al 2013
Bastrom et al 2015 §
italics = effect sizes calculated by author for this thesis; ¥ = using unrevised function scale

130
Table 5.12 MCID of SRS-22r
test study function self image pain mental health total score
Carreon et al 2010 0.08 0.98 0.2 - -
Bago et al 2009 0.0 1.6 0.2 0.4 0.4
Carreon et al 2010 0.65 (0.60–0.69) 0.63 (0.60–0.68) 0.72 (0.70–0.77) - -
Bago et al 2009 0.65 0.69 0.69 0.61 0.71
Carreon et al 2010 0.17 0.21 0.15 - -
Bago et al 2009 0.29 0.18 0.22 0.14 0.18
Carreon et al 2010 0.41 0.47 0.33 - -
Bago et al 2009 0.8 0.5 0.6 0.4 0.5
SEM = standard error of measurement; MDC = minimum detectable change
ROC
AUC
SEM
MDC
ROC = receiver operating characteristic; AUC = area under the curve
In summary, the SRS-22r appears to have excellent reliability and internal consistency.
Construct validity testing indicates that it has good convergence with other generic measures
of HRQoL (e.g. SF36), though less so with the EQ5D and measures of curve deformity such as
the Cobb angle. It is able to distinguish AIS patients with minor/moderate spinal deformities
from those with more severe changes (as indicated by Cobb angle and/or treatment status)
although it seems less sensitive to smaller differences between patients. Self-image appears to
be the only factor that responds with clinical significance following surgery with calculated
MCIDs indicating that a 1 to 1.6 change is required to indicate any meaningful change for the
patient. This supports the findings reported in the previous section for the SAQ and suggests
that improved self-image is an important outcome of surgery for people with AIS.
(ii) EQ-5D-3L
The EQ-5D-3L is a generic self-report HRQoL measure widely used across all health conditions
(Appendix 10). It consists of 5 domains: mobility, self-care, usual activities, pain/discomfort and
anxiety/depression. Each domain consists of 3 possible responses (no problems,
some/moderate problems, severe/extreme problems). It also includes a measure of current
health status using a visual analogue scale (VAS) ranging from 0 (worst imaginable health state)
to 100 (best imaginable health state).
There is also a 5L version of the EQ-5D which contains 5 possible responses to each domain,
therefore making it more sensitive and responsive to change. However, at the time the case

131
control study was conducted, no valuation set from which to derive utilities was available [31],
an important component of the health economic analysis of the feasibility study with which
this case control study was linked. The National Institute for Health and Care Excellence (NICE)
have also recently published their concerns with the metrics and tariff values for the 5L version
[31].
The psychometric properties of the EQ-5D-3L are well established across a number of different
disease states although only limited evaluation has occurred in AIS. These limited reports
suggest that it has good-to-excellent test-retest reliability and internal consistency (Table 5.13)
[26]. It also has reasonable convergent validity with the SRS-22r as described in previous
sections (see Table 5.10) although it does not appear to have any association with the most
commonly used radiographic measures of spinal deformity either pre- or post-surgery (Table
5.14). Greater association was seen with the Posterior Trunk Symmetry Index (POTSI), a
measure of surface trunk deformity and, therefore, more indicative of actual cosmetic, visible
trunk changes than an internal radiographic measure [32, 33].
Discriminative ability, responsiveness and MCID have not been investigated for the EQ-5D in
AIS to date.
Table 5.13 Reliability & internal consistency EQ-5D in AIS
property test overall index score VAS health state
test-retest reliability ICC 0.80 (0.68-0.88) 0.91 (0.85-0.95)
internal consistency Cronbach's α 0.89 (0.81-0.94) 0.95 (0.92-0.97)
Table 5.14 Convergent validity EQ-5D with spinal deformity measures
Pearson's r EQ5D score
Pre-operative Cobb 0.07
Post-operative Cobb -0.10
POTSI -0.54*
* statistically significant p<0.01

132
5.2.6.4 Generic function
(i) Paediatric Outcomes Data Collection Instrument (PODCI)
The PODCI is a generic self-report functional health outcomes measure designed for children
and adolescents with orthopaedic conditions (Appendix 11) [34]. It consists of 53 individual
items and is sub-divided into 7 sub-scales: upper extremity & physical function (8 items),
transfers and basic mobility (11 items), sports and physical functioning (12 items),
comfort/pain (3 items), global function (mean of the four previous scales), happiness with
physical condition (5 items) and expectations of treatment (9 items). The expectations of
treatment scale was not used for the case-control analysis. Standardised scores are calculated
for each scale ranging from 0 (worst) to 100 (best).
Five items are not included in these scales - they relate to ill-health/energy levels during last
week (2 items), school absence due to ill-health in last 12 months, ability to make friends, and
satisfaction with current condition (1 item each).
In comparison with the SRS-22r, the PODCI has undergone very limited investigation of its
psychometric properties. Those that have been performed have tended to focus on parent-
completed rather than patient-reported versions. In accordance with its original purpose,
these have encompassed a wide range of different conditions. To date, only one analysis of the
patient-reported version of PODCI has been performed with subjects with AIS [35].
Test-retest reliability of the patient-report form was initially evaluated in children and
adolescents suffering from a range of different orthopaedic and neuromuscular conditions,
including AIS (n=30, age 2-18 yrs) [36], and subsequently in children/adolescents with juvenile
idiopathic arthritis (JIA) (n=28, mean age 10.3yrs, SD 3.9) [37]. Despite using different analysis
methods, both studies reported high levels of reliability, although the comfort/pain and
happiness scales appeared to be less reliable in the JIA cohort (Table 5.15).
Similarly, internal consistency was also reported as excellent for the majority of scales by the
two studies, again with happiness demonstrating less consistency (Table 5.15).
The same studies have assessed construct validity through comparisons with either physician-
rated function or other HRQoL instruments and measures of disease activity (Table 5.16).
Reported correlation figures between these and the various function-related subscales

133
indicates a strong relationship suggesting a reasonable degree of convergence. In contrast, the
weak relationship between physician-rated function and the non-function PODCI scales (as
illustrated by the low correlation figures for the comfort/pain and happiness scales) indicates
satisfactory divergent validity. Note that for the multiple condition cohort, physician rated
function was compared with the combined scores of parent and patient-completed forms [36].
Only one study has investigated the discriminative ability of the patient-completed PODCI in
AIS (Table 5.17) [35]. Statistically significant differences were reported between AIS patients
and non-scoliotic controls for the transfers/mobility, global function, sports/physical function
and comfort/pain scales, with AIS patients recording lower scores (i.e. worse performance)
particularly for the latter two scales (difference between means 10.8 and 11.5 respectively).
Note that the controls for this comparison were from a separate study [38].
In contrast, the PODCI does not seem to be able to discriminate between AIS subjects with
varying degrees of spinal deformity as evidenced by the lack of statistically significant
differences between groups with increasing Cobb angles. Nor does it seem able to distinguish
between AIS patients who have undergone surgery from non-surgical cases.
These results probably reflect 1) the relatively small sample sizes involved, 2) that the PODCI is
a generic orthopaedic rather than an AIS-specific measure, and 3) that AIS does not usually
involve major changes in function or other domains covered by the PODCI.
Table 5.15 Reliability - PODCI
property test studyupper
extremitytransfers sports
comfort /
painglobal happiness
Pearson's rDaltroy et al
1998§ 0.96 0.97 0.87 0.89 0.95 0.87
ICCdo Monte et
al 20130.97* 0.81* 0.97* 0.59* - 0.53*
Daltroy et al
1998§ 0.84 0.91 0.9 0.84 0.92 0.76
do Monte et
al 2013- - - - 0.82 -
test-retest
reliability
internal
consistency
Cronbach's
α
* = statistically significant; § = no p-values provided
¥ = parent & adolescent-completed forms combined

134
Table 5.16 Construct validity PODCI
study correlation withupper
extremitytransfers sports
comfort /
painglobal happiness
Daltroy et
al 1998§
physician rating
global function¥ 0.62 (0.40) 0.75 (0.67) 0.73 (0.70) 0.24 (0.23) 0.76 (0.68) 0.25 (0.20)
CHQ PF-28
physical function
(Spearman's rho)
- - - - 0.67* -
active joints
(Spearman's rho)- - - - -0.51* -
limited joints
(Spearman's rho)- - - - -0.56* -
* = statistically significant; § = no p-values provided
¥ = parent & adolescent-completed forms combined; test-type not provided
do Monte
et al 2013
Table 5.17 Discriminative ability of PODCI in AIS
group nupper
extremitytransfers sports
comfort /
painglobal happiness
normals¥ 27 99.3 (1.6) 99.9 (0.6) 97.1 (3.8) 86.7 (14.5) 95.8 (3.8) 86.3 (12.5)
AIS 95 96.6 (7.6) 97.0 (5.4)* 86.3 (14.8)* 75.2 (22.4)* 88.8 (9.3)* 81.7 (18.1)
Cobb 10-29o 23 98.6 (2.9) 98.7 (2.8) 80.2 (12.7) 74.3 (24) 90.5 (9.5) 83.5 (16.6)
Cobb 30-49o 20 96.2 (5.1) 94.8 (7.7) 85.1 (16.1) 74.2 (17.5) 87.6 (9.4) 81.8 (17.9)
Cobb ≥50o 4 96.0 (4.6) 97.0 (3.5) 89.5 (13.1) 64.8 (24.2) 86.8 (10.0) 65.0 (37.0)
surgery 46 95.8 (10.1) 97.0 (5.2) 84.2 (15.4) 76.8 (24.0) 88.4 (9.5) 82.1 (17.0)
no surgery 49 97.4 (4.1) 96.9 (5.6) 88.3 (14.0) 73.7 (20.9) 89.1 (9.3) 81.3 (19.3)
*= statistically significant difference between normals and AIS patients
¥ = from previous study Haynes & Sullivan 2001
In summary, the PODCI again appears to be a reliable instrument in AIS although more
evidence is required to fully establish its validity. The currently available literature suggests it is
not able to distinguish between cases based on severity of condition although there is limited
evidence that it can discriminate between subjects with AIS and non-scoliotic controls. No
assessment of responsiveness to treatment or calculation of the MCID has been performed to
date for the PODCI in AIS.

135
5.2.6.5 Body awareness
Body awareness covers a range of different concepts. As part of this thesis, body awareness in
relation to sensorimotor perception was of particular interest. For this reason, instruments
designed to evaluate this aspect were considered for inclusion. The Body Awareness
Questionnaire (BAQ) [39] and the Body Consciousness Questionnaire [40] focus on awareness
of autonomic processes such as hunger and fatigue amongst other domains but do not
specifically cover awareness of sensorimotor processes related to movement and posture. In
contrast, the Kinaesthetic and Proprioceptive Awareness Questionnaire (KPAQ) is a body
awareness questionnaire focussing on self-reported proprioceptive and kinaesthetic sensitivity.
It specifically addresses the “specific awareness and attribution of kinesthetic [sic] and
proprioceptive cues from the body’s limbs, muscles, etc” [41].
(i) Kinaesthetic and Proprioceptive Awareness Questionnaire (KPAQ)
The KPAQ consists of 12-items and responses are given on a 5-point Likert scale which rates
the accuracy of the statement for the subject (Appendix 12). Overall scores range from 12
(worst) to 60 (best).
The KPAQ is derived from an initial set of three questions proposed by Smith-Jackson [42].
Subsequent development occurred as part of a study exploring the relationships between
psychosocial factors, biomechanical factors and musculoskeletal discomfort in the workplace
[41].
Internal consistency was reported as good (Cronbach’s α=0.82) and construct validity
demonstrated in comparisons with the Body Awareness Questionnaire (Pearson’s r=0.64,
p<0.0001) [41]. The KPAQ has also demonstrated a strong correlation with trunk
proprioception in adults during two small pilot studies [43, 44], suggesting that subjects have
some awareness of their own proprioceptive ability. These results indicate some degree of
convergent validity (Table 5.18).
As part of the original study using this instrument, KPAQ was evaluated against measures of
musculoskeletal discomfort, coping style, anxiety and personality type, with low and non-
significant correlations indicating divergent validity [41].

136
Table 5.18 Correlation between combined KPAQ/BAQ* score & trunk repositioning error
Kelaher et al 2003 Kelaher 2006
Flexion - -0.42
Lateral bending - -0.54
Axial rotation - -0.18
Mean score all 3 directions -0.77 -0.67
Type of movementcorrelation, r
* Body Awareness Questionnaire
Other aspects of psychometric testing (e.g. test-retest reliability, discriminative ability,
responsiveness, MCID) have yet to be assessed. The KPAQ has not been used previously with
children/adolescents or in AIS.
5.2.7 Physical measures of body schema
Physical measures of mechanisms thought to underpin body schema included evaluations of
tactile acuity (two point discrimination and stimulus localisation), laterality discrimination
(back and hands), proprioception (position matching), and spatial perception (line bisection
test). These have been described in detail in Chapter 4 and further information regarding
procedures, case report forms and scoring are described in appendices 14 to 19.
Data was also analysed taking into account the curve direction for cases and the corresponding
side for the matched controls. This involved recoding each of the initial trials into affected (i.e.
the direction of curve) and unaffected sides with respect to the side where testing was
conducted. For example, for cases, if the curve was convex to the right, then data for the trial
on the right side of the spine were reclassified as ‘Affected side’, and data from the left-side
trial were classified as ‘Unaffected side’. The reverse occurred for curves convex to the left.
Controls adopted the same classification as their matched case.
5.2.8 Bias
The main sources of bias in an observational study are selection bias and information bias (e.g.
misclassification, measurement error) [45]. Attempts were made to minimise selection bias
through the use of standardised inclusion/exclusion criteria and participant recruitment
procedures for both cases and controls (see section 5.2.3). The use of multiple recruitment

137
sites, and by recruiting both AIS and control participants from broadly similar regions, also
aimed to reduce selection bias. However, those who agreed to participate in the study were
self-selecting and it is impossible to determine the differences in any great detail between
them and those who declined to participate, particularly for the control group. Full details of all
those screened, recruited and followed up are described in the results section to enable
estimation of potential selection bias.
Misclassification was minimised in case participants by ensuring scoliotic status was confirmed
via medical imaging and specialist consultant review. In controls, a detailed physical
examination of the spine and clinical testing was performed by an experienced clinician in an
effort to ensure only non-scoliotic participants were included. However, the possibility exists
that some controls might go on to develop AIS later on (especially younger age groups) or may
have had changes too small to be noticed by clinical testing.
Attempts to reduce other forms of information bias included use of standardised outcome
assessment methods and assessor training. Procedures were tested prior to recruitment and
documented in a manual along with all other relevant study protocols. All personnel involved
in participant assessment and measurement were provided with this manual and completed
training to reduce the potential for measurement error. Subsequent visits by the author to
observe assessment sessions ensured compliance with testing protocols.
Unfortunately, assessors were not able to be blinded to the status of the participant. However,
different assessors for the case and control groups were used in an effort to minimise the
potential for bias. Scoliosis participants may also respond differently to testing compared with
control participants due to a heightened awareness of their trunk/spine rather than any ‘true’
difference. It is difficult to gauge how much of an impact this might have had.
Confounding variables are those that affect both the independent variable and the dependent
variable [46]. Known confounders for AIS and measures of body schema include age, physical
maturity (Risser sign) and, in some cases, sex. However, the possibility of an association being
due to other unknown variables is also a known risk [47]. Attempts to minimise this were taken
including matching the controls with AIS participants according to age, and sex, and; using
multivariate analyses to account for potential confounders (e.g. curve type, Cobb angle).

138
5.2.9 Statistical analysis
Data analysis was performed using the IBM SPSS Statistics (version 22) software package.
Categorical variables were summarised into frequency tables and chi-squared tests (or Fisher’s
exact test if count<5 in any category) performed where relevant to establish if observed values
were significantly different from expected frequencies.
Descriptive statistics were calculated for all continuous variables along with plots to illustrate
data distribution (histograms), medians and inter-quartile range (box plots), and means (with
95% confidence intervals). Independent t-tests were used to assess statistical significance of
the difference between group means. In the case of non-correctable non-normal distributions,
non-parametric tests (Mann Whitney U test) were used. Point-biserial correlations were
conducted to determine if group-type was related to individual parameters. Effect sizes were
calculated where relevant (Cohen’s d or Pearson’s r). Results were interpreted with regard to
likely clinical significance.
Within-group analyses using paired samples t-tests (or non-parametric Wilcoxon signed-rank
test) were also conducted to evaluate differences between left and right side and curve
direction for cases (and corresponding side for matched controls. Analysis based on curve
direction involved recoding each of the initial trials into affected (i.e. the direction of curve)
and unaffected sides with respect to the side where testing was conducted. For example, for
cases, if the curve was convex to the right, then data for the trial on the right side of the spine
were reclassified as ‘Affected side’, and data from the left-side trial were classified as
‘Unaffected side’. The reverse occurred for curves convex to the left. Controls adopted the
same classification as their matched case.
5.2.10 Ethics
Ethics approval for collection of data from cases was provided by NRES (East of England -
Cambridge South, 12/EE/0331) and the R&D departments of the NHS trusts involved. Approval
from University of Warwick BSREC (REGO-2013-590) enabled collection of data from the
control participants.
Both this study and the linked NIHR-funded feasibility study were registered with the ISRCTN
registry (16760995 and 90480705 respectively).

139
6 Research question 1 - case control study (results)
The previous chapter outlined the methodology to be used for the case control study
conducted as part of this thesis. This chapter presents the results of this study, initially
describing the results of the recruitment process and the sources of participant recruitment as
well as the demographic characteristics of both case and control participants. It then presents
the results of the measures evaluated, which included self-report questionnaires and physical
testing. A brief summary of the findings, along with a discussion of the limitations, completes
the chapter.
6.1 Participants
6.1.1 Cases
As described in Chapter 4, cases for this doctoral project were recruited as part of a NIHR-
funded feasibility study [1]. In total, 58 adolescents with AIS were recruited from four specialist
NHS sites (Table 6.1).
Table 6.1 Cases recruited by site
site n %
Royal Orthopaedic Hospital, Birmingham 20 34.5
Nuffield Orthopaedic Centre, Oxford 20 34.5
Frenchay Hospital, Bristol 11 19.0
James Cook University Hospital, Middlesbrough 7 12.0
total 58 100
Figure 6.1 gives a CONSORT-style breakdown of case recruitment from initial screening until
entry into the study. Recruitment involved three stages with an initial screening in clinic or by
patient notes, follow-up by telephone, and subsequent booking of a research clinic
appointment where formal consent and measures were taken. Note that figures for early
stages are compromised by missing screening data from some sites [1].
From the approximately 1632 patients that were initially screened, around 89% (~1455/1632)
were considered ineligible, primarily due to not having AIS. The remaining 177 patients (11%)

140
appeared to satisfy the requirements of the inclusion/exclusion criteria and attempts were
made to contact them regarding potential involvement in the study.
Figure 6.1 Consort diagram case control study*
*some figures approximate due to missing case screening data

141
Sixty-six of potentially eligible patients (37%) were unable to be contacted. Of the 111 (67%)
that could be contacted, 5 (5%) patients were deemed ineligible and a further 28 (25%)
declined to be involved, the main reasons cited being lack of time (n≈5) or unwillingness to
travel (n≈6). Willingness to be involved was uncertain in a further 18 patients.
Sixty patients were booked in for a research clinic appointment. Of these, 1 was subsequently
excluded as they had recently been placed on a waiting list for surgery. Another patient
withdrew their consent at the same stage, leaving 58 cases to be enrolled in to the study and
whose data went on to be analysed.
6.1.2 Controls
All primary and secondary schools in Coventry, along with all secondary schools in
Warwickshire and Oxfordshire, were contacted to request their participation. These schools
were identified from lists provided online by relevant local government bodies [2-4]. One
school in Leicestershire also expressed an interest in taking part. Of schools contacted, 5%
(10/193) gave permission to recruit students (Table 6.2).
Table 6.2 Number of schools involved in control participant recruitment, n (number contacted)
School type Coventry Warwickshire Oxfordshire Leicestershire Total
primary 1 (86) - - - 1 (86)
secondary 3 (21) 1 (35) 4 (50) 1 (1) 9 (107)
total 4 (107) 1 (35) 4 (50) 1 (1) 10 (193)
From these 10 schools, approximately 3249 students were approached to recruit age- and sex-
matched control participants. Of the initial 215 (7%) students who responded and were both
willing and eligible to take part, 3 subsequently withdrew prior to the research clinic
appointment and 4 were absent from school due to illness on the day of their appointment
(Figure 6.1).
At the research clinic itself, 2 students had findings from clinical observation that suggested
possible scoliosis, while a further 3 had conditions that precluded their involvement (2 learning

142
difficulties/autism; 1 fractured ankle). This left a total of 203 students enrolled into the study.
Unfortunately, 6 of these participants failed to complete their questionnaires and self-report
measures. Therefore, it was decided to exclude them, leaving a total of 197 for analysis (Table
6.3).
Table 6.3 Control recruitment by site
region site n %
Tudor Hall School 65 33.0
Marlborough C of E School 39 19.8
King Alfred’s Academy 23 11.7
Kingham Hill School 6 3.0
Leicestershire Lutterworth High School 19 9.6
Warwickshire Rugby School 12 6.1
Pattison College 20 10.2
St Gregory’s Primary School 7 3.6
Westwood Academy 4 2.0
Lyng Hall School 2 1.0
197 100
Oxfordshire
Coventry
total
6.1.3 Matching
Eighty-eight percent of cases (51/58) were matched (by age- and sex) to controls at the desired
1:3-4 ratio (Figure 6.2). The remaining 7 cases (12%), consisting primarily of those in the 16 to
17 yrs age group, were matched to 1 or 2 controls each (Figure 6.3).
The geographical spread of cases and controls relative to the recruiting sites (hospitals and
schools respectively) is illustrated in Figure 6.4.

143
Figure 6.2 Controls per case (by ID)
Figure 6.3 Controls per case (by age)
0
1
2
3
4
No
. of
mat
che
d c
on
tro
ls
Cases (ID)
Matched Controls per Case
0
1
2
3
4
No
. of
mat
ched
co
ntr
ols
Cases (age, yrs)
Matched Controls per Case (by age)

144
Figure 6.4 a) Case and hospital locations b) Control and school locations

145
6.2 Demographics
6.2.1 Matching variables
Sex and age distribution for the two groups are described in Table 6.4 and Table 6.5. The ratio
of female to male was equal between groups (≈5:1). Average age and age distribution was also
very similar with a difference in mean age between groups equivalent to 2.4 months.
Although participants across the range from 10 to 17 yrs were recruited in both groups, the
age distribution displayed a slight skew towards older age groups (Figure 6.5).
Table 6.4 Sex
case control total
n % n % n %
female 48 82.8 162 82.2 210 82.4
male 10 17.2 35 17.8 45 17.6
total 58 100 197 100 255 100
Table 6.5 Age (years)
n mean sd SE 95% CI median IQR min max
case 58 14.4 1.72 0.23 13.9, 14.8 14.6 13.1, 15.9 10.3 16.9
control 197 14.2 1.54 0.11 13.9, 14.4 14.3 13.1, 15.3 10.3 17.0

146
Figure 6.5 Histogram & boxplot of age by group
6.2.2 Other demographic variables
Self-reported ethnicity, handedness, family history of scoliosis and whether subjects had
reached puberty are reported in Table 6.6. Self-reported age of puberty onset, gross weekly
income, and measures of height, weight and BMI are described in Table 6.7. The ‘age of
puberty onset’ includes only those who reported having reached puberty.
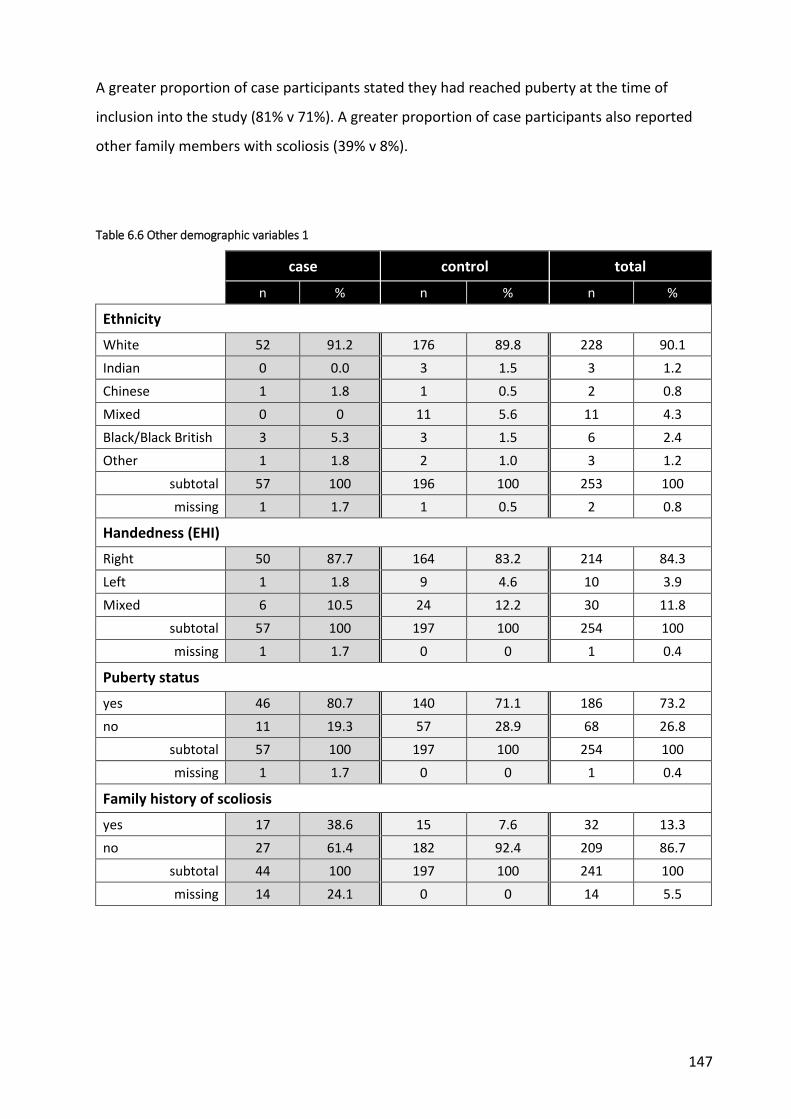
147
A greater proportion of case participants stated they had reached puberty at the time of
inclusion into the study (81% v 71%). A greater proportion of case participants also reported
other family members with scoliosis (39% v 8%).
Table 6.6 Other demographic variables 1
case control total
n % n % n %
Ethnicity
White 52 91.2 176 89.8 228 90.1
Indian 0 0.0 3 1.5 3 1.2
Chinese 1 1.8 1 0.5 2 0.8
Mixed 0 0 11 5.6 11 4.3
Black/Black British 3 5.3 3 1.5 6 2.4
Other 1 1.8 2 1.0 3 1.2
subtotal 57 100 196 100 253 100
missing 1 1.7 1 0.5 2 0.8
Handedness (EHI)
Right 50 87.7 164 83.2 214 84.3
Left 1 1.8 9 4.6 10 3.9
Mixed 6 10.5 24 12.2 30 11.8
subtotal 57 100 197 100 254 100
missing 1 1.7 0 0 1 0.4
Puberty status
yes 46 80.7 140 71.1 186 73.2
no 11 19.3 57 28.9 68 26.8
subtotal 57 100 197 100 254 100
missing 1 1.7 0 0 1 0.4
Family history of scoliosis
yes 17 38.6 15 7.6 32 13.3
no 27 61.4 182 92.4 209 86.7
subtotal 44 100 197 100 241 100
missing 14 24.1 0 0 14 5.5

148
Table 6.7 Other demographic variables 2
n mean sd SE 95% CI median IQR min max missing
n (%)
Age puberty onset (yrs)*
case 45 12.49 1.06 0.16 12.17, 12.81 13.00 12-13 9.00 15.00 1 (2.2)
control 137 12.35 1.04 0.09 12.17, 12.53 12.00 12-13 9.00 15.00 3 (2.1)
Income, postcode (weekly gross £)
case 58 748.79 231.97 30.46 687.8, 809.8 700.00 587.5, 860 430.00 1510.00 0 (0)
control 183 833.33 188.83 13.96 805.8, 860.9 860.00 690, 920 440.00 1710.00 14 (7.7)
Standing height, cm
case 58 162.66 11.00 1.44 159.8, 165.6 164.50 156, 170.3 127.00 187.00 0 (0)
control 197 162.44 9.48 0.68 161.1, 163.8 163.00 157.8, 168 122.50 186.00 0 (0)
Weight, kg
case 58 52.74 11.86 1.56 49.62, 55.86 54.00 44.5, 61 28.00 75.00 0 (0)
control 197 53.94 11.06 0.79 52.39, 55.5 54.40 46.2, 59.7 28.90 89.20 0 (0)
Body mass index (BMI)
case 58 19.55 3.19 0.42 18.71, 20.39 19.57 17.2, 21.2 13.45 27.48 0 (0)
control 197 20.32 3.25 0.23 19.86, 20.78 20.00 18, 22.1 14.36 35.25 0 (0)
* of those who reported reaching puberty in table 5.6

149
6.2.3 Spinal deformity characteristics - cases
There was almost an equal split between single (52.6%, 30/58) and double (45.6%, 26/58)
curve types, with one triple curve. Most of the primary curves (defined by the largest Cobb
angle) were reported as located in the thoracic region and convex to the right (Table 6.8).
Most participants (82%, 46/58) reported that they did not use a brace.
Table 6.8 Brace use & spinal deformity characteristics of 58 case participants
Category case missing
n % n (%)
Brace Yes 10 17.9
2 (3.4) No 46 82.1
Curve type
Single 30 52.6
1 (1.7) Double 26 45.6
Triple 1 1.8
Curve direction* Right 37 64.9
2 (1.7) Left 20 35.1
Curve location*
thoracic 36 62.1
0 (0) thoracolumbar 4 6.9
lumbar 17 29.3
unknown 1 1.7
Risser sign
0 - 0% 7 19.4
22 (37.9)
1 - 25% 3 8.3
2 - 50% 2 5.6
3 - 75% 7 19.4
4 - 100% 11 30.6
5 - skeletal maturity 6 16.7
* of primary curve
The Risser sign was not recorded in over a third of all cases. The main reason for the lack of
recording of the Risser sign was due to the images not being sufficiently extensive to allow for
its calculation.
In those where it was recorded, nearly half (47.2%, 17/36) were classified as in the final stages
or having already reached skeletal maturity. The rest were split almost equally between the

150
very early stages of skeletal maturation (27.8%, 10/36), with a Risser sign of 0 to 1, or mid-
stage (25%, 9/36), with a Risser sign of 2 to 3. The main reason for the lack of recording of the
Risser sign was due to the images not being sufficiently extensive to allow for its calculation.
The Cobb angle of the main curve ranged from 14 to 50o (mean = 34.02o, SD 10.0) indicating
that the cohort of cases ranged from mild to severe spinal deformity (Table 6.9 and Figure 6.6).
Absolute values for coronal and sagittal balance are also presented (Table 6.9 and Figure 6.7
and Figure 6.8). On average, sagittal and coronal imbalances were small and do not represent
a clinically significant departure from normal [5].
Table 6.9 Cobb angle (main curve) and spinal balance (absolute values) - descriptive statistics
Variable n mean sd SE 95% CI median min max IQR missing
n (%)
Cobb angle (o)
57 34.0 10.0 1.32 31.4 36.7 34.0 14.0 50.0 27-41 1 (1.7)
Coronal balance (mm)
55 17.8 13.6 1.83 14.1 21.4 15.0 0 50.0 8-27 3 (5.2)
Sagittal balance (mm)
42 37.8 28.8 4.44 28.8 46.7 29.0 0 97.0 16.8-
54 16
(27.6)
Figure 6.6 Cobb angle primary curve - histogram & boxplot
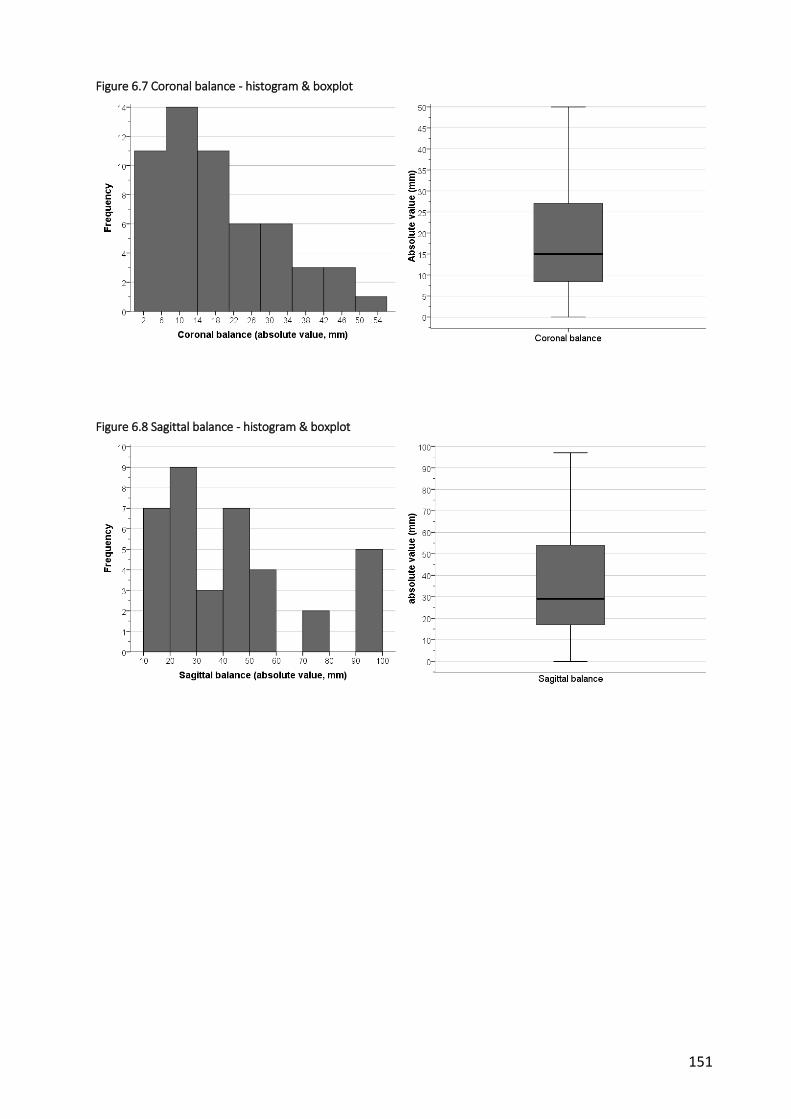
151
Figure 6.7 Coronal balance - histogram & boxplot
Figure 6.8 Sagittal balance - histogram & boxplot

152
6.3 Spinal Appearance Questionnaire (SAQ)
6.3.1 Appearance scale
Control participants scored towards the lower (i.e. better) end of the scale indicating that they
tended to select the images that represented a more ‘normal’ posture or alignment (Figure
6.9). In contrast, cases scores were more evenly distributed. This is reflected in the differences
in the mean and median scores between the two groups with cases recording double the
average scores than controls (Table 6.10). Statistical analysis (Mann-Whitney U test) revealed
that the 11 point difference in medians between the cases and controls was statistically
significant (median values = 22 and 11 respectively; U=266.00, z=11.07, p<0.001, r=0.70).
A point-biserial correlation was run to determine the relationship between perceived spinal
appearance and group type (i.e. case or control). Group type was significantly related to the
SAQ appearance score (rpb = 0.812; 95% BCa CI 0.741, 0.870; p<0.001) and shared 65.9% of the
variability in SAQ appearance score (rpb2=0.659) (Table 6.11).
6.3.2 Expectations scale
Control participant responses to the questions regarding desire/expectation for improvement
in posture and alignment were much lower than cases (Table 6.10 and Figure 6.10). This
reflected less of a desire amongst controls to change their alignment. The 9 point difference in
median scores between cases and controls was statistically significant (Mann-Whitney U test,
median values = 13 and 4 respectively; U=865.5, z=10.10, p<0.001, r=0.64).
A point-biserial correlation was run to determine the relationship between expectations and
group type (i.e. case or control). Group type was significantly related to the SAQ expectations
score (rpb = 0.732; 95% BCa CI 0.644, 0.805; p<0.001) and shared 53.6% of the variability in SAQ
expectations score (rpb2=0.536) (Table 6.11).
6.3.3 Total score
As would be expected, the combined score followed a similar pattern to the individual scales
with controls scoring better (i.e. lower) than cases (Table 6.10 and Figure 6.11). Statistical
analysis revealed that the 20 point difference in medians between cases and controls was

153
statistically significant (median values = 36 and 16 respectively; U=331.5, z=10.72, p<0.001,
r=0.68).
A point-biserial correlation was run to determine the relationship between SAQ total score and
group type (i.e. case or control). Group type was significantly related to the total score (rpb =
0.818; 95% BCa CI 0.759, 0.870; p<0.001) and shared 66.9% of the variability in SAQ total score
(rpb2=0.669) (Table 6.11).
Table 6.10 SAQ descriptive statistics
n mean sd SE 95% CI median IQR min max missing
n (%)
SAQ appearance (10 best - 50 worst)
case 56 22.6 5.91 0.79 21.0, 24.2
22.0 18-27.8 11 38 2 (3.4)
control 196 11.5 2.12 0.15 11.2, 11.8
11.0 10-12 10 27 1 (0.5)
SAQ expectations (4 best - 20 worst)
case 56 13.1 4.74 0.63 11.9, 14.4
13.0 9.25-17 4 20 1 (1.7)
control 196 5.31 2.36 0.17 4.97, 5.64
4.0 4-5 4 16 2 (1.0)
SAQ total score (14 best - 70 worst)
case 55 35.6 9.33 1.26 33.0, 38.1
36.0 28-43 15 55 3 (5.2)
control 195 16.8 3.76 0.27 16.3, 17.3
16.0 14-18 14 38 2 (1.0)

154
Figure 6.9 SAQ appearance histogram and box plot
Figure 6.10 SAQ expectations histogram and boxplot

155
Figure 6.11 SAQ total score histogram & boxplot
Table 6.11 SAQ - results of statistical analyses
measure scale
Difference between means/medians Correlation Group type v SAQ
test group diff
medians U z p-value
effect size**
rpb 95% BCa
CI rpb
2
SAQ
appearance Mann-
Whitney U case v control
11 266.0 11.07 <0.001* 0.70 0.812* 0.741, 0.870
0.659
expectations Mann-
Whitney U case v control
9 865.5 10.10 <0.001* 0.64 0.732* 0.644, 0.805
0.536
total Mann-
Whitney U case v control
20 331.5 10.72 <0.001* 0.68 0.818* 0.759, 0.870
0.669
* statistically significant; ** Pearson’s r
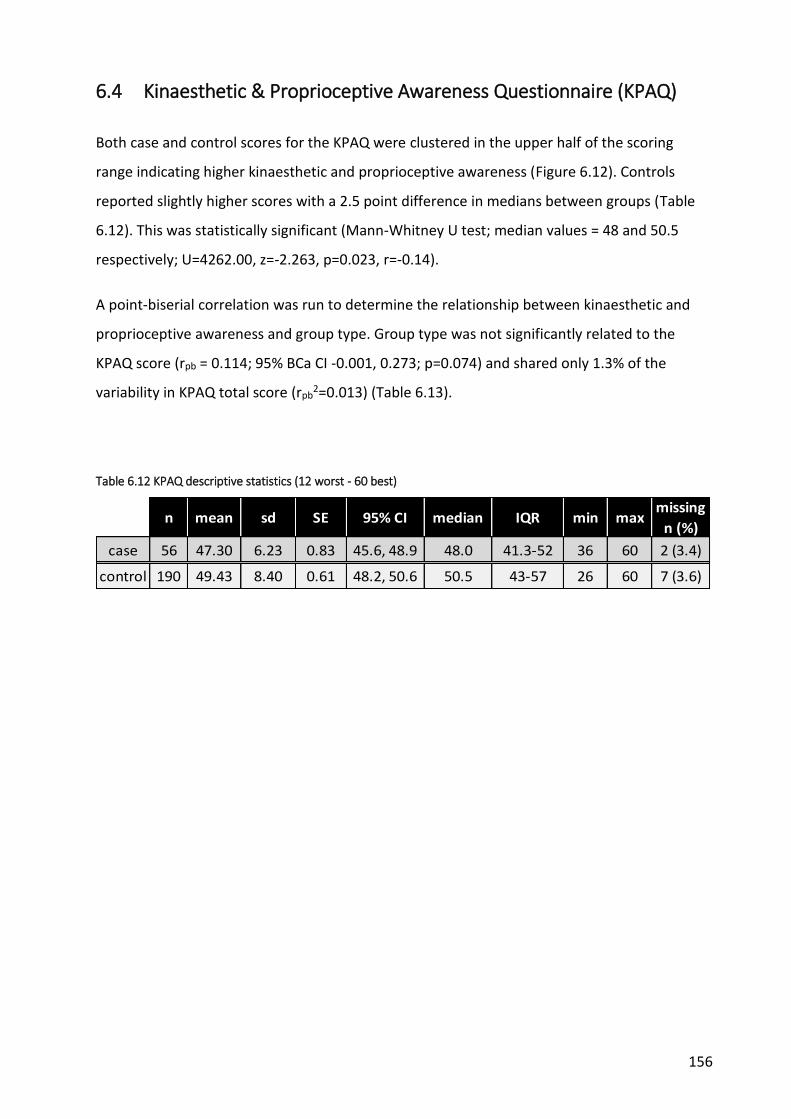
156
6.4 Kinaesthetic & Proprioceptive Awareness Questionnaire (KPAQ)
Both case and control scores for the KPAQ were clustered in the upper half of the scoring
range indicating higher kinaesthetic and proprioceptive awareness (Figure 6.12). Controls
reported slightly higher scores with a 2.5 point difference in medians between groups (Table
6.12). This was statistically significant (Mann-Whitney U test; median values = 48 and 50.5
respectively; U=4262.00, z=-2.263, p=0.023, r=-0.14).
A point-biserial correlation was run to determine the relationship between kinaesthetic and
proprioceptive awareness and group type. Group type was not significantly related to the
KPAQ score (rpb = 0.114; 95% BCa CI -0.001, 0.273; p=0.074) and shared only 1.3% of the
variability in KPAQ total score (rpb2=0.013) (Table 6.13).
Table 6.12 KPAQ descriptive statistics (12 worst - 60 best)
n mean sd SE 95% CI median IQR min maxmissing
n (%)
case 56 47.30 6.23 0.83 45.6, 48.9 48.0 41.3-52 36 60 2 (3.4)
control 190 49.43 8.40 0.61 48.2, 50.6 50.5 43-57 26 60 7 (3.6)

157
Figure 6.12 KPAQ histograms & boxplot
Table 6.13 KPAQ - results of statistical analyses
measure scale
Difference between means/medians Correlation Group type v KPAQ
test group diff
medians U z
p-value
effect size**
rpb 95% BCa
CI rpb
2
KPAQ total Mann-
Whitney U case v control
-2.5 4262.0 -2.263 0.023* -0.14 0.114 -0.001, 0.237
0.013
* statistically significant; ** Pearson’s r

158
6.5 Scoliosis Research Society questionnaire (SRS-22r)
6.5.1 Function scale
Both groups were negatively skewed with the majority of participants scoring at the upper end
of the scale indicating higher function (Figure 6.13). Despite no difference in median scores
(Table 6.14), statistical analysis revealed a significant difference between groups in favour of
the control group (Mann-Whitney U test; median values = 4.8; U=4480.00, z=-2.47, p=0.013,
r=-0.15). This is because the Mann-Whitney U test compares distribution or rankings between
groups rather than testing the difference in medians directly [6].
A point-biserial correlation was run to determine the relationship between function and group
type. Group type was significantly related to the function score (rpb = 0.240; 95% BCa CI 0.087,
0.389; p<0.001) although it shared only 5.8% of the variability in SRS-22r function score
(rpb2=0.058) (Table 6.15).
6.5.2 Pain scale
Controls generally experienced little if any pain as evidenced by the clustering of scores
towards the upper end of the scale (Table 6.14). In contrast, case scores were more evenly
spread suggesting they experienced more problems with pain (Figure 6.14). The 0.6 point
difference in median scores between groups was statistically significant (Mann-Whitney U test;
median values = 4.2 and 4.8 respectively; U=2126.00, z=-7.341, p<0.001, r=-0.46).
A point-biserial correlation was run to determine the relationship between pain and group
type. Group type was significantly related to the pain score (rpb =0.535; 95% BCa CI 0.436,
0.629; p<0.001) and shared 28.6% of the variability in SRS-22r pain score (rpb2=0.286) (Table
6.15).
6.5.3 Self-image scale
Results for the self-image scale were similar to the pain scale with cases reporting lower scores
and therefore greater problems with self-image (Figure 6.15 and Table 6.14). The 0.97 point
difference in means (-0.76 to -1.78 95% CI) between cases and controls was statistically
significant (mean values = 3.40 and 4.37 respectively; independent t-test, t=9.39, df=70.7,
p<0.001, d = -0.50).

159
A point-biserial correlation was run to determine the relationship between self-image and
group type. Group type was significantly related to the self-image score (rpb =0.594; 95% BCa CI
0.509, 0.680; p<0.001) and shared 35.3% of the variability in SRS-22r self-image score
(rpb2=0.353) (Table 6.15).
6.5.4 Mental health scale
The average and distribution of scores was very similar between groups (Table 6.14 and Figure
6.16). The 0.2 difference in medians between cases and controls was not statistically
significant (median values = 4.2 and 4.0 respectively; Mann-Whitney U test, U=5519.50,
z=0.196, p=0.846, r=0.01).
A point-biserial correlation was run to determine the relationship between mental health and
group type. Group type was not significantly related to the mental health score (rpb =0.067;
95% BCa CI -0.096, 0.226; p=0.284) and shared only 0.4% of the variability in SRS-22r mental
health score (rpb2=0.004) (Table 6.15).
6.5.5 Subtotal score
The differences between groups for the combined SRS-22r score were driven primarily by the
differences in the pain and self-image subscales (Figure 6.17 and

160
Table 6.14). This resulted in cases reporting lower and therefore worse subtotal scores on
average with a difference in means of 0.5 (-0.34 to -0.66 95% CI) which was statistically
significant (independent t-test, t=6.27, df=65.68, p<0.001, d = -0.62).
A point-biserial correlation was run to determine the relationship between the total score and
group type. Group type was significantly related to the total score (rpb =0.476; 95% BCa CI
0.361, 0.586; p<0.001) and shared 22.7% of the variability in SRS-22r total score (rpb2=0.227)
(Table 6.15).

161
Table 6.14 SRS-22r scores
scale (1 worst -
5 best) group n mean sd SE
95% CI
median IQR min max missing
n (%)
function case 57 4.60 0.45 0.06
4.48, 4.72
4.80 4.2, 5.0
3.40 5.00 1 (1.7)
control 197 4.79 0.27 0.02 4.75, 4.83
4.80 4.6, 5.0
3.80 5.00 0
pain case 57 3.96 0.76 0.1
3.76, 4.17
4.20 3.4, 4.6
1.80 5.00 1 (1.7)
control 197 4.7 0.37 0.03 4.64, 4.75
4.80 4.5, 5.0
3.20 5.00 0
self image
case 57 3.40 0.74 0.1 3.20, 3.60
3.40 2.8, 3.8
1.80 5.00 1 (1.7)
control 197 4.37 0.49 0.03 4.30, 4.44
4.40 4.0, 4.8
3.00 5.00 0
mental health
case 57 3.9 0.9 0.12 3.66, 4.14
4.2 3.3, 4.6
1.8 5 1 (1.7)
control 197 4.01 0.59 0.04 3.93, 4.09
4.0 3.6, 4.4
1.8 5 0
total score
case 57 3.97 0.58 0.08 3.81, 4.12
4.10 3.5, 4.4
2.70 4.85 1 (1.7)
control 197 4.47 0.31 0.02 4.42, 4.51
4.50 4.3-4.7
3.55 5.00 0

162
Figure 6.13 SRS-22r function histogram & boxplot
Figure 6.14 SRS-22r pain histogram & boxplot

163
Figure 6.15 SRS-22r self-image histogram & boxplot
Figure 6.16 SRS-22r mental health histogram & boxplot

164
Figure 6.17 SRS-22r total score histogram & boxplot
Table 6.15 SRS-22r - results of statistical analyses
scale Difference between means/medians Correlation Group type v SRS-22r
test diff
medians U z p-value
effect size**
rpb 95% BCa CI rpb2
function Mann-Whitney U 0 4480.0 -2.47 0.013* -0.15 0.240* 0.087, 0.389 0.058
pain Mann-Whitney U -0.6 2126.0 -7.34 <0.001* -0.46 0.535* 0.436, 0.629 0.286
mental health
Mann-Whitney U 0.20 5519.5 0.20 0.846 0.01 0.067 -0.096, 0.226 0.004
scale test diff
means 95% CI t df p-value
effect size¥
rpb 95% BCa CI rpb2
self-image
independent t-test -0.97 -0.76, -1.78 9.39 70.7 <0.001* -0.50 0.594* 0.509, 0.680 0.353
total independent t-test -0.50 -0.34, -0.66 6.27 65.7 <0.001* -0.62 0.476* 0.361, 0.586 0.227
* statistically significant; ** Pearson’s r; ¥ Cohen’s d

165
6.6 EQ 5D - 3L
Frequency of responses for each domain is reported in
Table 6.16 and graphically in Figure 6.18. In general, more than 70% of both cases and controls
reported no problems across all domains apart from pain. Due to the very low number of
responses for ‘extreme problems’ across all domains, this category was combined with ‘some
problems’ for further analysis (Table 6.17).
6.6.1 Mobility
The majority of participants in both groups stated they had no problems walking about.
However, there were notable discrepancies between observed and expected frequencies for
both groups (Table 6.17). This is reflected in the large differences between the proportion of
cases and controls reporting problems as opposed to those reporting none. Cases made up
71.4% (10/14) of all participants who described mobility problems but only 19.7% (47/239) of
those with no issues. In contrast, controls formed 28.6% (4/14) of participants with problems
but 80.3% (192/239) of those without. Only one (case) participant reported extreme problems
with mobility.
Fisher’s exact test results indicated that the null hypothesis (group-type and the presence of
mobility problems were independent) can be rejected (χ2=20.30, df=1, p<0.001). This suggests
that there is an association between group type and whether or not participants had problems
(Table 6.19).
Based on the odds ratio, the odds of participants having problems with mobility were 10.21
times higher for cases than controls (3.1 to 34.0 95% CI, z=3.79, p=0.0002).
6.6.2 Self-care
Virtually all participants in both groups reported no problems with self-care. Only small
differences existed between observed and expected counts, as well as between proportions
with or without problems within each group (cases with/without problems 33.3% / 22.4%;
controls 66.7% / 77.6%) (Table 6.17). One (control) participant reported extreme problems
with self-care.
166
Statistical analysis concluded with a non-significant result (χ2=0.203, df=1, p=0.537, Fisher’s
exact test; OR=1.73, 0.15 to 19.5 95% CI, z=0.445, p=0.656), therefore the null hypothesis
could not be rejected (Table 6.19). Consequently, there is no evidence of an association
between group type and reported problems, i.e. both cases and controls are just as likely to
have problems (or not) with self-care.
6.6.3 Usual activities
The results for usual activities were very similar to those reported for mobility. Again there
were notable differences between observed and expected frequencies, as well as in the
proportion of those reporting problems versus those that didn’t within groups (cases
with/without problems 66.7% / 19.1%; controls 33.3% / 80.9%) (Table 6.17). One control
participant reported they were unable to perform usual activities (i.e. extreme problems).
Fisher’s exact test was significant (χ2=21.77, df=1, p<0.001), leading to rejection of the null
hypothesis and suggesting a significant association between group type and whether or not
participants reported problems (Table 6.19).
Based on the odds ratio, the odds of participants having problems with usual activities were
8.49 times higher for cases than controls (3.0 to 23.8 95% CI, z=4.06, p<0.001).
6.6.4 Pain or discomfort
The most notable feature of the results for the pain domain is that, while the majority of
control participants followed the established pattern of reporting no problems, the majority of
cases reported they suffered from at least moderate pain or discomfort (Figure 6.18 and Table
6.17). One control and one case participant reported extreme pain or discomfort.
The lack of equality between observed/expected frequencies and in the proportions of those
with/without problems within groups, suggested that the response pattern (pain/no pain) was
heavily influenced by group type.
This was confirmed by statistical testing. The null hypothesis was rejected suggesting a
statistically significant association between group type (case v control) and whether or not
participants reported pain or discomfort (χ2= 56.301, df=1, p<0.001).

167
Based on the odds ratio, the odds of participants having pain or discomfort were 10.31 times
higher for cases than controls (5.3 to 20.1 95% CI, z=6.84, p<0.001) (Table 6.19).
6.6.5 Anxiety or depression
The majority of participants reported no problems although a sizeable minority indicated that
they suffered from at least a moderate level of anxiety or depression (≈20%). However, the
observed/expected frequencies and proportions of those who described suffering some
anxiety compared to those that reported none within groups were roughly equal (cases
with/without anxiety 31.3% / 20.5%; controls 68.8% / 79.5%) (Table 6.17). Three cases and one
control reported feeling extremely anxious or depressed.
Statistical testing was non-significant therefore the null hypothesis could not be rejected (χ2=
2.581, df=1, p=0.125; OR=1.76, 0.88 to 3.55 95% CI, z=1.593, p=0.111) (Table 6.19).
Consequently, there is no evidence to suggest an association between group type and
presence or not of anxiety or depression.
6.6.6 Health state VAS
Results for both groups were clustered towards the upper end of the scale indicating relatively
high self-evaluations of current health state overall (Table 6.18). However, some participants
recorded quite low scores resulting in a relatively large degree of negative skew in both groups
(Figure 6.19).
On average, cases reported worse current health states than controls (medians = 85 and 92
respectively). This 7 point difference was statistically significant, resulting in rejection of the
null hypothesis of no difference between groups (Mann-Whitney U test, U=3335.50, z=-4.612,
p<0.001, r=-0.29) (Table 6.19).
A point-biserial correlation was run to determine the relationship between perceived health
state and group type. Group type was significantly related to the health state score (rpb =
0.300; 95% BCa CI 0.164, 0.425; p<0.001) although it shared only 9% of the variability in EQ5D
health state score (rpb2=0.09) (Table 6.19).

168
Table 6.16 EQ5D 3L observed counts
domain case control total
n % n % n %
mobility
1 no problems 47 82.5 192 98.0 239 94.5
2 some problems 9 15.8 4 2.0 13 5.1
3 extreme problems 1 1.8 0 0 1 0.4
subtotal 57 100 196 100 253 100
missing 1 1.7 1 0.5 2 0.8
self-care
1 no problems 56 98.2 194 99.0 250 98.8
2 some problems 1 1.8 1 0.5 2 0.8
3 extreme problems 0 0 1 0.5 1 0.4
subtotal 57 100 196 100 253 100
missing 1 1.7 1 0.5 2 0.8
activity
1 no problems 45 78.9 191 97.0 236 92.9
2 some problems 12 21.1 5 2.5 17 6.7
3 extreme problems 0 0 1 0.5 1 0.4
subtotal 57 100 197 100 254 100
missing 1 1.7 0 0 1 0.4
pain
1 no problems 19 33.3 165 83.8 184 72.4
2 some problems 37 64.9 31 15.7 68 26.8
3 extreme problems 1 1.8 1 0.5 2 0.8
subtotal 57 100 197 100 254 100.0
missing 1 1.7 0 0 1 0.4
anxiety
1 no problems 42 73.7 163 83.2 205 81.0
2 some problems 12 21.1 32 16.3 44 17.4
3 extreme problems 3 5.3 1 0.5 4 1.6
subtotal 57 100 196 100 253 100
missing 1 1.7 1 0.5 2 0.8

169
Figure 6.18 EQ5D - 3L domains

170
Table 6.17 EQ5D 3L combined problems - expected counts, proportions & odds ratio
domain
case control total
problem category
case control
OR observed expected observed expected %
problem category
odds %
problem category
odds n (%) n (%) n (%) n (%)
mobility*
no problems 47 (82.5) 53.8 (94.4) 192 (98.0) 185.2 (94.5) 239 19.7 4.7 80.3 48 0.10
problems 10 (17.5) 3.2 (5.6) 4 (2.0) 10.8 (5.5) 14 71.4 0.213 28.6 0.021 10.21
subtotal 57 (100) 57 196 (100) 196 - - - - - -
missing 1 (1.7) - 1 (0.5) - - - - - - -
self-care
no problems 56 (98.2) 56.3 (98.8) 194 (99.0) 193.7 (98.8) 250 22.4 56.0 77.6 97 0.58
problems 1 (1.8) 0.7 (1.2) 2 (1.0) 2.3 (1.2) 3 33.3 0.018 66.7 0.01 1.73
subtotal 57 (100) 57 196 (100) 196 - - - - - -
missing 1 (1.7) - 1 (0.5) - - - - - - -
activity*
no problems 45 (78.9) 53 (93.0) 191 (97.0) 183 (92.9) 236 19.1 3.75 80.9 31.83 0.12
problems 12 (21.1) 4 (7.0) 6 (3.0) 14 (7.1) 18 66.7 0.267 33.3 0.031 8.49
subtotal 57 (100) 57 197 (100) 197 - - - - - -
missing 1 (1.7) - 0 - - - - - - -
pain*
no problems 19 (33.3) 41.3 (72.5) 165 (83.8) 142.7 (72.4) 184 10.3 0.50 89.7 5.16 0.10
problems 38 (66.7) 15.7 (27.5) 32 (16.2) 54.3 (27.6) 70 54.3 2.00 45.7 0.194 10.31
subtotal 57 (100) 57 197 (100) 197 - - - - - -
missing 1 (1.7) - 0 - - - - - - -
anxiety
no problems 42 (73.7) 46.2 (81.1) 163 (83.2) 158.8 (81.0) 205 20.5 2.8 79.5 4.94 0.57
problems 15 (26.3) 10.8 (18.9) 33 (16.8) 37.2 (19.0) 48 31.3 0.357 68.8 0.202 1.76
subtotal 57 (100) 57 196 (100) 196 - - - - - -
missing 1 (1.7) - 1 (0.5) - - - - - - -
* statistically significant difference between groups
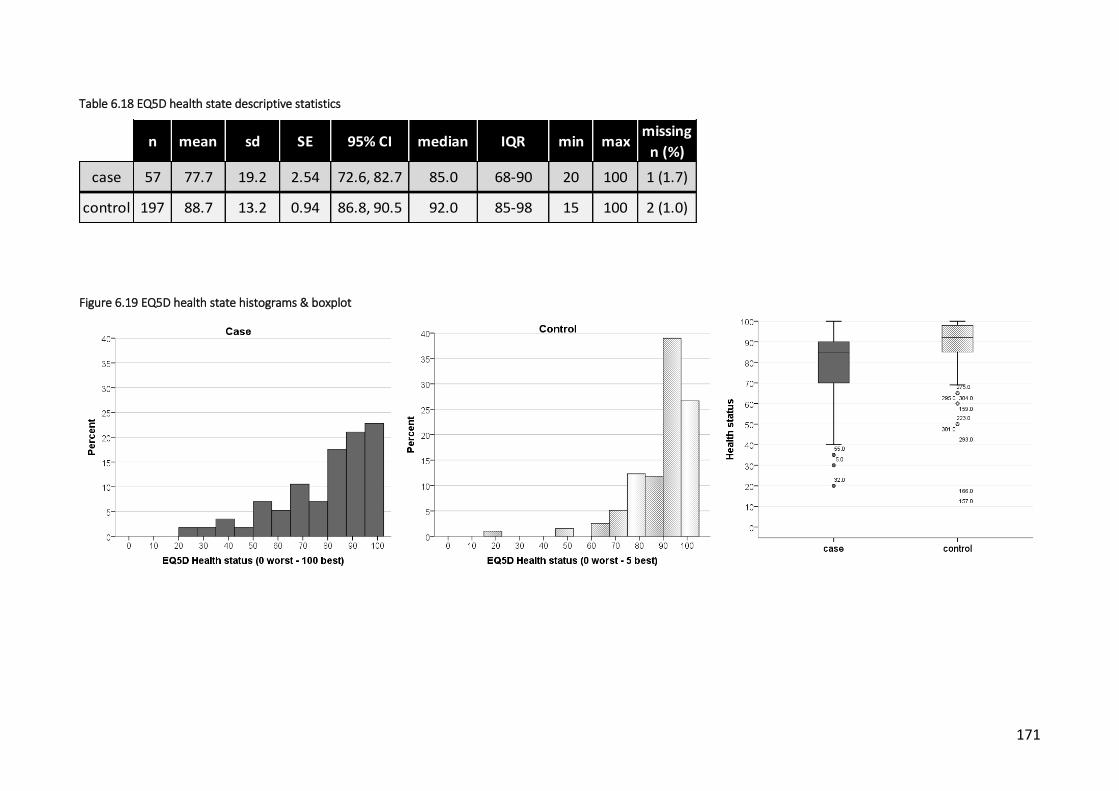
171
Table 6.18 EQ5D health state descriptive statistics
n mean sd SE 95% CI median IQR min maxmissing
n (%)
case 57 77.7 19.2 2.54 72.6, 82.7 85.0 68-90 20 100 1 (1.7)
control 197 88.7 13.2 0.94 86.8, 90.5 92.0 85-98 15 100 2 (1.0)
Figure 6.19 EQ5D health state histograms & boxplot
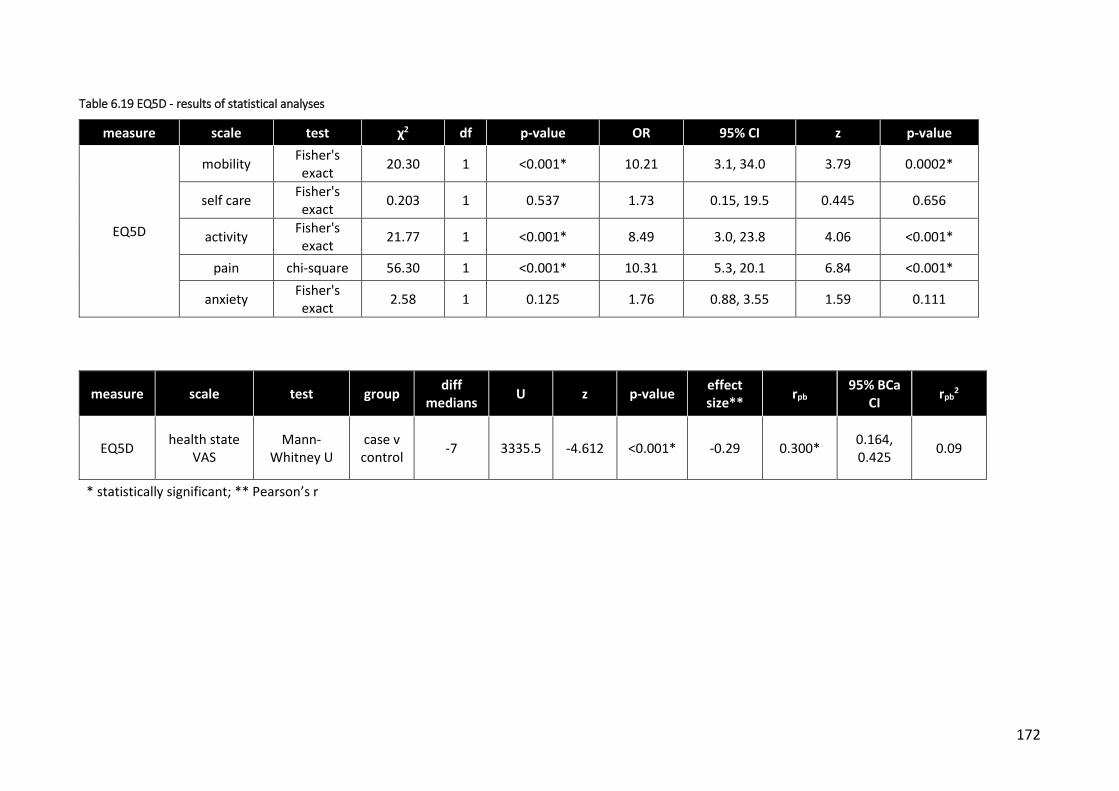
172
Table 6.19 EQ5D - results of statistical analyses
measure scale test χ2 df p-value OR 95% CI z p-value
EQ5D
mobility Fisher's exact
20.30 1 <0.001* 10.21 3.1, 34.0 3.79 0.0002*
self care Fisher's exact
0.203 1 0.537 1.73 0.15, 19.5 0.445 0.656
activity Fisher's exact
21.77 1 <0.001* 8.49 3.0, 23.8 4.06 <0.001*
pain chi-square 56.30 1 <0.001* 10.31 5.3, 20.1 6.84 <0.001*
anxiety Fisher's exact
2.58 1 0.125 1.76 0.88, 3.55 1.59 0.111
measure scale test group diff
medians U z p-value
effect size**
rpb 95% BCa
CI rpb
2
EQ5D health state
VAS Mann-
Whitney U case v control
-7 3335.5 -4.612 <0.001* -0.29 0.300* 0.164, 0.425
0.09
* statistically significant; ** Pearson’s r
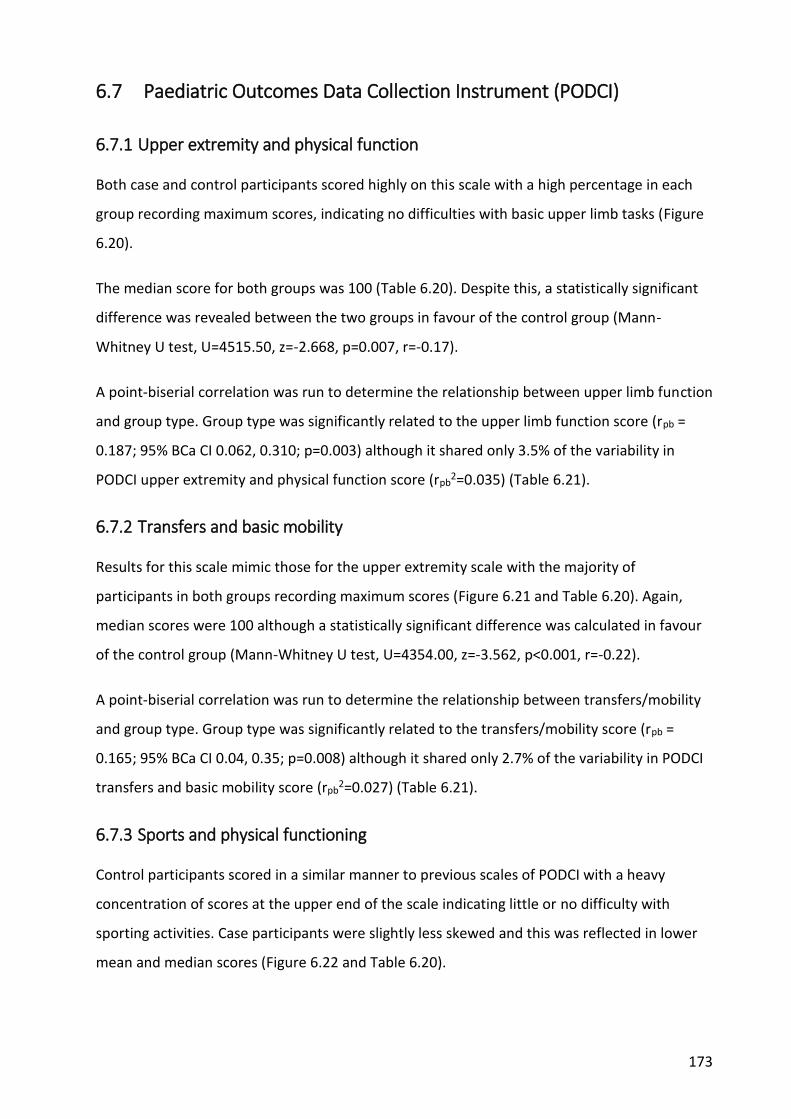
173
6.7 Paediatric Outcomes Data Collection Instrument (PODCI)
6.7.1 Upper extremity and physical function
Both case and control participants scored highly on this scale with a high percentage in each
group recording maximum scores, indicating no difficulties with basic upper limb tasks (Figure
6.20).
The median score for both groups was 100 (Table 6.20). Despite this, a statistically significant
difference was revealed between the two groups in favour of the control group (Mann-
Whitney U test, U=4515.50, z=-2.668, p=0.007, r=-0.17).
A point-biserial correlation was run to determine the relationship between upper limb function
and group type. Group type was significantly related to the upper limb function score (rpb =
0.187; 95% BCa CI 0.062, 0.310; p=0.003) although it shared only 3.5% of the variability in
PODCI upper extremity and physical function score (rpb2=0.035) (Table 6.21).
6.7.2 Transfers and basic mobility
Results for this scale mimic those for the upper extremity scale with the majority of
participants in both groups recording maximum scores (Figure 6.21 and Table 6.20). Again,
median scores were 100 although a statistically significant difference was calculated in favour
of the control group (Mann-Whitney U test, U=4354.00, z=-3.562, p<0.001, r=-0.22).
A point-biserial correlation was run to determine the relationship between transfers/mobility
and group type. Group type was significantly related to the transfers/mobility score (rpb =
0.165; 95% BCa CI 0.04, 0.35; p=0.008) although it shared only 2.7% of the variability in PODCI
transfers and basic mobility score (rpb2=0.027) (Table 6.21).
6.7.3 Sports and physical functioning
Control participants scored in a similar manner to previous scales of PODCI with a heavy
concentration of scores at the upper end of the scale indicating little or no difficulty with
sporting activities. Case participants were slightly less skewed and this was reflected in lower
mean and median scores (Figure 6.22 and Table 6.20).
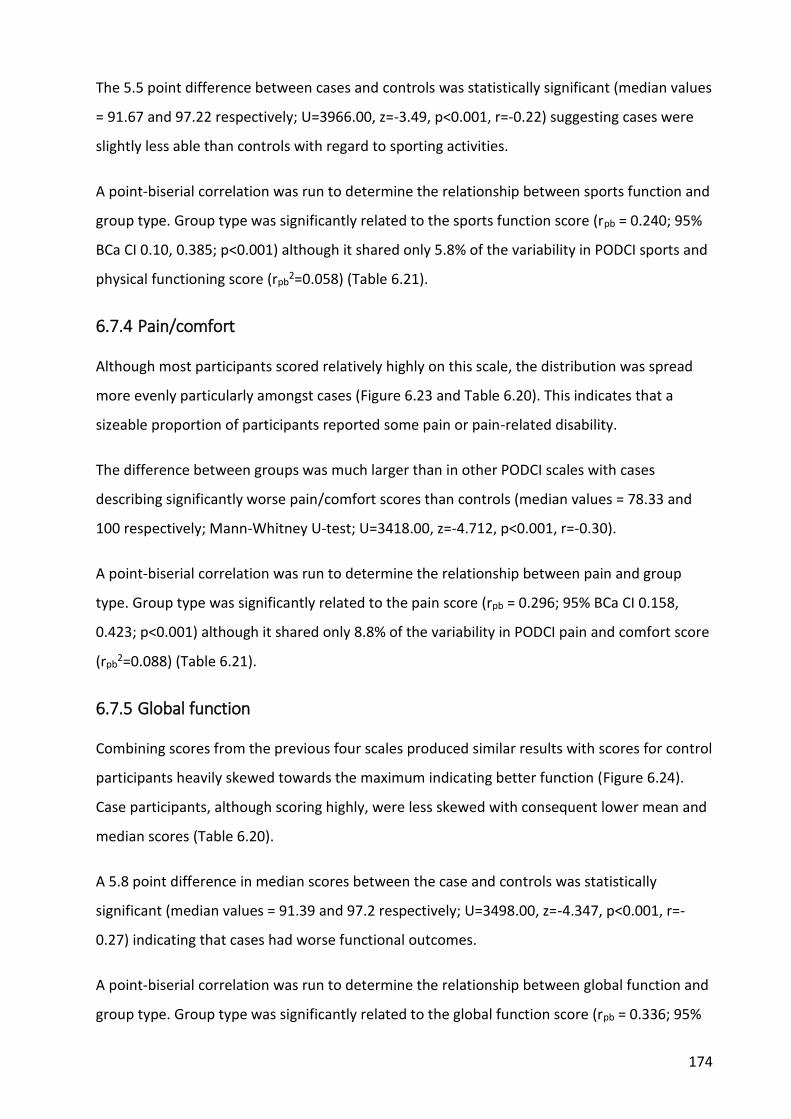
174
The 5.5 point difference between cases and controls was statistically significant (median values
= 91.67 and 97.22 respectively; U=3966.00, z=-3.49, p<0.001, r=-0.22) suggesting cases were
slightly less able than controls with regard to sporting activities.
A point-biserial correlation was run to determine the relationship between sports function and
group type. Group type was significantly related to the sports function score (rpb = 0.240; 95%
BCa CI 0.10, 0.385; p<0.001) although it shared only 5.8% of the variability in PODCI sports and
physical functioning score (rpb2=0.058) (Table 6.21).
6.7.4 Pain/comfort
Although most participants scored relatively highly on this scale, the distribution was spread
more evenly particularly amongst cases (Figure 6.23 and Table 6.20). This indicates that a
sizeable proportion of participants reported some pain or pain-related disability.
The difference between groups was much larger than in other PODCI scales with cases
describing significantly worse pain/comfort scores than controls (median values = 78.33 and
100 respectively; Mann-Whitney U-test; U=3418.00, z=-4.712, p<0.001, r=-0.30).
A point-biserial correlation was run to determine the relationship between pain and group
type. Group type was significantly related to the pain score (rpb = 0.296; 95% BCa CI 0.158,
0.423; p<0.001) although it shared only 8.8% of the variability in PODCI pain and comfort score
(rpb2=0.088) (Table 6.21).
6.7.5 Global function
Combining scores from the previous four scales produced similar results with scores for control
participants heavily skewed towards the maximum indicating better function (Figure 6.24).
Case participants, although scoring highly, were less skewed with consequent lower mean and
median scores (Table 6.20).
A 5.8 point difference in median scores between the case and controls was statistically
significant (median values = 91.39 and 97.2 respectively; U=3498.00, z=-4.347, p<0.001, r=-
0.27) indicating that cases had worse functional outcomes.
A point-biserial correlation was run to determine the relationship between global function and
group type. Group type was significantly related to the global function score (rpb = 0.336; 95%

175
BCa CI 0.185, 0.474; p<0.001) although it shared only 11.3% of the variability in PODCI global
function score (rpb2=0.113) (Table 6.21).
6.7.6 Happiness
Figure 6.25 illustrates the spread of scores for cases and controls on the happiness with
physical condition scale. Although median scores for both groups were relatively high,
indicating high average levels of happiness, the range of scores was very wide particularly
amongst cases (0-100).
There was a 10 point difference in median scores between groups suggesting that on average,
cases were less happy than controls (Table 6.20). This difference was statistically significant
(median values = 80 and 90 cases/controls respectively; U=3983.00, z=-3.39, p=0.001, r=-0.21).
A point-biserial correlation was run to determine the relationship between happiness and
group type. Group type was significantly related to the happiness score (rpb = 0.286; 95% BCa
CI 0.141, 0.417; p<0.001) although it shared only 8.2% of the variability in PODCI happiness
score (rpb2=0.082) (Table 6.21).

176
Table 6.20 PODCI scores
scale (0 worst - 100 best)
group n mean sd SE 95% CI median IQR min max missing
n (%)
upper extremity & physical function
case 57 95.3 8.39 1.11 93.0, 97.5
100 93.8, 100
50.0 100 1 (1.7)
control 197 97.8 4.66 0.33 97.2, 98.5
100 95.8, 100
62.5 100 0
transfers & basic mobility
case 57 97.8 3.93 0.52 96.7, 98.8
100 97, 100
79.6 100 1 (1.7)
control 197 99.1 3.2 0.23 98.7, 99.6
100 100, 100
69.7 100 0
sports & physical function
case 57 88.9 12.8 1.69 85.5, 92.3
91.7 84, 100
45.1 100 1 (1.7)
control 197 94.7 8.72 0.62 93.4, 95.9
97.2 93.1, 100
36.1 100 0
pain & comfort
case 57 77.4 19.1 2.53 72.3, 82.5
78.3 65,
93.3 32.8 100 1 (1.7)
control 197 89.4 15.2 1.09 87.2, 91.5
100 82.2, 100
15.0 100 0
global function
case 57 89.8 9.04 1.20 87.4, 92.2
91.4 83,
97.6 58.4 100 1 (1.7)
control 197 95.3 5.37 0.38 94.5, 96.0
97.2 92.5,
99 62.0 100 0
happiness
case 57 73.1 25.6 3.39 66.3, 79.9
80.0 55, 95
0 100 1 (1.7)
control 197 86.0 15.3 1.09 83.8, 88.1
90.0 80, 100
25.0 100 0

177
Figure 6.20 PODCI upper extremity & physical function - histogram & boxplot
Figure 6.21 PODCI transfers & basic mobility - histogram & box plot

178
Figure 6.22 PODCI sports & physical functioning - histogram & boxplot
Figure 6.23 PODCI pain/comfort - histogram & boxplot

179
Figure 6.24 PODCI global function - histogram & boxplot
Figure 6.25 PODCI happiness with physical condition - histogram & boxplot

180
Table 6.21 PODCI - results of statistical analyses
measure scale test group diff
medians U z p-value
effect size**
rpb 95% BCa
CI rpb
2
PODCI
UE & PhysFunc
Mann-Whitney U
case v control
0 4515.5 -2.67 0.007* -0.17 0.187* 0.06, 0.31 0.035
Transfers &mobility
Mann-Whitney U
case v control
0 4354.0 -3.56 <0.001* -0.22 0.165* 0.04, 0.35 0.027
Sports & PhysFunc
Mann-Whitney U
case v control
5.5 3966.0 -3.49 <0.001* -0.22 0.240* 0.099, 0.385
0.058
Pain Mann-
Whitney U case v control
21.67 3418.0 -4.71 <0.001* -0.30 0.296* 0.158, 0.423
0.088
Global function
Mann-Whitney U
case v control
5.8 3498 -4.35 <0.001* -0.27 0.336* 0.185, 0.474
0.113
Happiness Mann-
Whitney U case v control
10 3983 -3.39 0.001* -0.21 0.286* 0.141, 0.417
0.082
* statistically significant; ** Pearson’s r

181
6.8 Two point discrimination
Two-point discrimination threshold (TPDT) testing involved assessment of both the left and
right side of the spine. For cases, testing took place to either side of the vertebral level
corresponding to the curve apex of the primary curve. For controls, testing was at the same
vertebral level as their matching cases.
For some participants, it was not possible to determine the TPDT for either one or both sides.
This resulted in 6 case participants missing data for both sides, 2 missing data for the left side
only and 2 for the right side. One control participant was missing data for the left side and
another for the right side only.
Within-group analyses of left versus right and affected versus unaffected side were performed
along with a between-group analysis of case versus control participants. Lower TPDTs
(measured in mm) indicate greater sensitivity and tactile acuity.
6.8.1 Left v Right
Descriptive statistics and distributions are provided in

182
Table 6.22 and Figure 6.26 to Figure 6.27. Statistical analysis of the difference between left and
right TPDT thresholds within each group was conducted with a paired-samples t-test (Table
6.23).
For cases, on average, there was little difference in TPD thresholds between tests performed
on the left and right side of the spine (mean = 49.2 mm and 48.6 mm respectively) and this
difference was not statistically significant (mean difference = 1.38 mm; 95% CI -3.11, 5.88; t =
0.62; DF = 46; p = 0.54; d = 0.09).
Similarly for controls, on average there was little difference between tests performed on the
left and right sides (mean = 43.3 mm and 41.4 mm respectively). However, this difference was
statistically significant (mean difference = 1.97 mm; 95% CI 0.33, 3.62; t = 2.37; DF = 195; p =
0.019; d = 0.17).

183
Table 6.22 Two-point discrimination threshold descriptive statistics - Left v Right within groups (mm)
side mean sd SE 95% CI median IQR min max missing
(n)
case (n=49)
L 49.18 15.72 2.25 44.67, 53.70 45.00 40, 60 10.00 80.00 9
R 48.57 14.79 2.11 44.32, 52.82 45.00 40, 55 25.00 90.00
control (n=196)
L 43.32 11.77 0.84 41.66, 44.97 45.00 35, 50 15.00 80.00 1
R 41.35 11.22 0.80 39.77, 42.93 40.00 35, 50 15.00 75.00
Figure 6.26 Two point discrimination threshold histograms & boxplots - Left v Right within groups

184
Figure 6.27 Two point discrimination threshold means (95% CI) - Left v Right within groups
Table 6.23 TPDT Left v Right - statistical analyses
analysis test group diff
means 95% CI of
diff. means t-
statistic df p-value
Cohen's d
Left v Right
paired t-test
case 1.38 -3.11, 5.88 0.62 46 0.539 0.09
control 1.97 0.33, 3.62 2.37 194 0.019* 0.17
* = statistically significant

185
6.8.2 Affected v Unaffected side
Descriptive statistics for Affected and Unaffected side are described in Table 6.24 and
illustrated in Figure 6.28 and Figure 6.29. One case was missing x-ray information so was
unable to be categorised according to curve direction, along with the 3 matched control
participants.
Statistical analysis of the difference between Affected and Unaffected TPD thresholds within
each group was conducted with a paired-samples t-test (Table 6.25).
For cases, on average, there was little difference in TPDTs between tests conducted on the
affected or unaffected side (mean = 47.9 mm and 49.9 mm respectively) and this difference
was not statistically significant (mean difference = -2.02 mm; 95% CI -6.50, 2.45; t = -0.91; DF =
46; p = 0.368; d = -0.13).
Similarly for controls, on average there was little difference between tests performed on the
affected or unaffected side (mean = 41.3 mm and 43.4 mm respectively). However, this
difference was statistically significant (mean difference = -2.11 mm; 95% CI -3.77, -0.45; t = -
2.51; DF = 191; p = -0.013; d = -0.19).
Table 6.24 Two point discrimination threshold descriptive statistics- Affected v Unaffected side within groups
side n mea
n sd SE 95% CI median IQR min max
missing (n)
case
A 50 47.9 14.95 2.11 43.7, 52.2
45.0 40, 55 10.0 90.0 8
U 48 49.9 15.52 2.24 45.4, 54.4
45.0 40, 64 20.0 85.0 10
control A 193 41.3 11.81 0.85
39.6, 43.0
40.0 35, 50 15.0 70.0 4
U 193 43.4 11.29 0.81 41.8, 45.0
45.0 35, 50 15.0 80.0 4

186
Figure 6.28 Two point discrimination threshold histograms & boxplots - Affected v Unaffected side within groups

187
Figure 6.29 Two point discrimination threshold means (95% CI) - Affected v Unaffected
Table 6.25 TPDT Affected v Unaffected - statistical analyses
analysis test group diff
means 95% CI of
diff. means t-
statistic df
p-value
Cohen's d
Affected v unaffected
paired t-test
case -2.02 -6.50, 2.45 -0.91 46 0.368 -0.13
control -2.11 -3.77, -0.45 -2.51 191 0.013* -0.19
* = statistically significant
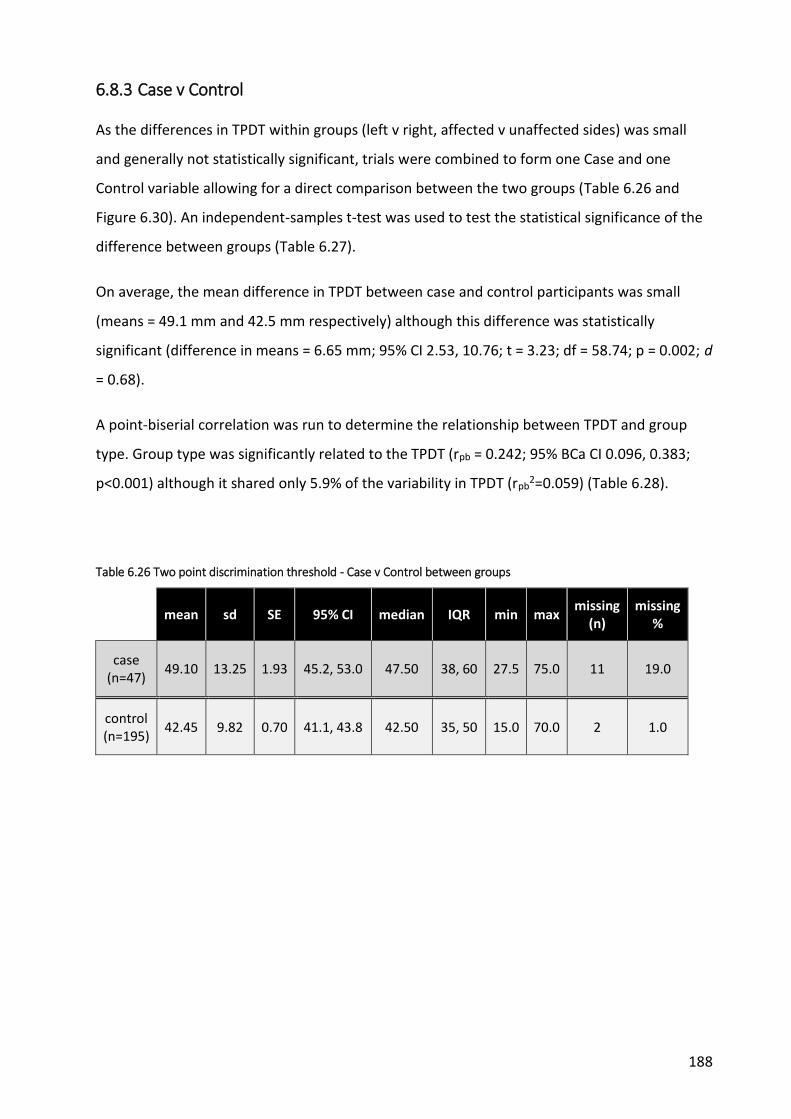
188
6.8.3 Case v Control
As the differences in TPDT within groups (left v right, affected v unaffected sides) was small
and generally not statistically significant, trials were combined to form one Case and one
Control variable allowing for a direct comparison between the two groups (Table 6.26 and
Figure 6.30). An independent-samples t-test was used to test the statistical significance of the
difference between groups (Table 6.27).
On average, the mean difference in TPDT between case and control participants was small
(means = 49.1 mm and 42.5 mm respectively) although this difference was statistically
significant (difference in means = 6.65 mm; 95% CI 2.53, 10.76; t = 3.23; df = 58.74; p = 0.002; d
= 0.68).
A point-biserial correlation was run to determine the relationship between TPDT and group
type. Group type was significantly related to the TPDT (rpb = 0.242; 95% BCa CI 0.096, 0.383;
p<0.001) although it shared only 5.9% of the variability in TPDT (rpb2=0.059) (Table 6.28).
Table 6.26 Two point discrimination threshold - Case v Control between groups
mean sd SE 95% CI median IQR min max missing
(n) missing
%
case (n=47)
49.10 13.25 1.93 45.2, 53.0 47.50 38, 60 27.5 75.0 11 19.0
control (n=195)
42.45 9.82 0.70 41.1, 43.8 42.50 35, 50 15.0 70.0 2 1.0

189
Figure 6.30 Two point discrimination threshold - histograms, boxplots & means (95% CI) Case v Control
Table 6.27 Two-point discrimination threshold - Results of statistical analyses
analysis test diff
means 95% CI of diff.
means t-
statistic df
p-value
Cohen's d
case v control
independent t-test
6.65 2.53, 10.76 3.230 59 0.002* 0.68
Table 6.28 Correlation between TPDT and group - case control
analysis test rpb 95% BCa CI rpb2 p-value
case v control
bi-serial correlation
0.242 0.096, 0.383 0.059 <0.001*
* statistically significant

190
6.9 Localisation
6.9.1 Left v Right
Descriptive statistics and distributions are provided in Table 6.29 and Figure 6.31 to Figure
6.32. Statistical analysis of the difference between left and right localisation accuracy within
each group was conducted with a paired-samples t-test (Table 6.30).
For cases, on average, there was little difference in localisation accuracy between tests
performed on the left and right side of the spine (mean number correct = 5.75, 47.9%; and
5.82, 48.5% respectively) and this difference was not statistically significant (mean difference =
-0.07, -0.6%; 95% CI -0.71, 0.57; t = -0.22; DF = 56; p = 0.83; d = -0.03).
Similarly for controls, on average there was little difference between tests performed on the
left and right sides (mean number correct = 6.46, 53.8%; and 6.47, 53.9% respectively) and this
difference was also not statistically significant (mean difference = -0.01, 0.08%; 95% CI -0.33,
0.32; t = -0.03; DF = 196; p = 0.98; d = -0.002).
Table 6.29 Localisation descriptive statistics - Left v Right (number correct; max = 12)
trial* mean sd SE 95% CI median IQR min max missing
(n)
case (n=57)
L 5.75 2.00 0.27 5.22, 6.29 6.00 5, 7 0 9
1 (1.7)
R 5.82 2.09 0.28 5.27, 6.38 6.00 5, 7 1 10
control (n=197)
L 6.46 2.40 0.17 6.12, 6.80 7.00 5, 8 0 12
0
R 6.47 2.39 0.17 6.13, 6.80 6.00 5, 8.5 1 12

191
Figure 6.31 Localisation histograms & boxplots - Left v Right within groups

192
Figure 6.32 Localisation means (95% CI) - Left v Right
Table 6.30 Localisation Left v Right - statistical analyses
analysis test group diff
means 95% CI of
diff. means t-
statistic df
p-value
Cohen's d
Left v Right
paired t-test
case -0.07 -0.71, 0.57 -0.22 56 0.827 -0.03
control -0.01 -0.33, 0.32 -0.03 196 0.975 -0.002

193
6.9.2 Affected v Unaffected
Descriptive statistics for Affected and Unaffected side are described in Table 6.31 and Figure
6.33 and Figure 6.34. One case was missing x-ray information so was unable to be categorised
according to curve direction, along with the 3 matched control participants.
Statistical analysis of the difference between Affected and Unaffected localisation accuracy
within each group was conducted with a paired-samples t-test (Table 6.32).
For cases, on average, there was little difference in localisation accuracy between tests
conducted on the affected or unaffected side (mean number correct = 5.91, 49.3%; and 5.75,
47.9% respectively) and this difference was not statistically significant (mean difference = 0.16,
1.3%; 95% CI -0.48, 0.80; t = 0.50; DF = 55; p = 0.62; d = 0.08).
Similarly for controls, on average there was little difference between tests performed on the
affected or unaffected side (mean number correct = 6.48, 54%; and 6.44, 54% respectively)
and this difference was also not statistically significant (mean difference = 0.04, 0.33%; 95% CI
-0.28, 0.36; t = 0.25; DF = 193; p = 0.80; d = 0.02).
Table 6.31 Localisation descriptive statistics - Affected v Unaffected side
trial* mean sd SE 95% CI median IQR min max missing
n (%)
case (n=56)
A 5.91 2.01 0.27 5.4, 6.5 6.00 5, 7.8 1 10 2 (3.4)
U 5.75 2.05 0.27 5.2, 6.3 6.00 5, 7 0 9 2 (3.4)
control (n=194)
A 6.48 2.38 0.17 6.1, 6.8 6.00 5, 8 0 12 3 (1.5)
U 6.44 2.41 0.17 6.1, 6.8 7.00 5, 8 1 12 3 (1.5)

194
Figure 6.33 Localisation histogram & boxplots - Affected - Unaffected side

195
Figure 6.34 Localisation means (95% CI) - Affected v Unaffected side
Table 6.32 Localisation Affected v Unaffected - statistical analyses
analysis test group diff
means 95% CI of
diff. means t-
statistic df
p-value
Cohen's d
Affected v unaffected
paired t-test
case 0.16 -0.48, 0.80 0.50 55 0.619 0.08
control 0.04 -0.28, 0.36 0.25 193 0.800 0.02

196
6.9.3 Case v Control
As the differences in localisation accuracy within groups (left v right, affected v unaffected
sides) was small and generally not statistically significant, trials were combined to form one
Case and one Control variable allowing for a direct comparison between the two groups. This
comparison also included the 3 central stimulation sites bringing the total number of tests to
30 for each participant.
The distribution of both groups was consistent with a normal distribution (Table 6.33 and
Figure 6.35). An independent-samples t-test was used to test the statistical significance of the
difference between groups (Table 6.34).
On average, the mean difference in localisation accuracy between case and control
participants was small (mean number correct = 14.21, 47.4%; and 16.28, 54.3% respectively)
although this difference was statistically significant (difference in means = -2.07, 6.9%; 95% CI -
3.49, -0.65; t = -2.87; df = 252; p = 0.004; d = -0.43) suggesting that control participants were
slightly more accurate on average than case participants.
A point-biserial correlation was run to determine the relationship between localisation ability
and group type. Group type was significantly related to the localisation accuracy (rpb = 0.178;
95% BCa CI 0.07, 0.28; p=0.004) although it shared only 3.2% of the variability in accuracy
(rpb2=0.032) (Table 6.35).
Table 6.33 Localisation descriptive statistics - Case v Control location (max=30)
mean sd SE 95% CI median IQR min max missing
(n)
case (n=57)
14.21 4.52 0.60 13.01, 15.41 15.00 11, 18 4.0 25.0 1 (1.7)
control (n=197)
16.28 4.86 0.35 15.60, 16.96 17.00 13, 20 4.0 29.0 0

197
Figure 6.35 Localisation histograms, boxplots & means (95% CI) - Case v Control location
Table 6.34 Localisation Case v Control - statistical analyses
analysis test group diff
means 95% CI of
diff. means t-
statistic df
p-value
Cohen's d
case v control
independent t-test
location -2.07 -3.49, -0.65 -2.87 252 0.004* -0.43
* = statistically significant
Table 6.35 Correlation Group type v Localisation accuracy
analysis test location rpb 95% BCa CI rpb2 p-value
case v control
bi-serial correlation
individual sites
0.178 0.070, 0.280 0.032 0.004*
* statistically significant

198
Further analysis was also undertaken to ascertain if participants were able to at least locate
the region the stimulus was applied (i.e. left, central or right side of spine). For the left and
right sides, each area consisted of 6 stimulation sites. The central area consisted of 3 sites (see
Appendices 12 and 14). A correct response occurred when a participant named any of the sites
within the same region as the stimulated site.
The distribution of both groups was skewed to the left indicating excellent localisation ability,
at least according to the area of testing (Table 6.36 and Figure 6.36). Due to the skewed
distribution, the data was transformed using a log10 transformation and the resulting data was
consistent with a normal distribution. An independent-samples t-test was used to test the
statistical significance of the difference between groups. As the result was the same as for the
non-transformed data, the results of the non-transformed data analysis is presented here for
simplicity (Table 6.37).
On average, the mean difference in localisation accuracy by area between case and control
participants was small (mean number correct = 26.96 or 89.9%; and 28.55 or 95.2%
respectively). This difference was statistically significant (difference in means = -1.59 or 5.3%;
95% CI -2.47, -0.71; t = -3.59; df = 65.06; p = 0.001; d = -0.95) suggesting that control
participants were slightly more accurate on average than case participants.
A point-biserial correlation was run to determine the relationship between regional
localisation ability and group type. Group type was significantly related to the localisation
accuracy (rpb = 0.300; 95% BCa CI 0.157, 0.434; p<0.001) although it shared only 9% of the
variability in regional accuracy (rpb2=0.090) (Table 6.38).
Table 6.36 Localisation descriptive statistics - Case v Control side (max=30)
mean sd SE 95% CI median IQR min max missing
(n) missing
%
case (n=57)
26.96 3.21 0.43 26.1, 27.8 28.00 25.5, 29 17 30 1 1.7
control (n=197)
28.55 1.68 0.12 28.3, 28.8 29.00 28, 30 20 30 0 0.0

199
Figure 6.36 Localisation histograms, boxplots & means (95% CI) - Case v Control (side)
Table 6.37 Localisation - results of statistical analyses
analysis test group diff
means 95% CI of
diff. means t-
statistic df
p-value
Cohen's d
case v control
independent t-test
side -1.59 -2.47, -0.71 -3.59 65.06 0.001* -0.95
* = statistically significant
Table 6.38 Correlation between localisation accuracy and group (case/control)
analysis test location rpb 95% BCa CI rpb2 p-value
case v control
bi-serial correlation
side (left, centre, right) 0.300 0.157, 0.434 0.090 <0.001*
* statistically significant

200
6.10 Laterality discrimination
6.10.1 Accuracy (hands)
6.10.1.1 Left v Right side
Two trials of 50 images each were undertaken. Participants had to choose whether the
presented image was of a left or right hand (25 each per trial, 50 in total for each side).
Accuracy was calculated as the percentage of correct responses for each side.
Descriptive statistics and distributions are provided in Table 6.39 and illustrated in

201
Figure 6.37 to Figure 6.38. Statistical analysis of the difference between left and right
judgement accuracy within each group was conducted with a paired-samples t-test (Table
6.40).
For cases, on average, there was little difference in ability to discriminate between left and
right hands (mean accuracy = 78.7% and 81.3% respectively). However, this difference was
statistically significant (mean difference = -2.62%; 95% CI -4.81, -0.42; t = -2.39; DF = 57; p =
0.02; d = -0.22).
Similarly for controls, on average there was little difference between tests performed on the
left and right sides (mean accuracy = 77.4% and 78.2% respectively) and this difference was
not statistically significant (mean difference = -0.71%; 95% CI -1.82, 0.40; t = -1.26; DF = 196; p
= 0.21; d = -0.05).
Table 6.39 Laterality discrimination descriptive statistics - Accuracy Left v Right hands
trial* mean sd SE 95% CI median IQR min max missing
(n)
case (n=58)
L 78.69 12.86 1.69 75.3, 82.1 79.0 72, 86 46.0 100 0
R 81.31 11.46 1.50 78.3, 84.3 82.0 73.5, 90 48.0 100 0
control (n=197)
L 77.44 14.76 1.05 75.4, 79.5 80.0 66, 90 38.0 100 0
R 78.15 14.85 1.06 76.1, 80.2 82.0 68, 90 30.0 100 0
*L = left; R = Right

202
Figure 6.37 Laterality discrimination histograms & boxplots - Accuracy Left v Right hands

203
Figure 6.38 Laterality discrimination means (95% CI) - Accuracy Left v Right hands
Table 6.40 Laterality discrimination Accuracy Left v Right Hands - statistical analyses
analysis test group diff
means 95% CI of
diff. means t-
statistic df
p-value
Cohen's d
Left v Right
paired t-test
case -2.62 -4.81, -0.42 -2.39 57 0.02* -0.22
control -0.71 -1.82, 0.40 -1.26 196 0.21 -0.05
* = statistically significant
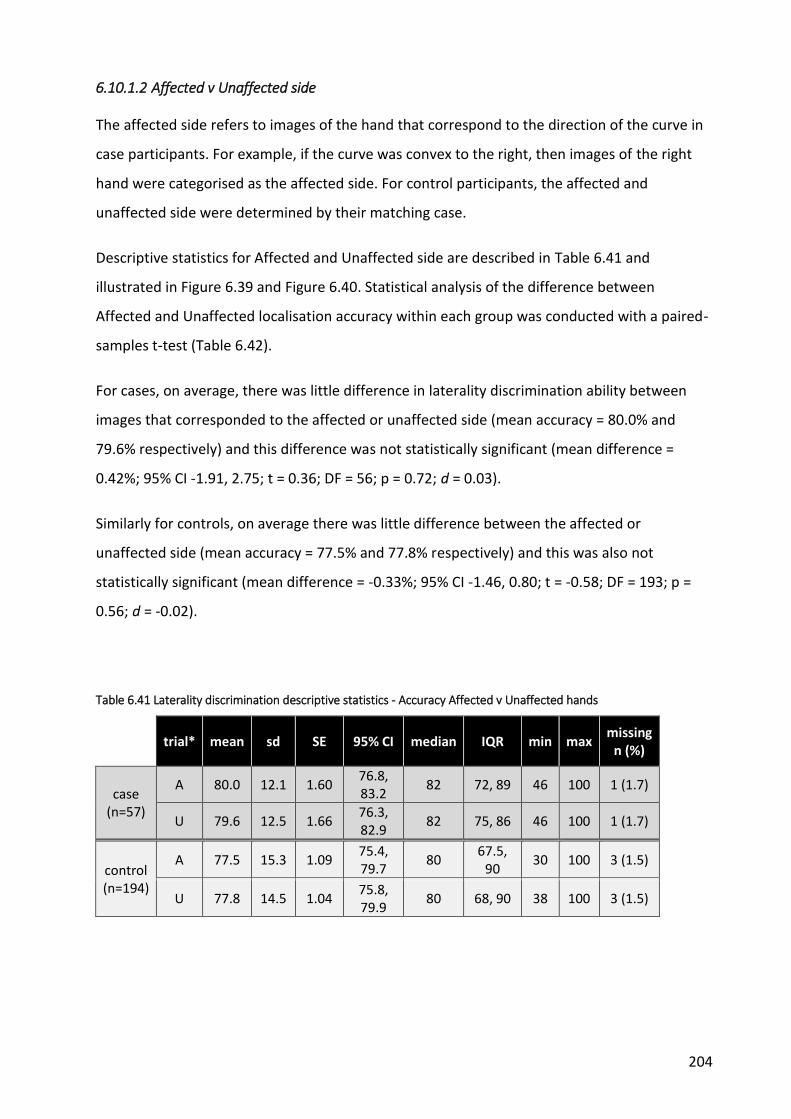
204
6.10.1.2 Affected v Unaffected side
The affected side refers to images of the hand that correspond to the direction of the curve in
case participants. For example, if the curve was convex to the right, then images of the right
hand were categorised as the affected side. For control participants, the affected and
unaffected side were determined by their matching case.
Descriptive statistics for Affected and Unaffected side are described in Table 6.41 and
illustrated in Figure 6.39 and Figure 6.40. Statistical analysis of the difference between
Affected and Unaffected localisation accuracy within each group was conducted with a paired-
samples t-test (Table 6.42).
For cases, on average, there was little difference in laterality discrimination ability between
images that corresponded to the affected or unaffected side (mean accuracy = 80.0% and
79.6% respectively) and this difference was not statistically significant (mean difference =
0.42%; 95% CI -1.91, 2.75; t = 0.36; DF = 56; p = 0.72; d = 0.03).
Similarly for controls, on average there was little difference between the affected or
unaffected side (mean accuracy = 77.5% and 77.8% respectively) and this was also not
statistically significant (mean difference = -0.33%; 95% CI -1.46, 0.80; t = -0.58; DF = 193; p =
0.56; d = -0.02).
Table 6.41 Laterality discrimination descriptive statistics - Accuracy Affected v Unaffected hands
trial* mean sd SE 95% CI median IQR min max missing
n (%)
case (n=57)
A 80.0 12.1 1.60 76.8, 83.2
82 72, 89 46 100 1 (1.7)
U 79.6 12.5 1.66 76.3, 82.9
82 75, 86 46 100 1 (1.7)
control (n=194)
A 77.5 15.3 1.09 75.4, 79.7
80 67.5,
90 30 100 3 (1.5)
U 77.8 14.5 1.04 75.8, 79.9
80 68, 90 38 100 3 (1.5)

205
Figure 6.39 Laterality discrimination histograms & boxplots - Accuracy Affected v Unaffected hands
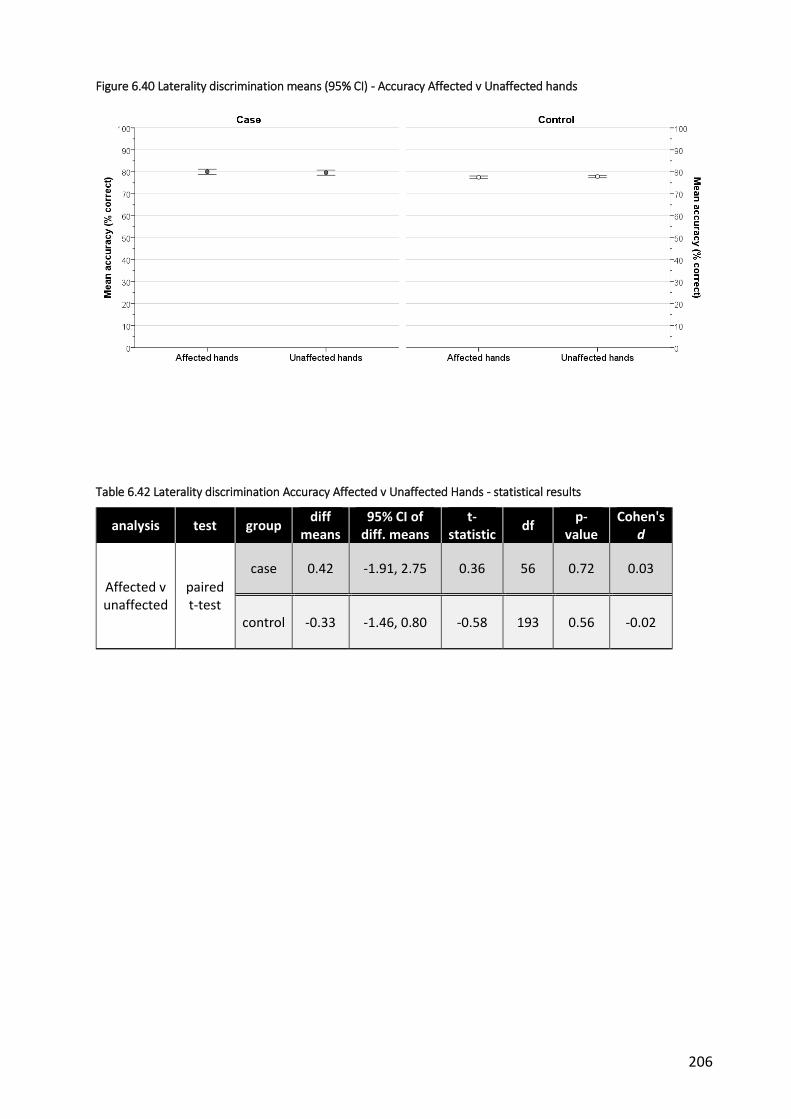
206
Figure 6.40 Laterality discrimination means (95% CI) - Accuracy Affected v Unaffected hands
Table 6.42 Laterality discrimination Accuracy Affected v Unaffected Hands - statistical results
analysis test group diff
means 95% CI of
diff. means t-
statistic df
p-value
Cohen's d
Affected v unaffected
paired t-test
case 0.42 -1.91, 2.75 0.36 56 0.72 0.03
control -0.33 -1.46, 0.80 -0.58 193 0.56 -0.02
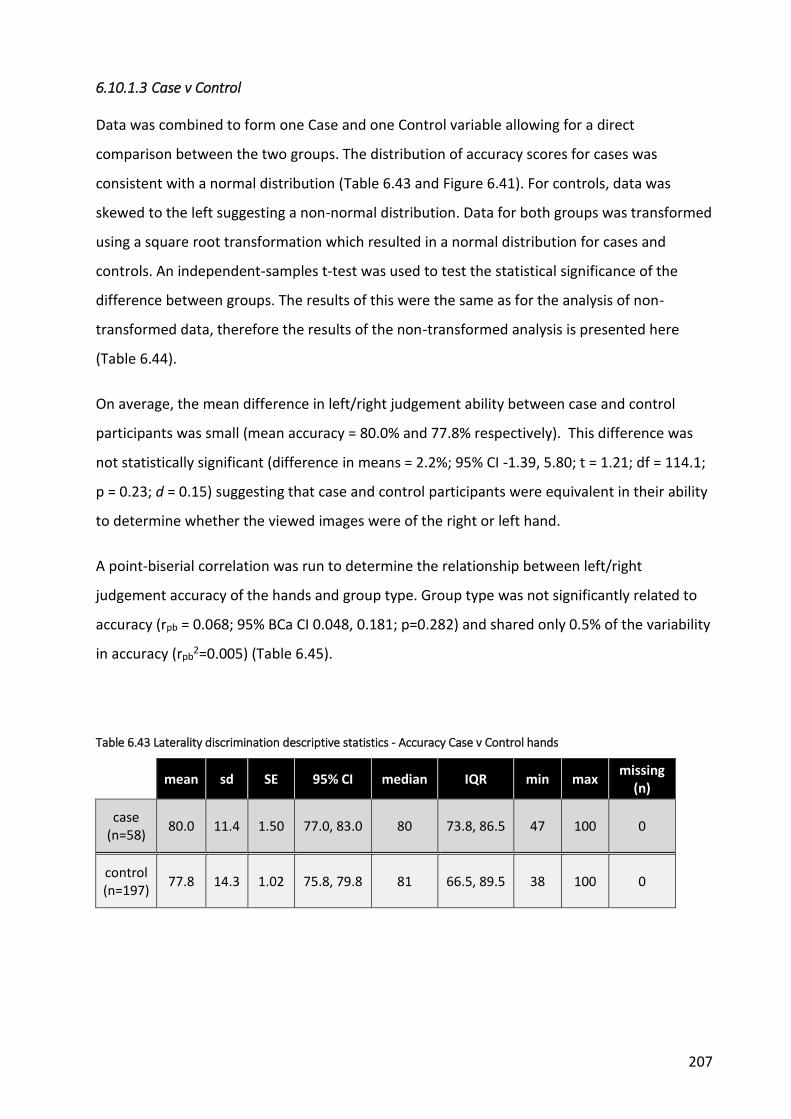
207
6.10.1.3 Case v Control
Data was combined to form one Case and one Control variable allowing for a direct
comparison between the two groups. The distribution of accuracy scores for cases was
consistent with a normal distribution (Table 6.43 and Figure 6.41). For controls, data was
skewed to the left suggesting a non-normal distribution. Data for both groups was transformed
using a square root transformation which resulted in a normal distribution for cases and
controls. An independent-samples t-test was used to test the statistical significance of the
difference between groups. The results of this were the same as for the analysis of non-
transformed data, therefore the results of the non-transformed analysis is presented here
(Table 6.44).
On average, the mean difference in left/right judgement ability between case and control
participants was small (mean accuracy = 80.0% and 77.8% respectively). This difference was
not statistically significant (difference in means = 2.2%; 95% CI -1.39, 5.80; t = 1.21; df = 114.1;
p = 0.23; d = 0.15) suggesting that case and control participants were equivalent in their ability
to determine whether the viewed images were of the right or left hand.
A point-biserial correlation was run to determine the relationship between left/right
judgement accuracy of the hands and group type. Group type was not significantly related to
accuracy (rpb = 0.068; 95% BCa CI 0.048, 0.181; p=0.282) and shared only 0.5% of the variability
in accuracy (rpb2=0.005) (Table 6.45).
Table 6.43 Laterality discrimination descriptive statistics - Accuracy Case v Control hands
mean sd SE 95% CI median IQR min max missing
(n)
case (n=58)
80.0 11.4 1.50 77.0, 83.0 80 73.8, 86.5 47 100 0
control (n=197)
77.8 14.3 1.02 75.8, 79.8 81 66.5, 89.5 38 100 0

208
Figure 6.41 Laterality discrimination histograms, boxplots & means (95% CI) - Accuracy Case v Control hands
Table 6.44 Laterality discrimination Hand accuracy case v control- statistical analyses
analysis test group diff
means 95% CI of diff.
means t-
statistic df
p-value
Cohen's d
case v control
independent t-test
side 2.20 -1.39, 5.80 1.21 114.11 0.23 0.15
Table 6.45 Correlation between group type and Hand accuracy - Laterality discrimination
analysis test rpb 95% BCa CI rpb2 p-value
case v control bi-serial
correlation 0.068 -0.048, 0.181 0.005 0.282

209
6.10.2 Accuracy (back)
6.10.2.1 Left v Right
Participants were required to judge whether the images depicted movement of the trunk to
the left or the right. Descriptive statistics and distributions are provided in Table 6.46 and
Figure 6.42 to Figure 6.43. Statistical analysis of the difference between left and right
judgement accuracy within each group was conducted with a paired-samples t-test (Table
6.47).
For cases, on average, there was little difference in ability to discriminate between images
depicting movement to the left and right (mean accuracy = 84.7% and 86.7% respectively).
However, this difference was statistically significant (mean difference = -2.0%; 95% CI -3.78, -
0.22; t = -2.25; DF = 57; p = 0.03; d = -0.18).
Similarly for controls, on average there was little difference between images showing left and
right movement (mean accuracy = 84.6% and 84.7% respectively) and this difference was not
statistically significant (mean difference = -0.13%; 95% CI -1.09, 0.82; t = -2.72; DF = 196; p =
0.79; d = -0.01).
Table 6.46 Laterality discrimination descriptive statistics - Accuracy Left v Right back (% correct)
trial* mean sd SE 95% CI median IQR min max missing
(n)
case (n=58)
L 84.7 12.8 1.68 81.4, 88.1 88 79.5, 92 34 100 0
R 86.7 10.0 1.31 84.1, 89.4 90 80, 94 60 100 0
control (n=197)
L 84.6 10.6 0.75 83.1, 86.1 86 78, 92 36 100 0
R 84.7 10.0 0.71 83.3, 86.1 86 78, 93 54 100 0
* L - left; R = right

210
Figure 6.42 Laterality discrimination histograms & boxplots - Accuracy Left v Right back

211
Figure 6.43 Laterality discrimination means (95% CI) - Accuracy Left v Right
Table 6.47 Laterality discrimination Back accuracy Left v Right - statistical analyses
analysis test group diff
means 95% CI of
diff. means t-
statistic df
p-value
Cohen's d
Left v Right
paired t-test
case -2.00 -3.78, -0.22 -2.25 57 0.03* -0.18
control -0.13 -1.09, 0.82 -2.72 196 0.79 -0.01
* = statistically significant

212
6.10.2.2 Affected v Unaffected
The affected side refers to images of the trunk movement that correspond to the direction of
the curve in case participants. For example, if the curve was convex to the right, then images
of movement to the right were categorised as the affected side. For control participants, the
affected and unaffected side were determined by their matching case.
Descriptive statistics for Affected and Unaffected side are described in Table 6.48 and Figure
6.44 and Figure 6.45. Statistical analysis of the difference between Affected and Unaffected
accuracy within each group was conducted with a paired-samples t-test (Table 6.49).
For cases, on average, there was little difference in ability to discriminate between images
depicting movement to the affected or unaffected side (mean accuracy = 86.0% and 85.3%
respectively) and this difference was not statistically significant (mean difference = 0.74%; 95%
CI -1.13, 2.60; t = 0.79; DF = 56; p = 0.43; d = 0.06).
Similarly for controls, on average there was little difference between the affected or
unaffected side (mean accuracy = 84.5% and 84.6% respectively) and this was also not
statistically significant (mean difference = -0.09%; 95% CI -1.06, 0.87; t = -0.19; DF = 193; p =
0.85; d = -0.01).
Table 6.48 Laterality discrimination descriptive statistics - Accuracy Affected v Unaffected back
trial* mean sd SE 95% CI median IQR min max missing
n (%)
case (n=57)
A 86.0 10.1 1.34 83.4, 88.7
88 78, 94 60 100 1 (1.7)
U 85.3 12.9 1.71 81.9, 88.7
90 80, 92 34 100 1 (1.7)
control (n=194)
A 84.5 10.2 0.73 83.1, 86 86 78, 92 54 100 3 (1.5)
U 84.6 10.4 0.75 83.1, 86.1
86 78, 92 36 100 3 (1.5)
*A = affected side; U = unaffected side

213
Figure 6.44 Laterality discrimination histograms & boxplots - Accuracy Affected v Unaffected back

214
Figure 6.45 Laterality discrimination means (95% CI) - Accuracy Affected v Unaffected back
Table 6.49 Laterality discrimination Back accuracy Affected v Unaffected - statistical analyses
analysis test group diff
means 95% CI of
diff. means t-
statistic df
p-value
Cohen's d
Affected v unaffected
paired t-test
case 0.74 -1.13, 2.60 0.79 56 0.43 0.06
control -0.09 -1.06, 0.87 -0.19 193 0.85 -0.01
* = statistically significant
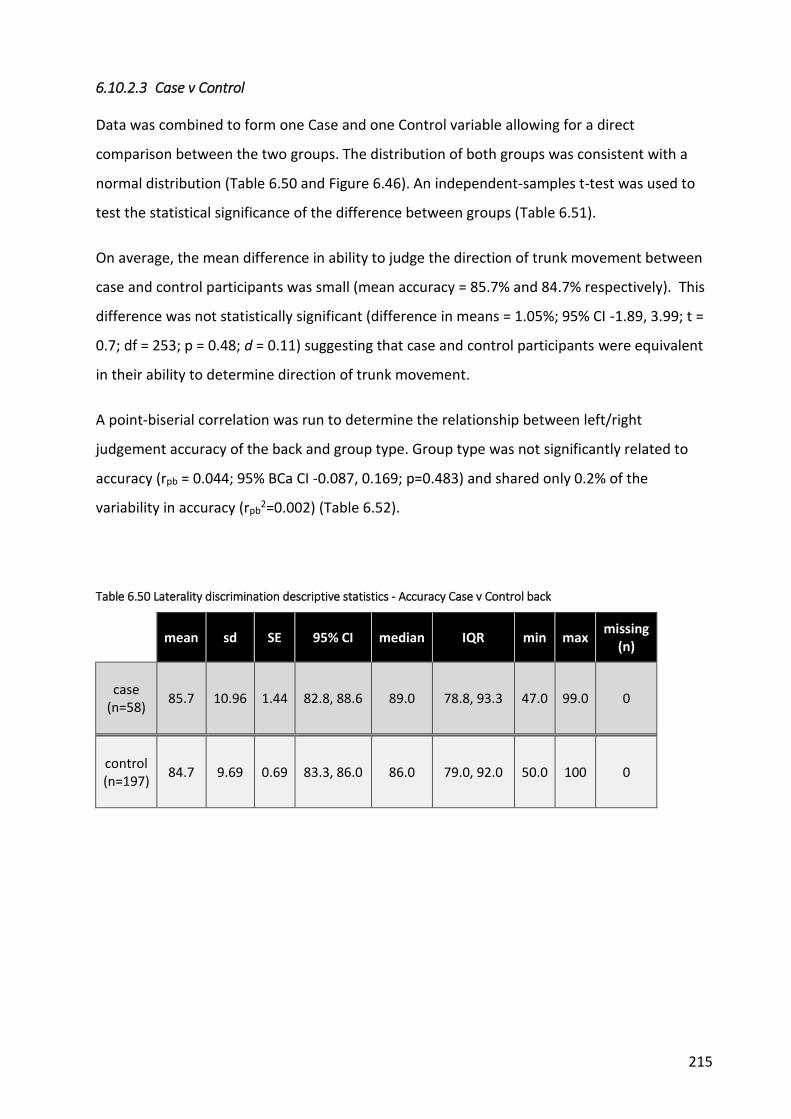
215
6.10.2.3 Case v Control
Data was combined to form one Case and one Control variable allowing for a direct
comparison between the two groups. The distribution of both groups was consistent with a
normal distribution (Table 6.50 and Figure 6.46). An independent-samples t-test was used to
test the statistical significance of the difference between groups (Table 6.51).
On average, the mean difference in ability to judge the direction of trunk movement between
case and control participants was small (mean accuracy = 85.7% and 84.7% respectively). This
difference was not statistically significant (difference in means = 1.05%; 95% CI -1.89, 3.99; t =
0.7; df = 253; p = 0.48; d = 0.11) suggesting that case and control participants were equivalent
in their ability to determine direction of trunk movement.
A point-biserial correlation was run to determine the relationship between left/right
judgement accuracy of the back and group type. Group type was not significantly related to
accuracy (rpb = 0.044; 95% BCa CI -0.087, 0.169; p=0.483) and shared only 0.2% of the
variability in accuracy (rpb2=0.002) (Table 6.52).
Table 6.50 Laterality discrimination descriptive statistics - Accuracy Case v Control back
mean sd SE 95% CI median IQR min max missing
(n)
case (n=58)
85.7 10.96 1.44 82.8, 88.6 89.0 78.8, 93.3 47.0 99.0 0
control (n=197)
84.7 9.69 0.69 83.3, 86.0 86.0 79.0, 92.0 50.0 100 0

216
Figure 6.46 Laterality discrimination histograms, boxplots & means (95% CI) - Accuracy Case v Control back
Table 6.51 Laterality discrimination Accuracy back - results of statistical analyses
analysis test group diff
means 95% CI of
diff. means t-
statistic df
p-value
Cohen's d
case v control
independent t-test
side 1.05 -1.89, 3.99 0.70 253 0.48 0.11
* = statistically significant
Table 6.52 Correlation of group and Back accuracy - Laterality discrimination
analysis test rpb 95% BCa CI rpb2 p-value
case v control bi-serial
correlation 0.044 -0.087, 0.169 0.002 0.483
* statistically significant
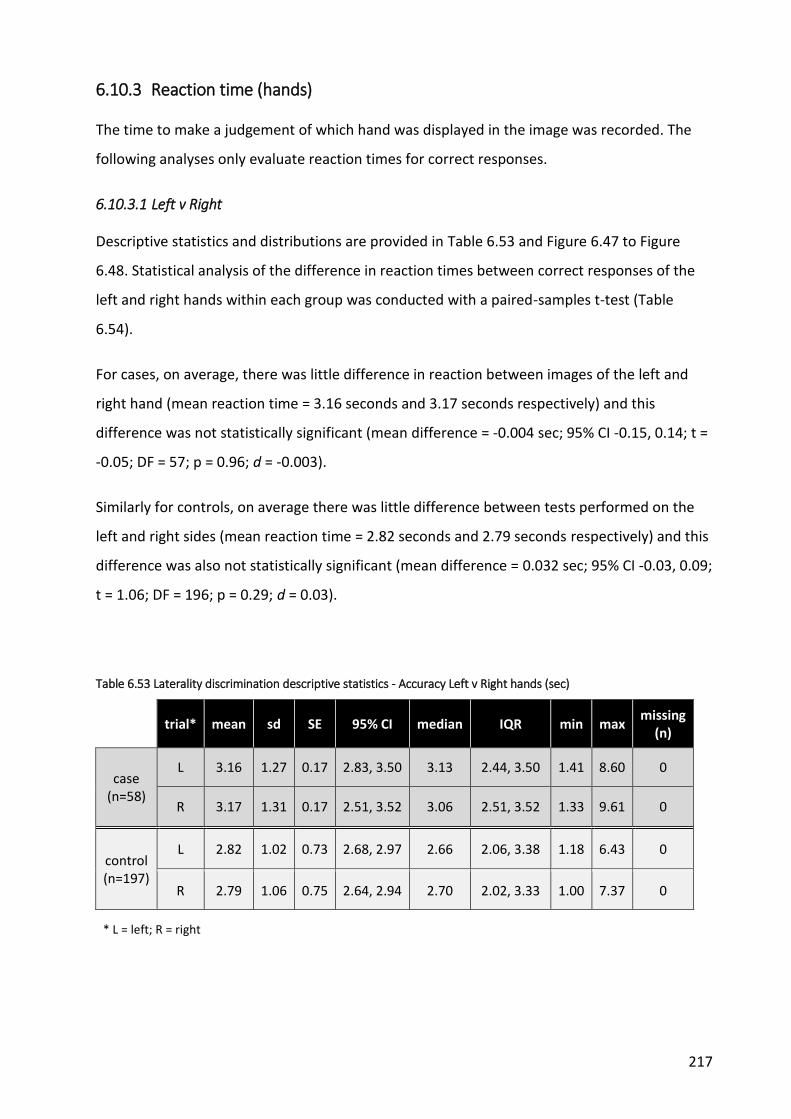
217
6.10.3 Reaction time (hands)
The time to make a judgement of which hand was displayed in the image was recorded. The
following analyses only evaluate reaction times for correct responses.
6.10.3.1 Left v Right
Descriptive statistics and distributions are provided in Table 6.53 and Figure 6.47 to Figure
6.48. Statistical analysis of the difference in reaction times between correct responses of the
left and right hands within each group was conducted with a paired-samples t-test (Table
6.54).
For cases, on average, there was little difference in reaction between images of the left and
right hand (mean reaction time = 3.16 seconds and 3.17 seconds respectively) and this
difference was not statistically significant (mean difference = -0.004 sec; 95% CI -0.15, 0.14; t =
-0.05; DF = 57; p = 0.96; d = -0.003).
Similarly for controls, on average there was little difference between tests performed on the
left and right sides (mean reaction time = 2.82 seconds and 2.79 seconds respectively) and this
difference was also not statistically significant (mean difference = 0.032 sec; 95% CI -0.03, 0.09;
t = 1.06; DF = 196; p = 0.29; d = 0.03).
Table 6.53 Laterality discrimination descriptive statistics - Accuracy Left v Right hands (sec)
trial* mean sd SE 95% CI median IQR min max missing
(n)
case (n=58)
L 3.16 1.27 0.17 2.83, 3.50 3.13 2.44, 3.50 1.41 8.60 0
R 3.17 1.31 0.17 2.51, 3.52 3.06 2.51, 3.52 1.33 9.61 0
control (n=197)
L 2.82 1.02 0.73 2.68, 2.97 2.66 2.06, 3.38 1.18 6.43 0
R 2.79 1.06 0.75 2.64, 2.94 2.70 2.02, 3.33 1.00 7.37 0
* L = left; R = right

218
Figure 6.47 Laterality discrimination histograms & boxplots - Reaction times Left v Right hands

219
Figure 6.48 Laterality discrimination means (95% CI) - Reaction times Left v Right hands
Table 6.54 Laterality discrimination Reaction time hands - left v right statistical analyses
analysis test group diff
means 95% CI of diff.
means t-
statistic df
p-value
Cohen's d
Left v Right (sec)
paired t-test
case -0.004 -0.146, 0.138 -0.05 57 0.96 -0.003
control 0.032 -0.028, 0.092 1.06 196 0.29 0.03

220
6.10.3.2 Affected v Unaffected
Descriptive statistics for Affected and Unaffected side are described in Table 6.55 and Figure
6.49 and Figure 6.50. Statistical analysis of the difference in reaction times between hand
images that corresponded to the Affected and Unaffected side within each group was
conducted with a paired-samples t-test (Table 6.56).
For cases, on average, there was little difference in reaction times between the affected or
unaffected side (mean reaction time = 3.14 seconds and 3.11 seconds respectively) and this
difference was not statistically significant (mean difference = 0.04 sec; 95% CI -0.09, 0.16; t =
0.57; DF = 56; p = 0.57; d = 0.03).
Similarly for controls, on average there was little difference between the affected or
unaffected side (mean reaction time = 2.80 seconds and 2.82 seconds respectively) and this
was also not statistically significant (mean difference = -0.019 sec; 95% CI -0.08, 0.04; t = --
0.06; DF = 193; p = 0.55; d = -0.02).
Table 6.55 Laterality discrimination descriptive statistics - Reaction time Affected v Unaffected hands (sec)
trial* mean sd SE 95% CI median IQR min max missing
(n)
case (n=57)
A 3.14 1.30 0.17 2.80, 3.48
3.05 2.48, 3.51
1.33 9.61 1 (1.7)
U 3.11 1.21 0.16 2.79, 3.43
3.08 2.43, 3.47
1.41 8.60 1 (1.7)
control (n=194)
A 2.80 1.07 0.08 2.65, 2.96
2.63 2.02, 3.39
1.16 7.37 3 (1.5)
U 2.82 1.02 0.07 2.68, 2.97
2.70 2.08, 3.35
1.00 6.14 3 (1.5)
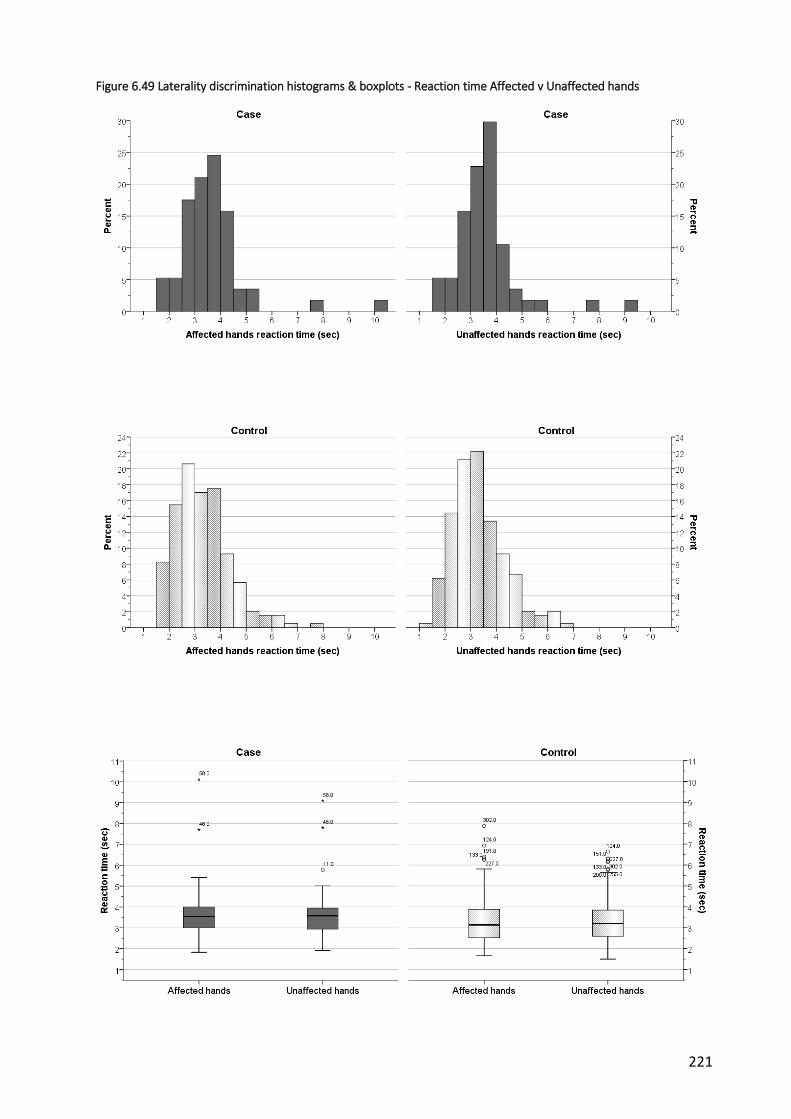
221
Figure 6.49 Laterality discrimination histograms & boxplots - Reaction time Affected v Unaffected hands

222
Figure 6.50 Laterality discrimination means (95% CI) - Reaction time Affected v Unaffected hands
Table 6.56 Laterality discrimination Reaction time Hands - Affected v Unaffected statistical analyses
analysis test group diff
means 95% CI of
diff. means t-
statistic df p-value
Cohen's d
Affected v unaffected
(sec) paired t-test
case 0.035 -0.088, 0.159
0.57 56 0.57 0.03
control -0.018 -0.079, 0.042
-0.60 193 0.550 -0.02
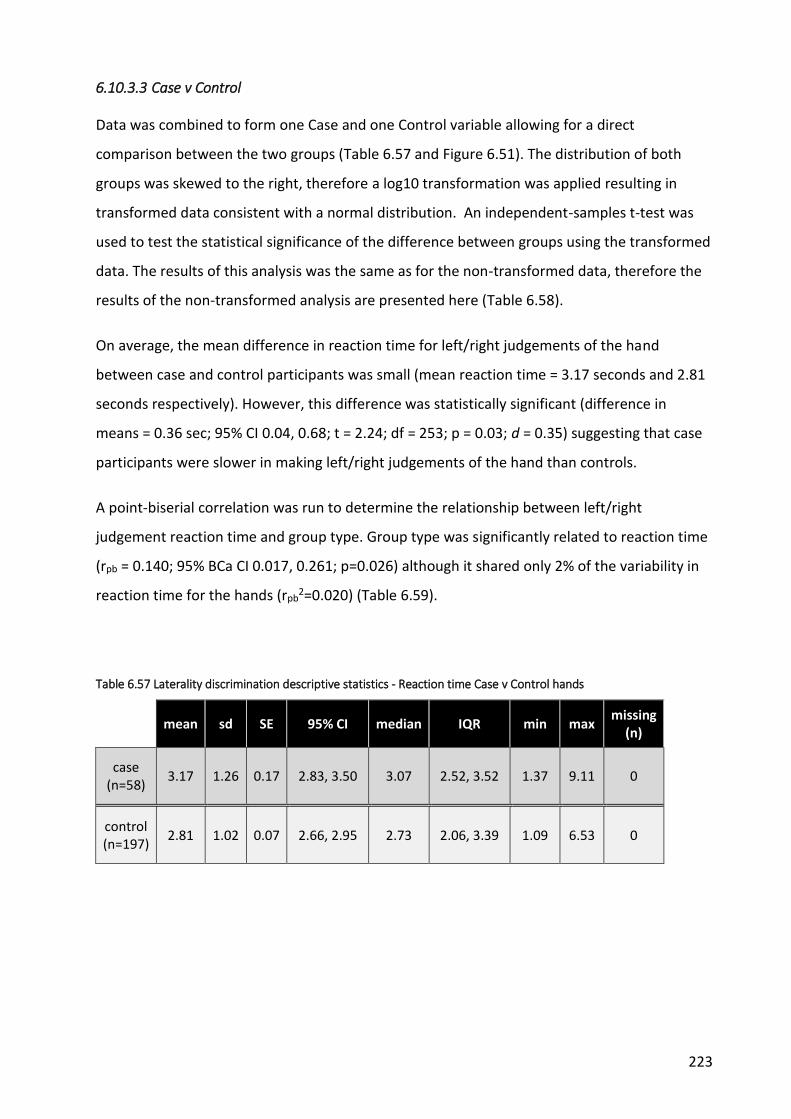
223
6.10.3.3 Case v Control
Data was combined to form one Case and one Control variable allowing for a direct
comparison between the two groups (Table 6.57 and Figure 6.51). The distribution of both
groups was skewed to the right, therefore a log10 transformation was applied resulting in
transformed data consistent with a normal distribution. An independent-samples t-test was
used to test the statistical significance of the difference between groups using the transformed
data. The results of this analysis was the same as for the non-transformed data, therefore the
results of the non-transformed analysis are presented here (Table 6.58).
On average, the mean difference in reaction time for left/right judgements of the hand
between case and control participants was small (mean reaction time = 3.17 seconds and 2.81
seconds respectively). However, this difference was statistically significant (difference in
means = 0.36 sec; 95% CI 0.04, 0.68; t = 2.24; df = 253; p = 0.03; d = 0.35) suggesting that case
participants were slower in making left/right judgements of the hand than controls.
A point-biserial correlation was run to determine the relationship between left/right
judgement reaction time and group type. Group type was significantly related to reaction time
(rpb = 0.140; 95% BCa CI 0.017, 0.261; p=0.026) although it shared only 2% of the variability in
reaction time for the hands (rpb2=0.020) (Table 6.59).
Table 6.57 Laterality discrimination descriptive statistics - Reaction time Case v Control hands
mean sd SE 95% CI median IQR min max missing
(n)
case (n=58)
3.17 1.26 0.17 2.83, 3.50 3.07 2.52, 3.52 1.37 9.11 0
control (n=197)
2.81 1.02 0.07 2.66, 2.95 2.73 2.06, 3.39 1.09 6.53 0

224
Figure 6.51 Laterality discrimination histograms, boxplots & means (95% CI) - Reaction time Case v Control hands
Table 6.58 Laterality discrimination Reaction time hands - case v control statistical analyses
analysis test group diff
means 95% CI of
diff. means t-
statistic df p-value
Cohen's d
case v control
independent t-test
side 0.361 0.044, 0.678
2.24 253 0.03* 0.35
* = statistically significant
Table 6.59 Correlation between group type and Reaction time Hands - Laterality discrimination
analysis test rpb 95% BCa CI rpb2 p-value
case v control bi-serial
correlation 0.140 0.017, 0.261 0.020 0.026
* statistically significant
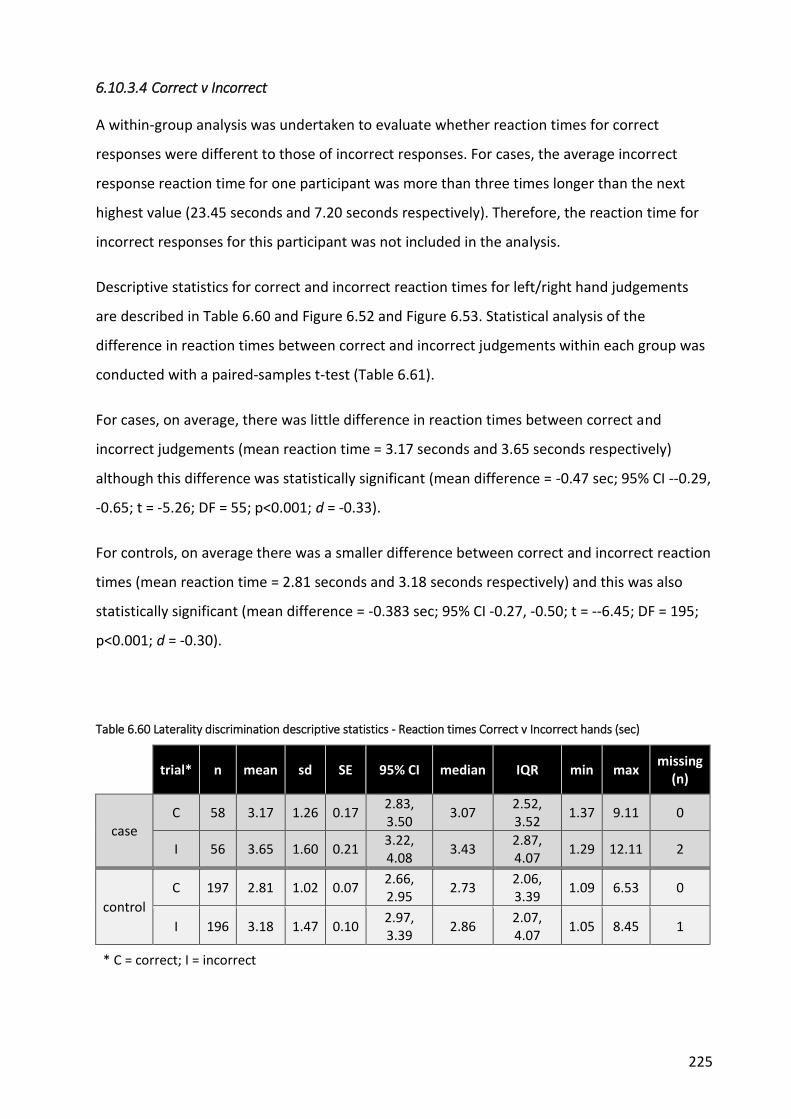
225
6.10.3.4 Correct v Incorrect
A within-group analysis was undertaken to evaluate whether reaction times for correct
responses were different to those of incorrect responses. For cases, the average incorrect
response reaction time for one participant was more than three times longer than the next
highest value (23.45 seconds and 7.20 seconds respectively). Therefore, the reaction time for
incorrect responses for this participant was not included in the analysis.
Descriptive statistics for correct and incorrect reaction times for left/right hand judgements
are described in Table 6.60 and Figure 6.52 and Figure 6.53. Statistical analysis of the
difference in reaction times between correct and incorrect judgements within each group was
conducted with a paired-samples t-test (Table 6.61).
For cases, on average, there was little difference in reaction times between correct and
incorrect judgements (mean reaction time = 3.17 seconds and 3.65 seconds respectively)
although this difference was statistically significant (mean difference = -0.47 sec; 95% CI --0.29,
-0.65; t = -5.26; DF = 55; p<0.001; d = -0.33).
For controls, on average there was a smaller difference between correct and incorrect reaction
times (mean reaction time = 2.81 seconds and 3.18 seconds respectively) and this was also
statistically significant (mean difference = -0.383 sec; 95% CI -0.27, -0.50; t = --6.45; DF = 195;
p<0.001; d = -0.30).
Table 6.60 Laterality discrimination descriptive statistics - Reaction times Correct v Incorrect hands (sec)
trial* n mean sd SE 95% CI median IQR min max missing
(n)
case C 58 3.17 1.26 0.17
2.83, 3.50
3.07 2.52, 3.52
1.37 9.11 0
I 56 3.65 1.60 0.21 3.22, 4.08
3.43 2.87, 4.07
1.29 12.11 2
control
C 197 2.81 1.02 0.07 2.66, 2.95
2.73 2.06, 3.39
1.09 6.53 0
I 196 3.18 1.47 0.10 2.97, 3.39
2.86 2.07, 4.07
1.05 8.45 1
* C = correct; I = incorrect

226
Figure 6.52 Laterality discrimination histograms & boxplots - Reaction times Correct v Incorrect hands
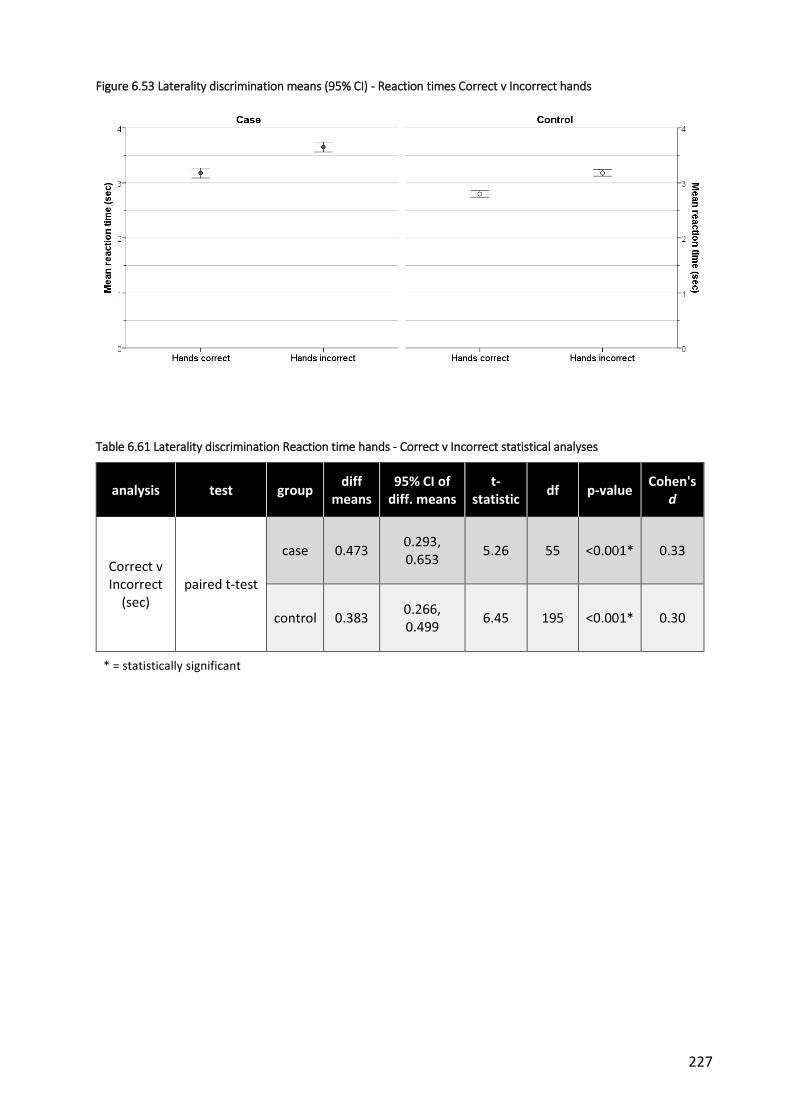
227
Figure 6.53 Laterality discrimination means (95% CI) - Reaction times Correct v Incorrect hands
Table 6.61 Laterality discrimination Reaction time hands - Correct v Incorrect statistical analyses
analysis test group diff
means 95% CI of
diff. means t-
statistic df p-value
Cohen's d
Correct v Incorrect
(sec) paired t-test
case 0.473 0.293, 0.653
5.26 55 <0.001* 0.33
control 0.383 0.266, 0.499
6.45 195 <0.001* 0.30
* = statistically significant

228
6.10.4 Reaction time (back)
The following analyses relate to the time taken to make judgements regarding the direction of
trunk movement.
6.10.4.1 Left v Right
Descriptive statistics and distributions are provided in Table 6.62 and

229
Figure 6.54 to Figure 6.55. Statistical analysis of the difference in reaction times between
correct judgements of trunk movement within each group was conducted with a paired-
samples t-test (Table 6.63).
For cases, on average, there was little difference in reaction times between images of left and
right trunk movement (mean reaction time = 2.08 seconds and 2.14 seconds respectively) and
this difference was not statistically significant (mean difference = -0.068 sec; 95% CI -0.17,
0.035; t = -1.31; DF = 57; p = 0.20; d = -0.09).
Similarly for controls, on average there was little difference in reaction times between images
of left and right trunk movement (mean reaction time = 2.01 seconds and 1.96 seconds
respectively) although this difference was statistically significant (mean difference = 0.055 sec;
95% CI 0.01, 0.10; t = 2.44; DF = 196; p = 0.02; d = 0.08).
Table 6.62 Laterality discrimination descriptive statistics - Reaction times Left v Right back (sec)
trial* mean sd SE 95% CI median IQR min max missing
(n)
case (n=58)
L 2.08 0.69 0.091 1.89, 2.26
2.00 1.51, 2.29
1.06 4.95 0
R 2.14 0.76 0.10 1.94, 2.34
1.91 1.63, 2.48
1.08 4.80 0
control (n=197)
L 2.01 0.72 0.51 1.91, 2.11
1.86 1.51, 2.29
1.00 5.06 0
R 1.96 0.67 0.48 1.86, 2.05
1.81 1.47, 2.28
1.00 4.97 0
* L = left; R = right

230
Figure 6.54 Laterality discrimination histograms & boxplots - Reaction times Left v Right back

231
Figure 6.55 Laterality discrimination means (95% CI) - Reaction times Left v Right back
Table 6.63 Laterality discrimination Reaction time Back - Left v Right statistical analyses
analysis test group diff
means 95% CI of
diff. means t-
statistic df
p-value
Cohen's d
Left v Right (sec)
paired t-test
case -0.068 -0.172, 0.036
-1.31 57 0.2 -0.09
control 0.055 0.011, 0.100 2.44 196 0.02* 0.08
* = statistically significant

232
6.10.4.2 Affected v Unaffected
Descriptive statistics for Affected and Unaffected side are described in Table 6.64 and Figure
6.56 and Figure 6.57. Statistical analysis of the difference in reaction times between trunk
images that corresponded to movement towards the Affected and Unaffected side within each
group was conducted with a paired-samples t-test (Table 6.65).
For cases, on average, there was little difference in reaction times between the affected or
unaffected side (mean reaction time = 2.08 seconds and 2.07 seconds respectively) and this
difference was not statistically significant (mean difference = 0.004 sec; 95% CI -0.09, 0.10; t =
0.08; DF = 56; p = 0.94; d = 0.01).
Similarly for controls, on average there was little difference between the affected or
unaffected side (mean reaction time = 1.97 seconds and 2.01 seconds respectively) and this
was also not statistically significant (mean difference = -0.037 sec; 95% CI -0.08, 0.009; t = -
1.57; DF = 193; p = 0.12; d = -0.05).
Table 6.64 Laterality discrimination descriptive statistics - Reaction time Affected v Unaffected back
trial* mean sd SE 95%
CI median min max IQR
missing (n)
case (n=57)
A 2.08 0.67 0.09 1.90, 2.25
1.92 1.08 3.95 1.60, 2.34
1 (1.7)
U 2.07 0.68 0.09 1.89, 2.25
1.97 1.06 4.95 1.60, 2.27
1 (1.7)
control (n=194)
A 1.97 0.66 0.05 1.88, 2.07
1.84 1.05 4.97 1.51, 2.29
3 (1.5)
U 2.01 0.73 0.05 1.91, 2.11
1.83 1.00 5.06 1.49, 2.29
3 (1.5)

233
Figure 6.56 Laterality discrimination histograms & boxplots - Reaction time Affected v Unaffected back

234
Figure 6.57 Laterality discrimination means (95% CI) - Reaction time Affected v Unaffected back
Table 6.65 Laterality discrimination Reaction time back - Affected v Unaffected statistical analyses
analysis test group diff
means 95% CI of
diff. means t-
statistic df
p-value
Cohen's d
Affected v unaffected
paired t-test
case 0.004 -0.093, 0.101 0.08 56 0.94 0.01
control -0.036 -0.082, 0.009 1.57 193 0.120 -0.05

235
6.10.4.3 Case v Control
Data was combined to form one Case and one Control variable allowing for a direct
comparison between the two groups (Table 6.66 and Figure 6.58). An independent-samples t-
test was used to test the statistical significance of the difference between groups (Table 6.67).
On average, the mean difference in reaction time for left/right judgements of trunk movement
between case and control participants was small (mean reaction time = 2.11 seconds and 1.99
seconds respectively). This difference was not statistically significant (difference in means =
0.123 sec; 95% CI -0.08, 0.32; t = 1.21; df = 253; p = 0.23; d = 0.18) suggesting no difference
between cases and controls.
A point-biserial correlation was run to determine the relationship between left/right
judgement reaction time and group type. Group type was not significantly related to reaction
time (rpb = 0.076; 95% BCa CI -0.043, 0.199; p=0.228) and shared only 0.6% of the variability in
reaction time for the back (rpb2=0.006) (Table 6.68).
Table 6.66 Laterality discrimination descriptive statistics - Reaction time Case v Control back (sec)
mean sd SE 95% CI median IQR min max missing
(n)
case (n=58)
2.11 0.70 0.09 1.93, 2.29 1.97 1.63, 2.28 1.07 4.43 0
control (n=197)
1.99 0.68 0.05 1.89, 2.08 1.80 1.51, 2.26 1.03 4.92 0

236
Figure 6.58 Laterality discrimination histograms, boxplots & means (95% CI) - Reaction time Case v Control back
Table 6.67 Laterality discrimination Reaction time Back - case v control statistical analyses
analysis test group diff
means 95% CI of
diff. means t-
statistic df
p-value
Cohen's d
case v control
independent t-test
side 0.123 -0.078, 0.324
1.21 253 0.23 0.18
Table 6.68 Correlation between Group type and Reaction time (back) - laterality discrimination
analysis test outcome variable rpb 95% BCa CI rpb2 p-value
case v control
bi-serial correlation
Reaction time (back) 0.076 -0.043, 0.199 0.006 0.228

237
6.10.4.4 Correct v Incorrect
Descriptive statistics for correct and incorrect reaction times for left/right judgements of trunk
movement are described in Table 6.69 and Figure 6.59 and Figure 6.60. Statistical analysis of
the difference in reaction times between correct and incorrect judgements within each group
was conducted with a paired-samples t-test (Table 6.70).
For cases, on average, there was over a 1 second difference in reaction times between correct
and incorrect judgements (mean reaction time = 2.11 seconds and 3.27 seconds respectively)
and this difference was statistically significant (mean difference = -1.16 sec; 95% CI -0.83, -
1.49; t = -7.07; DF = 57; p<0.001; d = -0.99).
For controls, on average there was a similar but smaller difference between correct and
incorrect reaction times (mean reaction time = 1.99 seconds and 2.86 seconds respectively)
and this was also statistically significant (mean difference = -0.86 sec; 95% CI -0.73, -0.99; t = -
13.37; DF = 194; p<0.001; d = -0.85).
Table 6.69 Laterality discrimination descriptive statistics - Reaction times Correct v Incorrect back (sec)
trial* n mean sd SE 95% CI median IQR min max missing
(n)
case C 58 2.11 0.70 0.09
1.93, 2.29
1.97 1.63, 2.28
1.07 4.43 0
I 58 3.27 1.53 0.20 2.87, 3.67
2.97 2.15, 3.76
1.14 7.78 0
control
C 197 1.99 0.68 0.05 1.89, 2.08
1.80 1.51, 2.26
1.03 4.92 0
I 195 2.86 1.27 0.09 2.68, 3.04
2.47 1.94, 3.48
1.06 7.67 2
* C = correct; I = incorrect

238
Figure 6.59 Laterality discrimination histograms & boxplots - Reaction times Correct v Incorrect back

239
Figure 6.60 Laterality discrimination means (95% CI) - Reaction times Correct v Incorrect back
Table 6.70 Laterality Discrimination Reaction time Back - Correct v Incorrect statistical analyses
analysis test group diff
means 95% CI of
diff. means t-
statistic df p-value
Cohen's d
Correct v Incorrect
(sec)
paired t-test
case 1.162 0.833, 1.492 7.07 57 <0.001* 0.99
control 0.860 0.734, 0.987 13.37 194 <0.001* 0.85
* = statistically significant

240
6.11 Line bisection testing
6.11.1 Left v right hand
Participants completed 12 trials with the right hand and 12 with the left hand. Individual trials
were then combined to form Right-hand and Left-hand variables for each group (Table 6.71
and

241
Figure 6.61 and Figure 6.62). Absolute errors were adjusted (AEadjusted) to take into account
the differences in line length between tests (Appendix 18).
Statistical analysis of the difference between left and right mean AEadjusted within each group
was conducted with a paired-samples t-test (Table 6.72).
For cases, on average, there was little difference in AEadjusted between tests performed with the
right and left hands (mean AEadjusted = 2.21% and 2.35% respectively) and this difference was
not statistically significant (mean difference = -0.14 %; BCa 95% CI -0.39, 0.12; t = -1.07; DF =
57; p = 0.289; d = -0.15).
Similarly for controls, on average there was little difference between tests performed with the
right and left hands (mean AEadjusted = 2.06% and 2.36% respectively). However, this difference
was statistically significant (mean difference = -0.25 %; 95% CI -0.38, -0.13; t = -4.04; DF = 195;
p < 0.001; d = -0.33).
Table 6.71 Line bisection descriptive statistics - Right v left within groups
side* mean sd SE 95% CI median IQR min max missing
(n)
Case (n=58)
RH 2.21 0.86 0.11 1.99, 2.44
2.13 1.73, 2.56
0.73 5.61 0
LH 2.35 1.01 0.13 2.08, 2.61
2.12 1.69, 2.98
1.03 6.07 0
Controls (n=196)
RH 2.06 0.68 0.05 1.97, 2.16
1.95 1.62, 2.36
0.75 5.18 1
LH 2.36 1.02 0.07 2.21, 2.50
2.25 1.78, 2.66
0.66 10.09 1

242
Figure 6.61 Line bisection histograms & boxplots - Right v left within groups

243
Figure 6.62 Line bisection means (95% CI) - Right v left within groups
Table 6.72 Line bisection Left v Right hand - results of statistical analyses
analysis test group diff
means 95% CI of
diff. means t-
statistic df p-value
Cohen's d
left v right hand
paired t-test
case -0.14 -0.39, 0.12 -1.07 57 0.289 -0.15
control -0.25 -0.38, -0.13 -4.036 195 <0.001* -0.33
* = statistically significant

244
6.11.2 Test paper position - Left v Centre v Right
Participants completed 8 trials each with the test paper centred in front of them, to the left of
centre, and to the right of centre. Individual trials were combined to form 3 variables relating
to the positioning of the paper (Left, Centre and Right paper position) for each group (Table
6.73 and Figure 6.63 to Figure 6.64).
Differences between mean AEadjusted for each test position were small for both case and control
participants (0.04 to 0.23% and 0.09 to 0.24% respectively). A within-group statistical analysis
of the difference between mean AEadjusted for each test position was conducted with a one-way
repeated-measures ANOVA (Table 6.74).
For cases, Mauchly’s test indicated that the assumption of sphericity had been violated (χ2 =
17.56; df = 2; p <0.001), therefore Huynh-Feldt corrected tests are reported (ε = 0.81). The
results show that the mean AEadjusted when estimating midline was not affected by the position
of the test paper (F = 1.70, dfm = 1.61; dfr = 91.94; p = 0.193; ω2 = 0.53).
For controls, Mauchly’s test indicated that the assumption of sphericity was valid (χ2 = 1.39; df
= 2; p = 0.50), therefore no corrections were applied. The results show that the mean AEadjusted
when estimating midline was affected by the position of the test paper (F = 6.77, dfm = 2; dfr =
390; p = 0.001; ω2 = 0.91).
Post hoc analysis of control participant data revealed statistically significant differences for
trials with the test paper in the left versus the centre position (difference in means = 0.24%;
Bonferroni-corrected 95% CI 0.08, 0.40; p = 0.001). This suggests that when the test was
conducted with the paper in the left position, control participants were less accurate in
identifying the midline as compared to the centre position. No statistically significant
difference was revealed for left versus right or centre versus right positions.

245
Table 6.73 Line bisection descriptive statistics - Test paper position relative error (%)
trial* mean sd SE 95% CI median IQR min max missing
(n)
case (n=58)
L 2.23 0.82 0.11 2.02, 2.45 2.10 1.55, 2.67 0.92 5.25 0
C 2.19 0.86 0.11 1.96, 2.42 2.14 1.42, 2.64 1.00 4.81 0
R 2.42 1.24 0.16 2.10, 2.75 2.15 1.58, 3.00 0.67 6.48 0
control (n=196)
L 2.32 0.89 0.06 2.19, 2.44 2.20 1.66, 2.83 0.76 5.78 1
C 2.08 0.81 0.06 1.97, 2.19 2.00 1.48, 2.56 0.50 5.22 1
R 2.17 0.78 0.06 2.06, 2.28 2.07 1.57, 2.66 0.78 5.01 1
Table 6.74 Line bisection Test paper position - results of statistical analyses
analysis test type (ɛ)
F dfM dfR p-value ω2
paper position L v C v R
repeated-measures ANOVA
case HF
(0.81) 1.70 1.61 91.94 0.19 0.53
control SA 6.77 2 390 0.001* 0.91
* = statistically significant; HF = Huynh-Feldt estimate of sphericity; SA = sphericity assumed

246
Figure 6.63 Line bisection histograms - test paper position within groups

247
Figure 6.64 Line bisection boxplots and means (95% CI) - test paper position within groups

248
6.11.3 Line length - 200mm v 225mm v 250mm
Participants were tested 6 times each using lines of 3 different lengths (200mm, 225mm and
250mm). Individual trials were combined to form 3 separate variables for each group (Table
6.75 and Figure 6.65 to Figure 6.66).
Examination of the distributions revealed an extreme score amongst cases for the 225mm line
condition. Their AEadjusted score of 9.63% was twice the value of the next highest case
participant (4.78%). Therefore, their result for this condition was classified as an outlier and
excluded from further analysis.
Differences between mean AEadjusted for each line length were small for both case and control
participants (0.02 to 0.06% and 0.02 to 0.12% respectively). Statistical analysis was conducted
with a one-way repeated-measures ANOVA (Table 6.76).
For cases, Mauchly’s test indicated that the assumption of sphericity had been violated (χ2 =
7.02; df = 2; p = 0.03), therefore Huynh-Feldt corrected tests are reported (ε = 0.92). The
results show that the mean AEadjusted when estimating midline was not affected by line length
(F = 0.03, dfm = 1.84; dfr = 103.09; p = 0.968; ω2 = -0.005).
For controls, Mauchly’s test indicated that the assumption of sphericity was valid (χ2 = 2.65; df
= 2; p = 0.27), therefore no corrections were applied. The results show that the mean AEadjusted
when estimating midline was also not affected by the length of the line (F = 1.06, dfm = 2; dfr =
390; p = 0.348; ω2 = 0.11).

249
Table 6.75 Line bisection descriptive statistics - Line length AEadjusted (%)
trial mean sd SE 95%
CI median IQR min max
missing (n)
case (n=58)
200mm 2.45 1.25 0.16 2.12, 2.78
2.32 1.46, 3.06
0.67 6.61 0
225mm 2.54 1.32 0.17 2.19, 2.88
2.38 1.67, 2.96
0.97 9.63 0
225 - outlier
2.41 0.92 0.12 2.17, 2.66
2.38 1.65, 2.93
0.97 4.78 1
250mm 2.47 1.02 0.13 2.20, 2.73
2.43 1.54, 3.34
0.74 4.42 0
control (n=196)
200mm 2.46 1.13 0.08 2.30, 2.62
2.29 1.75, 2.84
0.54 7.17 1
225mm 2.36 1.00 0.07 2.21, 2.50
2.17 1.67, 2.92
0.69 7.31 1
250mm 2.34 0.93 0.07 2.21, 2.47
2.18 1.63, 2.99
0.40 4.67 1
Table 6.76 Line bisection Line lengths - results of statistical analyses
analysis test type (ɛ) F dfM dfR p-value ω2
line length
200 v 225 v 250
repeated-measures ANOVA
case HF (0.92) 0.03 1.841 103.09 0.968 -0.005
control SA 1.059 2 390 0.348 0.11
* = statistically significant; HF = Huynh-Feldt estimate of sphericity; SA = sphericity assumed
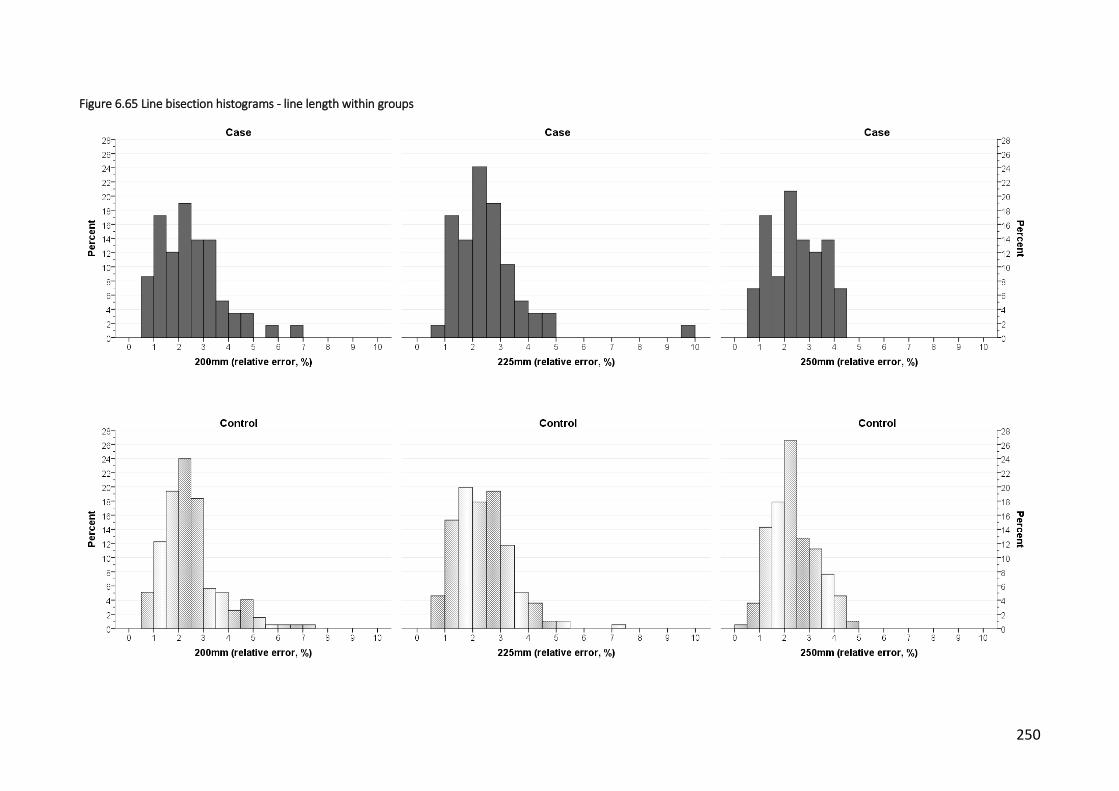
250
Figure 6.65 Line bisection histograms - line length within groups
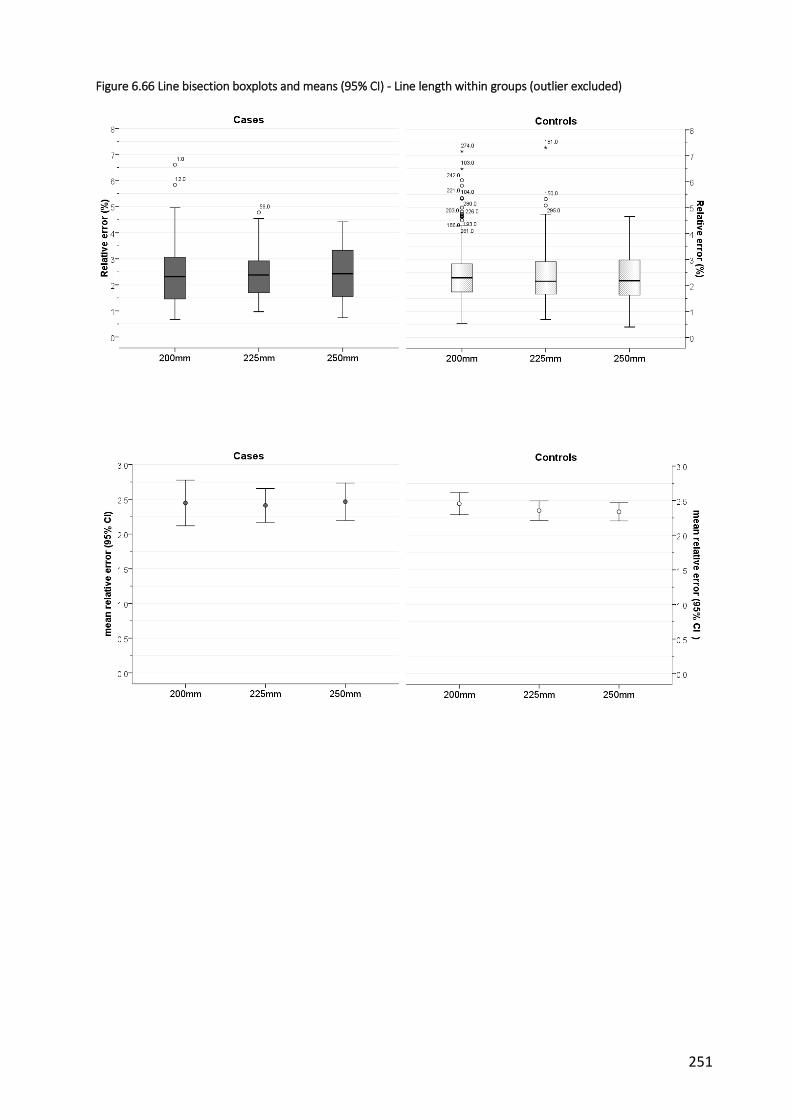
251
Figure 6.66 Line bisection boxplots and means (95% CI) - Line length within groups (outlier excluded)

252
6.11.4 Affected v unaffected side
Mean AEadjusted in determining the midline was analysed taking into account the curve direction
for cases and the corresponding side for the matched controls. This involved recoding each of
the 24 initial trials into affected (i.e. the direction of curve) and unaffected sides with respect
to both the hand that was used, and the position of the test paper. For example, for cases, if
the curve was convex to the right, then the 12 trials using the right hand were reclassified as
‘Affected side’ and 12 trials using the left hand classified as ‘Unaffected side’. The reverse
occurred for curves convex to the left. Controls adopted the same classification as their
matched case.
The same procedure was used to create Affected and Unaffected side variables with respect to
the position of the test paper (only 8 trials each as data from centre position excluded). Results
for these sets of variables are described below under the appropriate headings.
a) Hand used
Descriptive statistics for Affected and Unaffected side (with respect to which hand was used to
complete the task) are described in Table 6.77 and Figure 6.67 and Figure 6.68). One case was
missing x-ray information so was unable to be categorised according to curve direction, along
with the 3 matched control participants. A further case failed to complete the line bisection
test.
Statistical analysis of the difference between Affected and Unaffected mean AEadjusted within
each group was conducted with a paired-samples t-test (Table 6.78).
For cases, on average, there was little difference in AEadjusted between tests using the hand
corresponding to the affected or unaffected side (mean AEadjusted = 2.25% and 2.34%
respectively) and this difference was not statistically significant (mean difference = -0.09 %;
95% CI -0.35, 0.18; t = -0.67; DF = 56; p = 0.508; d = -0.09).
Similarly for controls, on average there was little difference between tests performed with the
hand corresponding to the affected or unaffected side (mean AEadjusted = 2.16% and 2.22%
respectively). This difference was also not statistically significant (mean difference = -0.06 %;
95% CI -0.19, 0.07; t = -0.88; DF = 192; p = 0.38; d = -0.07).

253
Table 6.77 Line bisection descriptive statistics- Affected v unaffected (hand) within groups
trial mean sd SE 95% CI median IQR min max missing
(n)
Case (n=57)
A 2.25 0.92 0.12 2.00, 2.50 2.11 1.76, 2.51 1.00 6.07 1
U 2.34 0.96 0.13 2.08, 2.59 2.25 1.69, 2.99 0.73 5.61 1
Control (n=193)
A 2.16 0.78 0.06 2.05, 2.27 2.04 1.65, 2.58 0.75 5.18 4
U 2.22 0.79 0.06 2.11, 2.33 2.12 1.75, 2.53 0.66 5.13 4
Figure 6.67 Line bisection histograms & boxplots - affected v unaffected (hand) within groups

254
Figure 6.68 Line bisection means (95% CI) - Affected v unaffected sides (hand)
Table 6.78 Line bisection Affected v Unaffected Hand - statistical analyses
analysis test group diff
means 95% CI of
diff. means t-
statistic df
p-value
Cohen's d
affected v unaffected
(hand)
paired t-test
case -0.09 -0.35, 0.18 -0.67 56 0.508 -0.09
control -0.06 -0.19, 0.07 -0.88 192 0.38 -0.07
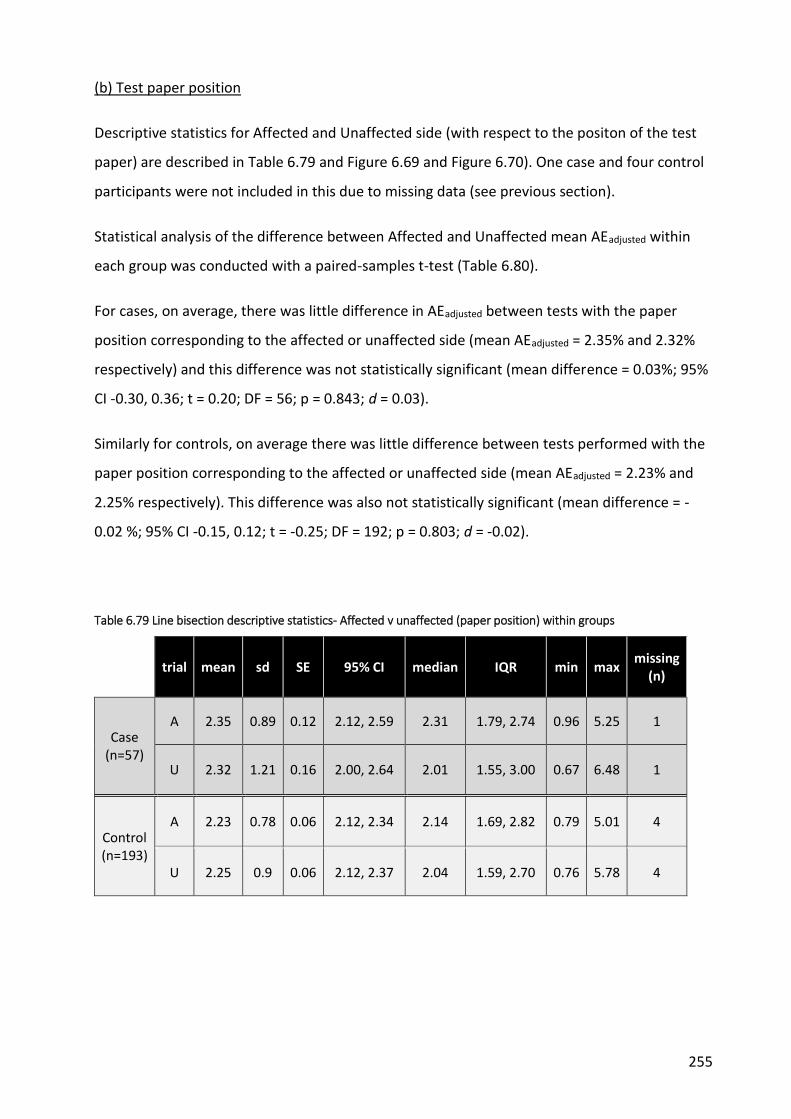
255
(b) Test paper position
Descriptive statistics for Affected and Unaffected side (with respect to the positon of the test
paper) are described in Table 6.79 and Figure 6.69 and Figure 6.70). One case and four control
participants were not included in this due to missing data (see previous section).
Statistical analysis of the difference between Affected and Unaffected mean AEadjusted within
each group was conducted with a paired-samples t-test (Table 6.80).
For cases, on average, there was little difference in AEadjusted between tests with the paper
position corresponding to the affected or unaffected side (mean AEadjusted = 2.35% and 2.32%
respectively) and this difference was not statistically significant (mean difference = 0.03%; 95%
CI -0.30, 0.36; t = 0.20; DF = 56; p = 0.843; d = 0.03).
Similarly for controls, on average there was little difference between tests performed with the
paper position corresponding to the affected or unaffected side (mean AEadjusted = 2.23% and
2.25% respectively). This difference was also not statistically significant (mean difference = -
0.02 %; 95% CI -0.15, 0.12; t = -0.25; DF = 192; p = 0.803; d = -0.02).
Table 6.79 Line bisection descriptive statistics- Affected v unaffected (paper position) within groups
trial mean sd SE 95% CI median IQR min max missing
(n)
Case (n=57)
A 2.35 0.89 0.12 2.12, 2.59 2.31 1.79, 2.74 0.96 5.25 1
U 2.32 1.21 0.16 2.00, 2.64 2.01 1.55, 3.00 0.67 6.48 1
Control (n=193)
A 2.23 0.78 0.06 2.12, 2.34 2.14 1.69, 2.82 0.79 5.01 4
U 2.25 0.9 0.06 2.12, 2.37 2.04 1.59, 2.70 0.76 5.78 4

256
Figure 6.69 Line bisection histograms & boxplots - Affected v unaffected (paper position) within groups
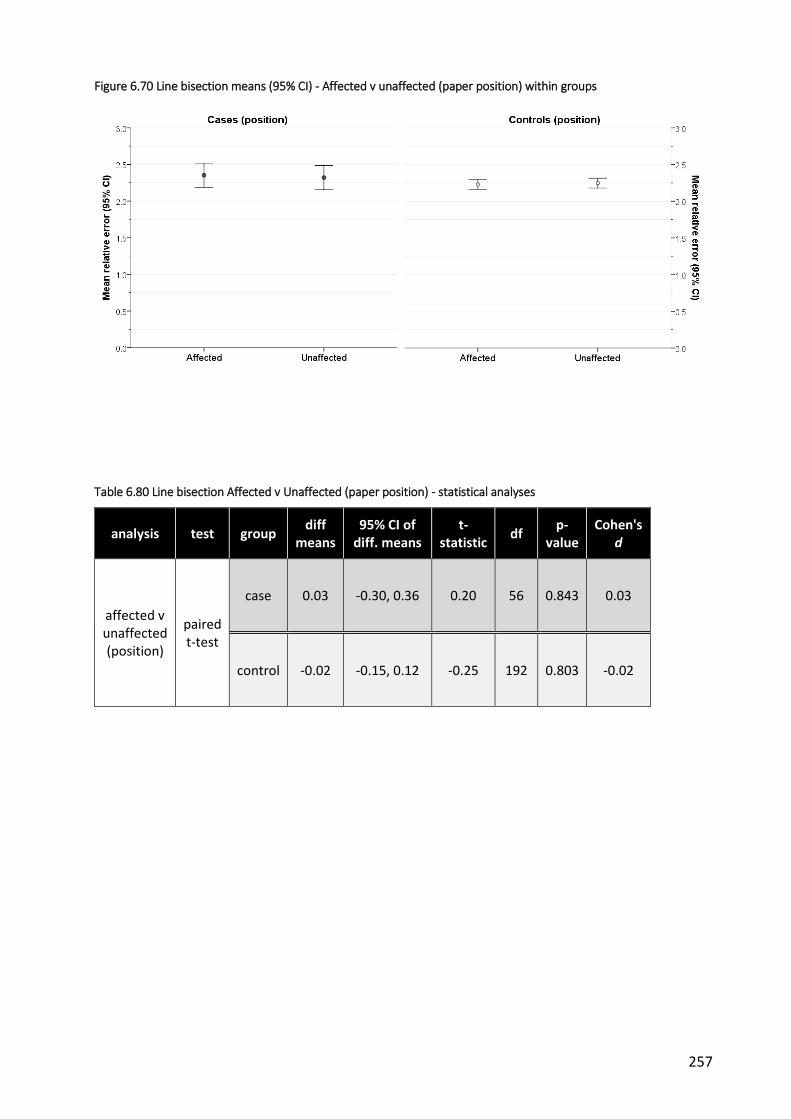
257
Figure 6.70 Line bisection means (95% CI) - Affected v unaffected (paper position) within groups
Table 6.80 Line bisection Affected v Unaffected (paper position) - statistical analyses
analysis test group diff
means 95% CI of
diff. means t-
statistic df
p-value
Cohen's d
affected v unaffected (position)
paired t-test
case 0.03 -0.30, 0.36 0.20 56 0.843 0.03
control -0.02 -0.15, 0.12 -0.25 192 0.803 -0.02

258
6.11.5 Body line v standard lines
Participants completed 18 trials with standard test lines and 6 using lines drawn within the
shape of a human torso. Individual trials were then combined to form Standard lines and Body
line variables for each group (Table 6.81 and Figure 6.71 and Figure 6.72). Statistical analysis of
the difference between mean AEadjusted for standard and body lines within each group was
conducted with a paired-samples t-test (Table 6.82).
For cases, on average, there was a small difference in AEadjusted between tests performed using
either the standard or the body lines (mean AEadjusted = 2.48% and 1.67% respectively) and this
difference was statistically significant (mean difference = 0.81 %; 95% CI 0.60, 1.02; t = 7.76; DF
= 57; p <0.001; d = 0.99).
For controls, on average there was a similar difference between tests performed using either
the standard or the body lines (mean AEadjusted = 2.38% and 1.61% respectively). This difference
was also statistically significant (mean difference = 0.77 %; 95% CI 0.67, 0.88; t = 15.05; DF =
195; p < 0.001; d = 1.13).
Table 6.81 Line bisection descriptive statistics - Body v standard lines within groups
trial mean sd SE 95%
CI median IQR min max
missing (n)
Case (n=58)
body 1.67 0.73 0.10 1.48, 1.86
1.63 1.15, 2.03
0.49 5.04 0
standard 2.48 0.91 0.12 2.24, 2.72
2.27 1.91, 2.96
1.04 5.43 0
Control (n=196)
body 1.61 0.63 0.04 1.52, 1.70
1.56 1.13, 2.06
0.44 3.13 1
standard 2.38 0.74 0.05 2.28, 2.49
2.32 1.88, 2.72
0.97 5.26 1

259
Figure 6.71 Line bisection histograms & boxplots - Body v standard lines within groups

260
Figure 6.72 Line bisection means (95%CI) - body v standard lines within groups
Table 6.82 Line bisection body v standard lines - statistical analyses
analysis test group diff
means
95% CI of diff.
means
t-statistic
df p-value Cohen's
d
body v standard
lines
paired t-test
case 0.81 0.60, 1.02 7.76 57 <0.001* 0.99
control 0.77 0.67, 0.87 15.05 195 <0.001* 1.13
* = statistically significant
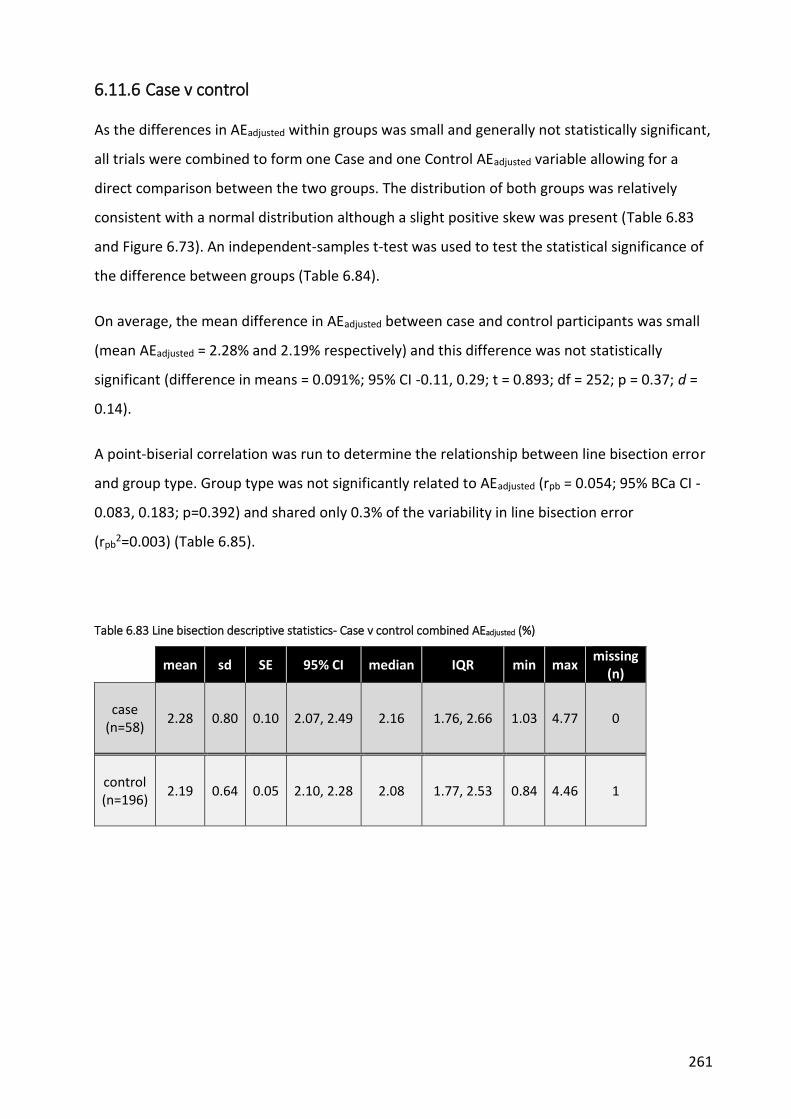
261
6.11.6 Case v control
As the differences in AEadjusted within groups was small and generally not statistically significant,
all trials were combined to form one Case and one Control AEadjusted variable allowing for a
direct comparison between the two groups. The distribution of both groups was relatively
consistent with a normal distribution although a slight positive skew was present (Table 6.83
and Figure 6.73). An independent-samples t-test was used to test the statistical significance of
the difference between groups (Table 6.84).
On average, the mean difference in AEadjusted between case and control participants was small
(mean AEadjusted = 2.28% and 2.19% respectively) and this difference was not statistically
significant (difference in means = 0.091%; 95% CI -0.11, 0.29; t = 0.893; df = 252; p = 0.37; d =
0.14).
A point-biserial correlation was run to determine the relationship between line bisection error
and group type. Group type was not significantly related to AEadjusted (rpb = 0.054; 95% BCa CI -
0.083, 0.183; p=0.392) and shared only 0.3% of the variability in line bisection error
(rpb2=0.003) (Table 6.85).
Table 6.83 Line bisection descriptive statistics- Case v control combined AEadjusted (%)
mean sd SE 95% CI median IQR min max missing
(n)
case (n=58)
2.28 0.80 0.10 2.07, 2.49 2.16 1.76, 2.66 1.03 4.77 0
control (n=196)
2.19 0.64 0.05 2.10, 2.28 2.08 1.77, 2.53 0.84 4.46 1

262
Figure 6.73 Line bisection histograms, boxplots and means (95% CI) - Case v control
Table 6.84 Line bisection Case v Control - statistical analyses
analysis test diff
means 95% CI of
diff. means t-
statistic df p-value
Cohen's d
case v control
independent t-test
0.09 -0.11, 0.29 0.893 252 0.373 0.14
Table 6.85 Correlation between Group type and Line bisection error
analysis test outcome variable rpb 95% BCa CI rpb2 p-value
case v control
biserial correlation
line bisection error 0.054 -0.083, 0.183 0.003 0.392

263
6.12 Trunk proprioception (position matching)
6.12.1 Left v Right
Descriptive statistics and distributions are provided in Table 6.86 and Figure 6.74 to Figure
6.75. Statistical analysis of the difference between left and right side-flexion position matching
ability within each group was conducted with a paired-samples t-test (Table 6.87).
For cases, on average, there was little difference in AEadjusted between tests performed to the
left and right side (mean AEadjusted = 11.01% and 10.15% respectively) and this difference was
not statistically significant (mean difference = 0.87%; 95% CI -1.38, 3.11; t = 0.77; DF = 57; p =
0.44; d = 0.13).
Similarly for controls, on average there was little difference between tests performed to the
left and right sides (mean AEadjusted = 9.37% and 9.95% respectively) and this difference was
also not statistically significant (mean difference = -0.58; 95% CI -1.86, 0.70; t = -0.9; DF = 195;
p = 0.37; d = -0.08).
Table 6.86 Trunk proprioception descriptive statistics - Left v Right-combined tests (AEadjusted %)
side mean sd SE 95% CI median IQR min max missing
(n)
Case (n=58)
L 11.01 6.81 0.89 9.22, 12.81 9.71 6.17, 15.85 0 32.54
0
R 10.15 6.34 0.83 8.48, 11.81 9.26 6.41, 14.09 0 38.28
Control (n=196)
L 9.37 6.56 0.47 8.45, 10.29 8.44 4.31, 12.76 0 31.75
1
R 9.95 7.55 0.54 8.89, 11.02 7.97 4.47, 13.5 0 35.70

264
Figure 6.74 Trunk proprioception histograms & boxplots - Left v Right combined tests

265
Figure 6.75 Trunk proprioception mean (95% CI) - Left v Right
Table 6.87 Proprioception Left v Right - statistical analyses
analysis test group diff
means 95% CI of
diff. means t-
statistic df
p-value
Cohen's d
Left v Right
paired t-test
case 0.87 -1.38, 3.11 0.77 57 0.444 0.13
control -0.58 -1.86, 0.70 -0.90 195 0.372 -0.08

266
6.12.2 Affected v unaffected
Descriptive statistics for Affected and Unaffected side are described in Table 6.88 and Figure
6.76 and Figure 6.77. Statistical analysis of the difference between position matching error of
Affected and Unaffected sides within each group was conducted with a paired-samples t-test
(Table 6.89).
For cases, on average, there was little difference in position matching ability between tests
conducted to the affected or unaffected side (mean AEadjusted = 10.89% and 10.46%
respectively) and this difference was not statistically significant (mean difference = 0.43; 95%
CI -1.86, 2.73; t = 0.38; DF = 56; p = 0.71; d = 0.06).
Similarly for controls, on average there was little difference between tests performed on the
affected or unaffected side (mean AEadjusted = 9.57% and 9.60% respectively) and this difference
was also not statistically significant (mean difference = -0.03; 95% CI -1.32, 1.26; t = -0.04; DF =
192; p = 0.97; d = -0.004).
Table 6.88 Trunk proprioception descriptive statistics - Affected v Unaffected side
side mean sd SE 95% CI median IQR min max missing
(n)
Case (n=57)
A 10.89 6.40 0.85 9.19, 12.59 10.00 6.30, 15.22 0 32.54
1
U 10.46 6.82 0.90 8.65, 12.27 9.37 6.39, 13.58 0 38.28
Control (n=193)
A 9.57 7.03 0.51 8.57, 10.57 8.10 4.65, 13.61 0 33.93
4
U 9.60 6.89 0.50 8.62, 10.58 8.65 4.30, 12.89 0 35.70

267
Figure 6.76 Trunk proprioception histograms & boxplots - Affected v Unaffected

268
Figure 6.77 Trunk proprioception mean (95% CI) - Affected v Unaffected side mean (95% CI)
Table 6.89 Proprioception Affected v Unaffected side - statistical analyses
analysis test group diff
means 95% CI of
diff. means t-
statistic df
p-value
Cohen's d
Affected v unaffected
paired t-test
case 0.43 -1.86, 2.73 0.38 56 0.707 0.06
control -0.03 -1.32, 1.26 -0.04 192 0.966 -0.004

269
6.12.3 Case v control
As the differences in position matching error within groups (left v right, affected v unaffected
sides) was small and not statistically significant, trials were combined to form one Case and
one Control variable allowing for a direct comparison between the two groups.
The distribution of both groups was consistent with a normal distribution (Table 6.90 and
Figure 6.78).
On average, the mean difference in position matching ability between case and control
participants was small (mean AEadjusted = 10.58% and 9.66% respectively) and this difference
was not statistically significant (difference in means = 0.92%; 95% CI -0.65, 2.49; t = 1.16; df =
252; p = 0.25; d = 0.17) suggesting no difference between control and case participants (Table
6.91).
A point-biserial correlation was run to determine the relationship between proprioception and
group type. Group type was not significantly related to position matching error (rpb = 0.073;
95% BCa CI -0.48, 0.186; p=0.249) and shared only 0.5% of the variability in position matching
error (rpb2=0.005) (Table 6.92).
Table 6.90 Trunk proprioception descriptive statistics - Case v Control
mean sd SE 95% CI median IQR min max missing
(n)
Case (n=58)
10.58 5.00 0.66 9.26, 11.90 10.01 7.32, 14.01 0 26.26 0
Control (n=196)
9.66 5.42 0.39 8.90, 10.42 8.75 5.85, 12.60 0 31.13 1 (0.5)
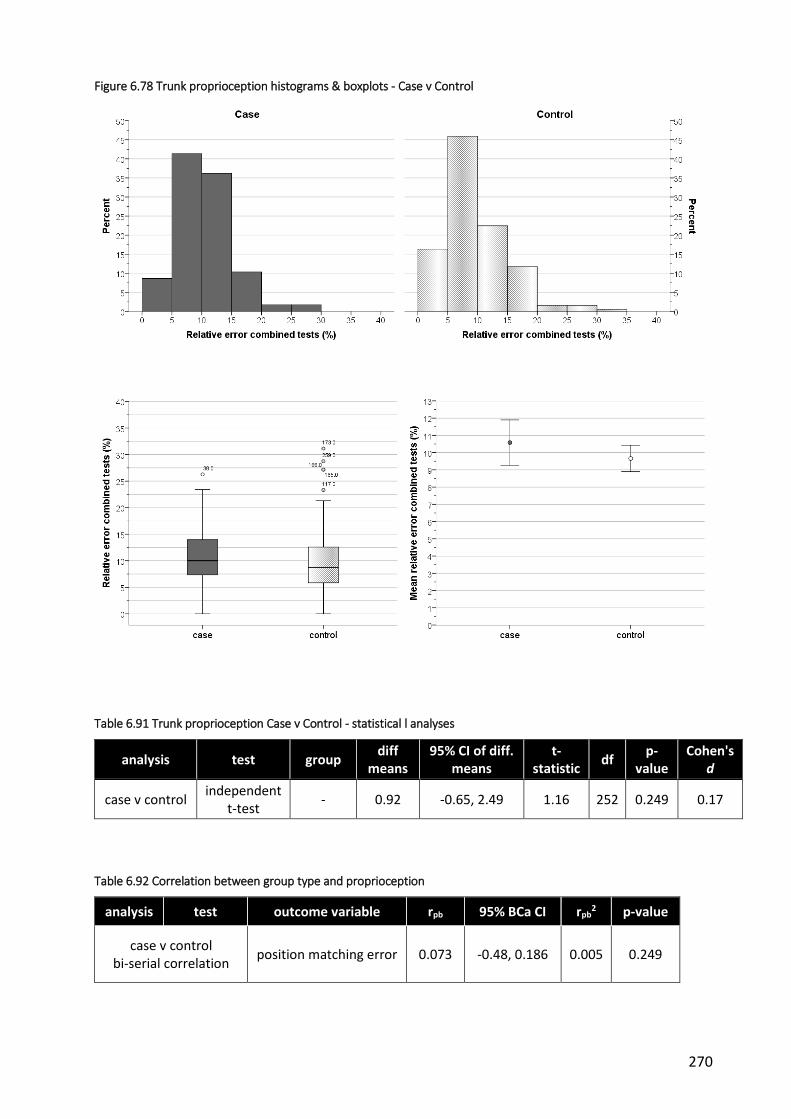
270
Figure 6.78 Trunk proprioception histograms & boxplots - Case v Control
Table 6.91 Trunk proprioception Case v Control - statistical l analyses
analysis test group diff
means 95% CI of diff.
means t-
statistic df
p-value
Cohen's d
case v control independent
t-test - 0.92 -0.65, 2.49 1.16 252 0.249 0.17
Table 6.92 Correlation between group type and proprioception
analysis test outcome variable rpb 95% BCa CI rpb2 p-value
case v control bi-serial correlation
position matching error 0.073 -0.48, 0.186 0.005 0.249

271
6.13 Dynamic standing balance
6.13.1 Left v right
Dynamic standing balance was tested 3 times for both left and right lower limbs. Trials were
then averaged to form a single Right-side and Left-side variable for each group.
A number of extreme scores amongst cases whose balance times were very long relative to the
rest of their cohort were apparent on examining the data. Investigation revealed that these
belonged to two participants in particular (Table 6.93). Participant 1 had very long balance
times for all trials apart from the second trial on the right leg. Participant 28 had long balance
times for the second and third trials on both left and right legs. In these instances, their
balance was between 2.4 to 10 times greater than those of the participant recording the next
longest time suggesting either far greater balance ability than the norm or an error in either
the timing or recording of the tests. This had the effect of increasing the mean times and the
variability for the corresponding trials. Therefore, the balance times for these participants that
were more than twice the next longest time were classified as outliers and excluded from
further analysis.
Table 6.93 Dynamic standing balance - extreme scores
Participant sex age, yrs Cobb angle
primary curve, o
Balance times (secs)
R1 R2 R3 L1 L2 L3
1 F 15.58 35 34* 12 46* 100* 48* 126*
28 M 14.75 NA 4 76* 60* 10 44* 60*
next highest time 14 11 8 10 13 15
* balance times more than 2x next highest value
Descriptive statistics and distributions are provided in Table 6.94 and Figure 6.79 and Figure
6.80.
For cases, on average, there was very little difference in balance time between the left and
right legs (mean = 3.11 and 3.08 seconds respectively) and this difference was not statistically

272
significant (mean difference = 0.036 seconds; 95% CI -0.42, 0.49; t = 0.157; DF = 55; p = 0.88; d
= 0.02) (Table 6.95).
Similarly for controls, on average there was little difference between the left and right legs
(mean = 3.67 and 3.75 seconds respectively) and this difference was not statistically significant
(mean difference = -0.076 seconds; 95% CI -0.40, 0.25; t = -0.464; DF = 196; p = 0.64; d = -0.03).
Table 6.94 Dynamic standing balance descriptive statistics - Left v Right (sec)
side* mean sd SE 95% CI median IQR min max missing
(n)
case (n=56)
L 3.11 1.71 0.23 2.66, 3.57 2.67 2, 3.9 1.00 10.00 2
R 3.08 1.60 0.21 2.65, 3.51 2.83 1.8, 4 1.00 9.00 2
control (n=197)
L 3.67 2.47 0.18 3.32, 4.02 3.00 2.3, 4 1.00 18.67 0
R 3.75 2.57 0.18 3.39, 4.11 3.00 2, 4. 7 1.00 16.67 0
*L = left; R = right
Table 6.95 Dynamic standing balance Left v Right - statistical analyses
analysis test group diff
means 95% CI of
diff. means t-
statistic df
p-value
Cohen's d
Left v Right
paired t-test
case 0.04 -0.42, 0.49 0.16 55 0.88 0.02
control -0.08 -0.4, 0.25 -0.46 196 0.64 -0.03

273
Figure 6.79 Dynamic standing balance histograms & boxplots - Left v Right

274
Figure 6.80 Dynamic standing balance mean (95% CI) - Left v Right balance time

275
6.13.2 Affected v unaffected side
The 6 trials for each side were combined to form an overall Affected-side and Unaffected-side
corresponding to the direction of the curve. As was the case with previous analyses, there
were a number of extreme scores amongst the cases which all came from the same participant
(Table 6.96). They were therefore classified as an outlier and excluded from subsequent
analysis (note that x-ray information was not available for a further case participant, therefore
it was not possible to categorise the affected or unaffected side for this case, nor their three
matching controls).
Table 6.96 Extreme scores
TNO Trial
A1 A2 A3 U1 U2 U3
1 100* 48* 126* 34* 12 46*
next highest time 14 12 8 10 11 15
* more than 2 x next highest score; A1 = Affected-side trial 1 etc; U1 = Unaffected-side trial 1 etc
Descriptive statistics and characteristics of the remaining participants are presented in

276
Table 6.97 and Figure 6.81and Figure 6.82.
For cases, on average, there was very little difference in balance time between the affected
and unaffected sides (mean = 3.17 and 3.02 seconds respectively) and this difference was not
statistically significant (mean difference = 0.15 seconds; 95% CI -0.30, 0.61; t = 0.681; DF = 55;
p = 0.496; d = 0.09) (Table 6.98).
Similarly for controls, on average there was little difference between the affected and
unaffected sides (mean = 3.66 and 3.69 seconds respectively) and this difference was not
statistically significant (mean difference = -0.04 seconds; 95% CI -0.35, 0.27; t = -0.23; DF = 193;
p = 0.82; d = -0.01).

277
Table 6.97 Dynamic standing balance descriptive statistics - Affected v unaffected side
side mean sd SE 95% CI median IQR min max missing
(n)
case (n=56)
A 3.17 1.58 0.21 2.75, 3.60 2.83 2, 4.33 1.00 9.00 2
U 3.02 1.73 0.23 2.56, 3.48 2.67 1.67, 3.58 1.00 10.00 2
control (n=194)
A 3.66 2.35 0.17 3.32, 3.99 3.00 2, 4.33 1.00 16.67 3
U 3.69 2.46 0.18 0.33, 4.04 3.00 2.33, 4.42 1.00 16.00 3
Figure 6.81 Dynamic standing balance histograms & boxplots - Affected v unaffected side

278
Figure 6.82 Dynamic standing balance means (95% CI) - Affected v unaffected side
Table 6.98 Dynamic standing balance Affected v Unaffected side - statistical analysis
analysis test group diff
means 95% CI of
diff. means t-
statistic df
p-value
Cohen's d
Affected v unaffected
paired t-test
case 0.15 -0.30, 0.61 0.68 55 0.50 0.09
control -0.04 -0.35, 0.27 -0.23 193 0.82 -0.01

279
6.13.3 Case v control
As little difference was found related to curve direction or between left and right balance times
within groups, all trials were combined into one variable to allow for a direct comparison
between case and control participants using all their respective data. These are summarised in
Figure 6.83 and Table 6.99.
Data for both groups, particularly controls, was positively skewed with scores again clustered
around the lower times. Average times were therefore correspondingly low with small
differences in mean and median scores between groups.
Due to the lack of normality and homogeneity of variance displayed by the data, a log10
transformation was applied to both groups (Figure 6.84 and Table 6.99).
On average, control participants were able to maintain balance longer than cases although the
difference between groups was small (untransformed mean = 3.10 and 3.71 seconds cases and
controls respectively). Transformation of the data resulted in means of 0.45 and 0.51 log10-
seconds for cases and controls respectively (geometric means of 2.81 and 3.24 seconds) with a
difference of 0.063. The corresponding geometric mean ratio was 1.15 (95% CI 1.00 to 1.34),
i.e. on average, controls balance times were 1.15 times the balance times of cases. The
confidence interval for the ratio includes 1 which implies no difference between the geometric
means.
Statistical analysis was performed using an independent-samples t-test on the transformed
data (Table 6.100). The difference between groups was not statistically significant (95% CI -
0.125, 0.001; t = 1.949 equal variances assumed; DF = 251; p = 0.052; d = 0.29).
A point-biserial correlation was run to determine the relationship between balance and group
type. Group type was not significantly related to balance time (rpb = 0.093; 95% BCa CI -0.147,
0.189; p=0.140) and shared only 0.9% of the variability in dynamic standing balance time
(rpb2=0.009) (Table 6.101).
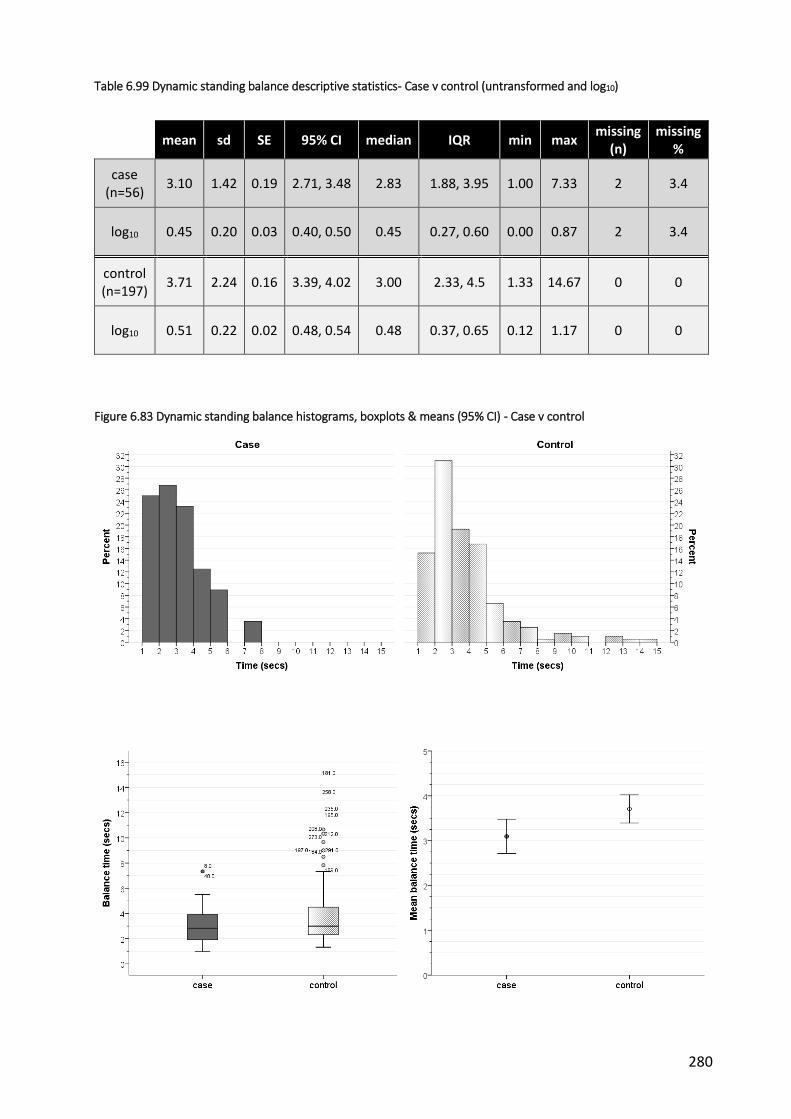
280
Table 6.99 Dynamic standing balance descriptive statistics- Case v control (untransformed and log10)
mean sd SE 95% CI median IQR min max missing
(n) missing
%
case (n=56)
3.10 1.42 0.19 2.71, 3.48 2.83 1.88, 3.95 1.00 7.33 2 3.4
log10 0.45 0.20 0.03 0.40, 0.50 0.45 0.27, 0.60 0.00 0.87 2 3.4
control (n=197)
3.71 2.24 0.16 3.39, 4.02 3.00 2.33, 4.5 1.33 14.67 0 0
log10 0.51 0.22 0.02 0.48, 0.54 0.48 0.37, 0.65 0.12 1.17 0 0
Figure 6.83 Dynamic standing balance histograms, boxplots & means (95% CI) - Case v control

281
Figure 6.84 Dynamic standing balance histograms, boxplots & means- Case v control Log10 transformation
Table 6.100 Dynamic standing balance Case v Control- statistical analyses
analysis test group diff
means 95% CI of
diff. means t-
statistic df
p-value
Cohen's d
case v control
independent t-test
log10
values -0.06 -0.13, 0.001 -1.95 251 0.052 -0.29
Table 6.101 Correlation between group type and balance
analysis test outcome variable rpb 95% BCa CI rpb2 p-value
case v control bi-serial correlation
balance time 0.093 -0.147, 0.189 0.009 0.140

282
6.14 Summary
6.14.1 Demographics
Overall, the demographic data from both groups suggested that the recruitment and matching
process was successful in terms of creating groups of similar characteristics. Participants from
both groups spanned the eligible age range (10-17yrs) although there was a slight bias towards
the older age groups. Figures for ethnicity were comparable for both groups and reflect the
general population of England [7]. The ratio of female:male participants was equal for both
groups and was in line with previously reported figures for AIS (see Chapter 1.3.1).
A small difference was noted between groups in terms of self-reported puberty status, with a
greater proportion of case participants stating they had reached puberty at the time of
inclusion into the study. A greater proportion of case participants also reported other family
members with scoliosis which is not an unexpected outcome as there is known to be some
genetic component to the aetiology of AIS (see section 1.3.4).
Control participants reported higher estimates of weekly family income than case participants.
It is unclear why this occurred although a sizeable proportion of control participants were
recruited from private fee-paying schools. No information was collected regarding school-type
from case participants so this cannot be evaluated in greater detail. Estimates of family income
were based on postcode estimates from the Office of National Statistics. Attempts were made
initially to collect self-reported data of parental income from participants but this was poorly
completed, especially by control participants.
Apart from these differences, the groups appeared to be similar with regard to demographic
characteristics. The small differences between groups on some parameters are unlikely to have
a major impact on the results.
6.14.2 Spinal characteristics - cases
The case participants were representative of the general AIS population in terms of spinal
deformity. The majority of curves were in the thoracic region and convex to the right,
consistent with descriptions from previous epidemiological studies [8]. The degree of
deformity, as defined by the Cobb angle, covered the spectrum from mild to severe scoliosis
(14 to 50o), with the majority of cases falling into the moderate AIS category (IQR 27-41o).

283
6.14.3 Perceived trunk symmetry
Perceived trunk symmetry was measured using the SAQ. There are no previously published
normative values for the SAQ for people without AIS. Control participant scores for all scales
were on average lower (i.e. better) than case participants. Scores for case participants were
consistent with previous reports of people with Cobb angles of a similar range or larger than
the participants in this study [9-11].
Large correlation coefficients between SAQ scales and group were observed indicating that
group type was strongly associated with perceived trunk symmetry. This was confirmed by
non-parametric significance testing. Large statistically significant differences between case and
control groups were recorded with case participants’ scores approximately double (i.e. worse)
that of controls for both the appearance and expectations subscales, as well as the total score.
This suggests that, at least for the participants in this study, people with AIS are aware of the
changes in their spine and perceive the symmetry of their trunk to be markedly different from
normal.
6.14.4 Body Awareness
Kinaesthetic and proprioceptive awareness was measured by the KPAQ. Case and control
participants recorded similar scores with cases reporting slightly lower (i.e. worse) scores on
average.
Very weak correlations between KPAQ and group were observed indicating that group type
was only weakly associated with self-reported body awareness. These results were confirmed
by non-parametric significance testing. A small, statistically significant difference between case
and control groups was recorded (difference in medians = 2.5), suggesting that cases were
worse than control participants in terms of kinaesthetic and proprioceptive awareness.
However, the effect size was very modest and it is uncertain whether this difference is
sufficient to be of clinical significance.
6.14.5 Health related quality of life (HRQoL)
Two measures were used to evaluate HRQoL in this study: a condition-specific (SRS-22r) and a
generic (EQ5D) instrument.

284
6.14.5.1 Generic
Overall, very few participants reported severe or extreme problems in any of the 5 domains
evaluated by the EQ5D. For this reason, responses were collapsed down into categories of
problems and no problems.
Normative values for the EQ5D-3L published by the EuroQol Group do not cover children or
adolescents. The closest age group for which data are available is for 18-24 yr olds [12]. In this
age group, the proportions of people reporting problems with the EQ5D-3L domains in England
(n=1259, 572M: 687F), along with the mean health state visual analogue scale (VAS) score, are
reported in Table 6.102. The results of the case control study are included for comparison.
Table 6.102 Proportion of people reporting problems (%) and mean VAS score
mobility self care usual
activities pain /
discomfort anxiety /
depression
health state VAS
(%) (%) (%) (%) (%) (mean)
EuroQol England 18-24yrs
4.0 0.8 4.4 16.0 15.6 86.5
Cases 17.5 1.8 21.1 66.7 26.3 77.65
Controls 2.0 1.0 3.0 16.2 16.8 88.65
The proportion of control participants reporting problems in the case control study were
similar to those described for 18-24 yr-olds in England. In contrast, the proportion of case
participants reporting problems were approximately 4 to 5 times higher than the published
normative values and control participants for mobility, usual activities and pain domains. The
proportions with anxiety problems were also greater for case participants though to a lesser
extent.
The differences between case and control participants were statistically significant for the
mobility, usual activity and pain domains. They also reflect the large odds ratios recorded for
these domains although wide 95% confidence intervals indicate the large variability.
A statistically significant difference between case and control participants was also observed
for the health state VAS. Previous reports in the literature across a range of health conditions
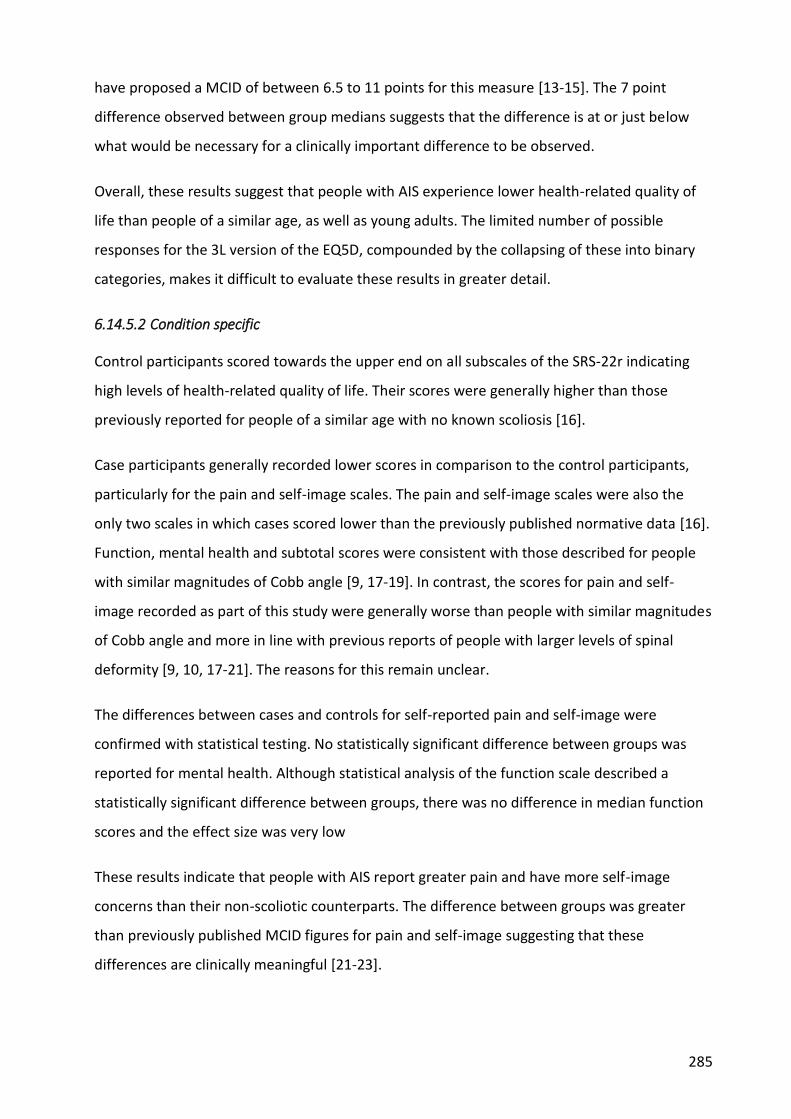
285
have proposed a MCID of between 6.5 to 11 points for this measure [13-15]. The 7 point
difference observed between group medians suggests that the difference is at or just below
what would be necessary for a clinically important difference to be observed.
Overall, these results suggest that people with AIS experience lower health-related quality of
life than people of a similar age, as well as young adults. The limited number of possible
responses for the 3L version of the EQ5D, compounded by the collapsing of these into binary
categories, makes it difficult to evaluate these results in greater detail.
6.14.5.2 Condition specific
Control participants scored towards the upper end on all subscales of the SRS-22r indicating
high levels of health-related quality of life. Their scores were generally higher than those
previously reported for people of a similar age with no known scoliosis [16].
Case participants generally recorded lower scores in comparison to the control participants,
particularly for the pain and self-image scales. The pain and self-image scales were also the
only two scales in which cases scored lower than the previously published normative data [16].
Function, mental health and subtotal scores were consistent with those described for people
with similar magnitudes of Cobb angle [9, 17-19]. In contrast, the scores for pain and self-
image recorded as part of this study were generally worse than people with similar magnitudes
of Cobb angle and more in line with previous reports of people with larger levels of spinal
deformity [9, 10, 17-21]. The reasons for this remain unclear.
The differences between cases and controls for self-reported pain and self-image were
confirmed with statistical testing. No statistically significant difference between groups was
reported for mental health. Although statistical analysis of the function scale described a
statistically significant difference between groups, there was no difference in median function
scores and the effect size was very low
These results indicate that people with AIS report greater pain and have more self-image
concerns than their non-scoliotic counterparts. The difference between groups was greater
than previously published MCID figures for pain and self-image suggesting that these
differences are clinically meaningful [21-23].

286
6.14.6 Generic function
Generic function was measured using the PODCI. Scores for both case and control participants
in this study were consistent with previous reports of people with and without scoliosis
respectively [Lerman et al 2002] with case participants generally scoring lower (i.e. worse) than
controls for all PODCI scales.
Weak correlations between the various scales and group were observed indicating that group
type was only weakly associated with function. The strongest relationships were with pain,
global function and happiness with physical condition domains although group type only
accounted for a relatively small amount of variability in each of these scales (< 12%).
These results were confirmed by non-parametric significance testing. Large statistically
significant differences were reported between group medians for pain and happiness, with
smaller differences for global function and sports function. However, effect sizes for all of
these were generally modest (<0.30, Pearson’s r).
These findings indicate that people with AIS do not suffer any major deficits with regard to
generic function except for perhaps pain and possibly happiness with physical condition.
6.14.7 Tactile acuity
Tactile acuity was assessed through TPDT and localisation ability testing.
6.14.7.1 Two point discrimination threshold (TPDT)
Within-group analyses of side-to-side differences were conducted for left v right and affected v
unaffected side (affected = curve direction of main curve). No significant differences were
reported for cases for these analyses. Differences between mean TPDTs for controls were only
slightly larger than for cases but were sufficient to be statistically significant for left v right and
affected v unaffected sides. However, the effect size for both was relatively small.
Overall, median TPDTs for case and control participants were consistent with previously
reported threshold distances for the lumbar and thoracic spine in healthy adults (see section
3.2.i), although there was substantial variability. Group type and TPDT was only weakly
correlated although on average, case participants reported greater TPDTs than control
participants which was statistically significant. These results suggest that people with AIS

287
display less tactile acuity than people without AIS, although the difference was small (i.e.
≤1cm). It is unclear if this difference is clinically significant.
Of interest is the fact that TPDT was unable to be calculated for one or both sides of the spine
in a large proportion of case participants (19% v 1% cases and control respectively). In these
participants, the lack of response consistency and the failure to identify one-point catch trials
resulted in their testing declared void. It is unclear why this occurred in cases to a greater
extent than control participants.
6.14.7.2 Localisation
Within-group analyses of side-to-side differences were conducted for left v right and affected v
unaffected side. The differences in the number of correct responses for both case and control
groups were very small (i.e. less than 1) and this was not statistically significant indicating no
differences in ability to localise the site of stimulation between sides.
Overall, localisation ability (as defined by the number of correct responses) for case and
control participants were much lower than those reported by Wand et al [24], where distance
between testing sites was large, but very similar to the study by Harvie et al [25], whose study
of localisation accuracy in the neck used distances between sites similar to those in this case
control study. The high accuracy figures for the ability to at least locate the correct side of
stimulation are more reflective of the testing protocol used by Wand et al [24], hence the
similarity of results for this analysis.
As with TPDT, only weak correlations were observed between group type and localisation
accuracy. Significance testing of the difference between group means revealed that on
average, control participants reported more correct responses than case participants. Although
statistically significant, control participants were only slightly more accurate in locating the
correct side than cases, reflecting the fact that both groups scored highly on this task. These
results suggest that people with AIS display less localisation accuracy than people without AIS,
although the difference was small. It is unclear if these differences are clinically significant.
6.14.8 Left/right judgement
Testing of left/right judgement ability involved evaluations of accuracy and reaction time for
both images of the hand and the trunk.

288
6.14.8.1 Accuracy
Within-group analyses of side-to-side differences were conducted for left v right and affected v
unaffected side. For controls, the difference in accuracy between sides was small and not
statistically significant when viewing images of the hand and trunk. For case participants, a
small statistically significant difference was observed between left and right sides for
judgement accuracy of hand and trunk images. However, these differences were small (2-3%),
with corresponding small effect sizes, and were not seen in the analyses taking into account
curve direction (affected v unaffected).
Overall, the left/right judgement accuracy for both groups was consistent with previously
reported figures for hand and trunk images (see section 3.2.1). Correlations between group
type and judgement accuracy were very low and this was reflected in the lack of a statistically
significant difference between case and control participants on average.
6.14.8.2 Reaction time
Within-group analyses of side-to-side differences in reaction time for correct responses were
conducted for left v right and affected v unaffected side. In general, there were no significant
differences between sides for either case or control groups when viewing images of the hand
or trunk.
Overall, the time to make a correct decision for both groups was consistent with previously
reported figures for hand and trunk images (see section 3.2.1), although cases tended be
slower. This difference was not statistically significant when viewing images of the trunk. In
contrast, the small difference in reaction times when viewing images of the hand (difference in
means = 0.36 seconds, 0.04-0.68 95% CI) was statistically significant despite only weak
correlation between group type and reaction time.
In summary, the results indicate that on average there is no difference in accuracy of left/right
judgement between case and control participants. There also appears to be no difference
between groups in the time taken to make those judgements, at least for images of the trunk.
Of interest, the reaction times when making correct left/right judgments were slower when
viewing images of the hand than for the back. In testing of the hands, participants were
requested to distinguish whether the image was of a left or right hand, whereas, for images of

289
the trunk, participants were required to judge the direction of movement. Therefore, whether
the faster times when judging trunk images represents a greater ability to judge left from right
in the trunk, or a reflection of the slight difference in task between the two sets of images is
uncertain.
Also of interest was the difference between reaction times for correct left/right judgements in
comparison to incorrect judgements. When viewing images of both the hand and the trunk,
the response times for correct responses were faster on average. Within group analyses
revealed that these differences were statistically significant for both case and control groups.
Previous reports have also highlighted this effect and ascribed it to the extra time and difficulty
required to mentally transform the internal body representation to match that of the viewed
image [26, 27].
6.14.9 Spatial perception
Spatial perception was evaluated using the line bisection test. A number of within-group
analyses were conducted to examine error in midline judgement alongside factors such as
hand used, line length, test paper position, and side-to-side differences.
In general, participants from both groups were very accurate in estimating the midpoint of a
line .This held true regardless of the different test manipulations including line length, hand
used, position of the test paper and curve direction. No statistically significant differences were
reported for any of these factors amongst case participants. Small differences were reported
between left and right hands and for the test paper position in the control group.
Overall, the % error for both cases and controls was consistent with previously published
reports (see section 3.3.1). The difference between the groups was not statistically significant
which is consistent with weak correlation between group type and midline error. These results
suggest that there is no difference in people with AIS and those without with regard to spatial
perception.
The line bisection testing also included evaluation of midline perception error between a
standard straight line and one that was drawn within the shape of a torso. Within-group
analyses of the difference in error between these two conditions (standard v body line)
revealed a statistically significant difference in both case and control groups with lower % error
when midline judgements were made with the body line. The mean errors for body lines for

290
cases and controls equated to distances of 1.67 mm and 1.61 mm respectively. In comparison,
when using the standard lines, the mean errors equated to distances of between 4.96 to 6.20
mm for case participants and 4.76 to 5.95 mm for control participants (depending on line
length). It is uncertain why this was the case.
6.14.10 Proprioception
Within-group analyses of side-to-side differences were conducted for left v right and affected v
unaffected side. No statistically significant differences in position matching error were
reported for either cases or controls for these analyses.
Overall, there was less than a 1% difference in position matching error between case and
control participants. This difference was not statistically significant. These results, combined
with a very weak correlation between group type and position matching error, indicate that
there is no difference between people with AIS and those without with regards to trunk
proprioceptive ability.
6.14.11 Balance
In general, both case and control participants performed poorly on the dynamic standing
balance test, only being able to maintain balance for median times of approximately 2.5-3
seconds. Within-group analyses of side-to-side differences were conducted for left v right and
affected v unaffected side. No significant differences in balance time were reported for either
cases or controls for these analyses.
Overall, case and control participants had very similar balance times and these were consistent
with previously reported values in an adolescent population [28]. On average, there was less
than a 1 second difference in balance time between case and control participants and this was
not statistically significant. These results, combined with a very weak correlation between
group type and balance time, indicate that there is no difference between people with AIS and
those without with regards to dynamic standing balance.
6.14.12 Limitations
The most important sources of bias associated with case control study designs include
selection bias and measurement (observer) bias [29]. Measures to avoid or reduce these in
relation to this study were described in section 5.2.8.

291
Limitations of case control designs also include an inability to infer causality or determine the
temporal sequence of condition and the variable of interest [29]. A discussion of other
limitations specific to this study include the following:
6.14.12.1 Prevalent v incident cases
The case participants recruited for this study were not confined to those who had suffered
recent onset of AIS, or who had been recently diagnosed. Therefore, the duration of the
condition amongst the group varied to some extent and this may have affected the results.
Participants with AIS of longer duration, who may have undergone previous treatment,
investigations and had longer to adjust to the condition and its potential consequences, may
respond differently to questionnaires and physical testing than those diagnosed more recently.
6.14.12.2 Control recruitment
The recruitment of controls from schools was an attempt to minimise the potential for
selection bias as described previously. However, the response from schools was, in the main,
very poor which resulted in recruitment occurring from all schools that were willing to be
involved, rather than being able to randomly select from a list of potential recruitment sources.
It is unclear as to how this may have affected the results of this study as no information was
collected from case participants as to school type. It is possible that the observed difference in
income estimates is a clue to the potential effect of this limitation. However, socioeconomic
factors are not known to be a factor in the development of AIS, and case and control
participants appeared to be comparable on all other relevant demographic factors.
(iii) Measurement properties
Some of the self-report measures used in this study appeared to be lacking with regard to
psychometric properties for use in the participant groups involved.
For example, the PODCI exhibited ceiling effects for most subscales that indicate that it is not
suitable for use in healthy adolescents or in those with AIS who do not have any other
significant medical condition. The pain, and possibly the happiness with physical condition
subscales, were the only ones that did not exhibit this effect. The high scoring of participants in
this study is probably a reflection of the fact that the PODCI was originally developed to
evaluate children and adolescents who had problems related to bone and muscle conditions

292
necessitating orthopaedic interventions. It appears that it is not sensitive enough for those
without any major health conditions or in adolescents with mild to moderate AIS.
Similar extreme effects were also noted for the EQ5D 3L, SAQ and some subscales of the SRS-
22r.
6.14.13 Conclusion
The case control study that was conducted as part of this thesis set out to establish whether
adolescents with AIS differ from non-scoliotic adolescents with regard to mechanisms thought
to underpin body schema. The results presented in this chapter from both physical testing and
self-report questionnaires suggest that no major difference exists in these mechanisms and
therefore, calls into question the role of a disrupted body schema in the development of AIS.
Differences have been found in relation to other aspects such as perceived trunk symmetry
and health-related quality of life, as well as pain and self-image. Although these were not
central to the main research question, they are relevant and important in considering how best
to deal with this condition. Further exploration of this area will take place in the overall
discussion of this thesis (Chapter 10).
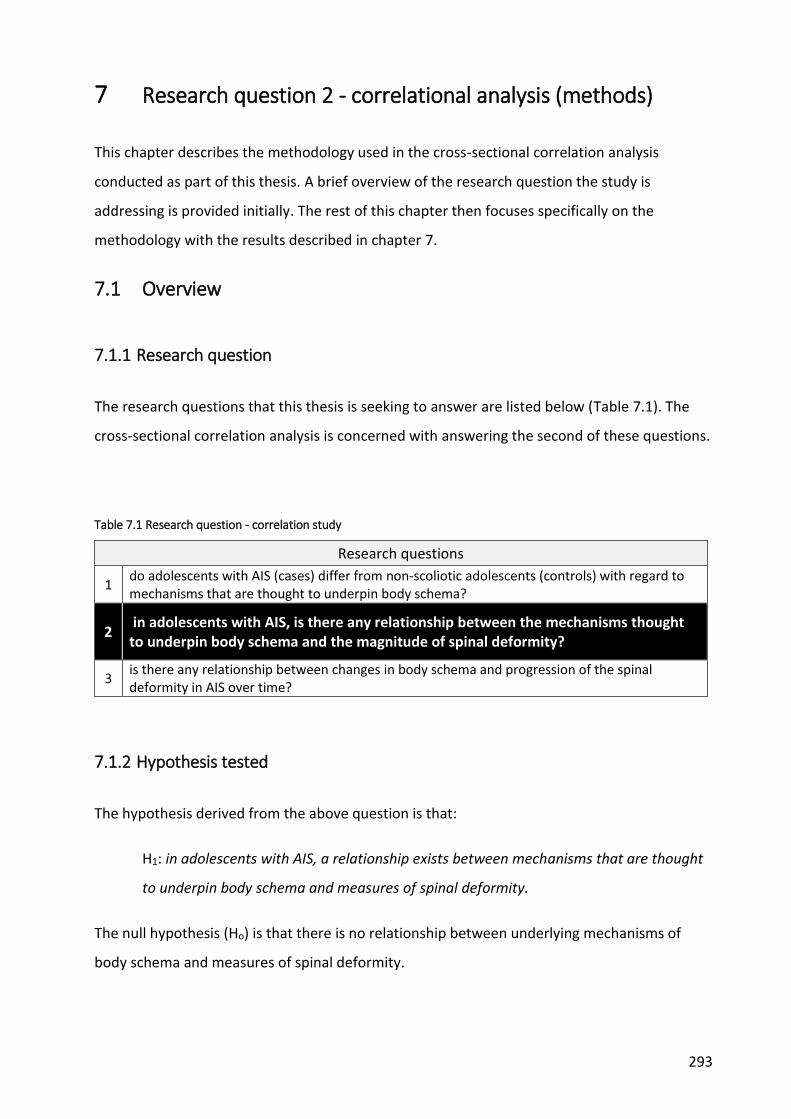
293
7 Research question 2 - correlational analysis (methods)
This chapter describes the methodology used in the cross-sectional correlation analysis
conducted as part of this thesis. A brief overview of the research question the study is
addressing is provided initially. The rest of this chapter then focuses specifically on the
methodology with the results described in chapter 7.
7.1 Overview
7.1.1 Research question
The research questions that this thesis is seeking to answer are listed below (Table 7.1). The
cross-sectional correlation analysis is concerned with answering the second of these questions.
Table 7.1 Research question - correlation study
Research questions
1 do adolescents with AIS (cases) differ from non-scoliotic adolescents (controls) with regard to mechanisms that are thought to underpin body schema?
2 in adolescents with AIS, is there any relationship between the mechanisms thought to underpin body schema and the magnitude of spinal deformity?
3 is there any relationship between changes in body schema and progression of the spinal deformity in AIS over time?
7.1.2 Hypothesis tested
The hypothesis derived from the above question is that:
H1: in adolescents with AIS, a relationship exists between mechanisms that are thought
to underpin body schema and measures of spinal deformity.
The null hypothesis (Ho) is that there is no relationship between underlying mechanisms of
body schema and measures of spinal deformity.

294
7.2 Methods
7.2.1 Study design
To test the proposed hypothesis, a cross-sectional analysis evaluating measures of body
schema and spinal deformity in AIS patients was conducted. Data obtained from participants
with AIS as part of the case control study described in chapters 4 and 5 was used for this study.
The setting, methods of participant recruitment (including inclusion and exclusion criteria),
potential biases and ethics have been described previously in sections 5.2.2, 5.2.3, 5.2.8 and
5.2.10 respectively.
7.2.2 Variables
Information collected from participants with AIS is described in sections 5.2.4 to 5.2.7 and
listed in Tables 5.2 and 5.3. These include all the self-report and physical measures from which
data was obtained for this correlation study.
7.2.2.1 Radiological measures
In the case control study, the x-ray information was used to characterise the AIS participants to
evaluate how typical they were of the general AIS population (Table 5.2). In this correlation
study, the x-ray information will be analysed in order to evaluate the study hypotheses. A
complete list of measures collected from radiological examination are listed in Table 7.2.
Table 7.2 X-ray variables
Variable data type
Curve type categorical (single, double, triple)
Curve direction* categorical (left, right)
Curve location* categorical (thoracic, thoracolumbar, lumbar, unknown)
Cobb angle* continuous (degrees)
Coronal balance continuous (mm)
Sagittal balance continuous (mm)
Risser sign categorical (0-5)
* of primary curve

295
7.2.2.2 Surface topography
As well as information from radiological examination, a subset of participants with AIS also
underwent surface topography measurements of the back, which is another method of
evaluating spinal deformity (see section 1.1). The Integrated Shape Imaging System (ISIS-2)
produces contour surface maps of the posterior trunk to highlight asymmetry and cosmetic
changes in body shape that occur as a result of the changes in the scoliotic spine [1]. A number
of different parameters are calculated in order to characterise the shape of the posterior trunk
(Table 7.3).
Table 7.3 ISIS2 variables
Variable data type
Lateral asymmetry* continuous (degrees)
Volumetric asymmetry* continuous (degrees)
Coronal balance continuous (mm)
Sagittal balance continuous (mm)
Transverse rotation continuous (degrees)
Flexion/extension angle continuous (degrees)
* corresponding to primary curve direction
The relevant details are described in detail in Appendix 19 but briefly,
Lateral asymmetry attempts to capture surface changes in the coronal or frontal plane
caused by underlying deviation of the spine. The derived value corresponds to the Cobb
angle from radiological examination.
Volumetric asymmetry refers to the differences in surface area between the left and
right side of the spine. Due to the contour-like maps that are produced, a 3-D image can
be drawn and overall volume differences calculated.
Coronal and sagittal balance are similar to the equivalent measures from x-rays which
capture the distance between plumb lines drawn down from C7 and up from the base

296
of the lumbar spine. These evaluate the deviation of the head over the sacrum in both
the coronal and sagittal planes.
Flexion/extension angle refers to a derived angle of trunk inclination in the sagittal
plane.
Derived measures of kyphosis and lordosis are also calculated by the ISIS-2 system but these
were not used in this study.
Previous studies have reported that ISIS-2 measurements are reliable [2] and that they
correlate well with Cobb angle [1, 3, 4], predict curve progression, and can discriminate
between surgical and non-surgical candidates [3].
Normative values for ISIS-2 measures have previously been established in non-scoliotic UK
school children between 10-16 years of age (n=271) [5]. No statistically significant differences
between sex or age groups were encountered within this cohort (Table 7.4). The results for
lateral asymmetry are similar to those reported in a previous study (mean 14.1 degrees, 95% CI
11.7, 16.5) which examined a convenience sample of 48 non-scoliotic adults (age 18-40ys) [6].
Both of these studies used an earlier version of ISIS.
Table 7.4 Normative values for ISIS measurements
age group n
Lateral asymmetry angle (max)
Volumetric asymmetry (max)
Transverse rotation angle
(yrs) (degrees) (degrees)
10 38 10.76 (4.87) 7.65 (7.95) 5.71 (2.60)
11 56 10.66 (7.11) 8.87 (8.03) 6.11 (2.59)
12 44 10.88 (6.43) 6.18 (5.98) 5.34 (1.76)
13 37 10.45 (9.96) 8.77 (7.42) 6.09 (2.30)
14 27 12.66 (5.75) 7.84 (5.98) 5.91 (2.39)
15 28 10.75 (4.48) 9.20 (7.94) 6.10 (2.19)
16 41 11.99 (3.90) 8.34 (8.17) 5.66 (2.26)
Overall 271 11.05 (5.88) 8.15 (7.40) 5.80 (2.32)
*calculated from Carr et al 1991 [5]

297
Information regarding all other measures has been described in chapters 3 and 4 with
supporting information provided in appendices 4 to 18.
7.2.3 Statistical analysis
Data analysis was performed using the IBM SPSS Statistics (version 22) software package.
Categorical variables were summarised into frequency tables. Descriptive statistics (including
95% confidence intervals where appropriate) were calculated for all continuous variables with
relevant histograms and boxplots.
To evaluate possible associations between spinal deformity and measures of body schema,
scatter plots were drawn with regression lines and correlation coefficients calculated using
parametric or non-parametric methods (Pearson’s r and Spearman’s rho respectively)
depending on whether data was normally distributed.
Point-biserial correlations were used to evaluate relationships between continuous and
categorical data. Bootstrapping was used when the continuous variable was not normally
distributed.

298
8 Research question 2 - correlational analysis (results)
The previous chapter outlined the methodology to be used for the cross-sectional correlation
study conducted as part of this thesis. This chapter presents the results of the study, initially
focussing on the relationship between x-ray and measures of body schema. It then reviews the
relationship between measures of spinal deformity as evaluated by surface topography (ISIS-2)
and body schema. As this is an exploratory study, relationships between spinal deformity and
other measures are also evaluated. A brief summary of the findings, along with a discussion of
the limitations, completes the chapter.
8.1 Participants
Of the 58 participants with AIS recruited for the case control study, x-ray results were available
for 57 participants (98.3%). X-ray information was not available for 1 participant as they had
undergone radiological examination at another (non-study) centre prior to being included in
the study (Table 8.1).
Results of surface topography measures were available for 30 participants (51.7%). Despite all
4 centres having access to ISIS-2 scanners, surface topography was not always collected as part
of routine investigations at each site. Problems with the ISIS-2 scanner not always being
available for use in some centres also limited the number of participants who underwent this
form of imaging.
Table 8.1 X-ray and ISIS-2 information available by site
Site Recruited,
n X-ray, n (%)
ISIS-2, n (%)
Royal Orthopaedic Hospital, Birmingham 20 19 (95) 6 (30)
Nuffield Orthopaedic Centre, Oxford 20 20 (100) 7 (35)
Frenchay Hospital, Bristol 11 11 (100) 10 (91)
James Cook University Hospital, Middlesbrough 7 7 (100) 7 (100)
total 58 57 (98) 30 (52)

299
8.2 Imaging information
Summary information of x-ray results was presented in chapter 6 (section 6.2.3). Equivalent
information for ISIS-2 measures is described in Table 8.2 and Figure 8.1 to Figure 8.5. For a full
explanation of ISIS-2 measures, please refer to Appendix 20.
Table 8.2 ISIS-2 measures - descriptive statistics
Variable n mean SD SE 95%
CI median min max IQR
missing n (%)
Lateral asymmetry (o)
30 24.37 9.16 1.67 20.95, 27.79
22.5 9.0 44.0 17.5,
34 28
(48.3)
Volumetric asymmetry
30 17.27 10.8 1.97 13.24, 21.30
13.0 5.0 53.0 10,
21.3 28
(48.3)
Coronal balance (mm)
30 14.63 9.72 1.77 11.00, 18.26
13.0 0 37.0 7,
24.3 28
(48.3)
Transverse rotation (o)
30 2.67 2.07 0.38 1.89, 3.44
2.0 0 9.0 1, 3 28
(48.3)
Flexion angle (o)
30 1.93 1.72 0.31 1.29, 2.58
1.0 0 7.0 1,3 28
(48.3)
Figure 8.1 ISIS-2 Lateral asymmetry - histogram & boxplot

300
Figure 8.2 ISIS-2 Volumetric asymmetry - histogram & boxplot
Figure 8.3 ISIS-2 Coronal balance (absolute values) - histograms & boxplots
Figure 8.4 ISIS-2 Transverse rotation (absolute values) - histogram & boxplot

301
Figure 8.5 ISIS-2 Flexion angle (absolute value) - histogram & boxplot
8.2.1 X-ray v ISIS-2
Scatterplots of x-ray versus ISIS-2 measures with regression lines are presented in Figure 8.6
and Figure 8.7. The plots suggested a linear relationship between Cobb angle and both lateral
asymmetry and volumetric asymmetry (Figure 8.6, statistically significant correlations
displayed). Lateral asymmetry is the ISIS-equivalent of the Cobb angle (see Appendix 20).
A similar relationship appeared to exist between coronal balance (as defined by x-ray) and the
equivalent ISIS-2 measure of coronal balance (Figure 8.7). There did not appear to be any other
observable relationships between x-ray and ISIS-2 variables.
These observations were confirmed by correlation coefficients that were calculated between x-
ray and ISIS-2 measures (Table 8.3). Strong positive correlations were found between Cobb
angle and lateral asymmetry (r=.710, 95% CI .452-.873, p<0.001) with the Cobb angle sharing
50.4% of the variability with lateral asymmetry (r2=0.504).
Moderate positive correlations between Cobb angle and volumetric asymmetry (r=.560, 95% CI
.250-.769, p=0.001), as well as between coronal balance variables (r=.479, 95% CI .162-.727,
p=0.007) were also reported. The percentage of shared variability was 31.4 and 24.1%
respectively (r2=0.314 and 0.241).
No other statistically significant correlations were reported between x-ray and ISIS-2 variables.

302
Table 8.3 X-ray v ISIS-2 variables - correlations
ISIS-2 variables
X-ray variables Lateral
asymmetry Volumetric asymmetry
Transverse rotation
Coronal balance
Flexion angle
Cobb angle (o)
Pearson Correlation
.710** .560**¥ .140¥ .041 .044¥
p-value <0.001 .001 .462 .830 .816
BCa 95% Confidence Intervals§
.452 .250 -.179 -.326 -.359
.873 .769 .465 .371 .424
n 30 30 30 30 30
Coronal balance (mm)
Pearson Correlation
-.182 -.118¥ -.306¥ .479** -.127¥
p-value .335 .534 .100 .007 .505
BCa 95% Confidence Intervals§
-.528 -.470 -.589 .162 -.507
.191 .237 .010 .727 .283
n 30 30 30 30 30
Sagittal balance (mm)
Spearman’s rho
-.142 -.119 .078 .110 .232
p-value .508 .580 .716 .610 .276
BCa 95% Confidence Intervals§
-.469 -.513 -.427 -.366 -.184
.213 .247 .577 .487 .584
n 24 24 24 24 24
* Correlation is significant at the 0.05 level (2-tailed); ** Correlation is significant at the 0.01 level (2-tailed); § bootstrap (1000 samples) Bias Corrected accelerated 95% CIs; ¥ Spearman's rho

303
Figure 8.6 X-ray Cobb angle v ISIS-2 variables - scatterplots
Figure 8.7 X-ray Coronal balance v ISIS-2 variables - scatterplots
304
8.3 Spinal deformity v body schema measures
Spinal deformity was evaluated by both x-ray and, in a subset of participants, by surface
topography using ISIS-2.
8.3.1 X-ray v body schema measures
No clear linear relationships were observed from the scatterplots between x-ray variables and
measures of body schema. This was confirmed by the lack of statistically significant
correlations between these sets of variables (Table 8.4). The relationships that came closest to
being statistically significant were between Cobb angle and TPDT, proprioception, and
laterality (accuracy and reaction time) for the back. However, even these displayed only weak
correlations (largest r=-.266) and the wide 95% CIs highlight the large variability. No changes in
the results were seen when partial correlations were performed to control for age, disease
duration, puberty status and Cobb angle.
8.3.2 ISIS-2 v body schema measures
Review of the scatterplots suggested that, similar to the x-ray results, the majority of ISIS-2
variables did not appear to share a relationship with measures of body schema..
However, statistically significant correlations were subsequently calculated between some of
these variables (Table 8.5). A moderate positive correlation was calculated for coronal balance
and line bisection error (r=.474, 95% CI .069, .748, p=0.008) (Figure 8.8). The percentage of
shared variability between these variables was 22.5% (r2= 0.225).
A weak negative correlation was observed between coronal balance and laterality accuracy of
the hands (r= -.374, 95% CI -.697, .004, p=0.042) (Figure 8.8). The shared variability of 14%
highlights the weakness of this relationship (r2=0.14). A moderate positive correlation was also
reported between transverse rotation angle and line bisection error (r=.422, 95% CI .081, .707,
p=0.020) with a shared variability of 17.8% (r2=0.178) (Figure 8.9). All of these correlations
exhibited very wide confidence intervals.
The direction of the correlations suggest that greater spinal deformity (i.e. increasing coronal
imbalance) is associated with worsening of these measures of body schema. These results
305
were consistent when partial correlations were performed to control for age, disease duration,
puberty status and Cobb angle.

306
Table 8.4 X-ray v measures of Body Schema - correlations
TPDT Localisation Proprioception Line Bisection Laterality Standing balance
X-ray variable
mm n correct absolute error
(%) absolute error
(%) Accuracy Hands (%)
Reaction time Hands (msec)
Accuracy back (%)
Reaction time Back (msec)
seconds
Cobb angle (o)
Pearson Correlation
-.266 -.183 -.243 0.172¥ .092 -.138 .244¥ -.236¥ .178
p-value .070 .176 .068 0.201 .496 .314 .067 .077 .189
BCa 95% Confidence Intervals§
-.540 -.388 -.475 -0.091 -.199 -.359 -.066 -.476 -.106
.025 .036 .030 0.414 .350 .089 .502 .052 .383
n 47 56 57 57 57 55 57 57 56
Coronal balance (mm)
Pearson Correlation
-.045 .081 .067 .041¥ -.237 -.009 -.022¥ .056¥ .148
p-value .768 .559 .627 .764 .081 .951 .872 .683 .286
BCa 95% Confidence Intervals§
-.389 -.181 -.247 -.217 -.426 -.273 -.280 -.194 -.126
.368 .339 .356 .320 -.031 .287 .257 .297 .410
n 45 54 55 55 55 53 55 55 54
Sagittal balance (mm)
Spearman’s rho
.214 -.177 .080 .181 -.128 -.061 -.085 -.172 -.005
p-value .202 .262 .614 .252 .419 .701 .591 .276 .975
BCa 95% Confidence Intervals§
-.157 -.518 -.253 -.131 -.446 -.382 -.367 -.476 -.344
.536 .205 .415 .471 .235 .285 .198 .172 .350
n 37 42 42 42 42 42 42 42 41 § bootstrap (1000 samples) Bias Corrected accelerated 95% CIs; ¥ Spearman's rho

307
Table 8.5 ISIS-2 variables v measures of Body Schema - correlations
TPDT Localisation Proprioception Line Bisection Laterality Standing balance
ISIS-2 variable
mm n correct absolute error
(%) absolute error
(%) Accuracy Hands (%)
Reaction time Hands (msec)
Accuracy back (%)
Reaction time Back
(msec) seconds
Lateral asymmetry (o)
Pearson Correlation
-.318 .009 -.089 -.065¥ .254 -.133 .332¥ -.164¥ .158
p-value .122 .961 .640 .733 .175 .492 .073 .386 .413
BCa 95% Confidence Intervals§
-.581 -.334 -.440 -.481 -.115 -.432 -.099 -.510 -.176
-.005 .309 .346 .345 .557 .212 .694 .197 .478
n 25 30 30 30 30 29 30 30 29
Volumetric asymmetry
Spearman's rho
-.197 -.242 -.045 .034 .151 -.064 .212 .025 -.036
p-value .345 .197 .815 .858 .427 .741 .261 .897 .854
BCa 95% Confidence Intervals§
-.571 -.549 -.405 -.367 -.259 -.425 -.209 -.341 -.388
.204 .095 .324 .424 .503 .341 .592 .383 .328
n 25 30 30 30 30 29 30 30 29
Coronal balance (mm)
Pearson Correlation
.256 .133 .282 .474**¥ -.374* -.075 -.320¥ .096¥ .115¥
p-value .216 .484 .131 .008 .042 .694 .085 .615 .553
BCa 95% Confidence Intervals§
-.015 -.177 -.048 .069 -.697 -.344 -.606 -.355 -.307
.516 .415 .606 .748 .004 .360 .012 .496 .512
n 25 30 30 30 30 30 30 30 30
* Correlation is significant at the 0.05 level (2-tailed); ** Correlation is significant at the 0.01 level (2-tailed); § bootstrap (1000 samples) Bias Corrected accelerated 95% CIs; ¥ Spearman's rho

308
Table 8.5 continued
TPDT Localisation Proprioception Line Bisection Laterality Standing balance
ISIS-2 variable
mm n correct absolute error
(%) absolute error
(%) Accuracy Hands (%)
Reaction time Hands (msec)
Accuracy back (%)
Reaction time Back
(msec) seconds
Transverse rotation (o)
Spearman's rho
.084 .043 .099 .422* .179 .024 -.174 -.024 -.276
p-value .689 .821 .604 .020 .343 .903 .358 .899 .148
BCa 95% Confidence Intervals§
-.405 -.346 -.278 .081 -.205 -.383 -.491 -.428 -.578
.515 .401 .481 .707 .480 .399 .150 .369 .053
n 25 30 30 30 30 29 30 30 29
Flexion angle (o)
Spearman's rho
-.285 -.288 -.263 .226 .006 -.081 -.160 .203 -.234
p-value .168 .123 .159 .230 .974 .678 .398 .282 .223
BCa 95% Confidence Intervals§
-.653 -.633 -.595 -.133 -.288 -.450 -.478 -.152 -.608
.168 .120 .128 .553 .333 .309 .233 .542 .219
n 25 30 30 30 30 29 30 30 29
* Correlation is significant at the 0.05 level (2-tailed); § bootstrap (1000 samples) Bias Corrected accelerated 95% CIs

309
Figure 8.8 ISIS-2 Coronal balance v body schema measures - scatterplots
Figure 8.9 ISIS-2 Transverse rotation v body schema measures - scatterplots

310
8.4 Spinal deformity v other measures
Although not the main focus of the study, and this being part of an exploratory series of
research, possible associations between spinal deformity and other self-report measures were
also considered. These included measures of perception of trunk appearance/symmetry,
HRQoL, general function and kinaesthetic/proprioceptive awareness that were also collected
as part of the case control study (see section 5.2.4). Information regarding calculated
correlation coefficients is presented along with scatterplots that displayed statistically
significant relationships.
8.4.1 X-ray v other measures
Scatterplots that suggested possible relationships between x-ray variables and other self-
report measures were plotted. The plots indicate a linear relationship between Cobb angle and
the SAQ appearance scale and SAQ total score.
Calculation of correlation coefficients revealed a weak positive correlation between Cobb
angle and the SAQ appearance scale which was statistically significant (r=.372, 95% CI .161,
.541, p=0.005) (Table 8.6). Cobb angle shared 13.8% of variability with the SAQ appearance
scale (r2=0.138).
A similar association was also found between Cobb angle and the SAQ total score (r=.331, 95%
CI .062, .539, p=0.015, r2=0.110), a result driven by the appearance scale which makes the
greatest contribution to the total score. This suggests that as Cobb angle increases, the
perception of trunk appearance and symmetry worsen. These results were consistent when
partial correlations were performed to control for age, disease duration and puberty status.
No other observable or statistically significant correlations were noted between x-ray variables
and other self-report measures. Point bi-serial correlations between x-ray variables and EQ5D
domains did not reveal any statistically significant correlations.

311
Table 8.6 X-ray v other measures - correlations
SAQ SRS-22r KPAQ
X-ray variable appearance expectation total function pain self-image mental health
total total
Cobb angle (o)
Pearson Correlation
.372** .154 .331* .099¥ .106¥ .036 -.020¥ .058 .257
p-value .005 .262 .015 .468 .437 .791 .883 .670 .059
BCa 95% Confidence Intervals§
.161 -.119 .062 -.170 -.176 -.200 -.265 -.227 .009
.541 .417 .539 .359 .368 .264 .229 .318 .504
n 55 55 54 56 56 56 56 56 55
Coronal balance (mm)
Pearson Correlation
.124 .206 .184 -.094¥ -.117¥ -.142 -.210¥ -.171 .094
p-value .375 .139 .192 .499 .401 .305 .127 .215 .503
BCa 95% Confidence Intervals§
-.237 -.078 -.142 -.339 -.409 -.447 -.469 -.459 -.182
.469 .434 .483 .188 .161 .205 .097 .132 .354
n 53 53 52 54 54 54 54 54 53
Sagittal balance (mm)
Spearman’s rho
-.009 -.121 -.071 -.149 .107 -.090 .036 -.055 .023
p-value .957 .457 .669 .352 .507 .574 .825 .733 .888
BCa 95% Confidence Intervals§
-.344 -.480 -.416 -.491 -.211 -.374 -.266 -.359 -.330
.300 .248 .281 .183 .427 .174 .354 .250 .381
n 40 40 39 41 41 41 41 41 40
* Correlation is significant at the 0.05 level (2-tailed); ** Correlation is significant at the 0.01 level (2-tailed); § bootstrap (1000 samples) Bias Corrected accelerated 95% CIs; ¥ Spearman's rho

312
Table 8.6 continued
PODCI EQ5D
X-ray variable Upper extremity
& PhysFunc Transfers
Sports PhysFunc
Global function
Pain Happiness VAS
Cobb angle (o)
Pearson Correlation
.066¥ -.119¥ .217¥ .095¥ -.005 -.050¥ -.148¥
p-value .627 .382 .108 .486 .973 .717 .278
BCa 95% Confidence Intervals§
-.168 -.382 -.028 -.164 -.255 -.335 -.402
.281 .128 .454 .352 .229 .257 .135
n 56 56 56 56 56 56 56
Coronal balance (mm)
Pearson Correlation
-.125¥ -.133¥ .053¥ -.071¥ -.077 -.204¥ -.133¥
p-value .367 .338 .702 .608 .579 .140 .338
BCa 95% Confidence Intervals§
-.414 -.418 -.213 -.383 -.337 -.468 -.403
.160 .170 .335 .248 .198 .080 .162
n 54 54 54 54 54 54 54
Sagittal balance (mm)
Spearman’s rho -.060 -.005 -.062 .053 .039 .046 -.088
p-value .712 .977 .700 .743 .808 .775 .584
BCa 95% Confidence Intervals§
-.367 -.323 -.391 -.306 -.256 -.295 -.420
.266 .326 .299 .449 .311 .365 .253
n 41 41 41 41 41 41 41 § bootstrap (1000 samples) Bias Corrected accelerated 95% CIs; ¥ Spearman's rho

313
8.4.2 ISIS-2 v other measures
Calculation of correlation coefficients suggested statistically significant relationships between
some ISIS-2 variables (lateral and volumetric asymmetry) with various SRS-22r and PODCI
subscales (Table 8.7)
However, visualisation of the scatterplots revealed that these were driven in large part by
ceiling effects in some subscales of the SRS-22r (Table 8.10) and PODCI (Figure 8.11).
Maximum scores in these scales were found across the range of lateral and volumetric
asymmetry angles. The direction of the implied relationships is also counterintuitive, with
better self-report scores associated with greater spinal deformity. Therefore, there does not
appear to be a genuine relationship between ISIS-2 and these measures despite the results of
the statistical analysis.
No other observable or statistically significant relationships were found. Point bi-serial
correlations between ISIS-2 variables and EQ5D domains did not reveal any statistically
significant correlations.
Figure 8.10 ISIS-2 v SRS-22r - scatter plots

314
Figure 8.11 ISIS-2 v PODCI - scatter plots

315
Table 8.7 ISIS-2 v other measures - correlations
SAQ SRS-22r KPAQ
ISIS-2 variable appearance expectation total function pain self-image mental health
total total
Lateral asymmetry (o)
Pearson Correlation
.193 -.031 .127 .452*¥ .305¥ .226 .034¥ .262 -.019
p-value .316 .872 .510 .012 .101 .231 .857 .161 .922
BCa 95% Confidence Intervals§
-.201 -.380 -.256 .104 -.012 -.167 -.286 -.108 -.344
.595 .361 .459 .747 .593 .559 .367 .575 .302
n 29 30 29 30 30 30 30 30 30
Volumetric asymmetry
Spearman's rho -.025 .028 .000 .398* .540** .287 .113 .354 .013
p-value .897 .882 .998 .029 .002 .124 .553 .055 .944
BCa 95% Confidence Intervals§
-.374 -.388 -.352 .035 .301 -.063 -.190 .051 -.368
.314 .415 .358 .700 .703 .592 .390 .601 .398
n 29 30 29 30 30 30 30 30 30
Coronal balance (mm)
Pearson correlation
.001 -.102 -.076 -.154¥ .043¥ .074 .056¥ .055 .256
p-value .995 .592 .694 .416 .822 .699 .770 .774 .172
BCa 95% Confidence Intervals§
-.406 -.483 -.502 -.475 -.400 -.425 -.363 -.384 -.146
.533 .390 .461 .155 .476 .537 .455 .409 .616
n 29 30 29 30 30 30 30 30 30
* Correlation is significant at the 0.05 level (2-tailed); ** Correlation is significant at the 0.01 level (2-tailed); § bootstrap (1000 samples) Bias Corrected accelerated 95% CIs; ¥ Spearman's rho

316
Table 8.7 continued
PODCI EQ5D
ISIS-2 variable Upper extremity
& PhysFunc Transfers
Sports PhysFunc
Global function
Pain Happiness VAS
Lateral asymmetry (o)
Pearson Correlation
.283¥ .159¥ .315¥ .311¥ .200 .095¥ -.003¥
p-value .129 .403 .090 .094 .289 .617 .989
BCa 95% Confidence Intervals§
-.079 -.244 .004 -.080 -.197 -.248 -.363
.614 .541 .575 .701 .560 .417 .326
n 30 30 30 30 30 30 30
Volumetric asymmetry
Spearman's rho .365* .108 .398* .447* .438* .103 -.075
p-value .047 .570 .030 .013 .015 .589 .694
BCa 95% Confidence Intervals§
.031 -.226 .057 .142 .089 -.220 -.425
.639 .395 .668 .660 .704 .425 .311
n 30 30 30 30 30 30 30
Coronal balance (mm)
Pearson’s correlation
-.048¥ -.029¥ -.024¥ .033¥ .002 .012¥ .016¥
p-value .802 .877 .900 .861 .990 .950 .934
BCa 95% Confidence Intervals§
-.391 -.323 -.396 -.364 -.421 -.402 -.365
.341 .278 .374 .395 .344 .431 .390
n 30 30 30 30 30 30 30
* Correlation is significant at the 0.05 level (2-tailed); § bootstrap (1000 samples) Bias Corrected accelerated 95% CIs; ¥ Spearman's rho

317
Table 8.7 continued
SAQ SRS-22r KPAQ
ISIS-2 variable appearance expectation total function pain self-image mental health
total total
Transverse rotation (o)
Spearman's rho
-.009 .015 -.025 .134 .140 .145 .280 .189 .331
p-value .962 .939 .899 .481 .461 .446 .135 .318 .074
BCa 95% Confidence Intervals§
-.337 -.401 -.406 -.287 -.241 -.233 -.073 -.206 -.053
.318 .440 .315 .528 .521 .517 .580 .537 .633
n 29 30 29 30 30 30 30 30 30
Flexion angle (o)
Spearman's rho
.064 .039 .061 .223 .092 .145 .178 .196 .051
p-value .743 .837 .752 .236 .630 .445 .346 .299 .789
BCa 95% Confidence Intervals§
-.301 -.379 -.361 -.201 -.233 -.235 -.163 -.170 -.287
.388 .468 .461 .555 .400 .478 .505 .515 .364
n 29 30 29 30 30 30 30 30 30
§ bootstrap (1000 samples) Bias Corrected accelerated 95% CIs

318
Table 8.7 continued
PODCI EQ5D
ISIS-2 variable Upper extremity
& PhysFunc Transfers Sports PhysFunc
Global function
Pain Happiness VAS
Transverse rotation (o)
Spearman's rho .254 .270 .084 .182 .101 .072 .024
p-value .175 .149 .660 .336 .594 .705 .902
BCa 95% Confidence Intervals§
-.117 -.104 -.279 -.202 -.256 -.290 -.337
.560 .622 .472 .517 .433 .405 .415
n 30 30 30 30 30 30 30
Flexion angle (o)
Spearman's rho .107 .039 .179 .006 -.066 -.042 -.147
p-value .572 .838 .345 .975 .729 .824 .437
BCa 95% Confidence Intervals§
-.276 -.343 -.193 -.374 -.456 -.441 -.525
.473 .386 .496 .388 .335 .377 .265
n 30 30 30 30 30 30 30
§ bootstrap (1000 samples) Bias Corrected accelerated 95% CIs

319
8.4.3 Perceived spinal deformity
The results of the case control study (chapter 6) suggested that there were differences
between people with AIS and non-scoliotic controls with regard to perceived spinal deformity
(SAQ) and HRQoL, particularly pain and self-image and, to a lesser degree, function. However,
the correlational analyses conducted in the previous sections (8.4.1 and 8.4.2) did not reveal
any association between the actual magnitude of spinal deformity and these parameters.
Therefore, an exploratory analysis was undertaken to investigate whether there was any
relationship between perceived spinal deformity (as measured by SAQ) and HRQoL. The results
are presented in Table 8.8 to Table 8.10 with relevant scatter plots (Figure 8.12 and Figure
8.13).
8.4.3.1 Pain
Calculation of correlation coefficients revealed a weak negative correlation between the SAQ
appearance scale and the PODCI pain scale which was statistically significant (r=-.365; 95% CI -
.622, -.089, p=0.016, r2=0.133). A point bi-serial correlation analysis also revealed a statistically
significant moderate correlation between the SAQ appearance scale and the EQ5D pain
domain (r=.438, 95% CI .178, .640, p=0.03, r2=0.192). No statistically significant correlation was
observed with the SRS-22 r pain scale.
8.4.3.2 Self-image & perceived health
Statistically significant moderate negative correlations were observed between SAQ
appearance and the SRS-22r self-image scales (r=-.619, 95% CI -.771, -.391, p<0.001, r2=.383).
Similar results were also reported for the PODCI happiness with physical condition scale (r=-
.580, 95% CI -.775, -.310, p<0.001, r2=.336) and the EQ5D health state VAS (r=-.466, 95% CI -
.696, -.188, p=0.002, r2=.217).
8.4.3.3 Function
Weak negative correlations were observed between SAQ appearance and various function
scales of the PODCI (Upper extremity & Physical function, Transfers & mobility, Global
function) and these were statistically significant (Table 8.9). However, review of the
scatterplots revealed significant ceiling effects with the PODCI upper extremity and transfer
scales (Figure 8.13).

320
Point biserial analyses revealed statistically significant weak to moderate correlations between
EQ5D usual activity and mobility domains respectively (Table 8.10).
No statistically significant correlations were calculated between SAQ and measures of body
schema.
Table 8.8 Correlations between SAQ scales and SRS-22r scales
SAQ
appearance
SAQ
expectations
SAQ total
score
-.142 -.182 -.219
.363 .244 .157
43 43 43
Lower -.453 -.489 -.532
Upper .157 .123 .089
-.232 -.134 -.259
.134 .392 .094
43 43 43
Lower -.516 -.468 -.573
Upper .098 .206 .066
-.619** -.469** -.623**
.000 .001 .000
43 43 43
Lower -.771 -.674 -.770
Upper -.391 -.214 -.416
-.237 -.283 -.352*
.126 .065 .021
43 43 43
Lower -.533 -.553 -.590
Upper .074 -.007 -.098
-.388* -.280 -.383*
.010 .069 .011
43 43 43
Lower -.652 -.564 -.637
Upper -.078 .054 -.075
SRS22
function
SRS22
pain
SRS22 self
image
SRS22
mental
health
SRS22
total score
Sig. (2-tailed)
Spearmans rho
Sig. (2-tailed)
N
Spearman's rho
Sig. (2-tailed)
BCa 95%
Confidence Interval
BCa 95%
Confidence Interval
BCa 95%
Confidence Interval
BCa 95%
Confidence Interval
BCa 95%
Confidence Interval
**Correlation is significant at the 0.01 level (2-tailed); *Correlation is significant at the
0.05 level (2-tailed); bootstrap (1000 samples) Bias Corrected accelerated 95% CIs
N
Pearson Correlation
Sig. (2-tailed)
N
N
Pearson Correlation
Sig. (2-tailed)
N
Spearman's rho

321
Table 8.9 Correlations between SAQ scales and PODCI scales
SAQ
appearance
SAQ
expectations
SAQ total
score
-.424** -.379* -.483**
.005 .012 .001
43 43 43
Lower -.657 -.595 -.689
Upper -.093 -.098 -.203
-.353* -.185 -.322*
.020 .235 .035
43 43 43
Lower -.587 -.462 -.571
Upper -.094 .087 -.064
-.365* -.234 -.344*
.016 .131 .024
43 43 43
Lower -.622 -.517 -.595
Upper -.089 .059 -.064
-.183 -.163 -.232
.241 .295 .135
43 43 43
Lower -.458 -.465 -.532
Upper .097 .123 .069
-.378* -.282 -.409**
.013 .067 .006
43 43 43
Lower -.627 -.559 -.668
Upper -.088 .022 -.106
-.580** -.578** -.689**
.000 .000 .000
43 43 43
Lower -.775 -.769 -.829
Upper -.310 -.332 -.466
PODCI UE
&
PhysFunc
PODCI
Transfers
& Mobility
PODCI
Pain
Comfort
PODCI
Sports
PhysFunc
PODCI
Global
function
PODCI
Happiness
w/ physical
condition
N
Spearman's rho
Sig. (2-tailed)
N
Spearman's rho
Sig. (2-tailed)
BCa 95%
Confidence Interval
BCa 95%
Confidence Interval
N
Pearson Correlation
Sig. (2-tailed)
N
Spearman's rho
Sig. (2-tailed)
BCa 95%
Confidence Interval
BCa 95%
Confidence Interval
BCa 95%
Confidence Interval
**Correlation is significant at the 0.01 level (2-tailed); *Correlation is significant at the
0.05 level (2-tailed); bootstrap (1000 samples) Bias Corrected accelerated 95% CIs
N
Spearman's rho
Sig. (2-tailed)
N
Spearman's rho
Sig. (2-tailed)
BCa 95%
Confidence Interval

322
Table 8.10 Correlations between SAQ scales and EQ5D domains
SAQ
appearance
SAQ
expectations
SAQ total
score
.438** .213 .375*
.003 .170 .013
43 43 43
Lower .178 -.052 .115
Upper .640 .473 .612
.451** .313* .444**
.001 .020 .001
55 55 55
Lower .178 .023 .154
Upper .636 .521 .624
.299* .081 .231
.026 .558 .090
55 55 55
Lower .016 -.198 -.070
Upper .527 .347 .488
-.466** -.279 -.430**
.002 .070 .004
43 43 43
Lower -.696 -.552 -.656
Upper -.188 .017 -.148
EQ5D pain
or
discomfort
Pearson Correlation
Sig. (2-tailed)
N
BCa 95%
Confidence Interval
EQ5D
mobility
Pearson Correlation
Sig. (2-tailed)
N
BCa 95%
Confidence Interval
EQ5D
usual
activity
Pearson Correlation
Sig. (2-tailed)
N
BCa 95%
Confidence Interval
EQ5D
health state
VAS
Spearman's rho
Sig. (2-tailed)
N
BCa 95%
Confidence Interval
**Correlation is significant at the 0.01 level (2-tailed); *Correlation is significant at the 0.05
level (2-tailed); bootstrap (1000 samples) Bias Corrected accelerated 95% CIs

323
Figure 8.12 Scatterplots SAQ appearance v pain, self-image & happiness with physical condition
Figure 8.13 Scatterplots SAQ appearance v function measures

324
8.5 Summary
As described previously in section 6.2.3 and 6.5.1, the radiological characteristics of the study
participants indicate that they represent a typical AIS population of this age group (i.e. 10-17
years) with moderate levels of spinal deformity, although it also included people from across
the range of mild to severe scoliosis (mean Cobb angle = 34.0 degrees, SD 10.0, 95% CI 31.4,
36.7, range 14 to 50 degrees).
Unfortunately, there are no published reports of ISIS-2 measurements for non-surgical AIS
patients, making it difficult to place the ISIS-2 results from the study participants in context.
ISIS-2 imaging of surgical patients with AIS indicate far higher levels of pre-surgical spinal
deformity than recorded here [1], with values for lateral asymmetry ranging from 45 to 76
degrees. In contrast, reported normative values for the various ISIS-2 measures in non-scoliotic
adolescents [2] were approximately half that recorded by the participants in this study (see
section 6.2.2.2). These results confirm the radiological findings which characterise the study
cohort as suffering, on average, from moderate AIS.
Comparison of radiological and surface topography measures revealed statistically significant
correlations similar to previous studies. For example, Weisz et al [3] reported a correlation (r)
of 0.77 (p<0.0001) between lateral asymmetry and Cobb angle, which is very similar to the
results of this study (r=0.710, p<0.001). However, the weak relationship between coronal
balance measures from x-ray and ISIS-2 highlight the differences between actual bony changes
and their visible ‘surface’ manifestations. The lack of correlation between other x-ray and ISIS-
2 variables suggests that they are assessing different aspects of spinal deformity.
Overall, it appears that the results of spinal deformity measures used in this study from both
radiological and surface topography imaging are consistent with previous reports. They also
indicate that the study participants are representative of an AIS population that has not
reached severe levels of deformity where surgery would be considered.
8.5.1 Spinal deformity v body schema measures
A review of the results suggests that there is no meaningful relationship between the
magnitude of spinal deformity and measures of body schema such as tactile acuity, left/right

325
judgement, spatial perception, or proprioception. No significant correlations were reported
between either x-ray or the majority of ISIS-2 variables and body schema measures. Although
analyses resulted in statistically significant correlations between two ISIS-2 variables and two
body schema measures, the width of the confidence intervals and the small percentage of
shared variability (as defined by r2) call into question the strength of any relationship.
8.5.2 Spinal deformity v other measures
A summary of the results indicates little or no relationship between spinal deformity and other
self-report measures of HRQoL, function, or kinaesthetic/proprioceptive awareness. Although
a statistically significant correlation was reported between Cobb angle and perception of
trunk/spinal symmetry (SAQ appearance scale), the relationship was weak and exhibited wide
confidence intervals with limited shared variability between the two measures. However, it
does fit the expected pattern of greater perceived trunk asymmetry with higher levels of spinal
deformity.
Of interest is the apparent lack of any corresponding relationship between surface topography
measures and perception of trunk symmetry. If surface topography evaluates cosmetic aspects
which are visible to the patient and therefore, more likely to be of greater concern than
underlying non-visible bony changes, it would be expected that they would have a greater
influence on trunk perception, illustrated by larger correlations between these parameters.
The results of this study did not find such large correlations.
Other apparent relationships between ISIS-2 and HRQoL and function measures were
compromised by ceiling effects in the self-report instruments used. The high scores seen in
these measures also highlight the fact that moderate AIS does not seem to be associated with
any clinically significant problems with function or HRQoL.
8.5.3 Perceived spinal deformity
The results of comparisons between perceived spinal deformity and measures of HRQol and
function revealed statistically significant relationships. Moderate to strong correlations were
observed between the SAQ appearance and SRS-22r self-image scales as well as the related
PODCI happiness with physical condition scale. This suggests that in people with AIS, perceived

326
spinal deformity is associated with overall self-image as well as happiness with their physical
condition.
Two out three of the pain measures displayed relationships with perceived spinal deformity.
Although these were generally weaker than for self-image, they indicate that increased
perceived spinal deformity is associated with increased pain.
The apparent relationship between perceived spinal deformity and function was compromised
by the ceiling effects evident in the scatterplots for two of the three PODCI scales with
statistically significant correlations. This effect was less pronounced in the PODCI global
function scale and it appears that higher perceived spinal deformity has some association with
lower global function scores.
8.5.4 Limitations
This study had a number of limitations that may have affected the results. Firstly, surface
topography was limited to just over half of the study participants which limited the sample size
to 30 participants. This is reflected in the wide 95% confidence intervals and other measures of
variability. A larger sample size would reduce the level of variability and therefore strengthen
the confidence in the results of the comparisons with ISIS-2 imaging measures or possibly lead
to a change in the results.
Some surface topography measures are also prone to artefacts introduced by stance, breathing,
posture and sway. These issues were of particular relevance in the first iteration of the ISIS scanner
and were resolved to some extent with the development of ISIS-2, which uses a standardised set-
up and much faster recording speeds to limit these effects [3-6]. Surface topography measures in
general have also been reported to be less accurate for patients who are extremely obese or
have heavy musculature [6] although the BMI results of the study participants did not indicate
that this was a major problem with this cohort.
Another possible limitation relates to the timing of the imaging studies with regard to when
data from other measures was collected. Study testing was timed to take place when
participants were scheduled to have their routine orthopaedic consultant visits. Generally,
they would also have some form of imaging conducted at the same time. However, on a
number of occasions, and for a variety of different reasons, imaging did not occur at the

327
scheduled visit, and therefore information was collected from the imaging studies that were
conducted as close to the data collection session as possible. In other cases, participants could
not attend their routine orthopaedic review (with imaging) and the study data collection
session on the same day, again resulting in a time gap between imaging and data collection of
other study measures. However, in the main, the differences in time between imaging and
data collection for the study were small and it is unlikely that any significant differences would
occur over such a short period of time.
Finally, some of the measures (particularly self-report instruments) displayed clear ceiling
effects with large proportions of participants recording maximum or near-maximum scores.
This limits the ability to evaluate the extent of any relationships between variables and may
hide actual associations between spinal deformity and the underlying domains the relevant
instruments seek to measure. Although they did not appear to be appropriate for the group of
participants involved in this study, it is uncertain whether use in patients with greater severity
of spinal deformity would reveal any underlying relationships.
8.5.5 Conclusion
The objective of this study was to ascertain whether a relationship exists between mechanisms
that are thought to underpin body schema and measures of spinal deformity in adolescents
with AIS. The results indicate that no such relationship exists. They also suggest that, at least
amongst people with moderate AIS where surgery is not being considered, increasing
magnitudes of spinal deformity are not associated with significant increases in pain or
reductions in function, self-image or other aspects of HRQoL. However, the perception of
spinal deformity does appear to be related at least to some extent.
With regard to testing in people with AIS, the ceiling effects seen with some measures indicate
that care should be taken when selecting appropriate measurement tools and that possibly,
these may need to be tailored to differing levels of spinal deformity in AIS.

328
9 Research question 3 - longitudinal analysis (methods)
This chapter describes the methodology used in the longitudinal analyses conducted as part of
this thesis. A brief overview of the research question the study is addressing is provided
initially. The rest of this chapter then focuses specifically on the methodology with the results
described in chapter 9.
9.1 Overview
9.1.1 Research question
The research questions that this thesis is seeking to answer are listed below (Table 9.1). The
longitudinal analyses are concerned with answering the last of these questions.
Table 9.1 Research question - longitudinal study
Research questions
1 do adolescents with AIS (cases) differ from non-scoliotic adolescents (controls) with regard to mechanisms that are thought to underpin body schema?
2 in adolescents with AIS, is there any relationship between the mechanisms thought to underpin body schema and the magnitude of spinal deformity?
3 is there any relationship between changes in body schema and progression of the spinal deformity in AIS over time?
9.1.2 Hypothesis tested
The hypothesis derived from the above question is that:
H1: changes in measures of spinal deformity over time are associated with changes in
measures of body schema.
The null hypothesis (Ho) is that in adolescents with AIS, changes over time in spinal deformity
are not associated with changes in the underlying mechanisms of body schema.

329
9.2 Methods - longitudinal study
9.2.1 Study design
To evaluate the study hypothesis, a longitudinal study was conducted on adolescents with AIS.
Data was obtained from participants with AIS who participated in the initial case control study
described in chapters 4 and 5. As well as the baseline data that was used for the cross-
sectional case control and correlational studies, information was also collected at 6 and 12
months to assess changes over time.
As previously discussed, the participants with AIS that took part in the studies that make up
this thesis were recruited as part of a NIHR-funded feasibility study [1]. The feasibility study
involved a pilot randomised control trial (RCT) where participants were randomised on a 1:1
basis into either an exercise intervention arm or an advice (control) arm. Follow-up was
performed at 6 months only. Participants in the experimental intervention were asked to
perform a home exercise programme for 6 months supplemented by 6 to 9 session with a
physiotherapist who monitored, modified and progressed the programme as needed as well as
providing education and advice regarding AIS. The focus of the exercises was to improve the
symmetry and posture of the trunk and spine. The control group received the advice and
education only over 1 to 2 sessions with the physiotherapist. Further details are provided in
Williams et al [1].
The objectives of the feasibility study were primarily to determine if a larger RCT could be
performed by assessing recruitment rate and intervention acceptability. The sample size was
not sufficient to determine the effectiveness of the interventions involved. Similarly, this
longitudinal analysis did not attempt to determine the benefits of the interventions and has
pooled the data from both arms for analysis. Where appropriate, treatment allocation was
controlled for when conducting the statistical analyses.
The setting, methods of participant recruitment (including inclusion and exclusion criteria),
potential biases and ethics have been described previously in sections 5.2.2, 5.2.3, 4.2.8 and
5.2.10 respectively.

330
9.2.2 Variables
Information collected from participants with AIS is described in sections 5.2.4 to 5.2.7 and
listed in Tables 5.2 and 5.3. These include all the self-report and physical measures from which
data was obtained for this longitudinal analysis. Information regarding radiological and surface
topography imaging are outlined in sections 7.2. Detailed descriptions of all measures are
provided in appendices 5 to 20.
9.2.3 Statistical analysis
Data analysis was performed using the IBM SPSS Statistics (version 22) software package.
Categorical variables were summarised into frequency tables and Cochran’s Q test conducted
to determine differences in proportions between time points.
Descriptive statistics (including 95% confidence intervals where appropriate) were calculated
for all continuous variables for each time point with relevant plots. A separate set of
descriptive statistics for each time-point were also produced which included only those
participants that completed the 12 month follow-up (12 mth completers).
Initially, a mixed repeated-measures analysis of variance with two predictor variables (within
subject = time-point, 3 levels; between subject = trial arm, 2 levels) was used to assess
statistical significance of the difference between means at each time-point. Homogeneity of
variance was assessed using Levene’s test. Normality of standardised residuals at all three
time-points was also evaluated. Where the assumption of sphericity was violated,
Greenhouse-Geisser or Huynh-Feldt estimates were used to adjust degrees of freedom.
Bonferroni correction was used to adjust for multiple comparisons. One way non-parametric
models (Friedman’s ANOVA) were used for evaluation of independent variables where the
assumptions of homogeneity and normality were violated and could not be corrected via
transformations or elimination of outliers. Results were interpreted with regard to likely
clinical significance.
Scatter plots of spinal deformity and measures of body schema were drawn (with regression
lines) and correlation coefficients calculated for each time-point using parametric or non-
parametric methods (Pearson’s r and Spearman’s rho respectively) depending on whether data
was normally distributed. Point-biserial correlations were used to evaluate relationships

331
between continuous and categorical data. Bootstrapping was used when the continuous
variable was not normally distributed.
The case control study conducted as part of this thesis included a number of within-group
analyses of differences between sides (left v right, affected v unaffected side). Any differences
recorded were generally small and either not statistically or clinically significant. Therefore,
these side analyses were not conducted as part of this longitudinal study.

332
10 Research question 3 - longitudinal analysis (results)
The previous chapter outlined the methodology used for the longitudinal analyses conducted
as part of this thesis. This chapter presents the results, initially describing the participants from
whom data was collected at each time point and defining those who completed testing at the
last follow-up at 12 months. It then presents the results of the longitudinal analyses as well as
looking at relationships between spinal deformity and other measures at 6 and 12 months. A
brief summary of the findings, along with a discussion of the limitations, completes the
chapter.
10.1 Participants
10.1.1 Follow-up
The number of participants with AIS who completed assessments at each time point is listed by
recruitment site in Table 10.1.
Table 10.1 Follow-up by recruitment site
site baseline
n (%) 6 months
n (%) 12 months
n (%)
Royal Orthopaedic Hospital, Birmingham 20 (34.5) 12 (26.7) 10 (23.8)
Nuffield Orthopaedic Centre, Oxford 20 (34.5) 16 (35.6) 16 (38.1)
Frenchay Hospital, Bristol 11 (19) 11 (24.4) 11 (26.2)
James Cook University Hospital, M’brough 7 (12) 6 (13.3) 5 (11.9)
total 58 (100) 45 (100) 42 (100)
% of baseline 77.6% 72.4%
Overall, there was a 22.4% (13/58) and 27.6% (16/58) attrition rate at 6 and 12 months
respectively. Participants who didn’t complete follow-up were primarily from one site (ROH)
where only 60% (12/20) and 50% (10/20) of participants completed the 6 and 12 mth follow-
ups respectively. Taken together, follow-up rates at the other sites were 86.8% (33/38) at 6
months and 84.2% (32/38) at 12 months. The reason for this disparity is unclear.

333
The consort diagram in Figure 10.1 gives a breakdown of recruitment, trial allocation and
retention from inclusion into the study until final follow-up. It also details why participants
were lost to follow-up, with the majority of those who did not complete failing to respond to
requests to attend follow-up sessions (n=13). All but one participant who did not complete
follow-up at 6 months, also failed to complete testing at 12 months.
Figure 10.1 Consort diagram longitudinal study
At each time point, some data was either not collected or lost (Table 10.2). One questionnaire
was lost at baseline and a further 1 and 4 were missing at 6 and 12 months respectively, which
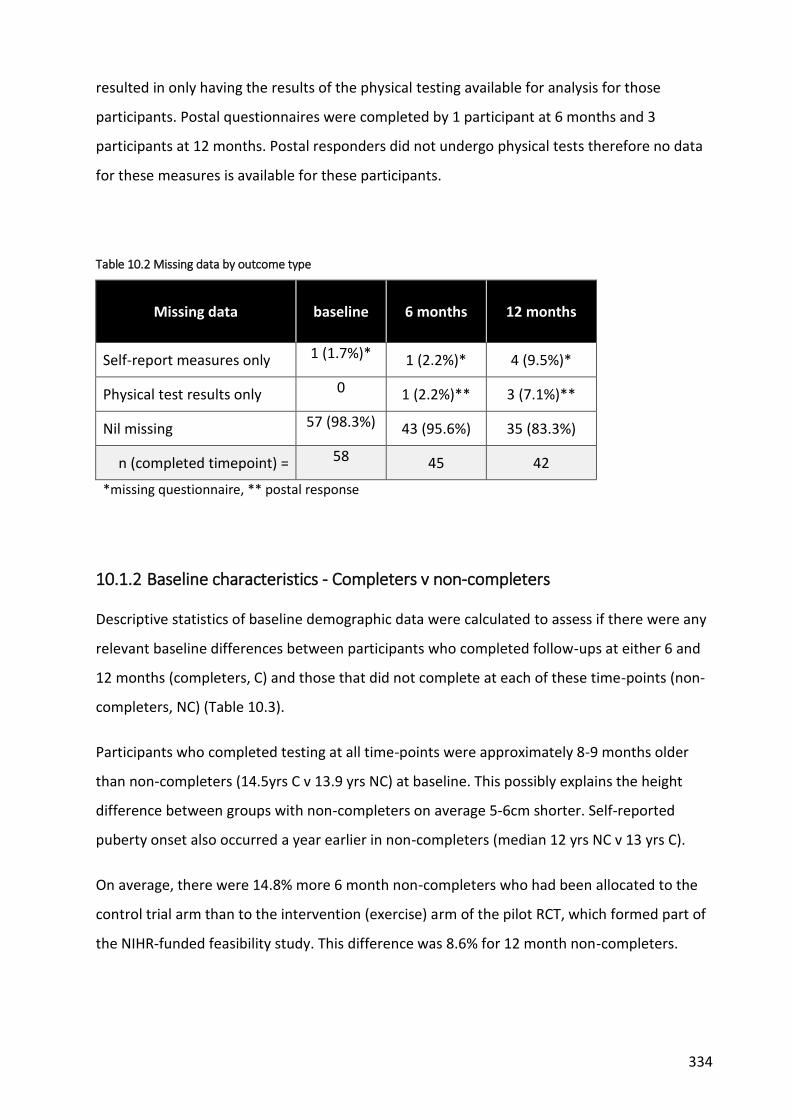
334
resulted in only having the results of the physical testing available for analysis for those
participants. Postal questionnaires were completed by 1 participant at 6 months and 3
participants at 12 months. Postal responders did not undergo physical tests therefore no data
for these measures is available for these participants.
Table 10.2 Missing data by outcome type
Missing data baseline 6 months 12 months
Self-report measures only 1 (1.7%)* 1 (2.2%)* 4 (9.5%)*
Physical test results only 0 1 (2.2%)** 3 (7.1%)**
Nil missing 57 (98.3%) 43 (95.6%) 35 (83.3%)
n (completed timepoint) = 58 45 42
*missing questionnaire, ** postal response
10.1.2 Baseline characteristics - Completers v non-completers
Descriptive statistics of baseline demographic data were calculated to assess if there were any
relevant baseline differences between participants who completed follow-ups at either 6 and
12 months (completers, C) and those that did not complete at each of these time-points (non-
completers, NC) (Table 10.3).
Participants who completed testing at all time-points were approximately 8-9 months older
than non-completers (14.5yrs C v 13.9 yrs NC) at baseline. This possibly explains the height
difference between groups with non-completers on average 5-6cm shorter. Self-reported
puberty onset also occurred a year earlier in non-completers (median 12 yrs NC v 13 yrs C).
On average, there were 14.8% more 6 month non-completers who had been allocated to the
control trial arm than to the intervention (exercise) arm of the pilot RCT, which formed part of
the NIHR-funded feasibility study. This difference was 8.6% for 12 month non-completers.

335
Table 10.3 Participant baseline demographic variables by responder type
All 6 mth
completer 6 mth non-completer
12 mth completer
12 mth non-completer
n (%) n (%) n (%) n (%) n (%)
Gender
Female 48 (82.8) 38 (84.4) 10 (76.9) 35 (83.3) 13 (81.3)
Male 10 (17.2) 7 (15.6) 3 (23.1) 7 (16.7) 3 (18.8)
subtotal 58 (100) 45 (100) 13 (100) 42 (100) 16 (100)
missing 0 0 0 0 0
Ethnicity
White 52 (91.2) 41 (91.1) 11 (91.7) 39 (92.9) 13 (86.7)
Indian 0 0 0 0 0
Chinese 1 (1.8) 1 (2.2) 0 1 (2.4) 0
Mixed 0 0 0 0 0
Black/Black British
3 (5.3) 2 (4.4) 1 (8.3) 1 (2.4) 2 (13.3)
Other 1 (1.8) 1 (2.2) 0 1 (2.4) 0
subtotal 57 (100) 45 (100) 12 (100) 42 (100) 15 (1)
missing 1 0 1 0 1
Trial arm
Control 29 (50.0) 21 (46.7) 8 (61.5) 20 (47.6) 9 (56.3)
Experimental 29 (50.0) 24 (53.3) 5 (38.5) 22 (52.4) 7 (43.8)
subtotal 58 (100) 45 (100) 13 (100) 42 (100) 16 (100)
missing 0 0 0 0 0
Handedness (EHI)
Left 1 (1.8) 1 (2.2) 0 1 (2.4) 0
Right 50 (87.7) 40 (88.9) 10 (83.3) 37 (88.1) 13 (86.7)
Mixed 6 (10.5) 4 (8.9) 2 (16.7) 4 (9.5) 2 (13.3)
subtotal 57 (100) 45 (100) 12 (100) 42 (100) 15 (100)
missing 1 0 1 0 1
Puberty status
Yes 46 (80.7) 36 (80.0) 10 (83.3) 35 (83.3) 11 (73.3)
No 11 (19.3) 9 (20.0) 2 (16.7) 7 (16.7) 4 (26.7)
subtotal 57 (100) 45 (100) 12 (100) 42 (100) 15 (100)
missing 1 0 1 0 1
Family history of scoliosis
Yes 17 (38.6) 17 (39.5) 0.0 16 (39.0) 1 (33.3)
No 27 (61.4) 26 (60.5) 1 (100) 25 (61.0) 2 (66.7)
subtotal 44 (100) 43 (100) 1 (100) 41 (100) 3 (100)
missing 14 2 12 1 13

336
Table 10.3 continued
mean sd SE 95% CI median IQR min max missing
(n)
Age (baseline) All
(n=58) 14.37 1.72 0.23
13.92, 14.83
14.63 13.10, 15.85
10.33 16.92 0
6 mth C*
(n=45) 14.51 1.80 0.27
13.97, 15.06
14.75 13.29, 15.96
10.33 16.92 0
6 mth NC*
(n=13) 13.88 1.37 0.38
13.05, 14.71
14.08 12.88, 15.00
11.00 16.08 0
12 mth C
(n=42) 14.54 1.84 0.28
13.97, 15.11
14.83 13.35, 16.06
10.33 16.92 0
12 mth NC
(n=16) 13.93 1.33 0.33
13.22, 14.64
14.08 12.85, 14.94
11.00 16.08 0
Age puberty onset (years)¥
All (n=45)
12.49 1.06 0.16 12.17, 12.81
13.00 12.00, 13.00
9 15 13
6 mth C
(n=35) 12.66 0.97 0.16
12.32, 12.99
13.00 12.00, 13.00
11 15 10
6 mth NC
(n=10) 11.90 1.20 0.38
11.04, 12.76
12.00 11.75, 13.00
9 13 3
12 mth C
(n=34) 12.65 0.99 0.17
12.30, 12.99
13.00 12.00, 13.00
11 15 8
12 mth NC
(n=11) 12.00 1.18 0.36
11.21, 12.79
12.00 12.00, 13.00
9 13 5
Income, postcode (weekly gross £) All
(n=58) 748.79 231.97 30.46
687.80, 809.79
700.00 587.5,
860 430 1510 0
6 mth C
(n=45) 736.00 195.34 29.12
677.31, 794.69
700.00 595, 850
430 1360 0
6 mth NC
(n=13) 793.08 336.09 93.21
589.98, 996.17
760.00 555, 900
440 1510 0
12 mth C
(n=42) 749.52 194.95 30.08
688.77, 810.27
735.00 610, 860
430 1360 0
12 mth NC
(n=16) 746.88 317.17 79.29
577.87, 915.88
670.00 520, 850
440 1510 0
* C = completer; NC = non-completer; ¥ = of those who reported reaching puberty in table 7.3.

337
Table 10.3 continued
mean sd SE 95% CI median IQR min max missing
(n)
Standing height (cm)
All (n=58)
162.66 11.00 1.44 159.76, 165.55
164.50 156.00, 170.25
127.00 187.00 0
6 mth C*
(n=45) 164.00 10.02 1.49
160.99, 167.01
165.00 158.50, 171.00
140.00 187.00 0
6 mth NC*
(n=13) 158.00 13.26 3.68
149.99, 166.01
160.00 151.50, 167.50
127.00 178.00 0
12 mth C
(n=42) 164.40 10.19 1.57
161.23, 167.58
165.00 159.75, 171.00
140.00 187.00 0
12 mth NC
(n=16) 158.06 12.02 3.01
151.65, 164.47
159.00 154.00, 166.50
127.00 178.00 0
Weight (kg)
All (n=58)
52.74 11.86 1.56 49.62, 55.86
54.00 44.50, 61.00
28.00 75.00 0
6 mth C
(n=45) 52.62 12.31 1.84
48.92, 56.32
54.00 44.00, 61.00
28.00 75.00 0
6 mth NC
(n=13) 53.15 10.57 2.93
46.77, 59.54
51.00 45.00, 61.50
37.00 75.00 0
12 mth C
(n=42) 52.74 12.32 1.90
48.90, 56.58
54.00 45.00, 61.00
28.00 75.00 0
12 mth NC
(n=16) 52.75 10.93 2.73
46.92, 58.58
50.50 43.00, 61.75
37.00 75.00 0
Body mass index (BMI)
All (n=58)
19.86 4.18 0.55 18.76, 20.96
19.57 17.22, 21.21
13.45 40.30 0
6 mth C
(n=45) 19.34 3.35 0.50
18.34, 20.35
18.86 17.16, 21.26
13.45 27.48 0
6 mth NC
(n=13) 21.64 6.12 1.70
17.95, 25.34
20.17 18.48, 21.24
16.67 40.30 0
12 mth C
(n=42) 19.29 3.31 0.51
18.25, 20.32
19.06 17.17, 20.94
13.45 27.48 0
12 mth NC
(n=16) 21.36 5.75 1.44
18.30, 24.43
20.00 17.76, 22.27
16.44 40.30 0
* C = completer; NC = non-completer

338
Differences in baseline spinal deformity and bracing status between participants who
completed all follow-ups and non-completers are presented in Table 10.4 and Table 10.5.
.
Non-completers were more likely at baseline to wear a brace (36% NC v 12-13% C), have a
double curve (50 and 60% for 6 and 12 month NC v 44 and 41% for C respectively), with the
primary curve convex to the left (58 and 47% NC v 30 and 33% C at 6 and 12 months
respectively) and the apex located in the lumbar spine (54 and 44% NC v 22 and 24% C). A
greater proportion of non-completers had baseline Risser signs of 0-2 (62.5% and 72.8% NC v
25.1 and 16% C) indicating lower levels of skeletal maturity, which is consistent with their
younger age on average at initial presentation. There was no relevant difference in mean
baseline Cobb angles between completers and 6 and 12 month non-completers.
Caution should be taken when interpreting these results. Due to low numbers of participants
in some categories, small differences in actual numbers can result in large proportional
differences.
Table 10.4 Participant baseline Cobb angle (main curve) by responder type
mean sd SE 95% CI median IQR min max missing
(n)
All (n=57)
34.02 10.00 1.32 31.36, 36.67
34.00 27.00, 41.00
14.00 50.00 1 (1.7)
6 mth C*
(n=45) 34.07 10.05 1.50
31.05, 37.09
34.00 26.00, 42.50
15.00 35.00 0
6 mth NC*
(n=12) 33.83 10.26 2.96
27.32, 40.35
34.00 27.00, 40.00
14.00 50.00 1 (7.7)
12 mth C (n=42)
34.21 10.28 1.59 31.01, 37.42
34.50 34.50, 43.00
15.00 50.00 0
12 mth NC
(n=15) 33.47 9.50 2.45
28.21, 38.73
32.00 27.00, 40.00
14.00 50.00 1 (6.3)
* C = completer; NC = non-completer

339

340
Table 10.5 Participant baseline brace use & spinal deformity characteristics by responder type
Category All
6 months 6 months 12 months 12 months C NC C NC n (%) n (%) n (%) n (%) n (%)
Brace
Yes 10 (17.9) 6 (13.3) 4 (36.4) 5 (11.9) 5 (35.7)
No 46 (82.1) 39 (86.7) 7 (63.6) 37 (88.1) 9 (64.3)
subtotal 56 45 11 42 14
missing 2 0 2 0 2
Curve type
Single 30 (52.6) 24 (53.3) 6 (50.0) 24 (57.1) 6 (40.0)
Double 26 (45.6) 20 (44.4) 6 (50.0) 17 (40.5) 9 (60.0)
Triple 1 (1.8) 1 (2.2) 0 1 (2.4) 0
subtotal 57 45 12 42 15
missing 1 0 1 0 1
Curve direction*
Right 35 (63.6) 30 (69.8) 5 (41.7) 27 (67.5) 8 (53.3)
Left 20 (36.4) 13 (30.2) 7 (58.3) 13 (32.5) 7 (46.7)
subtotal 55 43 12 40 15
missing 3 2 1 2 1
Curve location*
thoracic 36 (62.1) 31 (68.9) 5 (38.5) 28 (66.7) 8 (50.0)
thoracolumbar 2 (3.4) 2 (4.4) 0 2 (4.8) 0
lumbar 17 (29.3) 10 (22.2) 7 (53.8) 10 (23.8) 7 (43.8)
unknown 2 (3.4) 2 (4.4) 1 (7.7) 2 (4.8) 1 (6.3)
subtotal 57 45 12 42 16
missing 1 0 0 0 0
Risser sign
0 - 0% 7 (19.4) 5 (17.9) 2 (25.0) 3 (12.0) 4 (36.4)
1 - 25% 3 (8.3) 1 (3.6) 2 (25.0) 1 (4.0) 2 (18.2)
2 - 50% 2 (5.6) 1 (3.6) 1 (12.5) 0 2 (18.2)
3 - 75% 7 (19.4) 6 (21.4) 1 (12.5) 7 (28.0) 0
4 - 100% 11 (30.6) 10 (35.7) 1 (12.5) 9 (36.0) 2 (18.2)
5 - skeletal maturity
6 (16.7) 5 (17.9) 1 (12.5) 5 (20.0) 1 (9.1)
subtotal 36 28 8 25 11
missing 22 17 5 17 5
* of main curve; C = completer; NC = non-completer
10.1.3 Data analysis - participants available
As described previously, a total of 58 participants were recruited at baseline. Of these, 42 were
followed up at 12 months and are described in subsequent sections as 12 month completers.
Descriptive statistics were calculated and plots drawn separately for 12 mth completers (C) as
well as for all those participants for whom information was available at each individual time-
point (all responders; n= 58 and 45 for baseline and 6 months respectively).
341
10.2 Spinal deformity
Spinal deformity was assessed by variables calculated from x-ray. Due to the small number of
participants who underwent surface topography imaging, and the lack of any significant
relationships between ISIS-2 and body schema measures (as described in Chapter 7), analyses
of surface topography were not conducted as part of this study.
Descriptive statistics for Cobb angle along with coronal and sagittal balance are provided in

342
Table 10.6 to Table 10.8 and illustrated in Figure 10.2 to Figure 10.10. Details of these
measures are provided in Appendix 6. Results of statistical analyses are summarised in Table
10.9. Unless otherwise stated, a two (trial arm) by three (time-point) mixed repeated
measures ANOVA was conducted to compare the dependent (outcome) variable in each
condition.
10.2.1 Cobb angle
On average, Cobb angle increased by 3.5 degrees between baseline and 12 months (Table
10.6). The Cobb angle at baseline and 6 months for participants who completed the 12 month
time-point (C) was very similar to all participants for whom information was available at each
of these time-points (All).
Statistical analysis resulted in a statistically significant main effect of time-point (F(1.31, 41.76)
=4.22; p=0.036; η2=.117) (Table 10.9). Contrasts revealed that Cobb angle at 12 months was
greater than at baseline (F(1, 32) =5.284; p=.028; η2=.142). However, the difference was not
statistically significant after pairwise comparison with Bonferroni correction (mean
difference=2.971; SE 1.17; 95% CI -.294, 6.235, p=0.085).
There was no statistically significant interaction between time-point and arm.
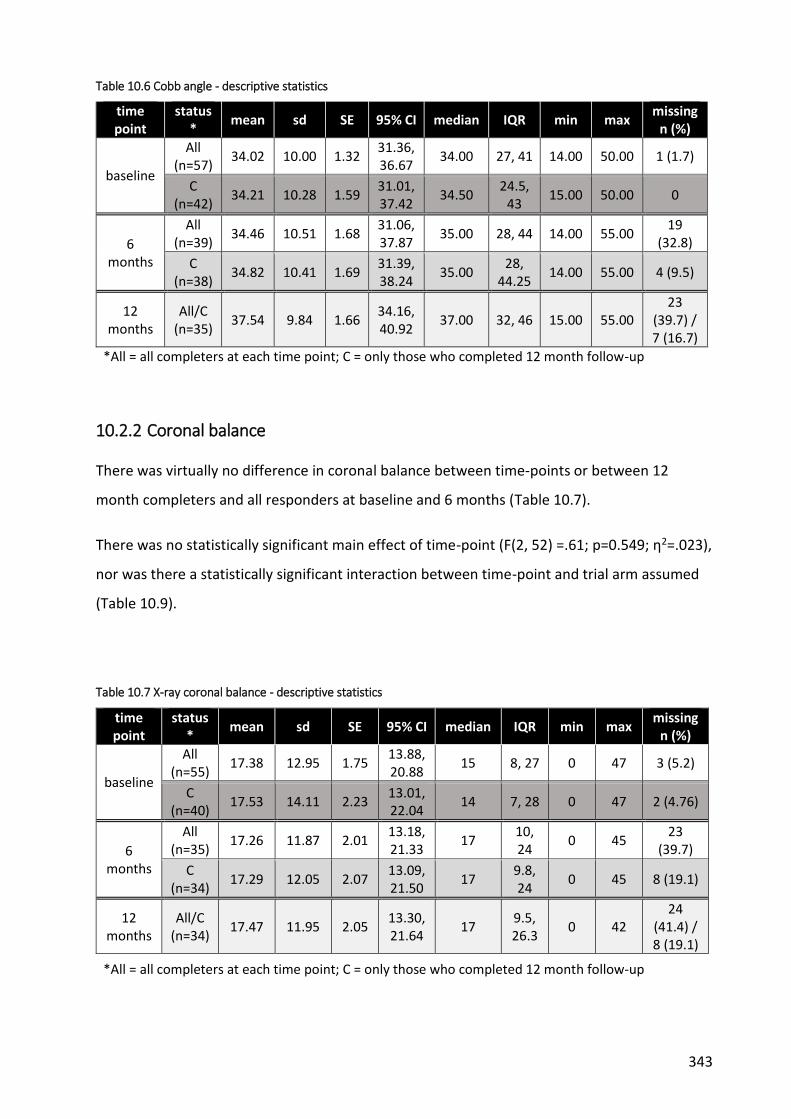
343
Table 10.6 Cobb angle - descriptive statistics
time point
status *
mean sd SE 95% CI median IQR min max missing
n (%)
baseline
All (n=57)
34.02 10.00 1.32 31.36, 36.67
34.00 27, 41 14.00 50.00 1 (1.7)
C (n=42)
34.21 10.28 1.59 31.01, 37.42
34.50 24.5,
43 15.00 50.00 0
6 months
All (n=39)
34.46 10.51 1.68 31.06, 37.87
35.00 28, 44 14.00 55.00 19
(32.8)
C (n=38)
34.82 10.41 1.69 31.39, 38.24
35.00 28,
44.25 14.00 55.00 4 (9.5)
12 months
All/C (n=35)
37.54 9.84 1.66 34.16, 40.92
37.00 32, 46 15.00 55.00 23
(39.7) / 7 (16.7)
*All = all completers at each time point; C = only those who completed 12 month follow-up
10.2.2 Coronal balance
There was virtually no difference in coronal balance between time-points or between 12
month completers and all responders at baseline and 6 months (Table 10.7).
There was no statistically significant main effect of time-point (F(2, 52) =.61; p=0.549; η2=.023),
nor was there a statistically significant interaction between time-point and trial arm assumed
(Table 10.9).
Table 10.7 X-ray coronal balance - descriptive statistics
time point
status*
mean sd SE 95% CI median IQR min max missing
n (%)
baseline
All (n=55)
17.38 12.95 1.75 13.88, 20.88
15 8, 27 0 47 3 (5.2)
C (n=40)
17.53 14.11 2.23 13.01, 22.04
14 7, 28 0 47 2 (4.76)
6 months
All (n=35)
17.26 11.87 2.01 13.18, 21.33
17 10, 24
0 45 23
(39.7)
C (n=34)
17.29 12.05 2.07 13.09, 21.50
17 9.8, 24
0 45 8 (19.1)
12 months
All/C (n=34)
17.47 11.95 2.05 13.30, 21.64
17 9.5, 26.3
0 42 24
(41.4) / 8 (19.1)
*All = all completers at each time point; C = only those who completed 12 month follow-up

344
10.2.3 Sagittal balance
Measures of sagittal balance were generally poorly completed with sizeable numbers of x-rays
performed without this variable being calculated. Therefore, the results need to be viewed
with caution.
On average, there were small differences in mean sagittal balance between time-points (Table
10.8). No statistically significant main effect of time-point was observed (F(2, 22) =0.0.77,
p=0.476; η2=.065), nor was there a statistically significant interaction between time-point and
trial arm (Table 10.9).
Table 10.8 X-ray sagittal balance - descriptive statistics
time point
status* mean sd SE 95% CI median IQR min max missing
n (%)
Sagittal balance (mm)
baseline
All (n=42)
37.76 28.79 4.44 28.79, 46.73
29.00 16.8,
54 0 97
16 (27.6)
C (n=29)
32.38 24.18 4.49 23.18, 41.58
26.00 16.5,
47 0 97
13 (30.95)
6 months
All (n=22)
28.55 17.81 3.80 20.65, 36.44
24.50 16.8, 39.8
0 78 36
(62.1)
C (n=21)
29.00 18.11 3.95 20.75, 37.25
25.00 16.5, 41.5
0 78 21
(50.0)
12 months
All/C (n=14)
32.07 20.93 5.59 19.99, 44.46
28.50 16.8, 46.8
0 78
44 (75.9) /
28 (66.7)
*All = all completers at each time point; C = only those who completed 12 month follow-up
Table 10.9 Summary of statistical analyses - x-ray
analysis n interaction type (ɛ) F dfM dfR p-value effect
size, η2
Cobb angle
(degrees) 34
timepoint GG (0.652)
4.22 1.31 41.76
0.036* 0.117
timepoint x arm 0.54 0.51 .017
Coronal balance
(mm) 28
timepoint SA
(0.884)
0.61 2 52
0.549 .023
timepoint x arm 1.00 0.376 .037
Sagittal balance
(mm) 13
timepoint SA (0.883)
0.77 2 22
0.476 .065
timepoint x arm 0.32 0.733 .028
* = statistically significant; GG = Greenhouse Guisser estimate of sphericity; SA = sphericity assumed (Mauchly's W); dfM = degrees of freedom (main effect); dfR = degrees of freedom (error); η2=partial eta squared

345
Figure 10.2 Cobb angle - histogram

346
Figure 10.3 Cobb angle - boxplots
Figure 10.4 Cobb angle - means (95% CI)

347
Figure 10.5 X-ray coronal balance - histograms

348
Figure 10.6 X-ray coronal balance - boxplots
Figure 10.7 X-ray coronal balance - means (95% CI)

349
Figure 10.8 X-ray sagittal balance - histograms

350
Figure 10.9 X-ray sagittal balance - boxplots
Figure 10.10 X-ray sagittal balance - means (95% CI)

351
10.3 Self-report Measures
10.3.1 Spinal Appearance Questionnaire (SAQ)
Descriptive statistics are presented in Table 10.10 to Table 10.12 and illustrated in Figure 10.12
to Figure 10.23. A summary of statistical analyses is presented in Table 10.13.
10.3.1.1 Appearance scale
There was virtually no difference in appearance score between time-points or between 12
month completers and all responders at baseline and 6 months (Table 10.10).
There was no statistically significant main effect of time-point (F(1.72, 58.42) =0.09; p=0.887;
η2=.003), nor was there a statistically significant interaction between time-point and trial arm
condition (Table 10.13).
Table 10.10 SAQ appearance score - descriptive statistics
SAQ appearance (10 best - 50 worst)
time point
status* mean sd SE 95%
CI median IQR min max
missing n (%)
baseline
All (n=56)
22.61 5.91 0.79 21.02, 24.19
22.00 18.00, 27.75
11.00 38.00 2 (3.4)
C (n=41)
23.10 6.42 1.00 21.07, 25.12
23.00 18.00, 28.00
11.00 38.00 1 (2.4)
6 months
All (n=44)
22.50 6.35 0.96 20.57, 24.43
23.00 18.25, 26.00
11.00 38.00 14
(24.1)
C (n=40)
22.28 6.11 0.97 20.32, 24.23
23.00 18.25, 26.00
11.00 36.00 2 (4.8)
12 months
All/C (n=38)
22.56 7.25 1.18 20.18, 24.94
22.00 16.75, 27.25
11.25 45.00 20
(34.5) / 4 (9.5)
*All = all completers at each time point; C = only those who completed 12 month follow-up
10.3.1.2 Expectations scale
Overall, there was little difference in expectations score between time-points (Table 10.11).
There was no statistically significant main effect of time-point (F(2, 70) =0.61; p=0.554;
η2=.017) (Table 10.13), nor was there a statistically significant between-subjects effect for trial
arm (F(1, 35) =1.148; p=0.291; η2=.032).

352
However, there was a statistically significant interaction between time-point and trial arm (F(2,
70) =9.39; p<0.001; η2=.211). This indicates that trial arm allocation had different effects on
expectation score depending on time-point. Between subject contrasts revealed significant
interactions when comparing experimental to control arm intervention for both baseline (F(1,
35) =13.94; p=0.001; η2=.285) and 6 month time-points (F(1, 35) =9.91; p=.003; η2=.221)
compared to 12 months. These results reflect the higher (i.e. worse) scores for participants in
the experimental intervention arm (compared to control participants) at baseline and 6
months compared to 12 months (Table 10.11

353
Figure 10.11).
Table 10.11 SAQ expectations score - descriptive statistics
SAQ expectations (4 best - 20 worst)
time point
status* mean sd SE 95% CI median IQR min max missing
n (%)
baseline
All (n=57)
13.10 4.71 0.62 11.85, 14.35
13.00 9.50, 17.00
4.00 20.00 1 (1.7)
C (n=42)
13.66 4.73 0.73 12.18, 15.13
14.00 10.50, 17.25
4.00 20.00 0
6 months
All (n=44)
12.98 5.14 0.78 11.41, 14.54
14.00 9.00, 17.75
4.00 20.00 14
(24.1)
C (n=40)
13.08 5.13 0.81 11.44, 14.71
14.00 9.00, 18.00
4.00 20.00 2 (4.8)
12 months
All/C (n=38)
12.95 5.27 0.86 11.21, 14.68
13.00 8.50, 17.25
4.00 20.00 20
(34.5) / 4 (9.5)
*All = all completers at each time point; C = only those who completed 12 month follow-up
10.3.1.3 Total score
Similar results were calculated for the total SAQ score with little difference in overall mean
scores (Table 10.12) and no statistically significant effects of time-point (F(1.70, 57.9) =0.22;
p=0.766; η2=.006), nor trial arm (F(1, 34) =1.81; p=0.188; η2=.050) (Table 10.13). The
statistically significant interaction of time-point and trial arm (F(1.70, 57.9) =5.38; p=0.01;
η2=.137) highlighted that trial arm allocation had different effects on total SAQ score
depending on time-point. Between subject contrasts revealed significant interactions when
comparing experimental to control arm intervention for both baseline v 12 months (F(1, 34)
=7.24; p=0.011; η2=.176) and 6 month v 12 month time-points (F(1, 34) =5.57; p=.024;
η2=.141). These results reflect the higher (i.e. worse) scores for participants in the
experimental intervention arm (compared to control participants) at baseline and 6 months
compared to 12 months (Figure 10.11).
Table 10.12 SAQ total score - descriptive statistics
SAQ total (14 best - 70 worst)
time point
status* mean sd SE 95% CI median IQR min max missing
n (%)

354
baseline
All (n=56)
35.60 9.25 1.24 33.12, 38.08
36.00 28.00, 43.00
15.00 55.00 2 (3.4)
C (n=41)
36.63 9.7 1.52 33.56, 39.69
37.00 30.00, 43.50
15.00 55.00 1 (2.4)
6 months
All (n=44)
35.48 9.85 1.49 32.48, 38.47
34.50 29.00, 43.75
15.00 53.00 14
(24.1)
C (n=40)
35.35 9.97 1.58 32.16, 38.54
34.00 29.00, 43.75
15.00 53.00 2 (4.8)
12 months
All/C (n=38)
35.51 11.22 1.82 31.82, 39.20
35.50 26.25, 44.25
15.25 63.00 20
(34.5) / 4 (9.5)
*All = all completers at each time point; C = only those who completed 12 month follow-up
Table 10.13 Summary of statistical analyses - SAQ
analysis n interaction type (ɛ) F dfM dfR p-value effect size,
η2
Spinal Appearance Questionnaire (SAQ)
Appearance 36 timepoint
HF (0.86) 0.09
1.718 58.42 0.887 0.003
timepoint x arm
1.19 0.305 0.034
Expectations 37 timepoint
SA (0.93) 0.61
2 70 0.544 0.017
timepoint x arm
9.39 <0.001* 0.211
Total score 36 timepoint
HF (0.85) 0.22
1.703 57.895 0.766 0.006
timepoint x arm
5.38 0.01* 0.137
* = statistically significant; GG/HF = Greenhouse Guisser/Huynh-Feldt estimate of sphericity; SA = sphericity assumed (Mauchly's W); dfM = degrees of freedom (main effect); dfR = degrees of freedom (error); η2=partial eta squared

355
Figure 10.11 Interaction graphs - timepoint * arm

356
Figure 10.12 SAQ appearance score - All Responders histogram
Figure 10.13 SAQ appearance score - 12 mth Completers only histogram

357
Figure 10.14 SAQ appearance score - boxplots
Figure 10.15 SAQ appearance score - means (95% CI)

358
Figure 10.16 SAQ expectations score - All Responders histograms
Figure 10.17 SAQ expectations score - 12 mth Completers only histograms

359
Figure 10.18 SAQ expectations score - boxplots
Figure 10.19 SAQ expectations score - means (95% CI)
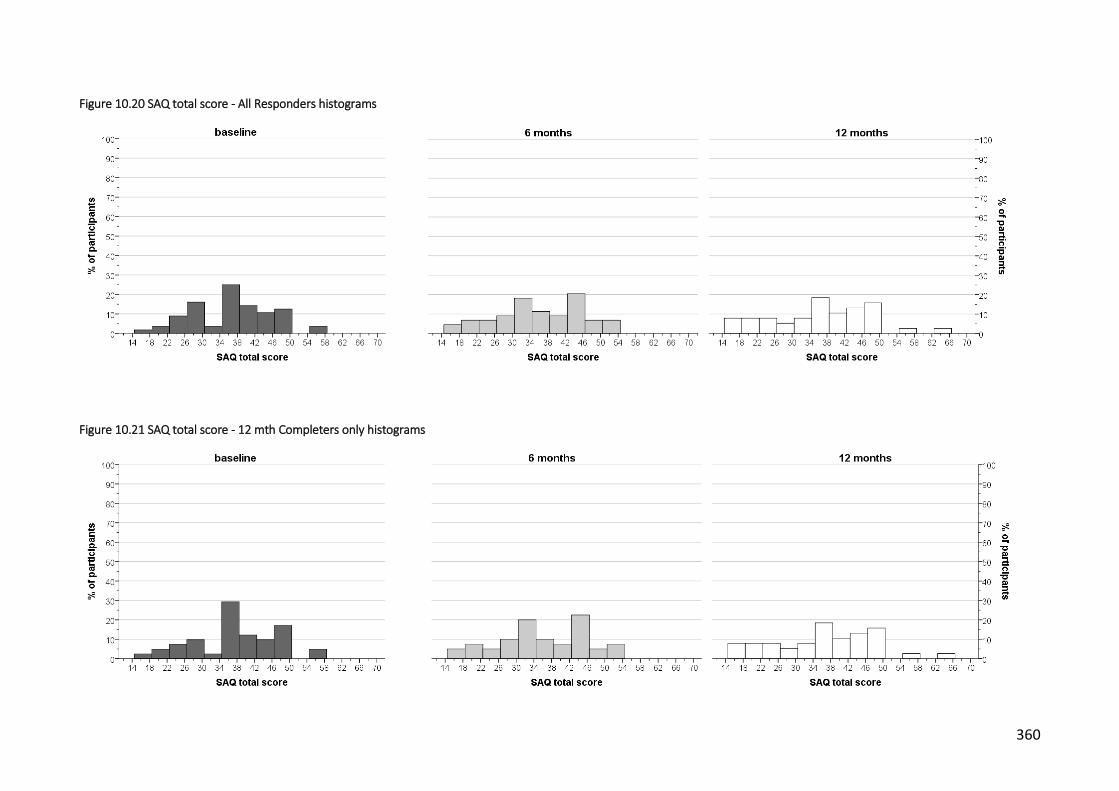
360
Figure 10.20 SAQ total score - All Responders histograms
Figure 10.21 SAQ total score - 12 mth Completers only histograms

361
Figure 10.22 SAQ total score - boxplots
Figure 10.23 SAQ total score - means (95% CI)

362
10.3.2 Kinaesthetic & Proprioceptive Awareness Questionnaire (KPAQ)
Descriptive statistics are presented in Table 10.14 and illustrated in Figure 10.24 to Figure
10.27.
There were small differences in KPAQ score between time-points (Table 10.14). These
differences were statistically significant (F(2, 70) =6.77; p=.002; η2=.162) (Table 10.15).
Contrasts revealed that KPAQ score at 12 months was greater than at baseline (F(1, 35)
=12.48; p=.001; η2=.263), and at 6 months (F(1, 35) =6.29; p=.017; η2=.152). The difference
between 6 and 12 months remained on the cusp of statistical significance after pairwise
comparison with Bonferroni correction (mean difference=2.58; SE 1.03; 95% CI -.007, 5.168,
p=0.051).
There was no statistically significant between-subject effect of trial arm (F(1, 35) =.66; p=.422;
η2=.019). There was no statistically significant interaction between time-point and trial arm
(F(2, 70) =1.81; p=.172; η2=.049).
Table 10.14 KPAQ - descriptive statistics
KPAQ total (12 worst - 60 best)
time point
status* mean sd SE 95% CI median IQR min max missing
n (%)
baseline
All (n=57)
47.26 6.17 0.82 45.62, 48.90
48.00 41.50, 52.00
36.00 60.00 1 (1.7)
C (n=42)
46.43 5.73 0.88 44.64, 48.21
47.50 41.75, 50.25
36.00 60.00 0
6 months
All (n=44)
46.99 5.28 0.80 45.39, 48.60
47.50 44.18, 50.00
32.00 57.00 14
(24.1)
C (n=40)
47.47 5.29 0.84 45.78, 49.16
48.00 45.25, 50.75
32.00 57.00 2 (4.8)
12 months
All/C (n=38)
49.92 4.75 0.77 48.36, 51.48
49.50 47.00, 53.25
38.00 59.00
20 (34.5)
/ 4 (9.5)
*All = all completers at each time point; C = only those who completed 12 month follow-up
Table 10.15 Summary of statistical analyses - KPAQ
analysis n interaction type (ɛ) F dfM dfR p-value effect
size, η2
KPAQ score 37 timepoint
SA (0.995) 6.77
2 70 0.002* 0.162
timepoint x arm
1.81 0.172 0.049
* = statistically significant; SA = sphericity assumed (Mauchly's W); dfM = degrees of freedom (main effect); dfR = degrees of freedom (error); η2=partial eta squared

363
Figure 10.24 KPAQ score - All Responders histograms
Figure 10.25 KPAQ score - 12 mth Completers only histograms
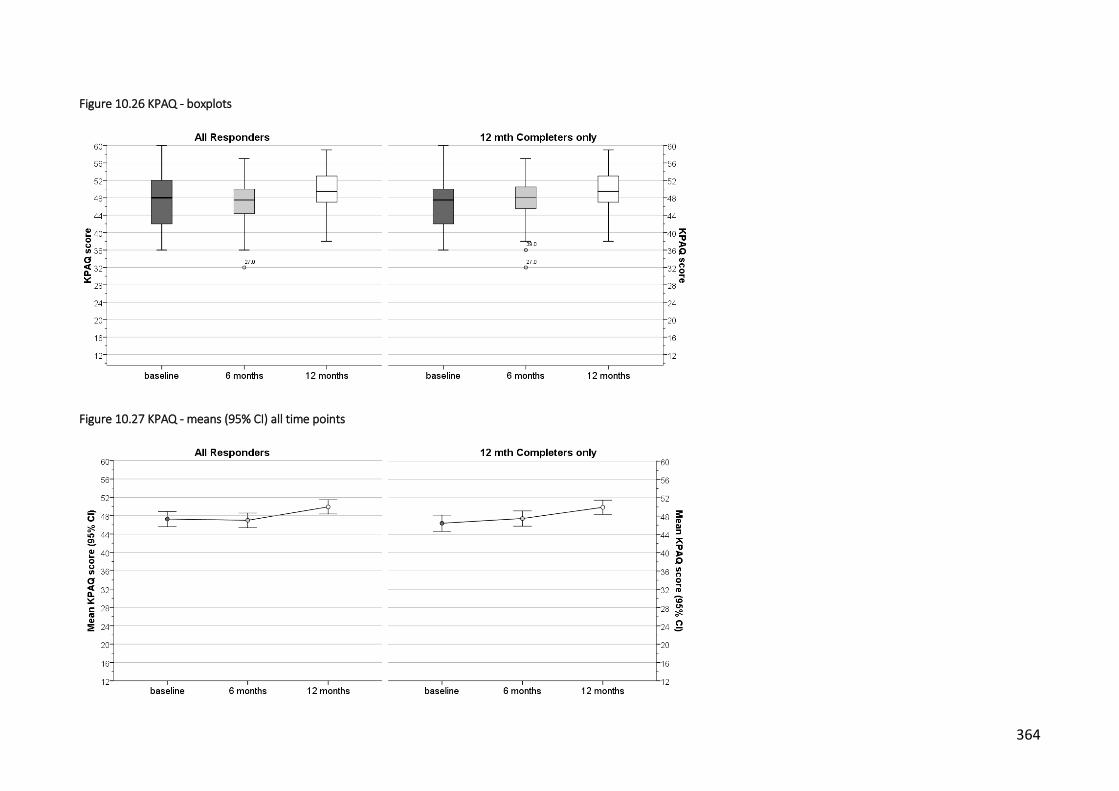
364
Figure 10.26 KPAQ - boxplots
Figure 10.27 KPAQ - means (95% CI) all time points
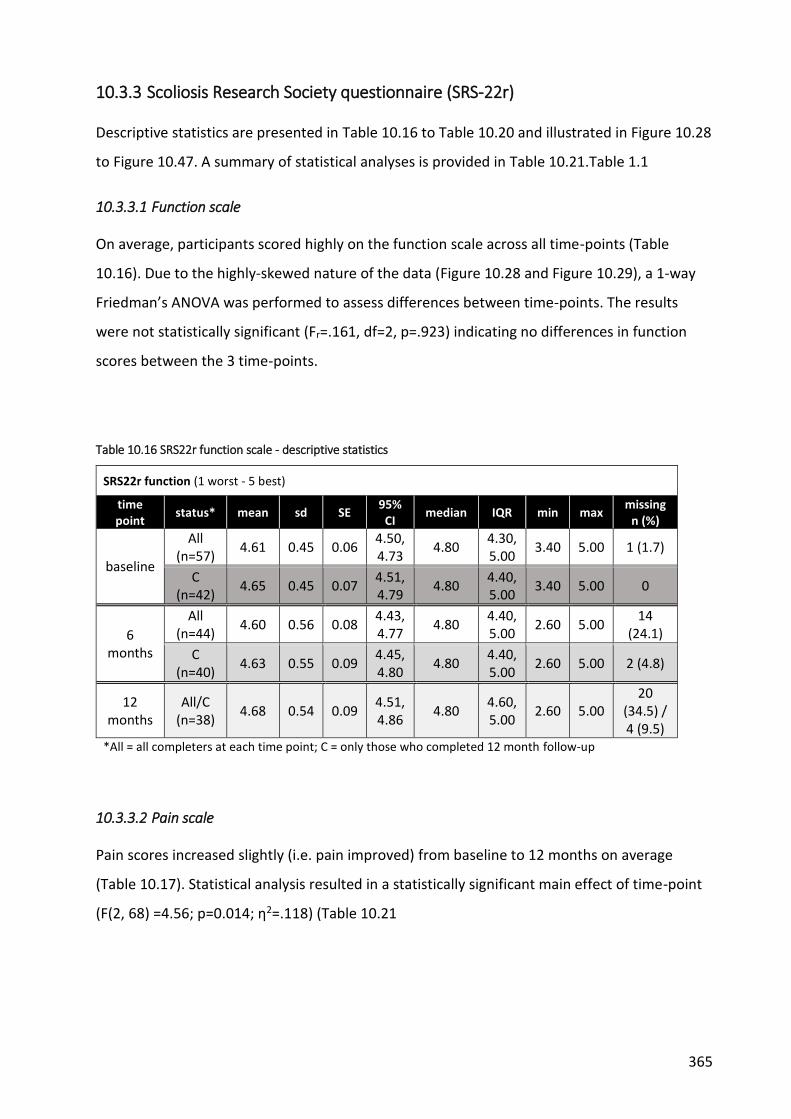
365
10.3.3 Scoliosis Research Society questionnaire (SRS-22r)
Descriptive statistics are presented in Table 10.16 to Table 10.20 and illustrated in Figure 10.28
to Figure 10.47. A summary of statistical analyses is provided in Table 10.21.Table 1.1
10.3.3.1 Function scale
On average, participants scored highly on the function scale across all time-points (Table
10.16). Due to the highly-skewed nature of the data (Figure 10.28 and Figure 10.29), a 1-way
Friedman’s ANOVA was performed to assess differences between time-points. The results
were not statistically significant (Fr=.161, df=2, p=.923) indicating no differences in function
scores between the 3 time-points.
Table 10.16 SRS22r function scale - descriptive statistics
SRS22r function (1 worst - 5 best)
time point
status* mean sd SE 95%
CI median IQR min max
missing n (%)
baseline
All (n=57)
4.61 0.45 0.06 4.50, 4.73
4.80 4.30, 5.00
3.40 5.00 1 (1.7)
C (n=42)
4.65 0.45 0.07 4.51, 4.79
4.80 4.40, 5.00
3.40 5.00 0
6 months
All (n=44)
4.60 0.56 0.08 4.43, 4.77
4.80 4.40, 5.00
2.60 5.00 14
(24.1)
C (n=40)
4.63 0.55 0.09 4.45, 4.80
4.80 4.40, 5.00
2.60 5.00 2 (4.8)
12 months
All/C (n=38)
4.68 0.54 0.09 4.51, 4.86
4.80 4.60, 5.00
2.60 5.00 20
(34.5) / 4 (9.5)
*All = all completers at each time point; C = only those who completed 12 month follow-up
10.3.3.2 Pain scale
Pain scores increased slightly (i.e. pain improved) from baseline to 12 months on average
(Table 10.17). Statistical analysis resulted in a statistically significant main effect of time-point
(F(2, 68) =4.56; p=0.014; η2=.118) (Table 10.21

366
Table 10.21). Contrasts revealed that pain score at 12 months was greater than at baseline
(F(1, 34) =9.413; p=.004; η2=.117) indicating that pain improved over time.
There was no statistically significant between-subject effect of trial arm (F(1, 34) =3.25; p=0.08;
η2=.087) or interaction between time-point and arm (F(2, 68) =2.76; p=0.071; η2=.075).
Table 10.17 SRS22r pain scale - descriptive statistics
SRS22r pain (1 worst - 5 best)
time point
status* mean sd SE 95%
CI median IQR min max
missing n (%)
baseline
All (n=57)
3.96 0.76 0.10 3.76, 4.17
4.20 3.40, 4.60
1.80 5.00 1 (1.7)
C (n=42)
4.00 0.74 0.11 3.77, 4.23
4.20 3.55, 4.60
2.00 5.00 0
6 months
All (n=44)
4.08 0.65 0.10 3.88, 4.28
4.10 3.64, 4.75
2.60 5.00 14 (24.1)
C (n=40)
4.12 0.67 0.11 3.91, 4.33
4.20 3.80, 4.80
2.60 5.00 2 (4.8)
12 months
All/C (n=38)
4.20 0.76 0.12 3.95, 4.45
4.40 3.95, 4.80
1.40 5.00 20 (34.5) / 4 (9.5)
*All = all completers at each time point; C = only those who completed 12 month follow-up
10.3.3.3 Self-image scale
On average, self-image scores were generally lower (i.e. worse) than other SRS-22r subscales
but were relatively consistent across time-points (

367
Table 10.18).
There was no statistically significant main effect of time-point (F(2, 70) =0.48; p=0.624;
η2=.013), nor was there a statistically significant interaction between time-point and trial arm
conditions (F(2, 70) =0.62; p=0.542; η2=.017) (

368
Table 10.21).

369
Table 10.18 SRS22r self-image scale - descriptive statistics
SRS22r self-image (1 worst - 5 best)
time point
status* mean sd SE 95%
CI median IQR min max
missing n (%)
baseline
All (n=57)
3.41 0.73 0.10 3.22, 3.61
3.40 2.90, 3.80
1.80 5.00 1 (1.7)
C (n=42)
3.41 0.76 0.12 3.18, 3.65
3.40 2.80, 3.85
1.80 5.00 0
6 months
All (n=44)
3.49 0.87 0.13 3.22, 3.75
3.60 2.65, 4.00
1.40 5.00 14
(24.1)
C (n=40)
3.49 0.84 0.13 3.22, 3.76
3.60 2.70, 4.00
1.40 5.00 2 (4.8)
12 months
All/C (n=38)
3.52 0.90 0.15 3.23, 3.82
3.60 3.00, 4.00
1.00 5.00 20
(34.5) / 4 (9.5)
*All = all completers at each time point; C = only those who completed 12 month follow-up
10.3.3.4 Mental health scale
Mental health scores displayed very little difference on average between time-points (Table
10.19), and there were no statistically significant main effects of time-point (F(2, 70) =0.48;
p=0.623; η2=.013) or interaction between time-point and trial arm conditions (F(2, 70) =2.39;
p=0.099; η2=.064) (

370
Table 10.21).
Table 10.19 SRS22r mental health scale - descriptive statistics
SRS22r mental health (1 worst - 5 best)
time point
status* mean sd SE 95%
CI median IQR min max
missing n (%)
baseline
All (n=57)
3.90 0.89 0.12 3.66, 4.14
4.20 3.30, 4.60
1.80 5.00 1 (1.7)
C (n=42)
3.88 0.88 0.14 3.61, 4.15
4.10 3.15, 4.60
2.00 5.00 0
6 months
All (n=44)
3.90 0.95 0.14 3.62, 4.19
4.20 3.25, 4.60
1.60 5.00 14
(24.1)
C (n=40)
3.91 0.94 0.15 3.61, 4.21
4.20 3.25, 4.60
1.60 5.00 2 (4.8)
12 months
All/C (n=38)
4.01 0.92 0.15 3.71, 4.31
4.20 3.20, 4.85
1.60 5.00 20
(34.5) / 4 (9.5)
*All = all completers at each time point; C = only those who completed 12 month follow-up
10.3.3.5 Subtotal
There was a slight improvement in SRS-22r subtotal scores over time (Table 10.20) but this did
not result in a statistically significant main effect of time-point (F(2, 70)=1.07; p=0.348;
η2=.003) or interaction between time-point and trial arm conditions (F(2, 70)=2.65; p=0.078;
η2=.007) (

371
Table 10.21).
Table 10.20 SRS22r subtotal - descriptive statistics
SRS22r total score (1 worst - 5 best)
time point
status* mean sd SE 95%
CI median IQR min max
missing n (%)
baseline
All (n=57)
3.97 0.58 0.08 3.81, 4.13
4.10 3.50, 4.43
2.70 4.85 1 (1.7)
C (n=42)
3.99 0.60 0.09 3.80, 4.17
4.13 3.50, 4.45
2.70 4.85 0
6 months
All (n=44)
4.02 0.59 0.09 3.84, 4.20
4.13 3.45, 4.49
2.85 4.95 14
(24.1)
C (n=40)
4.04 0.58 0.09 3.85, 4.22
4.18 3.45, 4.53
2.85 4.95 2 (4.8)
12 months
All/C (n=38)
4.10 0.65 0.11 3.89, 4.32
4.28 3.81, 4.51
2.20 4.90 20
(34.5) / 4 (9.5)
*All = all completers at each time point; C = only those who completed 12 month follow-up

372
Table 10.21 Summary of statistical analyses - SRS-22r
analysis n interaction type (ɛ)
F dfM dfR p-value effect size,
η2
SRS-22r
pain 36 timepoint
SA (0.998)
4.56 2 68
0.014* 0.118
timepoint x arm
2.76 0.071 0.075
self-image
37
timepoint SA
(0.843)
0.48
2 70
0.624 0.013
timepoint x arm
0.62 0.542 0.017
mental health
37 timepoint
SA (0.991)
0.48 2 70
0.623 0.013
timepoint x arm
2.39 0.099 0.064
Total score
37 timepoint
SA (0.925)
1.07 2 70
0.348 0.03
timepoint x arm
2.65 0.078 0.07
* = statistically significant; SA = sphericity assumed (Mauchly's W); dfM = degrees of freedom (main effect); dfR = degrees of freedom (error); η2=partial eta squared

373
Figure 10.28 SRS-22r function score - All Responders histograms all time points
Figure 10.29 SRS-22r function score - 12 mth Completers only histograms

374
Figure 10.30 SRS22r function scale - boxplots
Figure 10.31 SRS22r function scale - means (95% CI)
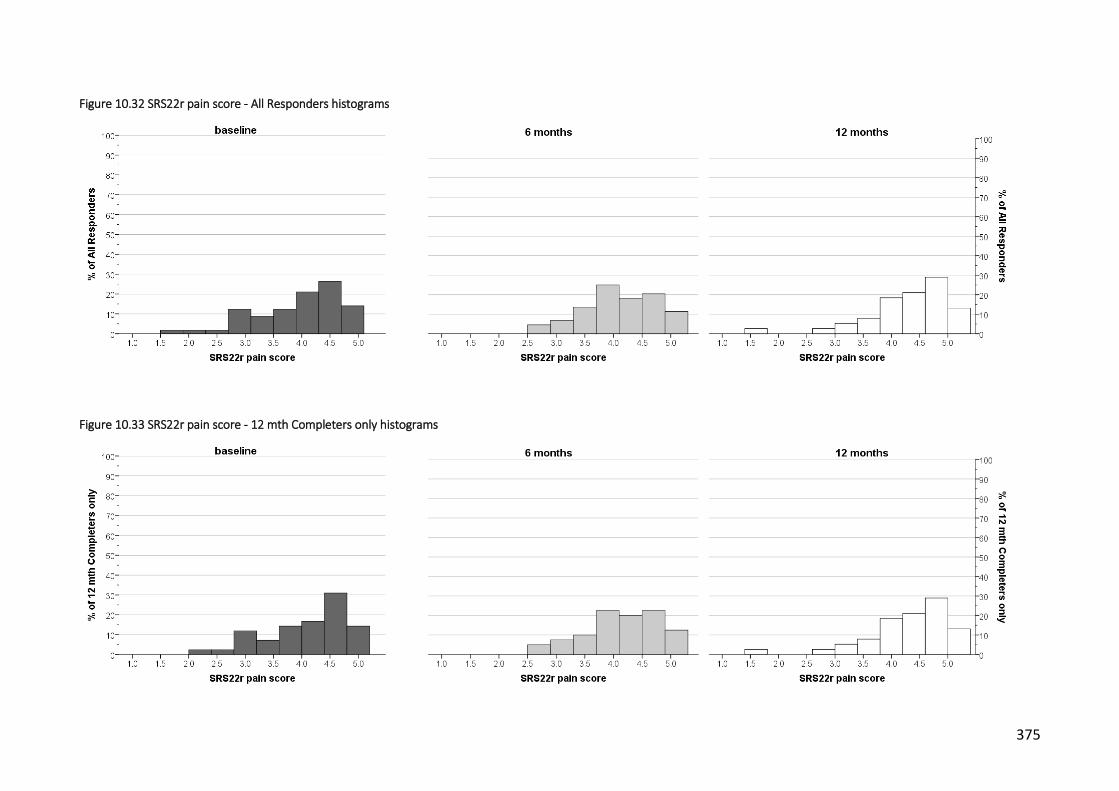
375
Figure 10.32 SRS22r pain score - All Responders histograms
Figure 10.33 SRS22r pain score - 12 mth Completers only histograms

376
Figure 10.34 SRS22r pain scale - boxplots
Figure 10.35 SRS22r pain scale - means (95% CI)

377
Figure 10.36 SRS22r self-image score - All Responders histograms
Figure 10.37 SRS22r self-image score - 12 mth Completers only histograms

378
Figure 10.38 SRS22r self-image scale - boxplots
Figure 10.39 SRS22r self-image scale - means (95% CI)

379
Figure 10.40 SRS22r mental health score - All Responders histograms
Figure 10.41 SRS22r mental health score - 12 mth Completers only histograms

380
Figure 10.42 SRS22r mental health scale - boxplots
Figure 10.43 SRS22r mental health scale - means (95% CI)

381
Figure 10.44 SRS22r total score - All Responders histograms
Figure 10.45 SRS22r total score - 12 mth Completers only

382
Figure 10.46 SRS22r total score - boxplots
Figure 10.47 SRS22r total score - means (95% CI)

383
10.3.4 EQ5D - 3L
Descriptive statistics are presented in Table 10.22 and Table 10.23 and illustrated in Figure
10.48 to Figure 10.56. Results of statistical analysis for the 5 domains are described in Table
10.24.
10.3.4.1 EQ5D domains
Responses for each domain were combined into two categories: problems or no problems
(Table 10.23). Statistical analysis was then conducted to determine differences in the
proportions of these two categories between time-points. There were some differences
between time-points for some domains, most notably, the reduction in the proportion of
participants reporting pain at 12 months. However, the results of statistical analysis indicate
that there was no difference in proportions over time for any of mobility, self-care, activity,
pain or anxiety domains (Table 10.24).
10.3.4.2 Health state VAS
On average, participants EQ5D VAS scores improved slightly across all time-points (Table
10.22). Due to the highly-skewed nature of the data (Figure 10.53 and Figure 10.54), a 1-way
Friedman’s ANOVA was performed to assess differences between time-points. The results
were not statistically significant (Fr1.389, df=2, p=.499) indicating no differences in perceived
health state between the 3 time-points.
Table 10.22 EQ5D health state VAS - descriptive statistics
EQ5D health state (0 worst - 100 best)
time point
status* mean sd SE 95% CI median IQR min max missing
n (%)
baseline
All (n=57)
77.65 19.17 2.54 72.56, 82.73
85.00 68.0, 90.0
20 100 1 (1.7)
C (n=42)
75.88 20.13 3.11 69.61, 82.15
81.50 69.0, 90.0
20 100 0
6 months
All (n=44)
78.23 17.10 2.58 73.03, 83.43
81.50 70.0, 90.0
30 100 14
(24.1)
C (n=40)
77.58 16.57 2.62 72.27, 82.88
80.00 70.0, 90.0
30 100 2 (4.8)
12 months
All/C (n=38)
79.37 22.02 3.57 72.13, 86.61
85.00 75.25, 95.00
15 100 20
(34.5) / 4 (9.5)
*All = all completers at each time point; C = only those who completed 12 month follow-up

384
Table 10.23 EQ5D - 3L frequencies
1 2 3 2 + 3
time point status* no problems some
problems extreme problems
combined problems
missing
EQ5D mobility
baseline All (n=57) 47 (82.5) 9 (15.8) 1 (1.8) 10 (17.5) 1 (1.7)
C (n=42) 35 (83.3) 6 (14.3) 1 (2.4) 7 (16.7) 0
6 months All (n=44) 39 (88.6) 5 (11.4) 0 5 (11.4) 14 (24.1)
C (n=40) 35 (87.5) 5 (12.5) 0 5 (12.5) 2 (4.8)
12 months All/C
(n=38) 36 (94.7) 2 (5.3) 0 2 (5.3)
20 (34.5) / 4 (9.5)
EQ5D self-care
baseline All (n=57) 56 (98.2) 1 (1.8) 0 1 (1.8) 1 (1.7)
C (n=42) 41 (97.6) 1 (2.4) 0 1 (2.4) 0
6 months All (n=44) 43 (97.7) 1 (2.3) 0 1 (2.3) 14 (24.1)
C (n=40) 39 (97.5) 1 (2.5) 0 1 (2.5) 2 (4.8)
12 months All/C
(n=38) 36 (94.7) 2 (5.3) 0 2 (5.3)
20 (34.5) / 4 (9.5)
EQ5D activity
baseline All (n=57) 45 (78.9) 12 (21.1) 0 12 (12.1) 1 (1.7)
C (n=42) 33 (78.6) 9 (21.4) 0 9 (21.4) 0
6 months All (n=44) 35 (79.5) 9 (20.5) 0 9 (20.5) 14 (24.1)
C (n=40) 33 (82.5) 7 (17.5) 0 7 (17.5) 2 (4.8)
12 months All/C
(n=38) 34 (89.5) 4 (10.5) 0 4 (10.4)
20 (34.5) / 4 (9.5)
EQ5D pain
baseline All (n=57) 19 (33.3) 37 (64.9) 1 (1.8) 38 (66.7) 1 (1.7)
C (n=42) 16 (38.1) 25 (59.5) 1 (2.4) 26 (61.9) 0
6 months All (n=44) 18 (40.9) 25 (56.8) 1 (2.3) 26 (59.1) 14 (24.1)
C (n=40) 17 (42.5) 22 (55.0) 1 (2.5) 23 (57.5) 2 (4.8)
12 months All/C
(n=38) 21 (55.3) 15 (39.5) 2 (5.3) 17 (44.7)
20 (34.5) / 4 (9.5)
EQ5D anxiety
baseline All (n=57) 42 (73.7) 12 (21.1) 3 (5.3) 15 (26.3) 1 (1.7)
C (n=42) 31 (73.8) 8 (19.0) 3 (7.1) 11 (26.2) 0
6 months All (n=44) 31 (70.5) 12 (27.3) 1 (2.3) 13 (29.5) 14 (24.1)
C (n=40) 28 (70.0) 11 (27.5) 1 (2.5) 12 (30.0) 2 (4.8)
12 months All/C
(n=38) 29 (76.3) 7 (18.4) 2 (5.3) 9 (23.7)
20 (34.5) / 4 (9.5)
*All = all completers at each time point; C = only those who completed 12 month follow-up
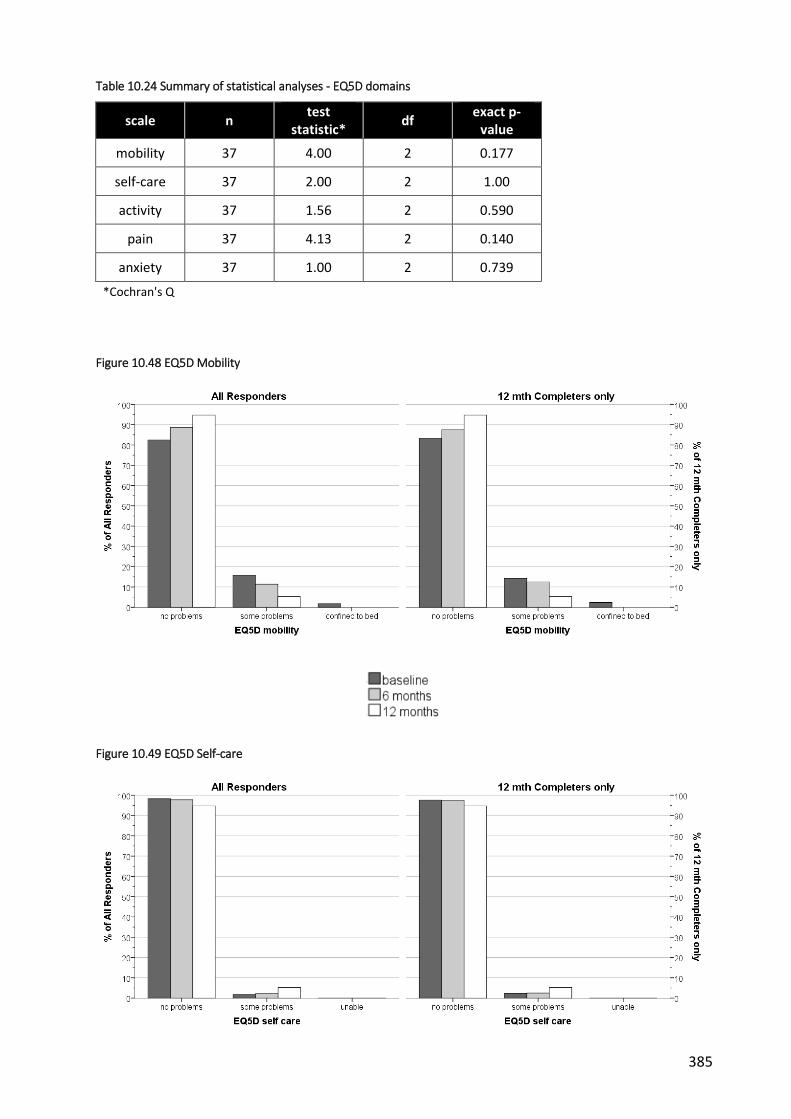
385
Table 10.24 Summary of statistical analyses - EQ5D domains
scale n test
statistic* df
exact p-value
mobility 37 4.00 2 0.177
self-care 37 2.00 2 1.00
activity 37 1.56 2 0.590
pain 37 4.13 2 0.140
anxiety 37 1.00 2 0.739
*Cochran's Q
Figure 10.48 EQ5D Mobility
Figure 10.49 EQ5D Self-care

386
Figure 10.50 EQ5D Usual activities
Figure 10.51 EQ5D Pain
Figure 10.52 EQ5D Anxiety / depression

387
Figure 10.53 EQ5D health state - All Responders histograms
Figure 10.54 EQ5D health state - 12 mth Completers only histograms

388
Figure 10.55 EQ5D health state - boxplots
Figure 10.56 EQ5D health state - means (95% CI)

389
10.3.5 Paediatric Outcomes Data Collection Instrument (PODCI)
Descriptive statistics for all scales are presented in Table 10.25 to Table 10.27 and illustrated in
Figure 10.57 to Figure 10.80. Summaries of statistical analyses are described in Table 10.28 and
Table 10.29.
10.3.5.1 Upper extremity and physical function
In general, participants scored highly on this PODCI scale with small differences between time-
points (Table 10.25). Due to the extremely-skewed nature of the data (Figure 10.57 and Figure
10.58), a 1-way Friedman’s ANOVA was performed to assess differences between time-points.
The results were statistically significant (Fr=.8.08, df=2, p=.018) indicating a difference between
time-points. Step-down follow-up analysis revealed that there was a significant increase in 12
month follow-up scores compared to baseline (effect size, rbaseline-12mths=.267) and 6 month
scores (r6mths-12mths=.214). There was no significant difference between baseline and 6 month
follow-up scores (p=.511, rbaseline-6mths=.120) (

390
Table 10.28).
Table 10.25 PODCI Upper extremity & physical function scores - descriptive statistics
PODCI Upper extremity & physical function (0 worst - 100 best)
time point
status* mean sd SE 95% CI median IQR min max missing
n (%)
baseline
All (n=57)
95.25 8.4 1.11 93.02, 97.47
100.00 93.75,
100 50 100 1 (1.7)
C (n=42)
94.94 9.54 1.47 91.97, 97.91
100.00 91.67,
100 50 100 0
6 months
All (n=44)
95.45 7.82 1.18 93.08, 97.83
100.00 92.71,
100 63 100
14 (24.1)
C (n=40)
95.21 8.09 1.28 92.62, 97.80
100.00 92.71,
100 63 100 2 (4.8)
12 months
All/C (n=38)
97.48 6.75 1.09 95.26, 99.70
100.00 100, 100
71 100 20
(34.5) / 4 (9.5)
*All = all completers at each time point; C = only those who completed 12 month follow-up
10.3.5.2 Transfers and basic mobility, Sports and physical functioning, Global function
Scoring for these three scales mirrored the high scores for the Upper extremity scale (Table
10.26). However, testing with 1-way Friedman ANOVA revealed no statistically significant
differences between time-points for any of these scales (Transfers: Fr=.241, df=2, p=.886;
Sports: Fr=.723, df=2, p=.697; Global: Fr=.298, df=2, p=.862) (Table 10.28).
Table 10.26 PODCI scale scores - descriptive statistics
PODCI Transfer & basic mobility (0 worst - 100 best)
time point
status* mean sd SE 95%
CI median IQR min max
missing n (%)
baseline
All (n=57)
97.77 3.93 0.52 96.72, 98.81
100.00 96.97,
100 80 100 1 (1.7)
C (n=42)
97.80 4.27 0.66 96.47, 99.13
100.00 96.97,
100 80 100 0
6 months
All (n=44)
97.77 3.93 0.52 96.72, 98.81
100.00 96.97,
100 80 100 1 (1.7)
C (n=40)
97.59 4.63 0.73 96.11, 99.08
100.00 96.97,
100 79 100 2 (4.8)

391
12 months
All/C (n=38)
97.37 6.56 1.06 95.21, 99.52
100.00 99.24,
100 71 100
20 (34.5) / 4 (9.5)
PODCI Sports & physical functioning (0 worst - 100 best)
baseline
All (n=57)
88.88 12.8 1.70 85.48, 92.28
91.67 84.03,
100 45.14 100 1 (1.7)
C (n=42)
90.02 11.62 1.79 86.40, 93.64
91.67 86.11,
100 56.06 100 0
6 months
All (n=44)
90.01 12.14 1.83 86.32, 93.70
94.44 88.89, 99.31
50.00 100 14
(24.1)
C (n=40)
90.63 11.95 1.89 86.81, 94.46
95.64 89.02,
100 50.00 100 2 (4.8)
12 months
All/C (n=38)
90.40 15.19 2.46 85.40, 95.39
95.83 87.5, 100
20.14 100 20
(34.5) / 4 (9.5)
PODCI Global (0 worst - 100 best)
baseline
All (n=57)
89.83 9.04 1.20 87.43, 92.22
91.39 82.95, 97.56
58.39 100 1 (1.7)
C (n=42)
90.02 9.59 1.48 87.03, 93.01
91.81 83.36, 97.80
58.39 100 0
6 months
All (n=44)
90.53 9.52 1.43 87.64, 93.42
93.54 87.72, 98.15
62.06 100 14
(24.1)
C (n=40)
90.84 9.59 1.52 87.77, 93.91
94.03 87.83, 98.32
62.06 100 2 (4.8)
12 months
All/C (n=38)
90.78 11.50 1.87 87.00, 94.56
95.58 87.58, 98.33
53.95 100 20
(34.5) / 4 (9.5)
*All = all completers at each time point; C = only those who completed 12 month follow-up
10.3.5.3 Pain/comfort and Happiness
Scoring for these two scales was lower on average than previous scales (Table 10.27). The data
was transformed (x2) to correct for skew and lack of normality prior to evaluation using a
mixed model repeat measures ANOVA as described previously. No statistically significant main
effect of time-point was revealed (Pain: F(2, 70)=0.29, p=0.746, η2=.008; Happiness: (F(2,
70)=.67, p=0.515, η2=.019), nor was there a statistically significant interaction between time-
point and arm for either of these scales (Pain: F(2, 70)=1.27, p=0.287, η2=.035; Happiness: (F(2,
70)=1.43, p=0.246, η2=.039) (Table 10.29).
Table 10.27 PODCI Pain/comfort & Happiness scores - descriptive statistics

392
time point
status* mean sd SE 95% CI median IQR min max missing n
(%)
PODCI Pain/comfort (0 worst - 100 best)
baseline
All (n=57)
77.41 19.13 2.53 72.33, 82.48
78.33 65,
93.33 32.78 100 1 (1.7)
C (n=42)
77.31 20.80 3.21 70.83, 83.80
83.61 60.56, 93.33
32.78 100 0
6 months
All (n=44)
79.27 20.87 3.15 72.92, 85.61
85.83 63.19,
100 23.33 100 14 (24.1)
C (n=40)
79.93 21.19 3.35 73.15, 86.71
86.67 65.14,
100 23.33 100 2 (4.8)
12 months
All/C (n=38)
77.88 24.18 3.92 69.93, 85.83
86.67 65.56,
95 21.67 100
20 (34.5) / 4 (9.5)
PODCI Happiness (0 worst - 100 best)
baseline
All (n=57)
73.07 25.58 3.39 66.28, 79.86
80.00 55.00, 95.00
0 100 1 (1.7)
C (n=42)
72.02 27.56 4.25 63.43, 80.61
77.50 53.75, 96.25
0 100 0
6 months
All (n=44)
71.68 28.45 4.29 63.03, 80.33
85.00 48.75, 95.00
5.00 100 14 (24.1)
C (n=40)
72.22 27.44 4.34 63.44, 80.99
85.00 48.75, 95.00
5.00 100 2 (4.8)
12 months
All/C (n=38)
76.84 22.76 3.69 69.36, 84.32
82.50 65.00, 95.00
0 100 20 (34.5) /
4 (9.5)
*All = all completers at each time point; C = only those who completed 12 month follow-up

393
Table 10.28 Summary of statistical analyses 1 - PODCI scales
analysis n test statistic, Fr df p-value
UE & Physical Function 37 8.083 2 0.018*
Transfers & basic mobility 37 0.241 2 0.886
Sports & physical functioning 37 0.723 2 0.697
Global function 37 0.298 2 0.862
* statistically significant; Fr = Friedman's ANOVA
Table 10.29 Summary of statistical analyses 2 - PODCI pain and happiness scales
analysis n interaction type (ɛ) F dfM dfR p-value effect size, η2
Pain Comfort
37
timepoint SA
(0.991)
0.29
2 70
0.746 0.008
timepoint x arm
1.27 0.287 0.035
Happiness 37
timepoint SA
(0.878)
0.67
2 70
0.515 0.019
timepoint x arm
1.43 0.246 0.039
SA = sphericity assumed (Mauchly's W); dfM = degrees of freedom (main effect); dfR = degrees of freedom (error); η2=partial eta squared

394
Figure 10.57 PODCI upper extremity & physical function - All Responders histograms
Figure 10.58 PODCI upper extremity & physical function - 12 mth Completers only histograms

395
Figure 10.59 PODCI upper extremity & physical function - boxplots
Figure 10.60 PODCI upper extremity & physical function - means (95% CI)
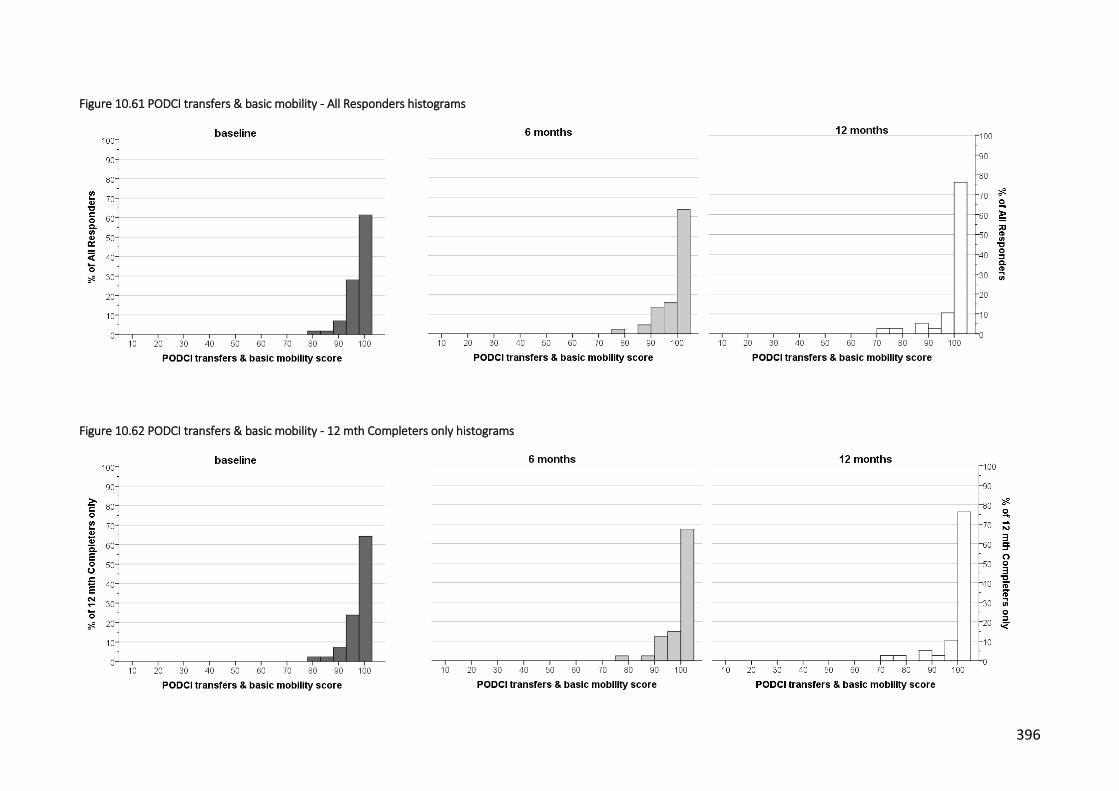
396
Figure 10.61 PODCI transfers & basic mobility - All Responders histograms
Figure 10.62 PODCI transfers & basic mobility - 12 mth Completers only histograms

397
Figure 10.63 PODCI transfers & basic mobility - boxplots
Figure 10.64 PODCI transfers & basic mobility - means (95% CI)
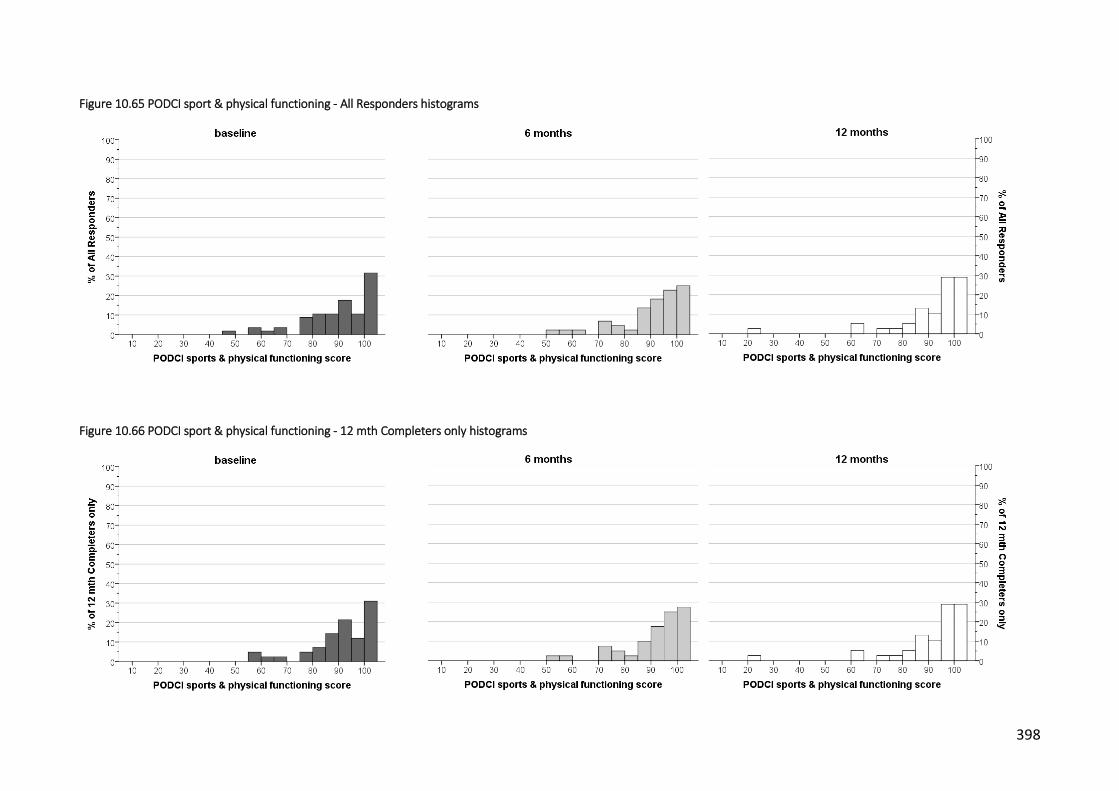
398
Figure 10.65 PODCI sport & physical functioning - All Responders histograms
Figure 10.66 PODCI sport & physical functioning - 12 mth Completers only histograms

399
Figure 10.67 PODCI Sports & physical functioning scores - boxplots
Figure 10.68 PODCI Sports & physical functioning scores - means (95% CI)

400
Figure 10.69 PODCI pain comfort - All Responders histograms
Figure 10.70 PODCI pain comfort - 12 mth Completers only histograms

401
Figure 10.71 PODCI Pain/comfort scores - boxplots
Figure 10.72 PODCI Pain/comfort scores - means (95% CI)

402
Figure 10.73 PODCI global function - All Responders histograms
Figure 10.74 PODCI global function - 12 mth Completers only histograms

403
Figure 10.75 PODCI Global function score - boxplots
Figure 10.76 PODCI Global function score - means (95% CI)

404
Figure 10.77 PODCI happiness - All Responders histograms
Figure 10.78 PODCI happiness - 12 mth Completers only histograms

405
Figure 10.79 PODCI Happiness score - boxplots
Figure 10.80 PODCI Happiness score - means (95% CI)

406
10.4 Physical measures of body schema
10.4.1 Two point discrimination
Descriptive statistics are presented in Table 10.30 and illustrated in Figure 10.81 to Figure
10.83. In general, there was a decrease in TPDT from baseline to 6 and 12 month follow-ups.
Due to lack of normality, data was transformed (square-root) prior to testing. Statistical
analysis revealed a statistically significant main effect of time-point (F(2, 42) =7.12; p=0.002;
η2=.253) (Table 10.31). Contrasts revealed that TPDT at baseline was greater than at 6 months
(F(1, 21) =8.71; p=.003; η2=.354) and 12 months (F(1, 21) =4.14; p=.018; η2=.240).
There was no statistically significant interaction between time-point and arm.
Table 10.30 TPDT - descriptive statistics
Two point discrimination threshold (mm)
time point
status* mean sd SE 95%
CI median IQR min max
missing n (%)
baseline
All (n=47)
49.10 13.25 1.93 45.20, 52.99
47.50 37.5,
60 27.50 75.00
11 (19.0)
C (n=34)
48.97 13.42 2.30 44.29, 53.65
47.50 37.5, 58.13
27.50 75.00 8 (19.0)
6 months
All (n=38)
43.95 10.34 1.68 40.55, 47.35
43.75 39.38,
50 20.00 72.50
20 (34.5)
C (n=36)
43.75 10.53 1.76 40.19, 47.31
43.75 38.13,
50 20.00 72.50 6 (14.3)
12 months
All/C (n=28)
43.48 11.75 2.22 38.93, 48.04
43.75 35, 50 27.50 82.50
30 (51.7) /
14 (33.3)
*All = all completers at each time point; C = only those who completed 12 month follow-up
Table 10.31 Two point discrimination threshold - statistical analyses
analysis n interaction type (ɛ) F dfM dfR p-value effect size, η2
TPDT (mm) 23 timepoint
SA (.961) 7.12
2 42 .002* 0.253
timepoint x arm 0.83 0.442 0.038
* = statistically significant; SA = sphericity assumed (Mauchly's W); dfM = degrees of freedom (main effect); dfR = degrees of freedom (error); η2=partial eta squared

407
10.4.2 Localisation
Descriptive statistics are presented in Table 10.32 and illustrated in Figure 10.84 to Figure
10.86. Localisation ability improved on average over time. However, analysis revealed no
statistically significant main effect of time-point (F(2, 42) =7.12; p=0.002; η2=.253), nor was
there a statistically significant interaction between time-point and trial arm condition (F(2, 42)
=7.12; p=0.002; η2=.253) (Table 10.33).
Table 10.32 Localisation - descriptive statistics
Localisation (number correct; max = 30)
time point status* mean sd SE 95%
CI median IQR min max
missing n (%)
baseline
All (n=57)
14.21 4.54 0.60 13.01, 15.41
15.00 11, 18 4.00 25.00 1 (1.7)
C (n=41)
14.66 4.55 0.71 13.22, 16.10
15.00 12, 18 4.00 25.00 1 (2.4)
6 months
All (n=44)
16.16 4.71 0.71 14.73, 17.59
15.50 13, 18 7.00 28.00 14
(24.1)
C (n=40)
16.38 4.58 0.72 14.91, 17.84
16.00 13.25,
18 8.00 28.00 2 (4.8)
12 months All/C (n=37)
16.49 5.29 0.87 14.72, 18.25
19.00 12.5,
20 6.00 25.00
21 (36.2) / 5 (11.9)
*All = all completers at each time point; C = only those who completed 12 month follow-up
Table 10.33 Localisation - statistical analyses
analysis n interaction type (ɛ)
F dfM dfR p-
value effect
size, η2
Localisation (n correct)
35
timepoint SA
(.970)
1.79
2 66
0.174 0.052
timepoint x arm 1.06 0.352 0.031
* = statistically significant; SA = sphericity assumed (Mauchly's W); dfM = degrees of freedom (main effect); dfR = degrees of freedom (error); η2=partial eta squared
408
10.4.3 Laterality discrimination (left/right judgement)
10.4.3.1 Hand accuracy
Descriptive statistics are presented in Table 10.34 and illustrated in Figure 10.87 to Figure
10.89. Accuracy in left/right judgement of hand images improved over time. Statistical analysis
revealed a statistically significant main effect of time-point (F(2, 68) =4.81; p=0.011; η2=.124) (

409
Table 10.37). Contrasts revealed that accuracy at baseline was less than at 6 months (F(1, 34)
=6.52; p=.015; η2=.161) and 12 months (F(1, 34) =9.31; p=.004; η2=.215).
There was no statistically significant interaction between time-point and arm.
Table 10.34 Laterality discrimination Hands accuracy - descriptive statistics
Laterality discrimination - Accuracy hands (% correct)
time point
status* mean sd SE 95%
CI median IQR min max
missing n (%)
baseline
All (n=58)
80.00 11.44 1.50 76.99, 83.01
80.00 73.75, 86.5
47.00 100.00 0
C (n=42)
79.98 10.96 1.69 76.56, 83.39
80.00 75, 86 47.00 100.00 0
6 months
All (n=43)
82.74 11.07 1.69 79.34, 86.15
86.00 76, 91 57.00 99.00 15(25.9)
C (n=39)
82.92 10.86 1.74 79.40, 86.44
86.00 76, 91 57.00 99.00 3 (7.1)
12 months
All/C (n=38)
85.21 9.65 1.56 82.04, 88.38
85.50 80,
92.5 52.00 100.00
20 (34.5) / 4 (9.5)
10.4.3.2 Back accuracy
Descriptive statistics are presented in Table 10.35 and illustrated in Figure 10.90 to Figure
10.92. Accuracy for left/right judgement of back images was greater than for images of the
hands on average, and a similar improvement was seen over time.
Due to the highly-skewed nature of the data (Figure 10.90), a 1-way Friedman’s ANOVA was
performed to assess differences between time-points. The results were statistically significant
(Fr13.27, df=2, p=.001) indicating an improvement with time in left/right judgement ability (
Table 10.38). Pairwise comparisons with adjusted p-values revealed that there was a
significant increase in accuracy at 12 month follow-up compared to baseline (p=.002, rbaseline-
12mths=.449) and 6 months (p=.047, r6mths-12mths=.276). There was no significant difference
between baseline and 6 month follow-up scores (p=.949, rbaseline-6mths=.216).

410
Table 10.35 Laterality discrimination Back accuracy - descriptive statistics
Laterality discrimination - Accuracy back (% correct)
time point
status* mean sd SE 95%
CI median IQR min max
missing n (%)
baseline
All (n=58)
85.72 10.96 1.44 82.84, 88.61
89.00 78.75, 93.25
47.00 99.00 0
C (n=42)
84.40 11.74 1.81 80.75, 88.06
87.50 78, 92 47.00 99.00 0
6 months
All (n=43)
87.67 10.03 1.53 84.59, 90.76
91.00 80, 96 64.00 99.00 15(25.9)
C (n=39)
87.64 10.01 1.60 84.40, 90.89
91.00 80, 96 64.00 99.00 3 (7.1)
12 months
All/C (n=38)
91.05 8.51 1.38 88.25, 93.85
94.50 86, 97 64.00 99.00 20
(34.5) / 4 (9.5)
10.4.3.3 Hand reaction times
Descriptive statistics are presented in Table 10.36 and illustrated in Figure 10.93 to Figure
10.95. Reaction time in making correct left/right judgements of images of the hand generally
improved over time. Analysis of the results revealed a statistically significant main effect of
time-point (F(2, 68) =19.85; p<0.001; η2=.369) (

411
Table 10.37). Contrasts revealed that reaction time at baseline was greater than at 6 months
(F(1, 32) =27.01; p<0.001; η2=.458) and 12 months (F(1, 32) =46.62; p<0.001; η2=.593).
There was no statistically significant interaction between time-point and arm.
10.4.3.4 Back reaction time
Descriptive statistics are presented in Table 10.36 and illustrated in Figure 10.96 to Figure
10.98. Similar trends in the data were observed for reaction times when making correct
left/right movement judgements of images of the trunk. A statistically significant main effect
was observed for time-point (F(1.68, 57.09) =36.63; p<0.001; η2=.519) (

412
Table 10.37). Contrasts revealed that there were statistically significant differences between all
time-points.
There was no statistically significant interaction between time-point and arm.
Table 10.36 Laterality discrimination reaction times - descriptive statistics
Laterality discrimination - RT hands correct (sec)
time point
status* mean sd SE 95% CI median IQR min max missing
n (%)
baseline
All (n=58)
3.17 1.26 0.17 2.83, 3.50
3.07 2.52, 3.52
1.37 9.11 0
C (n=42)
3.20 1.34 0.21 2.79, 3.62
3.07 2.58, 3.50
1.37 9.11 0
6 months
All (n=43)
2.52 0.81 0.12 2.27, 2.76
2.47 2.01, 2.94
1.16 5.73 15(25.9)
C (n=39)
2.56 0.83 0.13 2.29, 2.83
2.47 2.05, 2.98
1.16 5.73 3 (7.1)
12 months
All/C (n=38)
2.42 0.82 0.13 2.15, 2.68
2.26 1.80, 2.80
1.11 5.47 20
(34.5) / 4 (9.5)
Laterality discrimination - RT back correct (sec)
baseline
All (n=58)
2.11 0.70 0.92 1.93, 2.29
1.97 1.63, 2.28
1.07 4.43 0
C (n=42)
2.09 0.67 0.10 1.88, 2.30
1.95 1.63, 2.27
1.07 4.43 0
6 months
All (n=43)
1.65 0.45 0.07 1.51, 1.79
1.58 1.34, 1.92
1.04 3.12 15(25.9)
C (n=39)
1.66 0.46 0.07 1.51, 1.81
1.58 1.34, 1.92
1.04 3.12 3 (7.1)
12 months
All/C (n=38)
1.49 0.45 0.07 1.35, 1.64
1.38 1.24, 1.55
0.92 2.90 20
(34.5) / 4 (9.5)
*All = all completers at each time point; C = only those who completed 12 month follow-up

413
Table 10.37 Laterality discrimination - statistical analyses
analysis
n interaction type (ɛ) F dfM dfR p-value effect
size, η2
Laterality Accuracy hands
(% correct)
36
timepoint SA
(.907)
4.81 2 68
.011* 0.124
timepoint x arm
0.97 0.386 0.028
Laterality reaction time hands (msec)
36
timepoint GG
(.702)
19.85 2 68
<0.001* 0.369
timepoint x arm
0.44 0.575 0.013
Laterality reaction time back (msec)
36
timepoint HF
(.840)
36.63 1.67 57.09
<0.001* 0.519
timepoint x arm
1.52 0.229 0.043
* = statistically significant; GG/HF = Greenhouse Guisser/Huynh-Feldt estimate of sphericity; SA = sphericity assumed (Mauchly's W); dfM = degrees of freedom (main effect); dfR = degrees of freedom (error); η2=partial eta squared
Table 10.38 Laterality discrimination Accuracy Back - statistical analysis
analysis n test statistic,
Fr df p-value
Accuracy Back (% correct)
36 13.269 2 0.001
* statistically significant; Fr = Friedman's ANOVA

414
10.4.4 Line bisection
Descriptive statistics are presented in Table 10.39 and illustrated in Figure 10.99 to Figure
10.101. The percentage error in determining the midpoint of a line remained consistent at all
three time-points. This was reflected in the results of the statistical analysis (Table 10.40)
which revealed no significant main effect of time-point (F(2, 72) =1.00; p=0.374; η2=.027), nor
an interaction between time-point and trial arm (F(2, 72) =0.38; p=.687; η2=.01).
Table 10.39 Line bisection testing - descriptive statistics
Line bisection (relative error, %)
time point
status* mean sd SE 95% CI median IQR min max missing
n (%)
baseline
All (n=58)
2.28 0.80 0.10 2.07, 2.49
2.16 1.76, 2.66
1.03 4.77 0
C (n=42)
2.25 0.77 0.12 2.01, 2.49
2.10 1.79, 2.82
1.03 4.61 0
6 months
All (n=44)
2.39 0.71 0.11 2.18, 2.61
2.32 1.84, 2.75
1.26 4.07 14
(24.1)
C (n=40)
2.33 0.68 0.11 2.11, 2.55
2.25 1.80, 2.72
1.26 4.07 2 (4.8)
12 months
All/C (n=39)
2.16 0.53 0.08 1.99, 2.33
2.16 1.74, 2.56
1.27 3.37 19
(32.8) / 3 (7.1)
*All = all completers at each time point; C = only those who completed 12 month follow-up
Table 10.40 Line bisection - statistical analysis
analysis n interaction type (ɛ) F dfM dfR p-value effect
size, η2
Line bisection (% error)
38 timepoint
SA (.935)
1.00 2 72
0.374 0.027
timepoint x arm
0.38 0.687 0.01
* = statistically significant; SA = sphericity assumed (Mauchly's W); dfM = degrees of freedom (main effect); dfR = degrees of freedom (error); η2=partial eta squared

415
10.4.5 Proprioception
Descriptive statistics are presented in Table 10.41 and illustrated in Figure 10.102 to Figure
10.104. On average, there was a slight decrease in position matching error at 12 months.
However, statistical analysis revealed no significant main effect of time-point (F(2, 70) =2.66;
p=0.077; η2=.071), nor an interaction between time-point and trial arm (F(2, 70) =0.03; p=.973;
η2=.001) (Table 10.42).
Table 10.41 Trunk proprioception - descriptive statistics
Trunk proprioception (degrees)
time point
status* mean sd SE 95%
CI median IQR min max
missing n (%)
baseline
All (n=58)
10.58 5.00 0.66 9.26, 11.90
10.01 7.32, 14.01
0.00 26.26 0
C (n=42)
10.12 5.03 0.78 8.55, 11.68
9.04 6.84, 13.77
0.00 23.41 0
6 months
All (n=44)
10.10 4.94 0.74 8.59, 11.60
10.25 5.66, 12.39
1.85 23.09 14
(24.1)
C (n=40)
10.03 5.16 0.82 8.38, 11.68
10.25 5.56, 12.92
1.85 23.09 2 (4.8)
12 months
All/C (n=38)
8.28 4.87 0.79 6.68, 9.88
7.20 5.33, 10.15
2.86 29.33 20
(34.5) / 4 (9.5)
*All = all completers at each time point; C = only those who completed 12 month follow-up
Table 10.42 Trunk proprioception - statistical analyses
analysis n interaction type (ɛ)
F dfM dfR p-
value effect
size, η2
Proprioception (% error)
37
timepoint SA
(.988)
2.66
2 70
0.077 0.071
timepoint x arm
0.03 0.973 0.001
* = statistically significant; SA = sphericity assumed (Mauchly's W); dfM = degrees of freedom (main effect); dfR = degrees of freedom (error); η2=partial eta squared
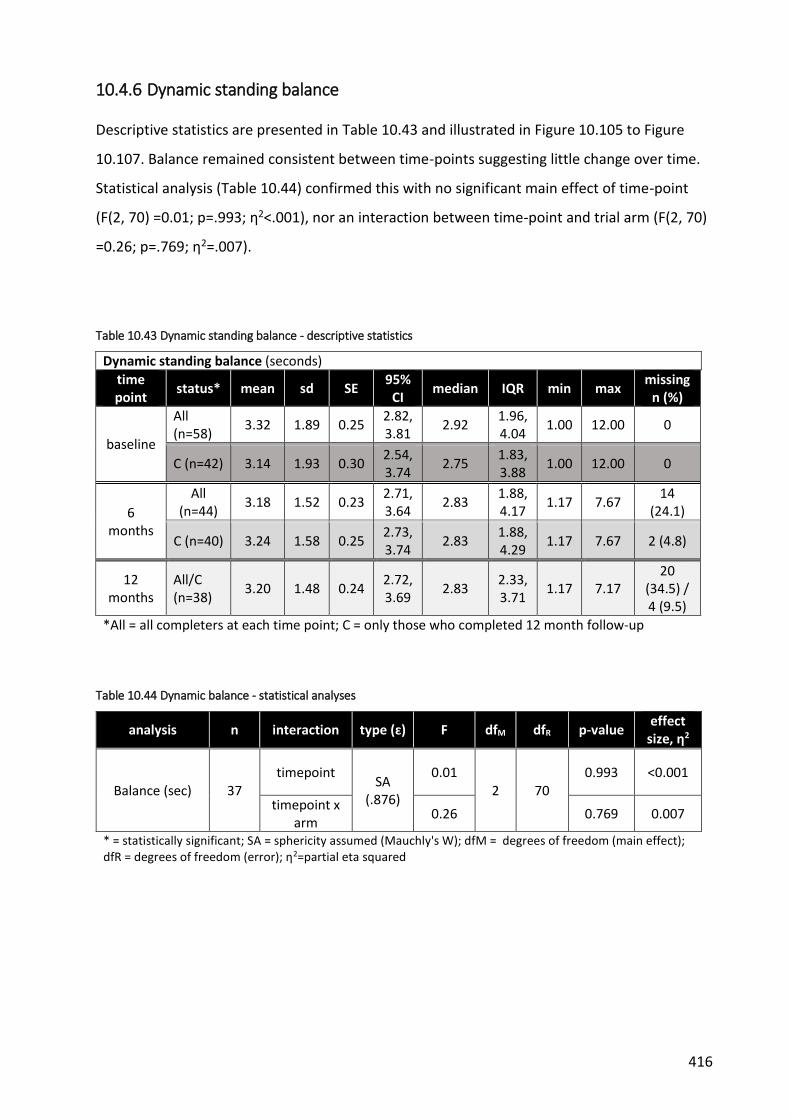
416
10.4.6 Dynamic standing balance
Descriptive statistics are presented in Table 10.43 and illustrated in Figure 10.105 to Figure
10.107. Balance remained consistent between time-points suggesting little change over time.
Statistical analysis (Table 10.44) confirmed this with no significant main effect of time-point
(F(2, 70) =0.01; p=.993; η2<.001), nor an interaction between time-point and trial arm (F(2, 70)
=0.26; p=.769; η2=.007).
Table 10.43 Dynamic standing balance - descriptive statistics
Dynamic standing balance (seconds)
time point
status* mean sd SE 95%
CI median IQR min max
missing n (%)
baseline
All (n=58)
3.32 1.89 0.25 2.82, 3.81
2.92 1.96, 4.04
1.00 12.00 0
C (n=42) 3.14 1.93 0.30 2.54, 3.74
2.75 1.83, 3.88
1.00 12.00 0
6 months
All (n=44)
3.18 1.52 0.23 2.71, 3.64
2.83 1.88, 4.17
1.17 7.67 14
(24.1)
C (n=40) 3.24 1.58 0.25 2.73, 3.74
2.83 1.88, 4.29
1.17 7.67 2 (4.8)
12 months
All/C (n=38)
3.20 1.48 0.24 2.72, 3.69
2.83 2.33, 3.71
1.17 7.17 20
(34.5) / 4 (9.5)
*All = all completers at each time point; C = only those who completed 12 month follow-up
Table 10.44 Dynamic balance - statistical analyses
analysis n interaction type (ɛ) F dfM dfR p-value effect
size, η2
Balance (sec) 37 timepoint
SA (.876)
0.01 2 70
0.993 <0.001
timepoint x arm
0.26 0.769 0.007
* = statistically significant; SA = sphericity assumed (Mauchly's W); dfM = degrees of freedom (main effect); dfR = degrees of freedom (error); η2=partial eta squared

417
Figure 10.81 TPDT - histograms

418
Figure 10.82 TPDT - boxplots
Figure 10.83 TPDT - means (95% CI)

419
Figure 10.84 Localisation - histograms

420
Figure 10.85 Localisation - boxplots
Figure 10.86 Localisation - means (95% CI)

421
Figure 10.87 Laterality discrimination - Hands accuracy histograms

422
Figure 10.88 Laterality discrimination Hands accuracy - boxplots
Figure 10.89 Laterality discrimination Hands accuracy - means (95% CI)

423
Figure 10.90 Laterality discrimination Back accuracy - histograms

424
Figure 10.91 Laterality discrimination Back accuracy - boxplots
Figure 10.92 Laterality discrimination Back accuracy - means (95% CI)

425
Figure 10.93 Laterality discrimination Reaction time Hands - histograms

426
Figure 10.94 Laterality discrimination Reaction time Hands - boxplots
Figure 10.95 Laterality discrimination Reaction time Hands - means (95% CI)

427
Figure 10.96 Laterality discrimination Reaction time Back - histograms

428
Figure 10.97 Laterality discrimination Reaction time Back - boxplots
Figure 10.98 Laterality discrimination Reaction time Back - means (95% CI)

429
Figure 10.99 Line bisection - histograms

430
Figure 10.100 Line bisection - boxplots
Figure 10.101 Line bisection - means (95% CI)

431
Figure 10.102 Proprioception - histograms
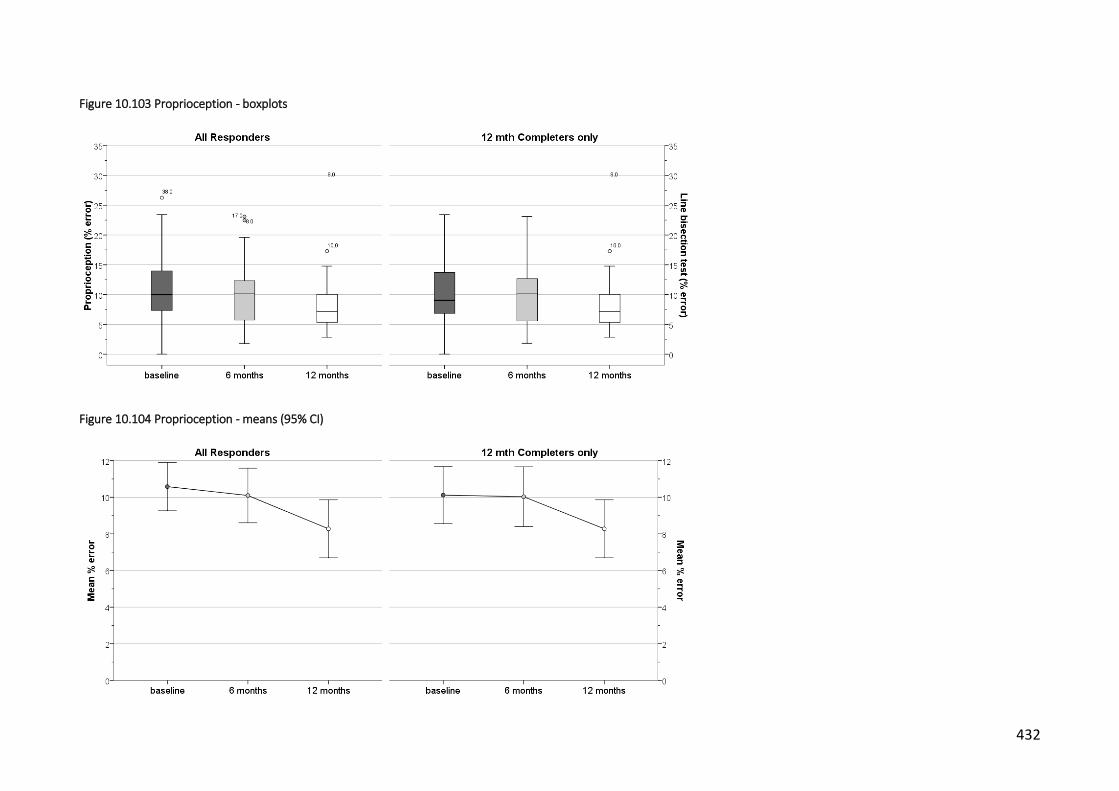
432
Figure 10.103 Proprioception - boxplots
Figure 10.104 Proprioception - means (95% CI)

433
Figure 10.105 Dynamic standing balance - histograms

434
Figure 10.106 Dynamic standing balance - boxplots
Figure 10.107 Dynamic standing balance - means (95% CI)

435
10.5 Correlations
Scatter plots were drawn and correlation coefficients calculated to determine potential
relationships between spinal deformity and measures of body schema. Cobb angle was used as
the measure of spinal deformity. As well as examining relationships with measures of body
schema, self-report measures that showed significant relationships with spinal deformity in the
cross-sectional correlation study described in chapters 7 and 8 were also analysed. This
included the SAQ and KPAQ. Only those plots showing significant correlations are illustrated.
10.5.1 Cobb angle v measures of body schema
Scatterplots that suggested possible relationships between Cobb angle and measures of body
schema at 6 and 12 months are presented in
436
Figure 10.108. Baseline plots are also included to provide context. The plots indicate a linear
relationship between Cobb angle and localisation ability suggesting that the number of correct
responses decreased with increasing Cobb angle.
Calculation of correlation coefficients revealed a weak negative correlation between Cobb
angle and localisation at 6 months which was statistically significant (r=-.388, 95% CI -.631, -
.137, p=0.021) (Table 10.45). Cobb angle shared 15.1% of variability with localisation ability
(r2=0.151). A moderate negative correlation was also revealed at 12 months which was on the
border of statistical significance (r=-.442, 95% CI -.700, -.044, p=0.051). Correlation coefficients
at 6 and 12 months had wide 95% confidence intervals.
No other observable or statistically significant correlations were noted between Cobb angle
and other measures of body schema. Partial correlations revealed no changes in these results
when age and disease duration were controlled for. Trial arm and puberty status also failed to
exhibit any significant relationship with spinal deformity and measures of body schema with
point-biserial correlation testing.

437
Table 10.45 Correlations - Cobb angle v body schema measures
Cobb angle (o)
TPDT Localisation Proprioception Line
Bisection Laterality
Standing balance
mm n correct absolute error (%) absolute error (%)
Accuracy Hands (%)
Reaction time Hands
(msec)
Accuracy back (%)
Reaction time Back
(msec) seconds
6 month follow up
Pearson Correlation
.008 -.388* -.196 -.150 -.106 -0.288¥ 0.175¥ -0.061¥ 0.001¥
p-value .962 .021 .259 .388 .546 .079 .292 .714 .997
BCa 95% Confidence Intervals§
-.265 -.631 -.487 -.467 -.505 -.581 -.217 -.368 -.325
.277 -.137 .075 .181 .321 .035 .541 .263 .341
n 35 35 35 35 35 38 38 38 38
12 month follow up
Pearson Correlation
-0.132¥ -.442 -0.409¥ -.029 -0.063¥ -0.383¥ 0.013¥ 0.123¥ -0.303¥
p-value .580 .051 .073 .905 .793 .096 .957 .606 .193
BCa 95% Confidence Intervals§
-.709 -.700 -.779 -.359 -.484 -.820 -.388 -.405 -.787
.449 -.044 .098 .298 .364 .123 .398 .596 .275
n 20 20 20 20 20 20 20 20 20
* statistically significant; § bootstrap (1000 samples) Bias Corrected accelerated 95% CIs; ¥ Spearman's rho

438
Figure 10.108 Scatterplots - Cobb angle v Localisation ability

439
10.5.2 Cobb angle v other measures
Scatterplots of KPAQ and SAQ scales v Cobb angle at 6 and 12 months were reviewed but only
the SAQ appearance scale appeared to suggest any relationship (Figure 10.109). A statistically
significant weak positive correlation was revealed at 6 months (r=.385, 95% CI .043, .693,
p=0.016) and 12 months (r=.364, 95% CI .11, .680, p=.044) (Table 10.46).Cobb angle shared
14.8% and 13.2% of the variability at 6 and 12 months respectively (r2=0.148 and 0.132).
Confidence intervals for the correlation coefficient were again very wide.
Partial correlations revealed no changes in these results when age and disease duration were
controlled for. Trial arm and puberty status also failed to exhibit any significant relationship
with spinal deformity and measures of body schema with point-biserial correlation testing.
Table 10.46 Correlations - Cobb v SAQ and KPAQ
SAQ KPAQ
Cobb angle (o)
appearance expectation total total
6 months
Pearson Correlation
.385* .032 .248 .130
p-value .016 .847 .128 .429
BCa 95% Confidence Intervals§
.043 -.285 -.095 -.201
.693 .355 .558 .588
n 39 39 39 39
12 months
Pearson Correlation
.364* .144 .297 .223
p-value .044 .438 .105 .228
BCa 95% Confidence Intervals§
.011 -.244 -.056 -.090
.680 .497 .636 .503
n 31 31 31 31
* statistically significant; § bootstrap (1000 samples) Bias Corrected accelerated 95% CIs

440
Figure 10.109 Scatterplots - Cobb angle v SAQ appearance

441
10.6 Summary
10.6.1 Spinal deformity
On average, there was very little change in the degree of spinal deformity over the study
period of 1 year. The Cobb angle decreased by 3-4 degrees on average between baseline and
12 months but this decrease was not statistically significant. It also does not appear to be of
any clinical significance falling as it does within the margin of measurement error. Changes of
at least 5-10 degrees are normally required before a genuine change in Cobb angle is
determined to have taken place [1]. The implications of this when attempting to determine
whether changes in spinal deformity are associated with change in other variables are obvious.
10.6.2 Body schema measures
Only two measures of body schema showed any statistically significant change over the 12
month study period. However, it is unclear if these differences are of clinical significance.
TPDT reduced by between 3.5 to 4mm from baseline to 12 month follow-up, the small changes
over time reflected in the small effect sizes. Previous studies have reported that changes of at
least 13-17mm would be required to provide 95% reliability of a true difference in TPDT in the
spine [2, 3].
Left/right judgement accuracy (for both images of the hand and trunk) improved by
approximately 5% over time with corresponding reductions in the reaction time of 0.5 to 1
seconds. These were associated with small to moderate effect sizes. There are no previous
reports of what constitutes a clinically significant effect for these parameters. Potential issues
with test reliability have been documented with contrasting opinions provided by different
studies [4, 5]. A learning effect has also been reported in laterality discrimination testing with
accuracy improvements of 3% and reductions in reaction time of between 8-20% previously
documented [5, 6].
Neither TPDT nor laterality discrimination testing were found to correlate with measures of
spinal deformity at either 6 months or 12 months.

442
10.6.3 Other measures
A number of self-report measures used in this study exhibited statistically significant changes
over time. The KPAQ improved by approximately 2-3 points between baseline and 2 months,
the small change reflected by the small effect size. Due to the lack of previous studies using
this measure, it is difficult to determine if this change represents a meaningful clinical
difference in kinaesthetic and proprioceptive awareness. These factors are also known to
improve in children as they develop and mature [7].
Changes in the SRS-22r pain scale and the PODCI upper extremity & physical function scale
were also observed over time in this study. However, the magnitude of the changes was very
small with small effect sizes. The change in the SRS-22r pain scale did not reach previously
reported thresholds for minimum detectable change and were close to the reported margins
of error [8, 9].
None of these measures were associated with changes in spinal deformity at either the 6 or 12
month follow-up. The SAQ appearance scale did reveal a weak negative correlation indicating
that there is some relationship between perception of trunk deformity and changes in spinal
deformity.
10.6.4 Limitations
A number of limitations may have affected the results of this study. Firstly, the number of
participants who failed to complete testing at all time-points, resulting in missing data, may
have compromised the ability of statistical testing to evaluate any changes in the study
measures. Descriptive statistics were calculated in an attempt to try and quantify any
differences in baseline characteristics between those who completed and those who didn’t.
Although some differences were evident, these were generally small in nature. However,
participants that dropped out of the study tended to be slightly younger and therefore, had
the greatest potential for progression of the spinal deformity. Descriptive statistics were also
presented to evaluate the difference between participants who completed 12 month follow-
up versus all the participants who had data available. In general, the differences between them
was small and of doubtful clinical significance.
A further complication related to collecting data for this study from participants who were
simultaneously involved in a pilot RCT and therefore undergoing different treatment

443
interventions. Attempts were made to control for this in the statistical analysis and, in general,
trial arm allocation had no effect on the results.
Spinal deformity did not change to any significant degree during the course of this study. This
is in accordance with the natural history of AIS as only a small percentage of people with AIS
undergo major changes. This means that establishing relationships between changes in spinal
deformity and other measures over time is difficult. The lack of changes in measures of body
schema observed in this study may simply reflect that the spinal deformity itself did not
change, and not necessarily rule out the possibility of their being a relationship. However, the
lack of correlation between spinal deformity measures and body schema at all time-points
does counter this argument to some extent.
Finally, in common with all observational studies, this study can only evaluate possible
associations between variables. It cannot establish the causal nature of any relationship
therefore the results of this study should be viewed from this perspective. However, the fact
that no significant relationships have been observed suggests that it is unlikely that using other
study designs would be likely to result in any differences in results.
10.6.5 Conclusion
The objective of this study was to ascertain whether any relationship exists between changes
in mechanisms thought to underpin body schema and progression of the spinal deformity in
AIS over time. The results indicate that some measures of body schema did change over the 12
month period in which they were assessed. However, these changes were not matched by any
significant corresponding changes in spinal deformity. Correlational analysis also revealed the
lack of any relationship between measures of body schema and spinal deformity at both the 6
month and 12 month follow-up, further confirming the lack of apparent association between
them. These follow-up results reflect the results of the earlier cross sectional study conducted
as part of this thesis and documented in chapter 7.
A relationship between measures of perceived spinal/trunk deformity (SAQ scales) was
observed over time, again mirroring the results of the earlier study. This suggests that in
people with AIS, perceptions of the level of spinal deformity are associated with the actual
magnitude of those changes, at least as measured radiologically by the Cobb angle.

444
In conclusion, and despite the limitations described previously, the results of this study suggest
that there is no relationship between changes in measures thought to underpin body schema
and progression of the spinal deformity in people with AIS.

445
11 Discussion
This thesis set out to determine whether body schema is implicated in the development of
adolescent idiopathic scoliosis. It sought to do so by investigating the following research
questions:
1. do adolescents with AIS differ from non-scoliotic adolescents with regard to
mechanisms that are thought to underpin body schema?
2. in adolescents with AIS, is there any relationship between the mechanisms thought to
underpin body schema and the magnitude of spinal deformity?
3. is there any relationship between changes in body schema and progression of the
spinal deformity in AIS over time?
11.1 Body schema and adolescent idiopathic scoliosis
For research question 1, a case-control study was conducted to investigate whether there
were any differences between people with AIS and non-scoliotic controls with regard to
measures of mechanisms underpinning body schema. Of the 9 parameters tested, only 3
resulted in statistically significant differences between groups, all of which were very small
with correspondingly small effect sizes, and unlikely to be of meaningful clinical significance.
The potential relationship between the magnitude of spinal deformity in people with AIS (as
determined radiographically and by surface topography) and measures of body schema was
evaluated for research question 2. A cross-sectional correlational analysis failed to detect any
association between spinal deformity and body schema measures. The apparent lack of any
relationship was confirmed by the longitudinal analyses conducted to assess changes over time
(research question 3). Despite changes in a number of measures of body schema between
time-points, there was no corresponding change in measures of spinal deformity. The lack of
correlation between spinal deformity and body schema measures at 6 and 12 month follow-
ups confirmed the earlier analyses conducted at baseline.
Taken all together, the reviews and analyses conducted as part of this thesis have produced
results that do not appear to be consistent with the guidelines of causality as proposed by
Bradford-Hill [ref]. There does not appear to be a strong relationship between measures of
body schema and AIS (as shown by the systematic review), there is little to no consistency in

446
results across a multitude of studies examining a variety of neurophysiological measures in AIS
(systematic review), and there does not appear to be any specificity or biological gradient
between measures of body schema and AIS (from correlational study of body schema versus
spinal deformity and longitudinal analyses). In the absence of any information regarding
temporality and coherence with other studies, we are left with biological plausibility and
analogy (in this case, the results of studies suggesting the role of body schema in certain
chronic pain conditions).
Therefore, with regards to the results of the studies and analyses conducted for this thesis,
there does not appear currently to be any evidence to associate disruptions in body schema
with the development of AIS.
11.2 Other measures and adolescent idiopathic scoliosis
As part of the case-control study, a number of clinically significant between-group differences
were observed in other self-report measures such as perceived trunk symmetry and HRQoL,
including pain, self-image and function. These differences indicated that on average, people
with AIS perceive greater levels of trunk asymmetry and deformity, as well as experiencing
greater prevalence and severity of pain, lower self-image and reduced function compared to
people without AIS.
11.2.1 Perceived trunk symmetry/deformity
It is perhaps not surprising that people with AIS would perceive their trunk to be substantially
different than those without AIS. They have a condition that may involve significant skeletal
deformity with associated cosmetic changes to the spine and trunk. The imaging data collected
as part of this project confirms that participants had sizeable bony changes, with the majority
categorised with moderate AIS. Depending on the time since diagnosis, they may also have
been monitored for a considerable period, each review potentially involving some form of
imaging or other assessment. Therefore, not only do they have spinal/trunk asymmetries, they
are also well aware of the state of their condition and the magnitude of any deformity and
subsequent changes. This is highlighted by the results of the correlational analyses conducted
at all time-points which showed weak but statistically significant positive relationships
between the SAQ and spinal deformity.

447
11.2.2 Self image
As with perceptions of trunk deformity, it is also not unusual that people with AIS have lower
self-image than people without AIS, especially when measured using a condition-specific
instrument such as the SRS-22r. It is perhaps compounded by the fact that AIS occurs at an age
when children become increasingly body-conscious and more sensitive to differences with
peers. The knowledge that the condition may progress could potentially also influence their
beliefs with regard to self-image. However, it is interesting to note that ratings of self-image
did not appear to be related to measures of spinal deformity as analysed in research questions
2 and 3. In other words, as spinal deformity increased there was not a corresponding decrease
in self-image scores, with the two parameters varying independently of each other.
However, a relationship was observed between perceived spinal deformity (as measured by
the SAQ) and self-image. Although distinct concepts, it is inevitable that they will be inter-
related to some extent in a condition where the major implication is the cosmetic changes that
occur as a result of the bony changes in the spine. What is interesting to note is that it is the
perceived rather than the actual magnitude of spinal deformity that appears to have the
greatest association with the self-image of people with AIS.
Previous studies have reported similar correlations between the SAQ and self-image [1, 2].
However, they also reported similar relationships with actual spinal deformity as measured by
the Cobb angle, which was not found in this study. Both of these studies included participants
with curves of greater magnitude which may explain the differences between their results and
those of this thesis. One of the studies [2] also included participants with other forms of
scoliosis.
11.2.3 Pain
Despite the characteristic presence of bony deformity and associated soft-tissue changes, the
general clinical consensus is that back pain is not a major feature of AIS and that reports of
pain merely reflect the normal prevalence figures for back pain in the wider adolescent
population [3]. However, in the case control study conducted as part of this thesis, 2/3 of the
participants with AIS reported some pain compared to only 15% of the control participants.
Case participants also scored significantly worse on the various pain scales included in the
study. These findings are consistent with other reports suggesting that pain, along with

448
cosmetic changes, is of major concern amongst people with AIS [4, 5]. Despite these
observations, the results of the correlational analyses conducted to evaluate research question
2 highlight that pain was not associated with the any of the parameters of spinal deformity. It
is possible that the diagnosis of AIS itself and/or cosmetic concerns may be of greater clinical
significance with regard to pain.
Evidence for this is provided by the correlational analyses conducted in chapter 8 which
highlight the association between two of the three pain measures and perceived spinal
deformity as measured by the SAQ. This suggests that the actual physical changes in the spine
are not the primary driver of the pain experienced by people with AIS. Rather it is the
perception of spinal deformity that appears to be more closely associated with pain in AIS.
11.2.4 Function
Function scores were generally lower for participants with AIS compared to their non-scoliotic
counterparts, although between-group differences were smaller than for pain and self-image.
This finding is notable as AIS is not generally associated with any significant functional deficits,
especially amongst those with mild to moderate scoliosis such as the majority of participants in
this study. Again, no association was observed between the magnitude of spinal deformity and
any of the function measures. Therefore, self-reported functional ability in people with AIS is
lower than people without AIS and this reduction in perceived function is not associated with
the actual degree of spinal deformity.
It is interesting to note that the reduction in function scores from self-report measures also
does not appear to reflect the various neurophysiological function measures tested as part of
the observational study. No major differences in proprioception, balance, spatial awareness or
tactile acuity were reported by AIS participants, yet AIS participants considered themselves to
be less able to enjoy normal function than control participants, albeit only by a small amount.
Correlational analyses conducted in chapter 8 suggest that the reduced functional ability
reported by people with AIS may be related to the perception of spinal deformity. Although
the results suggest a much weaker relationship than with self-image and pain, the findings of
these analyses indicate that a modest association exists between these domains. These results
need to be interpreted with some caution as sizeable ceiling effects were recorded for some of
the measures of function used in this thesis. . Similar problems have been previously reported
449
when using these measures of function in AIS [6]. The binary nature of the mobility and usual
activity scales of the EQ5D as used in the analyses conducted as part of this thesis, along with
the relatively low numbers of people reporting problems, also means that the observed
relationship between function and perceived spinal deformity is less than robust.
11.3 Limitations
A number of limitations have already been discussed in the relevant chapters pertaining to the
studies and analyses conducted as part of this research project. The principal limitation is the
problem of proving causality when conducting observational studies. However, in the case of
this project, no significant associations were observed with regard to the primary hypotheses,
although some associations have been detected between perceived spinal deformity and other
parameters as part of secondary-analyses. The findings related to these would need to be
investigated further using more robust study designs before any definitive judgements can be
made as to their veracity.
Another potential limitation is the type of testing that was used to collect data as part of this
thesis. This may have resulted in a true relationship between body schema and the
development of AIS failing to be detected. Specifically, evaluation using instruments and
methods with greater precision may have led to different results. Testing of body schema has
previously involved assessment with brain imaging and sophisticated equipment in a
laboratory-type environment. However, the practicalities of conducting a case control study
within the constraints of a PhD project have meant that these resources were not available,
particularly in a multi-site study such as that conducted as part of this thesis. The test regime
utilised in this research project was similar to that used previously in other conditions, notably
when testing body schema in chronic pain. The results were also, in the main, consistent with
those reported from other trials where these techniques were used.
A further limitation was the attrition rate that occurred over the 12 month follow-up period
which resulted in missing data. A lower attrition rate would result in greater confidence in the
results of the longitudinal analyses and lead to greater precision. Attempts to evaluate the
effects of the missing follow-up information were described in chapter 10, and descriptive
statistics were calculated to compare the results of those who completed all time-points with
those from all responders at each time point. The high attrition rate was largely due to

450
problems at one recruitment site, and did not appear to be related to people with AIS in
general. However, future studies would need to be aware of the potential for high attrition
rates and plan accordingly in order to minimise the effect of missing data.
In addition to these, this research project followed people with AIS for 12 months. AIS is a
condition that generally develops during the growth spurt associated with puberty and the
potential for progression continues until skeletal maturity up to 5-6 years later. In order to
capture the entirety of any changes in spinal deformity as well as other parameters, follow-up
should continue until physical growth has stopped. The possibility exists that an association
between body schema and spinal deformity was not detected due to the short time scale that
this study involved. Related to this is the fact that only a small percentage of people with AIS
progress to a point where they suffer from significant spinal deformity. As well as not
following-up for a longer period, the relatively small numbers of people with AIS recruited as
part of this research project may have been insufficient to detect any changes by virtue of
there not being enough participants who go on to develop significant spinal deformity. The
inclusion of prevalent cases, who may have already undergone all the changes they will ever
experience, may also have disguised a true effect of a disrupted body schema on AIS.
Finally, some of the characteristics of the people with AIS that were involved in this research
project were not typical of those reported previously in other studies. For example, the study
cohort reported, on average, higher prevalence and levels of pain as well as lower self-image
than described by other studies. The self-reported ratings for these parameters were more in
line with previous studies of people with greater levels of spinal deformity [1, 7-12]. It is
possible that the people with AIS included in this research project were experiencing more
problems than would be typically expected and that this was a significant factor in their
willingness to be involved in this study with a subsequent impact on the results. People with
AIS with similar levels of spinal deformity but with less concern or fewer problems may have
had less incentive to take part.
11.4 Future directions
There is no evidence from this thesis to support the role of a disrupted body schema in the
development of AIS. Therefore, unless new evidence is provided to the contrary, this avenue of
investigation does not appear worthwhile pursuing further. Greater emphasis can be focussed

451
on other more promising factors that may be involved although it is likely that the cause(s) are
multi-factorial.
Potentially more important in the short-to-medium term, is to investigate further some of the
issues that arose from the secondary analyses. The principal objective in evaluating the
possible relationship between body schema and AIS was to design novel methods of therapy
as an alternative to the limited, costly and invasive treatments currently available. Although
the results of this project indicate that treatment aimed at normalising body schema is not
justified, the relationships between perceived spinal deformity and aspects of HRQoL do
provide potential avenues of investigation that may lead to the development of alternative
methods of dealing with this condition. Altering the AIS patient’s perception of their spinal
condition may prove to be as fruitful as altering the structure of the spine itself, especially
amongst those with mild to moderate scoliosis whose physical condition does not warrant
more extreme treatment methods such as surgery, but whose perception of their condition
has an impact on other aspects of their life.
11.5 Conclusion
This thesis set out to evaluate the role of body schema in the development of AIS. The results
of the studies and analyses conducted as part of this thesis do not provide any evidence to
support this hypothesis and therefore suggest that a disrupted body schema is not associated
with AIS.
Although not the main focus of this project, differences in perceived spinal deformity and
HRQoL were observed in people with AIS compared to non-scoliotic controls. Interestingly, the
differences in pain, self-image, and function were not related to the level of actual spinal
deformity, suggesting that the physical changes associated with the condition itself were not
the important factors. Rather, the knowledge or perception of their condition appeared to be
the main drivers of the observed reductions in self-reported function and self-image and the
increased prevalence and severity of pain. This has important implications in the management
of people with AIS.

452
Body schema in adolescent idiopathic scoliosis
Peter J Heine
A thesis presented for the degree of
Doctor of Philosophy
Volume II of II
Department of Health Sciences
University of Warwick
UK
May 2019

453
References
Introduction
[1] Bradford Hill, A., 1965, “The environment and disease: association or causation?,” Proc R
Soc Med. May;58, pp295-300.
Chapter 1
[1] Kouwenhoven, J. W., and Castelein, R. M., 2008, "The pathogenesis of adolescent idiopathic scoliosis: review of the literature," Spine (Phila Pa 1976), 33(26), pp. 2898-2908.
[2] ScoliCare, 2017. http://scoliroll.com/thoracic/. Access year:2017.
[3] Study Force, "The planes of the body." http://biology-
forums.com/index.php?action=gallery;sa=view;id=8747. Access year: 2017.
[4] Fairbank, J., 2004, "Historical perspective: William Adams, the forward bending test, and the spine of Gideon Algernon Mantell," Spine (Phila Pa 1976), 29(17), pp. 1953-1955.
[5] Children’s Healthcare of Atlanta Inc., "Scoliosis." https://www.choa.org/medical-
services/orthopaedics/scoliosis-and-spine-program/scoliosis. Access year: 2017.
[6] Weinstein, S. L., Dolan, L. A., Cheng, J. C., Danielsson, A., and Morcuende, J. A., 2008, "Adolescent idiopathic scoliosis," Lancet, 371(9623), pp. 1527-1537.
[7] Cobb, J., 1948, "Outline for the study of scoliosis.," Am Acad Orthop Surg Instr Course Lect., 5, pp. 261-275.
[8] Weinstein, S. L., 1999, "Natural history," Spine (Phila Pa 1976), 24(24), pp. 2592-2600.
[9] Oxborrow, N. J., 2000, "Assessing the child with scoliosis: the role of surface topography," Arch Dis Child, 83(5), pp. 453-455.
[10] Berryman, F., Pynsent, P., Fairbank, J., and Disney, S., 2008, "A new system for measuring three-dimensional back shape in scoliosis," Eur Spine J, 17(5), pp. 663-672.
[11] Romano, M., Minozzi, S., Bettany-Saltikov, J., Zaina, F., Chockalingam, N., Kotwicki, T., Maier-Hennes, A., and Negrini, S., 2012, "Exercises for adolescent idiopathic scoliosis," Cochrane Database Syst Rev, 8, p. CD007837.
[12] Richardson, M., "Online musculoskeletal radiology book." Department of Radiology, University of Washington. Access year: 2017.
[13] learnneurosurgery.com, 2016, "Scoliosis," www.learnneurosurgery.com/scoliosis.html. Access year: 2017.
[14] National Health Service UK, 2016, "Scoliosis," www.nhs.uk/Conditions/Scoliosis/Pages/Causes.aspx. Access year: 2017
[15] Scoliosis Research Society, 2016, "Scoliosis," http://www.srs.org/patients-and-families/conditions-and-treatments/parents/scoliosis. Access year: 2017.

454
[16] Konieczny, M. R., Senyurt, H., and Krauspe, R., 2013, "Epidemiology of adolescent idiopathic scoliosis," J Child Orthop, 7(1), pp. 3-9.
[17] Stirling, A. J., Howel, D., Millner, P. A., Sadiq, S., Sharples, D., and Dickson, R. A., 1996, "Late-onset idiopathic scoliosis in children six to fourteen years old. A cross-sectional prevalence study," J Bone Joint Surg Am, 78(9), pp. 1330-1336.
[18] Wong, H. K., Hui, J. H., Rajan, U., and Chia, H. P., 2005, "Idiopathic scoliosis in Singapore schoolchildren: a prevalence study 15 years into the screening program," Spine (Phila Pa 1976), 30(10), pp. 1188-1196.
[19] Ueno, M., Takaso, M., Nakazawa, T., Imura, T., Saito, W., Shintani, R., Uchida, K., Fukuda, M., Takahashi, K., Ohtori, S., Kotani, T., and Minami, S., 2011, "A 5-year epidemiological study on the prevalence rate of idiopathic scoliosis in Tokyo: school screening of more than 250,000 children," J Orthop Sci, 16(1), pp. 1-6.
[20] Span, Y., Robin, G., and Makin, M., 1976, "Incidence of scoliosis in school children in Jerusalem.," J Bone Joint Surg [Br], 58-B.
[21] Soucacos, P. N., Soucacos, P. K., Zacharis, K. C., Beris, A. E., and Xenakis, T. A., 1997, "School-screening for scoliosis. A prospective epidemiological study in northwestern and central Greece," J Bone Joint Surg Am, 79(10), pp. 1498-1503.
[22] Morais, T., Bernier, M., and Turcotte, F., 1985, "Age- and sex-specific prevalence of scoliosis and the value of school screening programs," Am J Public Health, 75(12), pp. 1377-1380.
[23] O'Brien, J., and van Akkerveeken, P., 1977, "School screening for scoliosis. Results of a pilot study.," Practitioner, 219.
[24] Robitaille, Y., Villavicencio-Pereda, C., and Gurr, J., 1984, "Adolescent idiopathic scoliosis: epidemiology and treatment outcome in a large cohort of children six years after screening," Int J Epidemiol, 13(3), pp. 319-323.
[25] do Espírito Santo, A., Guimarães, L. V., and Galera, M. F., 2011, "[Prevalence of idiopathic scoliosis and associated variables in schoolchildren of elementary public schools in Cuiabá, state of Mato Grosso, 2002]," Rev Bras Epidemiol, 14(2), pp. 347-356.
[26] Dickson, R. A., Stamper, P., Sharp, A. M., and Harker, P., 1980, "School screening for scoliosis: cohort study of clinical course," Br Med J, 281(6235), pp. 265-267.
[27] Smyrnis, P. N., Valavanis, J., Alexopoulos, A., Siderakis, G., and Giannestras, N. J., 1979, "School screening for scoliosis in Athens," J Bone Joint Surg Br, 61-B(2), pp. 215-217.
[28] Dickson, R. A., 1983, "Scoliosis in the community," Br Med J (Clin Res Ed), 286(6379), p. 1745.
[29] Suh, S. W., Modi, H. N., Yang, J. H., and Hong, J. Y., 2011, "Idiopathic scoliosis in Korean schoolchildren: a prospective screening study of over 1 million children," Eur Spine J, 20(7), pp. 1087-1094.
[30] de Souza, F. I., Di Ferreira, R. B., Labres, D., Elias, R., de Sousa, A. P., and Pereira, R. E., 2013, "Epidemiology of adolescent idiopathic scoliosis in students of the public schools in Goiânia-GO," Acta Ortop Bras, 21(4), pp. 223-225.
[31] Lonstein, J. E., 2006, "Scoliosis: surgical versus nonsurgical treatment," Clin Orthop Relat Res, 443, pp. 248-259.

455
[32] Office of National Statistics, 2009, "Mid 2009 population estimates: Great Britain; estimated resident population by single year of age and sex." https://www.ons.gov.uk/peoplepopulationandcommunity/populationandmigration/populationestimates. Access date: 2017
[33] Rushton, P. R., and Grevitt, M. P., 2013, "Comparison of untreated adolescent idiopathic scoliosis with normal controls: a review and statistical analysis of the literature," Spine (Phila Pa 1976), 38(9), pp. 778-785.
[34] Scoliosis Association UK, 2016, "Scoliosis information," http://www.sauk.org.uk/scoliosis-information/scoliosis-information. Access year: 2017.
[35] Thompson, J., Williamson, E., Williams, M., Heine, P., Lamb, S., and Group, A. S., 2017, "The effectiveness of scoliosis-specific exercises for adolescent idiopathic scoliosis compared to other non-surgical interventions: A systematic review and meta-analysis," awaiting publication.
[36] Wong, M. S., Cheng, J. C., Lam, T. P., Ng, B. K., Sin, S. W., Lee-Shum, S. L., Chow, D. H., and Tam, S. Y., 2008, "The effect of rigid versus flexible spinal orthosis on the clinical efficacy and acceptance of the patients with adolescent idiopathic scoliosis," Spine (Phila Pa 1976), 33(12), pp. 1360-1365.
[37] Nachemson, A. L., and Peterson, L. E., 1995, "Effectiveness of treatment with a brace in girls who have adolescent idiopathic scoliosis. A prospective, controlled study based on data from the Brace Study of the Scoliosis Research Society," J Bone Joint Surg Am, 77(6), pp. 815-822.
[38] Negrini, S., Minozzi, S., Bettany-Saltikov, J., Chockalingam, N., Grivas, T. B., Kotwicki, T., Maruyama, T., Romano, M., and Zaina, F., 2015, "Braces for idiopathic scoliosis in adolescents," Cochrane Database Syst Rev, 6, p. CD006850.
[39] Weiss, H. R., and Goodall, D., 2008, "Rate of complications in scoliosis surgery - a systematic review of the Pub Med literature," Scoliosis, 3, p. 9.
[40] Coe, J. D., Arlet, V., Donaldson, W., Berven, S., Hanson, D. S., Mudiyam, R., Perra, J. H., and Shaffrey, C. I., 2006, "Complications in spinal fusion for adolescent idiopathic scoliosis in the new millennium. A report of the Scoliosis Research Society Morbidity and Mortality Committee," Spine (Phila Pa 1976), 31(3), pp. 345-349.
[41] Morris, S., 2016, "Girl, 14, died in torchlit ward surgery after theatre access delay.," The Guardian. https://www.theguardian.com/society/2016/apr/27/girl-14-died-in-torchlit-ward-surgery-after-theatre-access-delay. Access date: 2017
[42] Harding, I., 2011, "Cost of scoliosis surgery.," personal correspondence to P. Heine.
[43] Wang, W. J., Yeung, H. Y., Chu, W. C., Tang, N. L., Lee, K. M., Qiu, Y., Burwell, R. G., and Cheng, J. C., 2011, "Top theories for the etiopathogenesis of adolescent idiopathic scoliosis," J Pediatr Orthop, 31(1 Suppl), pp. S14-27.
[44] Lonstein, J. E., 1994, "Adolescent idiopathic scoliosis," Lancet, 344(8934), pp. 1407-1412.
[45] Veldhuizen, A. G., Wever, D. J., and Webb, P. J., 2000, "The aetiology of idiopathic scoliosis: biomechanical and neuromuscular factors," Eur Spine J, 9(3), pp. 178-184.
[46] Cheung, K. M., Wang, T., Qiu, G. X., and Luk, K. D., 2008, "Recent advances in the aetiology of adolescent idiopathic scoliosis," Int Orthop, 32(6), pp. 729-734.
456
[47] Ouellet, J., and Odent, T., 2013, "Animal models for scoliosis research: state of the art, current concepts and future perspective applications," Eur Spine J, 22 Suppl 2, pp. S81-95.
[48] Wise, C. A., Gao, X., Shoemaker, S., Gordon, D., and Herring, J. A., 2008, "Understanding genetic factors in idiopathic scoliosis, a complex disease of childhood," Curr Genomics, 9(1), pp. 51-59.
[49] Lowe, T. G., Edgar, M., Margulies, J. Y., Miller, N. H., Raso, V. J., Reinker, K. A., and Rivard, C. H., 2000, "Etiology of idiopathic scoliosis: current trends in research," J Bone Joint Surg Am, 82-A(8), pp. 1157-1168.
[50] Schlösser, T. P., van der Heijden, G. J., Versteeg, A. L., and Castelein, R. M., 2014, "How 'idiopathic' is adolescent idiopathic scoliosis? A systematic review on associated abnormalities," PLoS One, 9(5), p. e97461.
[51] Hitier, M., Hamon, M., Denise, P., Lacoudre, J., Thenint, M. A., Mallet, J. F., Moreau, S.,
and Quarck, G., 2015, "Lateral Semicircular Canal Asymmetry in Idiopathic Scoliosis: An Early
Link between Biomechanical, Hormonal and Neurosensory Theories?," PLoS One, 10(7), p.
e0131120.
Chapter 2
[1] Penfield, W., and Boldrey, E., 1937, "Somatic motor and sensory representation in the cerebral cortex of man as studied by electrical stimulation.," Brain, 60(4), pp. 389-443.
[2] Longo, M., 2015, "Implicit and explicit body representations," European Psychologist, 20(1), pp. 6-15.
[3] Wikipedia. "Cortical homunculus." https://en.wikipedia.org/wiki/Cortical_homunculus. Access year: 2017.
[4] Haggard, P., and Wolpert, D. M., 2005, "Disorders of the body scheme," Higher-order motor disorder: from neuroanatomy and neurobiology to clinical neurology, H.-J. Freund, M. Jeannerod, M. Hallett, and R. Leiguarda, eds., Oxford University Press.
[5] Coslett, H. B., 2014, "Body representations: updating a classic concept," The roots of cognitive neuroscience, A. Chatterjee, and H. B. Coslett, eds., Oxford University Press, New York, pp. 221-236.
[6] Azañón E, Tamè L, Maravita A, Linkenauger SA, Ferrè ER, Tajadura-Jiménez A, and MR, L., 2016, "Multimodal contributions to body representation," Multisensory Research, 29(6-7), pp. 635-661.
[7] Gallagher, S., 2005, "Terms of embodiment," How the body shapes the mind, S. Gallagher, ed., Oxford University Press, pp. 17-39.
[8] Kammers, M. P., Mulder, J., de Vignemont, F., and Dijkerman, H. C., 2010, "The weight of representing the body: addressing the potentially indefinite number of body representations in healthy individuals," Exp Brain Res, 204(3), pp. 333-342.
[9] de Vignemont, F., 2010, "Body schema and body image-Pros and cons," Neuropsychologia, 48(3), pp. 669-680.

457
[10] Longo, M. R., 2017, "Distorted body representations in healthy cognition," The quarterly journal of experimental psychology.70(3), pp 378-388.
[11] Moseley, G. L., Gallace, A., and Spence, C., 2012, "Bodily illusions in health and disease: Physiological and clinical perspectives and the concept of a cortical 'body matrix'," Neuroscience and Biobehavioral Reviews, 36(1), pp. 34-46.
[12] Berlucchi, G., and Aglioti, S. M., 2010, "The body in the brain revisited," Experimental Brain Research, 200(1), pp. 25-35.
[13] Vallar, G., and Papagno, C., 2003, "Pierre Bonnier's (1905) cases of bodily 'aschematie'," Classic cases in neuropsychology, C. Code, C.-W. Wallesch, Y. Joanette, and A. R. Lecours, eds., Psychology Press, Hove, pp. 147-170.
[14] Head, H., and Holmes, G., 1911, "Sensory disturbances from cerebral lesions," Brain, 34(2-3), pp. 102-254.
[15] Pellijeff, A., Bonilha, L., Morgan, P. S., McKenzie, K., and Jackson, S. R., 2006, "Parietal updating of limb posture: an event-related fMRI study," Neuropsychologia, 44(13), pp. 2685-2690.
[16] Martel, M., Cardinali, L., Roy, A. C., and Farnè, A., 2016, "Tool-use: An open window into body representation and its plasticity," Cogn Neuropsychol, 33(1-2), pp. 82-101.
[17] Gallagher, S., 2005, "The case of the missing schema," How the body shapes the mind, S. Gallagher, ed., Oxford University Press, pp. 40-64.
[18] Blakeslee, S., and Blakeslee, M., 2008, "The embodied brain," The body has a mind of its own, Random House, New York, pp. 3-5.
[19] Trojan, J., 2015, "Representations of body and space: theoretical concepts and controversies," Cogn Process, 16 Suppl 1, pp. 417-420.
[20] Giummarra, M. J., Gibson, S. J., Georgiou-Karistianis, N., and Bradshaw, J. L., 2008, "Mechanisms underlying embodiment, disembodiment and loss of embodiment," Neuroscience and Biobehavioral Reviews, 32(1), pp. 143-160.
[21] Longo, M. R., Azañón, E., and Haggard, P., 2010, "More than skin deep: Body representation beyond primary somatosensory cortex," Neuropsychologia, 48(3), pp. 655-668.
[22] Assaiante, C., Barlaam, F., Cignetti, F., and Vaugoyeau, M., 2014, "Body schema building during childhood and adolescence: a neurosensory approach," Neurophysiol Clin, 44(1), pp. 3-12.
[23] Reed, C. L., 2002, "What is the body schema?," The imitative mind: Development, evolution, and brain bases., Cambridge University Press, New York, NY, pp. 233-243.
[24] Botvinick, M., and Cohen, J., 1998, "Rubber hands 'feel' touch that eyes see," Nature, 391(6669), p. 756.
[25] Lackner, J. R., 1988, "Some proprioceptive influences on the perceptual representation of body shape and orientation," Brain, 111(Pt 2), pp. 281-297.
[26] Kilteni, K., Maselli, A., Kording, K. P., and Slater, M., 2015, "Over my fake body: body ownership illusions for studying the multisensory basis of own-body perception," Front Hum Neurosci, 9, p. 141.
[27] Smashing Lists., "10 amazing tricks to play with your brain." http://www.smashinglists.com/10-amazing-tricks-to-play-with-your-brain/. Acces year: 2017.

458
[28] Flor, H., 2002, "The modification of cortical reorganization and chronic pain by sensory feedback," Appl Psychophysiol Biofeedback, 27(3), pp. 215-227.
[29] Hotz-Boendermaker, S., Marcar, V. L., Meier, M. L., Boendermaker, B., and Humphreys, B. K., 2016, "Reorganization in Secondary Somatosensory Cortex in Chronic Low Back Pain Patients," Spine (Phila Pa 1976), 41(11), pp. E667-673.
[30] Tsao, H., Danneels, L.A., Hodges, P.W., 2011,”Smudging the motor brain in young adults with recurrent low back pain,” Spine, 36(21), pp1721-1727.
[31] Schabrun, S.M., Elgueta-Cancino, E.L., Hodges, P.W., 2017, “Smudging of motor cortex is related to the severity of low back pain,” Spine, 42(15), pp 1172-1178.
[32] Wand, B. M., Parkitny, L., O'Connell, N. E., Luomajoki, H., McAuley, J. H., Thacker, M., and Moseley, G. L., 2011, "Cortical changes in chronic low back pain: Current state of the art and implications for clinical practice," Manual Therapy, 16(1), pp. 15-20.
[33] Zhao, X., Xu, M., Jorgenson, K., Kong, J., 2017, “Neurochemical changes in patients with chronic low back pain detected by proton magnetic resonance spectroscopy: a systematic review,” Neuroimage Clin, 13, pp 33-38.
[34] Catley, M. J., O'Connell, N. E., Berryman, C., Ayhan, F. F., and Moseley, G. L., 2014, "Is tactile acuity altered in people with chronic pain? a systematic review and meta-analysis," J Pain, 15(10), pp. 985-1000.
[35] Adamczyk, A., Luedtke, K., Saulic, E., 2017, “Lumbar tactile acuity in patients with low back pain and healthy controls: systematic review and meta-analysis,” Clin J Pain, Epub, doi: 10.1097/AJP.0000000000000499.
[36] Tsay, A., Allen, T. J., Proske, U., and Giummarra, M. J., 2015, "Sensing the body in chronic pain: a review of psychophysical studies implicating altered body representation," Neurosci Biobehav Rev, 52, pp. 221-232.
[37] Tsao, H., Galea, M. P., and Hodges, P. W., 2010, "Driving plasticity in the motor cortex in recurrent low back pain," Eur J Pain, 14(8), pp. 832-839.
[38] Lotze, M., and Moseley, G. L., 2007, "Role of distorted body image in pain," Curr Rheumatol Rep, 9(6), pp. 488-496.
[39] Moseley, G. L., 2004, "Graded motor imagery is effective for long-standing complex regional pain syndrome: A randomised controlled trial," Pain, 108(1-2), pp. 192-198.
[40] Moseley, G. L., Zalucki, N. M., and Wiech, K., 2008, "Tactile discrimination, but not tactile stimulation alone, reduces chronic limb pain," Pain, 137(3), pp. 600-608.
[41] Tsao, H., Galea, M. P., and Hodges, P. W., 2008, "Reorganization of the motor cortex is associated with postural control deficits in recurrent low back pain," Brain, 131(Pt 8), pp. 2161-2171.
[42] Wand, B. M., O'Connell, N. E., di Pietro, F., and Bulsara, M., 2011, "Managing chronic nonspecific low back pain with a sensorimotor retraining approach: Exploratory multiple-baseline study of 3 participants," Physical Therapy, 91(4), pp. 535-546.
[43] Kälin, S., Rausch-Osthoff, A. K., and Bauer, C. M., 2016, "What is the effect of sensory discrimination training on chronic low back pain? A systematic review," BMC Musculoskelet Disord, 17, p. 143.

459
[44] Wand, B. M., Abbaszadeh, S., Smith, A. J., Catley, M. J., and Lorimer Moseley, G., 2013, "Acupuncture applied as a sensory discrimination training tool decreases movement-related pain in patients with chronic low back pain more than acupuncture alone: A randomised cross-over experiment," British Journal of Sports Medicine, 47(17), pp. 1085-1089.
[45] Ryan, C., Harland, N., Drew, B., and Martin, D., 2014, "Tactile acuity training for patients with chronic low back pain: a pilot randomised controlled trial," BMC Musculoskeletal Disorders, 15(1), p. 59.
[46] Daffada, P. J., Walsh, N., McCabe, C. S., and Palmer, S., 2015, "The impact of cortical remapping interventions on pain and disability in chronic low back pain: a systematic review," Physiotherapy, 101(1), pp. 25-33.
[47] Wälti, P., Kool, J., and Luomajoki, H., 2015, "Short-term effect on pain and function of neurophysiological education and sensorimotor retraining compared to usual physiotherapy in patients with chronic or recurrent non-specific low back pain, a pilot randomized controlled trial," BMC Musculoskelet Disord, 16, p. 83.
[48] Bagg, M. K., Hübscher, M., Rabey, M., Wand, B. M., O'Hagan, E., Moseley, G. L., Stanton, T. R., Maher, C. G., Goodall, S., Saing, S., O'Connell, N. E., Luomajoki, H., and McAuley, J. H., 2017, "The RESOLVE Trial for people with chronic low back pain: protocol for a randomised clinical trial," J Physiother, 63(1), pp. 47-48.
[49] Barlaam, F., Fortin, C., Vaugoyeau, M., Schmitz, C., and Assaiante, C., 2012, "Development of action representation during adolescence as assessed from anticipatory control in a bimanual load-lifting task," Neuroscience, 221, pp. 56-68.
[50] Herman, R., Mixon, J., Fisher, A., Maulucci, R., and Stuyck, J., 1985, "Idiopathic scoliosis and the central nervous system: a motor control problem. The Harrington lecture, 1983. Scoliosis Research Society," Spine (Phila Pa 1976), 10(1), pp. 1-14.
[51] Smania, N., Picelli, A., Romano, M., and Negrini, S., 2008, "Neurophysiological basis of rehabilitation of adolescent idiopathic scoliosis," Disability & Rehabilitation, 30(10), pp. 763-771.
[52] Veldhuizen, A. G., Wever, D. J., and Webb, P. J., 2000, "The aetiology of idiopathic scoliosis: biomechanical and neuromuscular factors," Eur Spine J, 9(3), pp. 178-184.
[53] Burwell, R. G., Freeman, B. J., Dangerfield, P. H., Aujla, R. K., Cole, A. A., Kirby, A. S., Polak, F., Pratt, R. K., Webb, J. K., and Moulton, A., 2006, "Etiologic theories of idiopathic scoliosis: neurodevelopmental concept of maturational delay of the CNS body schema ("body-in-the-brain")," Studies in health technology and informatics, 123, pp. 72-79.
[54] Patten, S. A., and Moldovan, F., 2011, "Could genetic determinants of inner ear anomalies be a factor for the development of idiopathic scoliosis?," Med Hypotheses, 76(3), pp. 438-440.
[55] Lowe, T. G., Edgar, M., Margulies, J. Y., Miller, N. H., Raso, V. J., Reinker, K. A., and Rivard, C. H., 2000, "Etiology of idiopathic scoliosis: current trends in research," J Bone Joint Surg Am, 82-A(8), pp. 1157-1168.
[56] Burwell, R. G., and Dangerfield, P. H., 2002, "Etiologic theories of idiopathic scoliosis: neurodevelopmental concepts to be evaluated," Studies in Health Technology & Informatics, 91, pp. 15-19.
[57] Hawasli, A. H., Hullar, T. E., and Dorward, I. G., 2015, "Idiopathic scoliosis and the vestibular system," Eur Spine J, 24(2), pp. 227-233.

460
[58] Cheung, J., Sluiter, W. J., Veldhuizen, A. G., Cool, J. C., and Van Horn, J. R., 2002, "Perception of vertical and horizontal orientation in children with scoliosis," J Orthop Res, 20(3), pp. 416-420.
[59] Cakrt, O., Slabý, K., Viktorinová, L., Kolář, P., and Jeřábek, J., 2011, "Subjective visual vertical in patients with idiopatic scoliosis," J Vestib Res, 21(3), pp. 161-165.
[60] Barrack, R. L., Whitecloud, T. S., Burke, S. W., Cook, S. D., and Harding, A. F., 1984, "Proprioception in idiopathic scoliosis," Spine (Phila Pa 1976), 9(7), pp. 681-685.
[61] Barrack, R. L., Wyatt, M. P., Whitecloud, T. S., Burke, S. W., Roberts, J. M., and Brinker, M. R., 1988, "Vibratory hypersensitivity in idiopathic scoliosis," J Pediatr Orthop, 8(4), pp. 389-395.
[62] Cook, S. D., Harding, A. F., Burke, S. W., Whitecloud, T. S., Barrack, R. L., and Leinhardt, T. M., 1986, "Upper extremity proprioception in idiopathic scoliosis," Clin Orthop Relat Res(213), pp. 118-124.
[63] Wyatt, M. P., Barrack, R. L., Mubarak, S. J., Whitecloud, T. S., and Burke, S. W., 1986, "Vibratory response in idiopathic scoliosis," J Bone Joint Surg Br, 68(5), pp. 714-718.
[64] McInnes, E., Hill, D. L., Raso, V. J., Chetner, B., Greenhill, B. J., and Moreau, M. J., 1991, "Vibratory response in adolescents who have idiopathic scoliosis," J Bone Joint Surg Am, 73(8), pp. 1208-1212.
[65] Sahlstrand, T., Ortengren, R., and Nachemson, A., 1978, "Postural equilibrium in adolescent idiopathic scoliosis," Acta Orthop Scand, 49(4), pp. 354-365.
[66] Byl, N. N., and Gray, J. M., 1993, "Complex balance reactions in different sensory conditions: adolescents with and without idiopathic scoliosis," J Orthop Res, 11(2), pp. 215-227.
[67] Chen, P. Q., Wang, J. L., Tsuang, Y. H., Liao, T. L., Huang, P. I., and Hang, Y. S., 1998, "The postural stability control and gait pattern of idiopathic scoliosis adolescents," Clin Biomech (Bristol, Avon), 13(1 Suppl 1), pp. S52-S58.
[68] Nault, M. L., Allard, P., Hinse, S., Le Blanc, R., Caron, O., Labelle, H., and Sadeghi, H., 2002, "Relations between standing stability and body posture parameters in adolescent idiopathic scoliosis," Spine (Phila Pa 1976), 27(17), pp. 1911-1917.
[69] Simoneau, M., Mercier, P., Blouin, J., Allard, P., and Teasdale, N., 2006, "Altered sensory-weighting mechanisms is observed in adolescents with idiopathic scoliosis," BMC Neurosci, 7, p. 68.
[70] Beaulieu, M., Toulotte, C., Gatto, L., Rivard, C. H., Teasdale, N., Simoneau, M., and Allard, P., 2009, "Postural imbalance in non-treated adolescent idiopathic scoliosis at different periods of progression," Eur Spine J, 18(1), pp. 38-44.
[71] Dalleau, G., Allard, M. S., Beaulieu, M., Rivard, C. H., and Allard, P., 2007, "Free moment contribution to quiet standing in able-bodied and scoliotic girls," Eur Spine J, 16(10), pp. 1593-1599.
[72] Dalleau, G., Damavandi, M., Leroyer, P., Verkindt, C., Rivard, C. H., and Allard, P., 2011, "Horizontal body and trunk center of mass offset and standing balance in scoliotic girls," Eur Spine J, 20(1), pp. 123-128.
[73] Stylianides, G. A., Dalleau, G., Begon, M., Rivard, C. H., and Allard, P., 2013, "Pelvic morphology, body posture and standing balance characteristics of adolescent able-bodied and idiopathic scoliosis girls," PLoS One, 8(7), p. e70205.

461
[74] Gruber, A. H., Busa, M. A., Gorton Iii, G. E., Van Emmerik, R. E., Masso, P. D., and Hamill, J., 2011, "Time-to-contact and multiscale entropy identify differences in postural control in adolescent idiopathic scoliosis," Gait Posture, 34(1), pp. 13-18.
[75] Olafsson, Y., Odergren, T., Persson, H. E., and Saraste, H., 2002, "Somatosensory testing in idiopathic scoliosis," Dev Med Child Neurol, 44(2), pp. 130-132.
[76] Goldberg, C. J., Dowling, F. E., Fogarty, E. E., and Moore, D. P., 1995, "Adolescent idiopathic scoliosis and cerebral asymmetry. An examination of a nonspinal perceptual system," Spine (Phila Pa 1976), 20(15), pp. 1685-1691.
[77] Picelli, A., Negrini, S., Zenorini, A., Iosa, M., Paolucci, S., and Smania, N., 2016, "Do adolescents with idiopathic scoliosis have body schema disorders? A cross-sectional study," J Back Musculoskelet Rehabil, 29(1), pp. 89-96.
Chapter 3
[1] Moher, D., Liberati, A., Tetzlaff, J., Altman, D. G., and Group, P., 2009, "Preferred reporting items for systematic reviews and meta-analyses: the PRISMA statement," J Clin Epidemiol, 62(10), pp. 1006-1012.
[2] von Elm, E., Altman, D. G., Egger, M., Pocock, S. J., Gøtzsche, P. C., Vandenbroucke, J. P., and Initiative, S., 2007, "The Strengthening the Reporting of Observational Studies in Epidemiology (STROBE) statement: guidelines for reporting observational studies," Lancet, 370(9596), pp. 1453-1457.
[3] Critical Appraisal Skills Programme, 2018, "CASP Case Control study checklist."
[4] Scottish Intercollegiate Guidelines Network, 2018, "SIGN Methodology Checklist 4: Case-control studies."
[5] Wells, G., Shea, B., O'Connell, D., Peterson, J., Welch, V., Losos, M., and Tugwell, P., 2019, "The Newcastle-Ottawa Scale (NOS) for assessing the quality of nonrandomised studies in meta-analyses," http://www.ohri.ca/programs/clinical_epidemiology/oxford.asp.
[6] Schlosser, T. P., Van Der Heijden, G. J., Versteeg, A. L., and Castelein, R. M., 2014, "How 'idiopathic' is adolescent idiopathic scoliosis? A systematic review on associated abnormalities," Scoliosis. Conference: 10th Meeting of the International Research Society of Spinal Deformities, IRSSD, 10(SUPPL. 1).
[7] Beaulieu, M., Toulotte, C., Gatto, L., Rivard, C. H., Teasdale, N., Simoneau, M., and Allard, P., 2009, "Postural imbalance in non-treated adolescent idiopathic scoliosis at different periods of progression," European Spine Journal, 18(1), pp. 38-44.
[8] Bruyneel, A. V., and Mesure, S., 2013, "Learning effect on the dynamical strategies in sitting position on seesaw motion for idiopathic scoliosis patients," Neuroscience Letters, 534(1), pp. 264-268.
[9] Dalleau, G., Allard, M. S., Beaulieu, M., Rivard, C. H., and Allard, P., 2007, "Free moment contribution to quiet standing in able-bodied and scoliotic girls," European Spine Journal, 16(10), pp. 1593-1599.

462
[10] De Santiago, H. A. R., Reis, J. G., Gomes, M. M., Da Silva Herrero, C. F. P., Defino, H. L. A., and De Abreu, D. C. C., 2013, "The influence of vision and support base on balance during quiet standing in patients with adolescent idiopathic scoliosis before and after posterior spinal fusion," Spine Journal, 13(11), pp. 1470-1476.
[11] Leteneur, S., Simoneau-Buessinger, E., Barbier, F., Rivard, C. H., and Allard, P., 2017, "Effect of natural sagittal trunk lean on standing balance in untreated scoliotic girls," Clinical Biomechanics, 49, pp. 107-112.
[12] Lidstrom, J., Friberg, S., Lindstrom, L., and Sahlstrand, T., 1988, "Postural control in siblings to scoliosis patients and scoliosis patients," Spine, 13(9), pp. 1070-1074.
[13] Mallau, S., Bollini, G., Jouve, J. L., and Assaiante, C., 2007, "Locomotor skills and balance strategies in adolescents idiopathic scoliosis," Spine (03622436), 32(1), pp. E14-22.
[14] Pialasse, J. P., Descarreaux, M., Mercier, P., and Simoneau, M., 2015, "Sensory reweighting is altered in adolescent patients with scoliosis: Evidence from a neuromechanical model," Gait and Posture, 42(4), pp. 558-563.
[15] Pialasse, J. P., Mercier, P., Descarreaux, M., and Simoneau, M., 2017, "A procedure to detect abnormal sensorimotor control in adolescents with idiopathic scoliosis," Gait and Posture, 57, pp. 124-129.
[16] Sahlstrand, T., Ortengren, R., and Nachemson, A., 1978, "Postural equilibrium in adolescent idiopathic scoliosis," Acta Orthopaedica Scandinavica, 49(4), pp. 354-365.
[17] Sim, T., Yoo, H., Lee, D., Suh, S. W., Yang, J. H., Kim, H., and Mun, J. H., 2018, "Analysis of sensory system aspects of postural stability during quiet standing in adolescent idiopathic scoliosis patients," Journal of NeuroEngineering and Rehabilitation, 15 (1) (no pagination)(54).
[18] Simoneau, M., Mercier, P., Blouin, J., Allard, P., and Teasdale, N., 2006, "Altered sensory-weighting mechanisms is observed in adolescents with idiopathic scoliosis," BMC Neuroscience, 7 (no pagination)(68).
[19] Simoneau, M., Richer, N., Mercier, P., Allard, P., and Teasdale, N., 2006, "Sensory deprivation and balance control in idiopathic scoliosis adolescent," Experimental Brain Research, 170(4), pp. 576-582.
[20] Stylianides, G. A., Dalleau, G., Begon, M., Rivard, C. H., and Allard, P., 2013, "Pelvic Morphology, Body Posture and Standing Balance Characteristics of Adolescent Able-Bodied and Idiopathic Scoliosis Girls," PLoS ONE, 8 (7) (no pagination)(e70205).
[21] Gregoric, M., Pecak, F., Trontelj, J. V., and Dimitrijevic, M. R., 1981, "Postural control in scoliosis. A statokinesimetric study in patients with scoliosis due to neuromuscular disorders and in patients with idiopathic scoliosis," Acta Orthopaedica Scandinavica, 52(1), pp. 59-63.
[22] Sahlstrand, T., and Petruson, B., 1979, "A study of labyrinthine function in patients with adolescent idiopathic scoliosis. I. An electro-nystagmographic study," Acta Orthopaedica Scandinavica, 50(6 II), pp. 759-769.
[23] Sahlstrand, T., 1980, "An analysis of lateral predominance in adolescent idiopathic scoliosis with special reference to convexity of the curve," Spine, 5(6), pp. 512-518.
[24] Byl, N. N., Holland, S., Jurek, A., and Hu, S. S., 1997, "Postural imbalance and vibratory sensitivity in patients with idiopathic scoliosis: implications for treatment," Journal of Orthopaedic & Sports Physical Therapy, 26(2), pp. 60-68.

463
[25] Dalleau, G., Damavandi, M., Leroyer, P., Verkindt, C., Rivard, C. H., and Allard, P., 2011, "Horizontal body and trunk center of mass offset and standing balance in scoliotic girls," European Spine Journal, 20(1), pp. 123-128.
[26] Pialasse, J. P., Mercier, P., Descarreaux, M., and Simoneau, M., 2016, "Sensorimotor Control Impairment in Young Adults With Idiopathic Scoliosis Compared With Healthy Controls," Journal of Manipulative and Physiological Therapeutics, 39(7), pp. 473-479.
[27] Byl, N. N., and Gray, J. M., 1993, "Complex balance reactions in different sensory conditions: Adolescents with and without idiopathic scoliosis," Journal of Orthopaedic Research, 11(2), pp. 215-227.
[28] Adler, N., Bleck, E. E., Rinsky, L. A., and Young, W., 1986, "Balance reactions and eye-hand coordination in idiopathic scoliosis," Journal of Orthopaedic Research, 4(1), pp. 102-107.
[29] Bennett, B. C., Abel, M. F., and Granata, K. P., 2004, "Seated postural control in adolescents with idiopathic scoliosis," Spine, 29(20), pp. E449-454.
[30] Driscoll, D. M., Newton, R. A., Lamb, R. L., and Nogi, J., 1984, "A study of postural equilibrium in idiopathic scoliosis," Journal of Pediatric Orthopaedics, 4(6), pp. 677-681.
[31] Gruber, A. H., Busa, M. A., Gorton Iii, G. E., Van Emmerik, R. E., Masso, P. D., and Hamill, J., 2011, "Time-to-contact and multiscale entropy identify differences in postural control in adolescent idiopathic scoliosis," Gait & Posture, 34(1), pp. 13-18.
[32] Chang, Y. T., Meng, L. F., Chang, C. J., Lai, P. L., Lung, C. W., and Chern, J. S., 2017, "Effect of postural control demands on early visual evoked potentials during a subjective visual vertical perception task in adolescents with idiopathic scoliosis," Frontiers in Human Neuroscience, 11 (no pagination)(326).
[33] Chen, P. Q., Wang, J. L., Tsuang, Y. H., Liao, T. L., Huang, P. I., and Hang, Y. S., 1998, "The postural stability control and gait pattern of idiopathic scoliosis adolescents," Clinical Biomechanics, 1), pp. S52-S58.
[34] Kuo, F. C., Wang, N. H., and Hong, C. Z., 2010, "Impact of visual and somatosensory deprivation on dynamic balance in adolescent idiopathic scoliosis," Spine (03622436), 35(23), pp. 2084-2090.
[35] Kuo, F. C., Hong, C. Z., Lai, C. L., and Tan, S. H., 2011, "Postural control strategies related to anticipatory perturbation and quick perturbation in adolescent idiopathic scoliosis," Spine (03622436), 36(10), pp. 810-816.
[36] Guo, X., Chau, W. W., Hui-Chan, C. W. Y., Cheung, C. S. K., Tsang, W. W. N., and Cheng, J. C. Y., 2006, "Balance control in adolescents with idiopathic scoliosis and disturbed somatosensory function," Spine, 31(14), pp. E437-E440.
[37] Kinikli, G. I., Yüksel, I., Yakut, Y., Alanay, A., and Yazici, M., 2011, "Alterations of postural sway in adolescent idiopathic scoliosis," Turkish Journal of Physiotherapy Rehabilitation, 22(1), pp. 17-22.
[38] Nault, M. L., Allard, P., Hinse, S., Le Blanc, R., Caron, O., Labelle, H., and Sadeghi, H., 2002, "Relations between standing stability and body posture parameters in adolescent idiopathic scoliosis," Spine, 27(17), pp. 1911-1917.
[39] Park, J. Y., Park, G. D., Lee, S. G., and Lee, J. C., 2013, "The effect of scoliosis angle on center of gravity sway," Journal of Physical Therapy Science, 25(12), pp. 1629-1631.

464
[40] Bruyneel, A. V., Chavet, P., Bollini, G., Ebermeyer, E., and Mesure, S., 2010, "Idiopathic scoliosis and balance organisation in seated position on a seesaw," European Spine Journal, 19(5), pp. 739-746.
[41] Le Berre, M., Guyot, M. A., Agnani, O., Bourdeauducq, I., Versyp, M. C., Donze, C., Thevenon, A., and Catanzariti, J. F., 2017, "Clinical balance tests, proprioceptive system and adolescent idiopathic scoliosis," European Spine Journal, 26(6), pp. 1638-1644.
[42] Yekutiel, M., Robin, G. C., and Yarom, R., 1981, "Proprioceptive function in children with adolescent idiopathic scoliosis," Spine, 6(6), pp. 560-566.
[43] Cook, S. D., Harding, A. F., and Burke, S. W., 1986, "Upper extremity proprioception in idiopathic scoliosis," Clinical Orthopaedics and Related Research, No. 213, pp. 118-124.
[44] Keessen, W., Crowe, A., and Hearn, M., 1992, "Proprioceptive accuracy in idiopathic scoliosis," Spine, 17(2), pp. 149-155.
[45] Barrack, R. L., Whitecloud, I. T. S., and Burke, S. W., 1984, "Proprioception in idiopathic scoliosis," Spine, 9(7), pp. 681-685.
[46] Guyot, M. A., Agnani, O., Peyrodie, L., Samantha, D., Donze, C., and Catanzariti, J. F., 2016, "Cervicocephalic relocation test to evaluate cervical proprioception in adolescent idiopathic scoliosis," European Spine Journal, 25(10), pp. 3130-3136.
[47] Barrack, R. L., Wyatt, M. P., Whitecloud, I. T. S., Burke, S. W., Roberts, J. M., and Brinker, M. R., 1988, "Vibratory hypersensitivity in idiopathic scoliosis," Journal of Pediatric Orthopaedics, 8(4), pp. 389-395.
[48] Wyatt, M. P., Barrack, R. L., and Mubarak, S. J., 1986, "Vibratory response in idiopathic scoliosis," Journal of Bone and Joint Surgery - Series B, 68(5), pp. 714-718.
[49] McInnes, E., Hill, D. L., Raso, V. J., Chetner, B., Greenhill, B. J., and Moreau, M. J., 1991, "Vibratory response in adolescents who have idiopathic scoliosis," Journal of Bone and Joint Surgery - Series A, 73 A(8), pp. 1208-1212.
[50] Cheung, J., Sluiter, W. J., Veldhuizen, A. G., Cool, J. C., and Van Horn, J. R., 2002, "Perception of vertical and horizontal orientation in children with scoliosis," Journal of Orthopaedic Research, 20(3), pp. 416-420.
[51] Antoniadou, N., Hatzitaki, V., Stavridis, S. I., and Samoladas, E., 2018, "Verticality perception reveals a vestibular deficit in adolescents with idiopathic scoliosis," Experimental Brain Research, 236(6), pp. 1725-1734.
[52] Cakrt, O., Slaby, K., Viktorinova, L., Kolar, P., and Jerabek, J., 2011, "Subjective visual vertical in patients with idiopatic scoliosis," Journal of Vestibular Research: Equilibrium and Orientation, 21(3), pp. 161-165.
[53] Le Berre, M., Pradeau, C., Brouillard, A., Coget, M., Massot, C., and Catanzariti, J. F., 2018, "Do Adolescents With Idiopathic Scoliosis Have an Erroneous Perception of the Gravitational Vertical?," Spine Deformity.
[54] Sahlstrend, T., and Petruson, B., 1979, "Postural effects on nystagmus response during caloric labyrinthine stimulation in patients with adolescent idiopathic scoliosis. II. An electro-nystagmographic study," Acta Orthopaedica Scandinavica, 50(6 II), pp. 771-775.
[55] Kapetanos, G., Potoupnis, M., Dangilas, A., Markou, K., and Pournaras, J., 2002, "Is the labyrinthine dysfunction a causative factor in idiopathic scoliosis?," Studies in health technology and informatics, 91, pp. 7-9.

465
[56] Jensen, G. M., and Wilson, K. B., 1979, "Horizontal postrotatory nystagmus response in female subjects with adolescent idiopathic scoliosis," Physical Therapy, 59(10), pp. 1226-1233.
[57] Hitier, M., Hamon, M., Denise, P., Lacoudre, J., Thenint, M. A., Mallet, J. F., Moreau, S., and Quarck, G., 2015, "Lateral semicircular canal asymmetry in idiopathic scoliosis: An early link between biomechanical, hormonal and neurosensory theories?," PLoS ONE, 10 (7) (no pagination)(e0131120).
[58] Yamamoto, H., Tani, T., MacEwen, G. D., and Herman, R., 1982, "An evaluation of brainstem function as a prognostication of early idiopathic scoliosis," Journal of Pediatric Orthopedics, 2(5), pp. 521-528.
[59] Simoneau, M., Lamothe, V., Hutin, E., Mercier, P., Teasdale, N., and Blouin, J., 2009, "Evidence for cognitive vestibular integration impairment in idiopathic scoliosis patients," BMC Neuroscience, 10, pp. 102-102.
[60] Pialasse, J. P., Descarreaux, M., Mercier, P., Blouin, J., and Simoneau, M., 2015, "The vestibular-evoked postural response of adolescents with idiopathic scoliosis is altered," PLoS ONE, 10 (11) (no pagination)(0143124).
[61] Wiener-Vacher, S. R., and Mazda, K., 1998, "Asymmetric otolith vestibulo-ocular responses in children with idiopathic scoliosis," Journal of Pediatrics, 132(6), pp. 1028-1032.
[62] Pollak, L., Shlamkovic, N., Minewicz, A., and Mirovsky, Y., 2013, "Otolith dysfunction as a possible cause for the development of idiopathic scoliosis," Journal of Pediatric Orthopaedics, 33(3), pp. 293-297.
[63] Chu, W. C. W., Lam, W. W. M., Chan, Y. L., Ng, B. K. W., Lam, T. P., Lee, K. M., Guo, X., and Cheng, J. C. Y., 2006, "Relative shortening and functional tethering of spinal cord in adolescent idiopathic scoliosis? Study with multiplanar reformat magnetic resonance imaging and somatosensory evoked potential," Spine, 31(1), pp. E19-E25.
[64] Chu, W. C. W., Man, G. C. W., Lam, W. W. M., Yeung, B. H. Y., Chau, W. W., Ng, B. K. W., Lam, T. P., Lee, K. M., and Cheng, J. C. Y., 2008, "Morphological and functional electrophysiological evidence of relative spinal cord tethering in adolescent idiopathic scoliosis," Spine, 33(6), pp. 673-680.
[65] Cheng, J. C., Guo, X., and Sher, A. H., 1998, "Posterior tibial nerve somatosensory cortical evoked potentials in adolescent idiopathic scoliosis," Spine, 23(3), pp. 332-337.
[66] Cheng, J. C., Guo, X., Sher, A. H., Chan, Y. L., and Metreweli, C., 1999, "Correlation between curve severity, somatosensory evoked potentials, and magnetic resonance imaging in adolescent idiopathic scoliosis," Spine, 24(16), pp. 1679-1684.
[67] Brinker, M. R., Willis, J. K., Cook, S. D., Whitecloud, I. T. S., Bennett, J. T., Barrack, R. L., and Ellman, M. G., 1992, "Neurologic testing with somatosensory evoked potentials in idiopathic scoliosis," Spine, 17(3), pp. 277-279.
[68] Fernandez-Bermejo, E., Garcia-Jimenez, M. A., Fernandez-Palomeque, C., and Munuera, L., 1993, "Adolescent idiopathic scoliosis and joint laxity. A study with somatosensory evoked potentials," Spine, 18(7), pp. 918-922.
[69] Chau, W. W., Chu, W. C. W., Lam, T. P., Ng, B. K. W., Fu, L. L. K., and Cheng, J. C. Y., 2016, "Anatomical origin of abnormal somatosensory-evoked potential (SEP) in adolescent idiopathic scoliosis with different curve severity and correlation with cerebellar tonsillar level determined by MRI," Spine, 41(10), pp. E598-E604.

466
[70] Kimiskidis, V. K., Potoupnis, M., Papagiannopoulos, S. K., Dimopoulos, G., Kazis, D. A., Markou, K., Zara, F., Kapetanos, G., and Kazis, A. D., 2007, "Idiopathic scoliosis: a transcranial magnetic stimulation study," J Musculoskelet Neuronal Interact, 7(2), pp. 155-160.
[71] Domenech, J., Tormos, J. M., Barrios, C., and Pascual-Leone, A., 2010, "Motor cortical hyperexcitability in idiopathic scoliosis: Could focal dystonia be a subclinical etiological factor?," European Spine Journal, 19(2), pp. 223-230.
[72] Petersen, I., Sahlstrand, T., and Sellden, U., 1979, "Electroencephalographic investigation of patients with adolescent idiopathic scoliosis," Acta Orthopaedica Scandinavica, 50(3), pp. 283-293.
[73] Robb, J. E., Conner, A. N., and Stephenson, J. B., 1986, "Normal electroencephalograms in idiopathic scoliosis," Acta Orthopaedica Scandinavica, 57(3), pp. 220-221.
[74] Dretakis, E. K., Paraskevaidis, C. H., Zarkadoulas, V., and Christodoulou, N., 1988, "Electroencephalographic study of schoolchildren with adolescent idiopathic scoliosis," Spine (Phila Pa 1976), 13(2), pp. 143-145.
[75] Dobosiewicz, K., 1997, "Neurophysiological mechanism of the unloading reflex as a prognostic factor in the early stages of idiopathic adolescent scoliosis," European Spine Journal, 6(2), pp. 93-97.
[76] Assaiante, C., Mallau, S., Jouve, J. L., Bollini, G., and Vaugoyeau, M., 2012, "Do adolescent idiopathic scoliosis (AIS) neglect proprioceptive information in sensory integration of postural control?," PLoS ONE, 7 (7) (no pagination)(e40646).
[77] Goldberg, C. J., Dowling, F. E., Fogarty, E. E., and Moore, D. P., 1995, "Adolescent idiopathic scoliosis and cerebral asymmetry. An examination of a nonspinal perceptual system," Spine, 20(15), pp. 1685-1691.
[78] Catanzariti, J. F., Agnani, O., Guyot, M. A., Wlodyka-Demaille, S., Khenioui, H., and Donze, C., 2014, "Does adolescent idiopathic scoliosis relate to vestibular disorders? A systematic review," Annals of Physical and Rehabilitation Medicine, Part 7. 57(6), pp. 465-479.
[79] Dufvenberg, M., Adeyemi, F., Rajendran, I., Oberg, B., and Abbott, A., 2018, "Does postural stability differ between adolescents with idiopathic scoliosis and typically developed? A systematic literature review and meta-analysis," Scoliosis and Spinal Disorders, 13 (1) (no pagination)(19).
Chapter 4
[1] Moseley, G. L., 2008, "I can't find it! Distorted body image and tactile dysfunction in patients with chronic back pain," Pain, 140(1), pp. 239-243.
[2] Botnmark, I., Tumilty, S., and Mani, R., 2016, "Tactile acuity, body schema integrity and physical performance of the shoulder: A cross-sectional study," Man Ther, 23, pp. 9-16.
[3] Catley, M. J., Tabor, A., Wand, B. M., and Moseley, G. L., 2013, "Assessing tactile acuity in rheumatology and musculoskeletal medicine--how reliable are two-point discrimination tests at the neck, hand, back and foot?," Rheumatology (Oxford), 52(8), pp. 1454-1461.

467
[4] Nolan, M. F., 1985, "Quantitative measure of cutaneous sensation. Two-point discrimination values for the face and trunk," Phys Ther, 65(2), pp. 181-185.
[5] Wand, B. M., Di Pietro, F., George, P., and O'Connell, N. E., 2010, "Tactile thresholds are preserved yet complex sensory function is impaired over the lumbar spine of chronic non-specific low back pain patients: a preliminary investigation," Physiotherapy, 96(4), pp. 317-323.
[6] Luomajoki, H., and Moseley, G. L., 2011, "Tactile acuity and lumbopelvic motor control in patients with back pain and healthy controls," Br J Sports Med, 45(5), pp. 437-440.
[7] Stanton, T. R., Lin, C. W. C., Bray, H., Smeets, R. J. E. M., Taylor, D., Law, R. Y. W., and Moseley, G. L., 2013, "Tactile acuity is disrupted in osteoarthritis but is unrelated to disruptions in motor imagery performance," Rheumatology (United Kingdom), 52(8), pp. 1509-1519.
[8] Elsig, S., Luomajoki, H., Sattelmayer, M., Taeymans, J., Tal-Akabi, A., and Hilfiker, R., 2014, "Sensorimotor tests, such as movement control and laterality judgment accuracy, in persons with recurrent neck pain and controls. A case-control study," Man Ther, 19(6), pp. 555-561.
[9] Falling, C., Mani, R., 2016, “Ageing and obesity indices influences the tactile acuity of the low back regions: A cross-sectional study”, Man Therapy, 23, pp 25-31.
[10] Elgueta-Cancino, E., Schabrun, S., Hodges, P., 2017, “Is the organisation of the primary motor cortex in low back pain related to pain, movement and/or sensation?”, Clin J Pain, Epub doi: 10.1097/AJP.0000000000000535
[11] Spahr, N., Hodkinson, D., Jolly, K., Williams, S., Howard, M., Thacker, M., 2017, “Distinguishing between nociceptive and neuropathic components in chronic low back pain using behavioural evaluation and sensory examination”, Musculoskelet Sc Pract, Epub doi: 10.1016/j.msksp.2016.12.006
[12] Harvie, D., Kelly, J., Buckman, H., Chan, J., Sutherland, G., Catley, M., Novak, J., Tuttle, N., Sterling, M., 2017, “Tactile acuity testing at the neck: A comparison of methods”, Musculoskelet Sci Pract., 32, pp 23-30.
[13] Wand, B. M., Catley, M. J., Luomajoki, H. A., O'Sullivan, K. J., Di Pietro, F., O'Connell, N. E., and Moseley, G. L., 2014, "Lumbar tactile acuity is near identical between sides in healthy pain-free participants," Man Ther, 19(5), pp. 504-507.
[14] Godde, B., Stauffenberg, B., Spengler, F., and Dinse, H. R., 2000, "Tactile coactivation-induced changes in spatial discrimination performance," J Neurosci, 20(4), pp. 1597-1604.
[15] Moberg, E., 1990, "Two-point discrimination test. A valuable part of hand surgical rehabilitation, e.g. in tetraplegia," Scand J Rehabil Med, 22(3), pp. 127-134.
[16] Yarnitsky, D., 1997, "Quantitative sensory testing," Muscle Nerve, 20(2), pp. 198-204.
[17] Peters, M. L., and Schmidt, A. J., 1991, "A comparison of two-point discrimination threshold of tactual, non-painful stimuli between chronic low back pain patients and controls," Pain, 44(1), pp. 57-60.
[18] Johnson, K. O., and Phillips, J. R., 1981, "Tactile spatial resolution. I. Two-point discrimination, gap detection, grating resolution, and letter recognition," J Neurophysiol, 46(6), pp. 1177-1192.
[19] Tong, J., Mao, O., and Goldreich, D., 2013, "Two-point orientation discrimination versus the traditional two-point test for tactile spatial acuity assessment," Front Hum Neurosci, 7, p. 579.

468
[20] Medina, J., and Coslett, H. B., 2016, "What can errors tell us about body representations?," Cogn Neuropsychol, 33(1-2), pp. 5-25.
[21] Steenbergen, P., Buitenweg, J. R., Trojan, J., and Veltink, P. H., 2013, "Reproducibility of somatosensory spatial perceptual maps," Experimental Brain Research, 224(3), pp. 417-427.
[22] Adamczyk, A., Sługocka, A., Saulicz, O., Saulicz, E., 2016, “The point-to-point test: a new diagnostic tool for measuring lumbar tactile acuity? Inter and intra-examiner reliability study of pain-free subjects”, Man. Ther, 22, pp 220-226.
[23] Flor, H., 2002, "The modification of cortical reorganization and chronic pain by sensory feedback," Appl Psychophysiol Biofeedback, 27(3), pp. 215-227.
[24] Moseley, G. L., Zalucki, N. M., and Wiech, K., 2008, "Tactile discrimination, but not tactile stimulation alone, reduces chronic limb pain," Pain, 137(3), pp. 600-608.
[25] Wand, B. M., O'Connell, N. E., di Pietro, F., and Bulsara, M., 2011, "Managing chronic nonspecific low back pain with a sensorimotor retraining approach: Exploratory multiple-baseline study of 3 participants," Physical Therapy, 91(4), pp. 535-546.
[26] Wand, B. M., Keeves, J., Bourgoin, C., George, P. J., Smith, A. J., O'Connell, N. E., and Moseley, G. L., 2013, "Mislocalization of sensory information in people with chronic low back pain: A preliminary investigation," Clinical Journal of Pain, 29(8), pp. 737-743.
[27] Steenbergen, P., Buitenweg, J. R., Trojan, J., and Veltink, P. H., 2014, "Tactile localization depends on stimulus intensity," Experimental Brain Research, 232(2), pp. 597-607.
[28] Yoshioka, T., Dillon, M. R., Beck, G. C., Rapp, B., and Landau, B., 2013, "Tactile localization on digits and hand: structure and development," Psychol Sci, 24(9), pp. 1653-1663.
[29] Parsons, L. M., 2001, "Integrating cognitive psychology, neurology and neuroimaging," Acta Psychol (Amst), 107(1-3), pp. 155-181.
[30] Bray, H., and Moseley, G. L., 2011, "Disrupted working body schema of the trunk in people with back pain," British Journal of Sports Medicine, 45(3), pp. 168-173.
[31] Bowering, K. J., Butler, D. S., Fulton, I. J., and Moseley, G. L., 2014, "Motor imagery in people with a history of back pain, current back pain, both, or neither," Clin J Pain, 30(12), pp. 1070-1075.
[32] Linder, M., Michaelson, P., and Röijezon, U., 2016, "Laterality judgments in people with low back pain--A cross-sectional observational and test-retest reliability study," Man Ther, 21, pp. 128-133.
[33] Wallwork, S. B., Butler, D. S., Fulton, I., Stewart, H., Darmawan, I., and Moseley, G. L., 2013, "Left/right neck rotation judgments are affected by age, gender, handedness and image rotation," Manual Therapy, 18(3), pp. 225-230.
[34] Cicchetti, D., 1994, "Guidelines, criteria, and rules of thumb for evaluating normed and standardized assessment instruments in psychology.," Psychological assessment, 6(4), pp. 284-290.
[35] Coslett, H. B., Medina, J., Kliot, D., and Burkey, A. R., 2010, "Mental motor imagery indexes pain: The hand laterality task," European Journal of Pain, 14(10), pp. 1007-1013.
[36] Nico, D., Daprati, E., Rigal, F., Parsons, L., and Sirigu, A., 2004, "Left and right hand recognition in upper limb amputees," Brain, 127(Pt 1), pp. 120-132.

469
[37] Caeyenberghs, K., Tsoupas, J., Wilson, P. H., and Smits-Engelsman, B. C., 2009, "Motor imagery development in primary school children," Dev Neuropsychol, 34(1), pp. 103-121.
[38] Dey, A., Barnsley, N., Mohan, R., McCormick, M., McAuley, J. H., and Moseley, G. L., 2012, "Are children who play a sport or a musical instrument better at motor imagery than children who do not?," British Journal of Sports Medicine, 46(13), pp. 923-926.
[39] Boonstra, A. M., de Vries, S. J., Veenstra, E., Tepper, M., Feenstra, W., and Otten, E., 2012, "Using the Hand Laterality Judgement Task to assess motor imagery: a study of practice effects in repeated measurements," Int J Rehabil Res, 35(3), pp. 278-280.
[40] Moseley, G. L., Gallace, A., and Spence, C., 2012, "Bodily illusions in health and disease: physiological and clinical perspectives and the concept of a cortical 'body matrix'," Neurosci Biobehav Rev, 36(1), pp. 34-46.
[41] Bultitude, J. H., and Rafal, R. D., 2010, "Derangement of body representation in complex regional pain syndrome: report of a case treated with mirror and prisms," Exp Brain Res, 204(3), pp. 409-418.
[42] Sumitani, M., Shibata, M., Iwakura, T., Matsuda, Y., Sakaue, G., Inoue, T., Mashimo, T., and Miyauchi, S., 2007, "Pathologic pain distorts visuospatial perception," Neurology, 68(2), pp. 152-154.
[43] Hach, S., and Schütz-Bosbach, S., 2014, "In (or outside of) your neck of the woods: Laterality in spatial body representation," Frontiers in Psychology, 5(FEB).
[44] Learmonth, G., Gallagher, A., Gibson, J., Thut, G., and Harvey, M., 2015, "Intra- and Inter-Task Reliability of Spatial Attention Measures in Pseudoneglect," PLoS One, 10(9), p. e0138379.
[45] Jewell, G., and McCourt, M. E., 2000, "Pseudoneglect: a review and meta-analysis of performance factors in line bisection tasks," Neuropsychologia, 38(1), pp. 93-110.
[46] Albert, M. L., 1973, "A simple test of visual neglect," Neurology, 23(6), pp. 658-664.
[47] Manning, L., Halligan, P. W., and Marshall, J. C., 1990, "Individual variation in line bisection: a study of normal subjects with application to the interpretation of visual neglect," Neuropsychologia, 28(7), pp. 647-655.
[48] Pulsipher, D. T., Seidenberg, M., and Hermann, B. P., 2009, "Corpus Callosum Maturation and Line Bisection Performance in Healthy Children," Brain Imaging Behav, 3(4), pp. 307-316.
[49] Scarisbrick, D. J., Tweedy, J. R., and Kuslansky, G., 1987, "Hand preference and performance effects on line bisection," Neuropsychologia, 25(4), pp. 695-699.
[50] Fukatsu, R., Fujii, T., Kimura, I., Saso, S., and Kogure, K., 1990, "Effects of hand and spatial conditions on visual line bisection," Tohoku J Exp Med, 161(4), pp. 329-333.
[51] Brodie, E. E., and Pettigrew, L. E., 1996, "Is left always right? Directional deviations in visual line bisection as a function of hand and initial scanning direction," Neuropsychologia, 34(5), pp. 467-470.
[52] Varnava, A., McCarthy, M., and Beaumont, J. G., 2002, "Line bisection in normal adults: direction of attentional bias for near and far space," Neuropsychologia, 40(8), pp. 1372-1378.
[53] Hausmann, M., Ergun, G., Yazgan, Y., and Güntürkün, O., 2002, "Sex differences in line bisection as a function of hand," Neuropsychologia, 40(3), pp. 235-240.
[54] Hausmann, M., Waldie, K. E., and Corballis, M. C., 2003, "Developmental changes in line bisection: a result of callosal maturation?," Neuropsychology, 17(1), pp. 155-160.

470
[55] Forderreuther, S., Sailer, U., and Straube, A., 2004, "Impaired self-perception of the hand in complex regional pain syndrome (CRPS)," Pain, 110(3), pp. 756-761.
[56] Yazgan, M. Y., Wexler, B. E., Kinsbourne, M., Peterson, B., and Leckman, J. F., 1995, "Functional significance of individual variations in callosal area," Neuropsychologia, 33(6), pp. 769-779.
[57] Pierce, C. A., Jewell, G., and Mennemeier, M., 2003, "Are psychophysical functions derived from line bisection reliable?," J Int Neuropsychol Soc, 9(1), pp. 72-78.
[58] Benwell, C. S., Thut, G., Grant, A., and Harvey, M., 2014, "A rightward shift in the visuospatial attention vector with healthy aging," Front Aging Neurosci, 6, p. 113.
[59] Ferrè, E. R., Longo, M. R., Fiori, F., and Haggard, P., 2013, "Vestibular modulation of spatial perception," Front Hum Neurosci, 7, p. 660.
[60] Brodie, E. E., and Dunn, E. M., 2005, "Visual line bisection in sinistrals and dextrals as a function of hemispace, hand, and scan direction," Brain Cogn, 58(2), pp. 149-156.
[61] Bissolotti, L., Sani, V., Gobbo, M., and C, O., "Adult scoliois and non-specific low back pain: analysis of trunk kinematics," Proc. 9th International Conference on Conservative Management of Spinal Deformities - SOSORT 2012 Annual Meeting, Scoliosis, p. O32.
[62] Gill, K. P., and Callaghan, M. J., 1998, "The measurement of lumbar proprioception in individuals with and without low back pain," Spine (Phila Pa 1976), 23(3), pp. 371-377.
[63] McNair, P. J., and Heine, P. J., 1999, "Trunk proprioception: enhancement through lumbar bracing," Arch Phys Med Rehabil, 80(1), pp. 96-99.
[64] Swinkels, A., and Dolan, P., 1998, "Regional assessment of joint position sense in the spine," Spine (Phila Pa 1976), 23(5), pp. 590-597.
[65] Swinkels, A., and Dolan, P., 2000, "Spinal position sense is independent of the magnitude of movement," Spine (Phila Pa 1976), 25(1), pp. 98-104; discussion 105.
[66] Newcomer, K. L., Laskowski, E. R., Yu, B., Johnson, J. C., and An, K. N., 2000, "Differences in repositioning error among patients with low back pain compared with control subjects," Spine (Phila Pa 1976), 25(19), pp. 2488-2493.
[67] Koumantakis, G. A., Winstanley, J., and Oldham, J. A., 2002, "Thoracolumbar proprioception in individuals with and without low back pain: intratester reliability, clinical applicability, and validity," J Orthop Sports Phys Ther, 32(7), pp. 327-335.
[68] Feipel, V., Parent, C., Dugailly, P. M., Brassinne, E., Salvia, P., and Rooze, M., 2003, "Development of kinematics tests for the evaluation of lumbar proprioception and equilibration," Clin Biomech (Bristol, Avon), 18(7), pp. 612-618.
[69] Preuss, R., Grenier, S., and McGill, S., 2003, "The effect of test position on lumbar spine position sense," J Orthop Sports Phys Ther, 33(2), pp. 73-78.
[70] Descarreaux, M., Blouin, J. S., and Teasdale, N., 2005, "Repositioning accuracy and movement parameters in low back pain subjects and healthy control subjects," Eur Spine J, 14(2), pp. 185-191.
[71] Lee, A. S., Cholewicki, J., Reeves, N. P., Zazulak, B. T., and Mysliwiec, L. W., 2010, "Comparison of trunk proprioception between patients with low back pain and healthy controls," Arch Phys Med Rehabil, 91(9), pp. 1327-1331.
471
[72] Tsai, Y. S., Sell, T. C., Smoliga, J. M., Myers, J. B., Learman, K. E., and Lephart, S. M., 2010, "A comparison of physical characteristics and swing mechanics between golfers with and without a history of low back pain," J Orthop Sports Phys Ther, 40(7), pp. 430-438.
[73] Georgy, E. E., 2011, "Lumbar repositioning accuracy as a measure of proprioception in patients with back dysfunction and healthy controls," Asian Spine J, 5(4), pp. 201-207.
[74] Gong, W., 2014, "The influence of lumbar joint mobilization on joint position sense in normal adults," J Phys Ther Sci, 26(12), pp. 1985-1987.
[75] Silfies, S., Cholewicki, J., Reeves, N., and Greene, H., 2017, "Lumbar position sense and the risk of low back injuries in college athletes: a prospective cohort study.," BMC Musculoskeletal Disorders, 8, p. 129.
[76] Pickard, C. M., Sullivan, P. E., Allison, G. T., and Singer, K. P., 2003, "Is there a difference in hip joint position sense between young and older groups?," J Gerontol A Biol Sci Med Sci, 58(7), pp. 631-635.
[77] Wilson, S. E., and Granata, K. P., 2003, "Reposition sense of lumbar curvature with flexed and asymmetric lifting postures," Spine (Phila Pa 1976), 28(5), pp. 513-518.
[78] Allison, G. T., and Fukushima, S., 2003, "Estimating three-dimensional spinal repositioning error: the impact of range, posture, and number of trials," Spine (Phila Pa 1976), 28(22), pp. 2510-2516.
[79] Newcomer, K., Laskowski, E. R., Yu, B., Larson, D. R., and An, K. N., 2000, "Repositioning error in low back pain. Comparing trunk repositioning error in subjects with chronic low back pain and control subjects," Spine (Phila Pa 1976), 25(2), pp. 245-250.
[80] McGlashen, K., Ashton-Miller, J. A., Green, M., and Schultz, A. B., 1991, "Trunk positioning accuracy in the frontal and sagittal planes," J Orthop Res, 9(4), pp. 576-583.
[81] Alahmari, K. A., Reddy, R. S., Silvian, P. S., Ahmad, I., Kakaraparthi, V. N., and Alam, M. M., 2017, "Association of age on cervical joint position error," J Adv Res, 8(3), pp. 201-207.
[82] Herter, T. M., Scott, S. H., and Dukelow, S. P., 2014, "Systematic changes in position sense accompany normal aging across adulthood," J Neuroeng Rehabil, 11, p. 43.
[83] Kaplan, F. S., Nixon, J. E., Reitz, M., Rindfleish, L., and Tucker, J., 1985, "Age-related changes in proprioception and sensation of joint position," Acta Orthop Scand, 56(1), pp. 72-74.
[84] Petrella, R. J., Lattanzio, P. J., and Nelson, M. G., 1997, "Effect of age and activity on knee joint proprioception," Am J Phys Med Rehabil, 76(3), pp. 235-241.
[85] Skinner, H. B., Barrack, R. L., and Cook, S. D., 1984, "Age-related decline in proprioception," Clin Orthop Relat Res(184), pp. 208-211.
[86] Ashton-Miller, J. A., McGlashen, K. M., and Schultz, A. B., 1992, "Trunk positioning accuracy in children 7-18 years old," J Orthop Res, 10(2), pp. 217-225.

472
Chapter 5
[1] von Elm, E., Altman, D. G., Egger, M., Pocock, S. J., Gøtzsche, P. C., Vandenbroucke, J. P., and Initiative, S., 2008, "The Strengthening the Reporting of Observational Studies in Epidemiology (STROBE) statement: guidelines for reporting observational studies," J Clin Epidemiol, 61(4), pp. 344-349.
[2] Vandenbroucke, J. P., von Elm, E., Altman, D. G., Gøtzsche, P. C., Mulrow, C. D., Pocock, S. J., Poole, C., Schlesselman, J. J., Egger, M., and Initiative, S., 2007, "Strengthening the Reporting of Observational Studies in Epidemiology (STROBE): explanation and elaboration," Epidemiology, 18(6), pp. 805-835.
[3] Williams, M. A., Heine, P. J., Williamson, E. M., Toye, F., Dritsaki, M., Petrou, S., Crossman, R., Lall, R., Barker, K. L., Fairbank, J., Harding, I., Gardner, A., Slowther, A. M., Coulson, N., and Lamb, S. E., 2015, "Active Treatment for Idiopathic Adolescent Scoliosis (ACTIvATeS): a feasibility study," Health Technol Assess, 19(55), pp. 1-242.
[4] Schulz, K. F., and Grimes, D. A., 2002, "Case-control studies: research in reverse," Lancet, 359(9304), pp. 431-434.
[5] Council, M. R., 2004, "MRC ethics guide: medical research involving children," Medical Research Council, London.
[6] Fairbank, J., 2004, "Historical perspective: William Adams, the forward bending test, and the spine of Gideon Algernon Mantell," Spine (Phila Pa 1976), 29(17), pp. 1953-1955.
[7] dos Santos Silva, I., 1999, Cancer epidemiology: principles and methods, International Agency for Research on Cancer, World Health Organisation, Lyon, France.
[8] Cromer, J. A., Schembri, A. J., Harel, B. T., and Maruff, P., 2015, "The nature and rate of cognitive maturation from late childhood to adulthood," Front Psychol, 6, p. 704.
[9] Malina, R., Bouchard, C., and Bar-Or, O., 2004, Growth, maturation and physical activity, Human Kinetics, Champaign, Illinois.
[10] Tanner, J., 1989, "Foetus into Man. Physical growth from conception to maturity," Castlemead Publications, London, pp. 6-23.
[11] Konieczny, M. R., Senyurt, H., and Krauspe, R., 2013, "Epidemiology of adolescent idiopathic scoliosis," J Child Orthop, 7(1), pp. 3-9.
[12] Milenkovic, S., and Dragovic, M., 2013, "Modification of the Edinburgh Handedness Inventory: a replication study," Laterality, 18(3), pp. 340-348.
[13] Office of National Statistics, 2007/8, "Small area income estimates England and Wales." https://www.ons.gov.uk/employmentandlabourmarket/peopleinwork/earningsandworkinghours/datasets/smallareaincomeestimatesformiddlelayersuperoutputareasenglandandwales. Access date: 2017.
[14] NHS choices., 2015, "BMI healthy weight calculator." https://www.nhs.uk/Tools/Pages/Healthyweightcalculator.aspx Access date: 2017.
[15] Bagó, J., Climent, J. M., Pérez-Grueso, F. J., and Pellisé, F., 2013, "Outcome instruments to assess scoliosis surgery," Eur Spine J, 22 Suppl 2, pp. S195-202.
[16] Carreon, L. Y., Sanders, J. O., Polly, D. W., Sucato, D. J., Parent, S., Roy-Beaudry, M., Hopkins, J., McClung, A., Bratcher, K. R., Diamond, B. E., and Group, S. D. S., 2011, "Spinal
473
appearance questionnaire: factor analysis, scoring, reliability, and validity testing," Spine (Phila Pa 1976), 36(18), pp. E1240-1244.
[17] Carreon, LY, Sanders, J., Diab, M., Polly, D., Diamond, B., and DJ, S., 2013, "Discriminative properties of the Spinal Appearance Questionnaire compared with the Scoliosis Research Society-22 Revised," Spine deformity, 1, pp. 328-338.
[18] Matamalas, A., Bagó, J., D'Agata, E., and Pellisé, F., 2014, "Body image in idiopathic scoliosis: a comparison study of psychometric properties between four patient-reported outcome instruments," Health Qual Life Outcomes, 12, p. 81.
[19] Mulcahey, M. J., Chafetz, R. S., Santangelo, A. M., Costello, K., Merenda, L. A., Calhoun, C., Samdani, A. F., and Betz, R. R., 2011, "Cognitive testing of the spinal appearance questionnaire with typically developing youth and youth with idiopathic scoliosis," J Pediatr Orthop, 31(6), pp. 661-667.
[20] Asher, M. A., Lai, S. M., Glattes, R. C., Burton, D. C., Alanay, A., and Bago, J., 2006, "Refinement of the SRS-22 Health-Related Quality of Life questionnaire Function domain," Spine (Phila Pa 1976), 31(5), pp. 593-597.
[21] Asher, M., Min Lai, S., Burton, D., and Manna, B., 2003, "The reliability and concurrent validity of the scoliosis research society-22 patient questionnaire for idiopathic scoliosis," Spine (Phila Pa 1976), 28(1), pp. 63-69.
[22] Asher, M., Min Lai, S., Burton, D., and Manna, B., 2003, "Scoliosis research society-22 patient questionnaire: responsiveness to change associated with surgical treatment," Spine (Phila Pa 1976), 28(1), pp. 70-73.
[23] Lai, S. M., Asher, M. A., Burton, D. C., and Carlson, B. B., 2010, "Identification of Scoliosis Research Society-22r Health-Related Quality of Life questionnaire domains using factor analysis methodology," Spine (Phila Pa 1976), 35(12), pp. 1236-1240.
[24] Asher, M., Min Lai, S., Burton, D., and Manna, B., 2003, "Discrimination validity of the scoliosis research society-22 patient questionnaire: relationship to idiopathic scoliosis curve pattern and curve size," Spine (Phila Pa 1976), 28(1), pp. 74-78.
[25] Glattes, R. C., Burton, D. C., Lai, S. M., Frasier, E., and Asher, M. A., 2007, "The reliability and concurrent validity of the Scoliosis Research Society-22r patient questionnaire compared with the Child Health Questionnaire-CF87 patient questionnaire for adolescent spinal deformity," Spine (Phila Pa 1976), 32(16), pp. 1778-1784.
[26] Adobor, R. D., Rimeslåtten, S., Keller, A., and Brox, J. I., 2010, "Repeatability, reliability, and concurrent validity of the scoliosis research society-22 questionnaire and EuroQol in patients with adolescent idiopathic scoliosis," Spine (Phila Pa 1976), 35(2), pp. 206-209.
[27] Bastrom, T. P., Bartley, C., Marks, M. C., Yaszay, B., Newton, P. O., and Group, H. S., 2015, "Postoperative Perfection: Ceiling Effects and Lack of Discrimination With Both SRS-22 and -24 Outcomes Instruments in Patients With Adolescent Idiopathic Scoliosis," Spine (Phila Pa 1976), 40(24), pp. E1323-1329.
[28] Berliner, J. L., Verma, K., Lonner, B. S., Penn, P. U., and Bharucha, N. J., 2013, "Discriminative validity of the Scoliosis Research Society 22 questionnaire among five curve-severity subgroups of adolescents with idiopathic scoliosis," Spine J, 13(2), pp. 127-133.
[29] Carreon, L. Y., Sanders, J. O., Diab, M., Sucato, D. J., Sturm, P. F., Glassman, S. D., and Group, S. D. S., 2010, "The minimum clinically important difference in Scoliosis Research

474
Society-22 Appearance, Activity, And Pain domains after surgical correction of adolescent idiopathic scoliosis," Spine (Phila Pa 1976), 35(23), pp. 2079-2083.
[30] Bagó, J., Pérez-Grueso, F. J., Les, E., Hernández, P., and Pellisé, F., 2009, "Minimal important differences of the SRS-22 Patient Questionnaire following surgical treatment of idiopathic scoliosis," Eur Spine J, 18(12), pp. 1898-1904.
[31] National Institute for Health and Clinical Excellence, 2017, "Position statement on use of the EQ-5D-5L valuation set." https://euroqol.org/nice-position-statement-on-the-eq-5d-5l/. Access date: 2017.
[32] Suzuki, N, Inami, K., Ono, T., Kohno, K., and Asher, M., 1999, "Analysis of posterior trunk symmetry index (POTSI) in scoliosis, part 1," Studies in Health Technolnogy & Informatics, 59, pp. 81-84.
[33] Inami, K, Suzuki, N., Ono, T., Yamashita, Y., Kohno, K., and Morisue, H., 1999, "Analysis of posterior trunk symmetry index (POTSI) in scoliosis, part 2," Studies in Health Technology & Informatics, 59, pp. 85-88.
[34] Klepper, S. E., 2011, "Measures of pediatric function: Child Health Assessment Questionnaire (C-HAQ), Juvenile Arthritis Functional Assessment Scale (JAFAS), Pediatric Outcomes Data Collection Instrument (PODCI), and Activities Scale for Kids (ASK)," Arthritis Care Res (Hoboken), 63 Suppl 11, pp. S371-382.
[35] Lerman, J. A., Sullivan, E., and Haynes, R. J., 2002, "The Pediatric Outcomes Data Collection Instrument (PODCI) and functional assessment in patients with adolescent or juvenile idiopathic scoliosis and congenital scoliosis or kyphosis," Spine (Phila Pa 1976), 27(18), pp. 2052-2057; discussion 2057-2058.
[36] Daltroy, L. H., Liang, M. H., Fossel, A. H., and Goldberg, M. J., 1998, "The POSNA pediatric musculoskeletal functional health questionnaire: report on reliability, validity, and sensitivity to change. Pediatric Outcomes Instrument Development Group. Pediatric Orthopaedic Society of North America," J Pediatr Orthop, 18(5), pp. 561-571.
[37] do Monte, F. A., Ferreira, M. N., Petribu, K. C., Almeida, N. C., Gomes, J. B., Mariano, M. H., Mesquita, Z. B., Simões, D. M., Rodrigues, A. F., and Souza, M. A., 2013, "Validation of the Brazilian version of the Pediatric Outcomes Data Collection Instrument: a cross-sectional evaluation in children and adolescents with juvenile idiopathic arthritis," BMC Pediatr, 13, p. 177.
[38] Haynes, R. J., and Sullivan, E., 2001, "The Pediatric Orthopaedic Society of North America pediatric orthopaedic functional health questionnaire: an analysis of normals," J Pediatr Orthop, 21(5), pp. 619-621.
[39] Shields, S., Mallory, M., and Simon, A., 1989, "The Body Awareness Questionnaire: reliability and validity," Journal of personality assessment, 53(4), pp. 802-815.
[40] Miller, L., Murphy, R., and Buss, A., 1981, "Consciousness of body: private and public," Journal of personality and social psychology, 41(2), pp. 397-406.
[41] Glasscock, N., 2003, "Exploring the relationships between psychosocial factors, biomechanical workstyle, muscle tension, and musculoskeletal discomfort reporting," PhD, North Carolina State University.

475
[42] Smith-Jackson, T., 1998, " Irrelevant speech, verbal task performance, and focused attention: a laboratory examination of the performance dynamics of open-plan offices." North Carolina State University, Unpublished work.
[43] Kelaher, D., Glasscock, N., and Mirka, G., "The effects of body awareness, movement direction, visual condition, and movement speed on trunk proprioception," Proc. Human Factors and Ergonomics Society 47th Annual Meeting, Human Factors and Ergonomics Society, pp. 1299-1302.
[44] Kelaher, D., 2006, "Effects of trunk extensor muscle fatigue on trunk proprioception and biomechanics," PhD, North Carolina State University, Raleigh, North Carolina.
[45] Jepsen, P., Johnsen, S. P., Gillman, M. W., and Sørensen, H. T., 2004, "Interpretation of observational studies," Heart, 90(8), pp. 956-960.
[46] Field, A., 2013, Discovering statistics using IBM SPSS, SAGE, London.
[47] Hammer, G. P., du Prel, J. B., and Blettner, M., 2009, "Avoiding bias in observational studies: part 8 in a series of articles on evaluation of scientific publications," Dtsch Arztebl Int, 106(41), pp. 664-668.
Chapter 6
[1] Williams, M. A., Heine, P. J., Williamson, E. M., Toye, F., Dritsaki, M., Petrou, S., Crossman, R., Lall, R., Barker, K. L., Fairbank, J., Harding, I., Gardner, A., Slowther, A. M., Coulson, N., and Lamb, S. E., 2015, "Active Treatment for Idiopathic Adolescent Scoliosis (ACTIvATeS): a feasibility study," Health Technol Assess, 19(55), pp. 1-242.
[2] Coventry City Council, 2014, https://www.coventry.gov.uk/schoolcontactdetails. Access date: 2017.
[3] Warwickshire County Council, 2014, https://www.warwickshire.gov.uk/schools. Access year: 2017.
[4] Council, Oxfordshire County Council, 2014, https://www.oxfordshire.gov.uk/cms/schools/list/all?utm_source=FURL-1&utm_medium=schoolslist&utm_term=nil&utm_content=&utm_campaign=schoolslist. access year: 2017.
[5] Glassman, S. D., Berven, S., Bridwell, K., Horton, W., and Dimar, J. R., 2005, "Correlation of radiographic parameters and clinical symptoms in adult scoliosis," Spine (Phila Pa 1976), 30(6), pp. 682-688.
[6] Field, A., 2013, Discovering statistics using IBM SPSS, SAGE, London.
[7] Office of National Statistics, 2009, "Mid 2009 population estimates: Great Britain; estimated resident population by single year of age and sex.."
[8] Konieczny, M. R., Senyurt, H., and Krauspe, R., 2013, "Epidemiology of adolescent idiopathic scoliosis," J Child Orthop, 7(1), pp. 3-9.
[9] Carreon, L. Y., Sanders, J. O., Polly, D. W., Sucato, D. J., Parent, S., Roy-Beaudry, M., Hopkins, J., McClung, A., Bratcher, K. R., Diamond, B. E., and Group, S. D. S., 2011, "Spinal

476
appearance questionnaire: factor analysis, scoring, reliability, and validity testing," Spine (Phila Pa 1976), 36(18), pp. E1240-1244.
[10] Carreon, LY, Sanders, J., Diab, M., Polly, D., Diamond, B., and DJ, S., 2013, "Discriminative properties of the Spinal Appearance Questionnaire compared with the Scoliosis Research Society-22 Revised," Spine deformity, 1, pp. 328-338.
[11] Matamalas, A., Bagó, J., D'Agata, E., and Pellisé, F., 2014, "Body image in idiopathic scoliosis: a comparison study of psychometric properties between four patient-reported outcome instruments," Health Qual Life Outcomes, 12, p. 81.
[12] Szende, A., Janssen, B., and Cabases, J., 2014, Self-reported population health: an international perspective based on EQ5D, Springer Open.
[13] Zanini, A., Aiello, M., Adamo, D., Casale, S., Cherubino, F., Della Patrona, S., Raimondi, E., Zampogna, E., Chetta, A., and Spanevello, A., 2015, "Estimation of minimal clinically important difference in EQ-5D visual analog scale score after pulmonary rehabilitation in subjects with COPD," Respir Care, 60(1), pp. 88-95.
[14] Chen, P., Lin, K. C., Liing, R. J., Wu, C. Y., Chen, C. L., and Chang, K. C., 2016, "Validity, responsiveness, and minimal clinically important difference of EQ-5D-5L in stroke patients undergoing rehabilitation," Qual Life Res, 25(6), pp. 1585-1596.
[15] Nolan, C. M., Longworth, L., Lord, J., Canavan, J. L., Jones, S. E., Kon, S. S., and Man, W. D., 2016, "The EQ-5D-5L health status questionnaire in COPD: validity, responsiveness and minimum important difference," Thorax, 71(6), pp. 493-500.
[16] Verma, K., Lonner, B., Hoashi, J. S., Lafage, V., Dean, L., Engel, I., and Goldstein, Y., 2010, "Demographic factors affect Scoliosis Research Society-22 performance in healthy adolescents: a comparative baseline for adolescents with idiopathic scoliosis," Spine (Phila Pa 1976), 35(24), pp. 2134-2139.
[17] Asher, M., Min Lai, S., Burton, D., and Manna, B., 2003, "Discrimination validity of the scoliosis research society-22 patient questionnaire: relationship to idiopathic scoliosis curve pattern and curve size," Spine (Phila Pa 1976), 28(1), pp. 74-78.
[18] Berliner, J. L., Verma, K., Lonner, B. S., Penn, P. U., and Bharucha, N. J., 2013, "Discriminative validity of the Scoliosis Research Society 22 questionnaire among five curve-severity subgroups of adolescents with idiopathic scoliosis," Spine J, 13(2), pp. 127-133.
[19] Bastrom, T. P., Bartley, C., Marks, M. C., Yaszay, B., Newton, P. O., and Group, H. S., 2015, "Postoperative Perfection: Ceiling Effects and Lack of Discrimination With Both SRS-22 and -24 Outcomes Instruments in Patients With Adolescent Idiopathic Scoliosis," Spine (Phila Pa 1976), 40(24), pp. E1323-1329.
[20] Asher, M., Min Lai, S., Burton, D., and Manna, B., 2003, "Scoliosis research society-22 patient questionnaire: responsiveness to change associated with surgical treatment," Spine (Phila Pa 1976), 28(1), pp. 70-73.
[21] Carreon, L. Y., Sanders, J. O., Diab, M., Sucato, D. J., Sturm, P. F., Glassman, S. D., and Group, S. D. S., 2010, "The minimum clinically important difference in Scoliosis Research Society-22 Appearance, Activity, And Pain domains after surgical correction of adolescent idiopathic scoliosis," Spine (Phila Pa 1976), 35(23), pp. 2079-2083.

477
[22] Rushton, P. R., and Grevitt, M. P., 2013, "Comparison of untreated adolescent idiopathic scoliosis with normal controls: a review and statistical analysis of the literature," Spine (Phila Pa 1976), 38(9), pp. 778-785.
[23] Bagó, J., Pérez-Grueso, F. J., Les, E., Hernández, P., and Pellisé, F., 2009, "Minimal important differences of the SRS-22 Patient Questionnaire following surgical treatment of idiopathic scoliosis," Eur Spine J, 18(12), pp. 1898-1904.
[24] Wand, B. M., Keeves, J., Bourgoin, C., George, P. J., Smith, A. J., O'Connell, N. E., and Moseley, G. L., 2013, "Mislocalization of sensory information in people with chronic low back pain: A preliminary investigation," Clinical Journal of Pain, 29(8), pp. 737-743.
[25] Harvie, D., Kelly, J., Buckman, H., Chan, J., Sutherland, G., Catley, M., Novak, J., Tuttle, N., Sterling, M., 2017, “Tactile acuity testing at the neck: A comparison of methods”, Musculoskelet Sci Pract., 32, pp 23-30.
[26] Wallwork, S. B., Butler, D. S., Fulton, I., Stewart, H., Darmawan, I., and Moseley, G. L., 2013, "Left/right neck rotation judgments are affected by age, gender, handedness and image rotation," Manual Therapy, 18(3), pp. 225-230.
[27] Coslett, H. B., Medina, J., Kliot, D., and Burkey, A. R., 2010, "Mental motor imagery indexes pain: The hand laterality task," European Journal of Pain, 14(10), pp. 1007-1013.
[28] Emery, C. A., Cassidy, J. D., Klassen, T. P., Rosychuk, R. J., and Rowe, B. B., 2005, "Development of a clinical static and dynamic standing balance measurement tool appropriate for use in adolescents," Phys Ther, 85(6), pp. 502-514.
[29] dos Santos Silva, I., 1999, Cancer epidemiology: principles and methods, International Agency for Research on Cancer, World Health Organisation, Lyon, France.
Chapter 7
[1] Berryman, F., Pynsent, P., Fairbank, J., and Disney, S., 2008, "A new system for measuring three-dimensional back shape in scoliosis," Eur Spine J, 17(5), pp. 663-672.
[2] Fidler, C., Turner-Smith, A., and Gant, C., 1984, "Repeatability of ISIS analysis in normal subjects." Annual Report of Oxford Orthopaedic Engineering Centre. 11:45-48
[3] Weisz, I., Jefferson, R. J., Turner-Smith, A. R., Houghton, G. R., and Harris, J. D., 1988, "ISIS scanning: a useful assessment technique in the management of scoliosis," Spine (Phila Pa 1976), 13(4), pp. 405-408.
[4] Turner-Smith, A. R., Harris, J. D., Houghton, G. R., and Jefferson, R. J., 1988, "A method for analysis of back shape in scoliosis," J Biomech, 21(6), pp. 497-509.
[5] Carr, A. J., Jefferson, R. J., Turner-Smith, A. R., and Beavis, A., 1991, "An analysis of normal back shape measured by ISIS scanning," Spine (Phila Pa 1976), 16(6), pp. 656-659.
[6] Saltikov, J.A., Van Schaik, P., Bell, J.A., Warren, J.G., Wojcik, A.S., Papastefanou, S.L., 2002, “3D back shape in normal young adults”, Studies in Health Technology and Informatics, 88, pp 81-85.

478
Chapter 8
[1] Jefferson, R. J., Weisz, I., Turner-Smith, A. R., Harris, J. D., and Houghton, G. R., 1988, "Scoliosis surgery and its effect on back shape," J Bone Joint Surg Br, 70(2), pp. 261-266.
[2] Carr, A. J., Jefferson, R. J., Turner-Smith, A. R., and Beavis, A., 1991, "An analysis of normal back shape measured by ISIS scanning," Spine (Phila Pa 1976), 16(6), pp. 656-659.
[3] Weisz, I., Jefferson, R. J., Turner-Smith, A. R., Houghton, G. R., and Harris, J. D., 1988, "ISIS scanning: a useful assessment technique in the management of scoliosis," Spine (Phila Pa 1976), 13(4), pp. 405-408.
[4] Turner-Smith, A. R., Harris, J. D., Houghton, G. R., and Jefferson, R. J., 1988, "A method for analysis of back shape in scoliosis," J Biomech, 21(6), pp. 497-509.
[5] Berryman, F., Pynsent, P., Fairbank, J., and Disney, S., 2008, "A new system for measuring three-dimensional back shape in scoliosis," Eur Spine J, 17(5), pp. 663-672.
[6] Liu, X., Thometz, J., Tassone, J., Paulsen, L., and Lyon, R., 2013, "Historical review and experience with the use of surface topographic systems in children with idiopathic scoliosis.," OA Musculoskeletal Medicine, 1(1), p. 9.
Chapter 9
[1] Williams, M. A., Heine, P. J., Williamson, E. M., Toye, F., Dritsaki, M., Petrou, S., Crossman, R., Lall, R., Barker, K. L., Fairbank, J., Harding, I., Gardner, A., Slowther, A. M., Coulson, N., and Lamb, S. E., 2015, "Active Treatment for Idiopathic Adolescent Scoliosis (ACTIvATeS): a feasibility study," Health Technol Assess, 19(55), pp. 1-242.
Chapter 10
[1] Weinstein, S. L., 1999, "Natural history," Spine (Phila Pa 1976), 24(24), pp. 2592-2600.
[2] Catley, M. J., Tabor, A., Wand, B. M., and Moseley, G. L., 2013, "Assessing tactile acuity in rheumatology and musculoskeletal medicine--how reliable are two-point discrimination tests at the neck, hand, back and foot?," Rheumatology (Oxford), 52(8), pp. 1454-1461.
[3] Wand, B. M., Catley, M. J., Luomajoki, H. A., O'Sullivan, K. J., Di Pietro, F., O'Connell, N. E., and Moseley, G. L., 2014, "Lumbar tactile acuity is near identical between sides in healthy pain-free participants," Man Ther, 19(5), pp. 504-507.
[4] Bray, H., and Moseley, G. L., 2011, "Disrupted working body schema of the trunk in people with back pain," British Journal of Sports Medicine, 45(3), pp. 168-173.
[5] Linder, M., Michaelson, P., and Röijezon, U., 2016, "Laterality judgments in people with low back pain--A cross-sectional observational and test-retest reliability study," Man Ther, 21, pp. 128-133.

479
[6] Boonstra, A. M., de Vries, S. J., Veenstra, E., Tepper, M., Feenstra, W., and Otten, E., 2012, "Using the Hand Laterality Judgement Task to assess motor imagery: a study of practice effects in repeated measurements," Int J Rehabil Res, 35(3), pp. 278-280.
[7] Ashton-Miller, J. A., McGlashen, K. M., and Schultz, A. B., 1992, "Trunk positioning accuracy in children 7-18 years old," J Orthop Res, 10(2), pp. 217-225.
[8] Bagó, J., Pérez-Grueso, F. J., Les, E., Hernández, P., and Pellisé, F., 2009, "Minimal important differences of the SRS-22 Patient Questionnaire following surgical treatment of idiopathic scoliosis," Eur Spine J, 18(12), pp. 1898-1904.
[9] Carreon, L. Y., Sanders, J. O., Diab, M., Sucato, D. J., Sturm, P. F., Glassman, S. D., and Group, S. D. S., 2010, "The minimum clinically important difference in Scoliosis Research Society-22 Appearance, Activity, And Pain domains after surgical correction of adolescent idiopathic scoliosis," Spine (Phila Pa 1976), 35(23), pp. 2079-2083.
Chapter 11
[1] Carreon, LY, Sanders, J., Diab, M., Polly, D., Diamond, B., and DJ, S., 2013, "Discriminative properties of the Spinal Appearance Questionnaire compared with the Scoliosis Research Society-22 Revised," Spine deformity, 1, pp. 328-338.
[2] Matamalas, A., Bagó, J., D'Agata, E., and Pellisé, F., 2014, "Body image in idiopathic scoliosis: a comparison study of psychometric properties between four patient-reported outcome instruments," Health Qual Life Outcomes, 12, p. 81.
[3] Weinstein, S.L., 1999, “Natural history”, Spine (Phila Pa 1976), 24(24), 2592-2600.
[4] Rushton P.R., Grevitt, M.P., 2013, “Comparison of untreated adolescent idiopathic scoliosis with normal controls: a review and statistical analysis of the literature”, Spine (Phila Pa 1976), 38(9), pp 778-785.
[5] Cordover, A.M., Betz, R.R., Clements, D.H., Bosacco, S.J., 1997, “Natural history of adolescent thoracolumbar and lumbar idiopathic scoliosis into adulthood”, Journal of Spinal Disorders, 10(3), pp 193-6.
[6] Lerman, J. A., Sullivan, E., and Haynes, R. J., 2002, "The Pediatric Outcomes Data Collection Instrument (PODCI) and functional assessment in patients with adolescent or juvenile idiopathic scoliosis and congenital scoliosis or kyphosis," Spine (Phila Pa 1976), 27(18), pp. 2052-2057; discussion 2057-2058.
[7] Carreon, L. Y., Sanders, J. O., Polly, D. W., Sucato, D. J., Parent, S., Roy-Beaudry, M., Hopkins, J., McClung, A., Bratcher, K. R., Diamond, B. E., and Group, S. D. S., 2011, "Spinal appearance questionnaire: factor analysis, scoring, reliability, and validity testing," Spine (Phila Pa 1976), 36(18), pp. E1240-1244.
[8] Asher, M., Min Lai, S., Burton, D., and Manna, B., 2003, "Discrimination validity of the scoliosis research society-22 patient questionnaire: relationship to idiopathic scoliosis curve pattern and curve size," Spine (Phila Pa 1976), 28(1), pp. 74-78.

480
[9] Berliner, J. L., Verma, K., Lonner, B. S., Penn, P. U., and Bharucha, N. J., 2013, "Discriminative validity of the Scoliosis Research Society 22 questionnaire among five curve-severity subgroups of adolescents with idiopathic scoliosis," Spine J, 13(2), pp. 127-133.
[10] Bastrom, T. P., Bartley, C., Marks, M. C., Yaszay, B., Newton, P. O., and Group, H. S., 2015, "Postoperative Perfection: Ceiling Effects and Lack of Discrimination With Both SRS-22 and -24 Outcomes Instruments in Patients With Adolescent Idiopathic Scoliosis," Spine (Phila Pa 1976), 40(24), pp. E1323-1329.
[11] Asher, M., Min Lai, S., Burton, D., and Manna, B., 2003, "Scoliosis research society-22 patient questionnaire: responsiveness to change associated with surgical treatment," Spine (Phila Pa 1976), 28(1), pp. 70-73.
[12] Carreon, L. Y., Sanders, J. O., Diab, M., Sucato, D. J., Sturm, P. F., Glassman, S. D., and Group, S. D. S., 2010, "The minimum clinically important difference in Scoliosis Research Society-22 Appearance, Activity, And Pain domains after surgical correction of adolescent idiopathic scoliosis," Spine (Phila Pa 1976), 35(23), pp. 2079-2083.

481
Appendices

482
Appendix 1 Systematic review search strategies
Medline
1. (AIS adj2 (patient$ or subject$ or girl$ or female$ or boy$ or male$)).ti,ab,kw. 2611
2. (scolio$ adj2 (subject$ or patient$ or child$ or girl$ or group$ or female$ or boy$ or male$ or pediatric$ or paediatric$)).ti,ab,kw. 3688
3. "adolescent idiopathic scoliosis".ti,ab,kw. 3439
4. or/1-3 7688
5. Adolescent/ 1894832
6. (young$ adj1 (adult$ or people$ or person$ or patient$ or girl$ or female$ or male$ or boy$ or child$)).ti,ab,kw. 259978
7. (teenager$ or adolescen$ or juvenile$ or youngster$).ti,ab,kw. 343380
8. or/5-7 2182148
9. Scoliosis/et [Etiology] 2299
10. Scoliosis/pp [physiopathology] 2318
11. (idiopathic adj2 scolios$).ti,ab,kw. 6382
12. 'ISc'.ti,ab,kw. 3735
13. or/9-12 12935
14. 8 and 13 6897
15. exp Neuromuscular Diseases/ 287734
16. ((neuromuscular or neurogenic or neurologic$) adj1 (disease$ or abnormalit$ or disorder$ or difficult$ or deficit$ or dysfunction$ or condition$)).ti,ab,kw. 104465
17. Proprioception/ 7372
18. Kinesthesis/ 3158
19. (propriocepti$ or "position matching" or "movement detection" or kinaesthes$ or kinesthes$ or kinematic$).ti,ab,kw. 42014
20. ((cortical or brain) adj1 (chang$ or reorganisation$ or representation$)).ti,ab,kw. 6274
21. Gait/ 25003
22. Posture/ph [physiology] 16188
23. Postural Balance/ 20646
24. (balanc$ or imbalanc$ or vestibular).ti,ab,kw. 344975
25. ((gait$ or postur$) adj1 (control$ or sway or analys$ or parameter$ or stability or pattern$ or equilibrium or stance or dysfunction or disequilibrium or asymmetr$ or symmetr$)).ti,ab,kw. 19722
26. (lateral$ adj1 discrimination).ti,ab,kw. 25
27. Biomechanical Phenomena/ 104349

483
28. Biophysical Phenomena/ 15367
29. Evoked Potentials, Somatosensory/ 11930
30. Sensory Thresholds/ 16264
31. Sensation Disorders/pp [physiopathology] 1346
32. Vibration/ 23759
33. (biomechanic$ or biophysical or "tactile acuity" or sensation$ or sensory or percept$ or sensorimotor or somatosensory or localis$ or localiz$ or "temporal order" or vibratory).ti,ab,kw. 1094017
34. (("two point" or sensory) adj1 discrimination).ti,ab,kw. 1717
35. Psychomotor Performance/ 59666
36. Movement/ph [physiology] 25859
37. ((motor or movement$) adj1 (change$ or control$ or function$ or cortex)).ti,ab,kw. 55107
38. ((muscle$ or muscular or rotational) adj2 (change$ or strength$ or activit$ or EMG or function$)).ti,ab,kw. 66926
39. Space Perception/ph [physiology] 15380
40. Visual Perception/ph [physiology] 30550
41. ((spatial or space or visual or orientation) adj1 (perception$ or awareness or process$ or impairment$ or disturbance$)).ti,ab,kw. 30365
42. (subjective adj1 visual adj1 (vertical or horizontal)).ti,ab,kw. 428
43. ((mid-line or midline) adj1 judgement$).ti,ab,kw. 1
44. ('SVV' or 'SSEP').ti,ab,kw. 2020
45. or/15-44 2071221
46. (scolio$ adj4 (physiopatholog$ or neuropatholog$ or neurophysiolog$ or neurogenic$ or neuromuscular or etiopathogenes$)).ti,ab,kw. 598
47. 4 and 45 1862
48. 14 and 45 2046
49. 8 and 46 406
50. 47 or 48 or 49 2875
Embase
1. Adolescent Idiopathic Scoliosis/ 2621
2. (AIS adj2 (patient$ or subject$ or girl$ or female$ or boy$ or male$)).ti,ab,kw. 5180
3. "adolescent idiopathic scoliosis".ti,ab,kw. 4424
4. (scolio$ adj2 (subject$ or patient$ or child$ or girl$ or group$ or female$ or boy$ or male$ or pediatric$ or paediatric$)).ti,ab,kw. 4685

484
5. or/1-4 11757
6. Idiopathic Scoliosis/ 4165
7. Scoliosis/ 21601
8. (idiopathic adj2 scolios$).ti,ab,kw. 8046
9. 'ISc'.ti,ab,kw. 4390
10. or/6-9 31675
11. Adolescent/ 1385714
12. Adolescence/ 34297
13. (young$ adj1 (adult$ or people$ or person$ or patient$ or girl$ or female$ or male$ or boy$ or child$)).ti,ab,kw. 343470
14. (teenager$ or adolescen$ or juvenile$ or youngster$).ti,ab,kw. 420319
15. or/11-14 1791196
16. 10 and 15 12085
17. exp Neuromuscular Disease/ 173247
18. Neurophysiology/ 26058
19. ((neuromuscular or neurogenic or neurologic$) adj1 (disease$ or abnormalit$ or disorder$ or difficult$ or deficit$ or dysfunction$ or condition$)).ti,ab,kw. 146232
20. Proprioception/ 12337
21. Kinesthesia/ 1917
22. Kinematics/ 21542
23. (propriocepti$ or "position matching" or "movement detection" or kinaesthes$ or kinesthes$ or kinematic$).ti,ab,kw. 49518
24. ((cortical or brain) adj1 (chang$ or reorganisation$ or representation$)).ti,ab,kw. 8783
25. Gait/ 47281
26. Body Position/ 16853
27. Body Equilibrium/ 16405
28. (balanc$ or imbalanc$ or vestibular).ti,ab,kw. 437842
29. ((gait$ or postur$) adj1 (control$ or sway or analys$ or parameter$ or stability or pattern$ or equilibrium or stance or dysfunction or disequilibrium or asymmetr$ or symmetr$)).ti,ab,kw. 27731
30. (lateral$ adj1 discrimination).ti,ab,kw. 29
31. Biomechanics/ 98410
32. Biophysics/ 12968
33. Somatosensory Evoked Potential/ 1510
34. Sensory Evoked Potential/ 317
35. Evoked somatosensory response/ 17184
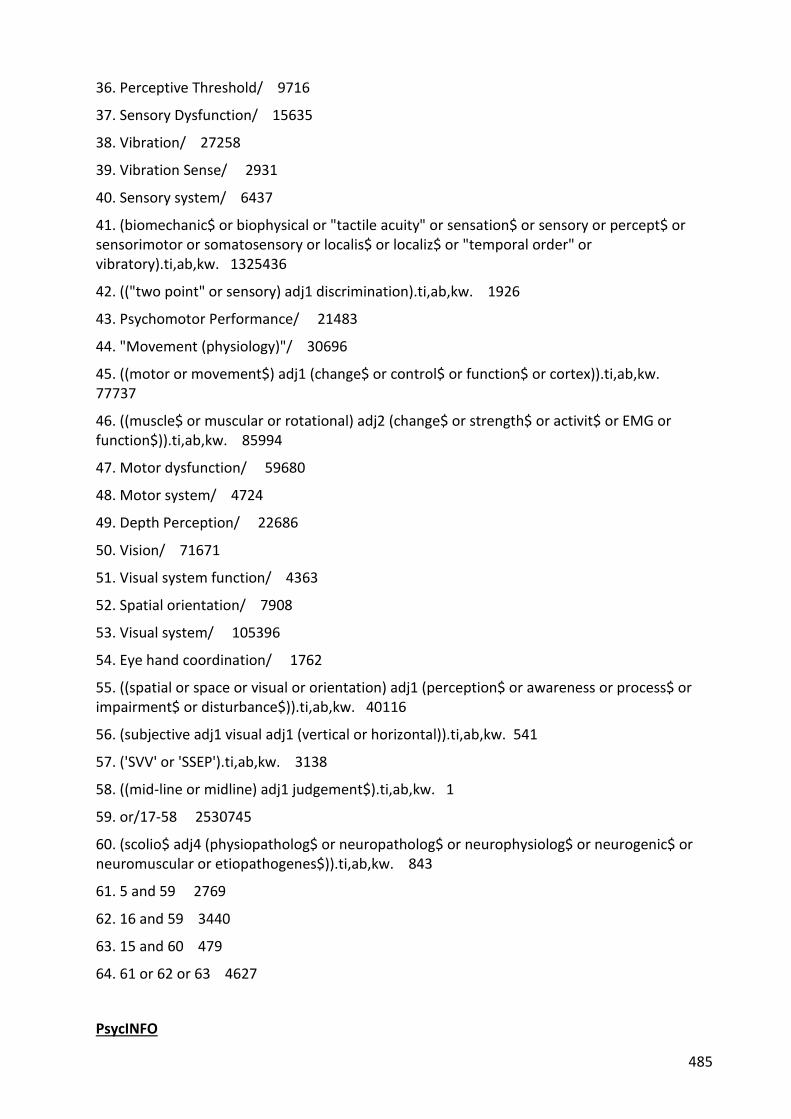
485
36. Perceptive Threshold/ 9716
37. Sensory Dysfunction/ 15635
38. Vibration/ 27258
39. Vibration Sense/ 2931
40. Sensory system/ 6437
41. (biomechanic$ or biophysical or "tactile acuity" or sensation$ or sensory or percept$ or sensorimotor or somatosensory or localis$ or localiz$ or "temporal order" or vibratory).ti,ab,kw. 1325436
42. (("two point" or sensory) adj1 discrimination).ti,ab,kw. 1926
43. Psychomotor Performance/ 21483
44. "Movement (physiology)"/ 30696
45. ((motor or movement$) adj1 (change$ or control$ or function$ or cortex)).ti,ab,kw. 77737
46. ((muscle$ or muscular or rotational) adj2 (change$ or strength$ or activit$ or EMG or function$)).ti,ab,kw. 85994
47. Motor dysfunction/ 59680
48. Motor system/ 4724
49. Depth Perception/ 22686
50. Vision/ 71671
51. Visual system function/ 4363
52. Spatial orientation/ 7908
53. Visual system/ 105396
54. Eye hand coordination/ 1762
55. ((spatial or space or visual or orientation) adj1 (perception$ or awareness or process$ or impairment$ or disturbance$)).ti,ab,kw. 40116
56. (subjective adj1 visual adj1 (vertical or horizontal)).ti,ab,kw. 541
57. ('SVV' or 'SSEP').ti,ab,kw. 3138
58. ((mid-line or midline) adj1 judgement$).ti,ab,kw. 1
59. or/17-58 2530745
60. (scolio$ adj4 (physiopatholog$ or neuropatholog$ or neurophysiolog$ or neurogenic$ or neuromuscular or etiopathogenes$)).ti,ab,kw. 843
61. 5 and 59 2769
62. 16 and 59 3440
63. 15 and 60 479
64. 61 or 62 or 63 4627
PsycINFO

486
1. (AIS adj2 (patient$ or subject$ or girl$ or female$ or boy$ or male$)).ti,ab,id. 176
2. (scolio$ adj2 (subject$ or patient$ or child$ or girl$ or group$ or female$ or boy$ or male$ or pediatric$ or paediatric$)).ti,ab,id. 69
3. "adolescent idiopathic scoliosis".ti,ab,id. 59
4. or/1-3 272
5. Adolescent Development/ 45166
6. "Adolescent".mh. 246082
7. (young$ adj1 (adult$ or people$ or person$ or patient$ or girl$ or female$ or male$ or boy$ or child$)).ti,ab,id. 131923
8. (teenager$ or adolescen$ or juvenile$ or youngster$).ti,ab,id. 262200
9. or/5-8 539901
10. "Scoliosis".mh. 138
11. Spinal Column/ 794
12. Spinal Cord Injuries/ 5108
13. Spinal Cord/ 6492
14. Musculoskeletal Disorders/ 2654
15. (idiopathic adj2 scolios$).ti,ab,id. 95
16. 'ISc'.ti,ab,id. 167
17. or/10-16 14799
18. 9 and 17 1158
19. "Neuromuscular Diseases".mh. 409
20. Neuromuscular Disorders/ 1073
21. Central Nervous System Disorders/ 1758
22. Neurophysiology/ 12652
23. ((neuromuscular or neurogenic or neurologic$) adj1 (disease$ or abnormalit$ or disorder$ or difficult$ or deficit$ or dysfunction$ or condition$)).ti,ab,id. 19847
24. Proprioception/ 930
25. Proprioceptors/ 359
26. "Kinesthesis".mh. 1593
27. (propriocepti$ or "position matching" or "movement detection" or kinaesthes$ or kinesthes$ or kinematic$).ti,ab,id. 10289
28. ((cortical or brain) adj1 (chang$ or reorganisation$ or representation$)).ti,ab,id. 4057
29. Gait/ 2363
30. "gait".mh. 2133
31. "posture".mh. 5927

487
32. "postural balance".mh. 3768
33. (balanc$ or imbalanc$ or vestibular).ti,ab,id. 74437
34. Equilibrium/ 3289
35. Labyrinth Disorders/ 502
36. ((gait$ or postur$) adj1 (control$ or sway or analys$ or parameter$ or stability or pattern$ or equilibrium or stance or dysfunction or disequilibrium or asymmetr$ or symmetr$)).ti,ab,id. 4333
37. (lateral$ adj1 discrimination).ti,ab,id. 33
38. "Biomechanical Phenomena".mh. 4544
39. "Biophysical Phenomena".mh. 265
40. Somatosensory Disorders/ 1300
41. Somatosensory Evoked Potentials/ 2665
42. "Evoked Potentials, Somatosensory".mh. 2044
43. "Sensory Thresholds".mh. 6474
44. Sensory Deprivation/ 1645
45. "Sensation Disorders".mh. 973
46. Vibration/ 1427
47. Biomechanics/ 408
48. (biomechanic$ or biophysical or "tactile acuity" or sensation$ or sensory or percept$ or sensorimotor or somatosensory or localis$ or localiz$ or "temporal order" or vibratory).ti,ab,id. 473073
49. (("two point" or sensory) adj1 discrimination).ti,ab,id. 567
50. "psychomotor performance".mh. 34550
51. Motor Processes/ 29819
52. Perceptual Motor Processes/ 13315
53. Movement Disorders/ 3138
54. "Movement".mh. 11767
55. ((motor or movement$) adj1 (change$ or control$ or function$ or cortex)).ti,ab,id. 24632
56. ((muscle$ or muscular or rotational) adj2 (change$ or strength$ or activit$ or EMG or function$)).ti,ab,id. 7040
57. "Space Perception".mh. 16958
58. "Spatial Orientation (Perception)"/ 7155
59. Visual Perception/ 39422
60. Vision/ 8867
61. ((spatial or space or visual or orientation) adj1 (perception$ or awareness or process$ or impairment$ or disturbance$)).ti,ab,id. 27475
62. (subjective adj1 visual adj1 (vertical or horizontal)).ti,ab,id. 177

488
63. ((mid-line or midline) adj1 judgement$).ti,ab,id. 1
64. ('SVV' or 'SSEP').ti,ab,id. 239
65. or/19-64 686839
66. (scolio$ adj4 (physiopatholog$ or neuropatholog$ or neurophysiolog$ or neurogenic$ or neuromuscular or etiopathogenes$)).ti,ab,id. 9
67. 4 and 65 62
68. 18 and 65 363
69. 9 and 66 2
70. 67 or 68 or 69 395
CINAHL
1. ((TI AIS N2 (patient* or subject* or girl* or female* or boy* or male*) OR (AB AIS N2 (patient* or subject* or girl* or female* or boy* or male*)) 1694
2. ((TI scolio* N2 (subject* or patient* or child* or girl* or group* or female* or boy* or male* or pediatric* or paediatric*) OR (AB scolio* N2 (subject* or patient* or child* or girl* or group* or female* or boy* or male* or pediatric* or paediatric*)) 1736
3. ((TI "adolescent idiopathic scoliosis") OR (AB "adolescent idiopathic scoliosis")) 1879
4. (MH "Scoliosis, Idiopathic, Adolescent") 889
5. S1 OR S2 OR S3 OR S4 4495
6. (MH "Adolescence") 438862
7. ((TI young* N1 (adult* or people* or person* or patient* or girl* or female* or male* or boy* or child*) OR (AB young* N1 (adult* or people* or person* or patient* or girl* or female* or male* or boy* or child*)) 87164
8. ((TI teenager* or adolescen* or juvenile* or youngster*) OR (AB teenager* or adolescen* or juvenile* or youngster*)) 468402
9. S6 OR S7 OR S8 520958
10. (MH "Scoliosis/ET") 477
11. (MH "Scoliosis/PP") 635
12. (MH "Scoliosis/DI") 573
13. ((TI idiopathic N2 scolios*) OR (AB idiopathic N2 scolios*)) 2871
14. ((TI "ISc") OR (AB "ISc")) 181
15. S10 OR S11 OR S12 OR S13 OR S14 3954
16. S9 AND S15 2987
17. (MH "Neuromuscular Diseases+") 628885
18. ((TI (neuromuscular or neurogenic or neurologic*) N1 (disease* or abnormalit* or disorder* or difficult* or deficit* or dysfunction* or condition*) OR (AB (neuromuscular or

489
neurogenic or neurologic*) N1 (disease* or abnormalit* or disorder* or difficult* or deficit* or dysfunction* or condition*)) 16948
19. (MH "Proprioception") 2839
20. (MH "Kinesthesis") 594
21. (MH "Kinetics") 5225
22. (MH "Kinematics") 13058
23. ((TI propriocepti* or "position matching" or "movement detection" or kinaesthes* or kinesthes* or kinematic*) OR (AB propriocepti* or "position matching" or "movement detection" or kinaesthes* or kinesthes* or kinematic*)) 20081
24. ((TI (cortical or brain) N1 (chang* or reorganisation* or representation*) OR (AB (cortical or brain) N1 (chang* or reorganisation* or representation*)) 2747
25. (MH "Gait") 8815
26. (MH "Posture/PH") 2583
27. (MH "Balance, Postural") 13615
28. ((TI balanc* or imbalanc* or vestibular) OR (AB balanc* or imbalanc* or vestibular)) 65888
29. (TI (gait* or postur*) N1 (control* or sway or analys* or parameter* or stability or pattern* or equilibrium or stance or dysfunction or disequilibrium or asymmetr* or symmetr*) OR (AB (gait* or postur*) N1 (control* or sway or analys* or parameter* or stability or pattern* or equilibrium or stance or dysfunction or disequilibrium or asymmetr* or symmetr*)) 9508
30. ((TI lateral* N1 discrimination) OR (AB lateral* N1 discrimination)) 5
31. (MH "Biomechanics") 19689
32. (MH "Biophysics") 1122
33. (MH "Evoked Potentials, Somatosensory") 1333
34. (MH "Evoked Potentials/PH") 1624
35. (MH "Sensation Disorders/PP") 307
36. (MH "Vibration") 3429
37. ((TI biomechanic* or biophysical or "tactile acuity" or sensation* or sensory or percept* or sensorimotor or somatosensory or localis* or localiz* or "temporal order" or vibratory) OR (AB biomechanic* or biophysical or "tactile acuity" or sensation* or sensory or percept* or sensorimotor or somatosensory or localis* or localiz* or "temporal order" or vibratory)) 210946
38. ((TI ("two point" or sensory) N1 discrimination) OR (AB ("two point" or sensory) N1 discrimination)) 270
39. (MH "Psychomotor Performance") 10565
40. (MH "Movement/PH") 3285
41. ((TI (motor or movement*) N1 (change* or control* or function* or cortex) OR (AB (motor or movement*) N1 (change* or control* or function* or cortex)) 13005

490
42. ((TI (muscle* or muscular or rotational) N2 (change* or strength* or activit* or EMG or function*) OR (AB (muscle* or muscular or rotational) N2 (change* or strength* or activit* or EMG or function*)) 22341
43. (MH "Spatial Perception") 2485
44. (MH "Visual Perception") 10217
45. ((TI (spatial or space or visual or orientation) N1 (perception* or awareness or process* or impairment* or disturbance*) OR (AB (spatial or space or visual or orientation) N1 (perception* or awareness or process* or impairment* or disturbance*)) 6807
46. ((TI (subjective N1 visual N1 (vertical or horizontal) OR (AB (subjective N1 visual N1 (vertical or horizontal)) 116
47. ((TI (mid-line or midline) N1 judgement*) OR (AB (mid-line or midline) N1 judgement*)) 1
48. (TI ('SVV' or 'SSEP') OR (AB ('SVV' or 'SSEP')) 420
49. S17 OR S18 OR S19 OR S20 OR S21 OR S22 OR S23 OR S24 OR S25 OR S26 OR S27 OR S28 OR S29 OR S30 OR S31 OR S32 OR S33 OR S34 OR S35 OR S36 OR S37 OR S38 OR S39 OR S40 OR S41 OR S42 OR S43 OR S44 OR S45 OR S46 OR S47 OR S48 411398
50. ((TI (scolio* N4 (physiopatholog* or neuropatholog* or neurophysiolog* or neurogenic* or neuromuscular or etiopathogenes*) OR (AB (scolio* N4 (physiopatholog* or neuropatholog* or neurophysiolog* or neurogenic* or neuromuscular or etiopathogenes*)) 256
51. S5 and S49 990
52. S16 and S49 785
53. S9 and S50 167
54. S51 OR S52 OR S53 1247
SportDISCUS
1. (DE "Adolescent idiopathic scoliosis") 77
2. ((TI AIS N2 (patient* or subject* or girl* or female* or boy* or male*) OR (AB AIS N2 (patient* or subject* or girl* or female* or boy* or male*) OR (KW AIS N2 (patient* or subject* or girl* or female* or boy* or male*)) 130
3. ((TI scolio* N2 (subject* or patient* or child* or girl* or group* or female* or boy* or male* or pediatric* or paediatric*) OR (AB scolio* N2 (subject* or patient* or child* or girl* or group* or female* or boy* or male* or pediatric* or paediatric*) OR (KW scolio* N2 (subject* or patient* or child* or girl* or group* or female* or boy* or male* or pediatric* or paediatric*)) 291
4. ((TI "adolescent idiopathic scoliosis") OR (AB "adolescent idiopathic scoliosis") OR (KW "adolescent idiopathic scoliosis")) 213
5. S1 OR S2 OR S3 OR S4 548
6. (DE "Teenagers") 28669
7. ((TI young* N1 (adult* or people* or person* or patient* or girl* or female* or male* or boy* or child*) OR (AB young* N1 (adult* or people* or person* or patient* or girl* or female*

491
or male* or boy* or child*) OR (KW young* N1 (adult* or people* or person* or patient* or girl* or female* or male* or boy* or child*)) 20738
8. ((TI teenager* or adolescen* or juvenile* or youngster*) OR (AB teenager* or adolescen* or juvenile* or youngster*) OR (KW teenager* or adolescen* or juvenile* or youngster*)) 38705
9. S6 OR S7 OR S8 75731
10. (DE "Scoliosis") 638
11. (DE "Scoliosis treatment") 107
12. (KW "scoliosis") 262
13. ((TI idiopathic N2 scolios*) OR (AB idiopathic N2 scolios*) OR (KW idiopathic N2 scolios*)) 370
14. ((TI "ISc") OR (AB "ISc") OR (KW "ISc")) 118
15. S10 OR S11 OR S12 OR S13 OR S14 998
16. S9 AND S15 371
17. (DE "Neuromuscular Diseases") 695
18. ((TI (neuromuscular or neurogenic or neurologic*) N1 (disease* or abnormalit* or disorder* or difficult* or deficit* or dysfunction* or condition*) OR (AB (neuromuscular or neurogenic or neurologic*) N1 (disease* or abnormalit* or disorder* or difficult* or deficit* or dysfunction* or condition*) OR (KW (neuromuscular or neurogenic or neurologic*) N1 (disease* or abnormalit* or disorder* or difficult* or deficit* or dysfunction* or condition*)) 2441
19. (DE "Proprioception") 1981
20. (DE "Muscular sense") 580
21. (DE "Dynamics") 3219
22. (DE "Kinematics") 9572
23. (DE "Human kinematics") 982
24. ((TI propriocepti* or "position matching" or "movement detection" or kinaesthes* or kinesthes* or kinematic*) OR (AB propriocepti* or "position matching" or "movement detection" or kinaesthes* or kinesthes* or kinematic*) OR (KW propriocepti* or "position matching" or "movement detection" or kinaesthes* or kinesthes* or kinematic*)) 19054
25. ((TI (cortical or brain) N1 (chang* or reorganisation* or representation*) OR (AB (cortical or brain) N1 (chang* or reorganisation* or representation*) OR (KW (cortical or brain) N1 (chang* or reorganisation* or representation*)) 490
26. (DE "Gait in humans") 5088
27. (DE "Gait disorders") 1692
28. (DE "Posture") 8309
29. (DE "Equilibrium (Physiology)") 3960
30. ((TI balanc* or imbalanc* or vestibular) OR (AB balanc* or imbalanc* or vestibular) OR (KW balanc* or imbalanc* or vestibular)) 31621

492
31. (TI (gait* or postur*) N1 (control* or sway or analys* or parameter* or stability or pattern* or equilibrium or stance or dysfunction or disequilibrium or asymmetr* or symmetr*) OR (AB (gait* or postur*) N1 (control* or sway or analys* or parameter* or stability or pattern* or equilibrium or stance or dysfunction or disequilibrium or asymmetr* or symmetr*) OR (KW (gait* or postur*) N1 (control* or sway or analys* or parameter* or stability or pattern* or equilibrium or stance or dysfunction or disequilibrium or asymmetr* or symmetr*)) 8246
32. ((TI lateral* N1 discrimination) OR (AB lateral* N1 discrimination) OR (KW lateral* N1 discrimination)) 6
33. (DE "Biomechanics") 29837
34. (DE "Biophysics") 1151
35. ((TI biomechanic* or biophysical or "tactile acuity" or sensation* or sensory or percept* or sensorimotor or somatosensory or localis* or localiz* or "temporal order" or vibratory) OR (AB biomechanic* or biophysical or "tactile acuity" or sensation* or sensory or percept* or sensorimotor or somatosensory or localis* or localiz* or "temporal order" or vibratory) OR (KW biomechanic* or biophysical or "tactile acuity" or sensation* or sensory or percept* or sensorimotor or somatosensory or localis* or localiz* or "temporal order" or vibratory)) 82430
36. ((TI ("two point" or sensory) N1 discrimination) OR (AB ("two point" or sensory) N1 discrimination) OR (KW ("two point" or sensory) N1 discrimination)) 92
37. (DE "Psychology of movement") 1418
38. (DE "Movement disorders") 1370
39. (DE "Perceptual-motor processes") 4737
40. ((TI (motor or movement*) N1 (change* or control* or function* or cortex) OR (AB (motor or movement*) N1 (change* or control* or function* or cortex) OR (KW (motor or movement*) N1 (change* or control* or function* or cortex)) 7435
41. ((TI (muscle* or muscular or rotational) N2 (change* or strength* or activit* or EMG or function*) OR (AB (muscle* or muscular or rotational) N2 (change* or strength* or activit* or EMG or function*) OR (KW (muscle* or muscular or rotational) N2 (change* or strength* or activit* or EMG or function*)) 22332
42. (DE "Spatial behavior") 237
43. (DE "Visual Perception") 2185
44. (DE "Motion perception (Vision)") 97
45. (DE "Sensorimotor cortex") 124
46. ((TI (spatial or space or visual or orientation) N1 (perception* or awareness or process* or impairment* or disturbance*) OR (AB (spatial or space or visual or orientation) N1 (perception* or awareness or process* or impairment* or disturbance*) OR (KW (spatial or space or visual or orientation) N1 (perception* or awareness or process* or impairment* or disturbance*)) 2185
47. ((TI (subjective N1 visual N1 (vertical or horizontal) OR (AB (subjective N1 visual N1 (vertical or horizontal) OR (KW (subjective N1 visual N1 (vertical or horizontal)) 22
48. ((TI (mid-line or midline) N1 judgement*) OR (AB (mid-line or midline) N1 judgement*) OR (KW (mid-line or midline) N1 judgement*)) 0

493
49. (TI ('SVV' or 'SSEP') OR (AB ('SVV' or 'SSEP') OR (KW ('SVV' or 'SSEP')) 44
50. (DE "Visual evoked response") 181
51. (DE "Evoked potentials (Electrophysiology)") 1758
52. S17 OR S18 OR S19 OR S20 OR S21 OR S22 OR S23 OR S24 OR S25 OR S26 OR S27 OR S28 OR S29 OR S30 OR S31 OR S32 OR S33 OR S34 OR S35 OR S36 OR S37 OR S38 OR S39 OR S40 OR S41 OR S42 OR S43 OR S44 OR S45 OR S46 OR S47 OR S48 OR S49 OR S50 OR S51 174233
53. ((TI (scolio* N4 (physiopatholog* or neuropatholog* or neurophysiolog* or neurogenic* or neuromuscular or etiopathogenes*) OR (AB (scolio* N4 (physiopatholog* or neuropatholog* or neurophysiolog* or neurogenic* or neuromuscular or etiopathogenes*) OR (KW (scolio* N4 (physiopatholog* or neuropatholog* or neurophysiolog* or neurogenic* or neuromuscular or etiopathogenes*)) 28
54. S5 and S52 187
55. S16 and S52 126
56. S9 and S53 12
57. S54 OR S55 OR S56 220
PEDro
1. In Abstract & Title:'scoliosis'
CDAS
1. (ZU "Scoliosis") 16
2. ((TI "scoliosis") OR (AB "scoliosis")) 67
3. S1 OR S2 67

494
Appendix 2 Participant information sheets (cases)
A2.1 Older child participant information sheet (cases)

495

496

497

498

499
A2.2 Younger child participant information sheet (cases)

500

501

502

503
A2.3 Parent participant information sheet (cases)

504

505

506

507

508

509
Appendix 3 Participant information sheets (controls)
A3.1 Older child participant information sheet (controls)

510

511

512

513
A3.2 Younger child participant information sheet (controls)

514

515

516

517

518
A3.3 Parent participant information sheet (controls)
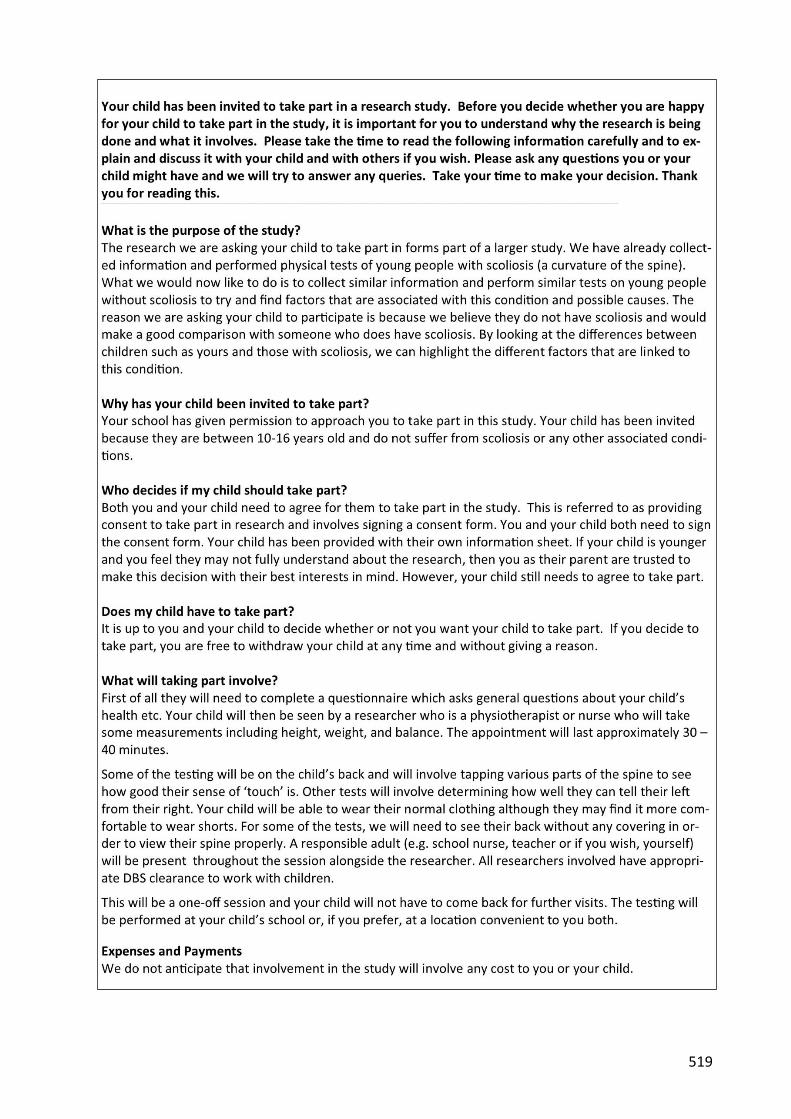
519

520

521

522
Appendix 4 Consent & eligibility forms
A4.1 Child consent form (cases)

523
A4.2 Parent consent form (cases)

524
A4.3 Eligibility checklist (cases)

525

526
A4.4 Consent & eligibility form (controls)

527

528
Appendix 5 Demographic questions (cases)

529

530

531

532
Appendix 6 Demographic questions (controls)

533

534

535

536
Appendix 7 X-ray information (cases)
A7.1 Case report form
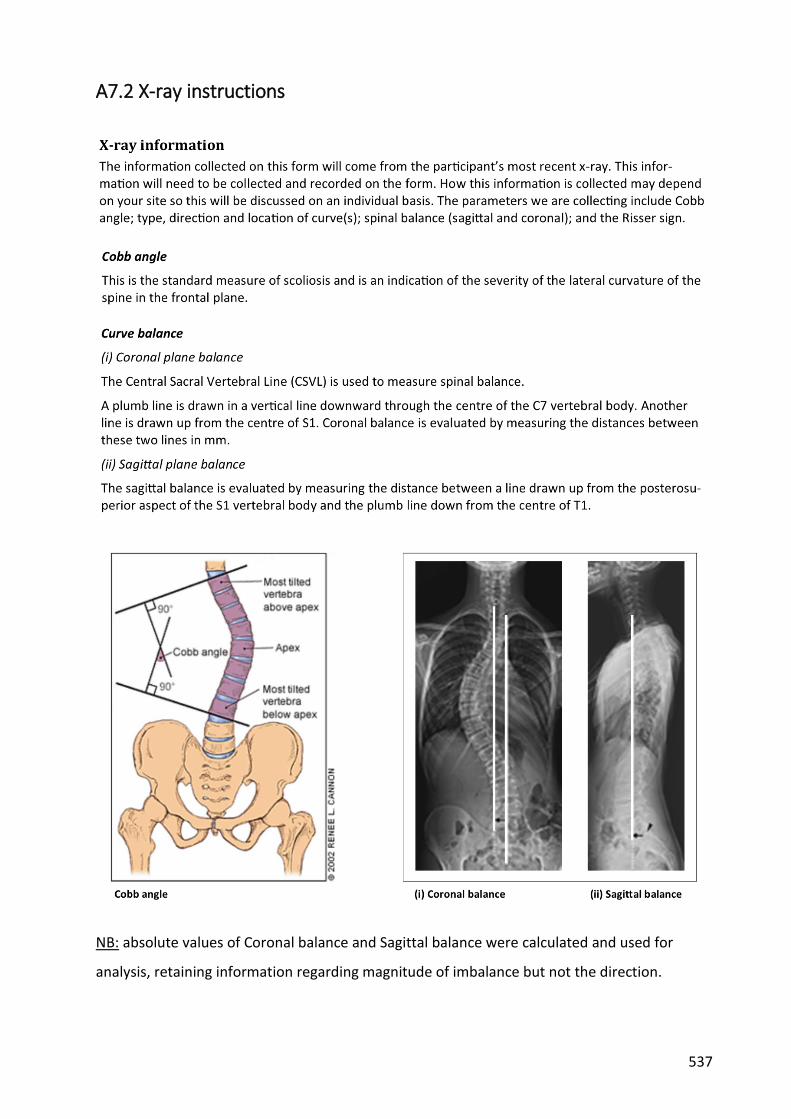
537
A7.2 X-ray instructions
NB: absolute values of Coronal balance and Sagittal balance were calculated and used for
analysis, retaining information regarding magnitude of imbalance but not the direction.

538

539
Appendix 8 Spinal Appearance Questionnaire (SAQ)
A8.1 SAQ questions

540

541

542
A8.2 SAQ scoring
Score total score = x
Question 1 2 3 4 5 6 7 8 9 10 (range = 10-50)
Score x Score 1 - 5 each question
Question 11 12 13 14 4-20) Lower the score the better
Appearance scale (sum of all scores)
Expectation scale (sum of all scores)
SAQ total score 14 (best) - 70 (worst)
Total = Appearance score + Expectations score
(range =
total score =

543
Appendix 9 Scoliosis Research Society questionnaire (SRS-
22r)
A9.1 SRS-22r questions

544
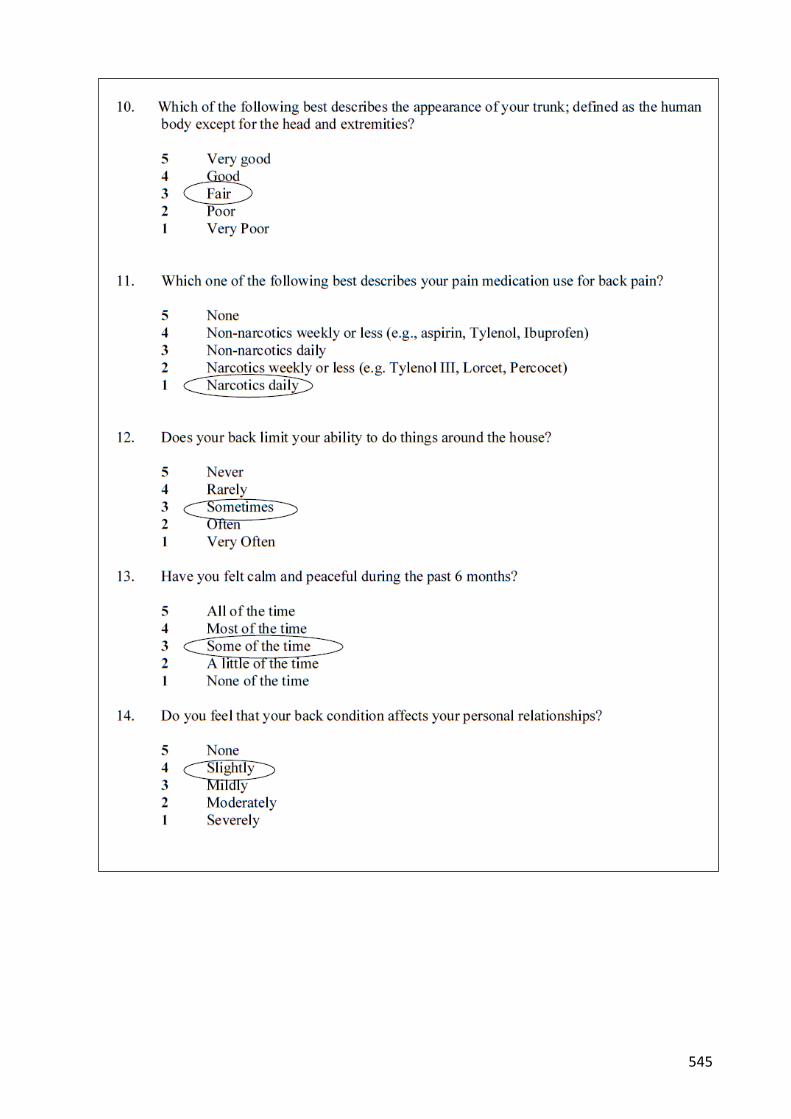
545

546

547
A9.2 SRS-22r scoring (example)

548
Appendix 10 EuroQol EQ5D-3L
Mobility
I have no problems in walking about 1
I have some problems in walking about 2
I am confined to bed 3
Self-care
I have no problems with self-care 1
I have some problems washing or dressing myself 2
I am unable to wash or dress myself 3
Usual activities
I have no problems with performing my usual activities 1
I have some problems with performing my usual activities 2
I am unable to perform my usual activities 3
Pain/discomfort
I have no pain or discomfort 1
I have moderate pain or discomfort 2
I have extreme pain or discomfort 3
Anxiety/depression
I am not anxious or depressed 1
I am moderately anxious or depressed 2
I am extremely anxious or depressed 3

549
To help people say how good or bad a health state is, we have
drawn a scale (rather like a Thermometer) on which the best state you can imagine is marked
by 100 and the worst state you can imagine is marked by 0.
We would like you to indicate on this scale how good or bad is
your own health today, in your opinion.
Please do this by drawing a line from the box below, to whichever point on the scale indicates how good or bad your current health
state is today.
Your own health state TODAY

550
Appendix 11 Paediatric Outcomes Data Collection (PODCI)
A11.1 PODCI questions
Q1 During last week, easy/hard to: Lift heavy books?
Q2 During last week, easy/hard to: Pour a half gallon of milk?
Q3 During last week, easy/hard to: Open a jar that has been opened before? 1 = Easy
Q4 During last week, easy/hard to: Use a fork and spoon? 2=A little hard
Q5 During last week, easy/hard to: Comb your hair? 3 = Very hard
Q6 During last week, easy/hard to: Button buttons? 4=Cant do at all
Q7 During last week, easy/hard to: Put on your coat?
Q8 During last week, easy/hard to: Write with a pencil?
Q9Over the last 12 months, how often did you miss school because of
health?
1 = Rarely 2
= x1/month 3 =
x2-3/month 4 =
x1/week 5 =
>x1/week 6 =
not student
Q10 During last week, how happy with: looks? 1 = Very happy
Q11 During last week, how happy with: body? 2 = Somewhat happy
Q12 During last week, how happy with: clothes or shoes can wear? 3 = Not sure
Q13 During last week, how happy with: ability to do the same things friends do? 4 = Somewhat unhappy
Q14 During last week, how happy with: health in general? 5 = Very unhappy
Q15 During last week, how often: feel sick and tired?
Q16 During last week, how often: full of pep and energy?
Q17 During last week, how often: pain or discomfort interfere with activities?
Q18 During last week, easy/hard to: Run short distances?
Q19 During last week, easy/hard to: Bicycle or tricycle?
Q20 During last week, easy/hard to: Climb three flights of stairs? 1 = Easy
Q21 During last week, easy/hard to: Climb one flight of stairs? 2 = A little hard
Q22 During last week, easy/hard to: Walk more than a mile? 3 = Very hard
Q23 During last week, easy/hard to: Walk three blocks? 4 = Cant do at all
Q24 During last week, easy/hard to: Walk one block?
Q25 During last week, easy/hard to: Get on and off a bus?
Q26 How often need help from another person for walking and climbing?
Q27 How often use assistive devices for walking and climbing?
1 = Never 2
= Sometimes 3 =
About half the time 4 =
Often 5 =
All the time
1 = Most of the time 2
= Some of the time 3
= A little of the time 4
= None of the time
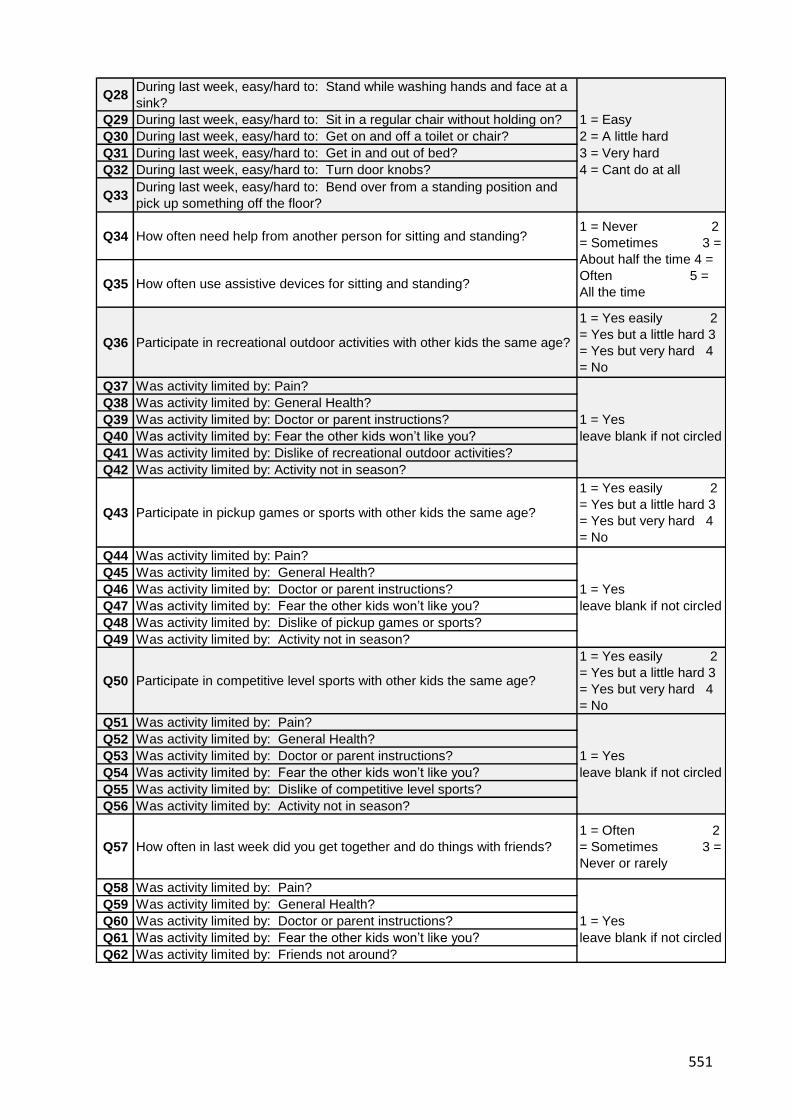
551
Q28During last week, easy/hard to: Stand while washing hands and face at a
sink?
Q29 During last week, easy/hard to: Sit in a regular chair without holding on? 1 = Easy
Q30 During last week, easy/hard to: Get on and off a toilet or chair? 2 = A little hard
Q31 During last week, easy/hard to: Get in and out of bed? 3 = Very hard
Q32 During last week, easy/hard to: Turn door knobs? 4 = Cant do at all
Q33During last week, easy/hard to: Bend over from a standing position and
pick up something off the floor?
Q34 How often need help from another person for sitting and standing?
Q35 How often use assistive devices for sitting and standing?
Q36 Participate in recreational outdoor activities with other kids the same age?
1 = Yes easily 2
= Yes but a little hard 3
= Yes but very hard 4
= No
Q37 Was activity limited by: Pain?
Q38 Was activity limited by: General Health?
Q39 Was activity limited by: Doctor or parent instructions? 1 = Yes
Q40 Was activity limited by: Fear the other kids won’t like you? leave blank if not circled
Q41 Was activity limited by: Dislike of recreational outdoor activities?
Q42 Was activity limited by: Activity not in season?
Q43 Participate in pickup games or sports with other kids the same age?
1 = Yes easily 2
= Yes but a little hard 3
= Yes but very hard 4
= No
Q44 Was activity limited by: Pain?
Q45 Was activity limited by: General Health?
Q46 Was activity limited by: Doctor or parent instructions? 1 = Yes
Q47 Was activity limited by: Fear the other kids won’t like you? leave blank if not circled
Q48 Was activity limited by: Dislike of pickup games or sports?
Q49 Was activity limited by: Activity not in season?
Q50 Participate in competitive level sports with other kids the same age?
1 = Yes easily 2
= Yes but a little hard 3
= Yes but very hard 4
= No
Q51 Was activity limited by: Pain?
Q52 Was activity limited by: General Health?
Q53 Was activity limited by: Doctor or parent instructions? 1 = Yes
Q54 Was activity limited by: Fear the other kids won’t like you? leave blank if not circled
Q55 Was activity limited by: Dislike of competitive level sports?
Q56 Was activity limited by: Activity not in season?
Q57 How often in last week did you get together and do things with friends?
1 = Often 2
= Sometimes 3 =
Never or rarely
Q58 Was activity limited by: Pain?
Q59 Was activity limited by: General Health?
Q60 Was activity limited by: Doctor or parent instructions? 1 = Yes
Q61 Was activity limited by: Fear the other kids won’t like you? leave blank if not circled
Q62 Was activity limited by: Friends not around?
1 = Never 2
= Sometimes 3 =
About half the time 4 =
Often 5 =
All the time

552
Q63 How often in last week did child participate in gym/recess?
1 = Often 2
= Sometimes 3 =
Never or rarely 4 =
No gym or recess
Q64 Was activity limited by: Pain?
Q65 Was activity limited by: General Health?
Q66 Was activity limited by: Doctor or parent instructions? 1 = Yes
Q67 Was activity limited by: Fear the other kids won’t like you? leave blank if not circled
Q68 Was activity limited by: Dislike of gym/recess?
Q69 Was activity limited by: School not in session?
Q70 Was activity limited by: Does not attend school?
Q71 Is it easy or hard to make friends with kids own age?
1 = Usually easy 2
= Sometimes easy 3 =
Sometimes hard 4 =
Usually hard
Q72 How much pain during the last week?
1 = None 2
= Very mild 3 =
Mild 4 =
Moderate 5 =
Severe 6 =
Very severe
Q73 During last week, how much did pain interfere with normal activities
1 = Not at all 2
= A little bit 3 =
Moderately 4 =
Quite a bit 5 =
Extremely
Q74 Expectation of Treatment: To have pain relief.
Q75 Expectation of Treatment: To look better.
Q76 Expectation of Treatment: To feel better about self. 1=Definitely yes
Q77 Expectation of Treatment: To sleep more comfortably. 2=Probably yes
Q78 Expectation of Treatment: To be able to do activities at home. 3=Not sure
Q79 Expectation of Treatment: To be able to do more at school. 4=Probably not
Q80Expectation of Treatment: To be able to do more play or recreational
activities.5=Definitely not
Q81 Expectation of Treatment: To be able to do more sports.
Q82 Expectation of Treatment: To be free from pain or disability as an adult.
Q83If had to spend the rest of your life with your bone and muscle condition as
it is right now, how would you feel about it?
1 = Very satisfied 2
= Somewhat satisfied 3
= Neutral 4 =
Somewhat dissatisfied
5 = Very dissatisfied

553
A11.2 PODCI scoring
Notes: A minimum of 4 items must have valid answers to score this scale.
Mean of Items: (sum of items Q1, Q2, Q3, Q4, Q5, Q6, Q8, Q32/ (number of non-missing items) 1 to 4
Standardized Score: [(4 - mean of items) / 3 ] * 100 0 to 100
Notes: A minimum of 7 items must have valid answers to score this scale.
Q34 is RESCALED as follows: Q34rescaled = [ (Q34 - 1)* 3/4 ] + 1 1 to 4
Q35 is RESCALED as follows: Q35rescaled = [ (Q35 - 1)* 3/4 ] + 1 1 to 4
Mean of Items: (sum of items Q7, Q21, Q24, Q25, Q28, Q29, Q30, Q31, Q33, Q34Rescaled, Q35Rescaled) / (number of non-missing items)1 to 4
Standardized Score: [(4 - mean of items) / 3 ] * 100 0 to 100
Notes: A minimum of 6 items must have valid answers to score this scale.
Q26 is RESCALED as follows: Q26rescaled = [ (Q26 -1) * 3/4 ] + 1 1 to 4
Q27 is RESCALED as follows: Q27rescaled = [ (Q27 -1) * 3/4 ] + 1 1 to 4
Q36 is RECODED to MISSING if (Q36 = 4 and [Q42 = 1) 1 to 4
Q43 is RECODED to MISSING if (Q43 = 4 and Q49 =1) 1 to 4
Q50 is RECODED to MISSING if (Q50 = 4 and Q59 = 1) 1 to 4
Q57 is RECODED and RESCALED as follows:
Step #1: Q57 is RECODED to MISSING if (Q57 = 3 and Q62 = 1 )
Step #2: If Q57 is not missing, Q57rescaled = [ (Q57 -1) * 3/2 ] + 1 1 to 4
Q63 is RECODED and RESCALED as follows:
Step #1: Q63 is RECODED to MISSING if (Q63 = 4 )
Step #2: Q63 is RECODED to MISSING if (Q63 = 3 and EITHER [Q69 = 1] or [Q70 = 1] )
Step #3: If Q63 is not missing, Q63rescaled = [ (Q63 - 1) * 3/2] + 1 1 to 4
Mean of Items: (sum of items Q18, Q19, Q20, Q22, Q23, Q26rescaled, Q27rescaled, Q36, Q43, Q50, Q57rescaled, Q63rescaled) / (number of non-missing items)1 to 4
Standardized Score: [(4 - mean of items) / 3 ] * 100 0 to 100
Upper extremity and physical function scale
Transfer and basic mobility scale
Sports and physical functioning scale

554
Notes: A minimum of 2 items must have valid answers to score this scale.
Q17 is RESCALED as follows: Q17rescaled = [ (4 - Q17) * 4/3 ] + 1 1 to 5
Q72 is RESCALED as follows: Q73rescaled = [ (Q73 - 1) * 4/5 ] + 1 1 to 5
Mean of Items: (sum of items Q17rescaled, Q72rescaled, Q73) / (number of non-missing items) 1 to 5
Standardized Score: [(4 - {mean of items - 1} ) / 4 ] * 100 0 to 100
Notes: A minimum of 3 items must have valid answers to score this scale.
Mean of Items: (sum of items Q10, Q11, Q12, Q13, Q14) / (number of non-missing items) 1 to 5
Standardized Score: [(5 - mean of items) / 4] * 100 0 to 100
Notes: If ANY of the four relevant scales are missing, this is not calculated.
Mean of Items:(sum of "Mean of Items" values for scales: 'Upper extremity and physical function' + 'Transfer and basic
mobility' + 'Sports and physical function' and 'Pain/comfort' ) / 40 to 100
Pain/comfort scale
Happiness scale
Global Function scale

555
Appendix 12 Kinaesthetic & proprioceptive questionnaire
(KPAQ)
A12.1 KPAQ questions
A12.2 KPAQ scoring
KPAQ score = sum of all scores 12 (worst) to 60 (best)

556
Appendix 13 Marking up instructions
NB: For controls, the above procedures were repeated using the same vertebral level as their
matching cases.

557
Appendix 14 Two point discrimination testing (TPDT)
A14.1 TPDT case report form
site Right
test order 22 19 11 15 2 5 12 6 17 23 3 9 10 8 13 14 21 4 20 18 7 1 16
distance 10mm 15mm 20mm 25mm 30mm 35mm 40mm 45mm 50mm 55mm 60mm 65mm 70mm 75mm 80mm 85mm 90mm 95mm 100mm100mm100mm 1 point 1 point
trial 1
trial 2
trial 3
site Left
test order 20 16 9 7 23 6 13 8 5 4 10 2 19 22 21 11 17 3 12 1 15 18 14
distance 10mm 15mm 20mm 25mm 30mm 35mm 40mm 45mm 50mm 55mm 60mm 65mm 70mm 75mm 80mm 85mm 90mm 95mm 100mm100mm100mm 1 point 1 point
trial 1
trial 2
trial 3

558
A14.2 TPDT instructions

559
A14.3 TPDT scoring
Threshold distances (mm) established from review of case report form. Threshold distance is
the distance-between-points of the caliper at which the participant first is able to correctly
distinguish two points as opposed to one point.

560
Appendix 15 Localisation
A15.1 Localisation case report form

561
A15.2 Localisation instructions

562
A15.3 Localisation scoring
The number of correct responses was counted from 15 different stimulus locations. Each
location was tested twice resulting in a maximum possible score of 30 correct responses.
For side to side comparisons, only the results of 12 points were used with the central locations
omitted (locations 3, 8, 13). This resulted in 6 locations per test and a maximum possible score
of 12 for each side.
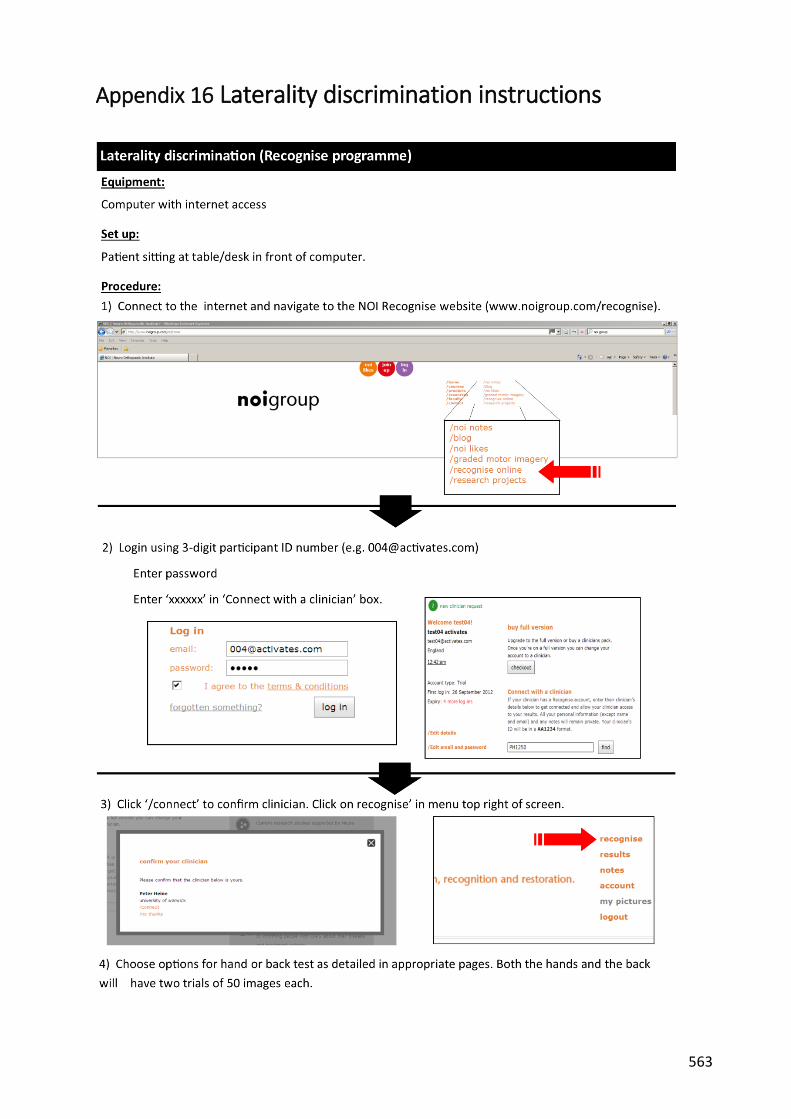
563
Appendix 16 Laterality discrimination instructions

564

565
566

567
A16.1 Laterality scoring
Each test consisted of 50 images, 25 of which were of the left and 25 of the right side. Testing
was performed twice for images of the back and the hands resulting in 100 images per body
part. Correct responses were counted and converted to an overall percentage accuracy. Time
(ms) was recorded for both the incorrect and incorrect responses for each image.

568
Appendix 17 Proprioception
A17.1 Proprioception case report form

569

570
A17.2 Proprioception instructions

571

572
A17.3 Proprioception scoring
Testing was performed 3 times to the left and right sides. The angle of the true reference
position and the perceived matching position were measured on each occasion. The difference
or error (degrees) was calculated according to:
Error (degrees) = true position (degs) - perceived position (degrees)
Negative distances indicate that the perceived position was an overestimation (i.e. greater
angle) of the true position.
Errors were converted to absolute values (AE) to calculate the magnitude of error irrespective
of whether it was an under or over-estimation by:
Absolute error (degrees) = √(error2)
To adjust for the differences between subjects with regard to the angle of the reference
positon, the absolute error was converted to a percentage using the following formula:
AEadjusted (%) = [AE / angle initial trial] x 100
An error of 0% indicates that the participant was able to match the reference position exactly.

573
Appendix 18 Line bisection test (LBT)
A18.1 LBT case report form -standard (example)

574
A18.2 LBT case report form - body (example)

575
A18.3 LBT instructions

576
A18.4 LBT scoring
Line bisection testing involved 24 separate trials involving specified combinations of hand
used, line length, line type, and paper position (see appendix O1.3 for further details). These
combinations were analysed for case and control participants separately according to:
hand used (left versus right - 12 trials each),
line length (200mm v 225mm v 250mm - 6 trials each, standard lines only),
paper position (left v centre v right - 8 trials each),
line type (standard v body - 18 trials and 6 trials respectively).
Data was also analysed to account for the direction of the curve within groups
For each test, the true length of the left half of the line was measured along with the perceived
left half of the line as defined by where the participant placed their mark. The difference or
error between these was calculated as:
Error (mm) = perceived length of left half - true length of left half
Negative distances indicate that the perceived middle of the line was to the left of the true
centre point.
Error was converted to absolute error (AE) by:
Absolute error (mm) = √(error2)
To adjust for the differences in line lengths used, the error was converted to a percentage
using the following formula:
AEadjusted (%) = [AE (mm) / total line length (mm)] x 100
An AEadjusted of 0% means that the participant’s estimation and the actual midline were the
same. Each 1% of AEadjusted equates to a 1.7 - 2.5mm (depending on line length) distance
between the actual midline and the participants’ estimate.

577
Appendix 19 Dynamic balance

578
A19.1 Balance scoring
Three tests were performed on each leg. The time (seconds) for each test was recorded and
the average for each side calculated as well as an overall average time.

579
Appendix 20 ISIS 2
The typical output following an ISIS 2 scan is shown below (from Berryman et al 1988 - see
Chapter 6 for reference).

580
A20.1 ISIS 2 parameters
The following information is taken directly from Berryman et al 1988. Parameters used for
analysis are highlighted.
A20.1.1 Height map
This shows a wire-frame plot, giving an impression of the three-dimensional shape of the back.
The back is viewed from below so that any rib humps are exaggerated.
A20.1.2 Contour plot
This plot represents the shape using contour lines and colour (blue lowest to red highest). The
numbers on the contours are in mm, plotted every 5 mm. The marker locations (solid blue
circles) and the most prominent points on the two shoulder blade areas (solid blue triangles)
are indicated.
A20.1.3 Tranverse
The shape of the transverse section at 19 equally spaced levels from the vertebra prominens
to the sacrum is shown. The rotation angle, back length and the skin angle at each section are
also shown. The open blue circles indicate the location of the spine at each level. A solid blue
circle indicates the vertebra prominens; a magenta diamond indicates the sacrum. The green
and red circles are on the paramedian lines at 10% of the back length to the right and left of
the spine. The skin angles are measured between the paramedian points at each level, i.e. over
a width of 0.2*back length. The skin angle is positive when the right side is higher.
A20.1.4 Coronal
This plot shows a fifth order polynomial curve fitted through the spinous process markers
(thick blue curve) and similar curves at the paramedian locations to the right (green) and left
(red). A fine blue line is dropped vertically from the vertebra prominens (gravity line). The
horizontal distance between this line and the sacrum gives a measure of the imbalance; its
value is printed at the bottom of the plot. Imbalance is positive when the sacrum lies to the
right of the vertical through the vertebra prominens. The heavy dashed black curve is
calculated from the spinous processes curve and the skin angle at each transverse location (19
levels between vertebra prominens and sacrum); it gives an estimate of the line through the

581
centres of the vertebrae. The angles of the perpendiculars to the points of inflection on this
curve are calculated and used to compute the lateral asymmetry [simulated Cobb angle(s)].
The vertebra prominens and the lumbar dimples are shown as solid blue circles; the sacrum is
a magenta diamond. The horizontal black lines give an indication of the difference in volume
between the two sides of the back at each transverse level. These volumetric differences are
normalised, summed and printed below the plot.
There may be one or two lateral asymmetry values, depending on whether a single or double
curve has been found. Lateral asymmetry is the ISIS2 measure of coronal spinal curvature and
is similar (but not identical) to radiographic Cobb angle.
A20.1.5 Sagittal
The sagittal sections through the vertebra prominens and paramedian locations to the right
and left are shown. The straight line from the vertebra prominens to sacrum is presented at
the angle of flexion/extension. This makes the stance of the patient immediately obvious to
the user without needing to read the value for flexion/extension printed below the curves. The
location and magnitude of the maximum kyphosis and lordosis are shown on the curves in
mm. The kyphosis and lordosis angles are also presented below the curves.
A20.1.6 Bilateral asymmetry maps
These maps present the volumetric differences between the sides of the back. The left plot
shows all differences between the two sides. If a part of the back is white it means that the
other side is higher at that location. The differences are not normalised so that a smaller
patient may well have smaller differences and yet have a worse curve. The right-hand plot
shows only the differences >10 mm. Straight backs should show minimal colour in this plot and
scoliotic backs should show more colour the worse the deformation is.
NB: absolute values for Coronal balance, Transverse rotation and Flexion/Extension angle were
calculated and used in the analysis, retaining magnitude of imbalance but not the direction.