Research proposal - University of Warwick
41
0 Do Differences in Schools' Instruction Time Explain International Achievement Gaps? Evidence from Developed and Developing Countries May 2014 Victor Lavy University of Warwick, Hebrew University of Jerusalem, and NBER Abstract The time that children spend in school varies across countries. Do these differences explain international gaps in pupils’ academic achievements? In this paper, I estimate the effects of instructional time on students’ achievement using PISA 2006 data, which includes data samples from over 50 countries. I find that instructional time has a positive and significant effect on test scores, and that the effect is much lower in developing countries. Evidence also suggests that the productivity of instructional time is higher in countries which implemented school accountability measures or that gave schools autonomy in budgetary decisions and in hiring/firing teachers. Victor Lavy Department of Economics Hebrew University and University of Warwick [email protected] JEL No. I21,J18,J24 This paper is a revised version of NBER Working Paper 16227 (July 2010). Special thanks go to Katherine Eyal, Michael Friedman, Amit Meir and Oren Epshtain for their outstanding research assistance. I benefited from comments at seminars at the LSE, Rome Tor Vergata, LACEA conference, Itau Bank conference in Rio, Hebrew University, Spain Ministry of Education, Paris School of Economics, Oxford University, and comments of the Economic Journal referees and editor. I thank the Israeli Science Foundation and the Falk Research Institute for research support.
-
Upload
khangminh22 -
Category
Documents
-
view
2 -
download
0
Transcript of Research proposal - University of Warwick

0
Do Differences in Schools' Instruction Time Explain International Achievement Gaps?
Evidence from Developed and Developing Countries
May 2014
Victor Lavy
University of Warwick, Hebrew University of Jerusalem, and NBER
Abstract
The time that children spend in school varies across countries. Do these differences explain international gaps in
pupils’ academic achievements? In this paper, I estimate the effects of instructional time on students’ achievement
using PISA 2006 data, which includes data samples from over 50 countries. I find that instructional time has a positive
and significant effect on test scores, and that the effect is much lower in developing countries. Evidence also suggests
that the productivity of instructional time is higher in countries which implemented school accountability measures
or that gave schools autonomy in budgetary decisions and in hiring/firing teachers.
Victor Lavy
Department of Economics
Hebrew University and University of Warwick
JEL No. I21,J18,J24
This paper is a revised version of NBER Working Paper 16227 (July 2010). Special thanks go to
Katherine Eyal, Michael Friedman, Amit Meir and Oren Epshtain for their outstanding research assistance.
I benefited from comments at seminars at the LSE, Rome Tor Vergata, LACEA conference, Itau Bank
conference in Rio, Hebrew University, Spain Ministry of Education, Paris School of Economics, Oxford
University, and comments of the Economic Journal referees and editor. I thank the Israeli Science
Foundation and the Falk Research Institute for research support.
1
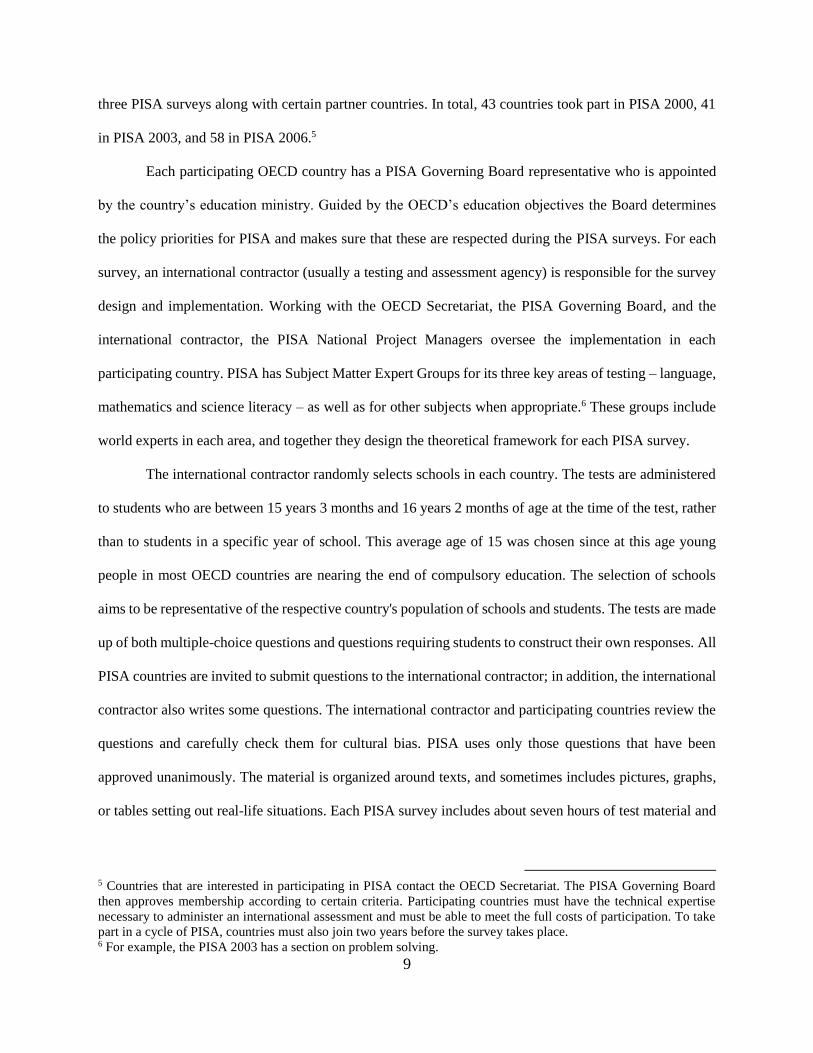
I. Introduction
The amount of time that students spend in public schools varies widely from one country to
another. For example, among European countries such as Belgium, France, and Greece, 15-year-old pupils
receive an average of more than 1,000 hours per year of total compulsory classroom instruction, while in
England, Luxembourg, and Sweden the average is only 750 hours per year.1 As well, children from the
ages 7-8 in England, Greece, France, and Portugal receive an average instructional time of more than 800
hours per year, while in Finland and Norway they receive less than 600 hours. Similar differences among
countries exist in the number of classroom lessons per week in different subjects as evident from data from
the 2006 Program for International Student Assessment (PISA), a unique international education survey
of 15-year-old students conducted by the Organization for Economic Co-operation and Development
(OECD) and designed to allow for cross-country comparisons. For instance, these data show that 15-year-
old pupils in Denmark receive 4 hours of instruction per week in math and 4.7 hours in language, while
pupils of the same age in Austria receive only 2.7 hours of weekly classroom lessons in math and 2.4 hours
in language. Overall, total weekly hours of instruction in math, language, and science is 55 percent higher
in Denmark (11.5 hours) than in Austria (7.4 hours). Similar magnitudes of disparities in instructional time
appear among the Eastern European and developing countries that are included in the PISA 2006.
Do these large differences in instructional time explain some of the differences across countries in
pupils’ achievements in different subjects? While research in recent years provides convincing evidence
about the effect of several inputs in the education production function,2 there is limited evidence on the
effect of classroom instructional time. This evidence ought to be important for policymakers in many
countries since increasing instructional time is a relatively simple option to implement (provided that
resources are available) and, moreover, such an increase would be feasible in many countries. For example,
U.S. President Barack Obama has argued in recent years that American children should go to school longer
1 Source: OECD Education at Glance, 2006: http://www.oecd.org/dataoecd/6/47/37344903.xls. 2 For example, see studies on class size (Krueger 1999), teachers’ training and certification (Kane et al. 2007),
remedial education (Jacob and Lefgren 2004), teacher effect (Rockoff 2004, Rivkin et al. 2005), and computer aided
instruction (Barrow et al. 2009).

2
– either staying later in the day or attending later into the summer or both. He has spoken of this goal, of
extending the school week and year, as a central element in his proposed education reform.3
In this paper, I use the results of the PISA 2006. PISA is a triennial survey of the knowledge and
skills of 15-year-olds. It is the product of collaboration between participating countries through the
Organization for Economic Co-operation and Development (OECD), and draws on leading international
expertise to develop valid comparisons across countries and cultures. More than 400,000 students from 57
countries constituting close to 90 percent of the world economy took part in PISA 2006. The study focused
on science, but the assessment also included language and mathematics. In addition, it collected data on
student, family, and institutional factors, including information about the amount of instructional time per
week in each of the subjects tested. I exploit these features of the data to identify the effect of instructional
time on academic achievement. First, having test scores in multiple subjects for each student and relatively
large variation in instructional time across subjects allows me to use within student estimation of the effect
of instructional time. At the same time, I am able to control for individual time invariant characteristics that
equally affect performance across subjects, such as the individual’s underlying ability, parental and family
background, lagged achievements, and lagged and current school resources and characteristics. Second, the
considerable within student variation in instructional time allows for additional analysis. I use this
significant variation to test whether the effect of instructional time is non-linear and whether it differs
among developed and developing countries. The disadvantage of this identification approach is that I
assume that the effect of instructional time is the same for all three subjects, an assumption that is common
in many studies that pool cross-sectional data across subjects. However, in this study I can assess how
3 President Barack Obama said on March 10, 2009, at a speech to the U.S. Hispanic Chamber of Commerce, that
American children should go to school longer — either stay later in the day or into the summer — to have a chance
to compete for jobs and paychecks against foreign children. He urged administrators to "rethink the school day" by
adding more class time, and proposed longer class hours as part of a broader effort to improve U.S. schools that he
said are falling behind foreign competitors. As well, these ideas have been recently implemented as part of Mayor
Rahm Emanuel's longer school day initiative, as students in forty schools across Chicago will have an extra 90
minutes of instruction every day. (See http://www.suntimes.com/news/education/7757540-418/chicago-public-
schools-system-launches-longer-school-day-website.html.)

3
restrictive it is by comparing estimates obtained based on pooling only sub-groups or all three subjects
together.
This paper hopes to overcome some of the problems and limitations found in the numerous studies
which have evaluated the effect of time spent in school on student achievement and earnings. For example,
Grogger (1996) and Eide and Showalter (1998) estimated the effect of the length of the school year in the
United States and found insignificant effects, perhaps due to limited variation in the length of the school
year there or the omission of other variables. Card and Krueger (1992) and Betts and Johnson (1998) used
state-level data in the United States to examine the same effect and found a positive significant effect on
earnings, perhaps because they studied earlier periods when length of the school year varied more widely
and because state-level data may be of sufficient size to contend with the potential effect of unobserved
heterogeneity. Card and Krueger (1992) also presented results controlling for state effects, showing that
the positive effect of a longer school year length vanishes within states and conditional on other school
quality variables. Lee and Barro (2001) examined the effect of the amount of time spent in school during
the year on student performance across countries while controlling for a variety of measures for school
resources. They found no effects of the length of the school year on internationally comparable test scores.
However, while this study attempted to identify the effect of instructional time on test scores by controlling
for many characteristics and resources in each school and country, this method cannot rule out biases (due
to school and country unobserved heterogeneity) that are correlated with instructional time and test scores.
A more recent study, Pischke (2007), overcame potential selection and endogeneity problems by using a
West-German short school year in 1966-67 which reduced those school years by about two-thirds for some
students. This change increased grade repetition in primary school and lowered enrollment in higher
secondary school tracks, but it had no adverse effect on earnings and employment later in life. Hansen
(2008) reported that more instructional time due to fewer snow-related school day cancelations and delayed
testing increased student performance in Colorado and Maryland. Marcotte and Hemelt (2008) reported
that substantial snowfall (leading to fewer days spent at school) is associated with lower pupils’
performance in Maryland. Allensworth and Takako (2009) evaluate the efficacy of a double-period algebra

4
policy initiated in the Chicago Public Schools in 2003 and targeted to 9th-grade students with test scores
below the national median. The authors suggest that support courses improved algebra test scores for the
target population, mainly for students close to the national median. Dobbie and Fryer (2011) find that
charter schools in New York City that add 25 percent or more instructional time have an annual gain of
0.059 of a standard deviation in math. However, the authors emphasize that their estimates of the
relationship between instructional time and school effectiveness are unlikely to be causal given the lack of
experimental variation in instructional time school inputs. However, Fryer (2012) reports similar size
effects of instructional time in Huston’s public schools.
The results I present in this paper show that instructional time has a positive and significant effect
on the academic achievements of pupils. However, the estimates are much lower than the “naïve” OLS
estimates which overstate the extent to which countries like the United States might “catch up” to other
developed nations by increasing instructional time. The size of the estimated effects is modest to large. On
average, a one-hour increase per week in math, science, or language instruction raises the test score in
these subjects by 0.06 of a standard deviation of the distribution of test scores. I also find that the results
were heterogeneous across groups, and that the effect of instructional time is larger for girls, immigrants,
and pupils from low socioeconomic status families. In addition, while estimates based on the sample of
the former Soviet Eastern European countries are very similar to the average effect obtained from the
sample of OECD developed countries, the evidence based on a sample of developing countries suggests a
much lower effect of additional instructional time on test scores. I find that on average, one additional
instructional hour in developing countries improves test scores by 0.025 standard deviation of the test
score distribution. Overall, the main results presented in this paper are very robust to a variety of robustness
checks with respect to the identification assumptions and to threats to their validity. In addition, this
evidence is almost identical to related results I obtained with data from Israel using two different
identification strategies (Lavy 2012). In that paper, the first method was identical to the one used in this
paper, and the second stemmed from a natural experiment that provided an opportunity to exploit a sharp
change in the method of funding schools in Israel. Remarkably, the results from the research in Israel and

5
the results presented in this research in an international context are almost identical. Moreover, the estimate
of the effect of instructional time obtained from the PISA is also very close to the estimate presented in
Dobbie and Fryer (2011) and Fryer (2012). This various estimates suggest an apparent ‘empirical
regularity’ in the relationship between instructional-time and test scores. However, it should be noted that
the pupil fixed effect framework used in this paper relies on some assumptions that reduce the strength of
the identification of causal relationships relative to a research design based on a randomized control trial,
a regression discontinuity model or a valid instrumental variable.
In the latter part of the paper, I investigate whether the estimated effect of instructional time varies
by certain characteristics of the labor market for teachers and of the school environment. I use information
from PISA 2006 about school accountability measures and the degree of school autonomy, such as the role
of schools in hiring and firing teachers and in determining wages of teachers. The main effects of these
characteristics, which vary by school, are absorbed in the estimation by the school fixed effects. However,
I am able to estimate the effect of their interactions with instructional time in each subject. The evidence
suggests that the productivity of instructional time is higher in schools that operate under well defined
accountability measures, and in schools that enjoy extensive autonomy in budgetary decisions and in hiring
and firing teachers. These findings emphasize the importance of quality and quantity of instructional time
in bridging the gaps in student achievement across countries.
The rest of the paper is organized as follows: Section II describes the identification strategy.
Section III presents the data, the construction of the analysis samples, and the various pieces of evidence
that assess the validity of the identification strategy. Section IV reports the pupil fixed effects estimates of
the effect of instructional time in each subject using the three international samples of countries. The
section also shows results about the correlations of the average productivity of instructional time with
schools' and teachers’ labor market characteristics. Section V presents conclusions.
II. Empirical Strategy

6
The effects of unobserved correlated factors usually confound the effect of instructional time on students’
outcomes. Such correlations could result if self-selection and sorting of students across schools are affected
by school resources, or if there is a correlation between school instructional time and other characteristics
of the school that may affect students’ outcomes. One possible method to account for both sources of
confounding factors in the estimation of instructional time is to rely on within-student variations in
instructional time across various subjects of study. 4 Based on this approach, I examine whether differences
in students between subjects are systematically associated with differences between subjects in
instructional time. The basic idea for identification is that the student characteristics, ability, and the school
environment are the same for all three subjects except for the fact that some subjects receive more
instructional time than others. Of course, it could be that at the school level such variation is not purely
random. However, the cause of such selection across schools is constant for students in each school and
therefore does not vary within each student. Based on this approach, I present within-student estimates of
the effect of instructional time on individual test scores using the following panel data specification,
Aijk iγ HkjXij S j j k) uijk (1)
Where Aijk is the achievement of the ith student, in the jth school, in the kth subject, Hkj is instructional time
in the kth subject in the jth school, X is a vector of characteristics of the ith student in the jth school and Sj is
a vector of characteristics of the jth school. jand k represent the unobserved characteristics of the school
and the subject, respectively, and uijk is the remaining unobserved error term. The student fixed effects i
captures the individual’s family background, underlying ability, motivation, and other constant non-
cognitive skills. Note that controlling for this individual fixed effect, in combination with within-student
variation across subjects' test scores, controls for school fixed effects j. In other words, exploiting within-
student variation allows one to control for a number of sources of potential biases related to unobserved
characteristics of the school, the student, or their interaction. In some situations, students might be placed
4 Dee (2005) used also the cross subject variation within student in his work on teacher effects with the Tennessee
STAR experiment.

7
or be sorted according to their ability across schools that provide more (or less) instructional time in some
subjects. For instance, if more talented students attend better schools that provide more instructional hours
overall in each subject, it would cause γ to be biased downward unless one were to account for student and
school fixed effects. The bias would have an opposite sign if the less talented students are exposed to more
instructional time. However, identification of the effect of instructional time based on a comparison of the
performance of the same student in different subjects is immune to these potential biases.
Several additional remarks about this identification strategy merit additional comment. First, the
necessary assumption for this identification strategy is that the effect of instructional time is the same for
all subjects, implying that γ cannot vary by subject. This assumption can be violated if the production
function for knowledge differs by subjects at different ages. For example, reading literacy might yield high
returns per hour of instruction when children are young while the return to math instruction might be higher
at later age. Although the restriction of equal productivity of instruction time across subjects is plausible
when children are at age 15, in this paper I will provide some evidence to support this conjecture. Second,
the effect of instructional time is "net" of instructional time spillovers across subjects (e.g. instruction time
in language might influence pupils’ test scores in mathematics). Third, the pupil fixed effect framework
does not preclude the possibility that pupils select or are sorted across schools partly based on subject-
specific instructional time. For example, pupils who have high ability in math may select or be placed in a
school that specializes in math, and they may receive more instructional time in math as a result. This
might be the case in a charter school that focuses on mathematics and therefore attracts students with a
particular gap between their math and language skills. Such school might also have a particularly strong
math faculty and therefore may choose to have more math instruction time for students.
However, this latter issue may be less of a concern in the PISA sample for several reasons. First,
since such tracking is largely conducted within schools, and I measure instructional time in each subject
by the school-level means and not by the class means or even the within school program level means.
Second, the pupils in the sample are 15 years old, and most are still in 9th grade. In most countries, 9th grade
is part of middle school or lower secondary school, while schools that specialize in a given subject are

8
mostly upper secondary schools, from 10th grade on. Third, I am able to stratify the sample according to
good proxies of whether the school sorts and selects students based on subject-specific considerations. For
example, I observe in the PISA data information about whether admission to a school takes into account
the student's academic record, or the student’s need or desire for a special program. I also note whether a
school uses tracking in forming classes, and whether it is a public or a private school. I assume that a school
that does not use academic ability as an admission criterion, or does not take into account student’s desire
for a particular program, will most likely not select students on subject-specific considerations. Such
selection is also less likely to take place in schools that do not use any form of tracking by ability, or in
public schools. Indeed, the results that I present below are very similar across the various stratified samples
based on schools’ admission and tracking policies, and whether the schools are private or public,
suggesting that this issue is not a source of bias. In the next section, I describe in more detail the data that
I use for the analysis.
III. Data
The Program for International Student Assessment, known by its acronym PISA, provides regular
data on the OECD country education systems and the knowledge and skills of their students. The first
survey was in 2000, the second in 2003, and the third in 2006. More than 50 countries have taken part in
PISA so far, and it is the only international education survey to measure the knowledge and skills of 15-
year-olds, an age at which students in most countries are nearing the end of their compulsory time in
school. PISA does not examine students’ mastery of specific school curricula. Instead, it evaluates
students’ ability to apply knowledge and skills in key subject areas and their ability to analyze reason and
communicate effectively as they examine, interpret, and solve problems. PISA measures student
performance in language, mathematics, and science literacy and asks students about their motivations,
beliefs about themselves, and learning strategies. All OECD member countries participated in the first
9
three PISA surveys along with certain partner countries. In total, 43 countries took part in PISA 2000, 41
in PISA 2003, and 58 in PISA 2006.5
Each participating OECD country has a PISA Governing Board representative who is appointed
by the country’s education ministry. Guided by the OECD’s education objectives the Board determines
the policy priorities for PISA and makes sure that these are respected during the PISA surveys. For each
survey, an international contractor (usually a testing and assessment agency) is responsible for the survey
design and implementation. Working with the OECD Secretariat, the PISA Governing Board, and the
international contractor, the PISA National Project Managers oversee the implementation in each
participating country. PISA has Subject Matter Expert Groups for its three key areas of testing – language,
mathematics and science literacy – as well as for other subjects when appropriate.6 These groups include
world experts in each area, and together they design the theoretical framework for each PISA survey.
The international contractor randomly selects schools in each country. The tests are administered
to students who are between 15 years 3 months and 16 years 2 months of age at the time of the test, rather
than to students in a specific year of school. This average age of 15 was chosen since at this age young
people in most OECD countries are nearing the end of compulsory education. The selection of schools
aims to be representative of the respective country's population of schools and students. The tests are made
up of both multiple-choice questions and questions requiring students to construct their own responses. All
PISA countries are invited to submit questions to the international contractor; in addition, the international
contractor also writes some questions. The international contractor and participating countries review the
questions and carefully check them for cultural bias. PISA uses only those questions that have been
approved unanimously. The material is organized around texts, and sometimes includes pictures, graphs,
or tables setting out real-life situations. Each PISA survey includes about seven hours of test material and
5 Countries that are interested in participating in PISA contact the OECD Secretariat. The PISA Governing Board
then approves membership according to certain criteria. Participating countries must have the technical expertise
necessary to administer an international assessment and must be able to meet the full costs of participation. To take
part in a cycle of PISA, countries must also join two years before the survey takes place. 6 For example, the PISA 2003 has a section on problem solving.

10
each student takes a two-hour test, with the actual combination of test materials different for every student.
Students also answer a 20- to 30-minute background questionnaire, providing information about
themselves, their homes, and their attitudes to learning. In addition, school principals are given a 20-minute
questionnaire about their schools.
Each country has its own group of test markers, overseen by the country’s National Project
Manager. They mark the PISA tests using a guide developed by the international contractor and the PISA
subject experts (with input from all participating countries). Other experts crosscheck the corrections. The
results are then sent to the international contractor, who in turn transmits the final data to the OECD
Secretariat. The average score among OECD countries is 500 points, and the standard deviation is 100
points. The results from PISA can be compared across the surveys, as can some of the background
questionnaire items.
Table 1 reports the distribution of instructional time in each of the three international samples of
countries in the 2006 PISA based on the pupil-level data. Each pupil replied to the following question:
“How much time do you typically spend per week studying the following subjects in regular lessons at
school?” 7 The student could choose from the following options: No time, Less than 2 hours a week, 2 or
more but less than 4 hours a week, 4 or more but less than 6 hours a week, or more than 6 hours a week.
I merged the first two options into one joint category as "less than two hours a week" and used the other
categories as is. I computed the school average in each subject using the mid values of each range. Since
the PISA data allow for overall instruction time per week in all subjects to be combined, I have aggregated
and averaged this information at the country annual level for all OECD countries. A high correlation
emerges between these country means and the administrative data on total annual hours of instruction in
secondary schooling as reported in the OECD report, “Education at Glance.”
According to Table 1, the means of instructional time in the developed OECD countries in math,
science, and language are 3.53, 3.06, and 3.54 hours per week, respectively. In the Eastern European
7 See the online appendix for the exact format of this question in the PISA 2006 student questionnaire.

11
sample, mean instructional time is lower than in the OECD countries in all subjects (3.30 for math, 2.77
for science and 3.08 in language). These Eastern European figures are similar to the mean instructional
time in the developing countries' sample (3.48 for math, 2.97 for science and 3.24 for language). Tables
A1-A3 in the appendix present the mean instructional time in each of the subjects for each of the countries
included in the three samples of the 2006 PISA. As seen from these tables, large variation in instructional
time exists on many levels. Variation emerges among the countries that make up the three broad multi-
country groups, and also within individual countries among the different schools and various subjects. The
PISA data - which include instruction time per week for the three subjects studied here, all other subjects,
and for the overall school week - explain some of the reasons behind the variations. For instance, the data
show that a large part of the variation across subjects in instruction time is explained by variation across
schools in total instruction time per week. Of course, the variation in total weekly instruction time across
schools is caused by several obvious factors. For instance, governments may allocate resources to schools
in a differential manner that is dependent on their socio-economic background, and schools may receive
different amounts of contributions from parents, the community, or local school authority. Many of these
factors vary at the school or country level, and our identification strategy that uses the within school and
pupil estimation strategies will account for them. When the variation in instructional time across subjects
is related to the overall length of the school week, than the benefit of additional classes in math, science or
English is at the expense of time not being in school. However, the counterfactual of increasing instruction
time in one of the three subjects could also be a reduction in instruction time of the other two subjects and
in all other subject as well. Indeed the PISA data reveal that schools with the highest level of instruction
time (observed in the data) in a given subject is more likely to have less than the maximum instruction
time in each of the other two subjects and also of all other subjects. Similar evidence are reported in Rivkin
and Schiman (2013) based on the PISA 2009 data.
Certain additional issues regarding the data and methodology bear mention. Different countries
vary in the length of the school year (number of weeks of study), but this factor is not a limitation in this
case since the within school and pupil estimation strategies control for the length of the school year.

12
Regarding instruction time, the measurements reflect the average in the school and not the hours reported
by each student. It is also worth noting that the variation in subject instruction hours across students in the
same school is not due to an endogenous decision of the students since the PISA sample in each country
includes students in 9th and 10th grades; levels at which the curriculum of study in most or all countries is
completely compulsory. Students may choose some courses only in the latter part of high school, perhaps
at 11th and 12th grades. Variation in subject instruction hours could stem from tracking practices in schools,
however, and I address this issue by directly examining the sensitivity of my results to differences in
tracking practices across schools.
Finally, Table A4 in the appendix presents the means of the PISA test scores and the instruction
time variables for all three samples of countries. The average test score in the developed OECD countries
is 513.4 and the standard deviation in test scores between pupils is 84.4. The within student standard
deviation in test scores is almost half as large, 38.8. Thus, there is considerable variation in test scores of
the same pupil to explain. The average weekly instructional time per subject in the OECD sample is 3.38
hours and the within-pupil standard deviation in instructional time is 1.02 — comparable in magnitude to
the standard deviation in instructional time between students, 1.08. The table also indicates that there are
no dramatic differences between the OECD sample and the Eastern European or developing countries'
samples in the within- and between-pupil standard deviations.
IV. Results
A. Estimates of the effects of instructional time in OECD countries
Table 2 reports the estimated coefficients of instructional time from subject-specific test score
regressions based on the sample of the OECD countries. For each subject, I report estimates from three
specifications: (1) without any controls; (2) with country fixed effects; and (3) with country fixed effects
and pupil characteristics. Panel A presents the OLS estimates when instructional time is measured in hours
per week. Panel B presents estimates for measures of instructional time by category: less than 2 hours per
week, 2-3 hours per week, and 4+ hours. Note that the first category indicator (less than 2 hours per week)

13
is the omitted group in the regression. The dependent variable is the standardized scores, computed by
subtracting the mean of 500 from each score and dividing it by standard deviation of 100. Therefore the
estimated coefficients of interest are in terms of standard deviation of the test score distribution.
Table 2 indicates that the estimated effects of instructional time on PISA test scores are all positive,
very large, always significantly different from zero, and not dramatically sensitive to the addition of
controls to the regression. For example, the estimate for total instructional time in mathematics is 0.217
with no controls, 0.280 with country fixed effects and 0.244 with the addition of student’s controls. In
science, the respective estimates are about 25-30 percent higher than in math. Interestingly, the language
estimates are much lower than in math and science. However, since the OLS estimates do not include
student fixed effects, we will show below that the results are highly biased upward. Panel B indicates that
the largest marginal effect of one additional hour of instruction is when classroom hours are increased from
less than 2 hours to 2-3 hours. For example, this change in instructional hours for math is associated with
an increase in test scores of nearly half of the standard deviation of between pupils test score distribution.
In Table 3, column 1 presents estimates from regressions based on a pooled sample of all three
subjects (with subject fixed effects included as controls) while column 2 presents estimates when student
fixed effects are included. The OLS estimates in column 1 are very similar to the estimates presented in
Table 2. The within-student estimates in column 2 are all positive and much smaller than the OLS estimates
in column 1 but they are still very precisely measured. Assuming a constant linear effect of instructional
time, the effect of one additional hour of classroom instruction in the within-student regression is
associated with an increase of 0.058 SD on the PISA test.
The other estimates presented in Panel A suggest some non-linearity in the effect of instructional
time, with a larger effect in the range of 1-2 hours than at higher levels. The difference between the
estimated effect of two to three hours of instruction versus the effect of up to two instruction hours is
0.0252 [= (0.063 points/2.5 hours)]. Similarly, the difference between the estimated effect of four or more
hours of instruction versus the effect of up to two instruction hours is 0.0248 [= (0.124 points/5 hours)],

14
both of which are lower than the average effect of 0.058. This suggests that the first two hours of instruction
have the lowest effect.
Interestingly, the results in Table 3 on the effects of instructional time are very similar to the
results in Lavy (2012). In that paper, I report results based on the same method I use in this paper and also
based on an alternative identification strategy that relies on a natural experiment that exploit a sharp change
in the funding method of schools in Israel. Remarkably, both of these two methods lead to identical point
estimates for the effect of instructional time on core subjects test scores, and these two sets of estimates
from the previous paper are almost identical to the results presented in this paper.8 These similar findings
strengthen the overall credibility of the results I present in this paper and also their causal interpretation.
The productivity of classroom hours might be different for different subjects. In order to check for
such variation I estimate models based on the three possible samples that include only two of three subjects.
The second panel of Table 3 presents estimates based on the sample that pools the math and science test
scores. The estimated effects of classroom-hours obtained from this sample is higher, 0.071, about 22
percent higher than the respective estimate obtained from pooling all three subjects together. However,
pooling math and language test scores yields an estimate of 0.074 and pooling science and language yields
an estimate of 0.043 (results available from the author upon request). The pattern that emerges from the
OECD country group does not permit me to conclude whether the average productivity of instructional
time is lower for any of the three subjects. However, the average (0.063) of the three estimates obtained
from three samples that include only two of the three subjects is very close to the estimate (0.058) obtained
by pooling all three subjects. It is also important to note that in Lavy (2012) I was able to estimate
separately the effect for each subject and these estimates are very similar to each other and as noted above
their mean is very close to the estimate we present here in Table 3.
8 It is also important to emphasize that the natural experiment method that I used in the Israeli context allowed me to
test some of the central assumptions I make while using the pupil fixed effect identification method. These tests
support the assumption that the effect of additional hours of instruction on each of the subjects is very similar and
that there are no cross-subjects spillover effects.

15
B. Robustness of main results and checks for threats of identification
In this section, I present a set of robustness checks and alternative specifications that support the
causal interpretation of the findings reported in column 2 of Table 3. Since the variation in hours of
instruction is at the school level, the first robustness check is based on a sample of schools instead of pupils.
I present these results in appendix Table A5. I obtain the variables at the school level by collapsing the
pupil-level data to the respective school-level means. The pattern in this table is very similar to Table 3.
The OLS estimates in the two tables are practically identical while the school fixed effect estimates based
on the school-level sample are slightly lower than the estimates based on student micro data. The estimate
based on all three subjects is lower by 17 percent than the respective estimate in Table 3; the estimate
based on math, and science only is lower by 9 percent than the respective estimate in Table 3.9
The second robustness check concerns whether the evidence in column 2 of Table 3 reflects some
subject-specific selection and sorting in some schools. It is based on the data available from the PISA
school questionnaire about how much consideration is given in the admission decisions to student’s
academic record and whether placements tests are used in this process.10 I expect that the validity of the
identification strategy will be underscored here since my prior is that the sample of schools that do not pay
any attention to applicants’ previous academic records and do not use any admission exams should not be
sensitive to endogenous sorting and selection. In columns 3-4 of Table 3, I report results from a sample of
schools that do not consider a student's prior academic record and in columns 5-6 I report estimates based
on a sample of schools that consider student’s academic record for admission. Note that the sample of
students in schools in which past academic achievements are irrelevant for admission is larger and accounts
for about two-thirds of the whole sample. The table indicates that the estimates from this sample are only
marginally different from those obtained from full sample: the OLS estimate is lower, 0.170 versus 0.196,
9 I also examined how sensitive the treatment estimates are by including interactions between the subject dummies
and pupil characteristics. The estimates from this more flexible specification approach are very similar to those
presented in Table 3, though overall they are about 10 percent lower (results are available from the author upon
request). 10 The exact wording is based on question 19 and is available in the online appendix.

16
and pupil fixed effect estimate is higher, 0.060 versus 0.058. As well, the OLS and the pupil fixed effect
estimates in columns 5-6 are also only marginally different than the estimates obtained from the full.
Overall, these results suggest that the type of admission process does not lead to differences that are
statistically significant. This suggests that our results in column 2 are not biased by school-sorting
processes.11
Another potential source of selection bias is tracking pupils into classes within schools according
to their ability. One can expect that schools practicing such tracking will also tend to select and admit
pupils based on subject specific strengths. If the strengths or specializations of schools are correlated with
hours of instruction in different subjects, a bias in the estimated effect of hours of instruction will occur.
In Table 4, I present results for three different samples distinguished by schools’ tracking policies.
Columns 1-2 show the estimates for a sample of schools that practice tracking at the class level where
students in classes are grouped according to their ability. Columns 3-4 show the results based on a sample
of schools that sort pupils into different ability study groups within classes. Columns 5-6 show the results
based on a sample of schools that do not practice any form of pupil tracking. The OLS and the pupil fixed
effect estimates in the first row in columns 1-2 are quite similar to the respective estimates presented in
columns 3-4. This indicates that the two forms of tracking leads to similar results. However, the results of
column 1-2 are 15 percent higher than the respective estimates in Table 3, and the results of columns 3-4
are about 7 percent higher than the estimates in Table 3. However, in both cases, these estimates are not
significantly different from the point estimates obtained from the full sample. Finally, the effect of
instruction hours on test scores in schools that practice no tracking at all is 0.052 which is not significantly
different from the estimate from the full sample 0.058. However, these results are significantly lower than
the estimates obtained for schools which practice tracking between classes.
11 I also estimated the effect of hours of instruction based on a sample of schools that do not use a student’s desire
for a particular program as a criterion for admission. This information is also based on the PISA school questionnaire,
question 19. The results based on this sample are very similar those obtained from the full sample (results are available
from the author upon request).
17
Another potential source of bias can originate from the inclusion of private schools in the PISA
sample. For example, 18 percents of the schools in the OECD sample are classified as private. This could
be of concern since private schools are more likely to base admission on previous academic record and on
additional exams, and to track pupils by ability. To address these concerns, I therefore estimated the effect
of instruction hours based on a sample that included only the public schools in the PISA sample. The
estimated effect of instruction school hours based on pooling together the math, science and language test
scores is 0.061, just barely higher than the estimate from a sample that included also the private schools
(results available from the author upon request).
Overall, the lack of any large, discernable differences in the effect of hours of instruction by
admission or tracking policies of schools suggests that our estimates are not biased by unobservables
correlated with sorting or selection of pupils based on subject-specific hours of instruction. This is an
important result since schools that admit pupils based on academic record or that track students by ability
also tend to select and admit pupils based on subject-specific strengths. If the strength or specialization of
schools is also correlated with hours of instruction in different subjects, it might bias the estimates of the
effect of hours of instruction. For example, certain schools may come to be known as “math-oriented” or
“literature-oriented.” The more effective teachers in each of these areas may gravitate to the schools that
emphasize these subjects – perhaps because they like teaching students motivated in their subjects, or
because they believe being the math teacher in the math-oriented school confers higher prestige than being
the math teacher in a the literature-oriented school. If these schools add more hours of instructions to their
favorite subject of specialization, then teachers’ quality will confound the effect of instruction time. Such
specialized-focus schools almost always select their students based on subject-specific ability and
motivation and often also use tracking. As a result, the robustness of the evidence presented above
regarding patterns of admission and student selection criteria is reassuring that the effect of instruction
time that I estimate is not capturing other effects such as teacher quality.
Table 5 provides further evidence to support this conclusion. First, I add to the regressions control
variables that are indicators of whether the school offers a special study program in science or math which

18
may attract students with special interest and ability in those subjects. The set of controls is based on
questions 20 and 22 in the PISA school questionnaire. These questions consist of indicators for school
activities that promote student engagement with science (such as science clubs, science fairs, science
competitions, extracurricular science projects, excursions, and field trips). The motivation for including
these control variables is that they most likely will eliminate a potential bias in the estimated effect of
hours of instruction due to selection or sorting of students to schools based on special abilities and interest
in science and math. These results are presented in columns 1 and 2 of Table 5. Note that the OLS (column
1) and fixed effects (column 2) estimates, are almost identical to the respective estimates presented in
columns 1-2 of Table 3. This suggests that the many schools that offer special programs and activities in
science and math are not source of concern for bias.
Another robustness check of our evidence is based on the data available in PISA (school
questionnaire question 14) about lack of qualified teachers for each of the following subjects: science,
mathematics, language, and other subjects. I have added a control variable for whether the school’s
capacity to provide instruction in a given subject is hindered by a lack of qualified teachers in that subject.
The rationale for adding this control is that specialized schools with a particular strength in a given subject
are less likely to struggle to find and hire qualified teachers. The OLS and pupil fixed effect estimates are
presented in columns 3 and 4 in Table 5. They are almost identical to those presented in columns 1-2 of
Table 3.12 These results suggest that a school's ability to find qualified teachers is not a potential source of
bias regarding our core results.
C. Heterogeneous treatment effects
12 I also estimate the potential effect of teachers in other ways, through various samples stratified by the extent of
lack of qualified teachers. For example, I compared a sample of schools that reported a lack of qualified teachers in
at least two subjects to a sample that included only schools without a lack of qualified teachers in any subject. The
results obtained from these samples are practically identical (results are available from the author upon request).

19
To gain further insights into the effect of instructional time, I explore heterogeneous effects of
classroom hours for different subgroups. In Table 6, I report separate estimates for boys and for girls. The
estimates show a positive impact of instructional time for both genders. In our preferred fixed effects
specification, the effect is marginally higher (by 13 percent) for girls than for boys, but this difference is
not significantly different from zero. This suggests that the benefits of additional instructional time are
similar for both genders.
In Table 7, I report results for two sub-samples stratified by certain family characteristics: the
average years of schooling of both parents and by immigrant status. In our preferred fixed effects
specification, the productivity of instructional time is clearly higher (35 percent) for pupils from low-
education families. As well, the effect of additional instructional time for immigrants reveals a striking
pattern. As compared to children of native parents, the benefits of additional instruction time are marginally
higher (12 percent) for children of first-generation immigrants, but they are much higher (30 percent) for
second-generation immigrants. This suggests that there are some heterogeneous effects of instructional
time.
D. Evidence from middle- and low-income countries
In this section, I explore whether the effects of instructional time differ by country income. The
first panel in Table 8 presents evidence that is based on a sample of 14 middle-income countries from the
former Soviet Bloc: Bulgaria, Czech Republic, Estonia, Croatia, Hungary, Lithuania, Latvia, Montenegro,
Poland, Romania, Russian Federation, Serbia, Slovak Republic, and Slovenia. The mean test scores of the
three subjects in this sample are all lower than the respective means of the OECD countries. The mean test
scores for this sample are: 472.4 for math, 480.4 for science, and 458.3 for language (see Table A2 in the
online appendix). The standard deviations in the pupil-level distribution of test scores are 97.8 in math,
97.9 in science and 105.0 in language – similar to those in the OECD sample.
The table indicates that the OLS estimates of the effect of instructional time are much higher in
this sample relative to the results for the OECD developed countries. For example, the OLS estimate for
20
the continuous hours of instruction variable is 0.38.2, versus 0.196 in the OECD sample. However, the
within-pupil estimate is 0.061 which is almost identical to the respective OECD estimate. This suggests
that the selection or endogeneity in school resources in the Eastern European countries is much more
important. In terms of heterogeneity, in our preferred fixed-effect specification the estimate for girls is
again higher (26 percent) than for boys, and it is much higher (33 percent) for pupils from low-education
families. As well, the greater effect of hours of instruction on second-generation immigrants is again
evident as in the OECD sample.
The second panel in Table 8 presents estimates based on a sample of 13 developing countries:
Argentina, Azerbaijan, Brazil, Chile, Colombia, Indonesia, Jordan, Kyrgyzstan, Mexico, Thailand,
Tunisia, Turkey, and Uruguay.13 The mean test scores for this sample of developing countries are: 398.5
in math, 403.4 in science, and 397.1 in language. This implies that their mean test scores are 21 percent
lower than in the OECD countries. The standard deviation in the pupil level distribution of test scores is
around 100 in the three subjects.
The Panel B estimates show much lower instructional time productivity than the estimates of the
OECD or the middle-income Eastern European countries. The effect of a change of one classroom hour is
only 0.029 points in our fixed effects specification. This effect size is about half the effect size estimated
for the OECD developed economies and for the Eastern European sample.14 In terms of heterogeneity,
instructional time in the sample of the developing countries is much more effective in improving test scores
of girls (38 percent higher than for boys) and of first-generation immigrants (67 percent higher than second-
13 It should be noted that I do not include in this sample the newly industrialized countries of Korea, Honk Kong,
Macau, and Chinese Taipei since their per capita income is much higher than the developing countries. In addition,
PISA does not classify these countries as developing countries. These countries are also among the best-performing
countries among all participants in PISA 2006 and their mean instructional time in all three subjects is also among
the highest in the overall sample. 14 The gap is even larger based on a comparison of the estimates derived from pooling only math and science test
scores. As well, the largest difference in terms of the non-linear specification of instructional hours between the two
groups of countries is in the effect of changing from less than two hours to 2-3 hours of instruction per week. These
results are available from the author upon request.

21
generation immigrants). However, in this sample the effect of additional instructional time is 26 percent
lower for pupils from low-education families than for pupils from highly educated families.
Our Table 8 results can be used to compute what proportion of the gap in knowledge and test
scores between the developed and developing countries can be explained or eliminated by bridging the gap
in instructional time and in its productivity in the different subjects. According to Table 1, the mean
instructional times in math, science and language in the OECD countries are 3.5, 3.1 and 3.5 hours per
week; in the poor countries they are 3.5, 3.0 and 3.2 hours per week respectively. A comparison shows
that the gaps in instructional time are relatively small. The two distinct groups of countries spend almost
the same amount of time on math and science, and the wealthy OECD countries spend only marginally
more time on language (9 percent). At the same time, the mean test scores in the developing countries
sample are about 100 points lower: 398.5 versus 506.5 in math, 403.4 versus 508.6 in science, and 397.1
versus 497.7 in language (see Table A1 and Table A3). Therefore, the gap in mean test scores between the
developing and the OECD developed countries is very large (more than 20 percent) and its size is about
one standard deviation in each of the subjects. Obviously, equalizing the instructional time in the poor
countries to the level in rich countries will not significantly eliminate the test score gap between these two
parts of the world. However, the poor countries can reduce this gap by raising the marginal productivity
of instructional time to the level in rich countries. The average instructional time in the three subjects in
the developing countries sample is 0.032. Converging to the productivity of instructional time in the OECD
countries will therefore raise achievements in each of the three subjects by 0.10 of a standard deviation. In
the next section, I explore the potential impact of changing structural features of the education system in
developing countries as these changes may lead to a convergence of the productivity of instructional time
to the level in the OECD countries.
E. Correlates of productivity differences of instructional time across countries
The productivity of instructional time is endogenous, and it can be affected by a wide variety of
factors - for example, the quantity and quality of other school inputs, teachers’ education and training,

22
class size, computers, science labs, and other similar factors. All of these inputs might interact with learning
hours and shape the productivity of instructional time in school. Similarly, various structural features of
the education system may affect teachers’ and school principals’ effort and efficiency, which should
influence the productivity of instructional time. These structural features include accountability measures
that publish school league tables based on national tests, or policies that use pupils’ performance measures
to determine school staff compensation. Another relevant structural characteristic of the education system
is the degree of autonomy that schools have in hiring and dismissing teachers. We can presume that more
flexibility in staffing decision might lead to a better match between teachers and schools and create an
environment that induces more effort and responsibility among school staff.
Many aspects and characteristics of this dimension of the educational landscape were surveyed as
part of the 2006 PISA, through a survey of school head masters and the gathering of data on various
indicators in a comparable manner for all the participating countries. For instance, PISA includes three
binary indicators of school accountability measures: whether achievements data are posted publicly;
whether achievements data are used in evaluation of school principal performance; and whether
achievements data are used in evaluation of teachers' performance. Another index ranks the school's quality
of educational resources that is based on teachers’ qualifications, class size, and the quality of other school
inputs. Two additional indices measure the degree of school autonomy. The first measures the school’s
autonomy in resource allocation: hiring and firing teachers, determining teachers’ starting salaries and
potential raises, and determining and allocating the budget. The second index measures the school’s
responsibility for curriculum and assessment including school independence in deciding the courses
offered and their content, the textbooks used, and the method of assessing pupil performance.
Table 9 presents the estimated coefficients from these regressions. I focus on the OECD sample
since it is the largest in terms of number of countries and schools in the sample and due to the relatively
large variation in structure and characteristics of schools. The first column presents the means for the
school measures. The table indicates that accountability is not widespread among OECD countries as only
33.5 percent of the schools post their mean achievement publicly, and even fewer schools use them to

23
evaluate school principals (22 percent) or teachers (29 percent). The relative size for the means of the other
indices is harder to interpret.
In columns 2 and 3 of Table 9, I present the estimates of the main effect of instructional hours and
the estimates of the interaction of instructional hours and each of the school-level indices. It should be
noted that because these indices are the same in each school for all subjects, their main effect cannot be
included as covariates in a regression that includes a school fixed effect. However, the interactions of these
indices with instructional time can be included in the within-pupil regression of achievement. Note that
while the pupil fixed effect absorbs the school fixed effect it also controls for any school- level factor that
is correlated with or determines these indices. In other words, even if the distribution of these indices across
schools is not random, the school fixed effect will control for such heterogeneity. Therefore, the identifying
assumption for the effect of the interaction between the indices and the hours of instruction is that the
heterogeneity in these indices across schools is not subject specific. In other words, the interaction of hours
of instruction with, for example, accountability, can be interpreted as causal only if it is picking up
observed and unobserved variation of a school characteristics that do not vary by subject.
I include the interactions one at a time, so each pair of estimates comes from a different regression.
The estimated main effect of instruction hours is always positive and significant, and it does not vary much
across the different regressions and from the estimate presented in Table 3. Several of the
estimated effects for the interaction terms are significantly different from zero. For example, the effects of
publishing achievement data and school responsibly for budget allocation are positive and significant.
Furthermore, these results remain significantly different from zero and their point estimate does not change
much when all the interactions simultaneously in the regression. These results, shown in column 4 of Table
9, suggest the multi-collinearity among the various indices does not prevent the estimation of the unique
effect of each index.
Overall, the results suggest that the productivity of instructional time is higher in schools that
implement school accountability measures, and in schools that have a degree of independence in allocating
their resources. The index of quality of educational resources has a positive coefficient but it is not

24
precisely measured. In contrast, school flexibility in determining its curriculum and pupils’ assessment
measures do not have a significant effect on the productivity of instruction hours. Note that this index has
no significant effect even when regressed as the sole interaction with hours of instruction. However, I
should emphasize that the main effect on pupils’ achievement of school pedagogical autonomy may still
be positive even though it does not vary with hours of instruction across the three subjects measured in
PISA.
The main effect of instructional time in the regression when all indices are included simultaneously
is 0.047. In schools that post the achievements of their students publicly, this estimate is 6.64, more than
40 percent higher. A similar large effect is evident in schools that evaluate school principals according to
their students’ performance though no such effect is evident in schools that similarly evaluate their
teachers. However, the 2006 PISA questionnaire data do not provide enough details to allow an
understanding of how exactly such evaluations are done and whether they are used to reward school staff
or affect their wages. As a result, we should be cautious in interpreting these results.
Another interesting feature of the school structure in PISA 2006 is governance, in particular the
role of the school governing board. Four questions assess the role of the governing board in influencing
staffing, the budget, and instructional content and assessment. Adding to the regression interactions terms
between these four indicators and instructional hours did not change the point estimates of the already
included interaction terms. Furthermore, the pattern of the estimates of these new interaction terms is
interesting since the results are consistent with the evidence of the other interaction terms. First, the results
indicate that having a board that influences staffing and the budget leads to a higher productivity of
instructional time. Second, having a board that influences instructional content and assessment has no
measurable effect on the productivity of instruction in school. This evidence (presented in column 5 of
Table 9) strengthens the overall findings that school autonomy in budgetary issues is conducive to
enhancing pupils’ learning and achievement. At the same time, there is no evidence that school pedagogic
autonomy will lead to higher productivity.

25
V. Conclusions
In this paper, I empirically measure the effects of instructional time on students’ academic
achievement. The evidence from a sample of 15-year-old students from over 50 countries consistently
shows that additional instructional time has a positive and significant effect on test scores. The OLS results
are highly biased upward, but the within-student estimates are very similar across groups of developed and
middle-income countries. Overall, the effects of instructional time are relatively large relative to other
school-level interventions for which we have reliable evidence. However, we should note that the
identification strategy based on within pupil variation has some limitations which may qualify the strength
of the causal statements that one can make relative to evidence from randomized experiments or a quasi-
experimental settings such as a regression discontinuity model.
From a policy perspective, any evaluation of the merits of adding instructional time should take
into account its cost relative to other potentially beneficial inputs or interventions. Policymakers would be
advised to consider that adding instructional time in a given subject may be associated with beneficial
spill-over effects by leading to more demanding and advanced coursework. For example, if high school
students from a different country or school spend twice as much class time on math than students from a
different country or school, they are much more likely to cover algebra rather than just geometry. Such an
increase in the level of challenge in coursework may have increased performance in PISA along with the
effect realized solely through more time devoted to subjects. The PISA data do now allow me to
disentangle these two channels of effect of change in instruction time.15
As well, our results also show that the estimated effect of additional instructional time is strikingly
lower for the sample of developing countries and the gains in developing countries were only half the size
of those in developed countries. The results are all the more worrying since the developing countries
included in the PISA sample (such as Chile, Argentina and Thailand) are much more developed than the
“typical” developing country. Possible explanations for the low productivity of instruction time in the PISA
15 See Goodman (2009) for a discussion of the literature on the effects of coursework on achievement and earnings.

26
developing countries sample can be drawn from the findings reported in the previous section as school
accountability measures, large degree of schools’ independence in allocating resources and in hiring/firing
teachers and strong influence of school governing boards are much less prevalent among schools from
these countries in comparison to the PISA developed countries sample. Given the recent evidence from
India, Kenya and other very poor developing countries about the high rate of absenteeism of teachers, we
can expect that the productivity of instructional time in the poorest developing counties in Africa and in
South East Asia is even lower than in our PISA sample. The significant association between instructional
time productivity and the structure and working environments of educational systems in OECD countries
points toward a path for improvements in all nations. For developing countries in particular, one avenue
for enhanced educational and economic progress clearly lies in closing this gap in productivity of
instructional time.

27
References
Allensworth Elaine and Takako Nomi, 2009, “Double-Dose Algebra as an Alternative Strategy to
Remediation: Effects on Students' Academic Outcomes”, Journal of Research on Educational
Effectiveness, March, pages 111-148.
Barrow, L., Markman, L. and C. E. Rouse. (2009). “Technology's Edge: The Educational Benefits of
Computer-Aided Instruction.” American Economic Journal: Economic Policy, Vol. 1, No. 1,
February, pp. 52–74.
Betts, J. R. and E. Johnson. (1998). “A Test of Diminishing Returns to School Spending.” Unpublished
Manuscript, University of California San Diego.
Card, D. and A. Krueger. (1992). “Does School Quality Matter? Returns to Education and the
Characteristics of Public Schools in the United States.” Journal of Political Economy, pp. 1-40.
Dee Thomas, “A teacher like me: Does race, ethnicity or gender matter?” American Economic
Review, 95(2), pp. 158-165. 2005.
Dobbie, Will and Roland G. Fryer, Jr. (2011) “Getting Beneath the Veil of Effective Schools: Evidence
from New York City”, Harvard University.
Eide, E. and M. H. Showalter. (1998). “The Effect of School Quality on Student Performance: A Quantile
Regression Approach,” Economics Letters, vol. 58, pp. 345-50.
Fryer, Roland G., Jr. (2012). “Injecting Successful Charter School Strategies into Traditional Public
Schools: Early Results from an Experiment in Houston, January 2012
Code to Replicate Results.” Harvard University.
Goodman, Joshua. (2009). “The Labor of Division: Returns to Compulsory Math Coursework”,
Unpublished Manuscript, Harvard Kennedy School.
Grogger, J. (1996). “Does School Quality Explain the Recent Black/White Wage Trend?” Journal of Labor
Economics, vol. 14, pp. 231-53.
Hansen, Ben. (2008) “School Year Length and Student Performance: Quasi-Experimental Evidence”,
Unpublished Manuscript, University of California Santa Barbara.
Jacob, B. and L. Lefgren. (2004). “Remedial education and student achievement: A regression-
discontinuity analysis”, Review of Economics and Statistics, vol. 86, pp. 226-44.
Kane. J., Rockoff J. E. and D. O. Staiger. (2007). "What Does Certification Tell Us About Teacher
Effectiveness? Evidence from New York City." NBER Working Paper 12155.

28
Krueger, Alan (1999) “Experimental Estimates of Education Production Functions”, Quarterly Journal of
Economics 114: 497-532.
Lavy, Victor. (2012) “Expanding School Resources and Increasing Time on Task: Effects of a Policy
Experiment in Israel on Student Academic Achievement and Behavior”, NBER Working Paper
Number w18369.
Lee, J. W. and R. Barro. (2001). “School Quality in a Cross-Section of Countries.”, Economica, vol. 68:
465-88.
Marcotte, Dave E. and Steven Hemelt. (2008). “Unscheduled Closings and Student Performance,”
Education Finance and Policy, vol. 3, pp. 316-38.
Pischke, Jörn-Steffen. (2007). “The Impact of Length of the School Year on Student Performance and
Earnings: Evidence from the German Short School Years,” Economic Journal, vol. 117: 1216-42.
Rivkin. S. G, Hanushek, E. A. and J. F. Kain. (2005). “Teachers, Schools, and Academic Achievement”,
Econometrica, vol. 73, pp. 417-59.
Rivkin. S. G, and Jeffrey C. Schiman, 2013, “Instruction Time, Classroom Quality, and Academic
Achievement”, NBER Working Paper 19464.
Rockoff. J. E. (2004). “The Impact of Individual Teachers on Student Achievement: Evidence from Panel
Data.” American Economic Review, vol. 94, pp. 247-52.

Subject Mean Value Std. Dev < 2 Hours 2-3 Hours 4-5 Hours 6 Hours +
All Subjects 3.38 (1.48) 13.16 40.43 36.45 9.97
Math 3.53 (1.38) 8.72 39.54 43.14 8.60
Science 3.06 (1.57) 21.14 42.72 25.53 10.61
Reading 3.54 (1.44) 9.61 39.02 40.66 10.71
All Subjects 3.05 (1.56) 22.51 39.59 29.29 8.61
Math 3.30 (1.48) 15.36 38.97 37.59 8.08
Science 2.77 (1.68) 33.38 37.21 17.53 11.88
Reading 3.08 (1.45) 18.79 42.59 32.75 5.86
All Subjects 3.23 (1.71) 22.86 34.72 27.51 14.90
Math 3.48 (1.69) 18.72 30.73 34.06 16.50
Science 2.97 (1.74) 29.03 37.17 18.53 15.27
Reading 3.24 (1.65) 20.85 36.27 29.94 12.95
Table 1 - Means and Standard Deviations of Instructional Time in OECD, Eastern European, and Developing Countries
Proportion of pupils by weekly instruction time
Panel A: 22 OECD Countries
Panel B: 14 Eastern European Countries
Panel C: 13 Developing Countries
Notes: The first column shows the mean of instruction time per week and the second column presents therespective standard deviations. The thrid to sixth columns presents the proportion of pupils by the amount ofweekly hours of instruction time. The sample in panel A includes 22 OECD developed countries: Australia,Austria, Belgium, Canada, Germany, Denmark, Spain, Finland, France, Greece, Ireland, Iceland, Italy, Japan,Luxembourg, Netherlands, Norway, New Zealand, Portugal, Sweden, Switzerland, United Kingdom. Panel Bincludes 14 countries of Eastern Europe: Bulgaria, Croatia, Czech Republic, Estonia, Hungary, Latvia,Lithuania, Montenegro, Poland, Romania, Russian Federation, Serbia, Slovak Republic, Slovenia. Panel Cincludes 13 developing countries: Argentina, Azerbaijan, Brazil, Chile, Colombia, Indonesia, Jordan,Kyrgyzstan, Mexico, Thailand, Tunisia, Turkey, Uruguay. Standard errors are reported in parentheses.

(1) (2) (3) (4) (5) (6) (7) (8) (9)
I. Continuous Hours:
0.217 0.280 0.244 0.262 0.384 0.339 0.046 0.154 0.125(0.010) (0.012) (0.011) (0.008) (0.009) (0.008) (0.010) (0.013) (0.012)
II. Categorical Hours:
0.409 0.480 0.430 0.447 0.537 0.485 0.493 0.507 0.422(0.082) (0.073) (0.067) (0.026) (0.028) (0.025) (0.104) (0.085) (0.077)
0.637 0.701 0.619 0.771 0.905 0.804 0.557 0.649 0.534(0.082) (0.074) (0.068) (0.030) (0.032) (0.030) (0.104) (0.087) (0.078)
Country dummies
Individual characteristics
4 Hours +
Notes: The table shows OLS regression estimates of student test z-scores on hours of school instruction in a particular subject. Scores are standardized using a mean of 500 anda standard deviation of 100. In the first regression hours of instruction is a continuous variable. In the second regression hours enters the regression as binary variables for aparticular number of hours learned per subject per week. The base (omitted) category is 1 hour. Controls on individual characteristics include binary variables for gender,fathers' and mothers' education and immigrant status. The sample includes 22 OECD developed countries (see notes to Table 1). Standard errors in parentheses are clustered atthe school level. Each regression contains 137 083 observations.
Table 2 - OLS Regressions of Standardized Test Scores on Instructional Time, OECD Sample
Mathematics Science Reading
Hours
2-3 Hours

(1) (2) (3) (4) (5) (6)I. Continuous Hours:
0.196 0.058 0.170 0.060 0.211 0.062(0.007) (0.004) (0.009) (0.005) (0.017) (0.009)
II. Categorical Hours:0.469 0.063 0.432 0.075 0.558 0.065
(0.027) (0.011) (0.038) (0.016) (0.057) (0.024)
0.679 0.124 0.627 0.141 0.737 0.131(0.029) (0.013) (0.040) (0.018) (0.060) (0.028)
Number of Observations
I. Continuous Hours:0.255 0.071 0.218 0.086 0.276 0.076
(0.007) (0.006) (0.009) (0.008) (0.018) (0.013)II. Categorical Hours:
0.457 0.094 0.401 0.108 0.552 0.122(0.026) (0.015) (0.035) (0.026) (0.051) (0.034)
0.739 0.170 0.657 0.207 0.805 0.187(0.028) (0.018) (0.037) (0.028) (0.056) (0.041)
Number of Observations
4 Hours +
307,156 177,846 57,580
Notes: The table shows OLS and FE regressions of student z-scores on hours of instruction in a particular subject.Scores are standardized using a mean of 500 and a standard deviation of 100. Fixed effects are at the student level.Each regression also includes subject fixed effects. In the first regression hours of instruction is measured acontinuous variable. In the second regression hours enters the regression as binary variables for a particular numberof hours learned per subject per week. The base (omitted) category is 1 hour. The sample includes 22 OECDdeveloped countries (see notes to Table 1). Standard errors in parentheses are clustered at the school level.
2-3 Hours
OLS
Student FE
Hours of Instructional Time
2-3 Hours
4 Hours +
460,734 266,769 86,370
B. Mathematics + Science
Hours of Instructional Time
Table 3 - Estimated Effect of Instructional Time on Standardized Test Scores, OECD SampleWhole Sample Sample Divided by School Admission Policy
Academic Record is Irrelevant
Academic Record Taken in to Account
OLS
Student FE OLS
Student FE

(1) (2) (3) (4) (5) (6)
0.199 0.066 0.190 0.062 0.200 0.052(0.011) (0.005) (0.010) (0.006) (0.014) (0.007)
Number of Observations
(1) (2) (3) (4)
0.184 0.056 0.196 0.058(0.007) (0.004) (0.007) (0.004)
Number of Observations
Hours of Instructional Time
212,169 201,138 160,188
Notes: Table 4 replicates Table 3 in samples defined by tracking status - whether the school tracks students byclasses, within classes, or not at all. The table shows OLS and FE regressions of student z-scores on hours ofinstruction in a particular subject. Scores are standardized using a mean of 500 and a standard deviation of 100.Fixed effects are at the student level. Each regression also includes subject fixed effects. Hours of learning is acontinuous variable. The sample includes 22 OECD developed countries (see notes to Table 1). Standard errorsin parentheses are clustered at the school level.
Table 4 - Estimated Effect of Instructional Time on Standardized Test Scores
by Tracking StatusTracking By Class Track In Class No Tracking
OLS
Student FE OLS
Student FE OLS
Student FE
Hours of Instructional Time
460,734 224,508
Notes: The table shows OLS and FE regressions of student z-scores on hours of instructionin a particular subject. Scores are standardized using a mean of 500 and a standarddeviation of 100. Fixed effects are at the student level. Each regression also includessubject fixed effects. Hours of instruction is a continuous variable. The sample includes 22OECD developed countries (see notes to Table 1). Standard errors in parentheses areclustered at the school level.
Table 5 - Estimated Effects of Instruction Time on Standardized Test Scores, with Controls Included in the Regressions for Special Science Activities in
School and for Scarcity of Teachers in Each SubjectControl Added For
Special Science Scarcity of Teachers
OLS
Student FE OLS
Student FE

(1) (2) (3) (4)
0.202 0.050 0.186 0.056(0.009) (0.004) (0.008) (0.004)
Number of Observations
Hours of Instructional Time
224,508 236,226
Notes: The table shows OLS and FE regressions of student z-scores on hours of instruction in a particular subject. Scoresare standardized using a mean of 500 and a standard deviation of 100. Fixed effects are at the student level. Each regressionalso includes subject fixed effects. Hours of instruction is a continuous variable. The sample includes 22 OECD developedcountries (see notes to Table 1). Standard errors in parentheses are clustered at the school level.
Table 6 - Estimated Effect of Instructional Time on Standardized Test Scores, by Gender, OECD SampleBoys Girls
OLS
Student FE OLS
Student FE
OLS Stud.FE OLS Stud.FE OLS Stud.FE OLS Stud.FE
(1) (2) (3) (4) (5) (6) (7) (8)
0.196 0.048 0.178 0.065 0.399 0.064 0.376 0.076
(0.009) (0.004) (0.007) (0.004) (0.020) (0.009) (0.020) (0.009)
Number of Observations
Notes: The table reports estimates of the effect of instruction time on test z-scores for the following sub-samples: pupilsfrom high edcuation families, pupils from low education families, first generation immigrants, and second generationimmigrants. Scores are standardized using a mean of 500 and a standard deviation of 100. Fixed effects are at the studentlevel. Each regression also includes subject fixed effects. Hours of instruction is a continuous variable. The sampleincludes 22 OECD developed countries (see notes in Table 1). Standard errors in parentheses are clustered at the schoollevel.
Hours of Instructional Time
235,539 225,195 23,103 22,092
Table 7 - Heterogeneity in Estiamted Effect of Instructional Time on Standardized Test Scores, OECD Sample.
High Parental Education
Low Parental Education
Immigrants - First Generation
Immigrants - Second Generation
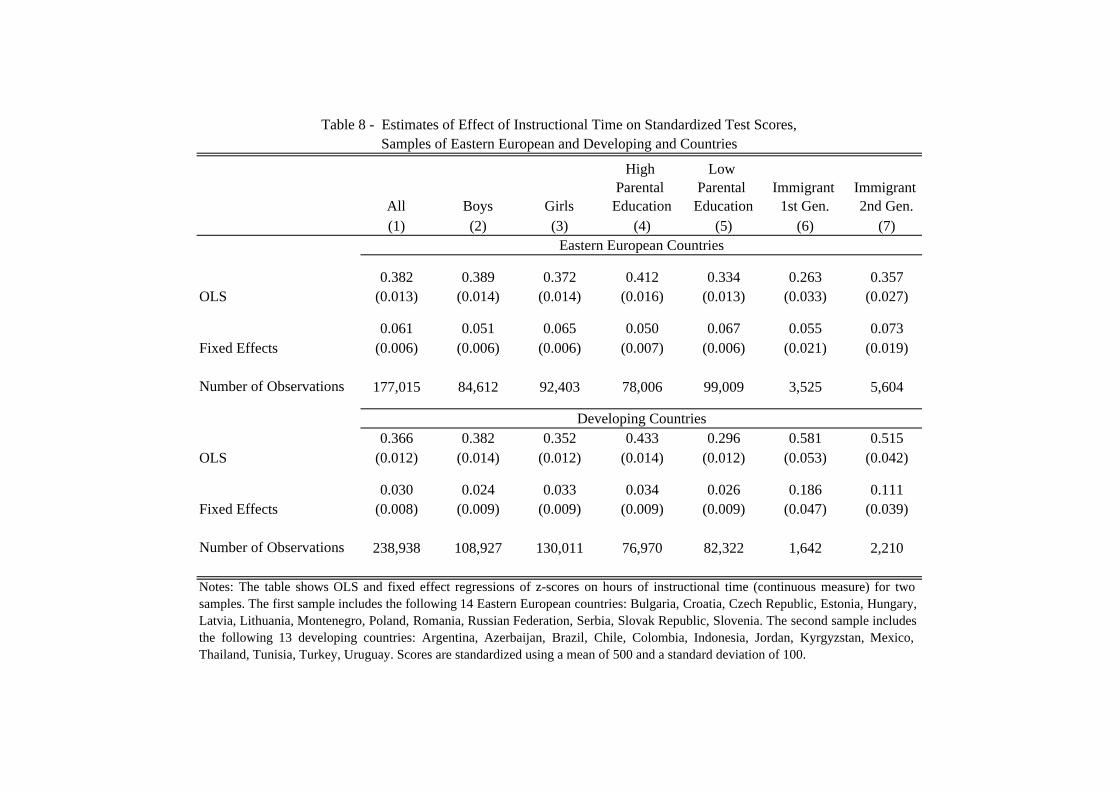
All Boys Girls
High Parental
Education
Low Parental
EducationImmigrant
1st Gen.Immigrant 2nd Gen.
(1) (2) (3) (4) (5) (6) (7)
0.382 0.389 0.372 0.412 0.334 0.263 0.357(0.013) (0.014) (0.014) (0.016) (0.013) (0.033) (0.027)
0.061 0.051 0.065 0.050 0.067 0.055 0.073(0.006) (0.006) (0.006) (0.007) (0.006) (0.021) (0.019)
Number of Observations 177,015 84,612 92,403 78,006 99,009 3,525 5,604
0.366 0.382 0.352 0.433 0.296 0.581 0.515(0.012) (0.014) (0.012) (0.014) (0.012) (0.053) (0.042)
0.030 0.024 0.033 0.034 0.026 0.186 0.111(0.008) (0.009) (0.009) (0.009) (0.009) (0.047) (0.039)
Number of Observations 238,938 108,927 130,011 76,970 82,322 1,642 2,210
OLS
Fixed Effects
Notes: The table shows OLS and fixed effect regressions of z-scores on hours of instructional time (continuous measure) for twosamples. The first sample includes the following 14 Eastern European countries: Bulgaria, Croatia, Czech Republic, Estonia, Hungary,Latvia, Lithuania, Montenegro, Poland, Romania, Russian Federation, Serbia, Slovak Republic, Slovenia. The second sample includesthe following 13 developing countries: Argentina, Azerbaijan, Brazil, Chile, Colombia, Indonesia, Jordan, Kyrgyzstan, Mexico,Thailand, Tunisia, Turkey, Uruguay. Scores are standardized using a mean of 500 and a standard deviation of 100.
Table 8 - Estimates of Effect of Instructional Time on Standardized Test Scores, Samples of Eastern European and Developing and Countries
Eastern European Countries
OLS
Fixed Effects
Developing Countries

Index(1) (2) (3) (4) (5)
.335 .050 .027 .020 .025(.472) (.004) (.008) (.009) (.009)
.216 .052 .021 .022 .023(.411) (.004) (.009) (.011) (.011)
.294 .055 .003 -.012 -.009(.456) (.005) (.008) (.010) (.010)
.150 .058 .001 .004 .004(.989) (.004) (.004) (.004) (.004)
-.058 .059 .012 .008 .009(.946) (.004) (.004) (.004) (.004)
.052 .058 -.002 -.005 -.006(.964) (.004) (.004) (.004) (.004)
.363 .050 .026 .012(.481) (.005) (.008) (.009)
.706 .038 .030 .018(.455) (.007) (.008) (.009)
.162 .060 -.006 -.002(.368) (.004) (.010) (.011)
.219 .060 -.008 -.008(.413) (.005) (.008) (.009)
Hours Main Effect .047 .033(.007) (.010)
School Governing Board Influences Staffing (Binary Variable)
School Governing Board Influences Budget (Binary Variable)
School Governing Board Influences Instructional Content (Binary Variable)
School Governing Board Influences Assessment (Binary Variable)
Notes: This table presents the continuous effect of hours of instruction when it is interacted with various schoolcharacteristics (means of hours characteristics are shown in column 1). The estimates presented in columns 2 and 3 arebased on regressions when each characteristic enters the regression separately. In columns 4 and 5 all characteristics arejointly included. Regressions include hours of instruction, interaction between hours and the school characteristic,subject dummies, subject dummies interacted with school characteristics, and pupil fixed effects. The dependentvariable is standardized test scores. The scores are standardized using a mean of 500 and a standard deviation of 100.The sample includes 22 OECD developed countries that are listed in the notes of Table 3.
School Responsibility for Curriculum & Assessment: Index (Range -1.4 to 1.3)
Table 9 - Estimated Effects of School Characteristics Interacted with Instructional Hours, OECD Countries.
Separate Spec. Joint Spec.
Index's Mean
Hours Main Effect.
Hours interact-ed with Index
Hours interact-ed with Index
Hours interact-ed ith Index
Achievement data are posted publicly (e.g. in the media). (Binary Variable)
Achievement data are used in evaluation of the principal's performance (Binary Variable)
Achievement data are used in evaluation of teachers' performance (Binary Variable)
Quality of Educational Resources: Index, (Range -3.45 to 2.1)
School Responsibility for Resource Allocation: Index, (Range -1.1 to 2.0)
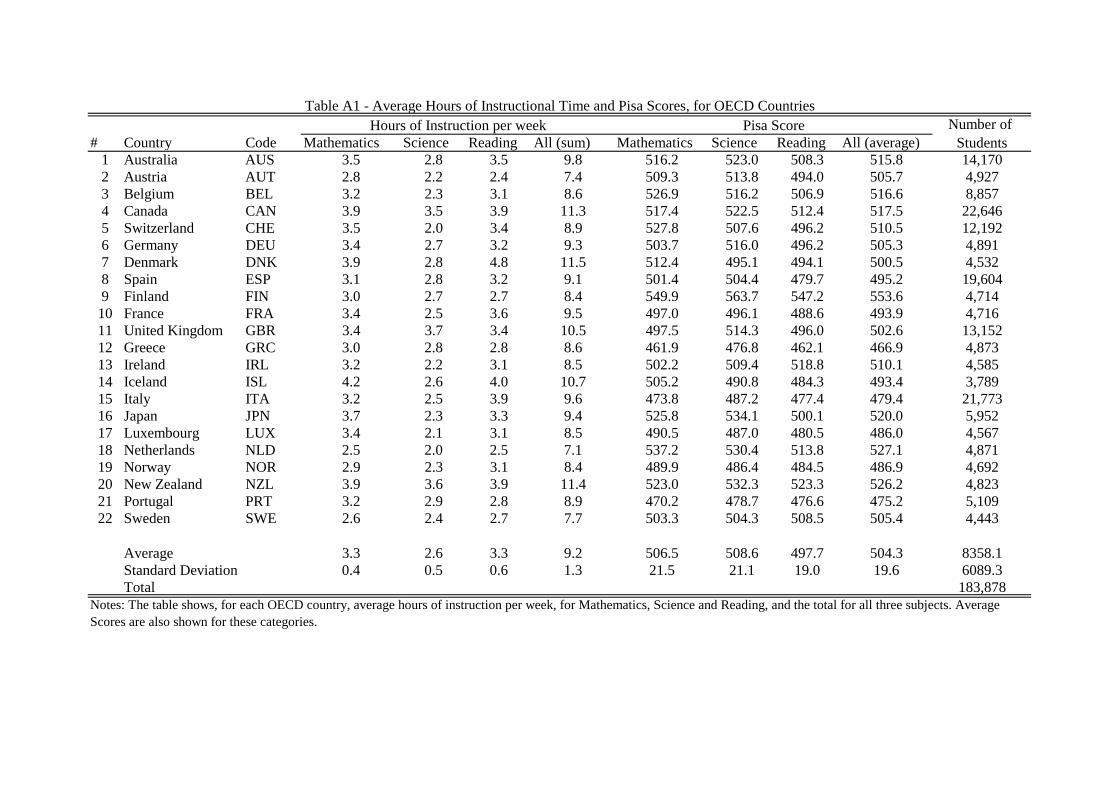
# Country Code Mathematics Science Reading All (sum) Mathematics Science Reading All (average)1 Australia AUS 3.5 2.8 3.5 9.8 516.2 523.0 508.3 515.8 14,1702 Austria AUT 2.8 2.2 2.4 7.4 509.3 513.8 494.0 505.7 4,9273 Belgium BEL 3.2 2.3 3.1 8.6 526.9 516.2 506.9 516.6 8,8574 Canada CAN 3.9 3.5 3.9 11.3 517.4 522.5 512.4 517.5 22,6465 Switzerland CHE 3.5 2.0 3.4 8.9 527.8 507.6 496.2 510.5 12,1926 Germany DEU 3.4 2.7 3.2 9.3 503.7 516.0 496.2 505.3 4,8917 Denmark DNK 3.9 2.8 4.8 11.5 512.4 495.1 494.1 500.5 4,5328 Spain ESP 3.1 2.8 3.2 9.1 501.4 504.4 479.7 495.2 19,6049 Finland FIN 3.0 2.7 2.7 8.4 549.9 563.7 547.2 553.6 4,71410 France FRA 3.4 2.5 3.6 9.5 497.0 496.1 488.6 493.9 4,71611 United Kingdom GBR 3.4 3.7 3.4 10.5 497.5 514.3 496.0 502.6 13,15212 Greece GRC 3.0 2.8 2.8 8.6 461.9 476.8 462.1 466.9 4,87313 Ireland IRL 3.2 2.2 3.1 8.5 502.2 509.4 518.8 510.1 4,58514 Iceland ISL 4.2 2.6 4.0 10.7 505.2 490.8 484.3 493.4 3,78915 Italy ITA 3.2 2.5 3.9 9.6 473.8 487.2 477.4 479.4 21,77316 Japan JPN 3.7 2.3 3.3 9.4 525.8 534.1 500.1 520.0 5,95217 Luxembourg LUX 3.4 2.1 3.1 8.5 490.5 487.0 480.5 486.0 4,56718 Netherlands NLD 2.5 2.0 2.5 7.1 537.2 530.4 513.8 527.1 4,87119 Norway NOR 2.9 2.3 3.1 8.4 489.9 486.4 484.5 486.9 4,69220 New Zealand NZL 3.9 3.6 3.9 11.4 523.0 532.3 523.3 526.2 4,82321 Portugal PRT 3.2 2.9 2.8 8.9 470.2 478.7 476.6 475.2 5,10922 Sweden SWE 2.6 2.4 2.7 7.7 503.3 504.3 508.5 505.4 4,443
Average 3.3 2.6 3.3 9.2 506.5 508.6 497.7 504.3 8358.1Standard Deviation 0.4 0.5 0.6 1.3 21.5 21.1 19.0 19.6 6089.3Total 183,878
Table A1 - Average Hours of Instructional Time and Pisa Scores, for OECD CountriesHours of Instruction per week Pisa Score Number of
Students
Notes: The table shows, for each OECD country, average hours of instruction per week, for Mathematics, Science and Reading, and the total for all three subjects. Average Scores are also shown for these categories.

# Country Code Mathematics Science Reading All (sum) Mathematics Science Reading All (average)1 Bulgaria BGR 2.6 2.3 2.6 7.5 417.2 439.4 407.2 421.3 4,4982 Czech Republic CZE 3.5 3.0 3.2 9.7 536.0 537.7 510.0 527.9 5,9323 Estonia EST 3.7 2.9 3.1 9.7 517.2 534.5 502.9 518.2 4,8654 Croatia HRV 2.7 1.8 2.9 7.3 467.3 493.3 477.1 479.2 5,2135 Hungary HUN 2.9 2.2 2.8 7.9 496.7 508.9 488.4 498.0 4,4906 Lithuania LTU 3.1 2.4 3.2 8.7 485.3 486.5 468.7 480.1 4,7447 Latvia LVA 3.9 2.5 3.2 9.7 491.1 493.7 484.6 489.8 4,7198 Montenegro MNE 2.7 2.5 2.6 7.8 395.2 408.8 387.8 397.3 4,4559 Poland POL 3.9 2.4 4.1 10.4 500.3 503.0 512.7 505.3 5,54710 Romania ROU 2.5 1.9 2.8 7.3 415.0 416.3 392.0 407.7 5,11811 Russian Federation RUS 3.2 3.3 1.8 8.3 478.6 481.4 442.3 467.4 5,79912 Serbia SRB 2.8 2.5 2.8 8.1 436.1 436.8 403.0 425.3 4,79813 Slovak Republic SVK 2.9 2.2 2.7 7.8 494.7 491.1 470.2 485.3 4,73114 Slovenia SVN 2.8 2.2 2.7 7.7 482.3 494.3 468.9 481.8 6,595
Average 3.1 2.4 2.9 8.4 472.4 480.4 458.3 470.3 5107.4Standard Deviation 0.5 0.4 0.5 1.0 41.3 40.2 44.0 41.3 640.5Total 71,504
Table A2 - Average Hours of Instructional Time and Pisa Scores, for Eastern European CountriesHours of Instruction per week Pisa Score Number of
Students
Notes: The table shows, for 14 Eastern European countries, average hours of instruction per week, for Mathematics, Science and Reading, and the total for all three subjects. Average Scores are also shown for these categories. The sample includes 14 countries of Eastern Europe: Bulgaria, Croatia, Czech Republic, Estonia, Hungary, Latvia, Lithuania, Montenegro, Poland, Romania, Russian Federation, Serbia, Slovak Republic, Slovenia.
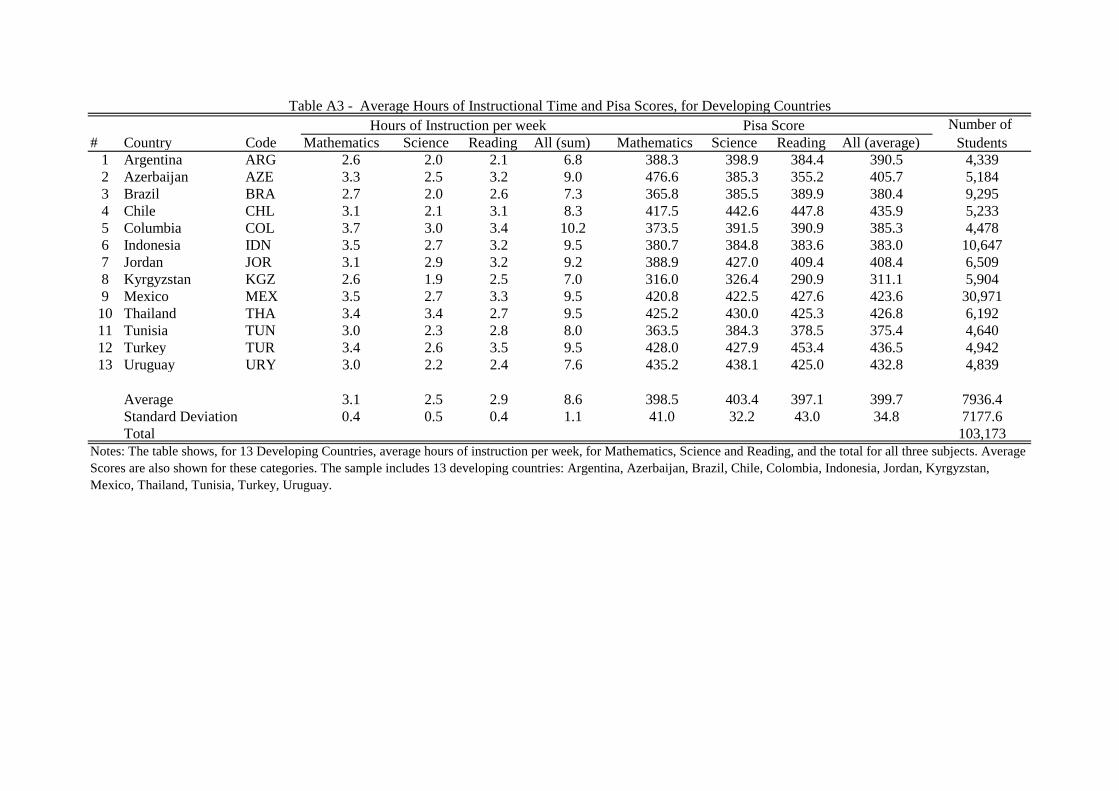
# Country Code Mathematics Science Reading All (sum) Mathematics Science Reading All (average)1 Argentina ARG 2.6 2.0 2.1 6.8 388.3 398.9 384.4 390.5 4,3392 Azerbaijan AZE 3.3 2.5 3.2 9.0 476.6 385.3 355.2 405.7 5,1843 Brazil BRA 2.7 2.0 2.6 7.3 365.8 385.5 389.9 380.4 9,2954 Chile CHL 3.1 2.1 3.1 8.3 417.5 442.6 447.8 435.9 5,2335 Columbia COL 3.7 3.0 3.4 10.2 373.5 391.5 390.9 385.3 4,4786 Indonesia IDN 3.5 2.7 3.2 9.5 380.7 384.8 383.6 383.0 10,6477 Jordan JOR 3.1 2.9 3.2 9.2 388.9 427.0 409.4 408.4 6,5098 Kyrgyzstan KGZ 2.6 1.9 2.5 7.0 316.0 326.4 290.9 311.1 5,9049 Mexico MEX 3.5 2.7 3.3 9.5 420.8 422.5 427.6 423.6 30,97110 Thailand THA 3.4 3.4 2.7 9.5 425.2 430.0 425.3 426.8 6,19211 Tunisia TUN 3.0 2.3 2.8 8.0 363.5 384.3 378.5 375.4 4,64012 Turkey TUR 3.4 2.6 3.5 9.5 428.0 427.9 453.4 436.5 4,94213 Uruguay URY 3.0 2.2 2.4 7.6 435.2 438.1 425.0 432.8 4,839
Average 3.1 2.5 2.9 8.6 398.5 403.4 397.1 399.7 7936.4Standard Deviation 0.4 0.5 0.4 1.1 41.0 32.2 43.0 34.8 7177.6Total 103,173
Table A3 - Average Hours of Instructional Time and Pisa Scores, for Developing CountriesHours of Instruction per week Pisa Score Number of
Students
Notes: The table shows, for 13 Developing Countries, average hours of instruction per week, for Mathematics, Science and Reading, and the total for all three subjects. Average Scores are also shown for these categories. The sample includes 13 developing countries: Argentina, Azerbaijan, Brazil, Chile, Colombia, Indonesia, Jordan, Kyrgyzstan, Mexico, Thailand, Tunisia, Turkey, Uruguay.

Mean 513.4 485.6 413.5 3.38 3.05 3.23
Standard Deviation 84.4 86.9 75.1 1.02 0.88 1.22between pupils
Standard Deviation 38.8 40.9 46.7 1.08 1.28 1.19within pupilsNotes: The table contains means, and the standard deviation within and between pupils, for 3 different samples: OECD countries, EasternEurope, and Developing Countries.
Table A4 - Descriptive Statistics - Test Score and Instructional Time Test scores Instructional time
OECD Developed
Eastern Europe
Developing countries
OECD Developed
Eastern Europe
Developing countries
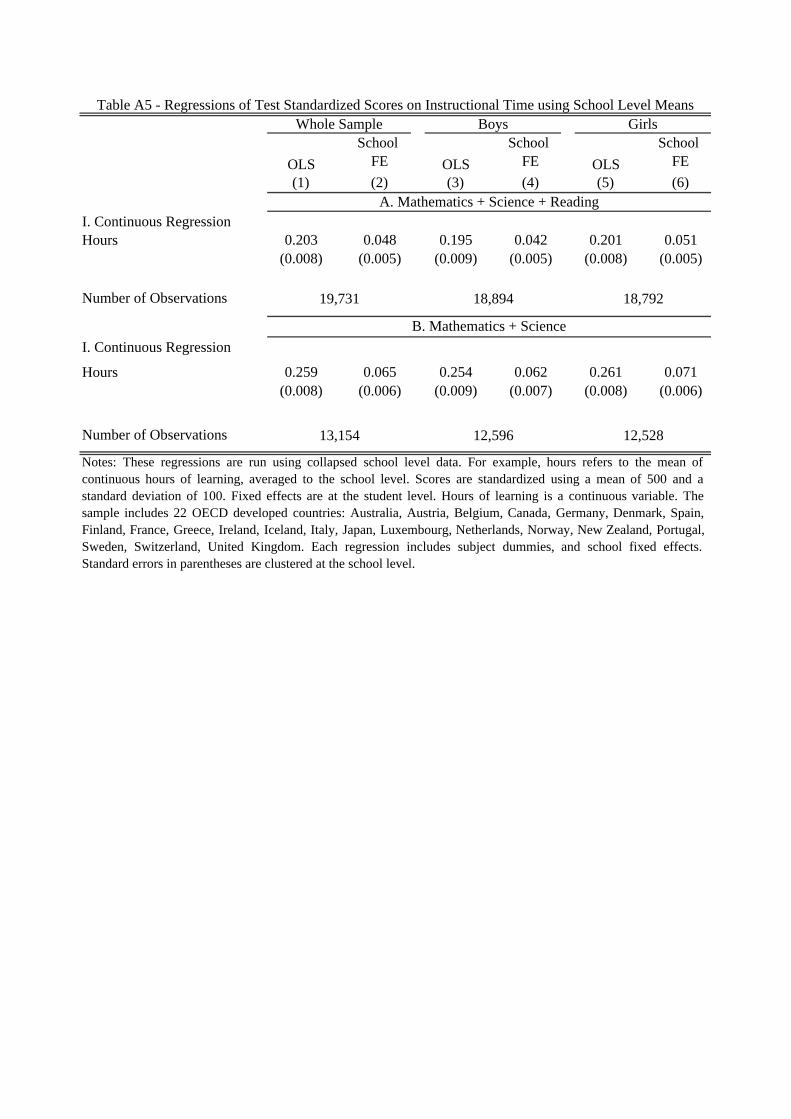
(1) (2) (3) (4) (5) (6)
I. Continuous Regression0.203 0.048 0.195 0.042 0.201 0.051
(0.008) (0.005) (0.009) (0.005) (0.008) (0.005)
Number of Observations
I. Continuous Regression
0.259 0.065 0.254 0.062 0.261 0.071(0.008) (0.006) (0.009) (0.007) (0.008) (0.006)
Number of Observations
Notes: These regressions are run using collapsed school level data. For example, hours refers to the mean ofcontinuous hours of learning, averaged to the school level. Scores are standardized using a mean of 500 and astandard deviation of 100. Fixed effects are at the student level. Hours of learning is a continuous variable. Thesample includes 22 OECD developed countries: Australia, Austria, Belgium, Canada, Germany, Denmark, Spain,Finland, France, Greece, Ireland, Iceland, Italy, Japan, Luxembourg, Netherlands, Norway, New Zealand, Portugal,Sweden, Switzerland, United Kingdom. Each regression includes subject dummies, and school fixed effects.Standard errors in parentheses are clustered at the school level.
B. Mathematics + Science
Hours
13,154 12,596 12,528
A. Mathematics + Science + Reading
Hours
19,731 18,894 18,792
Table A5 - Regressions of Test Standardized Scores on Instructional Time using School Level MeansWhole Sample Boys Girls
OLS
School FE OLS
School FE OLS
School FE