Research Proposal - UM Students' Repository
431
` IMPLEMENTATION OF TARGET COST MANAGEMENT (TCM) AND ITS KEY ENABLERS: A CASE STUDY OF AN AUTOMOTIVE COMPANY NORHAFIZA BAHARUDIN CHA0 80010 FACULTY OF BUSINESS & ACCOUNTANCY UNIVERSITY OF MALAYA KUALA LUMPUR 2016 University of Malaya
-
Upload
khangminh22 -
Category
Documents
-
view
0 -
download
0
Transcript of Research Proposal - UM Students' Repository
`
i
IMPLEMENTATION OF TARGET COST MANAGEMENT (TCM)
AND ITS KEY ENABLERS:
A CASE STUDY OF AN AUTOMOTIVE COMPANY
NORHAFIZA BAHARUDIN
CHA0
80010
FACULTY OF BUSINESS & ACCOUNTANCY
UNIVERSITY OF MALAYA
KUALA LUMPUR
2016
Univers
ity of
Mala
ya
`
ii
Univers
ity of
Mala
ya
`
iii
ABSTRACT
Studies show that many established Japanese companies use Target Cost Management
(TCM) as a profit planning management tool and a competitive tool for pricing their prod-
ucts. Despite the proven benefits of TCM as a key competitive tool, studies also show that
many companies, especially in developing countries, still lag behind in the implementation
of TCM. Furthermore, even if implemented, TCM practices outside of Japan are a
standalone process and the fundamental characteristics of TCM practices in these compa-
nies are not the same as in the Japanese companies. Nevertheless, due to the lack of studies
on TCM outside of Japan, there is still a lack of understanding concerning how different are
the TCM practices compared to the Japanese TCM theoretical model, why the differences
occur, and what enablers positively associated with TCM practices in non-Japanese envi-
ronment. By using the contingency theory and dynamic capabilities theory as underpinning
theories, this study attempts to examine in-depth how different are the TCM practices in
non-Japanese environment compared to the Japanese theoretical model, to identify the
causes of differences and to determine what enablers have a positive association with the
successful implementation of TCM. The research was carried out at Company A, a Malay-
sian-Japanese joint venture automotive company. It used the single embedded case study
method of K. Yin (2003) with multiple sources of data collection by using qualitative and
quantitative approach. Based on previous TCM case studies conducted at Japanese automo-
tive companies, a conceptual framework was developed as the case study guidelines. As for
TCM enablers that have a positive association with the successful implementation of TCM,
a theoretical framework was developed to find the statistical relationships. The findings
showed that the basic fundamental concept of TCM in the case company was similar to the
practices in Japanese automotive companies. Nevertheless, the case company coordinated
Univers
ity of
Mala
ya

`
iv
and reconfigured its resources to adapt to the contextual constraints, which caused some
differences in the TCM practices. Among nine proposed enablers, only top management
support and commitment, training and teamwork were regarded as the key enablers that
positively associated with the successful implementation of TCM. This research strength-
ens the body of knowledge relating to TCM practices in non-Japanese context particularly
in terms of in-depth understanding on TCM practice at Malaysia, how TCM practice was
adjusted to fit the contextual constraints, and the critical enablers that support the TCM im-
plementation in Malaysia automotive industry context.
Univers
ity of
Mala
ya

`
v
ABSTRAK
Banyak kajian menunjukkan syarikat-syarikat besar Jepun menggunakan Target Cost Man-
agement (TCM) sebagai alat dalam pengurusan “profit planning” dan alat strategi untuk
menetapkan harga produk yang berdaya saing. Walaupun TCM telah terbukti bermanfaat
sebagai alat kompetitif, kajian masih menunjukkan bahawa banyak syarikat di negara-
negara membangun masih ketinggalan dalam pelaksanaan TCM. Terdapat juga kajian yang
menunjukkan perlaksanaan TCM di negara selain Jepun masih di tahap tunggal dan tidak
berhubungkait dangan sistem yang lain. Ciri-ciri asas TCM juga didapati tidak sama seper-
ti perlaksanaan di syarikat-syarikat Jepun. Walau bagaimanapun, terdapat kekurangan
kajian menjelaskan apakah perbezaan perlaksanaaan TCM di luar Jepun berbanding dengan
TCM model di Jepun, kenapa ia berbeza, dan apakah faktor-faktor kritikal yang membantu
perlaksanaan TCM di luar Jepun. Berdasarkan “contingency theory” dan “dynamic capabil-
ities theory” sebagai theori asas, kajian ini cuba mengkaji secara mendalam perbezaan per-
laksanaan TCM di luar Jepun berbanding dengan model asal TCM di Jepun, mengenalpasti
punca berbeza dan, menentukan faktor positif yang membantu perlaksanaan TCM di luar
Jepun. Penyelidikan ini telah dijalankan di Syarikat A, syarikat automatif usahasama Ma-
laysia – Jepun dengan menggunakan kes kajian sebagai metodologi. Kes kajian ini ber-
dasarkan kaedah kajian kes K. Yin (2003) yang menggunakan pelbagai sumber pengum-
pulan data melalui cara kualitatif dan kuantitatif. Sebagai panduan perlaksanan kes kajian,
satu model konseptual perlaksanaan TCM dibentuk daripada kes-kes kajian perlaksanaan
TCM di syarikat-syarikat automatif Jepun. Untuk faktor- faktor yang membantu perlaksa-
naan TCM, model theoritikal dibentuk untuk mencari hubungkait statistik. Keputusan
kajian menunjukkan bahawa konsep asas TCM di Syarikat A adalah sama dengan konsep
TCM di syarikat- syarikat automatif Jepun. Tetapi, kajian ini mendapati terdapat
Univers
ity of
Mala
ya
`
vi
perbezaaan dalam cara pelaksanaan TCM. Ini disebabkan Syarikat A perlu menyepadukan
dan mengkonfigurasi sumber-sumber syarikat untuk mengadaptasi kekangan-kekangan
kontek. Dari sembilan faktor yang dicadangkan, hanya sokongan dan komitmen pengurusan
atasan, latihan dan budaya kerja berpasukan di anggap sebagai faktor-faktor positif mem-
bantu perlaksanaan TCM. Kajian ini menyumbang kepada pemantapan pengetahuan
mengenai perlaksanaan TCM di luar Jepun terutamanya memahami secara mendalam per-
laksanaan TCM di Malaysia, bagaimana TCM di ubahsuai untuk menyesuaikannya dengan
kekangan persekitaran, dan faktor kritikal yang membantu perlaksanaan TCM di dalam
automatif industri di Malaysia.
Univers
ity of
Mala
ya

`
vii
ACKNOWLEDGEMENT
Alhamdullillah. Thanks to Allah SWT for giving me the opportunity, strength and
patience to complete this research. I am deeply and whole heartedly thankful to all those
who have made this work possible especially to my supervisor, Prof. Madya Ruzita Jusoh,
my parents, Baharudin Arsat and Hajah Maimon Mijan and my mentor, Mr. Ameer Fahim
Nakata.
Jazakumullahu khairan kathira. Aameen.
Univers
ity of
Mala
ya
`
viii
TABLE OF CONTENTS
ABSTRACT ........................................................................................................................ III
ACKNOWLEDGEMENT ............................................................................................... VII
TABLE OF CONTENTS ................................................................................................ VIII
LIST OF FIGURES ..................................................................................................... XVIII
LIST OF TABLES .......................................................................................................... XIX
ABBREVIATIONS ......................................................................................................... XXI
LIST OF APPENDICES.............................................................................................. XXIV
CHAPTER 1: INTRODUCTION ....................................................................................... 1
1.1 Introduction .......................................................................................................... 1
1.2 Problem statement ............................................................................................... 3
1.3 Research questions ............................................................................................... 9
1.4 Research objectives .............................................................................................. 9
1.5 Scope of the study ............................................................................................... 10
1.6 Significance of the study .................................................................................... 14
1.7 Research approach ............................................................................................. 18
1.7.1 The case company................................................................................... 19
1.7.2 Confidentiality issue ............................................................................... 20
1.7.3 Research steps ......................................................................................... 21
1.8 Organization of the thesis .................................................................................. 25
CHAPTER 2: LITERATURE REVIEW ......................................................................... 29
2.1 Introduction ........................................................................................................ 29
2.2 Background of automotive industry ................................................................. 29
2.2.1 History of Malaysian automotive industry .......................................... 30
Univers
ity of
Mala
ya
`
ix
2.2.2 Issues in the Malaysian automotive industry ....................................... 32
2.2.3 Liberalization of the automotive industry ........................................... 34
2.3 Development of management accounting ........................................................ 35
2.3.1 Traditional management accounting .................................................... 38
2.3.1.1 Traditional costing methods .............................................. 39
2.3.1.2 Pricing under traditional management accounting ......... 42
2.3.2 Strategic management accounting (SMA) ........................................... 43
2.3.2.1 Benefits of Strategic Management Accounting techniques
.......................................................................................................... 45
2.4 Target cost management (TCM)....................................................................... 47
2.4.1 Concept of TCM ..................................................................................... 47
2.4.2 TCM development history ..................................................................... 49
2.4.3 TCM definition ....................................................................................... 50
2.4.4 TCM objectives ....................................................................................... 53
2.4.5 Characteristics of TCM ......................................................................... 56
2.4.6 TCM Engineering Tools ........................................................................ 61
2.4.7 TCM Implementation Process .............................................................. 63
2.4.8 TCM enablers ......................................................................................... 66
2.4.8.1 Advanced manufacturing technologies (AMT)
implementation ............................................................................... 71
2.4.8.2 Company strategy ............................................................... 74
2.4.8.3 Customer orientation ......................................................... 77
2.4.8.4 Organizational information-sharing network .................. 79
2.4.8.5 Lean manufacturing implementation ............................... 82
Univers
ity of
Mala
ya
`
x
2.4.8.6 Supplier relationship .......................................................... 83
2.4.8.7 Organization culture .......................................................... 86
2.4.8.8 Top management support and commitment .................... 89
2.4.8.9 Training ............................................................................... 90
2.5 Summary ............................................................................................................. 92
CHAPTER 3: CONCEPTUAL AND THEORETICAL FRAMEWORKS ................. 95
3.1 Introduction ........................................................................................................ 95
3.2 Theories ............................................................................................................... 96
3.2.1 Contingency theory ................................................................................ 96
3.2.2 Dynamic capabilities theory .................................................................. 99
3.3 Target Cost Management (TCM) ................................................................... 105
3.3.1 Plan stage .............................................................................................. 109
3.3.1.1 Step 1: Setting the target-selling price ............................ 109
3.3.1.2 Step 2: Setting the target profit ....................................... 110
3.3.1.3 Step 3: Setting the target cost .......................................... 112
3.3.1.4 Step 4: Making profitability feasibility study ................ 116
3.3.2 Do stage ................................................................................................. 117
3.3.2.1 Step 5: Achieving the target cost ..................................... 117
3.3.3 Check stage ........................................................................................... 119
3.3.3.1 Step 6: Monitoring and reporting cost achievement status
........................................................................................................ 119
3.3.4 Act stage ................................................................................................ 120
3.3.4.1 Step 7: Cost improvement ................................................ 120
3.3.5 Conceptual framework for the TCM implementation process ........ 122
Univers
ity of
Mala
ya
`
xi
3.4 Theoretical framework of TCM enablers ...................................................... 125
3.4.1 TCM enablers ....................................................................................... 126
3.4.1.1 Implementation of advanced manufacturing technologies
(AMT) ............................................................................................ 129
3.4.1.2 Confrontational strategy .................................................. 130
3.4.1.3 Customer orientation ....................................................... 131
3.4.1.4 Organizational information-sharing network ............... 132
3.4.1.5 Lean manufacturing implementation ............................. 134
3.4.1.6 Supplier relationship ....................................................... 135
3.4.1.7 Teamwork orientation organization culture ................. 137
3.4.1.8 Top management support and commitment .................. 138
3.4.1.9 Training ............................................................................. 140
3.4.2 Successful implementation of TCM .................................................... 141
3.4.2.1 Cost reduction ................................................................... 142
3.4.2.2 Design and development efficiency ................................. 143
3.4.2.3 Marketability .................................................................... 144
3.4.3 Summary of theoretical framework ................................................... 145
3.5 Summary ........................................................................................................... 146
CHAPTER 4: METHODOLOGY .................................................................................. 148
4.1 Introduction ...................................................................................................... 148
4.2 Rationale for case study research method ..................................................... 149
4.2.1 Single embedded case study method................................................... 151
4.3 Overview of the research design ..................................................................... 153
4.3.1 Principle 1: Use of multiple sources of evidence ............................... 153
Univers
ity of
Mala
ya
`
xii
4.3.2 Principle 2: Maintain a chain of evidence ......................................... 154
4.3.3 Principle 3: Create a case study database ......................................... 157
4.4 Case study protocol .......................................................................................... 159
4.5 Research site ..................................................................................................... 160
4.5.1 Research site selection ......................................................................... 161
4.5.2 Case company background ................................................................. 162
4.5.2.1 Organizational structure .................................................. 163
4.6 Qualitative approach ....................................................................................... 166
4.6.1 Interview ............................................................................................... 166
4.6.1.1 Interview instrument development ................................. 166
4.6.1.2 Interview data collection ................................................. 168
4.6.1.3 Interview data analysis ..................................................... 170
4.6.2 Direct observation ................................................................................ 171
4.6.2.1 Direct observation data collection ................................... 172
4.6.2.2 Direct observation data analysis ..................................... 173
4.6.3 Documentation ..................................................................................... 173
4.6.3.1 Documentation data collection ........................................ 174
4.6.3.2 Documentation data analysis ........................................... 175
4.6.4 Data analysis method ........................................................................... 175
4.6.4.1 Pattern matching .............................................................. 176
4.7 Quantitative approach ..................................................................................... 177
4.7.1 Survey .................................................................................................... 178
4.7.1.1 Development of survey instrument ................................. 178
4.7.1.2 Survey data collection ...................................................... 187
Univers
ity of
Mala
ya
`
xiii
4.7.1.3 Survey data analysis ......................................................... 189
4.8 Validity and reliability issues .......................................................................... 190
4.8.1 Construct validity ................................................................................. 190
4.8.2 Internal validity .................................................................................... 192
4.8.3 External validity ................................................................................... 193
4.8.4 Reliability .............................................................................................. 194
4.9 Summary ........................................................................................................... 194
CHAPTER 5: QUALITATIVE FINDINGS .................................................................. 197
5.1 Introduction ...................................................................................................... 197
5.2 History of TCM implementation at Company A .......................................... 200
5.2.1 TCM implementation stages ............................................................... 201
5.2.1.1 Period before the restructuring of Company A. ............ 201
5.2.1.2 Period after the restructuring of Company A ................ 202
5.2.2 Why Company A started to fully implement TCM .......................... 206
5.2.3 TCM perceived definition .................................................................... 209
5.2.4 Perceived successful implementation of TCM ................................... 211
5.3 TCM implementation process at Company A .............................................. 213
5.3.1 Plan stage .............................................................................................. 214
5.3.1.1 Step 1: Setting the target-selling price ............................ 214
5.3.1.2 Step 2: Setting the target profit ....................................... 220
5.3.1.3 Step 3: Setting the target cost .......................................... 222
5.3.1.4 Step 4: Making the profitability feasibility study .......... 230
5.3.2 Do stage ................................................................................................. 235
5.3.2.1 Step 5: Achieving the target cost ..................................... 236
Univers
ity of
Mala
ya
`
xiv
5.3.3 Check stage ........................................................................................... 244
5.3.3.1 Step 6: Monitoring and reporting the cost achievement
status .............................................................................................. 244
5.3.4 Act stage ................................................................................................ 248
5.3.4.1 Step 7: Cost improvement ................................................ 248
5.3.5 Summary of the TCM implementation process ................................ 252
5.4 Assessing the enablers of TCM practice at Company A .............................. 256
5.4.1 Advanced manufacturing technologies .............................................. 257
5.4.2 Confrontational strategy...................................................................... 258
5.4.3 Customer orientation ........................................................................... 261
5.4.4 Organizational information-sharing network ................................... 263
5.4.5 Lean manufacturing implementation ................................................. 267
5.4.6 Supplier relationship ............................................................................ 269
5.4.7 A teamwork orientation culture.......................................................... 274
5.4.8 Top management support and commitment ...................................... 277
5.4.9 Training ................................................................................................. 280
5.5 Summary ........................................................................................................... 283
CHAPTER 6: QUANTITATIVE FINDINGS ............................................................... 285
6.1 Introduction ...................................................................................................... 285
6.2 Survey results ................................................................................................... 285
6.2.1 Response rate analysis ......................................................................... 285
6.2.2 Respondents’ profile ............................................................................ 286
6.3 Data screening .................................................................................................. 288
6.4 Assessing the TCM enablers ........................................................................... 290
Univers
ity of
Mala
ya
`
xv
6.4.1. Construct type ..................................................................................... 291
6.4.2 The measurement model ...................................................................... 292
6.4.2.1 Reliability .......................................................................... 292
6.4.2.2 Validity .............................................................................. 293
6.4.3 The structural model ............................................................................ 304
6.5 Summary ........................................................................................................... 311
CHAPTER 7: DISCUSSION AND CONCLUSION ..................................................... 313
7.1 Introduction ...................................................................................................... 313
7.2 Overview of the study ...................................................................................... 314
7.3 The major differences of TCM implementation process .............................. 315
7.3.1 Step1: Set the target-selling price ..................................... 315
7.3.2 Step 2: Set the target profit ................................................. 317
7.3.3 Step 3: Set the target cost .................................................... 317
7.3.4 Step 4: Conduct the profitability feasibility study ............ 319
7.3.5 Step 5: Achieving the target cost ....................................... 321
7.3.6 Step 6: Continuous monitoring and reporting ................ 323
7.3.7 Step 7: Cost improvement stage ......................................... 324
7.3.8 New proposed conceptual framework for TCM ............... 326
7.4 The possible causes of the differences in TCM practices at Company A ... 329
7.4.1 No integration with other systems ...................................................... 330
7.4.2 Low degree of customer orientation ................................................... 333
7.4.3 Cost information constraint ................................................................ 335
7.4.4 Loose supplier relationship ................................................................. 337
Univers
ity of
Mala
ya
`
xvi
7.5 The relationship between the proposed TCM enablers and the successful
implementation of TCM at Company A ................................................................ 339
7.5.1 AMT and the successful implementation of TCM ............................ 340
7.5.2 Confrontational strategy and the successful implementation of TCM
342
7.5.3 Customer orientation and the successful implementation of TCM . 344
7.5.4 Organizational information-sharing network and the successful
implementation of TCM ........................................................................ 345
7.5.5 Lean manufacturing implementation and the successful
implementation of TCM ........................................................................ 347
7.5.6 Supplier relationship and the successful implementation of TCM.. 349
7.5.7 A teamwork orientation organization culture and the successful
implementation of TCM ........................................................................ 352
7.5.8 Top management support and commitment and the successful
implementation of TCM ........................................................................ 353
7.5.9 Training and the successful implementation of TCM....................... 354
7.6 Contributions and implications ...................................................................... 355
7.6.1 Theoretical contributions .................................................................... 355
7.6.1.1 Understanding of TCM practice in Malaysia context .. 355
7.6.1.2 The application of contingency and dynamic capabilities
theories in TCM practices. ........................................................... 357
7.6.2 Practical implications ........................................................................... 360
7.7 Limitations and recommendations for future research ................................ 361
7.8 Summary ........................................................................................................... 364
Univers
ity of
Mala
ya

`
xvii
REFERENCES ................................................................................................................. 365
LIST OF PUBLICATION AND PAPER PRESENTED .............................................. 383
APPENDICES .................................................................................................................. 383
Univers
ity of
Mala
ya
`
xviii
LIST OF FIGURES
FIGURE 1-1: MALAYSIAN TOTAL INDUSTRY VEHICLES (TIVS) AND TOTAL VEHICLES
PRODUCED/ASSEMBLED .............................................................................................. 12
FIGURE 1-2: RESEARCH STEPS ............................................................................................ 22
FIGURE 3-1: TCM ACTIVITIES PROCESS FLOW .............................................................. 123
FIGURE 3-2: THEORETICAL FRAMEWORK OF TCM ENABLERS....................................... 128
FIGURE 4-1: SIMPLIFIED ORGANIZATIONAL STRUCTURE OF COMPANY A .................... 164
FIGURE 6-1: FULL STRUCTURAL MODEL WITH PATH COEFFICIENTS .............................. 309
FIGURE 7-1: TCM – REVISED CONCEPTUAL MODEL. ..................................................... 327
Univers
ity of
Mala
ya
`
xix
LIST OF TABLES
TABLE 1-1: SUMMARY OF TCM STUDIES ........................................................................... 15
TABLE 1-2: TCM ACTIVITIES OF MODEL X1 AT COMPANY A .......................................... 24
TABLE 2-1: SUMMARY OF LITERATURE ON TCM ENABLERS ............................................ 70
TABLE 3-1: SUMMARY OF THE TCM IMPLEMENTATION PROCESS CONCEPTUAL
FRAMEWORK .............................................................................................................. 108
TABLE 3-2: SUMMARY OF PROPOSITIONS FOR TCM ENABLERS ..................................... 145
TABLE 4-1: THE PERIOD OF DATA COLLECTION AND DATA ANALYSIS. ........................... 156
TABLE 4-2: RESEARCH CONSTRUCTS AND SOURCES ........................................................ 180
TABLE 5-1: INTERVIEW RESPONDENTS ............................................................................. 199
TABLE 5-2: COMPARISON SUMMARY BETWEEN THE TCM CONCEPTUAL MODEL AND
TCM PRACTICE AT COMPANY A .............................................................................. 253
TABLE 6-1: RESPONSE RATE ............................................................................................. 286
TABLE 6-2: PROFILE OF THE RESPONDENTS ..................................................................... 287
TABLE 6-3: DESCRIPTIVE STATISTICS FOR EACH CONSTRUCT. ....................................... 289
TABLE 6-4: CONSTRUCT SUMMARY .................................................................................. 292
TABLE 6-5: RELIABILITY ASSESSMENT (CRONBACH’S ALPHA AND COMPOSITE
RELIABILITY INDEX, N=87) ....................................................................................... 293
TABLE 6-6: OUTER LOADINGS (MEAN, STDEV, T-VALUES, N=87) ............................... 294
TABLE 6-7: MEASUREMENT ITEMS WITH WEAK FACTOR LOADING ................................ 296
TABLE 6-8: CONVERGENT VALIDITY AND AVE OF THE MEASUREMENT MODEL
CONSTRUCT ................................................................................................................ 297
TABLE 6-9: OUTER MODEL AND CROSS LOADING ............................................................ 300
Univers
ity of
Mala
ya

`
xx
6-10: INTERCORRELATIONS, AVERAGE VARIANCE EXTRACTED (AVE), AND SQUARE
ROOT OF AVE (N=87) ................................................................................................ 303
TABLE 6-11: STRUCTURAL MODEL R² .............................................................................. 305
TABLE 6-12: PATH COEFFICIENT (MEAN, STDEV, T-VALUES, N=87, RE- SAMPLES=1000)
.................................................................................................................................... 307
TABLE 6-13: SUMMARY OF PATH COEFFICIENT RESULTS ................................................ 310
Univers
ity of
Mala
ya

`
xxi
ABBREVIATIONS
ABC Activity Based Costing
AFTA ASEAN Free Trade Area
AMT Advanced Manufacturing Technology
ASEAN Association of Southeast Asian Nations
AVE Average Variance Extracted
CAD Computer Aided Design
CAE Computer Aided Engineering
CAM-I Consortium for Advanced Management – International
CBU Complete Build Up
CE Chief Engineer
CFM Cross-Functional Management
CIM Computer Integrated Manufacturing
CKD Completely Knocked Down
CSI Customer Satisfaction Index
DFMA Design for Manufacture and Assembly
ECI Engineering Changes Instruction
FA Factory Automation
FMS Flexible Manufacturing Systems
GLC Government Linked Company
HICOM Heavy Industry Corporation of Malaysia
ISO International Organization for Standardization
JIT Just In Time
JV Joint Venture
Univers
ity of
Mala
ya
`
xxii
MRP Material Requirements Planning
MP Mass Production
NAP National Automotive Policy
NPD New Product Development
OA Office Automation
OJT On Job Training
PDCA Plan, Do, Check, Action
Perodua Perusahaan Otomobil Kedua Sendirian Berhad
Proton Perusahaan Otomobil Nasional
PLS Partial Least Squares
QFD Quality Functional Development
R&D Research and Development
ROA Return on Assets
ROS Return on Sales
SCM Strategic Cost Management
SEM Structural Equation Model
SMA Strategic Management Accounting
TCM Target Cost Management
TPS Toyota Production System
TQC Total Quality Control
TQM Total Quality Management
UK United Kingdom
US United States
VA Value Analysis
Univers
ity of
Mala
ya

`
xxiii
VE Value Engineering
WTO World Trade Organization
Univers
ity of
Mala
ya
`
xxiv
LIST OF APPENDICES
APPENDIX A: THE CASE STUDY PROTOCOL ................................................................. 384
APPENDIX B: CASE STUDY RESEARCH LETTER OF CONSENT ........................................ 385
APPENDIX C: TARGET COST MANAGEMENT INTERVIEW PROTOCOL ........................ 388
APPENDIX D: DOCUMENT SUMMARY SHEET FORMAT ................................................ 391
APPENDIX E: LIST OF INTERVIEWEES ........................................................................... 392
APPENDIX F: SURVEY COVER LETTER .......................................................................... 393
APPENDIX G: EXPLANATION OF THE STUDY AND GUIDELINE TO ANSWER THE
QUESTIONNAIRE ......................................................................................................... 395
APPENDIX H: SURVEY FORM ......................................................................................... 396
APPENDIX I: ITEMS CODING .......................................................................................... 403
APPENDIX J: DESCRIPTIVE ANALYSIS OF THE VARIABLES (N=87)............................... 406
Univers
ity of
Mala
ya
`
1
CHAPTER 1: INTRODUCTION
1.1 Introduction
The current fast changing markets, tough global business competition, rapid chang-
es in technology and vast information exchange make the business environment highly
competitive (Kaplan, 1984). This competitive market has resulted in high performance
standards in various aspects including cost, quality, productivity, delivery and process effi-
ciency. Accordingly, competitiveness can be gained by exceeding or at least meeting these
high global standards (Hitt, Ireland, & Hoskisson, 2004). Companies are more competitive
against their competitors when they manage to sell the right products with the right prices
and offer the customers more value at less cost (Cooper & Slagmulder, 1998; Drury & Ta-
les, 1994).
The application of Strategic Management Accounting (SMA) may assist companies
in achieving competitiveness against their competitors. This is because SMA is able to pro-
vide more timely and relevant information, which is important in setting the right cost and
right price (Adler, Everett, & Waldron, 2000). Nevertheless, in order to be competitive,
companies not only have to ensure that the selected advanced management accounting
methods are useful for product pricing but that they are also capable of assisting in cost re-
duction through waste elimination (Monden & Hamada, 1991; IFAC, 1998). This is be-
cause profit can be gained by selling more or producing at less cost as well as by proactive-
ly eliminating the non-productive and non-value added activities (Kaplan, 1984).
Furthermore, the SMA application needs to be applied in the earliest stage of a
product’s life because as the product is being developed, the ability to change the product
Univers
ity of
Mala
ya
`
2
decreases, which, in turn, decreases the degree to which the product cost can be reduced
(Cooper & Slagmulder, 1999). Many studies (Kato, 1993; Sakurai, 1989; Monden &
Hamada, 1991) posit that the most effective stage to control the cost is during the product
planning and design stage and not when the product has already been designed and manu-
factured. This is because the product design stage locks almost 80 per cent of the product
cost (Kato, 1993; Hergert, 2002). In the fully automated plants, this percentage can reach
up to almost 100 per cent (Sakurai, 1989). In other words, the way the product is planned
and designed will determine almost all the costs of later activities including the material,
manufacturing, marketing, distribution and after sales cost (Hergert, 2002; Sakurai, 1989).
Studies (Kato, 1993; Tani et al., 1994; Cooper & Slagmulder, 1998; Ansari &
Swenson, 2006; Shank & Fisher, 1999) highlight that Target Cost Management (TCM) as a
means of SMA that ensures products are sufficiently profitable when launched by manag-
ing the cost during the design stage while ensuring the products meet the quality and relia-
bility standards, and other customers’ needs (Cooper & Slagmulder, 1998). The market-
driven or price-driven costing concept of TCM (Gagne & Discenza, 1995; Ansari, Bell, &
Okano, 2007) helps companies to set the right price and right cost, reduces the risk of not
making sufficient profit, and makes better and faster product development (Tani et al.,
1994; Helms, Ettkin, Baxter, & Gordon, 2005). Thus, by using TCM as a serious competi-
tive tool, companies are able to increase their competitiveness and improve their long-term
profitability (Ansari & Swenson, 2006; Cooper & Slagmulder, 1998).
However, despite these noted benefits, many companies still underestimate the
power of TCM as a critical competitive tool (Ansari, Bell, & Okano, 2007). This is because
Univers
ity of
Mala
ya

`
3
even though TCM is seemingly simple, its implementation and execution is difficult
(Helms, Ettkin, Baxter, & Gordon, 2005). Furthermore, most TCM studies have been con-
ducted in the Japanese environment and focused on narrow aspects of TCM. The lack of
explanation of TCM differences (Tani et al., 1994) has caused a misunderstanding in TCM
practices (Feil, Yook, & Kim, 2004). Moreover, this drawback is compounded by the issue
of the unknown territory of management accounting practices, especially in developing
countries due to a lack of studies (Joshi, 2001). Accordingly, more research from different
perspectives is necessary to understand the TCM practices (Tani et al., 1994).
Since globalization creates opportunities and also threats to any company, a better
understanding concerning how SMA can assist companies to gain competitiveness is im-
portant. This research focuses on TCM as a critical SMA tool to help companies to remain
profitable and competitive by examining its implementation process, contextual constraints
and the enablers that positively associated with the implementation process in the Malaysi-
an context.
1.2 Problem statement
Despite the potential benefits of SMA, researchers have found that traditional man-
agement accounting still popular among companies (Sulaiman, Ahmad, & Alwi, 2004;
Sulaiman, Ahmad, & Alwi, 2005; Nishimura, 2005a; Adler, Everett, & Waldron, 2000;
Chenhall & Langfield-Smith, 1998a; Joshi, 2001). A study by Sulaiman et al. (2005) cites
that standard costing is still being widely used by many companies around the world: 76
per cent of companies in the UK, 73 per cent in New Zealand, 86 per cent in America, 68
per cent in India, 65 per cent in Japan and 56 per cent in Singapore. The survey of Chenhall
Univers
ity of
Mala
ya
`
4
and Langfield-Smith (1998a) of 78 companies in Australia also found a similar result. The
Australian companies widely use traditional management accounting practices compared
with SMA practices. By applying the survey method of Chenhall and Langfield-Smith
(1998a), a survey of 60 manufacturing companies in India by Joshi (2001) also found that
the adoption rate of traditional management accounting practices is higher than for SMA
practices. A study by Adler et al. (2002) in 165 New Zealand manufacturers also found that
traditional accounting techniques are more popular than SMA techniques. Among these
traditional accounting techniques, full costing is the most widely used followed by standard
costing.
Likewise, the comparative study by Sulaiman et al. (2004) of management account-
ing practices in four developing countries –China, Malaysia, India and Singapore – shows
that traditional cost management was still widely implemented. Nevertheless, unlike New
Zealand (Adler et al., 2002), standard costing is the most popular method followed by full
costing in Malaysia. A survey study by Chun et al. (1998) of 92 manufacturing companies
in Malaysia also found that among the practices of traditional management accounting,
standard costing is highly preferred followed by actual costing. Similarly, the most recent
empirical study of management accounting practices by Sulaiman et al.’s (2005) in Malay-
sia indicates that 70 per cent of local and 70 per cent of Japanese affiliated companies still
use standard costing. Nishimura’s (2005a) study of Japanese affiliated companies in Singa-
pore, Malaysia and Thailand also found that these companies widely use traditional man-
agement accounting, particularly actual costing and standard costing. Since most of Malay-
sian companies use lack of automation and highly depend on labour for the production,
they opt to perform their management control system through financial accounting (Nishi-
Univers
ity of
Mala
ya
`
5
mura, 2005a). Recent survey study, (2008) of 30 industrial companies in Malaysia also
found high implementation rate of traditional management accounting and high reliance of
financial accounting for the management control (Smith, Abdullah & Abdul Razak, 2008).
Many reasons contribute to the high popularity of the traditional management ac-
counting. In general, most of the companies still believe that the traditional management
accounting practices have higher benefits than SMA (Joshi, 2001; Chenhall & Langfield-
Smith, 1998a; Adler, Everett, & Waldron, 2000; Bright, Davies, Downes, & Sweeting,
1992). A survey study of UK manufacturers by Bright et al. (1992) found that the perceived
benefits are outweighed by the costs which make the top management reluctant to imple-
ment the SMA techniques. In addition, the companies in New Zealand face human resource
constraint issues in terms of cost of changes related to people and time, and a lack of rele-
vant skills as the main barriers that forbid the implementation of SMA practices (Adler,
Everett, & Waldron, 2000). Similarly, Malaysian companies are still reluctant to use SMA,
mainly due to lack of expertise, costly and time consuming (Smith et al., 2008).
On the other hand, a few scholars (Sakurai, 1989; Kato, Boer, & Chow, 1995;
Cooper & Slagmulder, 1999; Swenson, Ansari, Bell, & Kim, 2003; Helms et al., 2005)
found that TCM, one form of SMA, was highly implemented by world big companies
mainly by automotive companies particularly in Japan, USA and Europe. In Japan, Sakurai
(1989) found that some big Japanese companies were already implemented TCM since the
late 1970s. In the 1990s, Kato et al. (1995) highlight that 80 to 100 per cent of prominent
Japanese assembly manufacturing companies in Japan were implementing TCM. These
Japanese companies include Toyota, Nissan, Sony, Matsushita, Daihatsu, Canon, Komatsu,
Univers
ity of
Mala
ya
`
6
Olympus, Topcon and Isuzu (Cooper & Slagmulder, 1999; Helms et al., 2005). On the oth-
er hand, Boeing, Caterpillar, Daimler Chrysler and Continental Texas (automotive brake
supplier) are among the non-Japanese companies outside Japan that have managed to im-
plement TCM successfully (Swenson, Ansari, Bell, & Kim, 2003).
In terms of TCM implementation in non- Japanese environment, a survey study in
Holland by Dekker et al. (2003) found that almost 60 per cent of 32 Dutch companies are
using TCM. They claim that although these companies use different names, such as “pre-
calculation”, “basic net price” and “manufacturing cost”, the practices are similar to the
TCM concept. However, they were not able to conclude whether the actual process and
methods are exactly the same as the Japanese TCM practices due to the limitations of the
study method. Studies (Carr & Ng, 1995; Rattray, Lord, & Shanahan, 2007; Swenson,
Buttross, Kim, 2005; Nishimura, 2005a) on TCM practices in other countries outside Japan
found that the TCM practices are slightly different compared to prior TCM studies in Japan.
For example, the case study of Carr and Ng (1995) on Nissan UK found that the TCM prac-
tices in this company have significant differences in two main areas. First, Nissan UK fo-
cuses on the operational stage instead of the design and development stage to achieve the
target cost. Second, Nissan UK emphasizes on the local supply chain related costs com-
pared to other costs. Similarly, Rattray et al.’s (2007) survey of New Zealand companies
found that even though 39 per cent of 31 companies use TCM, these companies focus on
existing products instead of new product development, highly involve the manufacturing
department instead of design and development department, and have relatively low supplier
involvement instead of high supplier involvement. Survey by Consortium for Advance
Manufacturing – International (CAM-I) on TCM practices among USA companies found
Univers
ity of
Mala
ya

`
7
that most of the USA companies do not follow the fundamental TCM concept, and do not
use the TCM tools and disciplines as highlighted by the common published literature
(Swenson et al., 2005). Furthermore, a study made by Nishimura (2005a) in Japanese affili-
ated companies in Singapore, Malaysia and Thailand found that the TCM implementation
and its definition in these companies are not the same as in Japan. He argues that compa-
nies in these three countries merely consider TCM to be a cost or price target calculated to
challenge competitors in respect of the market price. He further emphasizes that these com-
panies do not follow the TCM fundamental characteristics as being practiced by the Japa-
nese companies. For example, these affiliated companies strongly link the target cost in-
formation with production cost and distribution cost rather than the research and develop-
ment cost (Nishimura, 2005a). Nishimura (2005a) suggests that this phenomenon might
indicate that these affiliated companies still rely on their Japanese headquarters for the fun-
damental strategy setting for TCM. In fact, this study supports Tani et al. (1994) who claim
that for the Japanese subsidiary companies, it is common that the product planning and de-
velopment are conducted by the headquarters in Japan.
Generally, the “environment, strategy and the organization structure specific to the
industry have an impact on the nature of TCM” (Tani et al., 1994, p. 71). However, since
most of the TCM studies focus on specific aspects of TCM in the Japanese environment,
the differences of TCM practices in other environments have not been explained in a satis-
factory manner (Tani et al., 1994; Feil, Yook, & Kim, 2004; Dekker & Smitdt, 2003). Fur-
thermore, as highlighted by Drury and Tales (1995), most of the management accounting
research focus on developing sophisticated models in simplified production settings. This
causes incomprehension and ignorance in respect of the actual accounting management
Univers
ity of
Mala
ya
`
8
practices, and, subsequently, creates a gap between the theory and practice (Drury & Tayles,
1995).
With current uncertain global business competition, all companies must proactively
find ways to remain profitable. Since TCM is widely used by companies in Japan, US and
Europe as competitive tools (Ansari et al., 2007), companies in developing countries should
implement TCM to make them competitive particularly in terms of setting the right price
and profit, and managing their products’ cost. A lack of study of TCM implementation in
non-Japanese context might widen the misunderstanding on TCM practices, in which cre-
ates hesitation of TCM implementation by the companies in developing countries. This cre-
ates more competitiveness gap between companies’ in developing countries and compa-
nies’ in developed countries. Consequently, to the extreme continuum, the economy of the
developing countries will never be at par with the developed countries.
Since there are lack of studies conducted in non-Japanese environment particularly
in Malaysia context, it is necessary to uncover the technical aspects of TCM practices in
non- Japanese environment in terms of how it is conducted, what are the differences com-
pared to Japanese TCM theoretical model, why there are differences, and what are the crit-
ical factors associated with the TCM practices in non-Japanese environment. Accordingly,
in-depth case study research in a company that has managed to implement TCM is non-
Japanese context is necessary.
Univers
ity of
Mala
ya
`
9
1.3 Research questions
Given the problem statement described in the previous section, this study attempts to
investigate in-depth the TCM implementation in one Malaysian automotive company. Spe-
cifically, the research questions are formulated as follows:
(1) How do the TCM practices in a typical Malaysian automotive company differ from
the Japanese automotive companies’ TCM model?
(2) Why do the differences in TCM occur?
(3) Among these enablers: implementation of Advanced Manufacturing Technology
(AMT), confrontational strategy, a customer orientation, an information-sharing net-
work, lean manufacturing implementation, supplier relationship, a teamwork oriented
organizational culture, top management support and commitment, and training, which
enablers are perceived by the TCM users of a typical Malaysian automotive company
as the critical enablers that have a positive association with the successful implemen-
tation of TCM?
1.4 Research objectives
The fundamental aim for this study is to develop a better understanding of TCM
practices in non-Japanese context specifically in Malaysia. Thus, consistent with the above
research questions, the research objectives of the study are:
(1) To examine in-depth the differences of TCM practices in a Malaysian automotive
company compared to Japanese TCM theoretical model.
(2) To identify the possible causes of the differences in TCM practices in a Malaysian
automotive company.
Univers
ity of
Mala
ya
`
10
(3) To determine the critical factors that positively associated with the successful imple-
mentation of TCM from the perspective of a Malaysian automotive company’s TCM
users.
1.5 Scope of the study
In order to understand in-depth the differences of TCM practices, this study investi-
gate the TCM practice in Malaysian automotive company by comparing it to the common
TCM practices in the Japanese automotive companies as highlighted by previous scholars.
In general, the scope of the study covers the TCM practices in automotive industry context
from the viewpoint of the accounting perspective. In this thesis, the automotive industry is
confined to final assembly, parts and components manufacturers and supporting industry
(suppliers of the parts and components) only (Hasan & Jomo, 2007).
Otley (1980) posits that the contingent factors or specific enablers influence the
management accounting system of a particular environment. Likewise, the specific envi-
ronment of a particular industry influences the structure and process of TCM (Tani et al.,
1994; Feil, Yook, & Kim, 2004). Therefore, in order to understand in-depth the TCM prac-
tices, this study focuses on one industry, an automotive industry. This industry was selected
for three reasons. First, TCM is widely used in the automotive industry (Kato, Boer, &
Chow, 1995). A survey made by Kobe University on Japan’s major industries found that
TCM is adopted 100 per cent by the transportation equipment industry compared to other
industries (Kato, Boer, & Chow, 1995). Besides, Monden and Hamada (1991) also claim
that TCM function very well in the Japanese automotive companies. In fact, the TCM prac-
Univers
ity of
Mala
ya
`
11
tices were originated from automotive industry in Japan before it migrated out to other Jap-
anese assembly and process industries (Ansari et al., 2007).
Second, the importance of managing the direct material cost during the design and
development stage to the automotive industry. Specifically, the ratio of the variable cost to
the total manufacturing cost is up to 90 per cent in automotive companies. With 85 per cent
of the total variable cost coming from direct material cost (Monden & Hamada, 1991). This
direct material cost mainly comes from the parts purchased from suppliers. Generally, a
typical car model has more than 5000 parts (Pierce, 2002) produced by various suppliers,
which involves a large supply chain. For example, in Toyota, the purchased parts cover 70
per cent of the total direct material required to produce the cars (Copper & Slagmulder,
1999). Since, the cost of direct material mainly locked and determined during the design
and development stage (Kato, 1993; Hergert, 2002), managing the direct material cost dur-
ing the design and development stage is very important to the automotive companies.
Among other cost management tools, TCM is well known as a cost management tool that is
applied in the design and development stage (Monden & Hamada, 1991; Ansari et al.,
2006). Thus, it is significant to study the TCM implementation in automotive industry
compared to other industries.
Third, the automotive industry is among the major industries that impact the coun-
try’s economic development. For example, in the case of Malaysia, the automotive industry
is one of the key industries that has succeeded in enhancing the Malaysian economy under
the government’s industrialization efforts (Mahidin & Kangeswary, 2004). Furthermore,
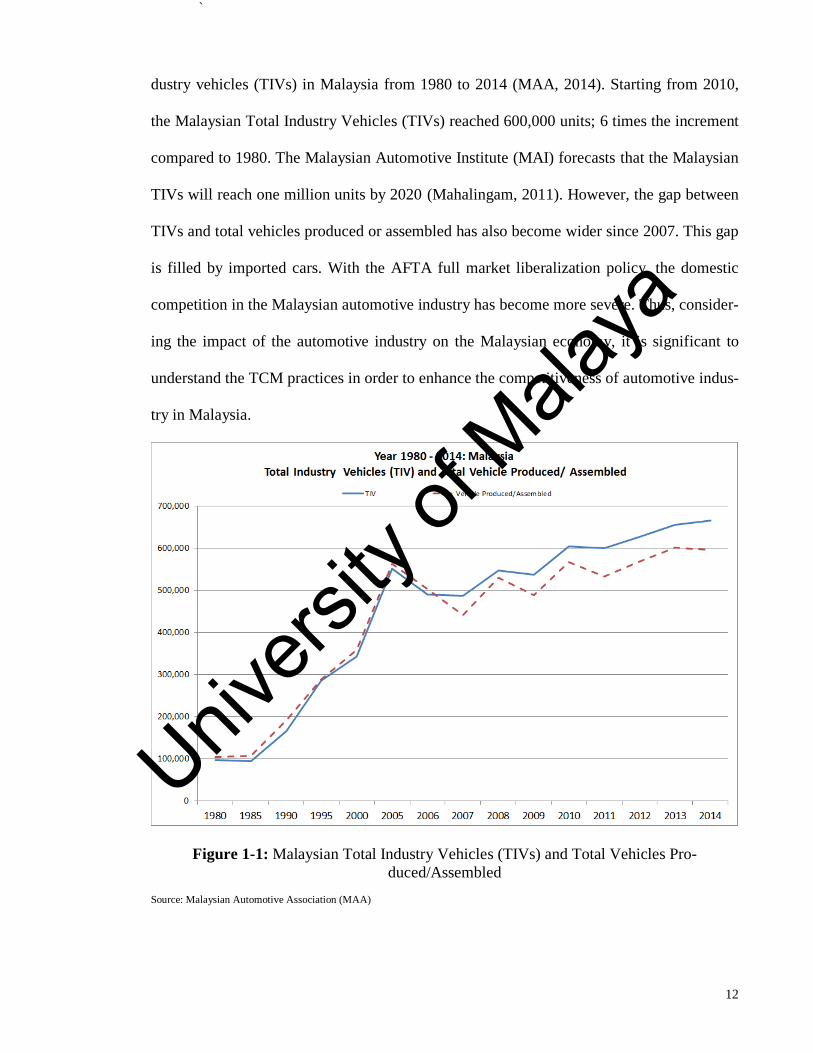
the domestic demand for vehicles in Malaysia is increasing. Figure 1-1 shows the total in-
Univers
ity of
Mala
ya
`
12
dustry vehicles (TIVs) in Malaysia from 1980 to 2014 (MAA, 2014). Starting from 2010,
the Malaysian Total Industry Vehicles (TIVs) reached 600,000 units; 6 times the increment
compared to 1980. The Malaysian Automotive Institute (MAI) forecasts that the Malaysian
TIVs will reach one million units by 2020 (Mahalingam, 2011). However, the gap between
TIVs and total vehicles produced or assembled has also become wider since 2007. This gap
is filled by imported cars. With the AFTA full market liberalization policy, the domestic
competition in the Malaysian automotive industry has become more severe. Thus, consider-
ing the impact of the automotive industry on the Malaysian economy, it is significant to
understand the TCM practices in order to enhance the competitiveness of automotive indus-
try in Malaysia.
Figure 1-1: Malaysian Total Industry Vehicles (TIVs) and Total Vehicles Pro-
duced/Assembled
Source: Malaysian Automotive Association (MAA)
Univers
ity of
Mala
ya
`
13
This study compares the TCM practice of a Malaysian automotive company to the
TCM practices of the Japanese automotive companies for three reasons. First, TCM is
widely implemented in the Japanese automotive companies (Kato et al., 1995). Ansari et al.
(2007) literature review of TCM from 1995 to mid-2005 shows that even though the com-
panies in America and Europe have implemented TCM, the implementation is fairly young
compared to Japan. Among other countries, the Japanese automotive companies are the
most mature, and the longest and most consistent users of TCM (Ansari et al., 2007). Sec-
ond, many case studies have been conducted on the Japanese automotive companies (Tani
et al., 1994; Lee & Monden, 1996; Monden & Hamada, 1991; Cooper & Slagmulder, 1999;
Okano, 2005; Kato et al., 1995; Sakurai, 1989; Kato, 1993), which make the TCM model in
this industry visible for the purposes of comparison. This vast information allows an in-
depth comparison study to understand the differences of TCM practices. Third, Japanese
automotive companies have mature and high interaction with Malaysian automotive com-
panies. In fact, both the Malaysian national car manufacturing companies, Proton and Pero-
dua, were established through joint ventures with the Japanese companies (Hasan & Jomo,
2007). Indirectly, this high interaction with Japanese companies makes Malaysian automo-
tive companies familiar with the Japanese management philosophy and Japanese manufac-
turing methods. For example, Proton even required their staff to be trained according to the
Japanese standards and procedures to develop skilled and semi-skilled workers (Mahidin &
Kanageswary, 2004).
In summary, TCM is influenced by the industry’s specific environment (Tani et al.,
1994; Feil, Yook, & Kim, 2004). In this study, the TCM differences in terms of environ-
ment can be controlled by focusing on a single industry, i.e. the automotive industry. The
Univers
ity of
Mala
ya
`
14
automotive industry was selected because of its dynamic competition and its significant
contribution to Malaysian economic. Accordingly, by comparing companies of a similar
nature, it can reduce the environmental variables related issues in understanding the differ-
ences of TCM practices, the causes of the differences and the enablers that support the suc-
cessful implementation of TCM practices.
1.6 Significance of the study
This study is significant because of three reasons. First, it contributes to the body of
knowledge by investigating in-depth the TCM practices and the differences of TCM prac-
tices in a non-Japanese environment compared to the theoretical TCM model. Table 1-1
summarizes previous empirical studies made on TCM. Most of the studies have been con-
ducted in developed countries- Japan, USA and Europe- found that the TCM practices in
other countries are different from the Japanese companies’ practices. On the other hand, as
highlighted by Sulaiman et al. (2005), most of Malaysian companies still opt to use tradi-
tional MA mainly due to lack of know-how on SMA. Nevertheless, SMA practices, par-
ticularly TCM, still remain comparatively unknown in Malaysia because no in-depth empir-
ical case study has been made to investigate it. Furthermore, there is no study made inten-
sively to investigate the differences of TCM implementation between Japanese and Malay-
sian companies. Thus, by understanding the level of TCM implementation in Malaysia,
what are the differences, what causes the differences and what enablers that have a positive
association with the successful implementation of TCM, this research expects to improve
the understanding of the TCM practices in non-Japanese context specifically in developing
countries like Malaysia.
Univers
ity of
Mala
ya
`
15
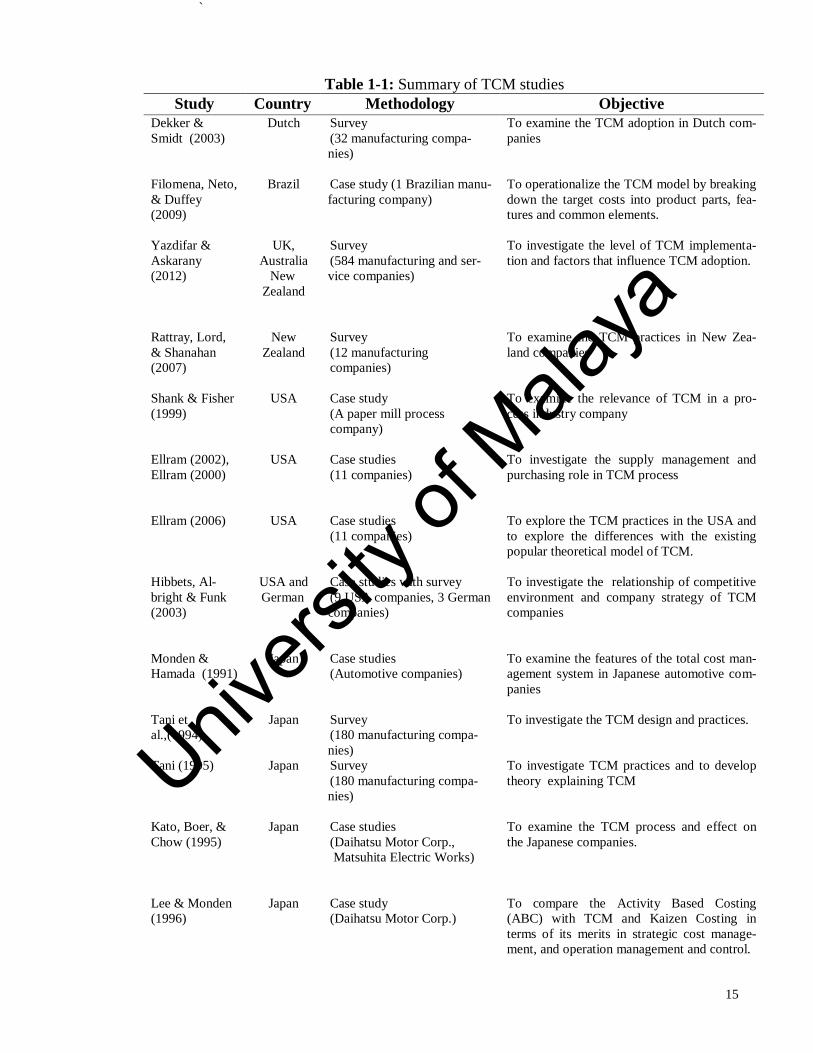
Table 1-1: Summary of TCM studies
Study Country Methodology Objective
Dekker &
Smidt (2003)
Dutch Survey
(32 manufacturing compa-
nies)
To examine the TCM adoption in Dutch com-
panies
Filomena, Neto,
& Duffey
(2009)
Brazil Case study (1 Brazilian manu-
facturing company)
To operationalize the TCM model by breaking
down the target costs into product parts, fea-
tures and common elements.
Yazdifar &
Askarany
(2012)
UK,
Australia
New
Zealand
Survey
(584 manufacturing and ser-
vice companies)
To investigate the level of TCM implementa-
tion and factors that influence TCM adoption.
Rattray, Lord,
& Shanahan
(2007)
New
Zealand
Survey
(12 manufacturing
companies)
To examine the TCM practices in New Zea-
land companies
Shank & Fisher
(1999)
USA Case study
(A paper mill process
company)
To examine the relevance of TCM in a pro-
cess industry company
Ellram (2002),
Ellram (2000)
USA Case studies
(11 companies)
To investigate the supply management and
purchasing role in TCM process
Ellram (2006)
USA Case studies
(11 companies)
To explore the TCM practices in the USA and
to explore the differences with the existing
popular theoretical model of TCM.
Hibbets, Al-
bright & Funk
(2003)
USA and
German
Case studies with survey
(9 USA companies, 3 German
companies)
To investigate the relationship of competitive
environment and company strategy of TCM
companies
Monden &
Hamada (1991)
Japan Case studies
(Automotive companies)
To examine the features of the total cost man-
agement system in Japanese automotive com-
panies
Tani et
al.,(1994)
Japan Survey
(180 manufacturing compa-
nies)
To investigate the TCM design and practices.
Tani (1995) Japan Survey
(180 manufacturing compa-
nies)
To investigate TCM practices and to develop
theory explaining TCM
Kato, Boer, &
Chow (1995)
Japan Case studies
(Daihatsu Motor Corp.,
Matsuhita Electric Works)
To examine the TCM process and effect on
the Japanese companies.
Lee & Monden
(1996)
Japan Case study
(Daihatsu Motor Corp.)
To compare the Activity Based Costing
(ABC) with TCM and Kaizen Costing in
terms of its merits in strategic cost manage-
ment, and operation management and control.
Univers
ity of
Mala
ya
`
16
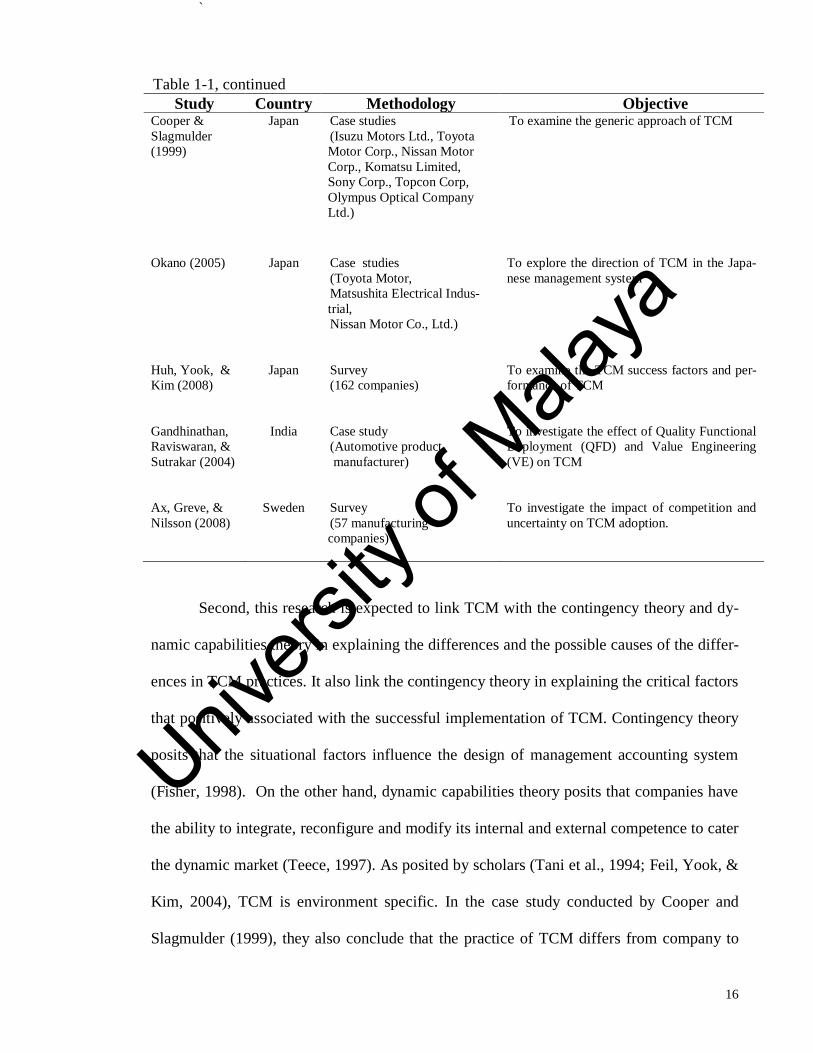
Table 1-1, continued
Study Country Methodology Objective Cooper &
Slagmulder
(1999)
Japan Case studies
(Isuzu Motors Ltd., Toyota
Motor Corp., Nissan Motor
Corp., Komatsu Limited,
Sony Corp., Topcon Corp,
Olympus Optical Company
Ltd.)
To examine the generic approach of TCM
Okano (2005) Japan Case studies
(Toyota Motor,
Matsushita Electrical Indus-
trial,
Nissan Motor Co., Ltd.)
To explore the direction of TCM in the Japa-
nese management system
Huh, Yook, &
Kim (2008)
Japan Survey
(162 companies)
To examine the TCM success factors and per-
formance of TCM
Gandhinathan,
Raviswaran, &
Sutrakar (2004)
India Case study
(Automotive product
manufacturer)
To investigate the effect of Quality Functional
Deployment (QFD) and Value Engineering
(VE) on TCM
Ax, Greve, &
Nilsson (2008)
Sweden Survey
(57 manufacturing
companies)
To investigate the impact of competition and
uncertainty on TCM adoption.
Second, this research is expected to link TCM with the contingency theory and dy-
namic capabilities theory in explaining the differences and the possible causes of the differ-
ences in TCM practices. It also link the contingency theory in explaining the critical factors
that positively associated with the successful implementation of TCM. Contingency theory
posits that the situational factors influence the design of management accounting system
(Fisher, 1998). On the other hand, dynamic capabilities theory posits that companies have
the ability to integrate, reconfigure and modify its internal and external competence to cater
the dynamic market (Teece, 1997). As posited by scholars (Tani et al., 1994; Feil, Yook, &
Kim, 2004), TCM is environment specific. In the case study conducted by Cooper and
Slagmulder (1999), they also conclude that the practice of TCM differs from company to
Univers
ity of
Mala
ya

`
17
company. However, there is lack of empirical studies that explain in-depth the differences
in terms of TCM implementation process, the possible causes of the differences and the
critical enablers that positively associated with the successful implementation of TCM in
non-Japanese environment context. Thus, by linking the contingency theory and dynamic
capabilities, it is expected that this research is able to explain the contextual constraints of
TCM practices in non-Japanese environment and how the company utilized its dynamic
capabilities by integrating, reconfiguring and modifying the TCM practice in order to adapt
with the contextual constraints for successful implementation of TCM.
Third, this research is expected to close the gap between the theory and practice of
TCM. Generally, many non-Japanese companies have failed to duplicate the Japanese man-
agement method because they have overlooked the underlying processes that support its
adoption (Kato et al., 1995). On the other hand, like other MA practices, TCM practices are
also environment specific (Feil et al., 2004). By focusing on the one industry i.e. automo-
tive industry, this study investigates in-depth the TCM practice in a Malaysian automotive
company and compares the empirical findings with the Japanese TCM theoretical model.
The details comparison of TCM practices help to understand in–depth the underlying pro-
cesses that facilitate and impede the implementation in Japanese and non-Japanese contexts.
Accordingly, this study shows the dynamic of TCM practices in terms of adapting with its
environmental context. By understanding how TCM practices can be suited in non-
Japanese context and the critical enablers that support the TCM practices, the potential
TCM companies in non-Japanese environment can equip themselves for risk mitigation and
prioritize the strategies planning before shifting to TCM practices for pricing their products
and managing the product costs. Furthermore, by understanding the actual TCM practices
Univers
ity of
Mala
ya
`
18
in non-Japanese context, the potential TCM companies in non-Japanese context could pre-
pare for the necessary pre-caution steps to mitigate the problems that normally occur during
the implementation.
In a nutshell, it is expected that this study contributes to the body of knowledge on
TCM practices, linking the TCM practices with contingency theory and dynamic capabili-
ties theory, and reducing the gap between the theory and practice of TCM for practical im-
plementation.
1.7 Research approach
This research used the case study method, specifically, a single embedded case
study method, as suggested by Yin (2003). There are three reasons why this methodology is
used in this study. First, a case study approach is a suitable research method when “how”
and “why” questions are imposed (Yin, 2003). Hence, inasmuch as the aim of this research
is to examine the differences of TCM practice in a Malaysian automotive company com-
pared to the Japanese automotive companies’ TCM practices, identify the causes of differ-
ences, and determine the factors that positively associated with the successful implementa-
tion of TCM in non-Japanese environment, the case study approach is the most appropriate
research methodology to answer these research questions.
Second, as the TCM is quite new outside of Japan (Ansari & Okano, 2007; Sulaim-
an, Ahmad, & Alwi, 2004; Tho, Isa, & Ng, 1998), the case study method is able to provide
a valuable insight into the body of knowledge, which is not possible to provide by the tradi-
tional empirical and modelling approach (Yin, 2003; Ellram, 2006). Accordingly, many
Univers
ity of
Mala
ya
`
19
scholars suggest that the case study research is the best methodology to investigate and to
analyse the differences of TCM implementation process (Tani et al., 1994; Sulaiman, Ah-
mad, & Alwi, 2004; Dekker & Smitdt, 2003).
Third, the case study method helps the researchers to understand “the mish-mash of
inter-related influences that shape management accounting practices”, which involve organ-
izational trend, and the economic and social aspects (Scapens, 2006, p. 10). Accordingly,
instead of solely examining the differences of the TCM practices from the survey study, a
single organization was selected for in-depth study. The case study method helps the re-
searcher to explain in-depth the differences of TCM practices in specific contexts and to
identify the causes that shape the differences. The survey within the case company’s em-
ployees helps to determine the employees’ perception on the factors that positively associ-
ated with the successful implementation of TCM in the case company. Accordingly, this
research intends to explain how a company comes to have the TCM practices they have,
how different they are from the original theoretical model, why the differences happen and
what factors support the implementation.
1.7.1 The case company
There are three reasons as to why the Company A (pseudonym) was selected as the
case company in this study. First, Company A best fits the study as it has designed, docu-
mented and reflected the TCM concept based on the researcher's judgment from the prelim-
inary studies of TCM practices in the several automotive companies. Nevertheless, the re-
search admits that there is no guarantee that Company A represents the best TCM practices
in the automotive industry.
Univers
ity of
Mala
ya

`
20
Second, Company A is widely exposed to the Japanese manufacturing methods.
Company A was established through a joint venture project between Malaysian and Japa-
nese partners with the majority of equity owned by the Malaysian government through
holding corporations (Source: Company A’s website). The cooperation with the prominent
Japanese automotive company, Company M (pseudonym), as its joint venture partner
makes Company A familiar with the Japanese manufacturing methods, including TCM.
Third, Company A was selected as the research location because of its significance
in the Malaysia automotive industry in terms of domestic market share and organizational
size. Company A has manufactured passenger cars since the 1990s. Since its establishment,
this case company has sold more than 2 million units of various vehicle models inclusive of
export markets and has been the market share leader for several consecutive years. Compa-
ny A is also a big organization with more than 10,000 employees (Source: Company A’s
website).
Hence, as the research location must strongly reflect the research topic (Boeije,
2010), Company A was selected for this study research. Chapter 4 will provide a more de-
tailed justification for selecting this company as the case company.
1.7.2 Confidentiality issue
As Company A has adopted an open concept, it has cooperated with many research-
ers who have conducted research at its premises. Through the literature review, the re-
searcher found several studies conducted by other researchers on Company A. With the as-
Univers
ity of
Mala
ya
`
21
sistance of a few personal contacts, the researcher managed to obtain approval from Com-
pany A’s Human Resources to conduct an in-depth case study at Company A.
However, since TCM research might relate with the company’s cost and profit mat-
ters, which is very confidential and potentially sensitive, Company A’s management strictly
required that no cost and profit figures be exposed. Furthermore, in order to comply with
Company A’s confidential requirements and the strict ethical guidelines of the university
concerning confidentiality, a pseudonym is used to disguise the identity of the company,
the product name and also the respondents.
1.7.3 Research steps
This research was conducted using case study method by collecting multi-sources of
data collection, as suggested by Yin (2003). The case study method should not limit to di-
rect and detailed observations as a source of evidence, instead it “can be based on any mix
of quantitative and qualitative evidence” (Yin, 2003, p. 15).
Univers
ity of
Mala
ya
`
22
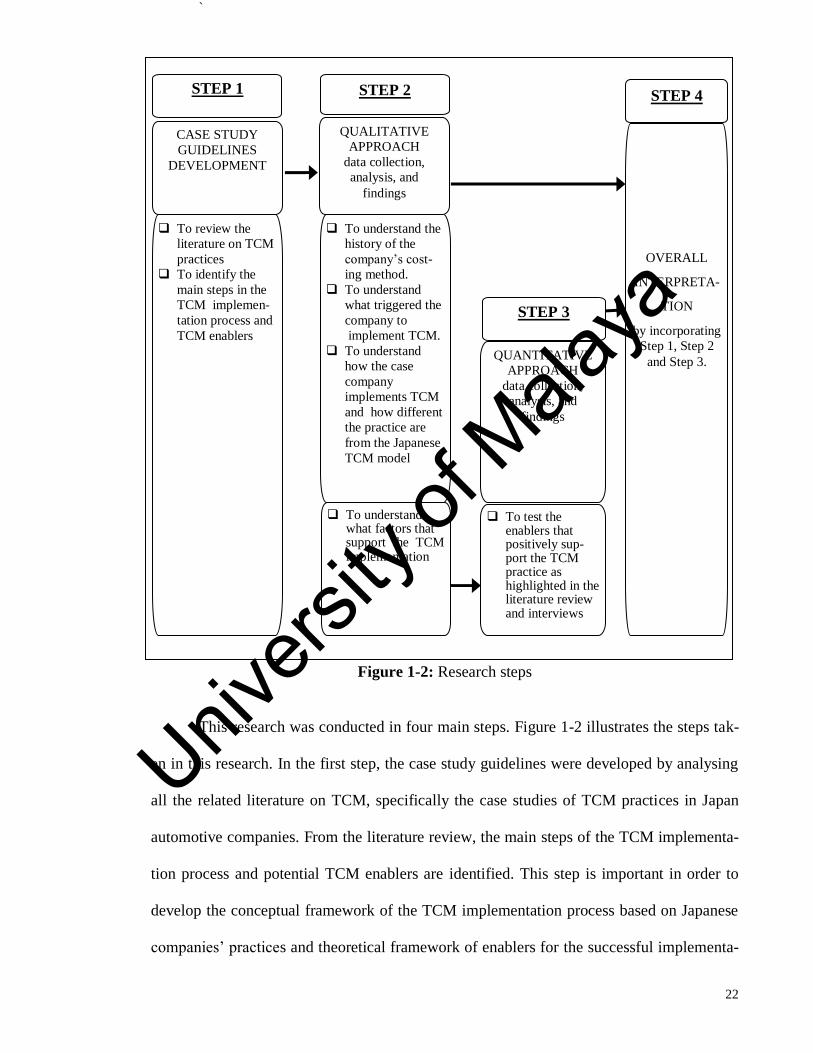
Figure 1-2: Research steps
This research was conducted in four main steps. Figure 1-2 illustrates the steps tak-
en in this research. In the first step, the case study guidelines were developed by analysing
all the related literature on TCM, specifically the case studies of TCM practices in Japan
automotive companies. From the literature review, the main steps of the TCM implementa-
tion process and potential TCM enablers are identified. This step is important in order to
develop the conceptual framework of the TCM implementation process based on Japanese
companies’ practices and theoretical framework of enablers for the successful implementa-
To understand the
history of the
company’s cost-
ing method.
To understand
what triggered the
company to
implement TCM.
To understand
how the case
company
implements TCM
and how different
the practice are
from the Japanese
TCM model
QUALITATIVE
APPROACH
data collection,
analysis, and
findings
STEP 2
QUANTITATIVE
APPROACH
data collection,
analysis, and
findings
To test the enablers that positively sup-port the TCM practice as highlighted in the literature review and interviews
OVERALL
INTERPRETA-
TION
by incorporating
Step 1, Step 2
and Step 3.
To understand what factors that support the TCM implementation
STEP 3
STEP 4
CASE STUDY
GUIDELINES
DEVELOPMENT
STEP 1
To review the
literature on TCM
practices
To identify the
main steps in the
TCM implemen-
tation process and
TCM enablers
Univers
ity of
Mala
ya

`
23
tion of TCM. Then, in the second step, qualitative data are collected to obtain a wide per-
spective and in-depth understanding concerning the TCM implementation process and the
factors that support the TCM practice. In this stage, multi-sources of data collection
through interviews, direct observation and documents review are collected to understand
the TCM practice and why the case company practices are the way they are. Then, in the
third step, the quantitative data are collected by distributing surveys to the case company’s
TCM users to confirm the critical factors that positively associated with the successful im-
plementation of TCM. In the last step, based on the perspectives of the contingency theory
and dynamic capabilities theory, the qualitative and quantitative result triangulation is made
to understand the differences of TCM implementation process, and to justify the possible
causes of the differences and the enablers that positively associated with the successful im-
plementation of TCM.
In order to study in-depth the TCM practice at Company A, this research focused on
the TCM implementation process of Model X1 (pseudonym). This model is a full model
change of the most saleable passenger car. Generally, the case company takes almost three
years for the new model development. In order to understand the TCM process implemen-
tation, this data was collected based on the development stages of Model X1. This period
was divided into three – Period 1, Period 2 and Period 3– which started from August 2008
and finished in June 2012. However, the data collected from August 2008 until July 2010
was based on the company’s historical internal documents only such as proposal papers,
meeting minutes, presentation materials and et cetera. Started from August 2010, the re-
searcher collected field data from interviews, observation such as factory visits, documenta-
tions through involvement in TCM related meetings, and surveys. The data collection stag-
Univers
ity of
Mala
ya
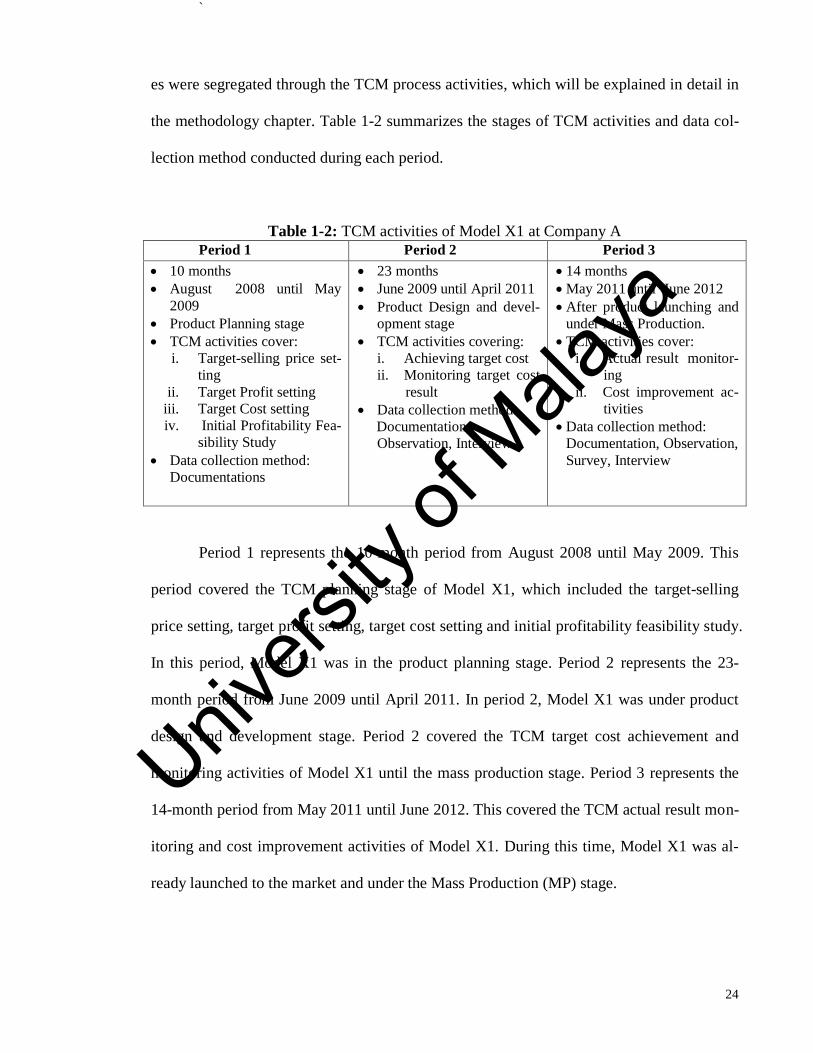
`
24
es were segregated through the TCM process activities, which will be explained in detail in
the methodology chapter. Table 1-2 summarizes the stages of TCM activities and data col-
lection method conducted during each period.
Table 1-2: TCM activities of Model X1 at Company A
Period 1 Period 2 Period 3
10 months
August 2008 until May
2009
Product Planning stage
TCM activities cover:
i. Target-selling price set-
ting
ii. Target Profit setting
iii. Target Cost setting
iv. Initial Profitability Fea-
sibility Study
Data collection method:
Documentations
23 months
June 2009 until April 2011
Product Design and devel-
opment stage
TCM activities covering:
i. Achieving target cost
ii. Monitoring target cost
result
Data collection method:
Documentation,
Observation, Interview
14 months
May 2011 until June 2012
After product launching and
under Mass Production.
TCM activities cover:
i. Actual result monitor-
ing
ii. Cost improvement ac-
tivities
Data collection method:
Documentation, Observation,
Survey, Interview
Period 1 represents the 10-month period from August 2008 until May 2009. This
period covered the TCM planning stage of Model X1, which included the target-selling
price setting, target profit setting, target cost setting and initial profitability feasibility study.
In this period, Model X1 was in the product planning stage. Period 2 represents the 23-
month period from June 2009 until April 2011. In period 2, Model X1 was under product
design and development stage. Period 2 covered the TCM target cost achievement and
monitoring activities of Model X1 until the mass production stage. Period 3 represents the
14-month period from May 2011 until June 2012. This covered the TCM actual result mon-
itoring and cost improvement activities of Model X1. During this time, Model X1 was al-
ready launched to the market and under the Mass Production (MP) stage.
Univers
ity of
Mala
ya
`
25
Originally, the researcher intended to end the research 6 months after the mass pro-
duction stage of Model X1, which was in November 2011. However, the researcher discov-
ered that Company A started to implement cost reduction activities to Model X1 even
though the mass production stage started just two months before. A new product code,
Model X2 (pseudonym), was created for this special cost reduction project. This was con-
sidered a new approach and had never been conducted before on previous products of
Company A. Due to the occurrence of this unexpected phenomenon of TCM activities, the
researcher decided to extend another 7 months to strengthen and support the previous find-
ings. This is because most of the research highlighted that, as a rule of thumb, management
will drop the project if it were found to be unprofitable during the development stage
(Cooper & Slagmulder, 1998). Thus, logically, had the Model X1 project been determined
to be unprofitable during the development stage, it would be dropped or the mass produc-
tion would be extended. Hence, there would be no necessity to conduct the Model X2 pro-
ject after the launching of Model X1. However, if Model X1 had been found to be profita-
ble, Model X2 would be considered by Company A as an extra effort made to reduce the
cost further. For either reason, the researcher suspected that the Model X2 project would be
able to strengthen the findings on the TCM practice at Company A.
1.8 Organization of the thesis
This thesis is presented in seven chapters. Chapter 2 presents the related literature
on the development of Malaysia’s automotive industry, as well as its management account-
ing development and TCM. First, it highlights the history and development of the automo-
tive industry in Malaysia and its significance to the Malaysian economy. This is followed
by the challenges of liberalization faced by the automotive industry. Next, it reviews the
Univers
ity of
Mala
ya
`
26
literature on the development of management accounting, which resulted in the develop-
ment of TCM. Finally, this chapter explains the previous studies done on TCM by catego-
rizing them into history, concept, definitions, and characteristics, implementation process,
tools, enablers and objectives.
Chapter 3 focuses on the theory used in this study, and the development of the con-
ceptual and theoretical framework used in the study. The first part of this section explains
the fundamental view of the contingency theory and dynamic capabilities theory, which
will be used to explain the research findings. Next, it explains the development of the TCM
conceptual framework. The TCM conceptual framework is explained in the Plan-Do-
Check-Action (PDCA) stages and seven major steps. This conceptual framework is used as
a guideline to conduct the case study research and as a base to compare the differences in
the TCM practices. Then, based on the literature review and initial qualitative findings, this
chapter proposes nine propositions as enablers that positively associated with the success-
ful implementation of TCM: Advanced Manufacturing Technologies (AMT) implementa-
tion, confrontational strategy, a customer orientation, an information-sharing network, lean
manufacturing implementation, supplier relationships, a teamwork oriented organizational
culture, top management support and commitment, and training. Finally, this chapter ex-
plains the dimensions for the successful implementation of TCM, which are cost reduction,
efficiency and marketability.
Chapter 4 outlines the methodological approach used in the research. The objectives
of this chapter are (1) to justify the appropriateness of using a single embedded case study
methodology, (2) to justify the selection of Company A as the case company, and (3) to
Univers
ity of
Mala
ya
`
27
explain how this research addresses the issue of validity and reliability. As this case study
uses multi-sources for the data collection method, this chapter categorizes the explanation
of the methodology into the qualitative and quantitative approach. The instrument devel-
opment, data collection procedures and data analysis method are explained in both ap-
proaches. The chapter ends with an explanation of the reliability and validity in terms of
issues and the approaches used to address them.
Chapter 5 discusses the qualitative finding of the research. The focus of this chapter
is to answer the research questions by synthesizing the qualitative data collected from the
interviews, documents and observations. First, the chapter explains the development of
TCM at Company A. Then, it assesses the implementation process of TCM at Company A
under the PDCA stages and seven steps by comparing it with the TCM conceptual frame-
work. This is followed by the identification and assessment of proposed enablers: Ad-
vanced Manufacturing Technologies (AMT) implementation, confrontational strategy, a
customer orientation, an information-sharing network, lean manufacturing implementation,
supplier relationships, a teamwork oriented organizational culture, top management support
and commitment, and training, in supporting the successful implementation of TCM prac-
tice at Company A.
Chapter 6 discusses the quantitative findings of the research. The main objective
of this chapter is to answer the third research question by determining the critical factors
that have a positive association with the successful implementation of TCM by using statis-
tical analysis. In the first section, it explains the statistical results for the respondents’ pro-
file using Statistical Package for Social Sciences (SPSS) analysis. This is followed by the
Univers
ity of
Mala
ya
`
28
statistical results for TCM enablers and an explanation using Partial Least Squares (PLS)
analysis. The PLS results will be explained in two stages, the measurement model and the
structural model.
Chapter 7 discusses the findings and concludes the research from the perspective of
the contingency and dynamic capabilities theory. This chapter starts with a summary of the
findings of the differences in the TCM implementation process compared to previous stud-
ies. Next, this chapter summarizes the possible reasons that might have caused the differ-
ences in TCM practices. This is followed by the new proposed conceptual framework for
the TCM implementation process. Then, it summarizes and justifies the relationship of each
of the proposed enablers with the successful implementation of TCM. Subsequently, this
chapter discusses the theoretical contributions and practical implications for academicians
and practitioners, respectively. Finally, it highlights the research limitations and recom-
mends some topics for future research.
Univers
ity of
Mala
ya
`
29
CHAPTER 2: LITERATURE REVIEW
2.1 Introduction
This chapter reviews the literature by previous scholars related to the history and
challenges of the Malaysian automotive industry, and the development of management ac-
counting and TCM. The first section of this chapter discusses the historical development of
the automotive industry in Malaysia and its importance to the Malaysia economy. It also
explains about the competitive challenges of the Malaysian automotive industry under lib-
eralization. The second section reviews the literature concerning key issues of the tradition-
al management in terms of product costing, which led to the development of strategic man-
agement accounting, i.e. TCM. Finally, this chapter reviews the literature on TCM by cat-
egorizing it into history, concept, definitions, objectives, characteristics, implementation
process, engineering tools and its enablers. In terms of the enablers, this research further
categorizes and discusses the detail background of the most comment TCM enablers: Ad-
vanced Manufacturing Technologies (AMT) implementation, confrontational strategy, a
customer orientation, an information-sharing network, lean manufacturing implementation,
supplier relationships, a teamwork oriented organizational culture, top management support
and commitment, and training. However, the detail linkage and proposition of each enabler
with TCM will be explained in Chapter 3.4.
2.2 Background of automotive industry
The automotive industry is one of the main catalysts for the development of the Ma-
laysian manufacturing sector (Mahidin & Kanageswary, 2004). As a prime producer of pas-
senger cars with the largest passenger car market in ASEAN (MIDA, 2010), the automotive
industry has a major impact on the development of Malaysia’s economy by generating ex-
Univers
ity of
Mala
ya
`
30
ports, tax revenue and employment (Wad & Govindaraju, 2011). As of year 2010, this in-
dustry had created employment for more than 300,000 employees (MAI, 2010).
2.2.1 History of Malaysian automotive industry
Historically, before the 1960s, most of the automobiles were imported Completely
Built up (CBU) from Europe. However, after the 1960s, the Malaysian government started
to introduce policies to develop local assembly production (Hasan & Jomo, 2007). Since
then, the Malaysian government has played an active role in promoting the development of
the automotive industry (Nor & Sumormo, 2005). The development of government policy
towards the automotive industry after the 1960s can be divided into two phases – first phase
and second phase.
The first phase was from 1963 to 1982 with the main objective being to enhance
local assembly and local content (Hasan & Jomo, 2007). In 1963, the Malaysian govern-
ment introduced a policy to encourage the integration of the Malaysian automotive industry.
The policy objectives were: (1) to promote import substitutes, (2) to save foreign currency
exchange, (3) to create employment, and (4) to develop the auto components manufacturing
industry that would enhance the automotive industry through the multiplier effect. In order
to encourage vehicles to be assembled locally, the Malaysian government started to adopt
policies, such as requiring vehicles to have a certain percentage of locally manufactured
parts and components, mandatory deletion of Component Knocked Down (CKD), tariff
protection for parts manufacturers, duty exemption, imposing import taxes and putting a
tariff on CBU imports. However, these efforts were not very successful as the cost of local-
ly assembled vehicles was still high (Jayasankaran, 1993). The reasons being: (1) there
Univers
ity of
Mala
ya
`
31
were many vehicle models, which caused the local demand for the particular parts and
components to be very little, and, hence, unable to achieve economy of scale, (2) high price
of locally made parts and components, (3) the Japanese assemblers refused to reduce the
price of the imported CKD parts to the same level as the price charged by the substitute lo-
cal parts producers (Nor & Sumormo, 2005; Jayasankaran, 1993).
The second phase of development of government policy towards the automotive in-
dustry started after 1983. This phase was initiated to counter the first phase issues and to
strengthen the automotive industry with the establishment of the National Car Project under
the Heavy Industrial Policy (Hasan & Jomo, 2007). The objectives of the National Car Pro-
ject were (1) to develop the local automotive industry, (2) to enhance the industry through
technical spin-offs and a value chain effect, and (3) to increase Bumiputra participation in
the industry (Tham, 2004). In 1985, Perusahaan Otomobil Nasional (Proton) was estab-
lished under the National Car Project. Proton was a joint venture project between the Ma-
laysia - Heavy Industry Corporation of Malaysia (HICOM), and Japan -Mitsubishi Motors
Corporation and Mitsubishi Corporation of Japan. Subsequently, the second national car
project, Perusahaan Otomobil Kedua Sdn. Bhd. (POSB), also known as Perodua, was estab-
lished in 1992. Perodua was established through joint cooperation among UMW Corpora-
tion Sdn. Bhd., Daihatsu Motor Corporation Ltd. of Japan, PNB Equity Resources Corpora-
tion Sdn. Bhd., Med-Bumikar Mara Sdn. Bhd., Daihatsu (Malaysia) Sdn. Bhd., Mitsui &
Co. Ltd. of Japan. The main objectives of the second national car project were to expand
the automotive product range and to boost the demand for domestic parts and components
(Nor & Sumormo, 2005). With the establishment of Proton and Perodua, Malaysia had
transformed itself from a mere vehicle assembler into a vehicle manufacturer (MIDA,
Univers
ity of
Mala
ya
`
32
2010). Besides Proton and Perodua, Industri Otomotif Komersial (M) Sdn. Bhd. (Inokom)
and the Malaysian Truck and Bus Sdn. Bhd. (MTB) were also granted the status of national
carmaker by the Malaysian government. The national car status was only granted to the au-
tomotive companies that were initiated by the Malaysian government under the Heavy In-
dustrial Policy. Even though these national automotive companies were established through
foreign company joint ventures, the majority of their shares belonged to the locals, particu-
larly the government through government linked companies (Rosli & Kari, 2008).
2.2.2 Issues in the Malaysian automotive industry
All Malaysian national cars have overseas joint venture partners. However, most of
the national car manufacturers only focus on the domestic market. Due to the small domes-
tic market size, the per unit amortization amount of indirect expenses of the national car
manufacturers is higher than that of global car manufacturers. Accordingly, the national car
manufacturers have higher cost per unit car, which causes cost disadvantages compared to
global car manufacturers. In order to counter this, the Malaysian government gives protec-
tion and incentives to enable the national cars to capture the domestic market and to protect
it from competition from imports (Tham, 2004; Sadoi, 1998). Bumiputra parts and compo-
nent manufacturers also receive preferential treatment from the government under the spe-
cial supplier development programme in terms of technical, financial and other supports
(Hasan & Jomo, 2007).
Generally, active government measures and the establishment of national car pro-
jects had a positive impact on the development of the Malaysian automotive industry. It
helped to increase the economies of scale of parts and components manufacturing, local
Univers
ity of
Mala
ya
`
33
content ratio and the number of local automotive component companies including joint
ventures with foreign firms. It also enhanced the research and development, and human re-
sources development. However, in spite of these results, the Malaysian automotive industry
has still not reached a global competitive level (Hasan & Jomo, 2007). For example, in
2003, Malaysia only captured 31.3 per cent of the ASEAN motor vehicle market compared
with Thailand, which netted 41.3 per cent of the ASEAN market. This was mainly due to
issues pertaining to the product features and price competitiveness (Mahidin & Kanag-
eswary, 2004).
Accordingly, Hasan and Jomo (2007) conclude that the main competitive challenges
of Malaysia’s national automotive industry are that (1) the industry has still not achieved
the economies of scales to be competitively profitable, (2) most of the local suppliers are
incompetent, and (3) the industry players are still heavily dependent on the government’s
tariff and non-tariff trade barriers. In addition, regarding the price competitiveness issue, in
a press conference in June 2013, the minister from the Ministry of International Trade and
Industry (MITI) argued that among four price factors – high profit margin, high manufac-
turing cost, excise duty and sales tax – that contribute to the expense, the main reason for
higher national car prices was due to the high profit margin. In order to counter this issue,
the Malaysian government imposed a new policy to pressure the market by encouraging the
introduction of new car brands from overseas into the market. Furthermore, the Malaysian
government planned to reduce the car prices gradually by 20 per cent to 30 per cent until
2017 (Chua, 2013), which would exert more pressure on the automotive industry players.
Univers
ity of
Mala
ya
`
34
2.2.3 Liberalization of the automotive industry
Even though Malaysia imposes protectionism and subsidies for national car manu-
facturers, the market liberalization under the ASEAN Free Trade Area (AFTA) has in-
creased the pressure from competition on the Malaysian automotive industry (Tham, 2004).
AFTA was established in 1992 by the Association of Southeast Asian Nations (ASEAN) to
create a free trade area among ASEAN countries – Malaysia, Brunei, Indonesia, Philippines,
Singapore, Thailand, Cambodia, Laos, Myanmar and Vietnam. Through AFTA, ASEAN
aims to become a completely free trade area by 2015 (MITI, 2011). Generally, AFTA
means tariff liberalization through trade collaboration among the ASEAN countries. The
liberalization of trade in the region through the elimination of both intra-regional tariffs and
non-tariff barriers helps the manufacturing sector in ASEAN to be more efficient and com-
petitive in the global market. The reduction and elimination of the tariffs allow producers or
manufacturers to buy raw materials at a cheaper price and better quality from ASEAN
countries. With lower costs and larger scale of production, the price of products will be
cheaper. This allows the producers or manufacturers to compete globally and access a
broader market (MITI, 2011).
Accordingly, Tham (2004) argues that the future of the national car manufacturers
depends on their capability to reduce production costs. The liberalization of the Malaysian
automotive industry creates more competitive pressure on the national car manufacturers
(Nor & Sumormo, 2005). This is because, eventually, the market liberalization under
AFTA is intended to force inefficient firms to exit while allowing efficient ones to gain
economies of scale in the ASEAN market (Tham, 2004). In order to deal with the competi-
tive global environment and pressure from liberalization, in March 2006, the Malaysian
Univers
ity of
Mala
ya
`
35
government introduced the National Automotive Policy (NAP) to facilitate the transfor-
mation, and to integrate the local automotive industry into regional and global industry
networks. Subsequently, in October 2009, the NAP was reviewed to nurture a more com-
petitive automotive market for local and international companies. This new review of NAP
also aimed to benefit the consumers in terms of environmental protection and safety (MITI,
2010).
The automotive industry in Malaysia is very competitive and dynamic. Since the
price and cost are among the factors that determine the competitiveness of vehicles, manag-
ing the cost and remain profitable are important for Malaysian automotive companies. The
Japanese automotive companies use TCM, one of SMA method, as serious competitive tool
to remain competitive and profitable (Kato et al., 1995). Considering the importance of the
automotive industry to the Malaysia economy, it is important to understand the TCM prac-
tices in the context of Malaysian automotive industry to make it more competitive.
2.3 Development of management accounting
Management accounting identifies, collects, measures and reports financial and non-
financial information that is useful to the business in its planning, evaluating, controlling
and decision-making to achieve the organizational goals (Bhimani, Horngren, Datar, &
Foster, 2008). According to International Federation of Accountants (IFAC) the evolution
of management accounting from traditional to advance management accounting can be cat-
egorized into four stages. However, these stages are not mutually exclusive and each con-
secutive stage includes previous stage with a new set of conditions in management envi-
Univers
ity of
Mala
ya
`
36
ronment (IFAC, 1998). In other words, the traditional and advance management accounting
tend to complement each other (Chenhall & Langfield- Smith, 1998b).
The first stage is cost determination and financial control which occurred before
1950s. In this stage, the management accounting is viewed as a technical activity which is
important to achieve organizational objectives. The focus of management accounting prac-
tices is to determine the product cost. Since, the production is based on labour oriented with
simple technology and low competition environment, there is a little innovation in the
products and production processes. Therefore, even though financial statement analysis,
ratio analysis, and budgeting are already established, the cost information is not fully used
for management decision-making (IFAC, 1998).
The second stage is information and management planning and control which oc-
curred between 1950s and 1960s. In this stage, the management accounting is viewed as a
management activity in which the management accountants provide the information to sup-
port the line management. The focus of management accounting practices is to provide in-
formation for planning, control and decision-making. Standard costing, Cost-Volume- Prof-
it analysis, and responsibility accounting are the examples of management accounting
method introduced in this stage. However, these management accounting methods are reac-
tive because problem identifications and actions are taken after the problems occurred.
The third stage is reduction of resources waste in the business processes which
started after 1965. The high global competition, rapid technologies and introduction of new
management and production techniques have enforced to eliminate the non-value added
Univers
ity of
Mala
ya
`
37
through process analysis and cost management methods such as Activity Based Costing
(ABC). The focus of the management accounting is managing resources and information to
enhance profit and eliminate waste. Accordingly, employee empowerment for decision
making and management information are necessary to achieve the organizational objectives.
However, the major challenge of management accountants is to provide appropriate infor-
mation for all managers and employees.
The fourth stage is creation of value through effective use of resources. Since 1985,
the business global competition becomes more severe due to the advance manufacturing
and information-processing technologies. As a consequence, the real time information be-
comes available directly to the management and lack of distinction between management
accountants and line management. In this stage, the focus of management accounting is
generating or creating value through effective use of resources, especially information, to
drive customer value, innovation and shareholder value. The use of resources to create val-
ue makes the management accounting becomes an integral part of management process.
Among the popular management accounting methods are TCM, Benchmarking and Indus-
try analysis (IFAC, 1998).
Based on IFAC (1998), most of the companies in the developed countries already
shifted to the stage four of management accounting evolution since 1990s. Nevertheless, a
survey study by Mahfar and Omar (2004) in 156 Malaysian selected companies found these
companies still dominantly apply stage one and stage two of management accounting evo-
lution and only a few companies managed to evolve into the third and fourth stage.
Univers
ity of
Mala
ya

`
38
According Ansari et al. (2007), any new management practice will have five stages
of life cycle: (1) development and advocacy, (2) technical refinement, (3) organizational
context of the practice, (4) linkage with other tools and processes, and (5) institutionaliza-
tion and diffusion. When a new management practice succeeds, it will be further developed,
advocated and passed on to other companies. Then, the technique will be further refined to
fit particular circumstances in different companies. As more companies implement the
practice, the focus shifts from technical refinement to cultural and behavioural implications
in the organizational context. After the practice matures, the focus is to link it with other
organizational tools and processes. When it reaches the saturation stage, the practice is al-
ready embedded in the organization and starts to diffuse as it spreads across industries and
the nation (Ansari et al., 2007).
In summary, management accounting provides critical information to the business
for its planning, evaluating, controlling and decision-making. In general the management
accounting can be divided into two categories, traditional management accounting - such as
variance analysis, standard costing and traditional budgeting - and strategic management
accounting (SMA) -such as TCM, ABC and benchmarking (Kaplan, 1983; Sulaiman et al.,
2004). Nevertheless, any management accounting practice will go through five stages of the
life cycles until it fully institutionalized. Below sub-sections below explain the issues of
traditional management accounting and the development SMA.
2.3.1 Traditional management accounting
The relevance of the traditional management accounting practices in current con-
temporary business environment is debated due the following reasons (Johnson & Kaplan,
Univers
ity of
Mala
ya
`
39
1987). First, the traditional management accounting relies on financial accounting which
makes the systems and costing techniques are financially focused (Johnson and Kaplan,
1987). In today’s competitive environment, non- financial data is important for the effective
and efficient operation (Kaplan, 1984). Second, the traditional management accounting
does not link with the companies’ strategies and external business context environment.
The cost and decision analysis tools mostly concentrate on the short run operation decisions
instead of the long run strategic decisions. They ignore the strategic elements of business
decisions, such as market share, brand image, competitor’s strategies, and competitive cost
structure (Wickramasinghe & Alawattage, 2007). Third, the traditional management ac-
counting information is based on historical information and an “after the fact responses”
(Nishimura, 2005). Thus it could not provide timely information for strategic and opera-
tional control to the managers (Johnson & Kaplan, 1987). Forth, since it focuses on compu-
tational aspects accounting, it overlooks the human-relation elements, such as attitude, per-
ceptions, motivation and moral (Hoque, 2003).
Due to the above issues, traditional accounting systems are inadequate to assist
managers in planning, pricing, control decisions and maintaining company survival in cur-
rent competitive business environment.
2.3.1.1 Traditional costing methods
The traditional cost accounting models were developed based on the mass produc-
tion of mature, standard and a narrow range of products with the direct labour and material
costs as the dominant factory costs, and less technology oriented business environment. In
this environment, the overhead costs are low and do not have a significant allocation distor-
Univers
ity of
Mala
ya

`
40
tion impact on the business (Kaplan, 1983). Job order costing, process costing, actual cost-
ing, standard costing, full costing and variable costing are among the examples of tradition-
al costing methods (Drury, 2004). The traditional cost systems are mainly used to value in-
ventory and allocate overheads for financial reporting purposes (Kaplan, 1983).
Among all, actual costing and standard costing are the most common methods used
by the Malaysian companies (Chun, Kasim, & Minai, 1998; Tho, Isa, & Thye, 1998;
Nishimura, 2005; Sulaiman, Ahmad, & Alwi, 2005). In spite of its popularity, many schol-
ars (Drury & Tales, 1994; Monden & Hamada, 1991) claim that the traditional cost ac-
counting methods, such as actual costing and standard costing, are inadequate, too compli-
cated and out-dated for assisting the company in planning, controlling and decision-making
in today’s highly competitive market.
For example, in terms of actual costing, the unit cost is measured based on the actu-
al cost of the direct material, the direct labour and the overheads incurred in producing the
product. The calculation of the direct material and direct labour cost per unit can be calcu-
lated by the amount of units produced. However, with an increasing mix of products and
technology-oriented business, the overhead cost per unit fluctuates from one period to an-
other. This is because the overhead cost, such as utilities, is not incurred uniformly
throughout the year. In addition, the allocated overhead method does not reflect the actual
resource consumption by each product (Kaplan, 1984). As a result, even though the produc-
tion volume and the production process are the same, the product cost per unit fluctuates
from month to month (Guan et al., 2009). Thus, the actual costing method is unable to pro-
vide accurate unit cost information on a timely basis (Guan et al., 2009).
Univers
ity of
Mala
ya
`
41
On the other hand, in the standard costing system, the standard price and quantity
for direct material and overheads are set in advance. These standards can be set by using
historical experience, historical accounting statements or engineering studies. The standard
cost per unit is set by multiplying the standard price by the standard quantity to represent an
amount or units consumed for each unit of production. Besides facilitating the product cost-
ing, the standard costing system also helps to improve planning and controlling. This is be-
cause the standard cost can be used as a benchmark and compared against the actual pro-
duction cost to analyse the variances in the price and quantity. From the results of the anal-
ysis of these variances, the management can take the necessary actions for the corrective
measures (Guan, Hansen, & Mowen, 2009). However, Shank and Fisher (1999) argue that
the use of standard costing is a short-term measure that focuses on cost control to avoid un-
favourable variances. It encourages companies to accept existing rules and the existing val-
ue chain, without an incentive to improve them. In addition, the cost variances derived only
focus on the financial information resulting from past decisions, and, hence, are not action-
able. It is based on historical information and an “after the fact responses”, which are una-
ble to contribute to the cost savings for the company and are unable to assist the managers
in increasing operational efficiency (Nishimura, 2005).
In summary, with an increasing product mix and technology oriented business envi-
ronment, the traditional cost management systems are inadequate to assist company in
terms of planning, pricing, controlling and decision making to be more competitive.
Univers
ity of
Mala
ya
`
42
2.3.1.2 Pricing under traditional management accounting
Under traditional management accounting, the product pricing concept is based on
the cost plus formula (Hergert, 2002). The product selling price is determined by adding up
all the costs, based on the allocated manufacturing costs or standard costs, with the profit
margin (Shank & Fisher, 1999). The formula below simplifies the pricing concept under
traditional management accounting:
Cost + profit margin = Selling price (Pierce, 2002)
This pricing method ignores the price and demand relationship, profit planning and
customer needs during the planning stage (Albright & Lam, 2006; Drury, 2004; Helms,
Ettkin, Baxter, & Gordon, 2005). This is because the price is solely dependent on the cost
and the cost is measured after the product has been produced. If the cost is not proactively
managed, the product is likely to be over engineered and sell at an unnecessarily high sell-
ing price. Consequently, the market is likely to reject or not accept the product after it has
been introduced in the market (Helms, Ettkin, Baxter, & Gordon, 2005). In order to meet
the market price, the product will be redesigned or the specifications will be reduced. How-
ever, once the design and manufacturing has been set, any changes are very expensive not
only in terms of money but also in time and effort. Any redesign after mass production to
reduce the cost is ineffective inasmuch as almost 80 per cent of the cost is locked at the de-
sign stage (Kato, 1993; Hergert, 2002).
Besides, using traditional cost management in pricing might cause the products to
be under-priced. If the products are under-priced, the companies are unable to recover their
Univers
ity of
Mala
ya
`
43
forgone profit easily. This is because, once the product has been launched on the market, it
is almost impossible for the companies to raise the price of the product. Eventually, the
profit depends on the balance of the product price after deducting the total product costs.
Thus, pricing under traditional costing does not guarantee that the companies can achieve
their desired profit margin (Albright & Lam, 2006).
In a nutshell, pricing the product by using cost-plus formula creates over-pricing
and under-pricing issues. This increases the risk of the company to achieve its desired profit
margin.
2.3.2 Strategic management accounting (SMA)
Generally, there is no agreed conceptual framework of SMA since it is still not
widely understood. Thus, there are various definitions of SMA (Roslender & Hart, 2003).
Nevertheless, the scholars believe that SMA will be adopted widely in the future by the in-
dustries and will be a major force that shapes the modern management accounting (Lang-
field-Smith, 2007).
For example, Hoque (2003) defines SMA as an accounting system for managing an
organization’s strategies and competitive advantages. On the other hand, Roslender and
Hart (2003) specifically define SMA as a generic approach that makes management ac-
counting more strategic by integrating it with marketing management. Subsequently, Wick-
ramasinghe and Alawattage (2007) define SMA as the intersection of management account-
ing with other functional disciplines, such as strategic management, marketing and opera-
tion management. The integration and coordination across different functions under SMA,
Univers
ity of
Mala
ya

`
44
allows companies to create an integrated value chain and deliver superior value to the cus-
tomers (Wijewardena & Zoysa, 1999).
SMA term is usually used by academics and practitioners in the Australia, New
Zealand and UK (Langfield-Smith, 2007). While, in the USA the Strategic Cost Manage-
ment (SCM) term is commonly used in the literature. Even though some scholars define
SCM similar with SMA, others view SCM as sub system of SMA (Langfield-Smith, 2007).
For example, Shank (1989) specifically defines SCM as a system that explicitly directs the
managerial use of cost information at one or more of the following stages: formulation of
strategies, communication of these strategies throughout the organization, implementation
of the strategies, and implementation of control system to monitor the result. Through the
SCM system, managers formulate and communicate the company’s long-term focus strate-
gies, and carry out tactics and control methods to achieve those strategies (Hoque, 2003).
Since SMA has wide definition, Simon (2007) categories the SMA into five broad
categories: (1) Costing, (2) Planning, control and performance management, (3) Strategic
decision- making, (4) Competitor accounting, and (5) Customer accounting. The SMA
techniques under Costing category are TCM, life-cycle costing, attribute costing, quality
costing, and value-chain costing. Among the techniques, TCM is the popular technique
used by the Japanese and world leading companies (Ansari et al., 2007). Since TCM also
exhibit strong emphasis on market and competitor (Sakurai, 1989), it is also known as tar-
get pricing, a price management tool (Newman & Mc Keller, 1995; Omar, 1997).
Univers
ity of
Mala
ya
`
45
In conclusion, there is no solid definition of SMA. Nevertheless, it is believed that
the strategic elements in SMA help the companies to gain competitive advantage. TCM is
one of the SMA that commonly used by the Japanese companies as a competitive tool.
2.3.2.1 Benefits of Strategic Management Accounting techniques
In the current business environment, the company’s competitiveness no longer de-
pends on the price or the performance attributes of existing products. Instead, it depends on
the company’s ability to produce a quality product at lower cost and more timely than its
competitors (Hiromoto, 1991). The application of SMA helps to increase a company’s abil-
ity to meet its strategic objectives and compete globally by providing financial and non-
financial information that are actionable and future oriented. This information assists man-
agers to manage the changes within its external and internal business environment, make
strategic decisions, integrate and control risks and profits together, which are important in
order to gain competitive advantage (Nishimura, 2005; Hoque, 2003).
Hiromoto (1991) posits that the goals of SMA are to support continuous innovations
and create future competitiveness by promoting strategic management and motivating em-
ployees to act strategically. In order to achieve these objectives, the design of the SMA
should have four elements: (1) focus on behavioural influence approach that influences em-
ployees to do the desired things instead of providing information for the decision-making
approach that recommends the optimal decisions for managers; (2) a market driven man-
agement by giving priority to market trends and customers’ requirements instead of tech-
nology driven management that focuses on current technology limitations; (3) applying a
dynamic approach instead of a static approach in terms of management accounting applica-
Univers
ity of
Mala
ya

`
46
tion, performance evaluation, and et cetera; and (4) promoting a team oriented approach
instead of a baton passing or sequential approach in the production process or product de-
velopment. In his case studies at Japanese manufacturing companies, he found that the top
Japanese companies integrate these elements in designing their SMA, such as TCM, to
support the company strategies for continuous innovation. Furthermore, these companies
also modified their cost allocation systems and redesigned their management accounting
system to make it function better (Hiromoto, 1991).
In addition, according to Okano and Suzuki (2007), the Japanese companies proac-
tively apply “Koto mae management” (before thing happens or causal management) in their
management accounting practices instead of solely relying on the accounting result. This
concept means that the Japanese companies do not limit their quality and cost focus to the
production stage but also include the upstream process, the design and development stage.
The fundamental stance is “quality and cost are built in on the site” with the “quality and
cost determined prior to the design stage”. Accordingly, the top Japanese companies man-
age to build in the quality and reliability within the allowable cost prior to the design and
development stage. TCM is a popular Japanese style of SMA that applies this concept
(Okano & Suzuki, 2007). The detail of TCM will be explained in the next section.
In summary, the management accounting has been developed before 1950s. In spite
of the weaknesses of the traditional management accounting, many companies still prefer to
use it. On the other hand, even though SMA has not been widely understood and adopted,
scholars believe that SMA will be adopted widely in the future. TCM is one of the promis-
Univers
ity of
Mala
ya
`
47
ing SMA that provides the companies with financial and non-financial information and em-
phasis on customer, market and competitors simultaneously.
2.4 Target cost management (TCM)
Generally, TCM is considered as a technique associated with SMA (Langfield-
Smith, 2007). Tani (1995) specifically categorizes TCM as a key sub-system for strategic
cost management. Nevertheless, Japanese scholars (Kato, 1993; Monden & Hamada, 1991;
Sakurai, 1989; Tani et al., 1994) emphasize that the TCM is neither costing nor accounting
but constitutes an interactive act and strategy that enable comprehensive planning and man-
agement.
There are many viewpoints concerning the TCM definitions, objectives, characteris-
tics, processes, tools and enablers were highlighted in the literature (Sakurai, 1989; Ansari
et al., 2006; Everaete et al., 2006; Monden & Hamada, 1991; Kato, Boer, & Chow, 1995;
Tani et al., 1994; Feil, Yook, & Kim, 2004). The following sub-sections elaborate on the
TCM literature concerning its concept, development history, definitions, objectives, charac-
teristics, engineering tools, implementation process, and enablers by previous scholars.
2.4.1 Concept of TCM
Sheldon (1923) under his philosophy of management highlighted that:
Industry exists to provide the commodities and services which are neces-
sary for the good life of the community, in whatever volume they are re-
quired. These commodities and services must be furnished at the lowest
prices compatible with an adequate standard of quality, and distributed in
such a way as directly or indirectly to promote the highest ends of the
community (Sheldon, 1923, p.285)
Univers
ity of
Mala
ya

`
48
Sheldon (1923) argues that companies should provide the customer with the lowest
price without sacrificing quality. On the other hand, according to economic theory, the ob-
jective of business is to maximize profit by consuming the most efficient combination of
resources to produce the most profitable products (Schiller, 1980; Steiner & Steiner, 2006;
Koch, 2010). Thus, the challenges for any company are to fulfil the customer requirements
by producing high quality product with low price, and to maximize profit simultaneously.
The TCM concept helps the companies to respond to these challenges. In general,
the TCM concept is based on this formula:
Target Cost= Target-selling price - target profit (Ansari et al., 2007)
In TCM, the target cost is set based on the target-selling price minus the target profit
margin (Ansari et al., 2007). This is based on the price led approach or backwards approach
where the target-selling price is set by the market before the product is being designed
(Helms et al., 2005). The target-selling price is defined as “the estimated price of a product
(or services) that potential customer will be willing to pay” (Horngren et al., 2008, p. 384).
As the target-selling price of the product with certain specifications is already set by the
market and the companies already fix their target profit, the companies are bound by the
target cost in producing the new product. Thus, the companies must reconcile their costs to
meet the target-selling price by improving the production costs or other related costs. This
is because the companies are only able to gain their target profit by achieving the target cost
(Howard & Herbig, 1996; Ellram, 2000). Eventually, this helps the companies to produce
Univers
ity of
Mala
ya

`
49
competitive products and reduce the risk of not making sufficient profit (Monden & Lee,
1993; Helms et al., 2005; Kato et al., 1995).
2.4.2 TCM development history
Historically, the backward approach in determining the product costs was used at
Ford in the US and Volkswagen in Germany in the 1930s. However, this approach only
started being widely used after World War 2 due to the scarcity of resources. It began with
the establishment of the Value Engineering (VE) concept by the Americans to maximize
the desirable product attributes while minimizing the product costs. Later, due to the stiff
domestic competition in Japan, the Japanese companies started to adopt the VE and inte-
grate it into their products to reduce the product cost at the design and development stages
(Feil, Yook, & Kim, 2004).
Although TCM has been utilized by Toyota in Japan since 1965, it only became
widely known to the world in the past 20 years ago. Among the reasons for the late ac-
knowledgment were that Just in Time (JIT) dominated the popular Japanese management
techniques and TCM was related to the secrecy surrounding a company’s new products
(Kato, 1993). Nevertheless, the Japanese companies did not develop TCM in one shot but
in gradual stages. TCM started with the cost reduction of individual parts of existing prod-
ucts before it was integrated with the profit management system and applied to the entire
organization (Kato et al., 1995). Toyota, Japan’s largest automotive company, was the first
company to initiate the integration of the diverse elements of TCM and promote it from a
simple cost reduction practice to a strategic profit planning model (Ansari et al., 2007). A
survey study made by Kato et al. (1995) revealed that in the early 1990s, 100% of the
Univers
ity of
Mala
ya
`
50
transportation equipment industry already implemented TCM in Japan. Among the Japa-
nese auto companies that have successfully implemented TCM are Toyota, Nissan,
Daihatsu, Komatsu, and Isuzu (Cooper & Slagmulder, 1999; Sakurai, 1989; Kato et al.,
1995). From the auto industry, TCM started to spread to other assembly and process indus-
tries in Japan (Ansari et al., 2007).
2.4.3 TCM definition
Studies (Sakurai, 1989; Feil, Yook, & Kim, 2004; Everaete et al., 2006) found vari-
ous terms and definitions of TCM. TCM is known as “Genka kikaku” or “Mokuhyou
genka” in Japanese of which the direct translation means “Cost Planning” or “Target Cost-
ing”. Sometimes, it is also called “Cost Projection”. Among all, “Target Costing” is the
most common term used by the english literature to translate “Genka kikaku” (Sakurai,
1989; Monden & Hamada, 1991). Generally, the Japanese scholars agree that “Genka
kikaku” or “Target Costing” is neither a costing system nor a system to set the target cost
(Tani, 1995). Nevertheless, the Japanese scholars do not have a consensus on the exact def-
inition of “Genka kikaku” (Feil, Yook, & Kim, 2004). Sakurai (1989) highlights that even
though there are no universally accepted definitions of “Target Costing” in Japan, it can be
defined as a cost management tool for reducing the overall cost of a product over its entire
life cycle with the help of the production, engineering, R&D, marketing and accounting de-
partments. While, Monden and Hamada (1991) define “Target Costing” as “the system to
support the cost reduction process in the developing and designing phase of an entirely new
product, a full model change or a minor model change” (Monden & Hamada, 1991, p.17).
Univers
ity of
Mala
ya
`
51
As TCM developed, the perspective of TCM shifted from a cost reduction tool to a
profit management tool (Feil, Yook, & Kim, 2004), which led to the TCM definition evolv-
ing. Kato (1993) highlights that “Target Costing” as a translation of “Genka kikaku” is in-
correct and misleading. This is because “Target Costing” is not a form of costing but a
“comprehensive programme to reduce costs, which begins even before there are any plans
for new products” (Kato, 1993, p. 36). Then, he further defines “Target Costing” as part of
a comprehensive strategic profit management system, which focuses on the life cycle cost
of the new products while improving the quality and reliability by studying all possible cost
reduction opportunities upstream of production and in the early production stage (Kato,
1993; Kato et al., 1995). In order to deliver the true meaning of “Genka kikaku”, in a Japa-
nese Cost Society meeting, the term of “Target Costing” was officially changed to Target
Cost Management (TCM) ( Feil, Yook, & Kim, 2004). Accordingly, this resulted in a com-
prehensive and integrated definition of TCM. The Japanese Accounting System (1996) de-
fines TCM as:
An overall profit management process by which quality, price, reliability,
delivery term and other targets are set at the time of the product planning
and development at the levels that meet the perceived customer needs.
Achievement of these targets is simultaneously attempted in all areas from
the upstream to downstream processes (Huh et al., 2008, p. 91).
From this definition, it can be concluded that TCM is “a profit management pro-
cess” with specific targets in “quality, prices, reliability, delivery date and other targets”,
which is set in the “product planning and development” stage with an objective to conform
to “the perceived customers’ needs”, and needs to be achieved from the “upstream to the
downstream” of the value chain. The examples of the upstream of the value chain are de-
sign, research and development, and product planning. Whereas, examples of the down-
Univers
ity of
Mala
ya
`
52
stream of the value chain are logistics, sales and customer services (Kato, 1993). However,
between the two, the Japanese companies have a greater tendency to focus on the upstream
to achieve their targets (Kato, 1993).
On the other hand, non-Japanese scholars also claim that many names are used for
TCM such as “basis net price”, “manufacturing cost reduction”, “pre-calculation”, “direct
cost feasibility study” and “design to cost” in other countries (Everaert et al., 2006). In fact,
the non-Japanese scholars also have various definitions for TCM. Kaplan and Atkinson
(1998) define TCM as a cost control method that is used during the product design stage.
Cooper and Slagmulder (1999) define TCM as a strategic technique to manage a compa-
ny’s future profits. This is because TCM achieves its objectives by determining its life cy-
cle cost at which the companies must produce the proposed products with a particular quali-
ty and functionality, and sell it at its anticipated selling price to achieve its profit (Cooper &
Slagmulder, 1999). Creese (2000) defines TCM as “a systematic approach to product cost
planning in which the cost of a proposed product with specific functionality, specific quali-
ty, and at a specified production quantity is determined to give a certain level of profits at
its anticipated selling price” (Creese, 2000, p. 4). Drury (2004) defines TCM as a technique
that focuses on managing costs during the product planning and design stage. Ansari et al.
(2006) cited that the Consortium for Advance Management-International (CAM-I) define
TCM as “a profit planning and cost management system that is price led, customer focused,
design centred, and cross-functional” (Ansari et al., 2006, p. 1). Everaert et al. (2006) de-
fine TCM more extensively as “Target costing is the process of determining the target cost
for products early in the New Product Development (NPD) process and of supporting the
attainment of this target cost during this NPD process, by providing target costing infor-
Univers
ity of
Mala
ya
`
53
mation to motivate the NPD team to realize downstream cost management of new products
in order to ensure product profitability when launched” (Everaert et al., 2006, p. 238).
Due to various definitions of TCM, some studies conclude that there are gaps be-
tween the actual TCM practices and the scholars’ definition of TCM (Everaert et al., 2006).
On the other hand, it has also been concluded that the diversity of definitions indicate that
TCM did not develop wholly from an established theory but gradually from practical appli-
cations. This indicates the broadness of the TCM concept (Feil, Yook, & Kim, 2004).
In summary, there are various definitions of TCM by the scholars and a wide range
of names and descriptions given by the respondents for the practices they employ. However,
even though there is a lack of identical definition of TCM, in general, all the definitions
given by the scholars have the same fundamental philosophy of TCM – the market price
becomes the determinant of the cost rather than the cost determining the market price.
2.4.4 TCM objectives
The objectives of the implementation of TCM are different from company to com-
pany (Sakurai, 1989; Tani et al., 1994). Among the objectives of TCM implementation are
cost reduction, development and design efficiency, marketability quality, satisfying cus-
tomers’ needs, timely introduction of new products, and long-term profitability improve-
ment (Tani et al., 1994; Huh et al., 2008; Ansari & Swenson, 2006 ; Cooper & Slagmulder,
1999). Generally, two main objectives of TCM implementation are to reduce cost and to
remain profitable.
Univers
ity of
Mala
ya
`
54
TCM is used as a cost reduction tool to reduce the costs at the planning and design
stage of the product life cycle (Sakurai, 1990). This is because the most effective stage to
control the cost is during the product planning and design stage and not when the product
and process has already been designed and is being manufactured (Kaplan & Atkinson,
1998). With 70 to 80 per cent of the product cost being locked in during the product design
stage, the design stage mostly fixes the cost of later activities including manufacturing and
after sales cost (Sakurai, 1989; Kato, 1993; Hergert, 2002). Accordingly, the key to cost
reduction is not to make the manufacturing more efficient but to make the design more ef-
fective (Kato et al., 1995). The target cost in TCM helps the engineer teams to focus their
intention on the cost implications during the design stage, which, subsequently, reduces the
cost of later stages (Kato, 1993; Hibbets et al., 2003).
Bayou and Reinstein (1998) argue that there are three methods to achieve cost re-
duction under TCM – cost improvement, cost cutting, and cost shifting. Cost improvement
is defined as cost development by using a structure that involves cost and non-cost elements
that integrate the costing, pricing, market share, profit margin and long-term investment.
However, even though cost reduction can be achieved by cost improvement, not all cost
improvements result in cost reduction. Cost cutting is defined as reducing the unavoidable
inefficiency by redesigning the product or restructuring the manufacturing process. The
cost reduction is met through a reduction in non-productive areas. Cost shifting is defined
as reducing the cost by changing the type or quality of resources in the manufacturing pro-
cess. These three methods have distinct tendencies: cost improvement has a suggestive ten-
dency, cost cutting has an assertive tendency and cost shifting has an evasive tendency.
Cost improvement has a suggestive tendency because the cost improvement activities in-
Univers
ity of
Mala
ya
`
55
volve a large scale of expertise with the study output being suggested to the top manage-
ment. Cost cutting has an assertive tendency because the decisions are made by top man-
agement to increase profit or to reduce loss. Cost shifting has an evasive tendency because
it switches to the lower cost line by degrading the quality. Both cost cutting and cost shift-
ing are conducted without implementing a strategic improvement programme. The authors
further advocate that TCM managers must consider the pitfalls before selecting any of these
methods (Bayou & Reinstein, 1998).
Another main objective of TCM implementation is to remain profitable. Since the
target-selling price is determined by the market, the product can be sold at the right price.
Therefore, by managing the cost within the target cost, TCM implementation helps the
company to ensure its profitability (Cooper & Slagmulder, 1998; Kato et al., 1995). Fur-
thermore, as TCM started to become integrated with other business elements (Ansari et al.,
2007), the TCM objective also gradually shifted from a cost reduction tool to a profit man-
agement tool (Feil, Yook, & Kim, 2004). For example, the Japanese companies link the
target profit setting in TCM with their companies’ midterm profit planning. This allows the
Japanese companies to integrate the TCM with their profit management system and apply it
as companywide activities (Kato et al., 1995)
In a nutshell, the main objectives of TCM implementation are to reduce cost and to
remain profitable. However, as the TCM developed, the TCM is used as a profit manage-
ment tool rather than a cost reduction tool.
Univers
ity of
Mala
ya
`
56
2.4.5 Characteristics of TCM
This section highlights the related literature on TCM characteristics. Various TCM
characteristics have been highlighted by previous studies from many perspectives (Sakurai,
1989; Ansari et al., 2006; Everaete et al., 2006; Monden & Hamada, 1991; Kato, Boer, &
Chow, 1995; Tani et al., 1994; Feil, Yook, & Kim, 2004). For example, Sakurai (1989)
outlines four characteristic of TCM: (1) it is mainly used in the planning and design stage;
(2) it is a tool for cost planning or cost reduction not cost control; (3) it is mostly imple-
mented in assembly oriented industries with a variety of products; and (4) it is a tool for
controlling the design specifications and production technique decisions, which makes it
focus more on management and engineering rather than accounting. On the other hand,
Monden and Hamada (1991) highlight five characteristics of TCM: (1) TCM is applied in
the developing and designing stage; (2) TCM is not a management method for cost control
but one of the tools to reduce costs; (3) TCM uses many management science methods in-
cluding engineering techniques; (4) TCM requires cooperation from many departments; and
(5) TCM is suitable for multi-products with a small production volume rather than a few
products with a large production volume.
However, Western scholars outline the TCM characteristics from different points of
view. Ansari et al. (2006) cite that the Consortium for Advanced Management-International
(CAM-I) summarises six characteristics of TCM: (1) price led costing, (2) focus on the cus-
tomer, (3) focus on design, (4) cross-functional teams, (5) value chain involvement, and (6)
life cycle cost reduction (Ansari et al., 2006). Everaete et al. (2006) based on the findings of
their case studies at three manufacturing companies outline eight characteristics of TCM.
These comprise (1) the target-selling price is set during product planning, in a market-
Univers
ity of
Mala
ya

`
57
oriented way; (2) the target profit margin is determined during product planning, based on
the strategic profit plan; (3) the target cost is set before the NPD process starts in which the
target cost is determined based on the subtraction method or the addition method; (4) the
target cost is subdivided into target costs for components, functions, cost items, designers
or suppliers; (5) attainment of the target cost requires a cross-functional team; (6) detailed
cost information is provided during NPD to support cost reduction; (7) the cost level of the
future product is compared with its target cost at different points during NPD; and (8) a
general rule is established that “the target cost can never be exceeded”.
Due to the wide scope of TCM characteristics, this research summarizes the common
characteristics of TCM as follows:
a) TCM starts in the upstream of production stage.
Most of the scholars highlight that TCM starts in the upstream of the production stage,
which is the design and development stage (Sakurai, 1989; Monden & Hamada, 1991).
However, Tani et al. (1994), in their survey of Japanese companies in 1991 found that these
companies already started to implement TCM earlier, which is in the product conceptual
and planning stage. Similarly, Kato et al. (1995), in their case study of Daihatsu, Japan,
found that the case company already starts TCM in the product conceptual stage.
b) TCM is suitable in a competitive business environment.
TCM is suitable in a competitive business environment with customers who are
very sensitive to price and where the market is under high competition and high productivi-
ty (Hibbets et al., 2003; Dekker & Smidt, 2003). Historically, the tough competition in the
Japanese market forced the Japanese companies to integrate the VE into their product de-
Univers
ity of
Mala
ya
`
58
sign and develop TCM gradually from a cost reduction tool to a profit management tool
(Feil, Yook, & Kim, 2004). Due to the stiff market competition, it is very hard to increase
the price once the product has been launched. The implementation of TCM helps Japanese
companies to set the right price from the initial stage by using the right selling price, which
is determined by the market. This helps the Japanese companies to manage their strategies
and operate speedily at a profitable margin (Howard & Herbig, 1996).
c) TCM is motivated by external forces
TCM is motivated by external forces to achieve the target cost. These external forc-
es come from markets and competitor analysis. On the other hand, traditional costing is mo-
tivated by internal forces, which are set by the industrial engineers and production manag-
ers through the concept of efficiency. Thus, unlike the traditional costing, the external forc-
es element of TCM helps the companies to respond to market demand and competitive
trends rather than merely focus on internal performance (Guan, Hansen, & Mowen, 2009).
d) TCM is a multiple feed forward system
A feed forward system is a control system that is based on planned data, which aims
to control the future by planning (Wickramasinghe & Alawattage, 2007). Compared with
other SMA techniques, TCM has a built-in multiple loop feed forward system (Nishimura,
2005). From the information received, such as market trend, the built-in system in TCM
allows companies to simulate the future business environment and link it with the compa-
nies’ multidimensional planned values. Furthermore, by linking it with long-term strategic
plan and short-term competitive plans, the companies are able to take proactive action in
achieving their targets (Nishimura, 2005).
Univers
ity of
Mala
ya
`
59
e) TCM is part of life costing cost management
TCM emphasizes recognizing, identifying and exploiting the external and internal
linkages to achieve cost reduction. These characteristics also exist in life cycle cost man-
agement. Thus, TCM is regarded as a part of life cycle cost management (Guan, Hansen, &
Mowen, 2009). In TCM, the target profit is also set to cover the life cycle costs of the prod-
ucts such as purchased parts cost, operating cost, and repair and maintenance cost (Cooper
& Slagmulder, 1999). In addition, TCM is also regarded as a part of the total cost manage-
ment in the Japanese companies (Monden & Hamada, 1991).
f) TCM is more suitable for mass production manufacturers
TCM is more suitable for manufacturers in assembly-oriented industries than pro-
cess-oriented industries (Sakurai, 1989). Especially for mass production companies that
produce multiple products in small to medium volume, make-to-stock items and high-
technology (Helms et al., 2005; Sakurai, 1990).
g) TCM must achieve the target cost without sacrificing the quality or functionality.
The rule of thumb for TCM implementation is that the target cost must never be ex-
ceeded (Kato et al., 1995; Cooper & Slagmulder, 1999). In the Japanese companies, achiev-
ing the target cost is a must because it leads to achieving the target profit and become prof-
itable (Kato et al., 1995). Thus, once the target cost has been set, any cost increment due to
design must have offsetting savings somewhere else in the design. Engineering tools, such
as Value Engineering (VE), are applied to achieve the target cost without sacrificing the
quality and functionality of the product (Cooper & Slagmulder, 1999; Tani et al., 1995).
However, if the companies decide to produce the product for strategic reasons, for example,
Univers
ity of
Mala
ya
`
60
to complete the product line, or to launch the product on time, the product will be produced
even if the target cost is not met. After the product launching, an intense cost reduction will
be conducted immediately to meet the target cost (Cooper & Slagmulder, 1999). Alterna-
tively, a systematic approach can also be taken by reviewing back the target cost or target
profit by increasing the target cost and reducing the profit margin, reviewing the manufac-
turing process for possible modification or lessening the product functionality requirements
to meet the target cost (Helms et al., 2005).
h) TCM execution requires cooperation from many parties.
Although, the product designers and plant engineers play important roles in TCM
(Horngren & Foster, 1987), TCM implementation requires cooperation from many depart-
ments and divisions including from the business value chain, such as suppliers (Monden &
Hamada; 1991; Okano, 2005). Additionally, many studies (Ansari et al., 2006; Everaete et
al., 2006; Swenson et al., 2003; Huh et al., 2008) highlight that a cross-functional team is
one of the characteristics of TCM. A cross-functional team is a group of employees from
different functions who are permanently assigned to work full-time in a team and report to
the leader of the team (George & Jones, 2005).
In conclusion, there are various TCM characteristics highlighted by the previous
studies. Among the main characteristics of TCM are it starts in the upstream of production
stage, it provides financial and non-financial information to the companies to be proactively
compete in the market, and it requires team work efforts to achieve the targets which are set
by the markets.
Univers
ity of
Mala
ya
`
61
2.4.6 TCM Engineering Tools
TCM focuses on achieving the target cost, planning, development and design of the
new product simultaneously by using engineering tools (Tani et al., 1995; Pierce, 2002).
There are many engineering tools used in TCM. Among the common engineering tools are
Value Engineering (VE) and reverse engineering (Cooper & Slagmulder, 1999; Pierce,
2002).
a) Value Engineering (VE)
VE is a systematic activity to evaluate the product’s design and cost by identifying
ways to improve the product’s value and maximize customer value from all aspects of the
value chain business functions (Horngren et al., 2008; Hergert, 2002; Kaplan & Atkinson,
1998). It reduces cost by simultaneously considering product reliability and increasing the
product value without degrading the product quality (Sakurai, 1989; Creese, 2000). Accord-
ingly, VE is different from cost reduction techniques in two aspects. First, cost reduction is
likely to lead to quality issues or cost increment elsewhere from the company wide view-
point. Second, cost-down techniques have limited areas of application.
VE uses two key concepts, which are “cost incurrence” and “locked in cost” in
managing the non-value added and value added cost. “Cost incurrence” is the cost incurred
when the resources are used up. While “locked in cost’, also known as “design in cost”, is
the cost that is not yet incurred but will be incurred in the future based on the decisions that
are made during the design stage. For example, the scrap cost that is incurred during the
manufacturing stage might be due to the bad design during the design stage (Horngren et al.,
2008).
Univers
ity of
Mala
ya
`
62
Generally, VE mainly involves designing a product from different angles at lower
cost by considering the functions needed by the customers (Sakurai, 1989). Thus, the main
focus of VE is to make innovations and modify the design during the product design stage
and implement it during the prototype stage (Creese, 2000). In fact, VE starts as early as in
the product conceptual development stage in Japanese companies (Monden & Hamada,
1991). Accordingly, VE can be categorized into three types based on its implementation
timing: “Zero-Look VE”, “First Look VE” and “Second-Look VE”. “Zero-Look VE” is
implemented in the product planning stage, “First-Look VE” is implemented in the design
stage and “Second-Look VE” is implemented in the production stage (Wickramasinghe &
Alawattage, 2007).
Through VE, the gap between the target cost and the actual production cost can be
eliminated by increasing operational efficiency, simplifying, redesigning, removing non-
value added features or adding value added features to fit the customers’ needs without
compromising quality (Cooper et al., 1998). For example, by standardizing the parts with
other models or products, the dies and moulds can be shared, which helps to increase the
volume of particular parts and eventually reduce the cost of the parts (Kato et al., 1995; Lee
& Monden, 1996). Additionally, standardizing the parts helps to reduce the cost in terms of
storage, handling of materials, assembly processes and after sales maintenance (Pierce,
2002).
Cost tables are one of the tools that support VE. With cost tables, the TCM mem-
bers are able to get cost information, estimate the target cost and reduce the possibility of
Univers
ity of
Mala
ya
`
63
supplier opportunistic transactions, which are non-value added to the customer. Neverthe-
less, the cost table is difficult and expensive to update. The usefulness decreases if they are
not updated frequently (Tani et al., 1994).
b) Reverse engineering
Reverse engineering is also known as tear down analysis. By tearing down the
competitor’s products, a company can gather information and the technologies used by the
competitors and identify the cost reduction ideas for their products (Kato et al., 1995). In
this process, the competitors’ products are dis-assembled and analysed piece by piece to
identify the opportunities for functionality, design and process improvement (Kaplan & At-
kinson, 1998). From the tear down activities, the Japanese companies adopt the lowest cost
among the competitors’ products as the target cost for their similar products (Howard &
Herbig, 1996).
In brief, TCM uses many engineering tools mainly VE and reverse engineering. VE
is a systematic activity or process conducted to achieve the target cost. The reverse engi-
neering is used to find the possible ideas for cost reduction.
2.4.7 TCM Implementation Process
Many studies highlight the process of TCM. Even though the basis of the concepts
is similar, the details of the processes or the stages that are described by the scholars vary
(Ansari et al., 2006; Drury 2006; Kaplan et al., 1998; Sakurai, 1989). Most of the non-
Japanese scholars describe the TCM process in a simple way. In general, TCM starts with a
market survey to get information concerning the anticipated selling price. Then, the target
Univers
ity of
Mala
ya
`
64
cost is set by subtracting the target profit from the target-selling price. After that, the target
cost is decomposed into sub-assemblies and the individual component parts (Ansari et al.,
2006).
Drury (2004) goes into further detail by breaking down the process of TCM into
four stages. The first stage is to determine the target-selling price that the customers are
willing to pay. Here, market research is required to identify the customer perceived value of
the product with the given features and functions. The second stage is to deduct the target
profit from the target-selling price to derive the target cost. This target profit depends on the
company’s overall planned return on investment and profit as a percentage of sales. The
third stage is to estimate the cost of the product. This estimation is a product estimated or
predetermined actual cost. In the final stage, if the estimated actual cost exceeds the target
cost, thorough efforts are made to reduce the actual cost and to close the gap.
Kaplan et al. (1998) categorize TCM into four different level processes with differ-
ent tools and objectives – Market Driven Costing, Product Level Target Costing, Compo-
nent Level Target Costing and Chained Target Costing. The Market Level Costing is the
level in which the market requirements are integrated into the product and the companies
start to set the target-selling price, target profit, and target cost or allowable cost. The Prod-
uct Level Target Costing is the level in which the designers work out how to satisfy the
customers within the allowable cost through engineering tools such as Value Engineering
(VE). In the Component Level Target Costing, the component level target cost is set and
cooperation with suppliers is necessary to omit the non-value added cost. This integrated
process is able to ensure that only profitable products are launched. While, in the Chained
Univers
ity of
Mala
ya
`
65
Target Costing Level, TCM is integrated into its supply chain. Here, the component level
target cost set by the buyers becomes the selling price of its suppliers. At this level, the
buyers can transmit down the competitive pressure to its supply chain, which generates in-
tense cost reductions in the whole supply chain.
Based on case study conducted at Brazilian manufacturing company, Filomena et al.
(2009) proposed TCM operationalization model to operationalize the TCM in the emerging
market. In this model the TCM is operationalized by categorizing it into four stages: (1)
define the product parts, features and common elements, (2) define the target cost per unit
to develop the product, (3) calculate the overall target cost per unit of the product, and (4)
define the insertion target cost by subtracting the target cost to develop the product from
overall product target cost, then breakdown the insertion target cost to parts and features
elements. They propose that this model help to integrate the TCM with other cost control
tools and enable more accurate cost control (Filomena, Neto, Duffey, 2009).
Japanese scholars describe the TCM process in more detail. Sakurai (1989) summa-
rizes that, typically, there are three fundamental steps in TCM process. The first step is
planning and designing the product quality that best meets the customers’ needs. Through
the market research, the customers’ needs and preferences are defined. The target-selling
price is estimated by considering the product concept, product attributes and the anticipated
sales quantity and competitors’ reaction. The target profit is set based on the company’s
strategic plan. The second step is to set the target cost of the products and then realize the
target by applying Value Engineering (VE). By deducting the target profit from the target-
selling price, an allowable cost is derived. In other words, the allowable cost represents the
Univers
ity of
Mala
ya
`
66
cost at which the product must be manufactured to gain the target profit margin when sold
at its target-selling price. However, Sakurai (1989) further highlights that this allowable
cost is very tight but desired by the top management. Thus, it usually cannot be achieved in
the short-term and normally is used as the long-term cost objective. The third step is to
achieve the target cost in the production stage by using standard costing (Sakurai, 1990).
The Japanese companies link back the TCM to standard costing by using the target cost as
the cost base of the standard costing system to achieve the target cost in the production
stage. Nevertheless, if the companies do not have the standard costing system, the target
cost is used as the budget. Then, the historical cost result is used to compare against this
budget for the purpose of evaluating the cost achievement (Sakurai, 1989).
In summary, there are various types of TCM implementation process highlighted by
the scholars. Nevertheless, the processes highlighted by the Japanese scholars are more de-
tails and comprehensive compared to the western scholars. Chapter 3 will detail up the
TCM implementation process explanation in four major stages and seven steps.
2.4.8 TCM enablers
Previous scholars have highlighted many different enablers that influence the suc-
cessful implementation of TCM (Helms et al., 2005; Swenson et al., 2003; Feil, Yook, &
Kim, 2004; Huh et al., 2008; Kato 1993; Tani et al., 1994; Sakurai 1989; Ansari et al., 2006;
Ellram, 2006; Lee & Monden, 1996; Cooper & Slagmulder, 1999).
Some literature oversimplified and concluded that the Japanese social and cultural
factors made the Japanese management accounting successful (Nishimura, 1995; Feil,
Yook, & Kim, 2004; Stainer, 1995). For example, Nishimura (1995) concludes that Japa-
Univers
ity of
Mala
ya
`
67
nese management is highly influenced by the Japanese culture of collectivism. The combi-
nation of teamwork based horizontal organization and multi-skill specialties enable the in-
tegration of a high quality and low cost strategy. Similarly, Feil et al. (2004) argue that the
implementation of TCM in Japan is successful because of the Japanese business and cultur-
al factors. They highlight that top management leadership, team orientation, commitment to
work, mutual trust, management accounting, employee education and training level,
“Keiretsu” (strategic network), and information network are the factors that contribute to
the successful implementation. In addition, Stainer (1995) concludes that the Japanese
manage to gain high productivity because they give attention to detail, commitment and
mutual respect and co-operative spirit, discipline, and understand and appreciate the close
link between quality and productivity. Nevertheless, Okano and Suzuki (2007) emphasize
that giving credit to Japanese social and cultural factors as contributing to the success of
TCM is misleading and a superficial conclusion. This is because as the social and cultural
factors are external and unmanageable factors, other researchers might predict that it will be
very difficult for overseas companies to implement Japanese management accounting.
Eventually there will be no more further effort to explore the manageable factors in which
it will lead to the end of the TCM research and practices in non-Japanese context (Okano &
Suzuki, 2007).
On the other hand, Tani et al. (1994), based on their survey study of manufacturing
companies in Japan, conclude that cross-functional teams, which create simultaneous engi-
neering or “rugby” style product development, is the key concept for the successful imple-
mentation of TCM. Huh et al. (2008) argue that the Japanese companies managed to im-
plement TCM successfully because they have dynamic capabilities that consist of architec-
Univers
ity of
Mala
ya
`
68
tural and process capabilities. The architectural capabilities element consists of top man-
agement support, empowered project manager, concurrent engineering, cross-functional
team and linkage to profit planning. The process capabilities element consists of coopera-
tion with other departments, information sharing, transfer of experience, employee empow-
erment and delegation of authority. The existences of architectural and process capabilities
improve the performance of TCM in terms of marketability, efficiency and cost reduction.
Accordingly, these dynamic capabilities allow the Japanese companies to have a competi-
tive advantage over Western companies (Huh, Yook, & Kim, 2008).
While, Helms et al. (2005) suggest that internal coordination and involvement of
accounting and financial professionals, and the close monitoring of marketing and quality
control throughout the entire process is necessary for the successful implementation of
TCM. The case study research of Swenson et al. (2003) of American companies found
that the TCM companies use a cross-functional structure and listen to the voice of the cus-
tomers. Besides that, these companies also emphasize on cost reduction during the design
stage and remove unnecessary cost throughout the supply chain with supplier involvement.
Ellram (2006) in her case studies of 11 companies in the USA posits that supply chain
management or purchasing function play an important role in the successful implementa-
tion of TCM. Similarly, Cooper and Slagmulder (1999) also highlight that the TCM prac-
tices in manufacturing companies in Japan highly involve the cooperation of suppliers in
achieving the target cost. However, regarding the high involvement of the supply chain, the
study findings of Rattray et al. (2007) in New Zealand were different. The survey results of
Rattray et al. (2007) for 31 New Zealand manufacturing companies show that the involve-
ment of suppliers in TCM is relatively low.
Univers
ity of
Mala
ya
`
69
Whereas, Sakurai (1989) suggests that the successful implementation of TCM re-
quires the implementation of cost engineering tools, such as Just In Time (JIT), Value En-
gineering (VE) and Total Quality Control (TQC). Likewise, Kato (1993) identifies a few
common features of the successful Japanese companies that implement TCM. First, these
companies implement both cost leader and differentiator strategies. Second, VE is widely
used as a tool to achieve the target cost. Third, they implement information systems as a
tool to support the TCM practices. Sales pricing support systems, target profit computation
support systems, cost database management systems, and research and development sup-
port systems, such as Computer Aided System (CAD), Computer Aided Engineering
(CAE) and Project management system are examples of information systems that support
TCM. The author further emphasizes that the essence of Japanese management is the com-
bination of technology for effectiveness and efficiency with human wisdom. Hence, he
states that “TCM is a subtle combination of the use of human intelligence for creativity and
the leading edge technologies of target costing support systems” (Kato, 1993, p. 43).
Ansari et al. (2006) conclude that the well-executed implementation process of
TCM is not enough. Instead, TCM should be institutionalized into the daily work routine of
the company to make it successful. Accordingly, he listed six common characteristics of
institutional processes that are embedded in successful TCM companies: (1) TCM is a
standard process in product development and one of the company’s competitive strategies,
(2) the existence of formal policies and procedures of TCM, (3) a formal department an-
choring TCM activities, (4) TCM is included as one of the performance measures, (5) a re-
wards and compensation system for TCM members, and (6) TCM processes are integrated
Univers
ity of
Mala
ya
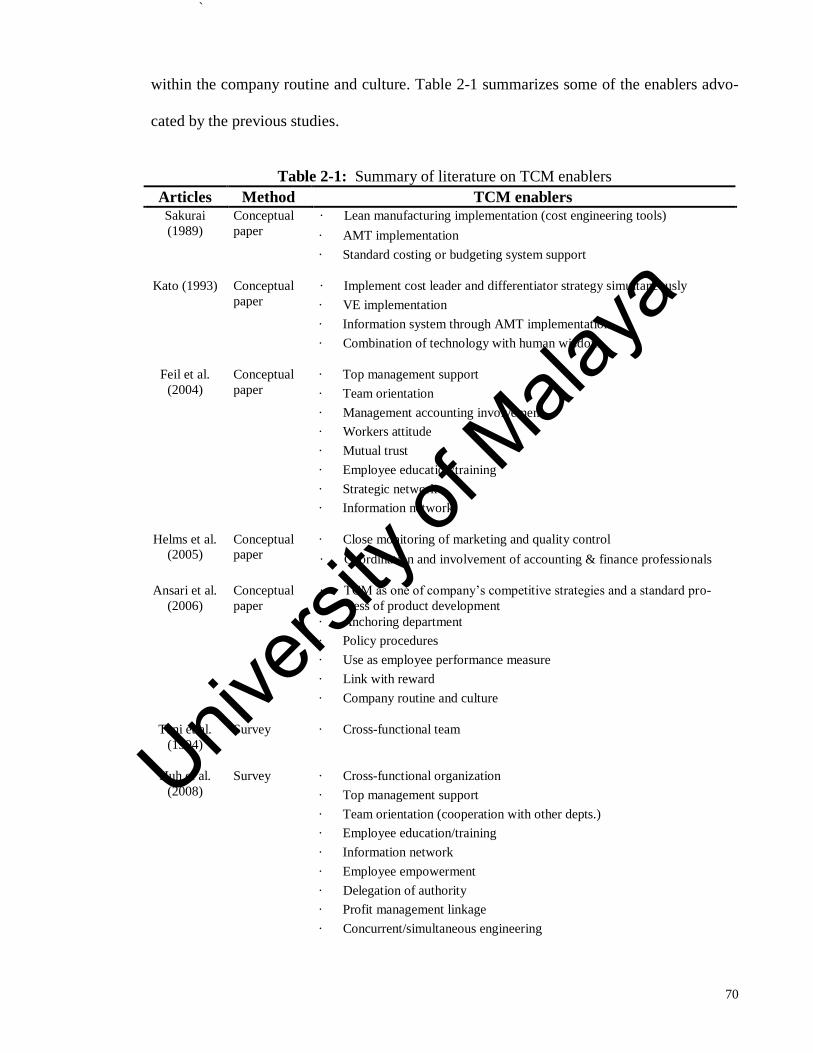
`
70
within the company routine and culture. Table 2-1 summarizes some of the enablers advo-
cated by the previous studies.
Table 2-1: Summary of literature on TCM enablers
Articles Method TCM enablers Sakurai
(1989)
Conceptual
paper
· Lean manufacturing implementation (cost engineering tools)
· AMT implementation
· Standard costing or budgeting system support
Kato (1993) Conceptual
paper
· Implement cost leader and differentiator strategy simultaneously
· VE implementation
· Information system through AMT implementation
· Combination of technology with human wisdom
Feil et al.
(2004)
Conceptual
paper
· Top management support
· Team orientation
· Management accounting involvement
· Workers attitude
· Mutual trust
· Employee education/training
· Strategic network
· Information network
Helms et al.
(2005)
Conceptual
paper
· Close monitoring of marketing and quality control
· Coordination and involvement of accounting & finance professionals
Ansari et al.
(2006)
Conceptual
paper
· TCM as one of company’s competitive strategies and a standard pro-
cess of product development
· Anchoring department
· Policy procedures
· Use as employee performance measure
· Link with reward
· Company routine and culture
Tani et al.
(1994)
Survey · Cross-functional team
Huh et al.
(2008)
Survey · Cross-functional organization
· Top management support
· Team orientation (cooperation with other depts.)
· Employee education/training
· Information network
· Employee empowerment
· Delegation of authority
· Profit management linkage
· Concurrent/simultaneous engineering
Univers
ity of
Mala
ya
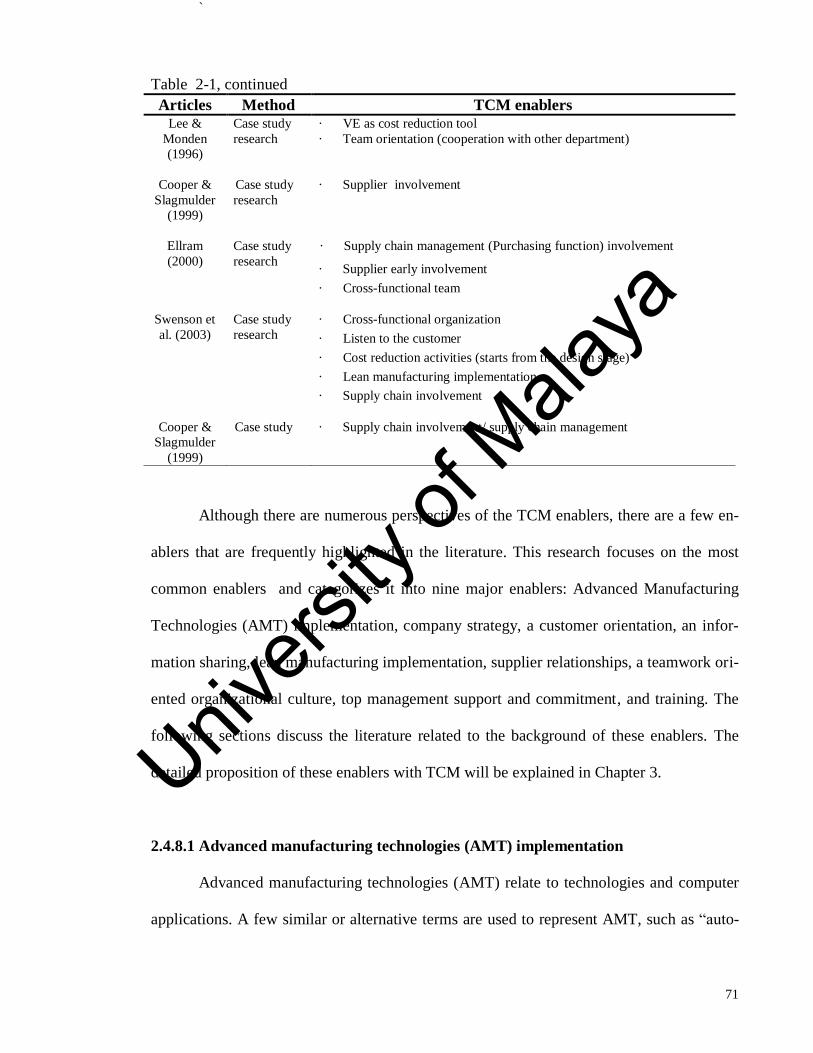
`
71
Table 2-1, continued
Articles Method TCM enablers
Lee &
Monden
(1996)
Case study
research
· VE as cost reduction tool
· Team orientation (cooperation with other department)
Cooper &
Slagmulder
(1999)
Case study
research
· Supplier involvement
Ellram
(2000)
Case study
research
· Supply chain management (Purchasing function) involvement
· Supplier early involvement
· Cross-functional team
Swenson et
al. (2003)
Case study
research
· Cross-functional organization
· Listen to the customer
· Cost reduction activities (starts from the design stage)
· Lean manufacturing implementation
· Supply chain involvement
Cooper &
Slagmulder
(1999)
Case study · Supply chain involvement/ supply chain management
Although there are numerous perspectives of the TCM enablers, there are a few en-
ablers that are frequently highlighted in the literature. This research focuses on the most
common enablers and categorizes it into nine major enablers: Advanced Manufacturing
Technologies (AMT) implementation, company strategy, a customer orientation, an infor-
mation sharing, lean manufacturing implementation, supplier relationships, a teamwork ori-
ented organizational culture, top management support and commitment, and training. The
following sections discuss the literature related to the background of these enablers. The
detailed proposition of these enablers with TCM will be explained in Chapter 3.
2.4.8.1 Advanced manufacturing technologies (AMT) implementation
Advanced manufacturing technologies (AMT) relate to technologies and computer
applications. A few similar or alternative terms are used to represent AMT, such as “auto-
Univers
ity of
Mala
ya
`
72
mation”, “factory automation” and “manufacturing techniques” (Kaplan & Atkinson, 1998;
Sakurai, 1990; Hoque, 2003; Perera, Harrison & Poole, 1997). Kaplan and Atkinson (1998)
define automation as the firm’s use of computerized manufacturing processes throughout
the factory, from design to manufacturing, and are linked together under the digital control.
On the other hand, Factory Automation (FA) is a popular term used in Japan to represent
the automation of a factory through the usage of a Computer Aided Design (CAD) or Com-
puter Added Manufacturing (CAM), Flexible Manufacturing System (FMS) and Office Au-
tomation (OA) (Sakurai, 1990). FMS is the core of AMT, which integrates the numerical
control machines, industrial robots and automated material handling systems (Sakurai,
1990). Among AMT, Computer Integrated Manufacturing (CIM) is the most advanced lev-
el where all the information and operations from all sections, such as design and develop-
ment, inventory control, engineering, manufacturing, marketing, and after sales, are central-
ised and fully automated (Kaplan & Atkinson, 1998).
A greater use of technologies improves long-term competitiveness by increasing
speed, flexibility and quality (Drury & Tayles, 1995). AMT implementation also helps the
companies to achieve manufacturing excellence, which results in producing the best prod-
uct at the lowest price (Mcnair & Mosconi, 1987). Mcnair and Mosconi (1987) suggest that
companies must proactively and wisely incorporate AMT and performance measuring sys-
tem changes into their strategic plan to achieve manufacturing excellence.
World-class manufacturers invest in AMT to improve their production process,
product quality and manufacturing flexibility (Hoque, 2003). However, the adoption of
AMT involves huge capital investment with a high degree of uncertainty involved in these
Univers
ity of
Mala
ya
`
73
investments. Usually, ample time is acquired to gain the potential benefits of an AMT in-
vestment. This is because the employees need trainings and experience to master the new
technologies. As the technologies get more complicated, more time is required in which
eventually delay the performance gains (Saberi, Mohd. Yusuff, Zulkifli & Megat Ahmad,
2010). Thus, before embarking on this investment, the company needs to thoroughly review
its objectives, strengths and weaknesses.
A study by Isa and Foong (2005) on AMT adoption and costing relationship in Ma-
laysian manufacturing companies argues that companies with a high level of AMT adoption
tend to practice more new costing methods, such as TCM. Furthermore, Sakurai (1989)
posits that an assembly oriented company with AMT adoption is the best candidate for the
implementation of TCM. Kato (1993) highlights that Japanese companies use information
systems extensively to support their TCM activities. For example, in terms of target profit
setting, Nissan Japan uses a computer simulation system to find the historical relationship
between the actual profit and selling price. The new product target profit is set based on this
historical relationship (Cooper & Slagmulder, 1999). Daihatsu Japan also created a com-
puter database system to record all the problems and countermeasures taken from the value
engineering and value analysis activities. This database works as an important reference to
avoid future product design related problems (Kato et al., 1995).
Accordingly, this research proposes that AMT implementation is one of the enablers
for the successful implementation of TCM.
Univers
ity of
Mala
ya
`
74
2.4.8.2 Company strategy
Porter’s Five Forces Model suggests that the competitiveness of any industry can be
viewed as a combination of five forces – the rivalry among existing competitors, the entry
of new competitors, the threat of substitute products, the bargaining power of suppliers and
the bargaining power of customers. These forces influence the price and costs including the
investment, which determines the company’s profitability (Porter, 1985). In a highly com-
petitive environment, the competition among sellers is the major driving force (Hibbets,
Albright, & Funk, 2003).
In order to counter these forces, a business strategy is necessary. The business strat-
egy is a company management’s action plan for managing the business and running the op-
erations. A winning strategy must match with the company’s external and internal envi-
ronment, improve the company’s performance and build competitive advantages. Basically,
two types of company performance improvement result from good strategies. These are (1)
improvements in the financial strength and profitability and (2) improvement in the compa-
ny’s market share standing and competitive strength (Thompson et al., 2010). Nevertheless,
by performing activities differently or performing different activities from its rivals, a com-
pany is able to establish its unique position against its rival and gain a competitive ad-
vantage (Hitt et al., 2004).
Porter (1985) outlines two basic types of competitive advantage, which are low cost
or differentiation. The type of competitive advantage the company possesses is the result of
the company’s ability to cope with the five forces better than its competitors. However, in
order to perform above average in their industry, companies have to gain sustainable com-
Univers
ity of
Mala
ya
`
75
petitive advantages. Subsequently, Porter (1985) combined the competitive strategy with
the scope of activities to develop three sustainable competitive advantages – cost leadership,
differentiation and focus strategy. The cost leadership strategy is to produce the product at
an acceptable level of quality and functionality at a lower cost than its competitors. The
sources of cost advantage are various, such as high market share, low cost, standardization
of parts, learning curve effects, economies of scales and tight cost control. The differentia-
tion strategy is the companies’ capability of producing and marketing the unique and supe-
rior products that are widely valued by customers in terms of quality and functionality. In
this strategy, companies focus on product uniqueness instead of cost or price through brand
loyalty, brand quality, emphasis on marketing, research and after sales service. Whereas, in
the focus strategy, companies focus on a specific segment or group of segments in the in-
dustry and customize their strategy to serve the target segments. In the cost focus strategy,
companies focus on the cost advantage of their target market segment. While in the differ-
entiation focus strategy, companies focus on differentiation of their target market segment
(Porter, 1985). Porter (1985) argues that in order to gain a sustainable competitive ad-
vantage, a company “must make a choice about the type of competitive advantage it seeks
to attain and the scope within which it will attain it. Being “all things to all people” is a rec-
ipe for strategic mediocrity and below average performance” (Porter, 1985, p. 12).
On the other hand, Creese (2000) highlights that a sustainable competitive ad-
vantage is unable to be developed under a highly competitive environment, also known as a
confrontational environment, by choosing the differentiation or cost leadership strategy
alone. This is because all competitors offer their product with high quality, high function-
ality and low cost. Similarly, according to Kato (1993), Japanese companies neither believe
Univers
ity of
Mala
ya
`
76
that cost leadership alone nor the differentiation strategy alone is an effective strategy. In-
stead, the Japanese companies implement both cost leadership and the differentiation strat-
egy simultaneously (Kato, 1993).
Copper (1995) poses the term “Confrontational strategy” to represent a combination
of the differentiation and low cost leadership strategy. This strategy focuses on producing a
high quality product at the lowest possible cost (Hibbets et al., 2003). Cooper (1996) fur-
ther elaborates that the confrontational strategy is a strategy that survives based on the
management of the survival triplet, which consists of cost, functionality and quality. Cost is
the value of the resources consumed until the product is delivered to the customer, such as
production costs, investment costs, marketing and selling costs. Functionality is the specifi-
cation and multidimensional characteristics of the product, which meet the customers’ re-
quirements, while quality is the conformance and performance of the product within its
specification. In order to gain sustainable competitive advantage, a company needs to com-
pete in all aspects of the survival triplet within its minimum and maximum range (Cooper,
1996).
Among the main characteristics of the TCM is that the target cost must be achieved
(Kato et al., 1995) without sacrificing the quality and functionality of the product (Cooper
& Slagmulder, 1999; Tani et al., 1995). Accordingly, this research proposes that a company
strategy that focuses simultaneously on cost leadership and differentiation, i.e. confronta-
tional strategy, is one of the enablers for the successful implementation of TCM.
Univers
ity of
Mala
ya
`
77
2.4.8.3 Customer orientation
A company can create sustainable competitive advantage by creating sustainable
superior value to the customers. This can be achieved by offering the products that exceed
the customers’ expectations of any alternative products (Narver & Slater, 1990). Narver and
Slater (1990) argue that market orientation consists of customer orientation, competitor ori-
entation and inter-functional coordination. It creates superior value to the customer, which
results in superior performance to the business. Narver and Slater (1990), in their study of
140 business units in Western countries, found that market orientation has a positive effect
on profitability. In addition, in a field study by Kohli and Jaworski (1990) in four US cities,
profitability was found to be a consequence of the market orientation. Kohli and Jaworski
(1990) also posit that the inter-departmental connectedness promotes better market orienta-
tion. This is because the direct and indirect contacts among employees across departments
facilitate the information sharing of market intelligence i.e. market requirements.
Customer orientation is the central element in the market orientation (Kohli & Ja-
worski, 1990). Customer orientation is defined as sufficient understanding of one’s target
customers to be able to continuously create superior value for them. Value can be created in
two ways: (1) increasing benefits to customers in relation to the customers’ cost and (2) de-
creasing the customers’ cost in relation to the customers’ benefits (Narver & Slater, 1990).
In order to create superior value, the companies must be able to identify and understand the
needs of their target customers. Customers perceive value can be examined through market
value analysis.
Univers
ity of
Mala
ya
`
78
Nevertheless, due to the dynamic changes of internal and external market, customer
values are dynamic and evolving. Therefore, the companies must also identify their future
customers and what those customers will perceive in the future (Narver & Slater, 1990).
Frequent and close interactions with current and potential customers help the companies to
identify and anticipate the customers’ needs. If not, they might lose their customers to their
rivals who are offering better value in terms of product functionalities and features (Hitt et
al., 2004). Pinto and Slevin (1989) posit that frequent consultation and communication with
customers in the early stage of development, and staying well connected to the customers in
order to understand and verify their needs are among the pre-requisites for critical success
factors for project implementation.
Customer orientation helps the companies to compete competitively in the current
market by focusing on customer satisfaction as the company priority. The key success fac-
tors of customer satisfaction are cost efficiency, time, quality and innovation. The compa-
nies must concentrate and influence these key success factors to deliver customer satisfac-
tion (Drury, 2004). Customer satisfaction can be measured by the customer response card,
questionnaire surveys, examining letters of complaint, feedback from sales representatives,
et cetera (Drury, 2004).
In TCM implementation, market and customer input is essential in setting the tar-
get-selling price, target profit and deciding the product features and functionality (Feil,
Yook, & Kim, 2004). An intensive market research is conducted before the development of
new products to understand the customers’ requirements (Cooper & Slagmulder, 1999; Lee
& Monden, 1996). Then, all the customers’ requirements in terms of cost, quality and time
Univers
ity of
Mala
ya
`
79
are simultaneously integrated into the product and process decision (Swenson et al., 2003).
As a rule of thumb, the customer perceived value must be higher than the product innova-
tion cost for the functionalities and features. If the cost is lower than the customer perceived
value, innovative ideas need to be added. However, if the cost is higher than the customer
perceived value, the innovative ideas need to be omitted. Accordingly, this helps the com-
panies to make the right decision by considering the trade-off between customer value and
cost (Swenson et al., 2003).
Considering the importance of customer orientation in the TCM practices, this re-
search proposes that the customer orientation is one of the enablers for the successful im-
plementation of TCM.
2.4.8.4 Organizational information-sharing network
Accounting system is the main source or product cost information for the manage-
ment. Other sources of information includes personal observation and non-financial per-
formance measures such as schedule attainment, setup time, number of defects and produc-
tion lead time (Horngren & Foster, 1987). In JIT plants, there are an increasing role of per-
sonal observation and non-financial measures, and a declining role of financial measures
(Horngren & Foster, 1987).
TCM implementation requires a wide range of information (Kato et al., 1995). This
is because new product development needs to be developed quickly and the products need
to be introduced to the market quickly before the customers’ needs and tastes change (An-
sari et al., 2006). With smooth information flows from downstream to upstream, a company
Univers
ity of
Mala
ya

`
80
can speed up the information flow, increase the effectiveness and efficiency and respond to
the customer quickly (Li & Lin, 2006). Thus, a joint effort through the entire value chain is
necessary (Helms et al., 2005). For example, Japanese companies have outstanding infor-
mation networks with customers and suppliers. This allows intensive backflow of formal
and informal information to the companies concerning the customers’ perceptions regard-
ing the existing products on the market (Feil, Yook, & Kim, 2004). Besides that, the Japa-
nese companies apply the 3-Gens principles: Genba (actual shop floor), Genbutsu (actual
items or things) and Genjitsu (actual reality) in managing their cost. Generally, these prin-
ciples make the Japanese companies’ management to look at the point of production rather
than rely on historical accounting information. This allows proactive and fast action in cost
reduction activities through direct communication with the suppliers, production and sales
fields during the planning, designing and production stages (Okano & Suzuki, 2007).
Information sharing is a pre-requisite for any integration and collaboration between
two companies (Yigibasioglu, 2010). In fact, cost information sharing between a company
and its suppliers helps to enhance inter-organizational cost management for TCM practices
(Creese, 2000). This is because a high degree of accuracy and transparency of information
is necessary for the designer to estimate the cost (Helms et al., 2005) and to design the part
according to the target cost (Monden et al., 1991). By sharing the cost information, the
same understanding of cost level can be attained between a company and its suppliers
(Creese, 2000). Furthermore, the pressure of reaching the target can be communicated and
well understood by each member of the value chain (Helms et al., 2005). Kato (1993) also
suggests that in TCM implementation, the use of information systems, such as Computer
Univers
ity of
Mala
ya
`
81
Aided Design (CAD), Computer Aided Engineering (CAE) should be networked among
the members in the value chain so that they can share the same information.
Nevertheless, the study of Li and Lin (2006) of 196 US companies found that in-
formation sharing is influenced by trust, and a shared vision between the supply chain part-
ners and the top management support. Additionally, the case study of Kulmala et al. (2002)
on cost information management in a Finnish equipment company and its seven suppliers,
found that there was a wide gap between the supplier side quality of cost information and
the customer side expectation. They also argued that a solid networking relationship and a
supply relation between the companies in a network required three important elements in
cost management. First, a company should know its operation cost clearly. Second, a com-
pany should share the cost information with its business partners. Finally, part of the infor-
mation flow should be open to the companies in the network for all the related parties to
understand the current situation. With these three elements, the opportunities for cost reduc-
tion and the consequences of the actions to the profit are clear to all parties. However, this
win-win relationship requires an open-book management and common accepted cost man-
agement practices among the related parties.
In TCM, achievement of the targets needs to be simultaneously attempted in all are-
as from the upstream to downstream processes (Huh et al., 2008). This requires wide range
of information through information sharing. Accordingly, this research proposes that the
organizational information-sharing network is one of the enablers for the successful imple-
mentation of TCM.
Univers
ity of
Mala
ya
`
82
2.4.8.5 Lean manufacturing implementation
Generally, lean manufacturing focuses on the efficient use of capital and operation
assets. The term “lean” is used to represent the system because it accomplishes more output
with less input (Albright & Lam, 2006). Lean manufacturing is also known as the Toyota
Production System (TPS) , a production system that eliminates waste in all activities that do
not create value added but consume resources (Albright & Lam, 2006). In addition, the ap-
plication of soft technologies (Burgess & Gules, 1998), business techniques and Advance
Management Practices (AMP) (Perera, Harrison, & Poole, 1997) are also used to represent
lean manufacturing. JIT, Total Quality Management (TQM), VE and TQC are among the
examples of lean manufacturing techniques (Creese, 2000; Gagne et al., 1995).
Lean manufacturing implementation leads to continuous improvement or “kaizen”
in productivity and quality (Krajewski & Ritzman, 2005). The key concept behind continu-
ous improvement is to understand that the excess inventory and capacity hides the underly-
ing problems in the process. Thus, lean manufacturing is also known as a tool for manage-
ment to expose the problems by systematically lowering inventories and capacities until the
problems are visible (Krajewski & Ritzman, 2005).
JIT is the most popular method of lean manufacturing and is closely related to TCM.
As large inventories and waste are costly, JIT helps to increase the effectiveness of TCM in
terms of producing product at low cost and high quality through its small lot production
concept (Nishimura, 1995, Creese, 2000). In general, JIT has two subsystems – visible
management and new production system. The visible management, also known as the Kan-
ban system, is to detect and correct the problems quickly; while the new production system
Univers
ity of
Mala
ya
`
83
is designed to solve the problems discovered in the process of visible management. Small
lots, zero inventory, multi-skill, horizontal managers and workers' relationship and short
lead-time are examples of the new production system (Nishimura, 1995). Besides JIT, VE
is another lean manufacturing technique that is commonly used in TCM as a tool to achieve
the target cost (Creese, 2000; Gandhinathan et al., 2004). According to Ibusuki and Kamin-
ski (2007), VE and TCM are complementary processes. VE allows the identification of
where the cost reduction could be achieved. Whereas, TCM shows the target cost level to
be achieved to guarantee the long-term profitability of the company.
In summary, lean manufacturing implementation helps the company to proactively
eliminate the non-productive and non-value added activities that result in cost reduction and
profit increment. Accordingly, this research proposes that the implementation of lean man-
ufacturing is one of the enablers for the successful implementation of TCM.
2.4.8.6 Supplier relationship
The total cost of the final product can be reduced if each party in the value chain
cooperates to improve its own operation costs. This small accumulated cost reduction in
each area eventually creates a major cost reduction impact on the final products (Helms et
al., 2005). Since the majority of the part cost comes from the purchased material and com-
ponents, supplier involvement is important in the implementation of TCM (Swenson et al.,
2003; Cooper & Slagmulder, 1999; Kato, 1993). With supplier involvement, the companies
can achieve the target cost by eliminating the waste, excess and uneven job loads along the
value chain (Helms et al., 2005), which helps the company to gain cost competitiveness
against its competitors (Kato, 1993).
Univers
ity of
Mala
ya
`
84
Accordingly, selecting the right supplier is a prerequisite for achieving the target
cost. A bad supplier can have a negative impact while a good supplier can be an asset to the
company (Helms et al., 2005; Cooper & Slagmulder, 1999). Besides cost, other decision
factors, such as suppliers’ reliability, cooperation, ability to produce quality parts, human
resource capability and reputation, need to be examined thoroughly in choosing the suppli-
ers (Cooper & Slagmulder, 1999).
One of the essential elements of the TCM is integrating the suppliers in the product
development process (Feil, Yook, & Kim, 2004). Creese (2000) highlights that joint re-
search and development is important to enhance inter-organizational cost management be-
tween a company and its suppliers. With joint research, technology sharing helps to stimu-
late design innovation, which can lead to cost reduction and enhance the functionality and
quality of the products. The companies are also able to evaluate the overall cost impact of
the product design over the product’s life cycle and take necessary prior action to reduce
costs (Guan et al., 2009). Furthermore, by collaborating with suppliers during the design
stage, companies can obtain their suppliers’ expertise. Suppliers’ knowhow can be incorpo-
rated to reduce the product’s cost without sacrificing the product functionality, such as by
using the standard parts instead of customized parts, improving the design and process, or
using cheaper alternative parts or components (Kaplan & Atkinson, 1998).
Nevertheless, the transfer of innovation power from the company to its suppliers is
unable to be utilized efficiently without a reliable relationship (Kulmala et al., 2002). Addi-
tionally, it is hard to achieve cost reduction objectives without the suppliers’ willingness to
Univers
ity of
Mala
ya
`
85
share initial cost and production data (Helms et al., 2005). An asymmetric power between a
company and its suppliers can cause opportunism behaviour, which increases the behaviour
uncertainty. High supply power due to relying on one supplier and time constraints to find
alternative sources of supply increase the possibility of this opportunistic behaviour (Nor &
Sumormo, 2005). Eventually, this might create a higher cost to the product.
Compared with other countries, Japanese companies have a close relationship with
their supply chain partners. This unique relationship creates strong trust between the sup-
pliers and manufacturers, which has made TCM feasible in Japan (Albright et al., 2006;
Newman & Mckeller, 1995; Kato et al., 1995; Cooper & Slagmulder, 1997; Okano, 2005).
For example, from the product development process, the engineers in the Japanese suppli-
ers study and work together with the manufacturers’ engineers, in which enables them to
share the same “design to cost” awareness and improvement activities. Moreover, the Japa-
nese suppliers are even capable of doing major design and proactively approaching the
manufacturers for approval. Thus, even though the manufacturers do not have the suppliers
cost data, the manufacturers can enjoy cost reductions proposed by the suppliers (Okano,
2005). At the same time, Japanese companies even suggest the cost reduction ideas to their
suppliers and act as a consultant to their suppliers rather than treat them as business rivals
(Kato et al., 1995).
The interactive relationship with suppliers is very important for the implementation
of TCM. Accordingly, this research proposes that the supplier relationship is one of the en-
ablers for the successful implementation of TCM.
Univers
ity of
Mala
ya

`
86
2.4.8.7 Organization culture
According to Hostede (1984), culture is “collective programming of the mind which
distinguishes the members of one category of people from those of another” (Hofstede,
1984, p. 389). Organizational culture is a pattern of shared beliefs and value systems that
assist employees to understand the organization’s role, which eventually shapes their work-
ing behaviour (Despande & Webster, 1989). Unlike the national level culture, which is very
unlikely and slow to change, the organizational culture is likely to change consciously
(Hostede, 1993). Barney (1986) suggests that organizational culture is shaped over time and
affects the types and variance of organizational processes and behaviours. It can be a source
of competitive advantage if it rare, valuable and inimitable (Barney, 1986)
Hostede (1984) suggests four cultural dimensions – power distance, individualism,
masculinity and uncertainty avoidance. These cultural dimensions reflect the characteristics
of the society in terms of the organization and the national culture. Power distance and un-
certainty avoidance represent the organizational culture that relates to the functioning of the
organization within a nation. For example, Asian countries have high power distance with
only a few top managers having strong decision-making at all levels of management. On
the other hand, Western countries with low power distance have diversified and decentral-
ized decision-making. Individualism and masculinity represent the national culture, which
is relatively independent of the functioning of the company but related to the functioning of
individuals within the company. For example, in an individualistic society, the society
clearly separates the family and the company. However, in a collectivist society, such as the
Asian society, the society does not separate the family and the company (Hostede, 1984).
Univers
ity of
Mala
ya

`
87
Accordingly, the interaction between the national and organizational culture differ-
entiate the cultural features of management accounting in each country (Nishimura, 1995).
For example, a society with high power distance naturally accepts the power inequalities,
the powerful people have the right or responsibility to command, and the status quo of
powerful peoples’ privileges. A society with less individualism is tightly integrated and has
a high tendency to give priority to the group rather than their own personal goal. A society
with low masculinity gives high value to personal relationships, supportiveness, modesty in
achievement and non-material values such as quality of life. On the other hand, a society
with strong uncertainty avoidance is aggressive, active, security seeking emotionality, and
intolerance (Hosfstede, 1984). For example, according to Hostede’s cultural index, Japan
belongs to the low individualism dimension, which reflects a collectivist society (Hostede,
1986). Accordingly, Okano and Suzuki (2007) advocate that the collectivism in Japan gen-
erates the collective objective and actions in the development of the Japanese management
accounting. The objective of the management accounting development is for larger groups
of companies, industries and Japanese society as a whole and not for the individual compa-
nies. These collective actions involve public learning, industry associations, companies and
the Japanese government.
In TCM practices, it is not possible to achieve a rigorous cost reduction without full
cooperation from the related departments (Feil, Yook, & Kim, 2004). Thus, multidiscipli-
nary cooperation is essential to stimulate multidisciplinary ideas resulting from the different
working backgrounds, knowledge and experience of individuals. With multidisciplinary
cooperation, a holistic approach to the cost reduction process can be conducted (Helms et
Univers
ity of
Mala
ya

`
88
al., 2005; Cooper & Slagmulder, 1999). Cross-functional is an example of multidisciplinary
cooperation.
Most of the companies in the Japanese automotive industry practice cross-functional
team with the TCM office consisting of team members from all the related departments
mainly from development, design, production technology and purchasing (Tani et al., 1994).
Thus, scholars posit that cross-functional team is one of the key principles of TCM imple-
mentation (Swenson et al., 2003; Huh et al., 2008). In Japan, Cross Functional Management
(CFM) is widely implemented to enhance the vertical and horizontal relationships and to
counter the communication barriers due to sectionalism. The word “function” in CFM does
not mean “department” but it covers the critical factors in management like cost, quality,
reliability, delivery and overseas. It promotes the important factors in the management of
the company like quality function, cost function and overseas function by cross-sectional
coordination within the organization. CFM involves setting up cross-functional committees
relating to functional issues to control and improve these functions within each department.
The objective is to address problems that are related to the horizontal organization that can-
not be solved by single departments within a vertical organization (Okano, 2005). Further-
more, horizontal and vertical interactions create interactive control, which helps the simul-
taneous engineering effectiveness at Japanese companies (Tani, 1995). Additionally, the
cross-functional discipline helps to control the group from imposing functional preferences,
which have no value added to the customer but yet increase the cost (Drury, 2004). Cross-
functional teams also help to integrate the information from across the organization and en-
courage information and value sharing among managers. This improves the organization’s
Univers
ity of
Mala
ya

`
89
functions of information acquisition, distribution and interpretation, which, eventually,
promote and facilitate effective organizational learning (Choe, 2002).
In summary, TCM implementation requires the total involvement and cooperation
of all employees throughout the organization (Monden & Hamada, 1991; Sakurai, 1989).
Multidisciplinary cooperation generates holistic ideas for waste elimination along the value
chain. This eventually helps to the company to meet its target cost. Thus, this research pro-
poses a teamwork orientation culture is one of the enablers for the successful implementa-
tion of TCM.
2.4.8.8 Top management support and commitment
A study made by the Malaysian Institute of Management (MIM) on Malaysian
Managerial Values, Expectation and Practices in 1991 showed that the 10 strongest values
of Malaysian managers are (1) Malaysians prefer working with leaders who have clear
goals; (2) cooperation among colleagues contributes to a better quality of life; (3) Malaysi-
an managers value decisiveness, (4) Malaysian managers value commitment from their
subordinates; (5) Malaysian managers value high achievers; (6) managers need to be ac-
countable for their actions; (7) effective managers share wisdom and experience; (8) re-
wards based performance is valued rather than seniority; (9) managers must make continu-
ous improvement; and (10) meeting deadlines is important (Abdullah et al., 1999). The
above result shows that Malaysians highly value leaders with clear direction. This might be
related to the nature of Malaysian society itself. According to Hostede’s cultural index, Ma-
laysia belongs to the high power distance dimension (Hostede, 1986). High power distance
societies naturally accept the right or responsibility of powerful people to command
Univers
ity of
Mala
ya
`
90
(Hostede, 1984). Thus, top management plays a significant role in pulling the Malaysian
workforce in the company’s direction.
In successful TCM companies, the top management play an important role in the
implementation of TCM. Among the roles of the top management in TCM implementation
are: (1) aligning the mindset of the employees towards the company direction for the suc-
cessful implementation of TCM, (2) creating awareness of TCM, (3) fostering the team-
orientation in TCM implementation, and (4) supporting the necessary resources for the
TCM team to achieve the goals (Feil, Yook, & Kim, 2004). Additionally, Yamashita (2000)
argues that cultural change within an organization initiated by the top management can cre-
ate an environment for accepting changes and making continuous improvement. For exam-
ple, regarding cultivating a VE culture, Daihatsu’s management play a significant role in
establishing the “Cost reduction formal suggestion system”. Through this system, employ-
ees are encouraged to give ideas for reducing the standard cost and improving the operation
methods by submitting their VE ideas for official implementation (Lee & Monden, 1996).
Based on the above arguments, this research proposes that top management support
and commitment is one of the enablers for the successful implementation of TCM.
2.4.8.9 Training
Human capital development is the most important factor to develop a nation. Ma-
laysia recognizes that human capital development is the most vital factor for Malaysia to
become a fully industrialised nation by 2020 (Sadoi, 1998). In order to develop competent
workers, the companies must train their employees (Mathis & Jackson, 2004). There are
Univers
ity of
Mala
ya
`
91
two types of training – internal training and external training. Internal training is conducted
within companies’ premises, and relates to the specific aspects of the job, such as technical
training and skill based related training. There are three common types of internal training –
formal training programmes, informal training and On Job Training (OJT). Unlike formal
training, which is formal and organized, the informal training occurs through spontaneous,
informal feedback and interaction among employees. Many employees learn their jobs in-
formally by asking and getting advice from their colleagues and superiors rather than
through formal training programmes. Among all the internal training types, OJT is the most
common training because it is less spontaneous, flexible and relates to the employees’ tasks.
On the other hand, external training is conducted outside the company’s premises. Among
the reasons as to why companies choose external training is that the cost is less expensive
compared to conducting internal training, the time constraints in developing internal train-
ing modules and lack of internal expertise (Mathis & Jackson, 2004).
Studies suggest that the best TCM team members are those who have been rotated
through several departments and have broad experience in the companies' operation. With
broad experience, TCM team members are capable of spotting and implementing ways to
reduce costs (Helms et al., 2005; Cooper & Slagmulder, 1999; Gagne, 1995). Accordingly,
Ansari et al. (2006) contend that for companies that have recently adopted TCM, the train-
ing programmes should focus on helping building awareness and acceptance of the TCM,
facilitate communication about TCM and increase the capability of its members. Such
training should involve the senior management who lead the TCM, the product teams who
are responsible for implementing TCM, the functional teams who support the product
Univers
ity of
Mala
ya

`
92
teams with data and analysis, and the main suppliers who are brought in as product team
members.
In summary, training helps to increase the know-how of TCM practices among em-
ployees. As the knowledge increases, the capability to implement TCM also increases. Ac-
cordingly, this research proposes that training is one of the important enablers for success-
ful implementation of TCM.
2.5 Summary
This chapter discussed the significant and dynamic background of the automotive
industry in Malaysia. It also discussed the development of the management accounting,
which leads to TCM. Then, it further discussed in detail what had been debated in the lit-
erature concerning the TCM concept, development history, definitions, objectives, charac-
teristics, engineering tools and process. Finally, the chapter highlighted the background
literature of the proposed enablers that are necessary for the successful implementation of
TCM. The detailed propositions of these enablers will be explained in Chapter 3.
The TCM related literature can be summarized under five main points. First, the key
difference between the traditional costing method and TCM is the timing and price-setting
sources of information. In the traditional costing method, the price is only set after the
product has been designed and the product has been manufactured based on the total in-
curred cost and desired profit. While TCM is price led, in which the price is set by the mar-
ket before the product is designed (Helms et al., 2005). Second, the traditional cost man-
agement techniques are not suitable for the current business environment. Problems, such
Univers
ity of
Mala
ya
`
93
as financial information focus, short-term focus, and out dated data, are likely to mislead
the management into making wrong decisions in pricing their products. TCM, one of SMA
methods, is able to counter these problems by providing timely, relevant, financial and non-
financial information related to the markets and the competitors (Drury & Tales, 1994;
Kaplan 1983; Gopalakrisnan et al., 2007; Wickramasinghe & Alawattage, 2007). Third,
although the literature has demonstrated the benefits and importance of TCM, many coun-
tries are still lagging behind in its implementation (Nishimura, 2005a; Nishimura, 2005b).
Fourth, there are varieties of definitions, characteristics, objectives, processes and enablers
of TCM highlighted by previous studies. The broadness of perspectives shows that TCM is
not developed from established theory but gradually from practical applications (Feil, Yook,
& Kim, 2004). Fifth, there are many enablers necessary for the TCM practices that have
been highlighted by previous literature. However, most of the enablers are not empirically
proven.
Therefore, this research focuses on providing evidence concerning the TCM prac-
tices in a Malaysia, how different it is from the original Japanese theoretical model, what
causes the differences and what enablers positively associated with the successful imple-
mentation of TCM implementation in the context of a typical Malaysian automotive com-
pany. The application of these approaches will be discussed further in Chapter 4 to Chapter
7.
The following chapter explains the development of the conceptual and theoretical
frameworks used in this research. The conceptual framework will be used to guide the qual-
Univers
ity of
Mala
ya

`
94
itative data collection for the TCM implementation process. The theoretical framework will
be used to guide the quantitative data collection for the TCM enablers.
Univers
ity of
Mala
ya
`
95
CHAPTER 3: CONCEPTUAL AND THEORETICAL FRAMEWORKS
3.1 Introduction
This chapter discusses the theories, and the development of the conceptual and theo-
retical frameworks used in this case study research. This research uses the case study meth-
od because it is the most appropriate method to answer how TCM is implemented, why
there are differences in TCM practices and what are key enablers that positively associated
with the successful implementation of TCM in a typical Malaysian automotive company
context (Yin, 2003). To answer the research questions, two frameworks are developed
which are the conceptual framework and the theoretical framework. The conceptual frame-
work is used as a guideline for examining for relevant evidence and reflecting important
issues concerning the implementation process of TCM (Yin, 2003), while the theoretical
framework is used as a guideline for looking for evidence concerning the key enablers that
have positive association with the successful implementation of TCM (Yin, 2003).
The first section of this chapter discusses two fundamental theories used in this re-
search, which are the contingency (Otley, 1980) and dynamic capabilities theories (Eisen-
hardt & Martin, 2000; Teece et al., 1997). By using these theories, the researcher aims to
develop a comprehensive understanding of differences in the TCM implementation process
and how a company adapts the contextual constraints by utilizing the available resources.
The following section discusses the development of the conceptual framework for the TCM
implementation process. The conceptual framework is based on several case studies on a
few Japanese automotive companies in Japan made by previous scholars. It is used as a
guideline to understand the TCM implementation process in the case company. Subse-
quently, the third section of this chapter proposes the theoretical framework for TCM ena-
Univers
ity of
Mala
ya
`
96
blers. Based on the literature analysis, this section justifies the propositions used in this
research. Here, nine enablers: Advanced Manufacturing Technology (AMT) implementa-
tion, confrontational strategy, a customer orientation, an information-sharing network, lean
manufacturing implementation, supplier relationships, a teamwork oriented organizational
culture, top management support and commitment, and training are proposed as the ena-
blers that have a positive association with the successful implementation of TCM. This
section also discusses the dimensions of the successful implementation of TCM used in this
study, which are cost reduction, design efficiency and marketability.
3.2 Theories
Generally, there is a lack of research dealing with the theoretical aspects of TCM
(Huh et al., 2008). This study attempts to link the conceptual foundation of TCM with the
contingency theory and dynamic capabilities theory. Specifically, the contingency theory is
used to support the whole study in terms of assuming that there are differences of TCM
practice in the case company compared with the Japanese TCM theoretical model. Contin-
gency theory is also used to explain the key enablers that positively associated with the
successful implementation of TCM. On the other hand, the dynamic capabilities theory is
used to explain that despite of internal and external enabling and inhibiting factors, the or-
ganization has the capabilities to adapt, integrate, reconfiguring its resources to meet the
company objectives.
3.2.1 Contingency theory
Contingency theory suggests there is no one universal best design of management
accounting systems that is applicable to all companies in all situations, and that it all de-
Univers
ity of
Mala
ya
`
97
pends on the specific situational factors of that particular company itself (Otley, 1980; Gor-
don & Miller, 1976; Fisher, 1998). The situational factors must fit together if the organiza-
tion is to perform well (Drazin & Van de Van, 1985). Accordingly, Otley (1980) posits that
the “contingency theory must identify specific aspects of an accounting system which are
associated with certain defined circumstances and demonstrate an appropriate matching”
(Otley, 1980, p. 413). Fisher (1998) posits that the contingency theory approach is situated
between the two extremes of the universal control approach and the situation specific ap-
proach. The universal control approach is based on specific management principles that
suggest that in order to maximize efficiency, there is only one best way to design the opera-
tional processes. Whereas, the situation specific approach implies that general rules and
modes cannot be applied because the factors that affect each control system are unique
(Fisher, 1998).
According to the contingency theory, the contingent factors, also known as situa-
tional factors, influence the design of management accounting information systems. Con-
tingency theorists claim that the main contingent factors are the environment, technology,
size and structure. The environment consists of the market and its related factors, such as
product, price and competition. Technology means the production method adopted by the
company. Size refers to the size of the company in terms of the number of employees and
the total value of assets. Structure refers to the formation of certain associations between
people and specific objectives and tasks. Besides these main contingent factors, scholars
also highlight strategy, ownership, power and age as important contingent factors (Wick-
ramasinghe & Alawattage, 2007). Because of the wide range of contingent factors, Fisher
(1998) summarizes the contingent factors into five categories: (1) contingent factors that
Univers
ity of
Mala
ya
`
98
are related to uncertainty, such as task and external environment; (2) contingent factors that
are related to firm technology and interdependence among a company’s subunits; (3) con-
tingent factors that are related to industry, firm and business unit variables; (4) contingent
factors that are related to a company’s competitive strategy and mission; and (5) contingent
factors that are related to observability factors that are observable by the evaluator in terms
of the behaviour or action of the employee or the outcome of those actions. Additionally,
Drury and Tayles (1995) posit there are four factors that may influence the sophistication of
the product costing design: (1) the degree of the competition faced by the company, (2) the
diversity of the product produced by the company, (3) the number of the product manufac-
tured by the company, and (4) the proportion of the overhead cost that cannot be allocated
directly to the products (Drury & Tayles, 1995).
Since the contingent factors or specific enablers influence the management account-
ing system, the suitability of contingent factors and the management accounting system af-
fect the organizational performance (Drury, 2004; Drazin & Van de Van, 1985). Drury
(2004, p. 696) emphasizes that, “The organizations that achieve a fit between the contingent
variables of the management accounting information system design achieve enhanced per-
formance”. The contingency theory posits that all elements in the organization must “fit”
well with one another for it to perform optimally. Hence, as the political, economic, social
and cultural environments are different for companies that operate in different settings, the
accounting information system should be designed in a flexible manner. Accordingly, it is
inappropriate to simply apply any new management accounting system to the foreign set-
ting without an adaptive framework (Drury, 2004).
Univers
ity of
Mala
ya
`
99
As a rule of thumb of contingency theory, a sophisticated SMA system is not auto-
matically associated with the superior performance rather superior performance is a product
of an appropriate fit between the identified contingent factors and a management account-
ing system (Simon, 2007). In addition, Kaplan (1984) posits that the management account-
ing must serve the strategic goals of the organization. It cannot be applied universally to all
companies without considering the underlying values, goals and strategies of particular
companies. In terms of TCM adoption, Kato et al. (1995) also posit that a company cannot
simply “plug in” the TCM into its system but that it requires the company to have a holistic
understanding of its business process before adopting TCM.
In summary, the contingency theory posits three important elements. First, the de-
sign of the management accounting system depends on the specific situational factors of
that particular company itself. Second, the situational factors influence the design of man-
agement accounting information systems. Third, the suitability of situational factors and the
management accounting system affect the organizational performance. Accordingly, in this
study, the contingency theory is used as the main theory to explain there are differences of
TCM practices between the case company and the Japanese companies, the situational fac-
tors influence the TCM practices at the case company, and there are specific situational fac-
tors that influence the successful implementation of TCM at the case company.
3.2.2 Dynamic capabilities theory
In the current rapidly changing environment, companies must possess competitive
advantage (Porter, 1985). The sources of competitive advantage can be categorized into
three main paradigms – competitive forces approach, strategic conflict approach and effi-
Univers
ity of
Mala
ya

`
100
ciency based approach. The competitive forces approach focuses on the actions a company
can take to create defensible positions against its competitive forces to gain competitive
advantage. The strategic conflict approach focuses on the effectiveness of the companies to
keep their competitors off balance through pricing strategies and control of information and
et cetera. Generally, the competitive forces and strategic conflict approaches focus on the
product market position as the source of competitive advantage. On the other hand, the effi-
ciency based approach focuses on the company level efficiency and effectiveness as a
source of competitive advantage (Teese et al., 1997). The resource-based theory, one com-
ponent of the efficiency approach, suggests that sustainable competitive advantage can be
gained if the companies have valuable, rare, inimitable and non-substitutable resources. Re-
sources are assets or inputs to production, whether tangible or intangible, that are difficult
to imitate that the company owns, controls and has access to (Teece et al., 1997; Helfat &
Peteraf, 2003). However, the resource-based theory is inadequate for explaining what re-
sources contribute to competitive advantage, and how and why a particular company is able
to achieve and sustain competitive advantage in the fast changing market (Eisenhardt &
Martin, 2000; Teese et al., 1997).
Dynamic capabilities theory is an extension of the resource-based theory
(Eisenhardt & Martin, 2000). It supports the resource based theory in explaining how valu-
able, rare, inimitable and non-substitutable resources can be created and how the current
pattern of activities of valuable resources in the companies can be changed over time in
changing environments (Ambrosini & Bowman, 2009). Teece et al., (1997) define dynamic
capabilities as “ the capacity to renew competences so as to achieve congruence with the
changing business environment” by “ adapting, integrating, and reconfiguring internal and
Univers
ity of
Mala
ya
`
101
external organization skills, resources, and functional competences” (Teece et al., 1997, p.
516). Generally, the dynamic capabilities perspective focuses on the capacity of an organi-
zation in a dynamic market to develop its external and internal competence through creat-
ing new resources, and renewing or altering its resource mix as a source of competitive ad-
vantage with the top management team and the evolution of organizational support (Teece
et al., 1997; Ambrosini & Bowman, 2009). In other words, the role of dynamic capabilities
is to influence the company’s existing resource base and transform it to new resources so
that that company can enhance or sustain its competitive advantage (Ambrosini & Bowman,
2009)
Eisenhardt and Martin (2000) argue that even though the dynamic capabilities can
be duplicated by other firms, the value of competitive advantage lies in the resource con-
figurations that managers build using the dynamic capabilities, and not the capabilities
themselves. This is because the dynamic capabilities are unique and distinctive processes
that develop from the path-dependent histories of individual companies. Hence, they must
be built. Any partial replication or imitation of a successful model may result in zero bene-
fits (Teece et al., 1997).
Dynamic capabilities cover specific strategies and organizational processes, such as
product development that create value for the company under a dynamic market by exploit-
ing resources into value-creating strategies (Eisenhardt & Martin, 2000). The value crea-
tion exists when the company exceeds its competitors’ ability in fulfilling the customer
needs while maintaining or improving their profit value. This value creation can be opti-
mized by synchronizing the processes in and between each resource management compo-
Univers
ity of
Mala
ya
`
102
nent. Accordingly, the amount of value the companies create and maintain depend on how
the resources are managed effectively and efficiently within the company’s environmental
context (Sirmon, Hitt, & Ireland, 2007).
Teese et al. (1997) suggest that the competitive advantage of the companies lies
with its managerial and organizational processes which are shaped by the companies’ paths
and positions. Company’s managerial and organizational processes refer to the way things
are conducted in the company, also known as routines, such as systems integration. Posi-
tions can be classified into two types: internal and external position. The internal position
refers company’s assets such as company’s technology, intellectual property and financial.
The external position refers to company relation with its markets and institutional environ-
ment such as supplier relations. Paths are the strategic alternatives available to the compa-
nies in which the company’s past and present guide and limit its future. Accordingly, paths
and positions are the forces that enabling and constraining the dynamic capabilities (Teese
et al., 1997; Ambrosini & Bowman, 2008).
Similarly, Zollo and Winter (2002) posit that the dynamic capabilities represent the
company’s systematic methods for generating and adapting operating routines. Operating
routines are organizational activities geared towards the operational function of the compa-
ny. They posit that the dynamic capabilities are shaped by the coevolution of three mecha-
nisms: (1) tacit accumulation of past experience, (2) explicit knowledge articulation, and (3)
knowledge codification processes. Tacit accumulation of past experience refers to the cen-
tral learning process by which operating routines have been thought to develop. Explicit
knowledge articulation refers to organization members’ collective effort to share and ex-
Univers
ity of
Mala
ya
`
103
change knowledge in which resulted better understanding of causals mechanisms interven-
ing between actions and performance outcomes. Knowledge codification processes refers to
organization members codify their understandings of the performance implication of inter-
nal routines in written tools, such as spreadsheets, manuals, and et cetera, for future tasks
guidelines.
In terms of the relationship between organizational processes and capability, Day
(1994) posits that they are closely related intertwined because it is capability that makes the
business processes to be conducted. Capabilities are defined as bundles of routines or pat-
tern of activities, skills and accumulated knowledge (Peng et al., 2008; Day, 1994). There
are three categories of capabilities: (1) inside-out, (2) outside-in, and (3) spanning capabili-
ties. Inside-out capabilities are the capabilities that deployed from the inside out and acti-
vated by competitive challenges, external opportunities and market requirements such as
cost control and financial management. Outside-in capabilities are exclusively focus out-
side the organization. They connect the organizational processes to external environment by
anticipating customer requirements and creating strong value chain relationships. Spanning
capabilities are the capabilities that integrate the inside-out and outside-in capabilities such
as new product development capabilities and pricing activities (Day, 1994). Day (1994)
posits that management systems and culture unifies the organizational capabilities into a
cohesive whole.
A survey study conducted by Peng et al. (2008) of 189 manufacturing companies in
six countries found that in terms of plant level capabilities, innovation and improvement
capabilities are the most critical source of operational capabilities. Improvement capabili-
Univers
ity of
Mala
ya
`
104
ties consist of continuous improvement, process management and leadership involvement
routines. Innovation capabilities consist of new technology, processes and equipment de-
velopment and cross-functional product development routines. These capabilities consist of
distinctive yet interrelated sets of routines, which are significantly related to the operational
performance (Peng, Schroeder, & Shah, 2008).
On the other hand, a survey study on the relationship between TCM success factors
and performance by Huh et al. (2008) in 880 companies at Japan found that the Japanese
companies manage to implement TCM successfully because they have dynamic capabilities
such as architectural and process capabilities. These capabilities allow them to have a com-
petitive advantage over Western companies. Architectural capabilities consist of top man-
agement support, empowered project manager, concurrent engineering, cross-functional
team and linkage to profit planning. Process capabilities consist of cooperation with other
departments, information sharing, transfer of experience, employee empowerment and del-
egation or authority. On the other hand, Huh et al. (2008) also found that even though local
capabilities are necessary, these capabilities are not regarded as the success factor of TCM
practices by the Japanese companies. Local capabilities consist of tools and information
system, knowledge about cost, new technology and material from R&D, technology in pro-
duction and quality, cost estimation capability and functional knowledge of team members.
Accordingly, Huh et al. (2008) conclude that the software of TCM, such as dynamic capa-
bilities, is more important than the hardware of TCM, such as tools and techniques, for suc-
cess implementation of TCM (Huh, Yook, & Kim, 2008).
Univers
ity of
Mala
ya
`
105
In summary, the dynamic capabilities theory explains that the companies have the
ability to adapt, integrate and reconfigure its resources to achieve competitiveness. Never-
theless, the competitive advantages of the companies depend on the routines which are
shaped by the companies’ paths and positions. Since TCM activities involve companywide,
require various types of information from all levels of organization including suppliers, and
integrate all systems, TCM can be considered as bundle of routines or capabilities (Day,
1994; Teese et al., 1997). Thus, it is expected that the factors related to paths and the posi-
tions of the company shape the TCM practices. In addition, in terms of TCM implementa-
tion, one can expect that even though there are enabling and inhibiting factors outside and
inside the companies, the companies have the capabilities to adapt, integrate and reconfig-
ure it resources to achieve the companies’ objectives. By adapting, integrating and recon-
figure the companies’ resources, the companies can fit together their resources with their
contextual environment for the organization to perform well. Accordingly, in this study, the
dynamic capabilities theory will be used as the underpinning theory explaining how the
case company come to have the TCM practice it has and the possible causes of the TCM
differences.
3.3 Target Cost Management (TCM)
According to contingency theory perspective, the implementation of any new man-
agement accounting system needs to adapt with its environment. This adaptation makes
any management accounting different from companies to companies (Drury, 2004). Never-
theless, Cooper and Slagmulder (1999), in their study of TCM practices in seven Japanese
companies, conclude that even though each company has different practices, the common
characteristics of TCM implementation process are the same. Accordingly, this research
assumes that the TCM case studies conducted in Japanese companies in Japan should have
Univers
ity of
Mala
ya
`
106
similar characteristics of TCM implementation process. Based on the case studies of Japa-
nese automotive companies in Japan: Lee and Monden (1996) in Daihatsu; Okano (2005) in
two automotive Japanese companies – Toyota, Nissan, and one electronic company-
Mastushita; Monden and Hamada (1991) in several anonymous Japanese automotive com-
panies; Cooper and Slagmulder (1999) in seven Japanese companies including four auto-
motive companies – Toyota, Isuzu, Nissan, Komatsu; and Kato et al. (1995) in Daihatsu,
the conceptual framework is developed as the case study guidelines.
In this research, the TCM implementation process explanation is classified into
four major stages - Plan, Do, Check, Action (PDCA). The objective is to make the explana-
tion more understandable to the readers. This PDCA is based on the International Organiza-
tion for Standardization (ISO) 9001: Quality Management Standard. The definition of each
PDCA cycle stage under ISO 9001 is: (1) Plan is to establish the objectives and processes
necessary to deliver results in accordance with customer requirements and the company's
policies, (2) Do is to implement the process, (3) Check is to monitor and measure processes
and products against policies, objectives and requirements for the product, and report the
results, and (4) Act is to take the actions to continually improve the process (Gupta, 2006).
The PDCA cycle is used to categorize the TCM implementation process because it is a
world quality standard requirement and widely known by all industries. Historically, the
PDCA cycle concept was originated by Walter A. Shewhart, known as the Shewhart cycle.
Then, it was further developed and enhanced by W. Edwards Deming and Kaoru Ishikawa,
which was popularly known as the Deming PDCA Cycle (Moen & Norman, 2010). Finally,
this cycle was modified and used as the basis of the ISO 9001 requirement (Gupta, 2006).
Univers
ity of
Mala
ya
`
107
Table 3-1 summarizes the previous case studies findings on the TCM implementa-
tion process under each PDCA stage. There are four main TCM steps under the Plan stage:
(1) target-selling price setting, (2) target profit setting, (3) target cost setting, and (4) profit-
ability feasibility study making. The TCM step under the Do stage is achieving the target
cost. The TCM step under the Check stage is monitoring and reporting the achievement
status. Finally, the TCM step under the Act stage is cost improvement implementation. For
each item, the number in brackets indicates the source of the findings of the previous case
studies. The following sub-sections will explain each stage and step of the TCM implemen-
tation process in detail.
Univers
ity of
Mala
ya
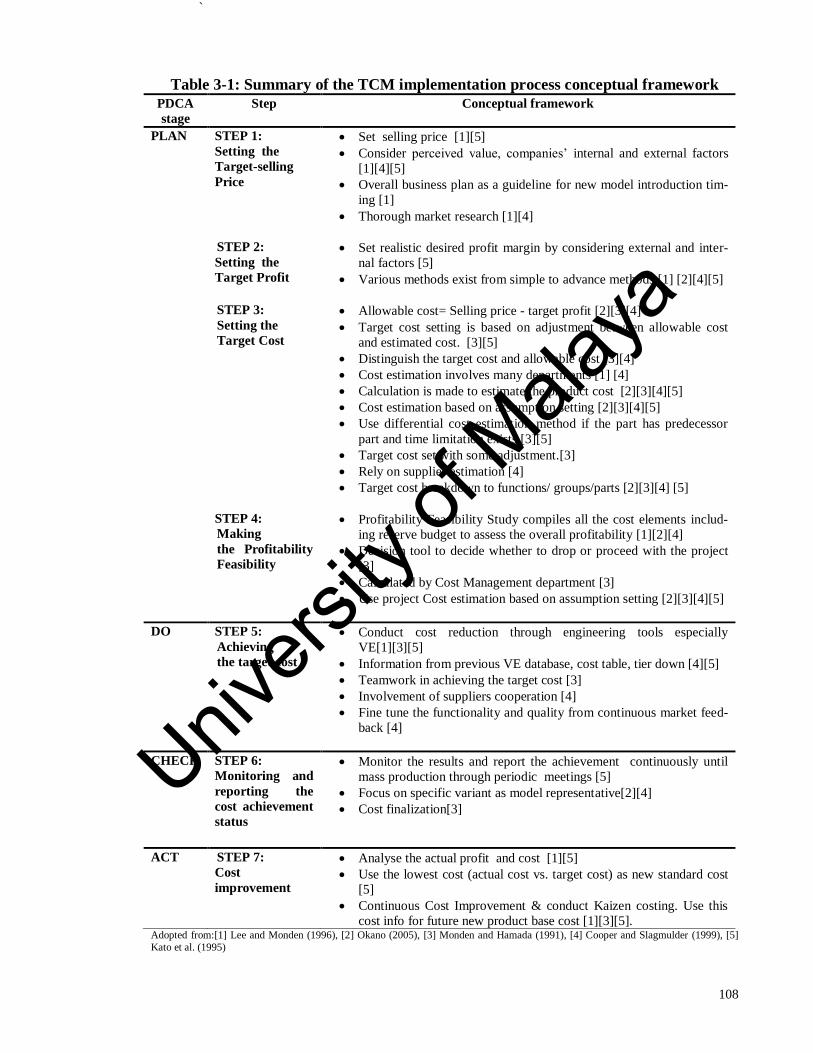
`
108
Table 3-1: Summary of the TCM implementation process conceptual framework
PDCA
stage
Step Conceptual framework
PLAN STEP 1:
Setting the
Target-selling
Price
Set selling price [1][5]
Consider perceived value, companies’ internal and external factors
[1][4][5]
Overall business plan as a guideline for new model introduction tim-
ing [1]
Thorough market research [1][4]
STEP 2:
Setting the
Target Profit
Set realistic desired profit margin by considering external and inter-
nal factors [5]
Various methods exist from simple to advance methods [1] [2][4][5]
STEP 3:
Setting the
Target Cost
Allowable cost= Selling price - target profit [2][3][4]
Target cost setting is based on adjustment between allowable cost
and estimated cost. [3][5]
Distinguish the target cost and allowable cost [3][4]
Cost estimation involves many departments [1] [4]
Calculation is made to estimate the product cost [2][3][4][5]
Cost estimation based on assumption setting [2][3][4][5]
Use differential cost estimation method if the part has predecessor
part and time limitation exists [3][5]
Target cost set with some adjustment.[3]
Rely on supplier estimation [4]
Target cost breakdown to functions/ groups/parts [2][3][4] [5]
STEP 4:
Making
the Profitability
Feasibility
Profitability Feasibility Study compiles all the cost elements includ-
ing reserve budget to assess the overall profitability [1][2][4]
Decision tool to decide whether to drop or proceed with the project
[3]
Calculated by Cost Management department [3]
Use project Cost estimation based on assumption setting [2][3][4][5]
DO STEP 5:
Achieving
the target cost
Conduct cost reduction through engineering tools especially
VE[1][3][5]
Information from previous VE database, cost table, tier down [4][5]
Teamwork in achieving the target cost [3]
Involvement of suppliers cooperation [4]
Fine tune the functionality and quality from continuous market feed-
back [4]
CHECK STEP 6:
Monitoring and
reporting the
cost achievement
status
Monitor the results and report the achievement continuously until
mass production through periodic meetings [5]
Focus on specific variant as model representative[2][4]
Cost finalization[3]
ACT STEP 7:
Cost
improvement
Analyse the actual profit and cost [1][5]
Use the lowest cost (actual cost vs. target cost) as new standard cost
[5]
Continuous Cost Improvement & conduct Kaizen costing. Use this
cost info for future new product base cost [1][3][5]. Adopted from:[1] Lee and Monden (1996), [2] Okano (2005), [3] Monden and Hamada (1991), [4] Cooper and Slagmulder (1999), [5]
Kato et al. (1995)
Univers
ity of
Mala
ya
`
109
3.3.1 Plan stage
There are four TCM steps under the Plan stage, which are: (1) target-selling price
setting, (2) target profit setting, (3) target cost setting, and (4) profitability feasibility study.
These steps mainly focus on establishing the TCM targets.
3.3.1.1 Step 1: Setting the target-selling price
The introduction of the new product development is based on the overall corporate
planning, which indicates when and how often the new products would be developed and
when the products would be changed and modified (Lee & Monden, 1996). However, be-
fore any new product development starts, Japanese companies conduct a thorough market
research (Lee & Monden, 1996). This is to grasp “what the customer wants and what price
they are prepared to pay” (Cooper & Slagmulder, 1999, p.24). From this market research,
the Japanese companies identify the types of new product to be developed and the contents
of model changes. Then, a product-planning proposal is presented to the top management to
get approval to proceed with the basic product planning of the new product (Cooper &
Slagmulder, 1999).
Japanese companies consider the companies’ internal and external factors in order
to set a realistic target-selling price. Among the internal and external factors are product
matrix, top management strategy and profitability objectives, corporate image, product at-
tributes and functionality, product concept, product life cycle, expected sales quantity,
forecast market share, price of competitors’ products, and competitors’ reaction (Cooper &
Slagmulder, 1999; Kato et al., 1995). Nevertheless, Copper and Slagmulder (1999) high-
light that the price setting process in Japanese companies is based on the concept of per-
Univers
ity of
Mala
ya
`
110
ceived value. Japanese companies add the additional functions from the previous model to
increase the perceived value. If the product has a predecessor, the selling price is higher if
only the perceived value is higher (Cooper & Slagmulder, 1999). For example, at Daihatsu,
the target-selling price is set by the product planning office based on market research meth-
ods using functional basis pricing (Kato et al., 1995).
3.3.1.2 Step 2: Setting the target profit
The target profit is set prior to the target cost setting (Kato et al., 1995). In setting
the target profit, the Japanese companies consider two important elements, which are the
target profit must be realistic and the target profit must be able to offset the product life cy-
cle cost (Cooper & Slagmulder, 1999).
Studies (Lee & Monden, 1996; Cooper & Slagmulder, 1999; Kato et al., 1995;
Okano, 2005) show that there are many ways, both simple and advance, to set the target
profit. According to Cooper and Slagmulder (1999), the Japanese companies set the target
profit by referring to the actual profit margin of the predecessor product and make some
adjustment to cater to the market condition changes. For example, Nissan uses this ap-
proach and uses the computer simulation to find the relationship between the profit and
selling price (Cooper & Slagmulder, 1999). However, some studies (Kato et al., 1995;
Monden & Hamada, 1991; Lee & Monden, 1996; Okano, 2005) highlight more complex
methods for target profit setting. Okano (2005) claims that Toyota sets its new product tar-
get profit setting based on the vehicle type target profit guidelines. These target profit
guidelines are based on the company’s mid-term and long-term target profit goal. Addition-
Univers
ity of
Mala
ya
`
111
ally, current relevant products’ operating profit and marginal profit are also considered in
setting the new product target profit (Okano, 2005).
On the other hand, Kato et al. (1995) highlights that Daihatsu sets its new product
target profit based on the target profit for the total product portfolio. This total target profit
is derived from the mid-term and long-term profit planning, which reflect a three to five-
year period of the company’s business strategies. From here, the total target profit is de-
composed into business product portfolios, which will be introduced in a particular period.
This profit allocation process consumes many hours of discussion before being finalized by
the top management. Once approved, Daihatsu will not reduce the target profit even in the
event of the introduction of unexpected competitors’ products during the product develop-
ment, which requires additional specification to counter the market. Instead, Daihatsu will
increase the sales price or sales volume, or reduce other costs to ensure the target profit is
achievable (Kato et al., 1995). This method of target profit setting helps to integrate the
company’s profit plan and product planning (Kato et al., 1995; Lee & Monden, 1996;
Monden & Hamada, 1991). This is because, in Japanese companies, the mid-term plan is
considered as an agreed commitment, which all the employees have to commit to achieve
(Kato et al., 1995). Furthermore, the linkage of the product target profit with the company
profit planning helps to make the employees understand that the final objective of TCM is
to achieve the company profit (Monden & Hamada, 1991).
Univers
ity of
Mala
ya
`
112
3.3.1.3 Step 3: Setting the target cost
i) Setting the target cost
In general, the total target cost can be derived by subtracting the target profit from
the target-selling price (Ansari, Bell, & Swenson, 2006; Ansari, Bell, & Okano, 2007). Re-
garding the target cost setting, studies found three common methods – top-down method,
bottom-up method and a combination of both (Sakurai, 1989). In the top-down method, the
target cost is set by deducting the target profit margin from the target-selling price. This
method is also known as the deductive method. The target is imposed on the TCM team
without any input from the lower management level. In the bottom-up method, the target
cost is set by the TCM members. In this method, the engineers estimate the target cost
based on their experience, skill and available production facilities. This method is also
known as the “adding up method” (Sakurai, 1989). The estimation of each part, component
and activity starts from the current cost level by considering all possible cost reductions
(Kato, 1993). The target cost is calculated by adding up all the estimated costs. Whereas,
the combination method is the target cost setting which is conducted by combining the top-
down method and the bottom-up method. Generally, although the target cost is set by the
top management, engineers are consulted in the target cost setting process. There is a con-
sensus between the top management and employees in setting the target cost (Sakurai,
1989). Regarding these target cost setting methods, Kato (1993) argues that the top-down
method is able to link the TCM with the company profit planning and business plans. On
the other hand, it is hard to link TCM with the companies’ profit planning and business
plans by using the bottom-up method. Furthermore, it is also hard to generate innovative
VE ideas through the bottom-up method. However, Sakurai (1989) highlights that most
TCM experts believe that a combination of the top-down and bottom-up methods is the best
Univers
ity of
Mala
ya
`
113
method. He further explains that the combination method allows top management to guard
the target profit, and, at the same time, encourage the employees to give their full commit-
ment.
Most of the case studies in Japanese companies found that these companies differ-
entiate the target cost and allowable cost (Cooper & Slagmulder, 1999; Monden & Hamada,
1991). The allowable cost is calculated by subtracting the target profit from the target-
selling price (Monden & Hamada, 1991; Sakurai, 1989). The allowable cost is a cost at
which the product must be manufactured to gain the target profit margin when sold at its
target-selling price. Basically, the allowable cost is the top management’s target, which is
very tough to attain in the short-term (Lee & Monden, 1996). Due to its tightness, there is
no guarantee that it can be achieved. In order to make it more attainable and achievable, the
“target cost” is set and applied to motivate the employees (Monden & Hamada, 1991;
Cooper & Slagmulder, 1999). The target cost is set after some adjustment is made to the
allowable cost to make it more attainable (Monden & Hamada, 1991; Sakurai, 1989). If the
target cost is too high, the actual cost never meets the target cost and demoralizes the em-
ployees. However, if the target cost is too low, the company will lose its competitiveness
(Cooper & Slagmulder, 1988). Accordingly, the target cost is set somewhere between the
estimated cost and the allowable cost. It has to be approved by the management (Sakurai,
1989). Usually, Japanese companies make an adjustment between the allowable cost and
the product estimated cost to derive the target cost (Tani et al., 1994, Lee & Monden, 1996).
However, according to Cooper and Slagmulder (1999), in the companies with sound TCM,
the gap between the allowable cost and the target cost is either non-existent or very small.
Univers
ity of
Mala
ya

`
114
ii) Calculate the estimated cost
The project assumption plays an important role in calculating the product estimated
cost (Monden & Hamada, 1991). The project assumptions are set from the project planning
stage and must be agreed by the related departments (Okano, 2005). Among the assump-
tions that are considered by the Japanese companies are monthly production volume, pre-
decessor product cost timing, depreciation conditions, product life cycle, production plant
location, foreign exchange rates, make or buy criteria for the parts and components, in-
vestment in plant and equipment, and production plant and numbers or process (Kato et al.,
1995; Okano, 1995). Nevertheless, in setting the assumption, such as the volume assump-
tion, only a realistic and achievable plan is considered (Cooper & Slagmulder, 1999). For
example, Toyota considers its past sales trend, market trend and competitors’ product offer-
ing to set a realistic project volume assumption (Cooper & Slagmulder, 1999).
Based on the approved project assumptions, the part and component costs of the
product are estimated (Kato et al., 1995). The part estimated cost is also known as the “as if
cost” or “drifting cost” (Kato et al., 1995). The “drifting cost” is an estimated cost based on
the existing part cost or “ongoing cost” by considering the cost-decreasing and cost-
increasing factors (Sakurai, 1989). It is known as the “drifting cost” because it drifts to-
wards the target cost continuously during the NPD process (Ansari & Bell, 1997). Cooper
and Slagmulder (1999) in their case study research found that, in Japan, the purchased parts
estimation depended heavily on the suppliers’ estimation. Furthermore, the interactive rela-
tion with suppliers allows the Japanese companies to receive early information of the parts’
estimation price after cost reduction and alternative cost reduction ideas from their suppli-
ers (Cooper & Slagmulder, 1999).
Univers
ity of
Mala
ya

`
115
There are two methods of part and component estimation, which are the differential
cost estimation system and the absolute cost estimation system. Under the differential cost
estimation system, only the cost changes of the engineering design changes between the
current and the new product model are estimated. This method limits the number of items
to be managed, which eventually decreases the number of the activities and time required
for making the estimation. This method is normally practiced when the predecessor parts
exist (Kato et al., 1995; Monden & Hamada, 1991). On the other hand, the absolute cost
estimation is a total cost estimation, which considers all the cost elements to derive the total
“estimated cost” (Monden & Hamada, 1991).
iii) Allocate the target cost
After the target cost has been set, the target cost is broken into each cost item and
major function. Cost items include material costs, direct labour costs, purchased part costs
and depreciation part costs. The major functions are engine, transmission, cooling system,
and audio system, et cetera (Okano, 2005; Cooper & Slagmulder, 1999; Monden & Hama-
da, 1991). A survey by Tani et al. (1995) of Japanese companies found that these compa-
nies set the target cost for direct material cost, purchased parts cost, direct variable cost,
overheads, development cost depreciation of new investment, development cost, trial pro-
duction cost and logistic cost. However, among these cost items, most of the Japanese
companies focus on the direct costs, such as direct material costs, purchased parts cost and
direct variable cost.
Univers
ity of
Mala
ya
`
116
There are two approaches for allocating the target cost by major function: (1) by the
historical cost reduction rates approach or (2) by the market analysis approach. Normally,
the market analysis approach is used when new functionality is introduced in the market.
For example, Isuzu uses the market analysis approach by setting the monetary values or
ratio of each major part function and studies how much customers are willing to pay for
that function. Then, the adjustment of the target cost is made to match the technical, legal
and safety requirements (Cooper & Slagmulder, 1999). After allocating the target cost by
the major function groups, the cost engineers for each design group or function group de-
compose the target cost to the group component and parts level (Okano, 2005; Monden &
Hamada, 1991; Copper & Slagmulder, 1999; Kato et al., 1995). The purpose is to set the
purchase parts price (Cooper & Slagmulder, 1999). The task of breaking down the target
cost involves many departments (Lee & Monden, 1996; Cooper & Slagmulder, 1999).
However, since the Chief Engineer (CE) is the project leader who sets the theme of the
product and its functionality, he can make any adjustment to the target cost allocation of
any function group to meet the functionality objectives (Cooper & Slagmulder, 1999). Tani
et al. (1994) in their survey of Japanese companies found that all automotive companies
break down their target cost to each part. Kato et al. (1995) also highlight that Daihatsu also
break down the target cost and delegate the components’ target cost to departments and
managers.
3.3.1.4 Step 4: Making profitability feasibility study
The objective of a profitability feasibility study is to ensure that the product is able
to earn an adequate profit margin over its life cycle. This process starts at the initial product
planning stage. Generally, at the Japanese companies, the Cost Management Department
Univers
ity of
Mala
ya
`
117
calculates the profitability to check whether the project can achieve its target profit. If the
project appears unprofitable, it will be eliminated or modified. However, if the project ap-
pears profitable, it will be adopted (Monden & Hamada, 1991).
In their case findings, Cooper and Slagmulder (1999) highlight that Nissan esti-
mates the overall profitability of the new product model by using the rough estimated sales
volume and all the costs related to the development of the new product. In terms of exclu-
sive investment cost, some automotive companies use payback period method in assessing
their investment (Monden & Hamada, 1991). The Japanese companies usually consider a
reserve budget to cater for design related problems that might occur during the production
process in their overall profitability. This reserve budget is set by the Chief Engineer (CE)
based on past experience of similar product development. Normally, the budget is between
5 to 10 per cent of the product level target cost (Cooper & Slagmuder, 1999).
3.3.2 Do stage
The TCM step under the Do stage is to implement the cost reduction to achieve the
target cost.
3.3.2.1 Step 5: Achieving the target cost
In this stage, the trial drawings of the products are developed based on the approved
target cost (Monden & Hamada, 1991). Usually, as the total estimated cost does not achieve
the target cost, further cost reduction by using engineering tools is required to reduce the cost
to the target cost level (Kato et al., 1995). Based on the results, the trial drawings are adjust-
ed accordingly. This cost reduction process is a continuous activity until it meets the target
Univers
ity of
Mala
ya
`
118
cost (Monden & Hamada, 1991). Cost reduction ideas can be identified through past VE
experience, tear down activities and assessing suppliers’ quotations by using a cost table
(Kato et al., 1995). In Daihatsu, VE is the main activity conducted to close the gap between
the target cost and the estimated cost (Lee & Monden, 1996).
Cooper and Slagmulder (1999) highlight that the Japanese companies usually con-
duct two types of cost reduction. First is the cost reduction to close the gap between the esti-
mated cost and the target cost. If the sum of the accumulated estimated cost is higher than the
target cost, further cost reduction will be imposed until the total target cost of the representa-
tive variant is achieved. Second is the cost reduction to close the gap between the target cost
and the suppliers’ quoted price. If the initial quoted price is higher than the target cost, the
company will have a series of negotiations with its suppliers until they reach consensus.
Furthermore, in order to ensure the design changes meet the target-selling price, the Japanese
companies fine-tune the product functionality and quality by getting occasional market feed-
back during the development stage (Cooper & Slagmulder, 1999). For example, at Daihatsu,
when the company has to change a design to cater to market changes, such as a new product
introduction by a competitor, the cost increment is offset by increasing the sales volume or
sales price, or decreasing other costs to keep the target profit achievable (Kato et al., 1995).
Generally, each design group is responsible for achieving the respective cost reduc-
tion target (Cooper & Slagmulder, 1999; Kato at el., 1995). However, they cooperate with
one another to identify cost effective VE that meet the customers’ demands (Monden &
Hamada, 1991). Japanese suppliers proactively participate to achieve the target cost by
suggesting alternative design prospects (Cooper & Slagmulder, 1999). For example, Nissan
Univers
ity of
Mala
ya
`
119
only submits the components or parts description and forecast production volume to their
suppliers. Its suppliers submit the price and forecast delivery timing based on this infor-
mation (Cooper & Slagmulder, 1999).
3.3.3 Check stage
TCM activities under the Check stage are to monitor and evaluate the TCM results
against its targets, and to report the achievement of the results.
3.3.3.1 Step 6: Monitoring and reporting cost achievement status
In this stage, continuous monitoring and reporting are conducted to ensure that the
corrective actions could be taken before the actual cost exceeds the target cost. If the design
changes cause an increase in cost, the company has to find alternative ways by offsetting it
with savings from somewhere else (Cooper & Slagmulder, 1999). For example, Daihatsu
conducts periodic cost meetings starting from the target cost approval timing until the mass
production timing to monitor the target cost achievement status (Kato et al., 1995).
Monden and Hamada (1991) highlight that once the final drawings have been final-
ized and production equipment conditions have been prepared, the final cost is estimated by
the Cost Management Department. The Purchasing Department also starts to negotiate with
suppliers to finalize the purchased parts. The Production Engineering Department estab-
lishes the standard values, such as material consumption and labour hours, which will be
used later as a cost database for financial accounting and material requirement planning
(Monden & Hamada, 1991).
Univers
ity of
Mala
ya
`
120
3.3.4 Act stage
The TCM activity under the Act stage is to evaluate the target cost achievement re-
sult and take the necessary countermeasures to close the gap.
3.3.4.1 Step 7: Cost improvement
In this stage, the overall TCM results are evaluated against the original targets. The
objective is to evaluate the degree of target cost achievement status. If the target cost is not
achieved, the detail analysis and study will be conducted to find the causes, where the gap
occurs and the departments responsible (Monden & Hamada, 1991; Lee & Monden, 1996).
This stage starts after the first three months of mass production because this timing is con-
sidered stable from any abnormal values (Kato et al., 1995; Monden & Hamada, 1991).
Sakurai (1989) posits that the target cost cannot be implemented without the sup-
port from standard costing or budgeting. In the case study of Kato et al. (1995) it was
found that, at Daihatsu, after three months mass production of the new product, if the target
cost is met, the actual standard cost of the production is used as a standard cost for the fu-
ture operation. However, if the actual standard cost is higher than the target cost, the target
cost is used as the standard cost. Accordingly, the production managers have to find ways
to reduce the current production cost to meet the target cost. However, a study by Lee and
Monden (1996) found that Daihatsu did not use the standard cost as the base of the new
product’s production cost for three main reasons. First, the standard cost uses static manu-
facturing conditions assumption, i.e. manufacturing methods and operating standards,
which are unrealistic and incompatible for use in the design and development stage in to-
day’s dynamic market. Second, it is very difficult to translate the standard cost variances
Univers
ity of
Mala
ya
`
121
with the tasks of new product development and design. Third, the standard cost does not
have a direct connection with the pricing strategy, cost planning or cost management. For
these reasons, Daihatsu only uses the standard cost for financial accounting and does not
use it for any managerial decision-making (Lee & Monden, 1996; Monden & Hamada,
1991).
Once the product is in the mass production stage, the Japanese companies continu-
ously strive to do cost reduction (Howard & Herbig, 1996). In the production stage, if the
design stage could not achieve the target cost, the TCM activities are followed by Cost
Maintenance activities. Nevertheless, the focus of this activity is not to lower the cost but to
prevent the cost from going up (Kato et al., 1995). For example, Kato et al. (1995) found
that at Daihatsu, a task force is formed to address the specific cost reduction activities in the
mass production stage. Japanese companies also continue the cost reduction process by
linking it with Kaizen Costing activities. Kaizen Costing is a system to support cost reduc-
tion in the mass production stage of the existing products. The objective is to achieve the
cost reduction targets through continuous improvement activities of the existing products to
meet the target profit (Lee & Monden, 1996; Monden & Hamada, 1991). Monden and
Hamada (1991) emphasize that Japanese automotive companies manage to create a total
cost management system because they link the TCM with the Kaizen Costing. A loose in-
tegration between Kaizen Costing and TCM might have an impact on the result of the im-
plementation of TCM, and, eventually, affect the employee perception of TCM. This is
because Kaizen Costing causes an improvement to the existing products. By using the Kai-
zen Costing data, the most updated data could be used for the new product cost estimation
Univers
ity of
Mala
ya
`
122
in the TCM process. This creates a cost information cycle between the design and produc-
tion (Monden & Hamada, 1991).
3.3.5 Conceptual framework for the TCM implementation process
Contingency approach suggests that “the particular features of an appropriate ac-
counting system will depend on upon the specific circumstance in which an organization
finds itself” (Otley, 1980, p.413). For the guideline of this case study research, based on
the contingency framework, the proposed conceptual framework of the TCM implementa-
tion process is tabulated in Figure 3-1. This conceptual framework can provide a guideline
for looking at the relevant evidence and reflecting important issues in case study research
(Yin, 2003). The conceptual framework for the TCM implementation process is segregated
into the PDCA stages and seven TCM steps. The number indicated on the upper left side in
Figure 3-1 shows the number of the TCM step.
Univers
ity of
Mala
ya
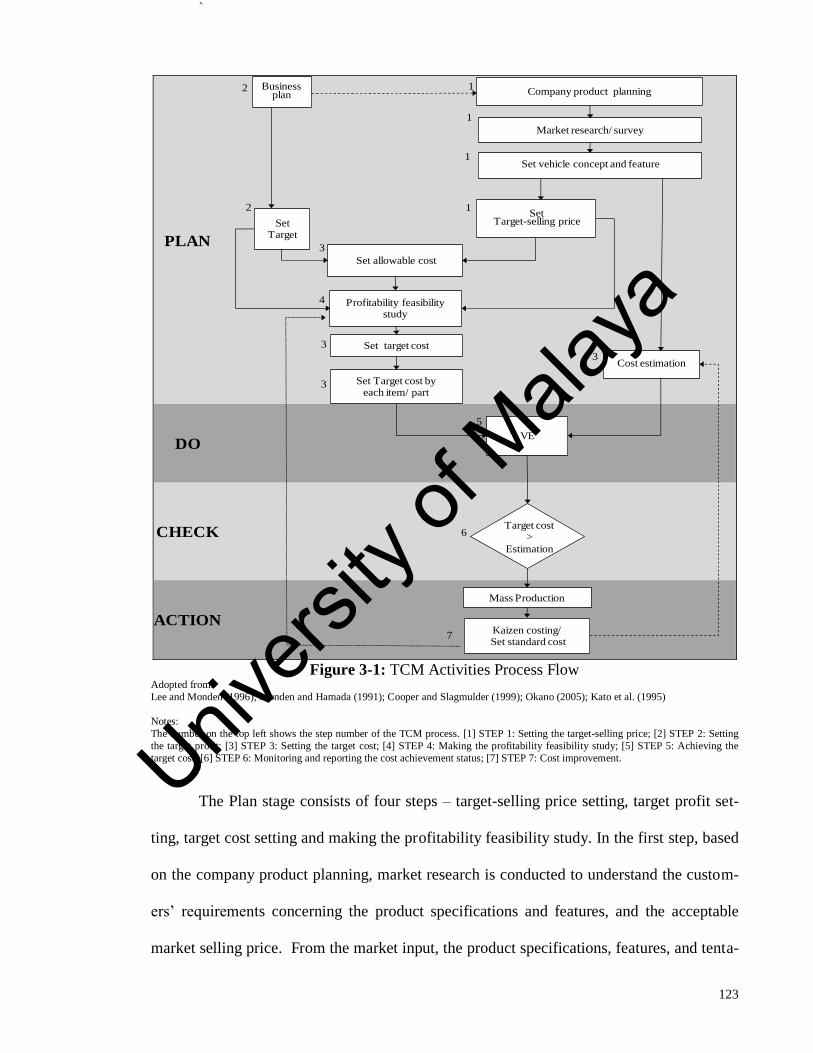
`
123
PLAN
DO
CHECK
ACTION
Business plan
Market research/ survey
Set vehicle concept and feature
Kaizen costing/Set standard cost
VE
Mass Production
Target cost >
Estimation
2 1
1
5
6
7
SetTarget
SetTarget-selling price
Set allowable cost
Profitability feasibility study
Cost estimation
Set target cost
Set Target cost by each item/ part
2
3
4
3
3
3
Company product planning
1
1
Figure 3-1: TCM Activities Process Flow
Adopted from:
Lee and Monden (1996); Monden and Hamada (1991); Cooper and Slagmulder (1999); Okano (2005); Kato et al. (1995)
Notes:
The number on the top left shows the step number of the TCM process. [1] STEP 1: Setting the target-selling price; [2] STEP 2: Setting
the target profit; [3] STEP 3: Setting the target cost; [4] STEP 4: Making the profitability feasibility study; [5] STEP 5: Achieving the
target cost; [6] STEP 6: Monitoring and reporting the cost achievement status; [7] STEP 7: Cost improvement.
The Plan stage consists of four steps – target-selling price setting, target profit set-
ting, target cost setting and making the profitability feasibility study. In the first step, based
on the company product planning, market research is conducted to understand the custom-
ers’ requirements concerning the product specifications and features, and the acceptable
market selling price. From the market input, the product specifications, features, and tenta-
Univers
ity of
Mala
ya
`
124
tive selling price are decided. In the second step, the target setting profit is set based on the
business plan. Next, in the third step, the allowable cost is determined by subtracting the
target profit from the target-selling price. The total target cost is set with some adjustment
between the range of allowable cost and the estimated cost. Then, the target cost is broken
down to all the cost items, such as purchased parts cost, investment cost and in-house pro-
duction cost. At the same time, based on the assumption of the product specifications and
features, all the related costs are estimated. For the purchased part cost estimation, the esti-
mation relies on the suppliers. In step four, after the target-selling price, target profit and
allowable target cost have been set, the profitability study will be calculated to assess the
profit and loss in introducing the new product. This profit and loss simulation only focuses
on representative variants. If the simulation shows a profitable condition, the top manage-
ment approves the proposal and allows it to proceed to the next stage.
The Do stage consists of activities to achieve the target cost. In this stage, the engi-
neering tools, especially VE, are used to close the differences between the target cost and
the cost estimation.
In the Check stage, the achievement status of the target cost against the estimation
cost is monitored continuously until the mass production stage through periodical meetings.
If the target cost is met, the product will proceed to the mass production stage.
Finally, in the Action stage, after the product has been through the mass production
stage and introduced to the market, the cost improvement stage is conducted. The actual
profit and loss achievement status is analysed against the original target to find the root
Univers
ity of
Mala
ya
`
125
causes and responsible departments. The target cost is used as the standard cost for future
operation. Through the Kaizen Costing, the continuous cost improvement activities are
conducted to continuously improve the cost. This cost information will be used for future
product development.
3.4 Theoretical framework of TCM enablers
Generally, many different factors or enablers can influence the SMA implementa-
tion effectiveness at different stages (Anderson & Young, 1999). Anderson and Young
(1999) in their study on the impact of the contextual and process factors on ABC, one of the
SMA methods, conclude that implementation effectiveness correlates with the contextual
and implementation process factors. The contextual factors are factors that are related to the
organization’s external and internal environment, and by characteristics of the individual
evaluating the innovation. Whereas, the implementation process factors are factors that are
related to the interaction of the project team and the organization, and the internal function-
ing of the project team, such as communication and goal clarity among team members (An-
derson & Young, 1999). Furthermore, Anderson and Young (1999) argue that contextual
factors affect the implementation process and implementation result of SMA, while the im-
plementation process factors only affect the implementation result of SMA. The authors
conclude that even though the contextual factors might impede the SMA implementation
result, improvement of the process factors might mitigate the indirect effect of the contex-
tual factors to the SMA implementation result.
According to the contingency theory, it is expected that the contingent factors influ-
ence the TCM practices, and the suitability of contingent factors and TCM practices affect
Univers
ity of
Mala
ya
`
126
the organizational performance (Drury, 2004). By using the contingency theory as the un-
derpinning theory, this research intent to explain the key enablers that positively associated
with the successful implementation of TCM in the case study context.
Even though there are many tools and techniques have been highlighted by scholars,
this research categorized and focuses on nine factors as TCM enablers: Advanced Manu-
facturing Technologies (AMT) implementation, confrontational strategy, a customer orien-
tation, an information-sharing network, lean manufacturing implementation, supplier rela-
tionships, a teamwork oriented organizational culture, top management support and com-
mitment, and training. Besides these nine enablers are the common enablers highlighted in
the literature, these enablers also are the most dominant factors discovered and confirmed
from the personal interviews with some key TCM users, observation during the field visits,
and found in internal documentations such as company quarterly magazines, reports and
press releases. Therefore, it is expected that all these enablers have a positive association
with the successful implementation of TCM in a typical Malaysian automotive company
too.
The next subsections below explain the development of each proposition of these
nine enablers. These propositions will be tested using the data obtained from the question-
naire survey conducted on the TCM users of Company A.
3.4.1 TCM enablers
This research proposes that the implementation of advance manufacturing tech-
niques (AMT), confrontational strategy, a customer centric, an information-sharing network,
Univers
ity of
Mala
ya

`
127
lean manufacturing implementation, supplier relationship, a teamwork orientation organiza-
tion culture, top management support and commitment, and training have a positive associ-
ation with the successful implementation of TCM. The successful implementation of TCM
is measured by three dimensions - development and design efficiency, marketability and
cost reduction. Figure 3-2 summarizes the theoretical framework used in this research in a
chart form.
Univers
ity of
Mala
ya
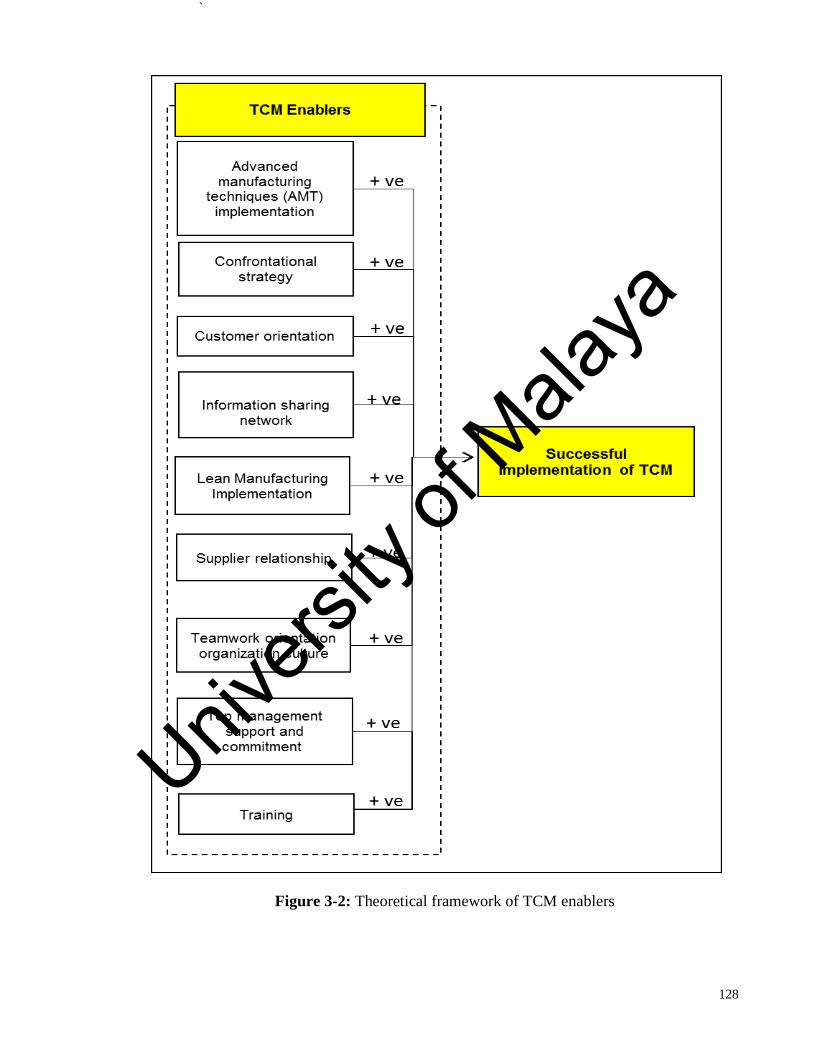
`
128
Figure 3-2: Theoretical framework of TCM enablers
Univers
ity of
Mala
ya
`
129
3.4.1.1 Implementation of advanced manufacturing technologies (AMT)
In this research, AMT implementation is defined as the application of technologies
and computerized systems to improve products or processes in the organization (Kaplan &
Atkinson, 1998; Sakurai, 1990).
Kato et al. (1995) in their case study found that the management of successful TCM
companies regarded technology as the greatest potential cost reduction tool that helps to
produce the product with high quality and low cost. Sakurai (1989) highlights that the im-
plementation of AMT, such as numerical control devices and industrial robots, helps the
Japanese companies to produce multiple products at low cost. In addition, the implementa-
tion of AMT allows efficient information flow, integrated and automated activities across
the value chain. This helps the companies to increase quality, reliability, manufacturing
flexibility and learning phase, and to reduce the stock, space, setup lead-time, and labour
cost (Isa & Foong, 2005; Sakurai, 1989). Accordingly, the implementation of AMT helps
companies to achieve manufacturing excellence and produce the best products at the lowest
price (Mcnair & Mosconi, 1987).
Japanese companies believe that TCM is a combination of human intelligence and
creativity with leading edge technologies as its support system (Kato, 1993). Thus, Japa-
nese companies use information systems widely to support their TCM activities. Among
the information systems used are: (1) system to support pricing and target profit computa-
tion, (2) system to support design and development like CAD and CAE, and (3) cost data-
base management system (Cooper & Slagmulder, 1998; Kato et al., 1995).
Univers
ity of
Mala
ya
`
130
Given the above discussion, the following proposition was developed:
Proposition 1: AMT implementation is positively associated with the successful implemen-
tation of TCM.
3.4.1.2 Confrontational strategy
In this research, the confrontational strategy is defined as the company strategy that
focuses on differentiation and low cost strategy simultaneously to achieve competitiveness
in terms of cost, functionality and quality (Cooper, 1995).
Historically, high market competition and diversification of customers’ needs forced
the Japanese companies to implement TCM (Tani, 1995; Sakurai, 1989). An empirical
study by Decker and Smidt (2003) on 32 Dutch manufacturing firms found that TCM was
likely to be adopted in an uncertain environment with intense competition. Additionally, in
the study of Ax et al. (2008) concerning the relationship between TCM adoption and com-
petition intensity in 57 Swedish manufacturing companies, it was found that the adoption of
TCM was positively correlated with competition intensity. In fact, in a highly competitive
market, the companies must establish a unique position against its rivals to gain a competi-
tive advantage by performing activities differently or performing different activities from
its rivals (Hitt et al., 2004).
Kato (1993) emphasizes that most of the leading Japanese companies that are using
TCM pursue both cost leadership and product differentiation strategies. He further posits
that no company is able to be a major player in the market by solely relying on the differen-
Univers
ity of
Mala
ya
`
131
tiation strategy without being cost competitive. Additionally, Copper (1996) also argues
that TCM is likely to be used by lean enterprises pursuing a confrontational strategy. This
is because, being in the current highly competitive market, it is necessary to compete in
terms of cost, quality and functionality simultaneously. Thus, the companies must pursue
both a cost leadership and a differentiation strategy (Cooper, 1996).
Therefore, the following proposition was developed:
Proposition 2: Confrontational strategy is positively associated with the successful imple-
mentation of TCM.
3.4.1.3 Customer orientation
In this research, customer orientation is defined as the sufficient understanding of
one’s target customers to be able to create superior customer value continuously (Narver et
al., 1990).
Under the current highly competitive market, there are many products on the market
that have similar functions or with better functions. Customers are also not particularly loy-
al to any company and switch brands easily if the companies do not offer the product they
want or do not offer it at the best price they want (Cooper, 1996). This shows that custom-
ers have the final power to define the price of a product with designated functions by select-
ing the best price that reflects the set of product functions in the market (Kaplan & Atkin-
son, 1998).
Univers
ity of
Mala
ya
`
132
The price led concept of TCM makes the TCM companies more adaptable to the
market and customer needs (Swenson et al., 2003). This is because the starting point for the
target cost is the anticipated selling price for the product, which is determined by market
analysis. Based on market analysis, the company defines their target customers, the features
or specifications that these customers want in the product and the price that these customers
are willing to pay for each feature or specification, and the product as a whole. All the cus-
tomer requirements like quality, cost and timely delivery, need to be considered in parallel
with the product features and used as a base for guiding the cost (Swenson et al., 2003).
Accordingly, Swenson et al. (2003) identify customer orientation as one of the principles of
the TCM.
Given the above discussion, the following proposition is put forward:
Proposition 3: Customer orientation is positively associated with the successful implemen-
tation of TCM.
3.4.1.4 Organizational information-sharing network
In this research, an information-sharing network is defined as information sharing
between the company and its business partners, such as employee, joint venture partners,
suppliers and trading companies, that is sufficiently detailed, frequent and timely to meet
the company’s requirements (Yigitbasioglu, 2010). This variable specifically focuses on
information sharing activities which is related with TCM between the case company and its
business partners.
Univers
ity of
Mala
ya

`
133
Information sharing among business partners helps to reduce the behavioural uncer-
tainty and increase the level of trust (Kwon & Suh, 2004). The study of Yigitbasioglu
(2010) on information sharing between buyers and key suppliers at 221 Finnish and Swe-
dish companies found that information sharing improves the buyer’s performance in terms
of output, particularly resource usage, and flexibility. He also found that the extent of the
information shared between buyers and suppliers depends on the environmental uncertainty,
demand uncertainty, key suppliers’ dependence on the buyer and the buyer’s dependence
on the key suppliers.
TCM is a cost management tool for reducing the overall cost of the product over its
entire life cycle, which involves all business aspects (Sakurai, 1990; Kato et al., 1995). In
setting a realistic target-selling price, target profit and target cost, TCM requires compre-
hensive internal and external information (Cooper & Slagmulder, 1999; Kato et al., 1995;
Monden & Hamada, 1991). Furthermore, since achievement of the targets need to be simul-
taneously attempted in all areas (Huh et al., 2008), communicating the targets to related
members is vital to ensure the achievement of target cost and target profit (Everaert et al.,
2006). Product planning and cost meetings act as a simultaneous engineering device that
creates an interactive interaction between the managers from various departments and
backgrounds (Tani, 1995; Tani et al., 1994). Accordingly, an information-sharing network
helps the companies to speed up the information flow, increase the effectiveness and effi-
ciency, and respond to the customer quickly (Li & Lin, 2006).
Hence, a proposition is set forth as follows:
Univers
ity of
Mala
ya
`
134
Proposition 4: The information-sharing network is positively associated with the successful
implementation of TCM.
3.4.1.5 Lean manufacturing implementation
In this research, lean manufacturing is defined as a production system that elimi-
nates waste in all activities that do not create value added (Albright & Lam, 2006). The
main concept in lean manufacturing is to reduce non-value added and irrelevant activities
that do not contribute to the value of the product (Albright & Lam, 2006). Through the im-
plementation of lean manufacturing, companies are capable of exploiting temporary ad-
vantages through the elimination of waste and be better than their competitors (Hibbets,
2003). According to Wickramasinghe and Alwattage (2007), the implementation of lean
manufacturing helps the Japanese companies to successfully implement cost reduction and
quality improvement programmes.
Copper (1995) posits that TCM is likely to be used by lean manufacturers. This is
because lean manufacturers exert immense pressure on all cost elements through the over-
lapping system for cost, quality, design and production (Ansari et al., 2006). Gagne (1995)
also states that among the companies that are likely to gain benefit from TCM are compa-
nies that have a cost reduction system during the planning, design and development stages,
and companies that implement lean manufacturing methods, such as JIT, VE and TQM.
This is because during the TCM planning stage, it is difficult to visualize and reflect accu-
rate conditions. After the product has been launched, there is a possibility that the actual
results might not reflect the target cost. Thus, continuous improvement by using lean manu-
facturing tools helps to bring back the cost as per plan (Helms et al., 2005).
Univers
ity of
Mala
ya
`
135
Additionally, Sakurai (1989) argues that many Japanese companies that implement
JIT also implement TCM. This is because the small lot production concept in JIT increases
the effectiveness of TCM. Kato (1993) also argues that the Western companies that manage
to implement a JIT production system with some modification are good candidates for im-
plementing TCM. Additionally, Nishimura (1995) posits that the combination of TCM and
JIT allows a product to be produced at low cost and of high quality.
Furthermore, TCM cannot be implemented successfully without cost engineering
tools (Sakurai, 1989). In the case study research conducted by Gandhinathan et al. (2004)
on Indian automotive product manufacturers, they found that the VE was a vital tool in
achieving the target cost during the design stage. In the case study conducted by Lee and
Monden (1996) at Daihatsu, they also found that VE is the main tool used to achieve the
target cost.
Accordingly, above arguments lead to the following proposition:
Proposition 5: The implementation of lean manufacturing is positively associated with the
successful implementation of TCM.
3.4.1.6 Supplier relationship
In this research, the supplier relationship is defined as the supplier involvement or
cooperation in achieving the buyer’s target (Helms et al., 2005). Compared with the organi-
zation information-sharing network, this variable specifically focuses on suppliers’ tangible
supports, such as cooperation in joint development and cost reduction activities, and intan-
Univers
ity of
Mala
ya
`
136
gible supports, such as cooperation in information and knowledge sharing, to achieve the
TCM objectives.
According to Tani et al. (1994), cooperation with the supplier is one of the major
success factors of TCM. Kato (1993) even regards suppliers as “a treasure island for cost
reduction activities” (Kato, 1993, p. 35). This is because almost 75 per cent of the total
product cost usually comes from purchased material and components. Thus, achieving
TCM goals is unlikely without relying on the suppliers (Swenson et al., 2003). A study
made by Carr and Ng (1995) found that Nissan UK focuses on the supply chain cost to con-
trol its total cost. This is because 81 per cent of Nissan’s manufacturing cost is covered by
the material costs, which include the raw material, purchased material, transportation and
duty cost. Thus, the impact of cost reduction activities from the material cost is almost four
times bigger than any other cost element, such as overheads or labour cost.
In the integrated TCM system, the buyer’s target cost for each part becomes the tar-
get-selling price of the suppliers. By transmitting the competitive pressure from the buyer
down to its supply chain, the whole supply chain is more efficient in achieving the cost re-
duction (Kaplan et al., 1998). The case study research by Cooper and Slagmulder (1999) on
seven Japanese companies found that Japanese companies transmitted the cost pressure to
their suppliers. The Japanese suppliers proactively find ways by themselves to design and
manufacture the product so that they could make an adequate return. Ellram (2000) studied
the link between purchasing and supply management in the TCM practices by sampling 11
American companies from eight industries. She found that companies with institutionalized
TCM place the purchasing members as the key member of the TCM cross-functional team.
Univers
ity of
Mala
ya
`
137
Among the important roles of the purchasing members are following up any problems that
arise and ensuring that the suppliers achieve their target cost reduction (Ellram, 2000). In
addition, Carr and Pearson’s (1999) study on the buyer-supplier relationship with perfor-
mance outcomes of 739 American firms found that strategically managed long-term rela-
tionships with suppliers have a positive impact on the financial performance of the compa-
nies.
Given the above discussion, the following proposition was developed:
Proposition 6: The supplier relationship is positively associated with the successful imple-
mentation of TCM.
3.4.1.7 Teamwork orientation organization culture
In this research, a teamwork orientation organization culture is defined as compa-
ny’s employees working together to achieve the company’s goal (George & Jones, 2005).
TCM requires high design effort to achieve the expected cost, which is equal or be-
low the target cost. This can be achieved by improving the product manufacturing process-
es and design without sacrificing the value added functions or features (Kaplan et al., 1998).
Without the full effort of the whole organization and the total involvement of all employees
throughout the organization, it is unlikely to meet the cost reduction target and achieve the
target cost (Cooper & Slagmulder, 1988; Monden & Hamada, 1991).
Teamwork is one of the critical factors that have a positive impact on the success of
the New Product Development (NPD) project (Lynn & Akgun, 2003). Accordingly, Feil et
Univers
ity of
Mala
ya

`
138
al. (2004) also posit that teamwork orientation is one of the critical success factors for the
successful implementation of TCM. This is because rigorous cost reduction is unable to be
achieved without the full cooperation from the related departments. In Japan, through
Cross- Functional Management (CFM), the cooperation from members with different func-
tions and knowledge backgrounds help to generate unique strategies (Tani, 1995). This
helps to achieve the target cost for the product at the given level of functionality and quality
(Monden & Hamada, 1991). Furthermore, Tani (1995) emphasizes that simultaneous engi-
neering or “rugby” style product development in the Japanese companies helps to generate
the cooperative effort from all the related departments.
Hence, a proposition is developed as follows:
Proposition 7: A teamwork orientation organization culture is positively associated with
the successful implementation of TCM.
3.4.1.8 Top management support and commitment
In this research, top management support and commitment is defined as top man-
agement willingness to provide the necessary resources, power and authority for TCM suc-
cess (Pinto & Slevin, 1989).
There are many studies highlight that top management support and commitment is
vital for the project success (Pinto & Slevin, 1989; Kerzner, 1987; Kuen & Suhaiza, 2012).
Top management support and cooperation in terms of sufficient resource allocation and
empowerment to project leaders is necessary for successful project implementation. The
Univers
ity of
Mala
ya

`
139
implementation stage is the most crucial stage that requires top management support be-
cause in this stage, resources, such as manpower, money and raw material, are highly need-
ed and unexpected issues are also likely to arise (Pinto et al., 1989). Pinto et al. (1989), in
their study on the critical success factors for R&D projects, found that top management
support is vital for granting the necessary power to the project managers controlling the
needed resources and rewarding the final results. Similarly, Kerzner (1987) emphasizes
that top management is necessary for successful project implementation.
Similarly, in Malaysia, a few studies found that top management has a significant
role in project success (Chang & Zailani, 2012; Kuen & Suhaiza, 2012; Islam et al., 2009).
For example, a study made by Chang and Zailani (2012) on 79 manufacturing companies in
Malaysia found that top management support and project mission are the main critical fac-
tors that indirectly supported the NPD. Kuen and Suhaiza’s (2012) survey study on 79 Ma-
laysian manufacturing companies found that top management support is positively related
to the indirect project success in the Malaysian manufacturing sector. In addition, a study
by Islam et al. (2009) at semiconductor companies in Malaysia found that top management
support is a moderator in the relationship between team learning and NPD process.
Cooper and Slagmulder (1999) posit that effective TCM requires a highly disci-
plined process. Accordingly, Feil et al. (2004) highlight that the top management plays an
important role in creating TCM awareness, aligning the employees' mindset, cultivating a
cross-functional team environment, and providing resources to achieve the TCM targets.
For example, a case study by Lee and Monden (1996) found that in Daihatsu, Japan’s top
Univers
ity of
Mala
ya
`
140
management encourage their employees to participate in contributing VE ideas by estab-
lishing a formal VE suggestion system.
Given the above discussion, the following proposition is put forward:
Proposition 8: Top management support and commitment is positively associated with the
successful implementation of TCM.
3.4.1.9 Training
In this research, training is defined as a process of employees acquiring capabilities
to support the achievement of the organizational goals (Mathis & Jackson, 2004).
The globally competitive environment requires competent employees with updated
knowledge, fresh ideas, abilities and skills that can deliver results. Accordingly, employees
must be trained continuously to update and maintain their capabilities (Mathis & Jackson,
2004). Furthermore, developing and empowering the employees helps to cultivate a culture
of continuous improvement (Yamashina, 2000) and retain employees, and, eventually,
promotes the organization’s competitiveness (Mathis, 2004).
Generally, failure to educate and train all relevant personnel will lead to system
implementation problems (Leong & Jarmoszko, 2010). Furthermore, without adequate
training and no in-depth knowledge of the companies, the employees are likely to focus on
short-term thinking and quick results (Albright et al., 2006). Accordingly, Pinto and Slevin
(1989) emphasize that selecting, recruiting and training people with the right administrative
and technical skills has a positive impact on the success of the project implementation.
Univers
ity of
Mala
ya
`
141
In terms of TCM practices, since the achievement of targets needs to be attempted
simultaneously in all areas, well trained and members with broad experience who are capa-
ble of spotting and implementing cost reduction activities are needed (Helms et al., 2005;
Cooper & Slagmulder, 1998; Gagne, 1995). In Japan, the Japanese companies mainly de-
velop their employees through OJT and job rotation (Okano & Suzuki, 2007; Feil, Yook, &
Kim, 2004; Sadoi, 1998). This “learning by doing” concept of training allows the employ-
ees to understand the whole business processes and the impact of their actions on the busi-
ness environment. This eventually leads the employees to continuously improve (Feil,
Yook, & Kim, 2004).
Thus, the following proposition is developed:
Proposition 9: Training is positively associated with the successful implementation of TCM.
3.4.2 Successful implementation of TCM
The relationship between the contingency factors and the management accounting
system affects the organizational effectiveness. The organizational effectiveness can be
measured in terms of the organizational objectives (Otley, 1980). A study by Adler et al.
(2000) on manufacturers in New Zealand found that the implementation of advanced man-
agement accounting techniques results the improvement in companies’ profitability, cost
reduction and quality improvement.
Generally, TCM implementation helps the companies to ensure that the products are
sufficiently profitable when launched on the market (Ansari & Swenson, 2006; Cooper &
Univers
ity of
Mala
ya
`
142
Slagmulder, 1998; Adler et al., 2000). Accordingly, even though there are various objec-
tives of the implementation of TCM, the final objective is to improve the companies’ long-
term profitability (Ansari & Swenson, 2006; Cooper & Slagmulder, 1998). On the other
hand, cost reduction, development and design efficiency and marketability are commonly
highlighted as the short-term objectives of the implementation of TCM (Huh et al., 2008;
Tani et al,. 1994; Adler et al., 2000; Dekker & Smidt, 2003). A survey study by Tani et al.
(1994) found that the main objectives of TCM implementation by most Japanese compa-
nies are cost reduction, quality, satisfying customers’ needs and the timely introduction of
new products, respectively.
However, as this research is unable to show the profit achievement level due to the
case company’s confidential issues, the success of the implementation of TCM is evaluated
based on three dimensions only- efficiency, marketability, and cost reduction improvement.
Furthermore, since these dimensions reflect the short-term effect of the TCM practices
(Huh et al., 2008), it can be easily acknowledged by the respondents. Furthermore, since
TCM is defined as “a profit management process” in which the specific targets in “quality,
prices, reliability, delivery date and other targets” must be attained simultaneously (Huh et
al., 2008), this research combines the dimension of efficiency, marketability, and cost re-
duction improvement as one dependent variable to measure the success of the implementa-
tion of TCM.
3.4.2.1 Cost reduction
In Tani et al.’s (1994) survey of Japanese companies in Japan, they found that
among all the objectives, cost reduction is the main objective of TCM implementation.
Univers
ity of
Mala
ya
`
143
Similarly, using the same survey tool, the study by Dekker & Smidt (2003) on Dutch manu-
facturing firms in Holland found that cost reduction is regarded as the main objective of
TCM implementation. Huh et al. (2008) posit that cost reduction is a performance variable
concerning the financial achievement through supply chain management and product cost
management. This dependent variable can be measured by product cost reduction, upstream
cost reduction, reduction in raw materials purchased, and waste reduction on the shop floor.
The main objective of the cost achievement activity can be achieved by reviewing
all the possible ideas of cost reduction during the product design stage. As the product is
not actually being produced at this stage, any revisions due to new data or information
availability are easy and not costly (Ansari et al., 2006). Once the product is ready to
launch, there are limited opportunities left for cost reduction. Thus, several authors have
argued that it is difficult to make major cost reductions after the design stage because al-
most 80 per cent of the product cost is fixed at the product design stage. Any large-scale
efforts to reduce the cost during the manufacturing stage are pointless (Shank et al., 1999;
Kato, 1993).
3.4.2.2 Design and development efficiency
Huh et al. (2008) posit that the development and design efficiency is a TCM per-
formance variable related to the efficiency of the R&D management and the design steps.
This dependent variable can be measured by the efficiency in the design to cost, strengthen-
ing the design and development process, and the cost reduction effort by engineers, as well
as improving the design and development technology.
Univers
ity of
Mala
ya
`
144
The target cost is set before the new product development starts by deducting the
target profit from the target-selling price. From here, the companies work towards achiev-
ing the target cost to ensure the new product can generate profit when launched (Shank et
al., 1999). Accordingly, this target cost helps the engineering teams to be conscious about
the cost implications of their design in the later stages of the product cycle (Everaert &
Bruggeman, 2002). In addition, since the TCM starts in the upper stream of the production
stage, the market requirements are considered and integrated earlier in the design stage (Sa-
kurai, 1989; Monden & Hamada, 1991). This helps to increase the efficiency by avoiding
time, money and effort lost in design changes due to over engineering countermeasures to
fit the market requirement after the product has been introduced to the market (Helms et al.,
2005; Kato, 1993).
3.4.2.3 Marketability
Huh et al. (2008) posit that the marketability is a TCM performance variable that
concerns the improvement in delivery and quality. It can be measured by quality improve-
ment, shorter lead-time, product features that meet the customers' requirements, and the
timely introduction of the new product.
TCM implementation helps the companies to consider all the customers’ needs in
terms of quality, price, reliability and delivery date and other targets (Huh et al., 2008).
Hence, the target-selling price is set by the market, and the cost reduction is guided by the
customers’ voice without sacrificing customer value (Ansari et al., 2006). In TCM, the cost
reduction activities do not sacrifice the product quality or reliability. Instead, the cost re-
Univers
ity of
Mala
ya
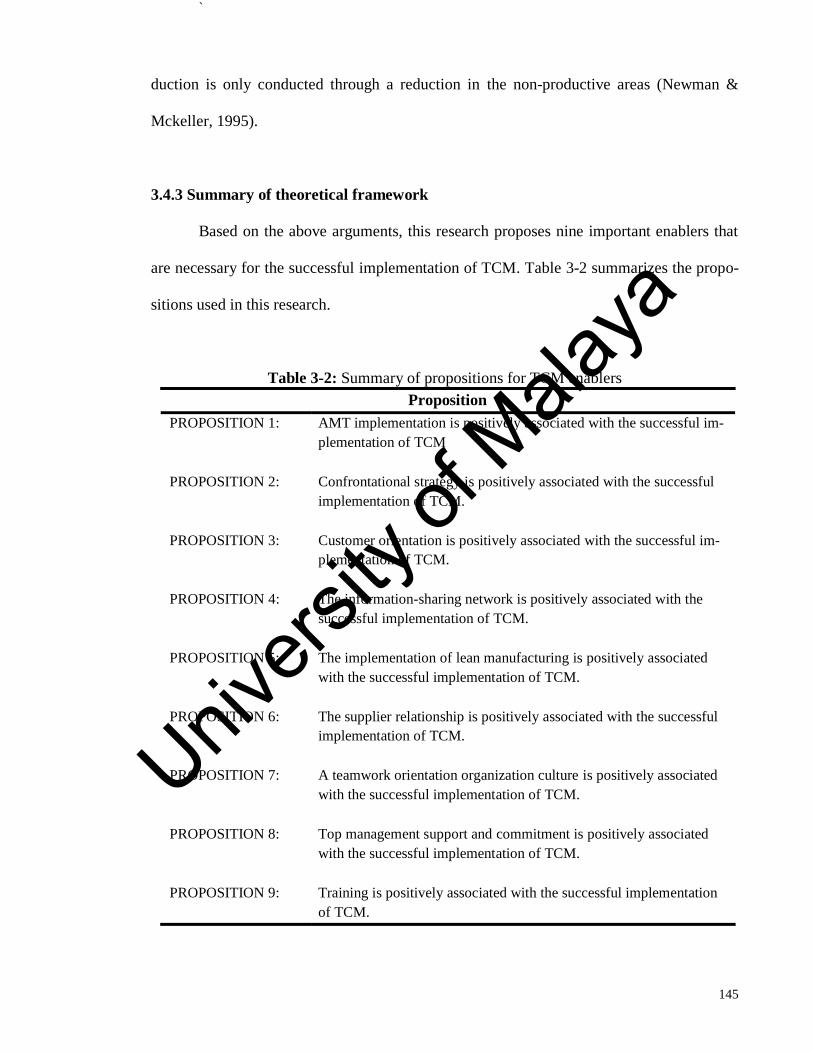
`
145
duction is only conducted through a reduction in the non-productive areas (Newman &
Mckeller, 1995).
3.4.3 Summary of theoretical framework
Based on the above arguments, this research proposes nine important enablers that
are necessary for the successful implementation of TCM. Table 3-2 summarizes the propo-
sitions used in this research.
Table 3-2: Summary of propositions for TCM enablers
Proposition
PROPOSITION 1: AMT implementation is positively associated with the successful im-
plementation of TCM
PROPOSITION 2: Confrontational strategy is positively associated with the successful
implementation of TCM.
PROPOSITION 3: Customer orientation is positively associated with the successful im-
plementation of TCM.
PROPOSITION 4: The information-sharing network is positively associated with the
successful implementation of TCM.
PROPOSITION 5: The implementation of lean manufacturing is positively associated
with the successful implementation of TCM.
PROPOSITION 6: The supplier relationship is positively associated with the successful
implementation of TCM.
PROPOSITION 7: A teamwork orientation organization culture is positively associated
with the successful implementation of TCM.
PROPOSITION 8: Top management support and commitment is positively associated
with the successful implementation of TCM.
PROPOSITION 9: Training is positively associated with the successful implementation
of TCM.
Univers
ity of
Mala
ya
`
146
3.5 Summary
This chapter discussed the fundamental theories and the development of the concep-
tual and theoretical frameworks used in this research. The first section discussed the two
fundamental theories, contingency theory and dynamic capabilities theory, used for this re-
search. The contingency theory posits that the best design of management accounting sys-
tems should depend on the specific situational factors of the company itself. This is because
the situational factors that affect each control system are exclusively unique. While, the dy-
namic capabilities theory posits that the ability of an organization in a dynamic market to
develop its external and internal competence is through creating new resources, and inte-
grating or re-configuring its resource mix as a source of competitive advantage. These theo-
ries will be used as the underpinning theories to explain the findings of this research.
The following section discussed the conceptual model of the TCM implementation
process based on several case studies made by scholars in the Japanese automotive compa-
nies in Japan. This conceptual framework was used as the case study guidelines for looking
at the significant evidence and reflecting on the key issues for this research. The conceptual
framework of TCM implementation was segregated into the PDCA stages and the seven
main steps, which were (1) target-selling price setting, (2) target profit setting, (3) target
cost setting, (4) profitability feasibility study, (5) achieving the target cost, (6) achievement
status monitoring and reporting, and (7) cost improvement stage.
The last section developed a theoretical framework used in the quantitative ap-
proach of this research. There were nine factors: advance manufacturing techniques (AMT)
implementation, confrontational strategy, a customer centric, an information-sharing net-
Univers
ity of
Mala
ya
`
147
work, lean manufacturing implementation, supplier relationship, a teamwork orientation
organization culture, top management support and commitment, and training, which were
proposed as enablers that have a positive association with the successful implementation of
TCM. In this theoretical model, the successful implementation of TCM was measured by
three dimensions- development and design efficiency, marketability and cost reduction.
The next chapter explains the research methodology used in this research. It justi-
fies the selection of the research method and the case company. The explanation of the re-
search design method will be segregated into the qualitative and quantitative approach.
Generally, the qualitative approach will be used to investigate the TCM implementation
process and enablers that exist in the case company. Then, the quantitative approach will be
used to statistically test the key enablers that positively associated with the successful im-
plementation of TCM. Under each approach, the instrument development, data collection
procedures and data analysis method will be explained in detail.
Univers
ity of
Mala
ya

`
148
CHAPTER 4: METHODOLOGY
4.1 Introduction
This chapter discusses the research design method used in this research. Based on
the nature of the research questions, the conceptual and theoretical frameworks as discussed
in the previous chapters, this research uses a single embedded case study method as sug-
gested by Yin (2003). This case study employs multi-sources of data collection by using the
qualitative and quantitative approaches. The qualitative approach is used to investigate the
TCM implementation process and why Company A implements TCM “as it is”, and to
identify the TCM enablers that exist in the case company. The data are collected through
interviews, documents, and direct observation. The quantitative approach is used to statis-
tically test the enablers that have a positive association with the successful implementation
of TCM in the case company. The data are collected through a questionnaire survey dis-
tributed to the case company’s employees. The insights obtained from the quantitative level
analysis are used to supplement the results of the qualitative level analysis. This provides a
comprehensive understanding concerning the enablers that have a positive association with
the successful implementation of TCM in the case company.
The next section in this chapter discusses and justifies the rationale for using the
case study method in a single industry and a single company. Then, the following section
describes the overview of the research design based on the three case study principles sug-
gested by Yin (2003). The fourth section explains the case study protocol used to guide the
case study research. Then, the following section explains the research site selection and
background of the selected case company. The sixth and seventh sections explain the
qualitative and quantitative evidence data collection approaches in terms of instrument de-
Univers
ity of
Mala
ya
`
149
velopment, data collection method and data analysis, respectively. Finally, the chapter ends
with an explanation of the validity and reliability issues and the approaches used to address
the issues.
4.2 Rationale for case study research method
The researcher considered a few arguments in selecting the case study as the re-
search method. There are three main reasons as to why this research has been conducted
using the case study method. First, the case study method is the most appropriate method to
answer the research questions. This is because the case study method is used when a “how”
or “why” question is being asked about the current set of events that the researcher has ei-
ther little or no control over (Yin, 2003). Furthermore, Yin (2009) argues that:
A case study is an empirical inquiry that investigates a contemporary phe-
nomenon within its real-life context, especially when the boundaries be-
tween phenomenon and context are not clearly evident. In other words, you
would use the case study method because you deliberately want to cover
contextual conditions – believing that they would be highly pertinent to
your phenomenon of study (Yin, 2009, p. 13).
Additionally, according to Ansari et al. (2007) in the early development of TCM,
most of the literature comprised descriptive and prescriptive studies, which were based on
case studies of the early adopters of TCM. This shows that the case study method helps the
researchers to keep thorough and significant characteristics of the real situation, such as the
organization and managerial processes (Yin, 2003).
Second, the TCM implementation is quite new outside Japan (Ansari et al., 2007;
Sulaiman et al., 2004; Nishimura, 2005) and there is a lack of specific studies to understand
Univers
ity of
Mala
ya
`
150
the TCM implementation process and factors that support the implementation in detail out-
side the Japanese environment (Sulaiman et al., 2004). In addition, Johnson and Kaplan
(1987) argue that most of the textbooks and accounting management research have focused
on developing a sophisticated model in a simplified production setting, which only reflects
minor problems faced by the practitioners and results in inaccuracy and overlooks the actu-
al accounting management practices. The case study method helps to provide valuable in-
sights into the body of knowledge, which cannot be provided by the traditional empirical
and modelling approach (Yin, 2003; Ellram, 2006). Accordingly, Sulaiman et al. (2004)
emphasize that the current studies on management accounting practices only focus on ex-
ploratory descriptive research in which the results only reflect percentages and frequencies.
They suggest that further studies should involve case studies in an attempt to examine the
specific factors that hinder many Asian countries from implementing strategic cost man-
agement. Furthermore, Tani et al. (1994) also suggest that researchers should use the case
study method in order to understand the complexity and differences of TCM practices.
Third, a case study allows more relevant data collection because the entire organiza-
tion can be investigated in-depth and with great attention to detail (Yin, 2003). A case study
enables a thorough understanding of the company’s strategy, industrial type, size, and cul-
tural and social context. Through direct and in-depth contact with practitioners, the TCM
practices can be covered thoroughly and a number of propositions can be evaluated. More-
over, case study research provides the opportunity to use various sources of evidence. Mul-
ti-sources of evidence allow the researcher to develop the converging lines of inquiry, a
process of triangulation and corroboration, and to address a wider range of historical, be-
havioural and observational issues (Yin, 2003).
Univers
ity of
Mala
ya

`
151
Based on the above arguments, in this research context, the researcher posits that
the case study is the appropriate approach to uncover the differences in the TCM imple-
mentation process, possible causes of the differences and the critical factors that support the
successful implementation of TCM in the context of Malaysian automotive company.
4.2.1 Single embedded case study method
In determining the case study design, Yin (2003) highlights that there are two im-
portant decisions have to be made. First, is to select a single or a multiple case study design.
Second is to select a single (holistic) or multiple (embedded) unit of analysis.
According to Yin (2003), a single case study is suitable under four main circum-
stances: (1) the case represents the critical case in testing a well-formulated theory, (2) the
case is unique, (3) the case is representative of the typical case, or (4) the opportunity to
access the case is very rare. Accordingly, this research uses a single case study method for
a few reasons. First, TCM was not developed wholly from an established theory but gradu-
ally from practical applications, which make it environment specific and unique (Feil, Yook,
& Kim, 2004). Since the development of TCM in Malaysia is still new, it can be considered
that under this context the implementation process is unique. Furthermore, in the early de-
velopment of TCM, most of the studies were conducted in a single case study mode due to
the unknown territory of TCM (Ansari et al., 2007). An analysis made by Ansari et al.
(2007) of the Japanese and English related TCM literature from 1995 to mid-2005 found
that almost half of the literature comprised non-empirical studies and the balance used em-
pirical studies. Out of 50 per cent of the empirical studies, 25 per cent of the research meth-
Univers
ity of
Mala
ya
`
152
odologies were based on a single site case study method. The multiple case studies were
very small which were 11 per cent in the English literature and 6 per cent in the Japanese
literature. Second, considering that the case company covers the majority of the automo-
tive market shares in Malaysia for several consecutive years, this company is representative
of the typical case of the TCM implementation process in the Malaysian automotive indus-
try context. Third, inasmuch as TCM involves the secrecy of the company in terms of cost-
ing, profit and new products (Kato, 1993) it is a rare opportunity to gain access to the case
company for TCM study.
In terms of unit analysis selection, Yin (2003) highlights that it is related to the
fundamental problem of defining what the case is and how the research defines its research
questions. Single or holistic analysis is advantageous when no logical subunits can be iden-
tified or when the relevant theory underlying the case study is holistic. On the other hand,
embedded or multiple units of analysis incorporates subunits of analysis, which increases
the opportunity for extensive analysis and enhances the understanding of the single case
(Yin, 2003). In that TCM implementation is still new outside of Japan (Nishimura, 2005),
there is a lack of solid model that outlines the critical enablers of the successful implemen-
tation of TCM in non- Japanese environment. Thus, an embedded or multiple unit of analy-
sis is selected in this research. In this research, the primary unit of analysis is the case com-
pany and the sub unit is the case company’s employees who are directly and indirectly in-
volved in the TCM practices.
By conducting a single case study with multiple units of analysis, the researcher is
able to understand the differences in the management accounting practices and the complex
Univers
ity of
Mala
ya
`
153
mixture of interrelated influences (Scapens, 2006) specifically in terms of the possible
causes of the differences and critical factors that positively associated with the successful
implementation of TCM in the case company context. Furthermore, this method also helps
to provide an in-depth understanding of the TCM practices and the modifications to the im-
plementation process from the perspective of the dynamic capabilities theory and contin-
gency theory. Thus, based on the above arguments, a single embedded case study method
is used in this research.
4.3 Overview of the research design
The research design is “a logical plan for getting from ‘here’ to ‘there’. ‘Here’ is
the initial question to be answered and ‘there’ is some set of conclusions (answers) about
these questions” (Yin, 2009, p. 26). Based on the research questions, this research uses
Yin’s (2003) positivist single embedded case study research method to answer the research
questions. According to Yin (2003), there are three principles must be fulfilled to conduct
and deliver a high quality case study research. First, the use of multiple sources of evidence
to develop converging lines of inquiry. Second, maintaining a chain of evidence to increase
the reliability. Third, creating a case study database to organize and document the collected
data. The sub-section below explains how this research covers each of these principles in
detail.
4.3.1 Principle 1: Use of multiple sources of evidence
In order to develop converging lines of inquiry for high quality case study research
(Yin, 2003) multi-sources of data evidence were collected in three steps. In the first step,
the qualitative data were collected through interviews, documents, and direct observation.
Univers
ity of
Mala
ya
`
154
There are four objectives of this step. First, to understand the context of the case company
including its organizational structure, business and management accounting practice. Sec-
ond, to understand what triggered the case company to implement TCM. Third, to investi-
gate in-depth the TCM practice in the case company. And, finally, to investigate the TCM
enablers that exist in the case company. In the second step, the quantitative data were col-
lected through questionnaire surveys distributed to the company’s employees. The objec-
tive of this step was to test the enablers that had been highlighted by the previous studies
and the initial findings from the first step. Then, the data were analysed using statistical
analysis. Finally, in the third step, the qualitative and quantitative data were triangulated to
obtain comprehensive interrelated connections to answer the research questions.
4.3.2 Principle 2: Maintain a chain of evidence
The case study reliability can be increased by maintaining a chain of evidence (Yin,
2003). Yin (2003) argues that this allows the external observer “to follow the derivation of
any evidence from initial research questions to ultimate case study conclusions” (Yin, 2003,
p. 102). In order to understand the whole TCM implementation process at Company A, this
research focused on Model X1, which is a full model change of the most saleable passenger
car of Company A. By focusing on one model, the researcher was able to understand the
TCM implementation process for each product development stage.
This case study covered the data collection of Model XI for approximately 47
months; 33 months during the development period and 14 months after launching period.
Even though, the data collection coverage period was 47 months, the actual field data col-
lection started from August 2010 until June 2012, which was approximately 22 months.
Univers
ity of
Mala
ya
`
155
Before this time, the data were collected from the company’s historical internal documents
only such as meeting minutes, report presentations and proposal papers. Initially, this case
study was intended to last 40 months only – a 34-month period for the product planning
stage until the mass production stage, and a 6-month period after the launching stage. How-
ever, the study was extended for another 7 months after the researcher found that Company
A had started to implement cost reduction activities for Model X1 after this model had been
launched by introducing a new model project code, Model X2. Due to this unexpected phe-
nomenon, the researcher decided to extend another 7 months to understand the reasons and
to strengthen the previous findings.
In conjunction with the research questions, this study was conducted in three main
stages for the qualitative data collection and only one stage for the quantitative data collec-
tion. Table 4-1 summarizes the organizational structure of the data collection stages and
data analysis.
Univers
ity of
Mala
ya

`
156
Table 4-1: The period of data collection and data analysis.
Qualitative Data Collection
[A] Interview
1st stage
2nd stage
3rd stage
[B] Observation
1st stage
2nd stage
3rd stage
[C] Documents
1st stage
2nd stage
3rd stage
Qualitative Data Collection
[D] Surveys
Data analysis
2011 2012Data Collection stage 2010
The qualitative data were collected through interview, observation and documenta-
tions. There were three main stages for the qualitative data collection. The first stage was
from August to December 2010, the second stage was from January to November 2011 and
the third stage was from December to June 2012. The main objective of the first stage was
to understand the fundamental concept and context of the TCM practice at Company A. In
this stage, the researcher assimilated herself as a part of Company A’s community. This
allowed the researcher to understand the case company culture and identify the actors who
played a key role in the organization, especially in TCM practice. The observation data col-
lection were focused on understanding the Company A’s environment through field visits.
The documentation data were collected to understand the general background about Com-
pany A. Preliminary interviews were conducted to obtain preliminary information before
Univers
ity of
Mala
ya
`
157
conducting formal interviews. The second stage data collection was conducted after the
fundamental concepts and familiarization with the case company were developed. In this
stage, formal interviews were conducted based on the case study interview protocol. The
observation data were collected by attending specific TCM related meetings to understand
the TCM implementation process in detail. The document data collections were based on
TCM and its inter-related matter only. Finally, the third stage data collection was conducted
to strengthen and to identify any findings that did not emerge during the previous stages,
and to finalize the explanation building for the case study. In this stage, the observation da-
ta and document data were focused on TCM related activities to support the survey findings.
As for the quantitative data collection, the data were collected in the second half of
2011. This questionnaire survey was designed after some preliminary findings concerning
the TCM enablers found in the qualitative data collection stage. Then, the survey questions
were distributed to the employees of Company A who were involved directly or indirectly
with the TCM implementation process.
For the data analysis, the data were analysed continuously starting from the begin-
ning until the end of the data collection stage.
4.3.3 Principle 3: Create a case study database
Organizing and documenting the collected data by creating the case study database
is one of the criteria for a high quality case study (Yin, 2003). Generally, the case study da-
ta documentation consists of two components, which are the data or evidentiary base and
the investigator's report. The data or evidentiary base is the case study raw data like notes
Univers
ity of
Mala
ya
`
158
that can be accessed for individual inspection. Notes are the most common element of the
database in case studies (Yin, 2003). For the investigator’s report, this dissertation is the
result drawn therefrom. Yin (2003) suggests that investigator’s report should “contain
enough data so that the reader of the report can draw independent conclusions” (Yin, 2003,
p. 102).
Accordingly, in this research, all the data were organized and analysed starting from
the early stage of data collection. Notes were taken in handwritten form from interviews,
field observations and document analysis. No editing was made to the notes as the priority
was given to the case study report editing. However, the notes were organized and catego-
rized for later access (Yin, 2003). The database, which consists of research notes, survey
and all documentation were grouped, analysed and summarized into several categories,
which became the chapters of this research and sub-topics within the chapters. However,
due to the issue of confidentiality, the data will be disposed of after approval of the disser-
tation.
Nevertheless, the actual data collection and data analysis process were not exactly
structured because changes were made to accommodate the unexpected emerging issues.
This was because there was no exact point where the data collection ended and the data
analysis began. This overlapping process of data collection and analysis improved the data
collection and data analysis (Patton, 1990). For example, the recorded interviews or docu-
ment data were analysed first before the subsequent interviews in order to grasp and discuss
new emerging issues with the next respondents. Regarding the data collection of this re-
search, it was guided by the conceptual and theoretical frameworks. However, at the end of
Univers
ity of
Mala
ya
`
159
the data collection process, in order to organize the data analysis, the researcher combined
the two sources of data collection, which were (1) the research questions generated from
the initial stage of the study, and (2) the analytic insights that emerged during the data col-
lection (Patton, 1990).
In summary, in order to deliver a high quality case study, this research took a few
measures to ensure the three principles of case study: (1) use multiple source of evidence,
(2) maintain the chain of evidence and (3) create a case study database, were complied.
4.4 Case study protocol
The case study protocol is the major tool for increasing the reliability of the case
study. This is because the case study protocol helps to focus on the subject of the case study
and anticipate the problems of the case study. Yin (2003) suggests that case study protocol
should consist of: (1) an overview of the case study project, (2) field procedures, which in-
cluded the data collection procedures and case study site selection, (3) case studies ques-
tions, and (4) a guide to the case study report. Based on this guideline, the summary of the
case study protocol of this research is attached in Appendix A. The detail case study proto-
col concerning the overview of the case study was covered in Chapter 3.
Regarding the case study protocol for data collection procedures, a letter of consent
with an interview protocol and survey questionnaire was submitted to the Company A’s
Human Resources General Manager to obtain approval for the case study research before
conducting formal data collection. Refer to Appendix B for the letter of consent. As stated
in the Consent Letter, all the collected data were strictly confidential and reported anony-
Univers
ity of
Mala
ya

`
160
mously for the purpose of this research only. Anonymity helps to protect the real case and
its real participants from any subsequent actions of the results (Yin, 2003). Neither individ-
ual names nor the company name were used in any oral or written report and were replaced
with an anonymous code. The respondents’ quoted opinions were represented in code num-
bers with general classifications of position, which were technical staff, lower management,
middle management, and top management. The technical staff level was an engineer and
executive. The lower management level was a specialist engineer and assistant manager.
The middle management level was a department manager, senior manager, and deputy gen-
eral manager. The top management level represents a general manager, executive director
and managing director. The respondents’ departments were mentioned to demonstrate the
tendency and variation of the respondents’ answers based on department. All the raw data
including the documents, notes taken, digital recording and transcribed interviews were
made available as needed to the auditors. Nevertheless, these raw data were not available to
the administration of the company being studied nor made public. After the research had
been concluded, the raw data were destroyed.
The case study protocol of the case study site selection and case study questions
will be covered in detail in the following sections of this chapter.
4.5 Research site
This section discusses the research setting selection process of the case study site and
the background of the case company in which the case study was conducted.
Univers
ity of
Mala
ya
`
161
4.5.1 Research site selection
According to Boeije (2010), the case study location must reflect the research topic
most strongly. Therefore, in order to select the right case company, the researcher made a
preliminary study by approaching a few companies through simple questionnaires concern-
ing TCM practices. From the feedback, the researcher went to several companies to make a
preliminary visit for screening purposes, as suggested by Yin (2003). This process helped
the researcher to identify the right case company properly before conducting the formal da-
ta collection. From this screening activity, the researcher found that compared with other
companies, Company A provided the most significant evidence as it has designed, docu-
mented and reflected the TCM concept.
Additionally, in responding to the competitive global and the local automotive envi-
ronment, Company A provided an interesting and dynamic setting to understand the TCM
implementation. This was because the case company had the status of a national automotive
car manufacturer, which was affected by the liberalization of the automotive industry. Fur-
thermore, given that Company A was established through a strategic alliance with a Japa-
nese automotive manufacturer over almost two decades, the TCM implementation at Com-
pany A was likely to be more mature than other companies.
Furthermore, the case company has a big size organization with total average reve-
nue of the past 3 years more than USD500 million and with more than 10,000 employees.
Since its establishment in 1990s, the case company has sold more than 2 million units of
passenger cars of various products inclusive of export markets and has become Malaysia’s
automotive market leader for several consecutive years.
Univers
ity of
Mala
ya
`
162
With the case company being the most likely “to yield the best data” (Yin, 2003, p.
21) as the main operational criteria, Company A was selected as the case company for this
research.
4.5.2 Case company background
Company A was one of the Government Linked Companies (GLC) among the au-
tomotive manufacturing companies that were established under the Heavy Industrial Policy
projects (Tham, 2004). This company was established in the 1990s through a joint venture
between Malaysian and Japanese companies. By 2015, this case company had already pro-
duced eight models and become Malaysia’s automotive market leader for several consecu-
tive years. Company A has received various awards and recognitions for its outstanding
products both domestically and from overseas. It is also listed among the most valuable
brands in Malaysia.
Company A is situated in the east of Peninsular Malaysia. Among the facilities at
Company A are a corporate building, R&D testing laboratories and styling studio, vehicle
test track, manufacturing plant, engine plant, pre-delivery inspection area, vehicle distribu-
tion stockyard, training centres and parts warehouse. It had the capacity to produce 250,000
units per annum on a 2-shift cycle. As at 2012, Company A sourced its parts and compo-
nents from 114 local suppliers and 15 overseas suppliers. It also had 180 sales and 170 ser-
vice outlets nationwide. In terms of the workforce, there are over 10,000 employees work-
ing under Company A’s organization and around 57,000 people working under the com-
munity of Company A inclusive of suppliers and dealers. Company A’s vision is to con-
Univers
ity of
Mala
ya
`
163
tribute to the development of the Malaysian society through excellence in terms of the qual-
ity of its product and services. This vision is translated through its mission of aiming to be a
world class automotive company well-known for its excellent quality and reliability
(Source: Company website).
4.5.2.1 Organizational structure
Company A is a dynamic organization with challenging goals. In order to equip the
company efficiently towards its business goal, Company A divides its operations under
three main subsidiaries – Company A1, Company A2 and Company A3. Company A1 is
responsible for the sales, marketing, and distribution operations of Company A’s vehicles
as well as the after sales service and spare parts operations. Company A2 is responsible for
the manufacturing operation of Company A’s vehicles. Company A3 is responsible for the
assembly of the vehicle engines and also the manufacturing operations of selected engine
component parts. After re-structuring at the end of 2001, Company A4 was incorporated
with Company A2 and Company A3 as its subsidiaries. Under this new restructuring, the
direct subsidiaries of Company A are Company A1 and Company A4.
Univers
ity of
Mala
ya
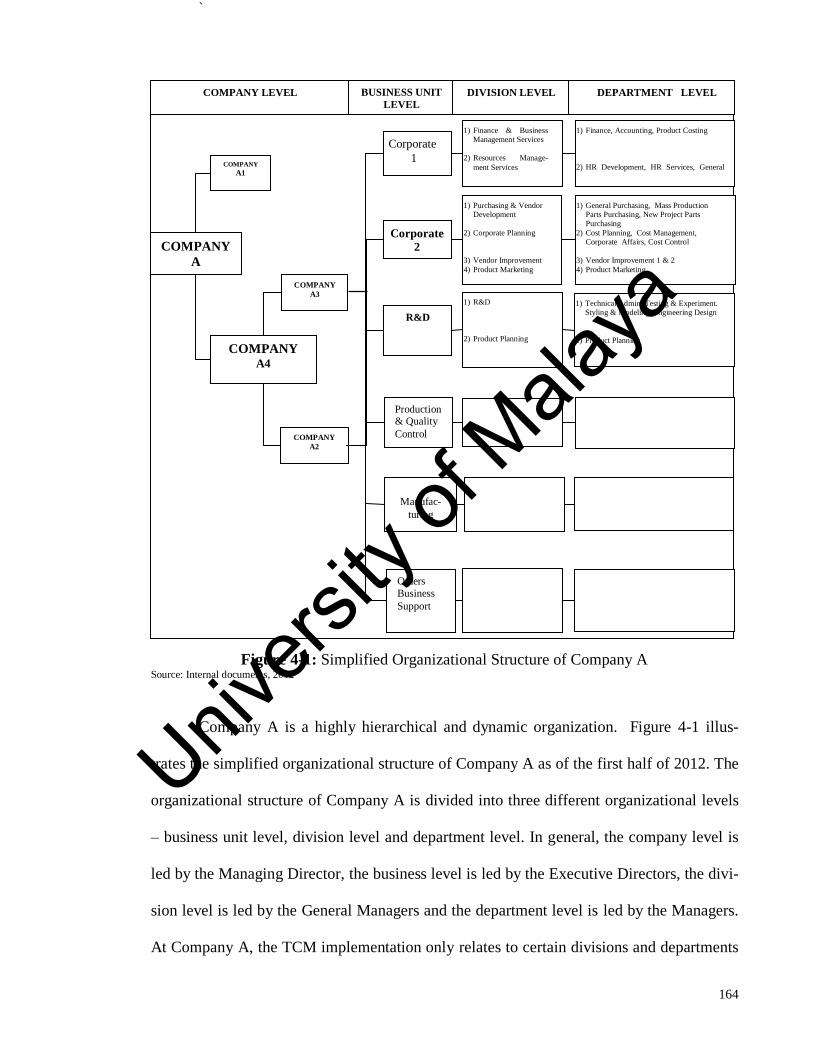
`
164
Figure 4-1: Simplified Organizational Structure of Company A Source: Internal documents, 2012
Company A is a highly hierarchical and dynamic organization. Figure 4-1 illus-
trates the simplified organizational structure of Company A as of the first half of 2012. The
organizational structure of Company A is divided into three different organizational levels
– business unit level, division level and department level. In general, the company level is
led by the Managing Director, the business level is led by the Executive Directors, the divi-
sion level is led by the General Managers and the department level is led by the Managers.
At Company A, the TCM implementation only relates to certain divisions and departments
COMPANY
A
COMPANY
A1
COMPANY
A4
COMPANY
A3
COMPANY
A2
Corporate
1
Corporate
2
R&D
Production & Quality
Control
Manufac-
turing
Others
Business
Support
1) Finance & Business Management Services
2) Resources Manage-
ment Services
1) Purchasing & Vendor Development
2) Corporate Planning
3) Vendor Improvement
4) Product Marketing
1) R&D
2) Product Planning
1) General Purchasing, Mass Production Parts Purchasing, New Project Parts Purchasing
2) Cost Planning, Cost Management, Corporate Affairs, Cost Control
3) Vendor Improvement 1 & 2
4) Product Marketing
1) Technical Admin. Testing & Experiment. Styling & Modeling, Engineering Design
2) Product Planning
1) Finance, Accounting, Product Costing
2) HR Development, HR Services, General
Administration. Clinc Admin., Security
COMPANY LEVEL BUSINESS UNIT
LEVEL DIVISION LEVEL DEPARTMENT LEVEL
Univers
ity of
Mala
ya
`
165
under Company A4. Thus, Figure 4-1 only provides details of the organizational structure
of the divisions and departments that are involved with TCM implementation. As of 2012,
the business units under Company A4 are Corporate 1, Corporate 2, Research and Devel-
opment (R&D), Production and Quality Control, Manufacturing and other business support
units. Under the Corporate 1 business unit, the divisions are Finance and Business Man-
agement Services, and Resources Management Services. Under Corporate 2 business unit,
the divisions are Purchasing and Vendor Development, Vendor Improvement, Corporate
Planning, and Product Marketing. Under the R&D business unit, the divisions are R&D and
Product Planning. The TCM activities of Company A are anchored by the Cost Planning
Department under the Corporate Planning Division of the Corporate 2 business unit. Be-
sides the Cost Planning Department, the TCM activities mainly involve the Engineering
Design Department of the R&D Division, Product Planning Division, New Project Parts
Purchasing Department of Purchasing and Vendor Development Division, and the Product
Marketing Division. The TCM also indirectly involves the Finance and Business Manage-
ment Services Division of Corporate 1 business unit and the Vendor Improvement Division
of Corporate 2 business unit.
Nevertheless, since Company A was a dynamic organization, this organizational
structure was not static. From when the case study started in 2010 until the end of the case
study period, there was frequent re-structuring within the business unit and division levels,
which involved the re-organization of departments within the organization.
Univers
ity of
Mala
ya
`
166
4.6 Qualitative approach
As highlighted by Yin (2003), qualitative data can be collected through several
common ways, such as documentation, archival records, interviews, direct observation, par-
ticipant observation and physical artefacts. However, in this study, the qualitative data were
only collected through interviews, documentation and direct observation. The following
section explains the qualitative data collection in terms of its instrument development, data
collection procedures and data analysis method.
4.6.1 Interview
For the case study, interviews are the most important source of data. Yin (2003)
emphasizes that “interviews are an essential source of case study evidence because most of
the case studies are about human affairs. These human affairs should be reported and inter-
preted through the eyes of the specific interviewees, and well informed respondents who
can provide important insights into a situation” (Yin, 2003, p. 92). Furthermore, interviews
also provide quick information concerning the previous history of the situation, which helps
the researcher to identify other relevant sources of evidence (Yin, 2003).
4.6.1.1 Interview instrument development
This case study used preliminary interview or unstructured informal interview and
in-depth interviews. For the preliminary interview, it was conducted informal, flexible and
free flowing conversation with no specific of questions. This preliminary interview was
used as a preliminary step in the research process to help the researcher become familiar
with the current phenomena, to understand the overall structure of the TCM implementa-
tion and to identify the main key players of TCM at Company A. As for the in-depth inter-
Univers
ity of
Mala
ya
`
167
views, the interview questions were based on the interview protocol set forth in Appendix
C. The interview protocol was developed based on Ellram (2000) and Ellram et al. (2006)
and re-constructed to suit the research objectives and the research questions. After setting
the initial draft of the interview protocol, it was shown to two academicians and one practi-
tioner for comments, after which the interview protocol was revised and re-designed before
being finalized.
The interview protocol was divided into two sections; section A focused on the
TCM while section B focused on the background of the interviewees. In section A, there
were 56 interview questions, which were divided into four main parts. In the first part, the
questions were designed to understand the TCM implementation history of Company A.
The questions in the second part were designed to understand the TCM implementation
process at Company A. The questions in the third part were designed to understand the is-
sues concerning TCM implementation and the questions in the final part were designed to
understand the results of TCM implementation. In the second part, the questions on the
TCM implementation process were divided into five small categories – Plan Stage, Do
Stage, Check Stage, Action Stage and enablers of the TCM practices. The details of the
TCM implementation process were divided into the PDCA cycle stages (Plan-Do-Check-
Action) in order to understand the TCM process easier. In setting the questions on the TCM
implementation process and TCM enablers, the conceptual and theoretical frameworks
were used as guidelines.
However, the interview protocol and research frameworks were not considered as
definite or comprehensive. This was because the interviews were guided conversations ra-
Univers
ity of
Mala
ya
`
168
ther than structured inquiries. In the case study interview, the actual flow of the questions
asked was flexible rather than rigid (Yin, 2003).
4.6.1.2 Interview data collection
Open-ended interviews and focused interviews are the most common types of in-
terview conducted in case studies (Yin, 2003). These interviews can be conducted in sever-
al ways such as face-to-face interviews, telephone interviews and computer assisted inter-
views (Cavana, Delaheya, & Sekaran, 2000). This research used the purposive sampling
method because this sampling method helped to focus on the specific target group with
confined key respondents who were able to contribute a lot on the issues related to the re-
search (Boeije, 2010; Cavana et al., 2000).
In the first interview stage, the researcher used preliminary interviews through in-
formal face-to-face conversations to gain freer responses from the respondents involved.
For this interview stage, there were no particular criteria set for the selection of the re-
spondents. The respondents were introduced by the researcher’s contacts. Since, the objec-
tives of the preliminary to generate ideas about the subject being investigated, this inter-
view was not guided by a specific set of questions. Nevertheless, for each interview session
with the respondent, the researcher introduced herself and explained the objectives of the
session. Through the preliminary interview process, the research found out how the Com-
pany A’s employees think and how they react to subject under investigation. This input was
necessary to frame and finalize the interview protocol and survey questionnaire, so that the
interview and survey questions would be almost natural to the respondents.
Univers
ity of
Mala
ya
`
169
After understanding some of the background and having identified several key in-
formants from the preliminary interviews, the official data collection began with in-depth
interviews in the second and third interview stage. In these stages, the interviews were con-
ducted based on the interview protocol attached in Appendix C. The data collection was
gathered through in-depth interviews with a few key personnel of Company A who were
involved with TCM from the related departments. These included Product Marketing, Pur-
chasing and Vendor Development, Cost Control, Product Planning, Research and Devel-
opment, Accounting, Cost Planning Department, and a few of Company A’s suppliers. The
profile of the interview respondents will be explained in Chapter 5.1.
Generally, the interview questions were passed to the respondents three days be-
fore the actual interview process. The interviews were conducted on premises of Company
A or those of its suppliers. Before starting the interview, the objectives of the interview
were explained to the respondents. The interview protocol and TCM implementation pro-
cess conceptual framework was used to guide the interviewer during the interview process.
By using such guidance, the uniformity and consistency of data can be assured. During the
face-to-face interviews, the probing method was also used to follow the flow of the inter-
view. In addition, a few new additional questions were asked to probe for more information
during the interview sessions. In the event of a conflict of information, the respondents
were also asked directly about their opinions about the TCM implementation process and
the enablers outlined by the literature and previous respondents. However, some of the in-
terviews were conducted in a spontaneous way with the basic guidelines as the interviewees
felt uncomfortable in a formal setting. In any event, some clarification was needed after the
in-depth interviews were conducted; hence, following the interviews, emails were sent to
the respondents to obtain further clarification. After each interview session, the respondents
Univers
ity of
Mala
ya
`
170
were thanked personally. Upon request, the report findings were shared with the respond-
ents.
Notes were taken during the interview sessions and most of the interviews were dig-
itally recorded. However, due to certain business issues and confidentiality, some partici-
pants were reluctant to have a formal session and refused to be digitally recorded. In this
case, soon after each interview was completed, the researcher summarized and reconfirmed
all the points that had been highlighted by the respondents.
4.6.1.3 Interview data analysis
Generally, whenever possible, with the approval of the respondents, all the inter-
views were digitally recorded to ensure a full understanding. However, hence the objective
of the preliminary interview to get general preliminary information on the subject being
studies, no data analysis was made for study report. The in-depth interviews conducted in
second and third interview stage were analysed but not fully transcribed, inasmuch as the
main purpose of the research was not to have a full record of speech and transcript. Besides
the digital recording of the interviews, the researcher also took written notes during the in-
terviews. Then, all the field notes were used as a reference during the interview data analy-
sis. After being transcribed, a draft was sent to the respondents for verification of the facts
and comments. This was to verify the analysis made and to ask detailed questions for clari-
fication. Subsequently, all the feedback was incorporated to refine the analysis. Moreover,
the objectives of this process were to reduce researcher bias and increase the reliability of
the results, which, ultimately, increase the internal consistency and content validity.
Univers
ity of
Mala
ya
`
171
In order to triangulate and conclude the data collection derived from the interviews,
cross-case analysis was made. This cross-case analysis was made by grouping the answers
together from different persons with the common topics or questions from the interview
guidelines (Patton, 1990). Then, the case study interviews were analysed through content
analysis. Here, the content analysis was defined as a process of identifying, coding and cat-
egorizing the primary pattern of the data. This analysis also allowed the themes to emerge
from the raw data (Cavana et al., 2001). In this research, NViVo8 software was used to
code, categorize and analyse the content analysis.
4.6.2 Direct observation
Direct observation evidence is data collected from field visits and observation of
meetings, sidewalk activities, and factory work, et cetera (Yin, 2003). The observations can
range from formal, such as observation of meetings, to casual data collection activities,
such as a field visit. The findings are usually useful in offering additional information to the
research (Yin, 2003).
There are five important reasons for observation. First, it helps the researcher to ob-
tain a comprehensive “picture” of the site and “a sense of setting”, which cannot be gained
by talking to people. Second, it provides a “rich description” for further analysis and inter-
pretation. Third, it helps the researcher to understand the culture of the case company.
Fourth, it enables the researcher to understand the experience of the interview respondents
who are less articulate. And, finally, it helps the researcher to crosscheck and validate the
data obtained from the interview (Simon, 2009).
Univers
ity of
Mala
ya
`
172
4.6.2.1 Direct observation data collection
In this research, direct observation data collection was made through company
presentations, meetings, field visits and during interviews. The opportunity for direct ob-
servations was made by frequent visits to the case study setting. In this research, the obser-
vation data were collected under three stages. The first stage started as soon as the re-
searcher gained access to the case company through field visits. In this stage, the observa-
tion objectives were mainly to evaluate the social acceptance towards outsiders and to veri-
fy that the case company was conducting TCM. This observation mostly covered the organ-
izational culture in terms of information sharing openness among workers, facilities and the
equipment existing in the case company, and factory shop floor condition, et cetera. In this
stage, informal and formal interaction with various levels of employee of the case company
helped the researcher to understand the background culture of the case company.
After the basic concepts, themes and the main key respondents of TCM had been
identified, the selection of observation sites were more selective and focused. Starting from
the second stage observation, the observations were carried out in TCM related meetings
and activities, such as quality gate meetings for each new product development stage, inter-
nal cost reduction meetings, cost reduction meetings with suppliers, monthly cost achieve-
ment meetings, daily meetings of the Cost Planning Department and many others. The ob-
jective of this stage was to clarify the TCM implementation process, issues and themes for
strengthening and solidified strategies with others data collection methods. Finally, the last
stage of observation was conducted after the results of the survey were finalized. The re-
sults were used as a base to re-observe and re-evaluate the TCM implementation process,
Univers
ity of
Mala
ya
`
173
issues and themes at the case company. At this stage, the continuation of the TCM activities
after the mass production stage was also observed.
4.6.2.2 Direct observation data analysis
The observations were recorded in the field notes. Then, the observation findings
were compared against the preliminary conceptual framework and theoretical framework.
The initial findings from the observation were used as the guidelines to finalize the selec-
tion of enablers that support the TCM implementation. As highlighted in Chapter 2, there
are many enablers highlighted by the previous studies. The initial observation findings
helped the researcher to select the right enablers as the proposition before conducting the
survey. Furthermore, the findings from the observation were used to understand the actual
TCM implementation process conducted at the case company. For example, how the team
members consult with one another to resolve issues, and how the issues relates to other
stages. These findings were used to strengthen the conceptual framework for the TCM im-
plementation process.
Nevertheless, the data analysis was developed simultaneously with the documenta-
tion and interview data collection. If there was any conflicting observation, it was com-
pared with what had been highlighted by the respondents and written in the documents, the
questions were raised during the interviews to obtain clarification from the key respondents.
4.6.3 Documentation
Documentation data evidence can be collected through agendas, announcements and
minutes of meetings, written reports of events, and administrative documents, such as pro-
Univers
ity of
Mala
ya
`
174
posals, progress reports, and articles appearing in the mass media or in newspapers (Yin,
2003). Data sources from documents are very important to corroborate and enhance the ev-
idence from other data sources. Documents help the researcher to verify spelling, names
or titles mentioned in the interviews, and provide details to corroborate with other data
sources. In addition, the inference from documents may lead to new questions and new
findings (Yin, 2003).
4.6.3.1 Documentation data collection
In general, the documents were collected based on three stages. In the first stage, the
documents collected were more general, which focused on the company background and
overview of the TCM practice. Examples of the general documentation include company
information from the case company official website, company quarterly magazines, press
releases, newspaper and magazine articles.
The second and third stages of document collecting were mostly based on the TCM
related matters, which involved the meetings attended by the researcher and the documents
received during the interviews. However, for the third stage, the documents collected fo-
cused more on the new findings, especially to find relevant evidence relating to the survey
results. With the consent of the case company, examples of documents collected in this
stage included internal documents, such as cost achievement progress report, management
presentation, slide presentations, cost reduction meeting minutes, and cost related activity
reports and proposals. The researcher also received specific internal documents, such as
TCM training material, TCM practices guidelines and TCM related standard working pro-
cedures. These documents were shown by the respondents during the interview sessions
Univers
ity of
Mala
ya

`
175
and meetings attended by the researcher. Upon receiving the internal documents, a brief
explanation was made by the respondents. The researcher also re-analysed the internal doc-
uments before continuing with the subsequent interviews.
4.6.3.2 Documentation data analysis
All the documents were reviewed and summarized using the Document Summary
Sheet. Appendix D shows the blank format sample of the Document Summary Sheet. By
using the Document Summary Sheet, each main document was summarized into three main
items: a brief description of the document, the significance of the document to the research
and a summary of the document contents. Then, for easy data storage and retrieval, an an-
notated bibliography of these documents was established (Yin, 2003). Due to the large
amount of documents, the documents were separated into a primary file and secondary file
to categorize the importance of the database (Yin, 2003).
All the findings from the documentation were triangulated with the findings from
the interviews and direct observation to strengthen the research findings and conclusions.
These findings were combined and categorized to address the conceptual and theoretical
frameworks. If any conflicting data or discrepancy occurred, the questions were raised dur-
ing the next interview session or/and a short telephone interview was conducted to verify
the discrepancy.
4.6.4 Data analysis method
Every case study analysis should have a general analytic strategy to define the prior-
ities of what to analyse and for what reason. Three types of general analytic strategy are: 1)
Univers
ity of
Mala
ya
`
176
to follow the theoretical propositions, 2) to define and test rival explanation, and 3) to de-
velop the case description. For a single case study, any of these strategies can be used with
specific analytic techniques: pattern matching, explanation building, addressing rival ex-
planations and logic models, for case study analysis (Yin, 2003). In this research, the data
analysis was based on the conceptual and theoretical frameworks using the pattern match-
ing technique.
4.6.4.1 Pattern matching
Pattern-matching plays an important role in case study research analysis. According
to Yin (2003), five main elements should be considered in designing the case study: 1) re-
search questions, 2) units of analysis, 3) propositions, 4) the logic linking the data to the
propositions, and 5) the criteria for interpreting the findings. Pattern-matching is related to
the last three elements. The pattern matching is conducted by comparing the empirical
based pattern against the predicted pattern of the research (Yin, 2003). The basic steps of
pattern matching are as follows. First is to develop the theory as a predicted or proposition
before data collection. Second is to define the criteria use for data collection. Third is to
compare the actual or empirical pattern with the predicted pattern based on the predeter-
mined criteria. If the predicted pattern matches the actual pattern, a solid conclusion can be
drawn (Yin, 2003).
For data analysis, this research relied on the conceptual and theoretical frameworks
set prior to the data collection stage. After all the qualitative data had been coded, catego-
rized and analysed, pattern matching was conducted. This started with developing the em-
pirical pattern based on the collected data. Based on the research questions, two types of
Univers
ity of
Mala
ya

`
177
empirical pattern were developed, the TCM implementation process empirical pattern and
the TCM enabler empirical pattern. For the TCM implementation process empirical pattern
development, the collected data were arranged in a time-series empirical pattern chronology
to match with TCM PDCA cycle stages. Then, the empirical pattern and conceptual pattern
were matched by analysing the pattern in terms of what, who, when and how. For example,
in each PDCA stage, “what the activities were” in the empirical pattern was matched
against “what the activities should have been” in the conceptual pattern, “who had been in-
volved” against “who should have been involved”, “what methods had been used and how”
against “what methods should have been and how” and “when the activities had been con-
ducted” against “when the activities should have been conducted”.
For the TCM enabler analysis, the TCM enabler empirical pattern and the predicted
pattern or the theoretical propositions, were matched by analysing the pattern in terms of
“what enablers existed” in the empirical pattern against “what enablers should have exist-
ed” in the predicted pattern. Each proposition was assessed separately. If the proposition
was deemed to be satisfied, it was selected to be used in the survey questionnaire and tested
statistically. If the proposition was not deemed to be satisfied, it was dropped from the sur-
vey items.
4.7 Quantitative approach
This section explains the quantitative approach in terms of development of the sur-
vey instrument, data collection procedures and data analysis method. The main objective of
the questionnaire survey was to test statistically the enablers highlighted by the literature
and identified during the qualitative data collection.
Univers
ity of
Mala
ya
`
178
4.7.1 Survey
Yin (2003) posits that a survey facilitates a more structured interview, which can be
designed as part of the case study to produce quantitative data. It follows the same method
of sampling procedure, instruments and analysis as the normal survey method but with a
different role. The findings from the survey are considered as one of the components of the
overall assessment and not necessarily taken as the ultimate result in the assessment of the
study (Yin, 2003). In this research, the survey questions were designed to generate quantita-
tive data as part of the case study evidence. The survey questions were distributed to Com-
pany A’s employees who were directly or indirectly involved with TCM.
4.7.1.1 Development of survey instrument
Generally, the questionnaires were adapted from previous research and were re-
constructed to suit the research questions. Since there was a tendency for the survey ques-
tionnaire to be misunderstood, several stages were structured to obtain a comprehensive
questionnaire. Then, the questionnaire was pre-tested by six academicians and three TCM
practitioners. The objective was to rectify any questionnaires inadequacy and to ensure the
content of the questionnaire was clear, relevant and easy to be understood before the ques-
tionnaires were distributed to the respondents at large. After receiving the feedback, the
structure and wording of the questionnaire was revised including words that were ambigu-
ous. Here, the researcher also added a few additional questions to make it more comprehen-
sive. The questionnaire was not pilot-tested because most of the survey instrument was
adapted from established existing research.
Univers
ity of
Mala
ya
`
179
The survey questions were divided into three sections. The questions in section 1
were related to the proposed factors that support the TCM implementation. The questions in
section 2 were related to the perceived successful implementation of TCM. The last section
asked the respondents for demographic data. For the TCM enablers, the items used to oper-
ationalize the constructs were taken from previous researchers: Advanced Manufacturing
Technology (AMT) implementation measurement adapted from Burgess and Gules (1998),
confrontational strategy measurement adapted from Zahay and Griffin (2010), a customer
orientation measurement adapted from Narver and Slater (1990), an information-sharing
network measurement adapted from Chen et al. (2010), lean manufacturing implementation
measurement adapted from Chenhall (1997), supplier relationship measurement adapted
from Carr and Pearson (1999), a teamwork oriented organizational culture measurement
adapted from Lynn and Akgun (2003), top management support and commitment meas-
urement adapted from Krumweide (1998) and Anderson and Young (1999), and training
measurement were adapted from Saraph et al. (1989) and Krumweide (1998). The variable
of TCM successful implementation was measured by three dimensions – efficiency, mar-
ketability and cost reduction improvement. The measurements of TCM successful imple-
mentation were adapted from Huh et al. (2008). The constructs and the sources are sum-
marized in the Table 4-2.
Univers
ity of
Mala
ya
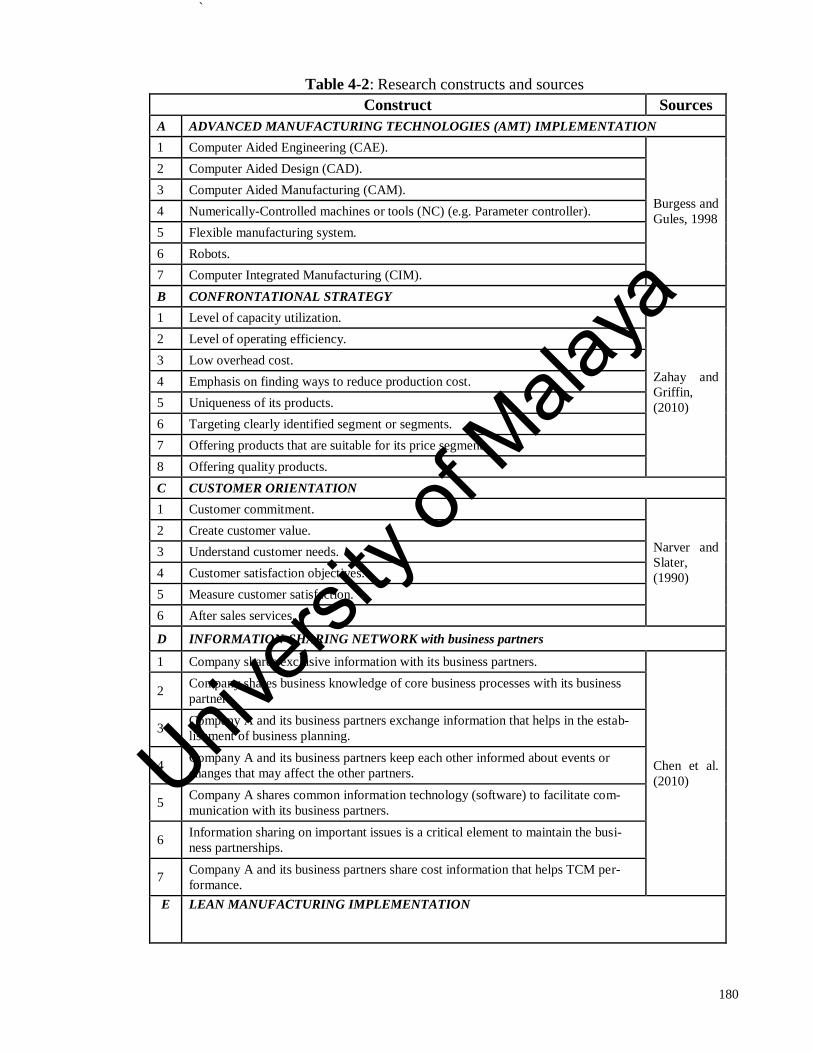
`
180
Table 4-2: Research constructs and sources
Construct Sources
A ADVANCED MANUFACTURING TECHNOLOGIES (AMT) IMPLEMENTATION
1 Computer Aided Engineering (CAE).
Burgess and
Gules, 1998
2 Computer Aided Design (CAD).
3 Computer Aided Manufacturing (CAM).
4 Numerically-Controlled machines or tools (NC) (e.g. Parameter controller).
5 Flexible manufacturing system.
6 Robots.
7 Computer Integrated Manufacturing (CIM).
B CONFRONTATIONAL STRATEGY
1 Level of capacity utilization.
Zahay and
Griffin,
(2010)
2 Level of operating efficiency.
3 Low overhead cost.
4 Emphasis on finding ways to reduce production cost.
5 Uniqueness of its products.
6 Targeting clearly identified segment or segments.
7 Offering products that are suitable for its price segment.
8 Offering quality products.
C CUSTOMER ORIENTATION
1 Customer commitment.
Narver and
Slater,
(1990)
2 Create customer value.
3 Understand customer needs.
4 Customer satisfaction objectives.
5 Measure customer satisfaction.
6 After sales services.
D INFORMATION-SHARING NETWORK with business partners
1 Company shares exclusive information with its business partners.
Chen et al.
(2010)
2 Company shares business knowledge of core business processes with its business
partners.
3 Company A and its business partners exchange information that helps in the estab-
lishment of business planning.
4 Company A and its business partners keep each other informed about events or
changes that may affect the other partners.
5 Company A shares common information technology (software) to facilitate com-
munication with its business partners.
6 Information sharing on important issues is a critical element to maintain the busi-
ness partnerships.
7 Company A and its business partners share cost information that helps TCM per-
formance.
E LEAN MANUFACTURING IMPLEMENTATION
Univers
ity of
Mala
ya
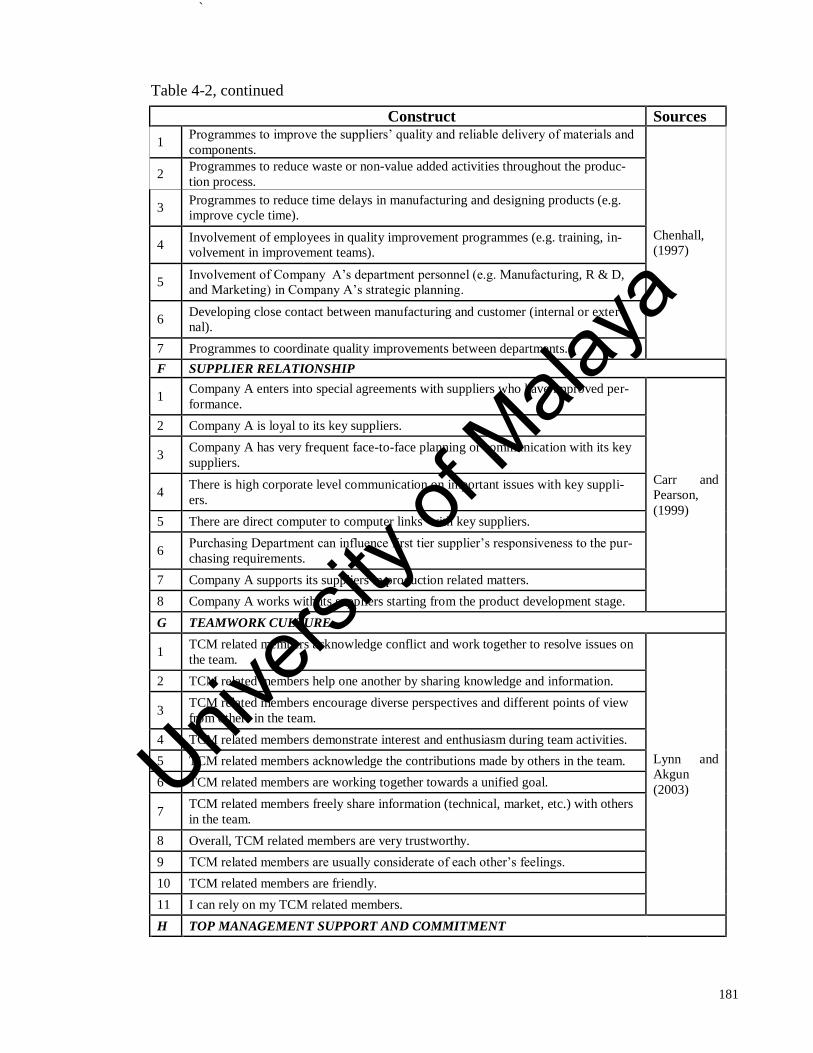
`
181
Table 4-2, continued
Construct Sources
1 Programmes to improve the suppliers’ quality and reliable delivery of materials and
components.
Chenhall,
(1997)
2 Programmes to reduce waste or non-value added activities throughout the produc-
tion process.
3 Programmes to reduce time delays in manufacturing and designing products (e.g.
improve cycle time).
4 Involvement of employees in quality improvement programmes (e.g. training, in-
volvement in improvement teams).
5 Involvement of Company A’s department personnel (e.g. Manufacturing, R & D,
and Marketing) in Company A’s strategic planning.
6 Developing close contact between manufacturing and customer (internal or exter-
nal).
7 Programmes to coordinate quality improvements between departments.
F SUPPLIER RELATIONSHIP
1 Company A enters into special agreements with suppliers who have improved per-
formance.
Carr and
Pearson,
(1999)
2 Company A is loyal to its key suppliers.
3 Company A has very frequent face-to-face planning or communication with its key
suppliers.
4 There is high corporate level communication on important issues with key suppli-
ers.
5 There are direct computer to computer links with key suppliers.
6 Purchasing Department can influence first tier supplier’s responsiveness to the pur-
chasing requirements.
7 Company A supports its suppliers in production related matters.
8 Company A works with its suppliers starting from the product development stage.
G TEAMWORK CULTURE
1 TCM related members acknowledge conflict and work together to resolve issues on
the team.
Lynn and
Akgun
(2003)
2 TCM related members help one another by sharing knowledge and information.
3 TCM related members encourage diverse perspectives and different points of view
from others in the team.
4 TCM related members demonstrate interest and enthusiasm during team activities.
5 TCM related members acknowledge the contributions made by others in the team.
6 TCM related members are working together towards a unified goal.
7 TCM related members freely share information (technical, market, etc.) with others
in the team.
8 Overall, TCM related members are very trustworthy.
9 TCM related members are usually considerate of each other’s feelings.
10 TCM related members are friendly.
11 I can rely on my TCM related members.
H TOP MANAGEMENT SUPPORT AND COMMITMENT
Univers
ity of
Mala
ya
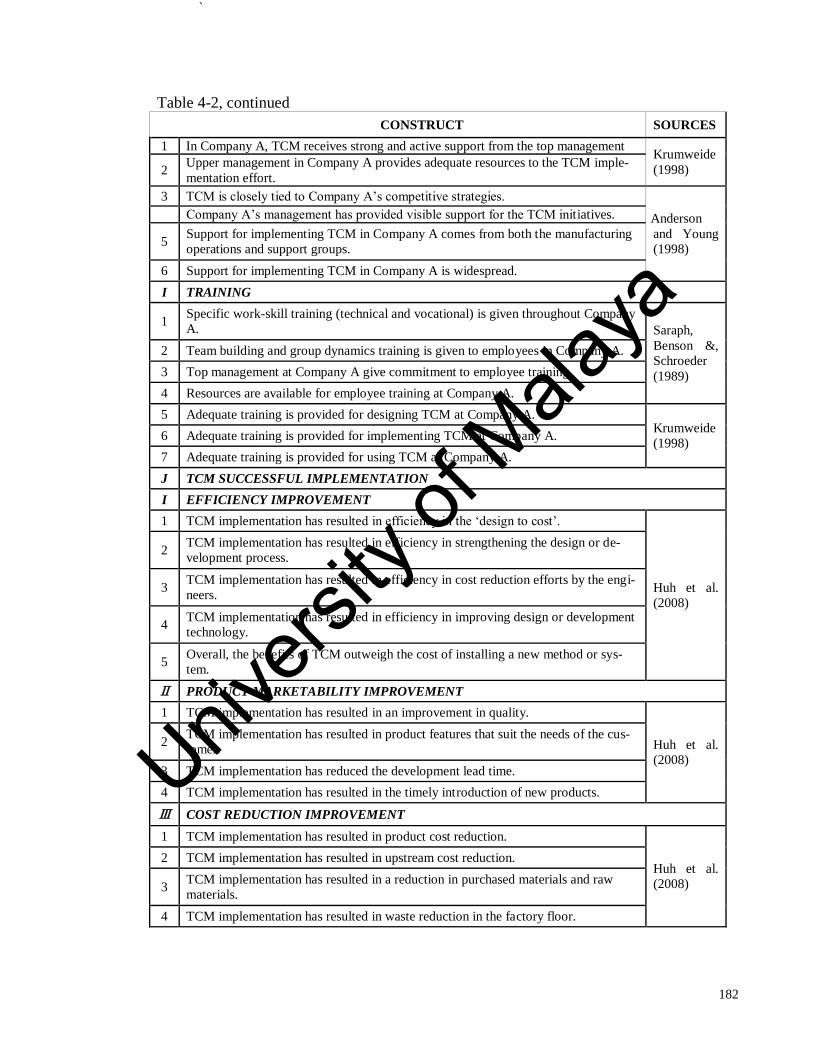
`
182
Table 4-2, continued
CONSTRUCT SOURCES
1 In Company A, TCM receives strong and active support from the top management Krumweide
(1998) 2 Upper management in Company A provides adequate resources to the TCM imple-
mentation effort.
3 TCM is closely tied to Company A’s competitive strategies.
Anderson
and Young
(1998)
4 Company A’s management has provided visible support for the TCM initiatives.
5 Support for implementing TCM in Company A comes from both the manufacturing
operations and support groups.
6 Support for implementing TCM in Company A is widespread.
I TRAINING
1 Specific work-skill training (technical and vocational) is given throughout Company
A. Saraph,
Benson &,
Schroeder
(1989)
2 Team building and group dynamics training is given to employees in Company A.
3 Top management at Company A give commitment to employee training.
4 Resources are available for employee training at Company A.
5 Adequate training is provided for designing TCM at Company A. Krumweide
(1998) 6 Adequate training is provided for implementing TCM at Company A.
7 Adequate training is provided for using TCM at Company A.
J TCM SUCCESSFUL IMPLEMENTATION
I EFFICIENCY IMPROVEMENT
1 TCM implementation has resulted in efficiency in the ‘design to cost’.
Huh et al.
(2008)
2 TCM implementation has resulted in efficiency in strengthening the design or de-
velopment process.
3 TCM implementation has resulted in efficiency in cost reduction efforts by the engi-
neers.
4 TCM implementation has resulted in efficiency in improving design or development
technology.
5 Overall, the benefits of TCM outweigh the cost of installing a new method or sys-
tem.
Ⅱ PRODUCT MARKETABILITY IMPROVEMENT
1 TCM implementation has resulted in an improvement in quality.
Huh et al.
(2008)
2 TCM implementation has resulted in product features that suit the needs of the cus-
tomer.
3 TCM implementation has reduced the development lead time.
4 TCM implementation has resulted in the timely introduction of new products.
Ⅲ COST REDUCTION IMPROVEMENT
1 TCM implementation has resulted in product cost reduction.
Huh et al.
(2008)
2 TCM implementation has resulted in upstream cost reduction.
3 TCM implementation has resulted in a reduction in purchased materials and raw
materials.
4 TCM implementation has resulted in waste reduction in the factory floor.
Univers
ity of
Mala
ya
`
183
The AMT implementation construct measured seven items: Computer Aided Engi-
neering, Computer Aided Design, Computer Aided Manufacturing, Numerically-Controlled
machines or tools, Flexible manufacturing system, Robotics and Computer Integrated
Manufacturing (Burgess & Gules, 1998). All these items were measured using multiple
seven-point Likert scales ranging from 1= “not at all” to 7= “To a great extent”.
The confrontational strategy was measured by eight items: level of capacity utiliza-
tion, level of operating efficiency, low overhead cost, focus on finding ways to reduce cost,
uniqueness of its products, targeting the identified segments, offering products that are suit-
able with it price segments and offering quality product (Zahay & Griffin, 2010). Original
items were slightly modified to adapt with the research context. All these items were meas-
ured using multiple seven-point Likert scales ranging from 1= “not at all” to 7= “To a great
extent”.
The customer orientation was measured by six items: customer commitments, create
customer value, understand customer needs, customer satisfaction objectives, measure cus-
tomer satisfaction and after sales services (Narver & Slater, 1990). All these items were
measured using multiple seven-point Likert scales ranging from 1= “not at all” to 7= “To a
great extent”.
Information-sharing network was measured by seven items: case company shares
exclusive information with its business partners, case company shares business knowledge
of core business processes with its business partners, case company exchanges information
with its business partners for business planning purpose, both case company and its busi-
Univers
ity of
Mala
ya
`
184
ness partners keep each other informed about events or changes that may affect the other
partners, case company shares common information technology to facilitate communication
with its business partners, information sharing on important issues is a critical element to
maintain the business partnerships, and case company and its business partners share cost
information that helps TCM performance (Chen et al., 2010). The original items were
slightly modified to adapt to the research context. All these items were measured using
multiple seven-point Likert scales ranging from 1= “strongly disagree” to 7= “strongly
agree”.
The lean manufacturing construct was measured by seven items: programmes to
improve the suppliers’ quality and delivery, programmes to reduce waste or non-value add-
ed activities, programmes to reduce time delays in manufacturing and designing products,
involvement of employees in quality improvement programmes, involvement of depart-
ments’ personnel in company’s strategic planning, developing close contact between manu-
facturing and customer, and quality improvements programmes between departments
(Chenhall, 1997). All these items were measured using multiple seven-point Likert scales
ranging from 1= “not at all” to 7= “To a great extent”.
The supplier relationship construct was measured by eight items: case company en-
ters into special agreements with suppliers who have improved performance, case company
is loyal to its key suppliers, case company has very frequent face-to-face planning or com-
munication with its key suppliers, high corporate level communication on important issues
with key suppliers, direct computer to computer links with key suppliers, Purchasing De-
partment capability to influence supplier’s responsiveness to the case company’s require-
Univers
ity of
Mala
ya

`
185
ments, case company supports its suppliers in production related matters and case company
works with its suppliers starting from the product development stage (Carr & Pearson,
1999). The original items were slightly modified to adapt to the research context. All these
items were measured using multiple seven-point Likert scales ranging from 1= “strongly
disagree” to 7= “strongly agree”.
Teamwork orientation organization culture was measured by eleven items: TCM re-
lated members acknowledge conflict and work together to resolve issues, TCM related
members help one another by sharing knowledge and information, TCM related members
encourage diverse perspectives and different points of view from team members, TCM re-
lated members demonstrate interest and enthusiasm during team activities, TCM related
members acknowledge the contributions made by team members, TCM related members
are working together towards a unified goal, TCM related members freely share infor-
mation with team members, respondent feels the TCM related members are trustworthy,
respondent feels that the TCM related members are usually considerate of each other’s feel-
ings, respondent feels that the TCM related members are friendly and respondent feels the
TCM related members are reliable (Lynn & Akgun, 2003). Original items were slightly
modified to adapt to the research context. All these items were measured using multiple
seven-point Likert scales ranging from 1= “strongly disagree” to 7= “strongly agree”.
The top management support and commitment construct was measured by six
items: TCM receives strong and active support from the top management, upper manage-
ment provides adequate resources to the TCM implementation, TCM is closely tied to case
company’s competitive strategies, management has provided visible support for the TCM
Univers
ity of
Mala
ya
`
186
initiatives, TCM practice receives support from manufacturing operations and support
groups, and TCM practice received company wide support (Krumweide,1998; Anderson
and Young, 1998). The original items were slightly modified to adapt to the research con-
text. All these items were measured using multiple seven-point Likert scales ranging from
1= “strongly disagree” to 7= “strongly agree”.
The training construct was measured by seven items: specific work-skill training
(technical and vocational) is given throughout company, team building and group dynamics
training is given to employees, top management’s commitment to employee training, re-
sources are available for employees training, adequate training is provided for designing
TCM, adequate training is provided for implementing TCM, adequate training is provided
for using TCM (Krumweide, 1998; Saraph, Benson &, Schroeder, 1989). Original items
were slightly modified to adapt to the research context. All these items were measured us-
ing multiple seven-point Likert scales ranging from 1= “strongly disagree” to 7= “strongly
agree”.
TCM successful implementation was operationalized by three performance dimen-
sions: design and development efficiency improvement, product marketability improve-
ment and cost reduction improvement. All these items were measured by seven-point Likert
scales ranging from 1= “strongly disagree” to 7= “strongly agree”. The original items were
slightly modified to adapt to the research context. Design and development efficiency im-
provement was measured by five items, which assessed the TCM performance on efficien-
cy improvement in terms of: “design to cost”, strengthening the design or development pro-
cess, cost reduction efforts by the engineers, improving design or development technology
Univers
ity of
Mala
ya
`
187
and the benefits of TCM outweigh the cost of installing a new method or system. Product
marketability improvement was measured by four items, which assessed the TCM perfor-
mance on marketability improvement in terms of: quality, product features that suit the
needs of the customer, reduction in development lead time and timely introduction of new
products. Cost reduction improvement was measured by four items, which assessed the
TCM performance on cost reduction improvement in terms of: product, upstream processes,
purchased materials and raw materials, and waste on the factory floor (Huh et al., 2008).
4.7.1.2 Survey data collection
Even though the Company A has around 10,000 employees, through the initial quali-
tative data collection, it was identified that only a few departments and personnel were di-
rectly or indirectly involved with TCM in Company A. In general, the total number of di-
rect and indirect TCM users was less than 200 personnel. Departments such as Cost Plan-
ning, Product Marketing, Research and Development, Purchasing and Vendor Development,
Product Planning were considered as the directly involved with TCM because of their high
involvement in TCM processes. As for Accounting and Vendor Improvement Department,
it was considered as indirectly involved with TCM due to their low involvement in TCM
processes. In spite of their low involvement, these departments were still likely to recognize
the necessary enablers that support the successful implementation of TCM at Company A.
No questionnaires were distributed to departments that did not have any involvement with
TCM processes. According to Cavana et al. (2000), “As a rule of thumb, sample size be-
tween 30 and 500 could be effective depending on the type of sampling design used and
research question investigated” (Cavana et al., 2000, p. 280). Considering the small popula-
tion of Company A’s employees who directly or indirectly involved in TCM, only one-
Univers
ity of
Mala
ya
`
188
hundred sets of survey questionnaires in printed booklet form were distributed to the re-
spondents by the researcher herself and by the researcher’s contacts. A cover letter from
the researcher was attached with the survey questionnaires ensuring anonymity and confi-
dential of the respondents. The following items were included in the survey booklet:
1. Survey cover letter (Refer to Appendix F)
2. Explanation of study and terms used and how to answer the questionnaire (Refer
to Appendix G)
3. Survey form (Refer to Appendix H)
The respondents provided their feedback to the survey questions in the printed
booklet. For all the survey questions, a seven-point Likert scale was used to rate the re-
spondents’ feedback on the measurement items. The scale was anchored on the low end by
“not at all or strongly disagree” and high end by “To a great extent or strongly agree”. Un-
der each group of measurement variables, a free space column was also provided for re-
spondents to include any additional remarks. These remarks were considered as part of the
respondents’ feedback and quoted as qualitative findings.
Considering the range of the survey questions, the survey was distributed to re-
spondents for a one-week period to allow adequate time for completion. Once completed,
the survey was submitted to the designated collection areas and collected by the researcher
and researcher’s contacts. In this way, the researcher had no knowledge as to which re-
spondent gave which survey response and anonymity was guaranteed. With the researcher’s
contacts assistance, almost all respondents managed to submit the feedback within the des-
Univers
ity of
Mala
ya

`
189
ignated period. Nevertheless there were less than 10 percent of respondents who did not
reply on the stipulated time. Through researcher’s contacts, it was known that non-replied
respondents’ reason was too busy with current tasks to complete a survey. This confirma-
tion was important to avoid non- bias response issue. For non-replied respondents, no fur-
ther follow up was made to the respondents because the replied rate almost reached 90 per
cent.
4.7.1.3 Survey data analysis
For data analysis, all the questions were coded into code numbers as listed in Ap-
pendix I. Then, all the survey results were input into an Excel spreadsheet based on these
codes before transferring it into Statistical Package for Social Science (SPSS) Version 18
and Smart Partial Least Squares (PLS) Version 2.0 for detail statistical analysis. SPSS was
used to analyse the demography of the respondents, whereas PLS was used to statistically
test the TCM enablers. PLS is a multiple regression method for testing models with multi-
ple item constructs. It is useful when the factors are many, there are many missing data,
they are highly collinear and the sample size is relatively small. Furthermore, PLS is a suit-
able methodology for exploratory research and model testing (Kwun & Alshare, 2007).
Hulland (1999) contends that compared with PLS, LISTERL, a well-known causal model-
ling technique, is poorly suited for small data sample sizes as it results in improper solu-
tions in some cases. In conjunction with this, he advocated that PLS is a suitable method
to counter small data sample issues (Hulland, 1999). Hence, as this research has 80 meas-
urements aggregated into 10 groups, PLS was the appropriate method to test the model.
Univers
ity of
Mala
ya
`
190
The data will be assessed in two stages. The first stage is the measurement model
assessment. In this stage, the purpose is to evaluate the reliability and validity of the con-
structs and indicators. The data will be assessed in terms of indicator reliability, internal
consistency reliability, convergent validity and discriminant validity (Henseler, Ringle, &
Sinkovics, 2009). The second stage is structural model assessment. The structural model
visualizes the relationship between the exogenous and endogenous variables by using the
path diagram. Then, the data will be assessed in terms of path coefficient, t-value and R² by
using bootstrapping procedures (Henseler, Ringle, & Sinkovics, 2009).
4.8 Validity and reliability issues
The quality of the social research design can be evaluated using four common tests
– construct validity, internal validity, external validity and reliability. By integrating these
tests in the research design, readers will have the confidence in the process of the investiga-
tion, data analysis, data interpretation and the findings (Yin, 2003). In case study research
design, these tests are applied from the design stage until the data conclusion stage (Yin,
2003). This section discusses the validity and reliability issues and the approaches used to
address the issues.
4.8.1 Construct validity
In case study research, there are three tactics to increase the construct validity. First
is the use of multiple sources of evidence during the data collection. Data triangulation can
be achieved by corroborating the same phenomena and data from multiple sources. “With
data triangulation, the potential problems of construct validity can also be addressed be-
cause the multiple sources of evidence essentially provide multiple measures of the same
Univers
ity of
Mala
ya
`
191
phenomenon” (Yin, 2009, p. 117). Second is to establish a chain of evidence during the da-
ta collection. Third is to have the draft of the case study report to be reviewed by the key
informants (Yin, 2003). Regarding validation of the respondent, Simons (2009) posits that
this allows the individual to validate whether they have been presented fairly and accurately,
and to decide the credibility of the interpretation. However, the researcher still needs to
cross check with other data sources and have criteria as a guideline to decide whether the
respondents’ responses are worth (Simon, 2009).
In this research, multiple data sources were used and data collections were taken in
a few stages and organized to increase the construct validity. The objectives were to pro-
duce more robust findings and interpretations. Then, in order to establish the chain of evi-
dence, data verification processes were conducted in each data collection method. For in-
terview data collection verification, the researcher summarized the field notes before end-
ing each interview and concluded the main findings with the respondents in order to obtain
the initial confirmation. Then, after transcribing the interviews, the written summaries were
given to the respondents to validate the content interpretation. For the document data col-
lection verification, the collected data from documents, such as newspaper articles, compa-
ny documents, and meeting minutes, were also discussed during the interviews sessions.
For the observation data collection verification, the findings were discussed with the main
key respondents and related members of the event being observed and were discussed with
the interviewees during the interview sessions. In this way, the results of all data collec-
tion findings were crosschecked closely for triangulation. If inconsistent results were de-
tected, additional individuals were interviewed or additional company documents and in-
formation were collected to resolve it. However, if inconsistent and inaccurate information
Univers
ity of
Mala
ya
`
192
issues were unable to be resolved, it was omitted from the findings. After concluding the
study, a copy of the case report was given to a few key informants for review.
4.8.2 Internal validity
Internal validity is developed by establishing the causal relationship by showing
certain conditions that lead to other conditions. This is to differentiate it from a spurious
relationship. In the case study data analysis, pattern matching is one of the techniques to
increase the internal validity. The empirical based pattern is compared against the predict-
ed pattern of the research. If the patterns match, the results help to strengthen the internal
validity of the case study (Yin, 2003).
In this research, pattern matching was conducted to increase the internal validity.
Pattern matching was developed through a few steps. First, for the purpose of benchmark-
ing, two predicted patterns were made, a conceptual framework of the TCM implementa-
tion process and a theoretical proposition of successful TCM enablers. Second, all the qual-
itative data collected on the TCM implementation process and TCM enablers were orga-
nized in empirical patterns. Finally, the empirical patterns and the predicted patterns were
compared by analysing whether they were in line with one another based on predefined cri-
teria. Generally, what, who, when and how were used as the criteria for analysis compari-
son. This helps to conduct a more comprehensive analysis on the TCM implementation
process and key enablers for successful implementation of TCM.
Univers
ity of
Mala
ya
`
193
4.8.3 External validity
External validity is to test “whether a study’s findings are generalizable beyond the
immediate case study” (Yin, 2003, p. 37). Yin (2003) emphasizes that a statistical generali-
zation is possible in survey research where the sample can be generalized to a larger uni-
verse. However, for case studies, a statistical generalization is not possible due to the pur-
posefully small sample to examine a phenomenon in-depth. Thus, for case studies the gen-
eralization relies on analytic generalization. Analytic generalization is generalization in
“which a previously developed theory is used as a template with which to compare the em-
pirical results of the case study. If two or more cases are shown to support the same theory,
replication may be claimed” (Yin, 2003, p. 33). In case studies, a complete research design
represents the “theory” of what is being studied (Yin, 2003). In addition, according to
Cavana et al. (2001), case studies can only be replicated to organizations that have a similar
situation in terms of the nature of the problem and problem definition.
In order to allow successful transferability, from this research study context to a
reader’s present context, the researcher provided thick descriptions of the research for the
purpose of reference and comparison. The early section of this chapter explained the under-
lying theory development of this research in detail, such as how the case study site selection
was made, how the conceptual and theoretical frameworks were developed, how the data
collection instrument was developed, and how the samples were selected. This information
will help readers to make decisions regarding how closely the contexts may or may not
match.
Univers
ity of
Mala
ya
`
194
4.8.4 Reliability
The reliability test is to ensure other researchers can derive the same findings by fol-
lowing the same research procedures outlined by the original researcher. The objective of
the reliability test is to minimize the biases and errors. By properly documenting the proce-
dures of the case study and making the steps as operational as possible, other researchers
can repeat the process and gain the same results. In addition, reliability can be increased by
using the case study protocol (Yin, 2003).
Regarding the researcher’s bias and respondent bias issues, the researcher admits
there might be a possibility of bias between the researcher and the study contexts in terms
of the organization, the organization members and the issues related to the study. In order
to reduce the bias, the researcher did her best to minimize the effect of the relationship by
integrating the opinions from various departments. As one of the respondent bias counter-
measures, the study was conducted over a long period of about 22 months. This allowed the
respondents to be more relaxed and behave naturally (Cavana et al., 2000). Furthermore,
the researcher also performed case study protocol. This protocol helped the researcher to
carry out data collection by focusing on the case study subject and anticipate the case study
problems. The overview of the case study protocol was covered in section 4.4.
4.9 Summary
This chapter depicted the research design used to investigate the TCM implementa-
tion process, possible causes of the differences, and the key enablers that have a positive
association with the successful implementation of TCM. It covered the justification for us-
ing a single embedded case study, selection of the research site and the research design ac-
Univers
ity of
Mala
ya
`
195
tivities conducted in terms of instrument development, data collection and data analysis.
This chapter also explained the approach taken to handle the validity and reliability issues.
In this research, a case study was selected as the research method mainly because it
was the most appropriate approach to uncover the research questions. Since the develop-
ment of TCM in Malaysia is still new and TCM is environment specific (Feil, Yook, &
Kim, 2004; Nishimura, 2005), the TCM implementation at Company A can be considered
as a unique case. Moreover, considering the size of the organization and its market share,
and its strategic alliance with a Japanese automotive company, this company offered a
unique environment and the best site for data collection. Accordingly, this research used a
single embedded case study with Company A’s employees as the subunit. The main objec-
tive of the subunit was to understand in-depth the critical enablers that support the success-
ful implementation of TCM.
This case study research was based on Yin’s (2003) positivism case study method in
which the data were collected through multi-source collection mainly through interviews,
document review, direct observation and survey. This helps to increase the validity through
data triangulation. To understand the TCM practice at the case company, the data were col-
lected using the qualitative approach. Then, the analysis was made by comparing the empir-
ical patterns with the predicted patterns from conceptual and theoretical frameworks by us-
ing the pattern matching method. For the enablers of TCM, the data were collected using
the qualitative approach and then re-collected using the quantitative approach. Then, the
survey was analysed using SPPS and PLS applications.
Univers
ity of
Mala
ya

`
196
The findings of the TCM implementation process and its enablers will be explained
separately under the qualitative findings and quantitative findings in Chapters 5 and 6, re-
spectively. Chapter 5 will discuss the qualitative findings of the TCM implementation pro-
cess, and the qualitative assessment of the each TCM enablers. Then, Chapter 6 will discuss
the statistical analysis of the TCM enablers.
Univers
ity of
Mala
ya
`
197
CHAPTER 5: QUALITATIVE FINDINGS
5.1 Introduction
This chapter discusses the qualitative findings of this research. Accordingly, this
chapter synthesizes the qualitative data collected from the interview, documents and direct
observations to identify how TCM is being practiced and to assess the enablers that support
the successful implementation of TCM. The conceptual framework for the TCM implemen-
tation process and TCM enablers’ theoretical framework are used as guidance for the data
analysis.
The organization of the chapter is as follows. The first section discusses and anal-
yses the profile of the interview respondents. The next two sections answer the research
question one: (1) How do the TCM practices in a typical Malaysian automotive company
differ from the Japanese automotive companies’ TCM model?, and research question two:
(2) Why do the differences in TCM occur?. It starts with the discussion on the develop-
ment history of TCM at Company A. This section describes and discusses the perspective
of TCM from Company A’s viewpoint. The following section discusses the qualitative
findings concerning the overall TCM implementation process at Company A guided by the
PDCA cycle stages and seven main process steps, as outlined in the conceptual framework.
Under each step, the explanation of Company A’s TCM practice is provided. This is fol-
lowed by the analysis of the comparison against the conceptual framework.
Then, the following section answers the third research question three: (3) Which en-
ablers are perceived by the TCM users of a typical Malaysian automotive company as the
critical enablers that have a positive association with the successful implementation of
Univers
ity of
Mala
ya
`
198
TCM?. However, the assessment only focuses on nine key constructs: (1) Advanced Man-
ufacturing Technology (AMT) implementation, (2) confrontational strategy, (3) a customer
orientation, (4) an information-sharing network, (5) lean manufacturing implementation, (6)
supplier relationships, (7) a teamwork oriented organizational culture, (8) top management
support and commitment and (9) training. Although other factors were also identified dur-
ing the qualitative data collections, those factors were omitted from discussion. This omis-
sion was made due to inconsistency of information provided by the respondents and lack of
supporting evidence. Finally, this chapter also discusses the respondents’ opinions concern-
ing their perceived successful implementation of TCM in terms of cost reduction im-
provement, design and development efficiency improvement, and marketability improve-
ment.
5.2 Interview respondents’ profile
As shown in Table 5-1, the interviews covered various managerial levels within the
Company A from different departments, including technical staff, lower management, mid-
dle management and top management who were involved with TCM. The respondents
were selected based on purposive sampling method through the introduction of researcher’s
contacts and other respondents’ reference. This helped the researcher to focus on the specif-
ic target group with confined key respondents who were expert in the research topic (Boeije,
2010; Cavana et al., 2000). In total, there were 24 respondents and 24 interview sessions,
which, on average, lasted 1 to 2 hours for each session. Most of the informants were male.
It was impossible to do gender balancing in the respondent selection as the population in
the automotive industry is male dominated. In average, the respondents had 10 years of
working experience. In order to preserve the anonymity of the respondents, code numbers
Univers
ity of
Mala
ya
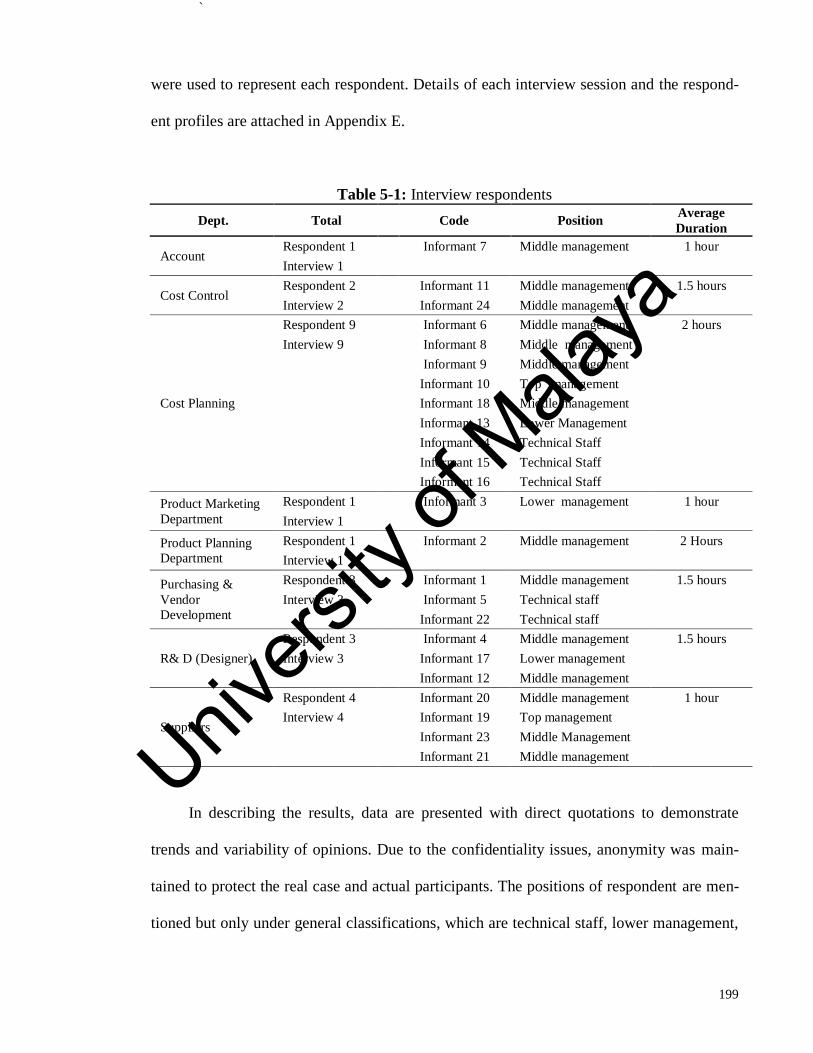
`
199
were used to represent each respondent. Details of each interview session and the respond-
ent profiles are attached in Appendix E.
Table 5-1: Interview respondents
Dept. Total
Code Position Average
Duration
Account Respondent 1 1 Informant 7 Middle management 1 hour
Interview 1
Cost Control Respondent 2 1 Informant 11 Middle management 1.5 hours
Interview 2 2 Informant 24 Middle management
Cost Planning
Respondent 9 1 Informant 6 Middle management 2 hours
Interview 9 2 Informant 8 Middle management
3 Informant 9 Middle management
4 Informant 10 Top management
5 Informant 18 Middle management
6 Informant 13 Lower Management
7 Informant 14 Technical Staff
8 Informant 15 Technical Staff
9 Informant 16 Technical Staff
Product Marketing
Department
Respondent 1 1 Informant 3 Lower management 1 hour
Interview 1
Product Planning
Department
Respondent 1 1 Informant 2 Middle management 2 Hours
Interview 1
Purchasing &
Vendor
Development
Respondent 3 1 Informant 1 Middle management 1.5 hours
Interview 3 2 Informant 5 Technical staff
3 Informant 22 Technical staff
R& D (Designer)
Respondent 3 1 Informant 4 Middle management 1.5 hours
Interview 3 2 Informant 17 Lower management
3 Informant 12 Middle management
Suppliers
Respondent 4 1 Informant 20 Middle management 1 hour
Interview 4 2 Informant 19 Top management
3 Informant 23 Middle Management
4 Informant 21 Middle management
In describing the results, data are presented with direct quotations to demonstrate
trends and variability of opinions. Due to the confidentiality issues, anonymity was main-
tained to protect the real case and actual participants. The positions of respondent are men-
tioned but only under general classifications, which are technical staff, lower management,
Univers
ity of
Mala
ya
`
200
middle management, and top management. However, the respondents’ departments are
mentioned to demonstrate the tendency and variation of the respondents’ answers based on
the department.
5.3 History of TCM implementation at Company A
Company A is a Malaysian-Japanese joint venture (JV) company, which was estab-
lished in the early 1990s. Since its establishment, many Japanese expatriates from Compa-
ny A’s joint venture companies have worked at Company A. According to the internal
sources, the concept of TCM was taught by the Japanese expatriates to the management of
Company A in the early years of the company’s establishment.
The case company has implemented TCM since its establishment. The development
of TCM at the case company was a gradually embedded process rather than a drastic em-
bedded process. The implementation of TCM started from cost reduction activities through
localization activities and negotiation activities of existing purchased parts. Then, the cost
reduction activities expanded to “design to cost” at the design stage to secure profit for its
new products. Nevertheless, the TCM activities at Company A could be considered as an
evolving process with continuous improvement rather than a rigid and fixed method. This
is because a project review post mortem was conducted after each new product started its
mass production. From here, the TCM process issues were extracted, the improvements or
the counter measures were planned for the next new product. According to the internal
sources, these improvements only changed and improved the TCM activities in terms of
how to achieve the target cost. No changes were made to the fundamental concept of TCM.
Univers
ity of
Mala
ya
`
201
5.3.1 TCM implementation stages
In general, the TCM implementation at Company A could be divided into two stag-
es: (1) the period before the re-structuring of Company A and (2) the period after the re-
structuring of Company A.
5.3.1.1 Period before the re-structuring of Company A.
In the early years of Company A’s establishment, all vehicles manufactured at
Company A were fully developed by Company M. Company M is a Japanese automotive
manufacturer and one of Company A’s joint ventures partners. Company A only introduced
a few small design changes to the exterior upper body of the predecessor product to meet
the Malaysian markets, such as changing the front, rear bumper and back door.
Before the re-structuring of Company A, TCM activities were conducted but to a
limited extent through cost reduction activities of localization and negotiation with suppli-
ers. Localization means changing the sourcing of parts from CKD, imported from Japan, to
locally produced parts. Through localization of activities, Company A helped to increase
the demand for local parts and reduced the foreign exchange impact of the CKD parts.
Nevertheless, in the initial stage, the target cost setting of the local parts was flexible and
less rigid. This was because the main objective of localization activities was to get the cost
savings compared to its original CKD parts cost. The localization would be implemented if
the cost of the local candidate supplier’s parts were lower than the cost of the CKD parts
and passed the local parts testing. The localization activities from setting the target cost un-
til negotiation with suppliers were highly segmented on a departmental basis. For example,
the Cost Control Department under the Accounting Division focused on setting the target
Univers
ity of
Mala
ya
`
202
cost and monitored the cost level of the vehicle, the R&D Department focused on the tech-
nical aspects of the parts, and the Purchasing and Vendor Development Department fo-
cused on the part cost negotiation with suppliers. As commented by Product Marketing
personnel, before the re-structuring of Company A, TCM was less integrated:
… (Previously) certain departments or certain groups doing their tasks
process by process. After completed one process, second process continues.
Now, first process and second process (for example), there are so called
joined, integrated or simultaneous activities. That is a new improvement.
(Informant 3, Lower management, Product Marketing Dept.).
It can be concluded that before the re-structuring of Company A, TCM activities
were implemented to some extent but they were not formally centralized, they were non-
simultaneous and the activities were very limited.
5.3.1.2 Period after the re-structuring of Company A
At the end of 2001, Company A was restructured in order to prepare the company to
enhance its capabilities and competitiveness towards the challenges arising from liberaliza-
tion of the AFTA market. Under this re-structuring, Company A4 was established as a sub-
sidiary that fully controlled the manufacturing operations of Company A with the majority
of the shares being under its Japanese partners. Consequently, this re-structuring triggered
the full reinforcement of the TCM implementation with the re-establishment of the Cost
Planning Section. At Company A, “Cost Planning” was a common term used to represent
the TCM.
Univers
ity of
Mala
ya

`
203
Before the restructuring, the Cost Planning Section was already established but only
as a small section under the Product Planning Department in the R&D Division. The re-
structuring separated the Cost Planning Section from the R&D Division and re-established
the Cost Planning Department under the Corporate Planning Division. Since the restructur-
ing, the head of the Cost Planning Department was led by a Japanese expatriate from Com-
pany M. Under this re-structuring the new functions of the Cost Planning Department were
to coordinate the entire activity plan for the Cost Planning activities, to summarize the prof-
itability and cost estimation of the whole vehicle, to determine the cost estimation of the
internal parts that is mutually agreed by all related departments, to propose an overall target
cost and its distribution to the respective departments, to set up a standard cost table for the
entire company’s usage and to promote knowledge to the personnel directly involved in the
development of parts. In general, the main function of the Cost Planning Department was to
plan and conduct the cost planning activities or TCM activities for securing the new mod-
el’s profit.
In the early stage, after the establishment of the Cost Planning Department, the
TCM activities more focused on the cost reduction of purchased parts for existing products,
in-house cost, warranty cost, overhead cost and logistics cost. Under the purchased part
cost, the cost reduction activities were localization activities, VE and negotiation of dis-
count. Furthermore, Company A’s products only involved small design changes compared
to its predecessor products. Thus, less emphasis was made to reduce the cost through prod-
uct design in the design and development stage.
Univers
ity of
Mala
ya
`
204
Starting from the second half of 2002 onwards with the development of passenger
car, Model X (the predecessor product of model X1), Company A gradually produced
products in which most of the upper body parts were developed by Company A. Subse-
quently, the TCM activities gradually started to focus on cost reduction through product
design in the design and development stage.
In early 2011, the Cost Planning Department, Cost Control Department and Cost
Management Department were centralized under the Accounting Division to strengthen the
cost related activities of Company A. Cost Planning Department was responsible for the
cost of the new products, Cost Management Department was responsible for the overall
cost reduction of existing products, and Cost Control Department was responsible for the
manufacturing cost of the existing products. Later, at the end of 2012, Company A started
to make major organizational changes by integrating a few functions and departments under
the Research and Development Division. These organizational changes also involved the
Product Marketing Department, Purchasing and Vendor Development Department and the
Cost Planning Department. The main objective for the re-structuring of the organization
was to strengthen Company A’s product design and development.
The re-structuring of the organization impacted on the TCM practice in terms of the
roles and responsibility of the departments involved and the accuracy of the cost estimation.
For example, in the early establishment of the Cost Planning Department, one of its respon-
sibilities was to estimate the cost of the purchased parts. This was because in the early
stages, most of the cost reduction activities for the purchased parts focused on localization.
Thus, the target cost was mainly derived from the CKD cost level. This cost information
Univers
ity of
Mala
ya

`
205
could only be obtained by the Cost Planning Department from its counterpart at Company
M. Later, as the TCM developed, the estimation was done together with other TCM mem-
bers from the Purchasing and Vendor Development Department and R&D Department. The
main objective was to obtain a more realistic estimated cost for the purchased parts. Never-
theless, this estimation was based on the current cost level information of the existing prod-
ucts’ purchased parts. From here, cost reduction target was imposed to meet the target cost.
Generally, the purchased parts target cost setting at the Company A was based on the com-
bination method. However, at the end of the research, the case company started to imple-
ment the top-down method in setting the target cost for its new products (other than Model
X1 and Model X2). In the top-down method, the target cost of purchased parts cost was set
based on the benchmark costs of Company M’s products to meet the global competitive
level. This new target cost setting method was anchored by the R&D Department.
The TCM activities at the case company were an evolving process with gradual im-
provement. Generally, after the end of each project, the TCM activities were reviewed and
the improvement would be implemented for the next new product development. Neverthe-
less, for each project the basic concept of TCM was the same, except the strategies or
methods used to set, achieve and monitor the target cost. For example during the Model X,
since Company A had just started to produce most of the upper body parts, huge investment
was made for in-house facilities, and high development costs for technical support. Thus,
besides the monitoring of the cost of the purchased parts, management also focused on
monitoring the development and investment costs. However, since Model X1, a full model
change of Model X, the focus was solely on monitoring the cost of the local purchased
parts because it was the major contributor to the vehicle cost. Furthermore, since the in-
Univers
ity of
Mala
ya
`
206
house facilities already existed, less new investment was made for the development of
Model X1. Furthermore, in terms of the purchase parts, as the information became availa-
ble, more solid and realistic methods were used to set the target cost of the purchased parts.
5.3.2 Why Company A started to fully implement TCM
There were two main reasons as to why the Company A started to implement TCM
fully. First was to remain profitable by preparing the company for tough competition after
AFTA. Company A recognized that the liberalization of the automotive market made the
market more competitive. Since the re-structuring, Company A already started to equip it-
self towards the challenges of AFTA with the specific mission to achieve certain targets in
the Customer Satisfaction Index (CSI), cost reduction and market share by launching the
“Triple T” Vision (pseudonym). This vision helped to give awareness to all employees
about the company’s direction. As commented by the respondents, the main objective of
TCM implementation was for profit planning, which helped the company to remain profit-
able against stiff automotive market competition.
I think the reason (of TCM implementation) may be because competition is get-
ting very stiff. We have to make sure we achieve the overall profit that we
want…TCM will determine the profit of the company. (Informant 2, Middle
management, Product Planning Dept.)
Cost Planning (TCM) is for Profit Planning. If P2 doesn’t have Cost Planning
(TCM activities) I think it is quite tough, difficult to plan profit especially for
new models. (Informant 6, Middle management, Cost Planning Dept.)
I think it (the TCM implementation) is in line with the management’s profitabil-
ity targets. I believe when you want to have a profit, of course you have to see
in many different angles for example like raw material process whether you are
competitive or not. And I think with the bigger volume of exclusive parts, you
must ensure that the actual overall yield is feasible. (Informant 4, Middle man-
agement, R&D Dept.).
Univers
ity of
Mala
ya
`
207
The second reason was because of the new management direction after the re-
structuring of Company A. Since its restructuring, Company M is the main shareholder of
Company A4 that controlled the manufacturing operation. Accordingly, the Cost Planning
Section was also re-established in the same year to strengthen the TCM activities. As com-
mented by the R&D middle management:
... To say that Company M is 100% actual push factor (to implement TCM)
is not correct. Actually, management (Company A) wants it. But Company
M assists in terms of how and of course they would implement how it is
done in Japan and transfer it here. (Informant 4, Middle management,
R&D Dept.).
Nevertheless, Company M played a main role in triggering the implementation and
influencing the practice of TCM in Company A. In fact, since its restructuring, the Cost
Planning Department was led by the Japanese managers. Thus, most of the TCM methods
were copied from Company M. Furthermore, prerequisite for any project to start is to re-
ceive an approval from Company M. This was because Company A relied on the technical
aspect from Company M and Company M was among the main shareholders of Company
A. Accordingly, the direction or the strategies planned must be in line with the direction of
Company M. On the question of how Company M influenced the Company A’s TCM prac-
tice, the Cost Planning middle management commented that:
Company A’s Cost Planning (TCM) activities have a lot of influence from
Company M. Company M’s Cost Planning (TCM) way is changing. Accord-
ingly, Company A way is also changing (follow Company M). Project by
project Company M’s (Cost Planning/TCM) direction is actually different.
Actually, the project approval has to get approved both from Company A
and Company M (top management). Especially, Company M has lots of
Univers
ity of
Mala
ya
`
208
power. If direction is against the Company M’s direction, the project cannot
get approval from Company M. So, whenever we propose a project, we need
to understand the Company M’s (Cost Planning) direction. (Informant 6,
Middle management, Cost Planning Dept.).
Company A relied on the support of Company M for TCM implementation. This was
because the personnel in the Cost Planning Department, the Department that anchored the
TCM activities, were still new and had limited TCM experience. Furthermore, most of the
personnel were engineers with limited background of accounting knowledge. Additionally,
the high turnover rate of the Cost Planning personnel meant that the knowledge of the TCM
was not retained. As commented by the middle management of R&D Department,
Company M’s management or Company M’s intervention also comes into
the picture because we can say that our Cost Planning (CP) Department is
still young, and in that sense Company M has a stronger hand in that team.
So, I would say and I would believe that actually Company M has quite a lot
of say in this item. The original team under our CP (department) was dis-
solved. Because many left and then there was a new team. So, the develop-
ment of the CP group itself is actually still not yet mature. So, because of
that Company M still plays a bigger role. (Informant 4, Middle management,
R&D Dept.)
It can be concluded that Company A started implementing TCM thoroughly be-
cause of the new management direction and to remain profitable after AFTA. However, the
TCM practice was influenced by Company M as the shareholder and technical partner of
Company A, the technology and the lack of knowhow of Company A’s personnel.
Univers
ity of
Mala
ya

`
209
5.3.3 TCM perceived definition
At Company A, TCM was known as Cost Planning. There were no documents
found using TCM term and none of the respondents familiar with the TCM term. Since
TCM concept was introduced by Company M, the Japanese ex-patriates at Company A
called TCM as “Genka kikaku”. As highlighted by the previous scholars (Sakurai, 1989;
Feil, Yook, & Kim, 2004; Huh et al., 2008), there are various translations found to repre-
sent “Genka kikaku” such as Target Costing, Target Cost Management, Cost Planning and
Cost Projection. In order to make the respondents more familiar and comfortable in each
interview session, the TCM term was replaced with Cost Planning.
Generally, at Company A, Cost Planning was defined as an activity to plan and se-
cure the new product’s profit. As stated in the company documents, the Cost Planning ac-
tivities were defined as:
An activity to secure the profit planning of all models (products), from the
profit planning stage until the phase off stage (Source: Internal document).
However, even though all the respondents acknowledged the Cost Planning activi-
ties definition in the company’s documents, the individual respondents’ definitions of Cost
Planning varied. In the interviews conducted with the Cost Planning Department personnel
who were directly involved in TCM, their definitions of Cost Planning or TCM were as
follows.
Cost Planning (TCM) is an activity to achieve the target profit. (Informant
18, Middle Management, Cost Planning Dept.).
Univers
ity of
Mala
ya

`
210
Cost Planning (TCM) is an activity conducted to achieve the target cost set.
(But) Most of our activities are focused on achieving target cost not target
profit. By achieving target cost, automatically we achieve our target profit.
(Informant 16, Technical staff, Cost Planning Dept.).
Cost planning is planning activities. How to achieve the targets based on
what management wants and these targets not are necessarily in terms of
numbers. (Informant 14, Technical staff, Cost Planning Dept.)
In explaining TCM, one of the respondents highlighted that each product had a few
variants or grade types, such as basic, standard and high grade. Generally, Company A fo-
cused on the achievement of profitability for the overall portfolio. Nevertheless, certain
variants might be produced even though the management knew from the planning stage
that these variants would not be profitable. Similarly, Howard and Hebig (1996) also high-
lighted that the Japanese companies focused on portfolio profitability of all related prod-
ucts instead of focusing on the profitability of individual products. As commented by the
respondent:
Cost Planning (TCM) is an activity to achieve the target profit and target
cost agreed by the management. However, it does not mean that all variants
of the models (products) are profitable. Some of the variants might have
negative profit because the company has to produce it as a community ser-
vice. (Informant 13, Lower management, Cost Planning Dept.)
In summary, the case company defined TCM as a tool to secure the profit. How-
ever, instead of focusing on the profitability of the individual variants, Company A focused
on portfolio profitability. Furthermore, the TCM activities mainly focused on achieving the
target cost in order to achieve the target profit set by the top management.
Univers
ity of
Mala
ya
`
211
5.3.4 Perceived successful implementation of TCM
Besides profit, the TCM implementation helped the case company in terms of im-
proved efficiency, marketability, and cost reduction. Regarding the improvement in effi-
ciency, the target cost and target profit in TCM worked as specific goals for the employees,
especially for the TCM members. As commented by a respondent, the targets in TCM had
driven all the members in one direction who were striving to achieve it:
We set what we want and we work to get that. That’s why the target is very
important, in order for us to plan our activities or our concept or our ideas
(Informant 3, Lower management, Product Marketing Dept.).
TCM implementation also developed the members' knowledge by exposing them to
a wider perspective of their job’s value chain. For example, how their designs would impact
the product life cycle cost and overall costs. This developed their creativity and increased
the efficiency in design by cost.
My staffs have now learnt about the whole system. So, they are not only an
engineer “by design” but they also “design by cost”. So, that it is adding
value to them. That is probably not a really direct benefit but it is a benefit
(Informant 4, Middle management, R&D Dept.).
In terms of marketability, TCM helped Company A to understand the customers’
requirements and customers’ priorities from the results of the market surveys. Accordingly,
through tough trade off decisions due to the cost constraints, this market information helped
the management to make the right decision by selecting the customers’ most value added
function.
Univers
ity of
Mala
ya
`
212
During the Model Y, the Product Marketing proposed to have the split seat
and gear shift at the Instrument Panel (IP)... Lastly, our Product Marketing
agreed to take gear shift at IP because it has more priority (to the customer).
(Informant 2, Middle management, Product Planning Dept.).
Regarding cost reduction, the TCM implementation process helped Company A’s
employees to be cost conscious. In every decision, they identified cost as the main priority:
...For example, like what my staff would usually do when there are problems.
Usually they received “monren” parts with problems. Then, they do the
analysis and they will approach me with a few options. For example like they
have three kinds of counter measures, options A, B, and C. Options A, B and
C will also be given some cost and lead time. We do not necessarily choose
the cheapest, of course we will choose the best in terms of optimization of
lead time, schedule and cost. But, the cost definitely plays a big role (In-
formant 4, Middle management, R&D Dept.).
Additionally, through the TCM activities, TCM members also learned how to esti-
mate the cost of parts. This knowledge assisted the members to verify the suppliers’ quoted
price. This reduced the upstream cost and eventually reduced the total vehicle cost:
In an automotive industry like our company, every stage of development of the
parts we have to check the cost level and verify. Are the technical changes val-
id or not? So we want to gain a win-win situation with our suppliers. If we
don’t have the target cost, what is the basis that we want to challenge the sup-
pliers? (Informant 5, Technical staff, Purchasing & Vendor Development
Dept.).
Suppliers do not simply throw their quotation in without any consideration. So,
I think we can more or less control suppliers. Because we have our own basic
calculation, we know the range where the cost should be. So, we can control
our own overall vehicle cost and I think that will affect our overall profitabil-
ity (Informant 4, Middle management, R&D Dept.).
Accordingly, the TCM implementation helped Company A to communicate its
targets to the employees. Through TCM process implementation, TCM members
learned the value chain of the tasks, the impact of their design to the cost, the right
Univers
ity of
Mala
ya
`
213
cost level of the parts, and the features most valued by the customers. These
knowledge help to improve Company A’s efficiency and marketability, and elimi-
nate the unnecessary costs.
5.4 TCM implementation process at Company A
This section discusses the qualitative findings on the TCM practices, which were
guided by the conceptual framework for the TCM implementation process. The data were
obtained through interviews; company internal documents such as operation procedures,
presentation materials and reports; and observations through several TCM related meetings
attended by the researcher, such as cost reduction challenge meetings, morning meetings,
and TCM quality gates meetings.
At Company A, the Cost Planning or TCM activities were considered as a part of
New Product Development (NPD) activities. The NPD activities were planning activities
for the development of new product which were anchored by the Product Planning Division
of R&D business unit. Generally, at each major step of TCM implementation process,
Company A sets a quality gate meeting. It functions as the checkpoints with certain criteria
that need to be complied with. In each quality gate meeting, the decision to proceed to the
next stage was decided by the top management. Since TCM was a part of NPD, some of
the TCM quality gates were the same as those of the NPD.
For easy explanation, the TCM implementation process at Company A was narrated
in PDCA stages with seven steps. However, even though the process was narrated in seven
steps, the TCM process was actually very interactive and most of the activities happened
Univers
ity of
Mala
ya
`
214
simultaneously with the prior or next process because of simultaneous engineering. There
are four steps under the Plan stage: (1) setting the target selling price, (2) setting the target
profit, (3) setting the target cost, and (4) making the profitability feasibility study. The step
under the Do stage or execution stage is cost reduction activities conducted to achieve the
target cost. The step under the Check stage or monitoring stage is monitoring and reporting
of the cost achievement status. The step under the Act stage or improvement stage is cost
improvement. Then, under each step, the explanation is divided into two sections. The first
section explains the TCM practice of Company A. The second section summarizes the dif-
ferences of TCM practice in Company A compared to TCM conceptual framework shown
in Figure 3-1 in Chapter 3.
5.4.1 Plan stage
This sub-section explains the activities conducted at the case company in the Plan or
planning stage and compares the differences with the conceptual framework. There are four
TCM steps under the Plan stage of the PDCA cycle: (1) setting the target-selling price, (2)
setting the target profit, (3) setting the target cost, and (4) making the profitability feasibil-
ity study.
5.4.1.1 Step 1: Setting the target-selling price
a) TCM practice at Company A
The company used business planning and market survey information to set a realis-
tic target-selling price. For smooth explanation, the major elements in setting the target-
selling price are divided into three sub-sections: (i) business planning, (ii) market survey
and (iii) setting the target-selling price.
Univers
ity of
Mala
ya
`
215
i) Business planning
In general, Company A considered three main elements in setting the strategy for its
future business plan which were market condition, company strategies and company re-
sources. The market condition covered the economic and industrial condition including
government policy, competitors’ movement, and people’s lifestyle, et cetera. Company
strategies covered the business scale, profit, products positioning of the shareholder group,
and brand strategy, et cetera. Company resources covered the development and production
capability, sales network condition, and own technology, et cetera.
Company A made a long-term plan for its future product range. Agreement meet-
ings were conducted with its JV partners before fixing the long range product planning.
However, compared with previous years, this long-term product planning was reviewed
frequently to reflect the latest market condition. This is due to the frequent changes in com-
petitors’ products and changes in government policy, such as fuel price and bank loan in-
terest.
ii) Market survey
Company A made considerable efforts to understand the customers through various
market surveys. The Product Marketing Department was responsible for the market re-
search activities for the future products. Generally, there were three categories of surveys:
(1) annual market survey of existing products, (2) future trend market survey, and (3) new
product market survey. The annual market survey of existing products was conducted
twice a year. The objectives were to understand the customer feedback on the existing
Univers
ity of
Mala
ya
`
216
products and to understand current market trends. The future trend market survey was con-
ducted once a year. Company A used this information to understand the future market trend.
A new product market survey is a survey conducted on the target market for each new
product. However, before conducting the new product market survey, the product features
and specifications assumptions were already set by the Product Marketing Department.
These features and specifications assumptions were set based on previous analysis of the
annual and future product market surveys. Nevertheless, not all the information was based
on previous market surveys due to the time lag of updated market information. The compet-
itors’ products trend was also considered in deciding the new product features and specifi-
cations assumptions. The objective of new product market survey was mainly to verify the
product features and specification assumptions of the new product. Therefore, the target
market was sampled when the product was conceptualized to confirm the features and spec-
ification of the new product from the perspectives of potential customers only. Company A
did not conduct the new market survey to find out the requirements of the potential custom-
ers concerning the new product features and specifications. As emphasized by the Product
Marketing Department staff, the objective of the new product market survey was only to
verify the features and specification assumptions that had been forecast by the marketing
group.
We make some assumptions. Say we are going to make a new product, a lim-
ited version to the target customer. So, we make assumptions that the custom-
er is female customer, for body colour they want some specific colour, and
then they like some decoration, so that is our assumptions. And then with our
assumption we go out and ask people. You will accept this colour or not? This
colour is suitable for you or not? So we ask that kind of question. And once
we get the result, then we can show that our assumption is correct. (Informant
3, Lower management, Product Marketing Dept.).
Univers
ity of
Mala
ya
`
217
Nevertheless, in finalizing the product specifications, priority was given to the items
that were most valued by the customers based on the market research. A tough decision was
made by trade off of some specifications with the best specification items that were valued
by customers. As commented by the R&D middle management, customer value priority
was the most important element in making decisions when finalizing the product specifica-
tion:
… which is the priority, if I give this, you have to cost down or drop other
part…sort like barter system...if you choose gear shift at IP(Instrument Panel)
shift you cannot have split seat. You have to drop one because the cost is very
high… Lastly, our Product Marketing agreed to take gear shift at IP because it
has more priority (to the customer). (Informant 2, Middle management, Product
Marketing Dept.)
iii) Setting the selling price
Based on the internal and external input, and product features and specifications,
the tentative target-selling price was set by the Product Marketing Department. This tenta-
tive selling price would be reviewed again before the product launching by analysing the
latest product profitability status and market condition.
The Product Marketing Department conducted the Product Marketing Concept
meeting, one of the quality gate meetings in NPD, to get the top management’s approval to
proceed with the project and approval of a tentative selling price. Due to the confidentiality
of the issue, this meeting was only attended by the top management of certain related de-
partments. In justifying the tentative selling price to the top management, the product price
mapping was used to visualize and justify the product pricing against its competitors. The
product price mapping tabled out similar products of the closest competitors, and Company
Univers
ity of
Mala
ya
`
218
A’s predecessor product and new product with its price ranges by variants. All products
were clustered based on the brand and arranged on the X-axis. With the Y-axis as a price
axis, each product brand was arranged in order based on the price of its grade types or vari-
ants (i.e. basic, standard, high or premium grade), engine capacity (i.e. 1.0 litre, 1.3 litres or
1.5 litres) and engine transmission (i.e. manual or automatic) type. A comparison between
the predecessor product and the new product was also provided to show the new product
features and specifications differences. This visualization helped the top management to
easily understand the target market position, product price range position and current mar-
ket status.
In this Product Marketing Concept meeting, the market share of existing products’
against the Total Industry Vehicles (TIV), new product market strategy, target market,
trend and movement of competitors’ products, and projected volume were also presented to
the top management. The justification for the introduction or development of a new product
was also explained in detail to the top management. Generally, three types of justification
were used: (1) to enhance the model line-up, (2) to increase or sustain volume, or (3) to im-
prove profit. The predecessor product actual sales trend was used to support the justifica-
tion. Company A did not use any computer system simulation to predict the sales volume,
selling price or the model mix variant ratio.
Besides getting approval from Company A’s top management, the product concept
had to be approved by Company M’s top management. This was because during the devel-
opment and manufacturing side, Company A highly relied on Company M in respect of
technical expertise. After receiving approval for the Project Marketing concept from both
Univers
ity of
Mala
ya
`
219
sets of top management, the project was allowed to go to the next stage in which more de-
tailed studies were made by all the related departments.
The TCM activities or Cost Planning activities by the Cost Planning Department at
Company A only started after the Product Marketing Concept approval meeting. From here
onwards, the Cost Planning Department started to detail up the cost and profit simulation
study and achievement scenario planning study.
b) Differences compared to the conceptual framework
In terms of setting the tentative selling price, conduct thorough market research,
consider the internal and external factors in setting the selling price and using the business
plan in introducing the new products, the case study findings supported the previous litera-
ture.
However, regarding the market survey, this research found one difference com-
pared to the conceptual framework. Previous studies highlight that from the output of the
market research, the Japanese companies determine the types of new product to be devel-
oped and the contents of the product features and specifications (Cooper & Slagmulder,
1999). In the case company, a new product market survey was conducted after the new
product features and specifications were already conceptualized. Company A did not con-
duct a market survey to capture what features and specifications the customers’ required in
the new product. Instead, the objective of this new product market survey was only to veri-
fy or justify the prior assumptions concerning the new product features and specifications.
This difference might due to the range of changes that could be made by Company A for
Univers
ity of
Mala
ya
`
220
the new product against its base or predecessor product. Since Company A used its joint
venture’s base product platform, the platform parts such as chassis, engine and transmission
parts were carried over from its joint venture company’s base product. Company A only
customized the upper body of the product to suit Malaysian market’s requirement in terms
of styling, features and ride comfort. This limits the level of customer orientation in its new
product development.
5.4.1.2 Step 2: Setting the target profit
a) TCM practice at Company A
The process of setting the target profit required many analyses and simulations.
However, the case company did not use any computer simulation system to simulate the
target profit. This target profit setting process was concurrent with the cost estimation and
initial profitability feasibility study making process. Even though Company A had a com-
pany business plan based on the forecasted budget, Company A did not have a company-
wide mid-term or long-term profit plan that considered future competitive planning like
Daihatsu or target profit guidelines like Toyota, as highlighted in the literature (Kato, 1993;
Lee & Monden, 1996; Okano, 2005). As commented by the Japanese ex-patriate of the
Cost Planning Department, even though Company A had the business plan, the profit plan-
ning was calculated based on the profit level of existing products and did not consider the
target profit level of future competitive products:
Company A does have 3 or 5 year business plans, which include profit plan-
ning. However, the profit planning was not officially authorized by our top
management and not considered as our future plan. It was calculated based
on current existing model profit, not considered future company targets. In
this sense, I understand that this company does not have mid-term or long-
term plan. But company must have long-term and mid-term profit planning. In
Univers
ity of
Mala
ya
`
221
order to establish long-term profit planning, our company has to study how
we want to be. This one we don’t have (Informant 6, Middle management,
Cost Planning Dept.).
He further commented that the lack of information on the company profit planning
caused the new product target profit setting to be based on the predecessor product’s profit
level with some adjustment:
...the profit target should be in line with the company direction. So, the com-
pany must have long-term or middle term profit planning for 3 years later.
How much profit do we want to get, what expectation on each model, like this
planning is nothing at this company. Even though we want to establish the
profit target for a new project, we don’t have any direction. So we have to
study the profit target (by ourselves). So, one of the ways is to look at the ex-
isting model as a base (Informant 2, Middle management, Cost Planning
Dept.)
Based on financial accounting information, Company A studied the predecessor
product’s historical profit trend to set the target profit for the new product. A particular
month of historical accounting statement or actual profitability was selected as the base
profitability for the new product. The target profit per unit of the new product was set from
the predecessor product’s actual operating profit ratio per unit with some adjustment of
profit increment and decrement considerations. Generally, it was set based on below formu-
la:
New product target profit =
Predecessor product target profit – estimated profit decrement + estimated profit increment.
Estimated profit increment was an estimated profit gain from cost improvement ac-
tivities. Whereas, profit decrement was an estimated profit loss due to unavoidable cost
such as material price increment and foreign exchange rate increment. In order to justify
the new product target profit level, Company A used the yearly average profit of the prede-
Univers
ity of
Mala
ya
`
222
cessor product and company business plan target profit, which was calculated based on the
forecasted budget, as reference points. In the initial stage, the target profit setting only fo-
cused on one variant or grade type of the particular product as the representative variant.
Normally, the representative variant was the variant that has the highest projected volume.
Later, the target profit of other variants and weighted average target profit were also calcu-
lated and presented to the top management as references.
b) Differences compared to the conceptual framework
In general, this case study supports the previous literature findings in terms of the
thorough analysis and simulation made to set the target profit. Previous studies (Lee &
Monden, 1996; Cooper & Slagmulder, 1999; Kato et al., 1995; Okano, 2005) highlighted
that the Japanese companies use various ways to set the target profit. This case study found
that in setting the target profit, Company A used the predecessor product profit ratio from a
particular month of historical accounting statement with some adjustments. Then, the
yearly average of predecessor product profit level and business plan profit level were used
as reference points to justify the target profit of the new product. This simple method was
used due to the absence of mid-term or long-term profit planning, which considered the fu-
ture competitive market condition and target profit guidelines information. Accordingly, the
case company relied on financial accounting information as the main source of information
for target profit setting.
5.4.1.3 Step 3: Setting the target cost
a) TCM practice at Company A
Univers
ity of
Mala
ya

`
223
The process of target cost setting at Company A could be divided into three main el-
ements: (i) setting the total target cost, (ii) calculate the estimated cost, and (iii) allocate the
target cost. This activity was mainly anchored by the Cost Planning Department.
i) Setting the total target cost
The total target cost at Company A was set by deducting the target profit from the
tentative selling price.
ii) Calculate the estimated cost
In TCM activities, the project assumptions were used as a guideline to estimate accu-
rate total cost. Accordingly, before the calculation of the estimated cost started, the Prod-
uct Planning Department set the project assumption. The project assumption was defined as
a set of assumptions for a particular project development. These assumptions were set
based on the company’s direction, government policy, and market survey results and com-
petitors threat. Examples of project assumptions were the timing of the base cost, model life,
total sales volume, total cost planning volume, ratio of volume for each variant, and foreign
exchange rates. For example, the foreign exchange rates project assumption was used to
convert the imported material costs which were quoted in foreign currencies to the same
rate of local currency value. Without locking the foreign exchange rates based on the pro-
ject assumptions, the cost changes occurred at each development stage would include the
foreign exchange rate fluctuation impact. This would distort the monitoring and reporting
of the project related cost changes occurred at each development stages. Accordingly, in
order to set realistic and accurate project assumption, the latest information input was nec-
essary. As commented by Informant 2:
Univers
ity of
Mala
ya
`
224
Input of latest data is important because I think Cost Planning (TCM) success
depends on accurate assumptions. When we made Cost Planning (TCM), eve-
rything is based on assumptions. You make currency assumptions, material
price assumptions, process assumptions, et cetera (Informant 2, Middle Man-
agement, Product Planning Dept.).
Based on these assumptions, all the related departments estimated the costs. General-
ly, these estimated costs were estimated based on current cost level such as current skill,
experience and facilities. Then, these estimated costs were passed to the Cost Planning De-
partment for total cost and profit simulation. These cost estimation activities involved the
cooperation of many departments. For example, the new investment and development cost
data were estimated by all the related departments, local part cost estimation was estimated
together by R&D, Cost Planning, and Purchasing and Vendor Development Department,
CKD parts cost was estimated by Company M, in-house cost was estimated by the Product
Engineering Department, and other cost expenses were estimated by the Cost Planning De-
partment based on the average historical accounting statements for particular periods that
were received from the Accounting Department. All the estimated costs were compiled in
a product profitability feasibility format to simulate the total estimated cost of the new
product. Step 4 in the next section will explain the details of the profitability feasibility
study.
For the new investment and development costs, all the related departments estimated
their cost based on the initial product features and specification assumptions. Investment
cost is the cost related to capital expenditure, while the development cost is the cost related
to the operation expenses required to develop the new product. Then, the cost estimation
was compiled by the Product Planning Department to obtain the total estimated investment
Univers
ity of
Mala
ya

`
225
and development cost. After that, each department went through several budget challenge
meetings with the Chief Engineering (CE) to finalize their estimated investment and devel-
opment cost. After the estimated costs had been finalized, the Product Planning Department
submitted the cost information to the Cost Planning Department for calculation of the prof-
itability feasibility study.
As for the local purchased parts, the parts were divided into exclusive parts and non-
exclusive parts. The non-exclusive parts were also known as common parts. Parts were de-
fined as common part if they were already existed and also used in other products. Thus,
the cost of a common part was extracted from the current cost database and no cost estima-
tion was made. While an exclusive part was defined as a part that was exclusively used in
the new product. There were two categories of exclusive purchased parts. First category is a
part that is developed specifically for the new vehicle product. This was also known as a
new exclusive purchased part. Second category is an existing part that has engineering de-
sign changes specifically for the new vehicle product. This was also known as a new Engi-
neering Changes Instruction (ECI) purchased parts.
Generally, Company A used two approaches to estimate these exclusive parts. The
approach selection depended on the availability of the part cost information itself. Never-
theless, both estimation approaches were made based on the current cost level. The first ap-
proach was absolute cost estimation by using cost tables. However, this method was limited
to certain manufacturing processes, such as plastic injection, stamping parts and machining
parts due to the unavailability of the respective cost tables. The absolute cost estimation
considered all the cost elements in manufacturing and delivery of the part, such as material
Univers
ity of
Mala
ya
`
226
cost, purchased part cost, manufacturing processing cost, transportation cost, tooling cost,
packaging cost, profit and administration cost. The second approach was the differential
cost estimation by calculating the specification cost changes compared to the existing part.
For the model X1 project, both of these estimation approaches were calculated together by
three departments – Cost Planning, R&D, and Purchasing and Vendor Development. How-
ever, for the functional parts that TCM members did not have the expertise or limited cost
information, such as the wire harness, the case company relied on the estimation of the
suppliers. Usually, for new exclusive parts, the estimated part cost was used as the target
cost. Agreement meetings with Company M’s R&D counterparts were conducted to final-
ize the target cost of each exclusive part.
As for the CKD parts, the cost estimation was done by Company M. As CKD parts
cost were controlled by Company M, Company A only received the total cost of CKD parts
by variants. For the target cost of the localization parts, or parts that changed sourcing from
CKD to local, the absolute target cost was provided by Company M.
The Cost Planning Department compiled all the estimated costs and categorized them
by cost item: in-house cost, local purchased parts cost, overhead cost, exclusive fixed cost,
sales and distribution cost, tax and duty cost, project risk budget and CKD parts cost. The
project risk budget consisted of the material increment budget and the Chief Engineer (CE)
budget.
Univers
ity of
Mala
ya

`
227
iii) Allocate the target cost
Normally, the total estimated cost was unable to meet the total target cost. Accord-
ingly, the cost reduction target was planned to close the difference between the total esti-
mated cost and total target cost. The total cost reduction target ratio was set by dividing the
gap between total target cost and total estimated cost with the total estimated cost. Then,
this cost reduction target was imposed to certain cost items in order to make the total esti-
mated cost meets the total target cost.
For this activity, all cost items were categorized into controllable or uncontrollable.
An uncontrollable cost item was defined as the cost reduction activities unable to be con-
ducted, such as tax and duty, overhead cost, sales and distribution cost, and project risk
budget. While, a controllable cost item was defined as the cost reduction activities able to
be conducted, such as exclusive fixed cost, in-house cost or local purchased parts cost.
Then, for each controllable cost item, it was further divided into two categories, new exclu-
sive and carry over. New exclusive was the new cost item that was exclusively related to
the new product development. Carry over was the common cost item, which was not ex-
clusively related to the new product development. Based on this total cost reduction target
amount, Cost Planning imposed the cost reduction target ratio equally to the estimated cost
of each new exclusive controllable cost item only. In other words, the target cost of each
new exclusive controllable cost item was set by summing up the estimated cost with its cost
reduction amount. On the other hand, no cost reduction target was imposed on the estimat-
ed cost of common controllable and uncontrollable cost items. Thus, the target cost for all
these cost items were same with their estimated cost.
Univers
ity of
Mala
ya
`
228
In summary, total target cost allocation was set based on below formula:
Total target cost allocation (with cost reduction) =
[Estimated cost of each exclusive controllable cost item x Cost reduction ratio] +
Estimated cost of each common controllable cost item +
Estimated cost of each uncontrollable cost item
Then, a kick off meeting was conducted to disseminate the target cost of each cost
element to each responsible department. As for the local purchased parts, the total target
cost was further broken down to each R&D designer group: Shell body, Body Others, Inte-
rior, Electrical, Engine, Drive Train and Chassis groups. Each R&D designer group only
received their target cost in absolute amount. Company A did not breakdown the target cost
into each function (i.e. seat, air conditioner, steering) nor into each part (i.e. right front seat,
left front seat, back seat). From here, each design group was responsible to meet their group
target cost by conducting VE for the necessary items. The details of the VE activities will
be explained in section 5.4.2.1.
b) Differences compared to the conceptual framework
In terms of setting the total target cost, project assumptions for cost estimation, ab-
solute and differential method of cost estimation, these case findings support the previous
literature. Below findings strengthen the previous literature by providing the details of the
processes.
First, the previous literature mentioned that TCM cost reduction activities were
conducted to eliminate the waste (Monden & Hamada, 1991) of non-productive and non-
value added activities (Kaplan, 1984). This case study strengthen the previous findings by
specifying the cost reduction activities in terms of which cost items the cost reduction could
Univers
ity of
Mala
ya
`
229
be applied to. In the organization being studied, the cost reduction target was only imposed
on the exclusive controllable cost items. No cost reduction was imposed to the common
controllable and uncontrollable cost items. In other words, the cost reduction activities were
only imposed to the cost items that can be fully controlled during the project development.
Second, the previous literature mentioned two types of cost estimation method –
differential cost estimation (Kato et al., 1995; Monden & Hamada, 1991) and the absolute
cost estimation method (Okano, 2005; Monden & Hamada, 1991). Monden and Hamada
(1991) and Kato et al. (1995) highlight that the differential method is used when the previ-
ous parts exist and when there is a time constraint. This study supports previous findings. In
addition, this case study found that the selection of the method of estimation also depended
on the availability of cost information. In the event of cost information being available in
detail, such as cost table availability, the absolute cost estimation method was used.
This research also found three differences compared with the conceptual framework.
First, unlike the Japanese companies that have different definitions for allowable cost and
target cost (Monden & Hamada, 1991; Sakurai, 1989), the case company did not differenti-
ate between the target cost and the allowable cost. After deducting the target profit from
the target-selling price, no adjustment was made to make the target cost more attainable.
Second, unlike the Japanese automotive companies that break down the target cost
of purchased parts to the part basis (Tani et al., 1994), the case company only break down
the target cost to the R&D designer group level. This target cost inclusive of the total cost
reduction should be achieved by each R&D designer group. Each design group was respon-
Univers
ity of
Mala
ya
`
230
sible to conduct the necessary VE to any selected purchased parts in order to meet the allo-
cated target cost.
Third, unlike Japanese automotive companies, which rely heavily on their suppliers
for purchased part cost estimation (Cooper & Slagmulder, 1999), Company A did not rely
solely on its suppliers. Instead, some of the cost estimation was done together by the R&D
Department, Cost Planning Department and, Purchasing and Vendor Development Depart-
ment. Company A only relied on the suppliers’ estimation for the functional parts, which
the TCM members did not have the expertise or only had limited cost information. The in-
volvement of suppliers was very low at the case company. Accordingly, the low supplier
relationship meant the case company did not rely on the suppliers’ cost estimation except
for certain functional parts.
5.4.1.4 Step 4: Making the profitability feasibility study
a) TCM practice at Company A
After approval of the Product Marketing Concept proposal, the Product Planning
Department kicked off the project and led the project committee, which consisted of all the
related departments – Purchasing and Vendor Development, R&D Designers, Logistics,
Product Engineering, Cost Planning, Quality Assurance, Quality Control and Production
Planning. The Product Planning Department instructed all the related departments to submit
their development preparation related cost information to the Cost Planning department.
After all the information was gathered, the Product Planning Department conducted the
Project Proposal meeting; one of the NPD quality gate meetings to get management ap-
proval on quality, cost and delivery. This meeting was joined by the top management level
Univers
ity of
Mala
ya
`
231
of the related departments. In this meeting, a detailed explanation was presented to the top
management concerning the project assumptions, product concept, product specifications
and features, product schedule until mass production, total investment and development
cost, and profitability status. The results of the profitability status per unit vehicle were
shown in the representative variant and in the weighted average of all variants. In terms of
tabulating the profitability status per unit vehicle, bar graph diagrams were used to show
the status of total target cost against total estimated cost, and total target profit against total
estimated profit.
For the Project Proposal meeting preparation, the Cost Planning Department was re-
sponsible for preparing the profitability feasibility study and making the achievement sce-
nario planning. An achievement scenario planning was a set of concrete strategies or plan-
ning to cover the difference between the target cost and the estimated cost in order to meet
the target cost, such as conducting VE. For the Model X1, the total estimated cost was
higher than the total target cost. Accordingly, the Cost Planning Department planned the
achievement scenario planning concerning how to cover the difference through the cost re-
duction activities. Nevertheless, this achievement scenario planning must be conducted dur-
ing the development stage and must be materialized before the mass production stage start-
ed. The summary of achievement scenario planning was shown in the same bar chart dia-
gram of target cost and estimated target cost, and presented to the management during the
Project Proposal meeting.
The cost information used in the profitability feasibility study came from various
sources. The Cost Planning Department gathered all the costs information from the related
Univers
ity of
Mala
ya

`
232
departments and compiled the estimated cost to calculate the profitability feasibility study.
In general, the source of the cost information can be classified into five categories. First,
the information was derived from estimation by the related departments, such as facilities
related investment cost was estimated by Production Engineering Department. Second, the
information was derived from a particular month of the predecessor product profitability,
also known as historical accounting statement, from the Accounting Department such as in-
house variable costs. From this base cost, some additional cost estimations for the new
product from Product Engineering Department were added. Third, the information was de-
rived from the monthly average of the predecessor product profitability from the Account-
ing Department, such as overhead cost, depreciation cost and indirect labour cost. As the
case company used the actual costing method, the predecessor product profitability by
month from the Accounting Department highly fluctuated according to the production vol-
ume. Thus, Cost Planning used the monthly average of the predecessor product profitability.
Fourth, the information for the total local purchased parts cost was derived from the accu-
mulated purchased parts cost listed in the master part list, a list of purchased parts required
to produce one unit vehicle. Generally, the initial quotation submitted by the suppliers
would be used. However, in the event of no information received, the estimated cost would
be used. Fifth, the information of the CKD parts cost was derived from Company M. Based
on this information, the Cost Planning Department used project assumptions, such as for-
eign currency exchange rates, cost planning volume and product model life, to calculate the
per unit vehicle of total estimated cost. For example, the per unit vehicle cost of investment
and development cost was calculated by dividing the total cost with the total model life
volume of the product. The model life volume of the product was calculated by multiplying
the product model life in number of months by the monthly cost planning volume.
Univers
ity of
Mala
ya
`
233
For the profitability feasibility study making, the Cost Planning Department used
the profitability feasibility format sheet to calculate the total estimated cost and total esti-
mated profit per unit vehicle for each variant. Based on volume ratio of each variant, the
total estimated cost and total estimated profit was also calculated in weighted average per
unit vehicle. Generally, this format sheet was similar to the accounting profit and loss for-
mat in which it sets out the target-selling price, all the estimated costs and estimated profit
in one sheet. Inside the profitability feasibility format, all the cost items were tabulated and
categorized into seven categories – local purchased parts cost, CKD parts cost, in-house
cost, sales and distribution cost, fixed cost, other expenses, and tax and duty cost. The CE
budget and material impact budget were also included in the other expenses category as a
risk management. These budgets were allocated inside the profitability feasibility format to
cater for any additional unexpected market demand or government requirement. Then, the
total estimated cost was deducted from the tentative target-selling price in order to simulate
the estimated profit. Company A simulated a few types of profit: gross profit, operating
profit, also known as profit before tax, contribution margin (selling price minus the variable
cost) and contribution margin after exclusive fixed costs (contribution market minus the
exclusive fixed costs).
Generally, Company A constructed the profitability feasibility study concurrently
with the target profit and target cost setting. In the initial stage, the calculation was made
for the representative variant only. Later as more details information received, the calcula-
tion was made for all variants and summarized in the weighted average to represent the
profitability of the product. This calculation was continuously updated several times until
Univers
ity of
Mala
ya
`
234
the mass production stage. This was because the case company need to monitor the cost
reduction result of achievement scenario planning which was set to cover the difference
between total target cost and total estimated cost. Furthermore, the development period of
the new product model was around 32 months with several design changes. Thus, the cost
and profit achievement status need to be monitored thoroughly and reported during each
quality gate meeting. Additionally, after the mass production stage, the Cost Planning De-
partment continuously calculated the actual profit per unit vehicle by using the profitability
format sheet based on the actual historical accounting statement cost information. Never-
theless, this profitability format sheet was less complicated then the profitability feasibility
study format used in the development stage. The objectives were to evaluate the project
achievement in terms of profit level on a quarterly basis until the end of the model life of
the product and to capture the profit movement. Any decrement in the profit trend would
trigger the case company to take prompt actions.
b) Differences compared to the conceptual framework
In general, this case study supports the previous literature findings in terms of using
the profitability study as a tool to grasp the total estimated cost, to simulate the new product
profit level and as a decision tool to decide the profitable level for the project (Monden &
Hamada, 1991; Cooper & Slagmulder, 1999). However this case study found that the deci-
sion to decide the profitability level of the new product was not solely depended on the re-
sult of the profitability feasibility study. The case company also considered the achieve-
ment scenario planning through cost reduction activities to cover the differences between
the estimated cost and target cost during the development stage.
Univers
ity of
Mala
ya
`
235
This study strengthens the previous studies by providing the details of how the prof-
itability feasibility study was conducted at the case company. These items were summa-
rized in six main items. First, in order to ensure the product could earn an adequate profit
margin, all related cost information was gathered from various departments. Second, the
Cost Planning Department calculated the profitability feasibility study based on project as-
sumptions, such as foreign currency exchange rates and cost planning volume. The purpose
was to convert all the cost information to the same level as the project assumptions. Third,
in order to calculate the profitability feasibility study, the case company used a profitability
feasibility format sheet. Based on this format sheet, all the estimated costs were compiled to
simulate the total estimated profit per unit vehicle. Fourth, the result of the profitability
feasibility study was presented to the top management with an achievement scenario plan-
ning. Fifth, the profitability feasibility study was frequently updated along the development
stage to monitor the cost and profit achievement status result. Sixth, after the product has
been launched, Company A continuously updated the profitability using the actual cost in-
formation from Accounting Department by quarterly basis until the end of the product
model life to monitor the accumulated actual profit against the accumulated target profit.
5.4.2 Do stage
This sub-section explains the activities conducted at the case company in the Do or
execution stage to meet the TCM targets and compares the differences with the conceptual
framework. Under the Do stage of the PDCA cycle, Company A conducted several cost
reduction activities to meet the target cost.
Univers
ity of
Mala
ya
`
236
5.4.2.1 Step 5: Achieving the target cost
a) TCM practice at Company A
After receiving the top management approval in the Project Proposal meeting, all
related departments put full effort to achieve the target cost by executing the cost reduction
activities. In achieving the target cost, Company A implemented all the cost improvements,
cost cutting, and cost shifting methods. Among which, the cost cutting by reducing the inef-
ficient or non-value added was mostly practiced. The cost shifting method was the most
unpopular method. This was because Company A has a requirement for a specification with
a high level of quality. Any change in the type of material needs to pass the testing re-
quirements. Basically, three activities were conducted to achieve the target cost: (i) supplier
selection, (ii) VE activities, and (iii) other cost reduction activities.
i) Supplier selection
At Company A, the process for achieving the target cost focused more on the local
purchased parts. It started by selecting the suppliers that could meet the target cost from the
initial design stage. This was because the cost of the local purchased parts covered around
40 to 50 per cent of the total vehicle cost. Generally, the designs were classified into two
categories – In-house Drawing and Outsource Drawing. For In-house Drawing, the drawing
was designed, developed and scaled by Company A and Company M and then passed to
the selected supplier. For Outsource Drawing, Company A only prepared the concept and
basic specification design of the part and passed it to selected supplier for the detailed de-
sign and development. Generally, the Outsource Drawing involved the functional parts,
such as air-conditioning and headlamp.
Univers
ity of
Mala
ya

`
237
For each exclusive part, the suppliers were requested to tender their projects based
on the initial drawings by submitting the most competitive price using a specific quotation
format provided by Company A. This format required the suppliers to indicate their price
with a detailed breakdown of cost by the material cost, manufacturing process cost, pur-
chased parts cost, tooling cost, packing cost, transportation cost, admin cost and profit.
Upon receiving quotations from the suppliers, the quoted prices were compared against the
target cost. Generally, meeting the target cost and offering the most competitive price were
the main criteria for supplier selection.
In the supplier selection process, the Purchasing and Vendor Development Depart-
ment conducted the Supplier Committee meeting. In this meeting, each proposed part was
presented in an A3 size paper report with target cost, suppliers quoted price, suppliers’
background, part process manufacturing flow and information pertaining to the historical
performance of the supplier, such as supplier’s performance track record and forge cases.
This information was to ensure that fair judgement was made by Company A’s manage-
ment in selecting the suppliers. This meeting was joined by the middle and top management
level of the Cost Planning Department, R&D Department, Logistics Department, QA De-
partment and Manufacturing Department. The objective of this meeting was to obtain a
consensus concerning the nomination of the suppliers before it was proposed to the top
management for finalization. Then, the names of the nominated suppliers were presented to
the Managing Directors and Executive Directors for their final approval. After the selection
of the suppliers, the TCM members from the R&D, and Purchasing and Vendor Develop-
ment Departments monitored each supplier’s part during the development process.
Univers
ity of
Mala
ya
`
238
ii) VE activities
The case company used VE as a main tool to achieve the target cost. Three types of
VE were conducted in the different stages of product development with different purposes.
Zero Look VE was conducted in the planning stage to create the product concept and for
setting the target for the function and cost. First Look VE was conducted in the design stage
to achieve the target value by achieving the target function and target cost. Second Look
VE was conducted in the mass production stage by improving the value, improving the
function or reducing the cost. Since, the Product Planning Department already integrated
the Zero Look VE during the product planning stage by setting an appropriate product spec-
ifications, Company A’s designers mostly focused their activities on the First Look VE and
Second Look VE. Generally, the First Look VE involved the new exclusive purchased parts
and the Second Look VE involved the existing or common purchased parts. As commented
by the respondent on VE activities:
The Zero Look VE is integrated by our Product Planning Department during
the specification setting. For engineering designers, our current activities on-
ly focus on First Look and Second Look VE (Informant 12, Middle Manage-
ment, R&D Dept.).
Among the VE activities conducted were deleting or changing non-value added child
parts or process, and changing the type, size or thickness of the material. Nevertheless, the
VE items would not sacrifice the basic safety requirement of the vehicle. The main objec-
tives of VE were to omit items that had less relative importance to the customers’ require-
ments and to increase design optimization regardless of the cost impact. As commented by
the R&D middle management respondent, the VE main purpose was to optimize the design
and not all the VE resulted in a cost reduction:
Univers
ity of
Mala
ya
`
239
Basically, the purpose of VE is to optimize the design while the performance
quality of the product should be maintained or upgraded from the previous part
or model. During the design stage, designers or engineers mainly focus on how
to achieve part performance through design. VE is not for cost reduction but it’s
a kind of process used to determine the optimum design to achieve the target per-
formance of the parts or vehicles. For example, we want to install a meter (meter
combination) using four bolts. But by doing VE, three bolts are enough to keep
the meter performance. In this case, it looks like a cost reduction instead of VE
(but actually it is VE). But if we need four bolts to install a meter instead of three
bolts, as the performance cannot be met if we use three bolts, then this is also
called VE but not cost reduction. (So) Not every VE can be used as cost reduc-
tion (Informant 12, Middle management, R&D Dept.).
As the development stage approaches the mass production stage, any engineering
changes increase the cost. For example, after the tooling fabrication, any engineering
changes to counter the failure of unexpected engineering issues that are involved in a tool-
ing modification would incur higher cost. As highlighted by the respondents from the
R&D middle management, VE failure caused the costs to increase due to a tooling modifi-
cation to counter the issues:
At the design stage, normally a VE consideration study is conducted based on
previous design to determine whether to improve the performance or part quality.
At this stage, normally, a reduction can be achieved by reducing the weight, us-
ing cheaper material but with the same performance, reduce the number of pro-
cesses et cetera. The percentage of success is still maybe 50-50 as the changes
might not work for the new part even though the previous part was a success. If
this happens, the cost to redesign for countermeasure VE might be higher than
the cost of the original part (without VE activity) (Informant 12, Middle man-
agement, R&D Dept.).
... For example let us say for the carpet, we want to do VE by reducing the
thickness of the ‘felt’. But, after it goes to testing the NVH (Noise, Vibration,
and Harshness) level is not met and the ‘felt’ has to be put back. In fact, more
‘felt’. And so as it is no longer at the design planning stage, and the part has
already been made, we have to add the ‘felt’. May be some slight modification
has to be done on top of the ‘felt’ addition. So you want to reduce maybe 1
ringgit and yet ended up having to put back the ‘felt’, which is 1 ringgit and
Univers
ity of
Mala
ya
`
240
maybe another few more cents for modification of the mould (Informant 4,
Middle management, R&D Dept.).
Furthermore, even though the VE on a particular part passed the Computer Aided
Engineering (CAE) analysis during the design stage, the outcome of the whole vehicle
crash test at the end of the development stage might be different. This was because the
crash test result was affected by the performance of other surrounding parts connected to
the VE parts. As commented by the R&D middle management, the success of VE as a cost
reduction tool is very subjective:
... Probably we did the CAE analysis, probably we did some tests on the
mock up but those mock ups in the CAE analysis were only on a single part.
But when the part goes in a vehicle, it is being tested as a whole vehicle. So
many things have to change as a complete package. We cannot wait until that
stage to actually conclude our VE. The VE has to come in earlier because it
needs tooling modification. We can do some VE, we can do some CAE analy-
sis with okay results but after the whole vehicle is sent for crash test impact,
for example, certain parts failed. And, because of that, we have to increase
the thickness or change material or revert back to the original plan or may
be with a higher specification (Informant 4, Middle Management, R&D
Dept.).
One of the R&D middle management commented that proper study and develop-
ment concept direction were very important in realizing VE as a cost reduction tool.
So, the moral of the story, the cost reduction during the design stage is only ef-
fective if the designers properly study or benchmark other competitor parts. Sec-
ondly, the VE for the cost reduction during the design stage is very effective if the
development concept is cost (reduction) instead of items (specification) change
or quality upgraded. In the design activity, many cases happen that cost reduc-
tion can only be achieved if we sacrifice the specification, styling or performance
in order to achieve cost. The CE of the project should decide the option, which,
normally, is in line with the development policy concept (Informant 12, Middle
management, R&D Dept.).
Univers
ity of
Mala
ya
`
241
The benchmark information was very important to increase the successfulness of
the VE activities as a cost reduction tool. For data gathering for benchmarking information,
the case company conducted tear down activities, in which the competitors’ cars were re-
verse engineered to analyse the structure, material, features, design and cost of the parts.
The results were compiled and were used for the design and development of future new
products. Nevertheless, the collected cost benchmark information was still insufficient for
the TCM activities. As commented by one of the survey respondents:
TCM implementation is (at this company) still in the early stage. Currently, we
do not have enough information for cost benchmarking (Informant 16, Technical
staff, Cost Planning Dept.).
iii) Cost reduction activities
Generally, once the product specifications have been decided at the planning stage,
the case company did not add new product specifications or functions to meet new re-
quirements from the market feedback during the product development stage unless the gov-
ernment introduces new regulations that should be complied promptly. Nevertheless,
throughout the development stage, many minor technical design changes occurred to cater
to the technical issues, such as part matching issues and manufacturing workability issues.
In each development stage, the selected suppliers submitted their updated quotation
to the Purchasing and Vendor Development Department based on technical changes. If the
supplier’s quoted price was higher than the estimated technical cost changes of Company A,
the company usually used negotiation to persuade suppliers to meet the target cost. As for
the cost reduction activities for the local purchased parts, Company A analysed its major
Univers
ity of
Mala
ya
`
242
local purchased parts cost by comparing it with Company M’s part cost level to identify
cost reduction ideas. A detailed analysis was made for each cost item: material cost, pur-
chased part cost, manufacturing cost, tooling cost and administration cost. Then, further
negotiation was conducted with the suppliers to reduce the cost. However, some suppliers
were not willing to meet the target cost based on negotiation only. Accordingly, the chal-
lenge meetings were conducted continuously between the suppliers and Company A’s
TCM team members to discuss how to meet the target cost. Before each challenge meeting,
an internal meeting was conducted among the TCM team members to brainstorm and ob-
tain consensus concerning the cost reduction ideas. In the challenge meeting, the suppliers
were asked to justify their estimation with some evidence. The supplier quotations were
accepted if the cost justifications were reasonable. However, if the justifications were not
convincing, the TCM team members consulted with the suppliers and highlighted the points
concerning how to achieve the target cost. Several challenge meetings were conducted un-
til both parties were satisfied with the cost level. Finally, in the event of no conclusion be-
ing reached, Company A’s top management became involved. Nevertheless, the involve-
ment of the top management did not always reach the expected results. In each challenge
meeting, the meeting minutes concerning what to do, who to do, when to do were written
on the white board. At the end of the meeting, the printed minutes were signed by all mem-
bers and distributed to the participants. Based on the minutes, the counter measures activi-
ties were followed up by the TCM team members.
Additionally, Company A also conducted in-house cost reduction activities to
achieve the in-house target cost. The in-house cost covered the raw material, main material,
direct labour, consumable and energy cost of the in-house production processes. The in-
Univers
ity of
Mala
ya
`
243
house cost reduction activities were anchored by Product Engineering Department. Among
the cost reduction activities conducted for the in-house cost were process improvement and
cycle time reduction.
b) Differences compared to the conceptual framework
In general, this case study supports the previous literature findings in terms of VE as
a tool to achieve the target cost and teamwork in achieving the target cost. This case study
also found two items that were different from what had been highlighted by the previous
literature. First, rather than continuously conducting VE to meet the target cost like the Jap-
anese companies (Lee & Monden, 1996), Company A focused on the negotiation of local
purchased parts. This might due to the suppliers of Company A hardly suggested any cost
reduction ideas and information for effective VE. Accordingly, attaining the target cost
upon initial quotation submission was the main criteria for the selection of suppliers. By
using the cost estimation of TCM members as a reference point, at each development stage,
a series of negotiation meetings were conducted with suppliers to challenge the suppliers’
estimated cost. The Company A’s top management also involved in the final negotiation
meeting with the suppliers.
Second, unlike the Japanese companies that continuously fine-tuned the specifica-
tion, functionality and quality from market feedback during the development stage (Cooper
& Slagmulder, 1999), Company A only adopted the changes due to compulsory new regu-
lations introduced by the government. No changes were made to the specification and func-
tionality to meet new market feedback during the development stage. Company A seemed
to lock all the functionality specifications during the planning stage.
Univers
ity of
Mala
ya
`
244
5.4.3 Check stage
This sub-section explains the activities conducted at Company A in the Check or
monitoring stage and compares the differences with the conceptual framework. Under the
Check stage of the PDCA cycle, Company A monitored and measured the TCM results
against its targets, and reported the achievement of the results.
5.4.3.1 Step 6: Monitoring and reporting the cost achievement status
a) TCM practice at Company A
At Company A, the development process for the new model product took approxi-
mately 34 months from planning until the mass production stage. During the development
stage, Company A conducted continuous meetings to monitor and report the cost and profit
achievement status. Generally, there were three types of meeting related to the TCM activi-
ties were held: NPD quality gate meetings, monthly cost achievement meetings, and target
profit and cost achievement meeting. The Cost Planning Department was responsible for
gathering the cost related information from the related departments, prepared and reported
the cost and profit summary status.
NPD quality gate meetings were conducted at each development stage by the Prod-
uct Planning Department of R&D Division. The main objectives of NPD development
quality gate meeting were to present the status of delivery, quality and cost to the top man-
agement, and to obtain their approval to proceed to the next level of the development stage.
For these meetings, the Cost Planning Department was responsible to report the TCM ac-
tivities in terms of cost and profit achievement status. Accordingly, at each development
Univers
ity of
Mala
ya

`
245
stage, Cost Planning Department updated the profitability feasibility study by using the lat-
est cost information to capture the total estimated cost and to simulate the total profit per
unit vehicle. The summary of the results was presented in a bar graph diagram, and submit-
ted to the Product Planning Department as one of the presentation materials. Each NPD
quality gate meeting had a different cost achievement level passing rate criteria that had to
be achieved before proceeding to the next stage of development.
Monthly cost achievement meetings were conducted on a monthly basis starting af-
ter the tooling design had been finalized until the mass production stage. These were an-
chored by the Cost Planning Department. The main objectives of these meetings were to
frequently reflect on the estimated cost changes of the local purchased parts due to any de-
sign engineering changes or supplier price changes, and to monitor the result of achieve-
ment scenario planning that was set during the Project Proposal meeting. This was because
the purchased parts cost contributed the biggest impact on the target cost achievability.
Accordingly, each R&D designer group was responsible to present the cost achievement of
their group by monthly basis. If any design changes caused cost increment to any parts, re-
sponsible group had to find savings at other parts to offset it. However, in the monthly cost
achievement meetings, the profit status was not reported.
The monthly cost achievement meetings notified all the related departments con-
cerning the cost achievement status of the local purchased parts. This allowed the related
departments to take the necessary actions to counter the shortfall promptly. In this meeting,
the case company only focused on the local purchased parts because it covered the biggest
cost items of the vehicle cost and within Company A’s control. The case company did not
Univers
ity of
Mala
ya
`
246
monitor the CKD parts cost because this cost was monitored separately by Company M. In
the monthly cost achievement meetings, the cost achievement status of the local purchased
parts by each design group and the total local purchased parts cost summary per vehicle
were presented to the management. Here, the cost changes as per the latest supplier quota-
tions were compared against the target cost and previous month’s cost achievement status.
In the absence of actual suppliers’ quotations reflecting the latest cost due to design engi-
neering changes, Company A used R&D designer estimation to reflect the impact on the
cost. However, the participants of this meeting were limited to the CE, lower management
and middle management of the R&D Department, and Purchasing and Vendor Develop-
ment Departments.
The Target Profit and Cost Achievement meeting was conducted by the Cost Plan-
ning Department before the mass production stage started. The objective was to report the
overall profit and cost achievement status per unit vehicle to the top management. Here, the
profitability feasibility study was updated to capture the latest total estimated cost and to
simulate the total profit per unit vehicle. Nevertheless, for uncontrollable cost items, which
were not involved with the cost reduction activities, such as overhead cost, warranty cost,
transportation cost, the cost amount remained the same as the base cost. For the cost of the
local purchased parts and the CKD cost, the actual supplier quotations were used to reflect
the actual cost. As for the in-house cost and selling and distribution cost, the latest estimat-
ed costs were used. Then, the profitability feasibility study results were translated into a bar
graph diagram to show the cost and profit achievement movement from the base cost until
the time of mass production. Inside the bar graph diagram, the analysis of cost and profit
movement was also shown according to a few categories, such as VE, specification changes,
Univers
ity of
Mala
ya
`
247
cost reduction activities and others. In this meeting, the summary of the TCM activities and
the project review were also presented. Due to the confidentiality of profit information, this
meeting was only attended by the top management of certain departments. The results of
this meeting were also used to make judgements for reviewing the selling price. Besides
that, the re-finalization of the selling price also considered the current market condition,
competitors’ product specifications and customer perceived value towards the new product.
Besides above meetings, the Production Control Department conducted the produc-
tion preparation progress status meeting by monthly basis after tooling design approval
stage. Generally this meeting related with NPD in terms of monitoring the progress of new
product development. The objective of this progress meeting was to monitor the project
preparation in terms of delivery and quality towards the mass production stage. In this
meeting, all the project committee members reported their development progress status and
presented their reports in turn to the committee. The meeting was conducted standing up
and lasted for one to two hours. Each department evaluated the status progress by them-
selves according to three conditions – OK, NG or Half OK. The level of evaluation was
based on the impact of the issues to the project’s mass production timing. However, this
presentation only focused on quality and delivery issues. Due to the issue of confidentiality,
no cost and profit status were presented at this meeting. This meeting was attended by the
lower management to the top management of the related departments involved with the
production operation and product development – Manufacturing, Product Engineering,
Quality Assurance, R&D, and Purchasing and Vendor Development Departments.
Univers
ity of
Mala
ya
`
248
b) Differences compared to the conceptual framework
In terms of conducting the continuous meetings to monitor the cost achievement
and finalizing the costs for the final reporting, the case study findings support the previous
literature. Nevertheless, compared to the previous literature (Monden & Hamada, 1991;
Cooper & Slagmulder, 1999; Kato et al., 1995; Okano, 2005), this case study found that not
all cost items were monitored at the same frequency. Among the cost items, the cost moni-
toring frequency of the local purchased parts was higher. Besides that, at Company A, the
TCM activities meetings were related to the NPD quality gate meetings. Without manage-
ment approval, the project was not allowed to proceed to the next level of development
stage. Nevertheless, all TCM activities meetings only involved certain departments and cer-
tain management levels in Company A due to the confidentiality surrounding the cost and
profit status. Before the mass production started, the total estimated profit and cost were
finalized. This information was used to review and reset the selling price.
5.4.4 Act stage
This sub-section explains the activities conducted at Company A in the Act or im-
provement stage, and compares the differences with the conceptual framework. Under the
Act stage of the PDCA cycle, Company A evaluated the achievement status against its tar-
gets and took countermeasures to close the differences.
5.4.4.1 Step 7: Cost improvement
a) TCM practice at Company A
Three months after mass production, the Cost Planning Department captured the ac-
tual cost and conducted an Actual Profit and Cost Achievement Status meeting to the top
Univers
ity of
Mala
ya

`
249
management. At this timing, the data were almost stable for reflecting the actual mass pro-
duction stage. The main objective was to report the actual cost and profit movement from
the TCM or Cost Planning’s viewpoint. Normally, the uncontrollable factors, such as the
material market price, foreign forex exchange, and government tax and duty were among
the risks that would make the actual cost higher than the estimated cost. Accordingly, based
on the historical accounting statement, the actual result of cost, profit, production volume,
and model mix were analysed and compared against TCM planning. Besides that, the re-
maining tasks, next actions, overall project review and improvement items were also ex-
plained in this meeting. After this meeting, the Cost Planning Department continued to
monitor and report the actual profit and cost achievement status to the top management on a
quarterly basis until the end of the product model life cycle; for example, 6 years. The pur-
pose was to compute the actual profit and cost from the TCM’s viewpoint. For this meeting
too, the actual cost data were taken from the historical accounting statements with some
adjustments were made to some cost items. For example, instead of using a particular
month of general and administration cost, an adjustment was made by using an average
monthly result. Furthermore, for the future new product, a particular month of the predeces-
sor product profitability or historical accounting statement with some adjustment was used
as the base cost.
Even though Model X1 achieved its target cost and target profit, due to the drastic
market competition movement under automotive liberalization, Company A acknowledged
that the selling price level of Model X1 was not competitive enough compared to the future
products of its competitors. This might be because the target cost of the exclusive local pur-
chased parts was set using the current cost level, which was less competitive. Accordingly,
Univers
ity of
Mala
ya
`
250
as commented by the middle management of the Cost Planning Department, the issue of
balancing the realistic cost and challenging the target cost was very important in setting the
competitive target cost:
I think the Model X1 project was successful in terms of management's direc-
tion. But the direction, which is to avoid shortfall, was not suitable for Com-
pany A. (During the model X1) the strategy to follow the direction (of Compa-
ny M) was to make an agreeable target. Consequently, the target was very re-
alistic but not challenging. This was based on Company M's (target cost level)
trend at that time. Target setting in the early stage is very important for cost
planning. And, I think management understanding of the challenge is essential
to carry out good cost planning (Informant 6, Middle management, Cost Plan-
ning Dept.).
Company A did not practice standard costing, Kaizen Costing and Cost Mainte-
nance activities. Thus, after the mass production stage no variance checking was made on
the actual standard cost against the target cost. Due to the absence of Kaizen Costing and
Cost Maintenance activities, there were no further cost reduction activities conducted to
meet the target cost at the production stage. Even though the manufacturing operation of
Company A had kaizen activities or continuous improvement activities, the target cost re-
duction of these improvement activities was not linked to the TCM activities. Thus, in or-
der to make the selling price of Model X1 more competitive, instead of conducting Kaizen
Costing or Cost Maintenance activities in the production stage, Company A re-conduct the
TCM activities by introducing a new project code, which was Model X2. This special cost
reduction project was anchored by the Cost Planning Department and started two months
after Model X1 had been launched. The cost results of Model X1 reported during the Target
Profit and Cost Achievement meeting were used as the base cost for Model X2. In order to
make the selling price of Model X2 more competitive, a certain percentage of cost reduc-
tion was imposed on all cost items except the tax and duty cost. Then, a task force commit-
Univers
ity of
Mala
ya
`
251
tee was set up to conduct the cost reduction activities. This task force consisted of a few
departments, which were responsible for each cost element. For example, for the in-house
costs, Product Engineering was responsible to set the cost reduction activities for all the
production shops and their cost elements, such as raw materials, main materials, direct la-
bour, consumables, transportation costs, energy and reject costs. A cost achievement pro-
gress meeting was conducted on a monthly basis to monitor and present the cost achieve-
ment to the top management. In this meeting, each group presented their cost achievement
status. The Cost Planning Department compiled and summarized the overall cost achieve-
ment results to reflect the per unit vehicle cost reduction result of the representative variant.
b) Differences compared to the conceptual framework
In general, this case study supports the previous literature findings in terms of re-
porting the actual cost and profit after mass production stage started (Kato et al., 1995;
Monden & Hamada, 1991). Nevertheless, this case study found several differences com-
pared with what had been highlighted in the literature. First, the previous literature did not
highlight the continuous profit monitoring after the mass production stage until the end of
the product model life cycle. At Company A, after the mass production stage, the profit
level was continuously monitored on a quarterly basis until the end of the product life. A
periodic meeting was conducted to report to the top management the cost movement com-
pared with the previous quarter, and the total accumulated actual profit started from its
launching time against its total accumulated target profit, which was set during the project
planning stage.
Univers
ity of
Mala
ya
`
252
Second, as Company A used actual costing method for its financial reporting pur-
pose, there was no comparison made to analyse the differences between the standard cost
and target cost. Thus, there were no activities conducted to meet the target cost at the mass
production stage. Third, even though the cost improvement activities and lean manufactur-
ing activities were conducted in the mass production stage, there was no clear evidence that
the target cost of the TCM was linked with these systems. Additionally, due to the absence
of Kaizen Costing, the in-house target cost, which was set during the design stage, was
hardly followed after the mass production stage. Since Company A did not continue the
cost reduction activities in the mass production stage by using Kaizen Costing or Cost
Maintenance activities, Company A re-conduct the TCM activities by introducing Model
X2, a new project code for the model X1, as the cost reduction project to make the product
cost more competitive.
5.4.5 Summary of the TCM implementation process
Generally, the stages and steps of the TCM practices in the case company were sim-
ilar to the conceptual model. The findings showed that the TCM fundamental practice at
Company A was almost similar to the Japanese theoretical model. Nevertheless, this study
found that there were some differences in the details of the process under each step. Fur-
thermore, this research also found several new items that were not highlighted in the previ-
ous literature. This findings help to strengthen the previous literature on TCM practices.
From the findings highlighted in the above sub-sections, Table 5-2 summarizes the
findings of the TCM implementation process compared to the conceptual framework. On
the right side of each item, the findings of the case study are categorized into similar or dif-
Univers
ity of
Mala
ya
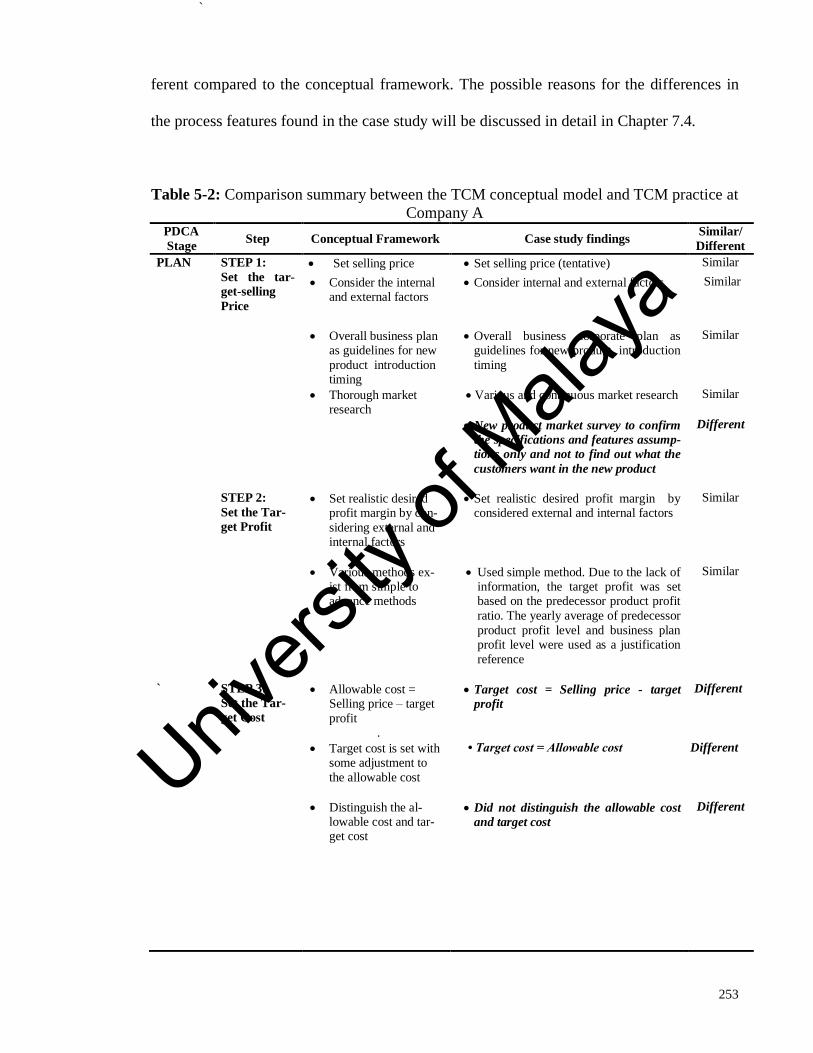
`
253
ferent compared to the conceptual framework. The possible reasons for the differences in
the process features found in the case study will be discussed in detail in Chapter 7.4.
Table 5-2: Comparison summary between the TCM conceptual model and TCM practice at
Company A PDCA
Stage Step Conceptual Framework Case study findings
Similar/
Different
PLAN STEP 1:
Set the tar-
get-selling
Price
Set selling price Set selling price (tentative) Similar
Consider the internal and external factors
Consider internal and external factors Similar
Overall business plan as guidelines for new
product introduction timing
Overall business corporate plan as guidelines for new product introduction
timing
Similar
Thorough market research
Various and continuous market research
Similar
New product market survey to confirm
the specifications and features assump-
tions only and not to find out what the
customers want in the new product
Different
STEP 2:
Set the Tar-
get Profit
Set realistic desired profit margin by con-
sidering external and internal factors
Set realistic desired profit margin by considered external and internal factors
Similar
Various methods ex-ist from simple to advance methods
Used simple method. Due to the lack of information, the target profit was set based on the predecessor product profit
ratio. The yearly average of predecessor
product profit level and business plan profit level were used as a justification
reference
Similar
` STEP 3:
Set the Tar-
get Cost
Allowable cost = Selling price – target
profit .
Target cost = Selling price - target
profit
Different
Target cost is set with some adjustment to
the allowable cost
• Target cost = Allowable cost Different
Distinguish the al-lowable cost and tar-get cost
Did not distinguish the allowable cost
and target cost
Different
Univers
ity of
Mala
ya

`
254
Table 5-2, continued PDCA
Stage Step Conceptual Framework Case study findings
Similar/
Different
Cost estimation in-volved many depart-
ments
Cost estimation involved many depart-ments
Similar
Cost estimation based on project assump-
tions setting
Cost estimation based on project as-sumptions setting
Similar
Use differential cost estimation method if the part has prede-
cessor part and time
limitation exists
Use differential cost estimation method if the part has predecessor part and time limitation exists
Similar
Cost estimation method based on in-
formation availability
Different
Target cost set with some adjustment
Target cost breakdown to each cost ele-ment was set with some adjustments
Similar
Cost reduction target was imposed on
new exclusive controllable cost items
only
Different
Rely on supplier estimation
Less reliant on supplier estimation.
Target cost for exclusive part is calcu-
lated together by a few related depts.
Estimation was based on existing
product’s supplier quotations (current
cost level)
Different
Target cost break-down to functions/
groups/ parts
Target cost breakdown of local pur-
chased parts was up to R&D designer
group level only. For exclusive new
part, the estimated cost became the tar-
get cost.
Different
STEP 4:
Conduct the
Profitability
Feasibility
Study
Profitability Feasibil-ity Study compiles
all the cost items in-cluding a reserve or
risk budget to assess
overall profitability
Profitability Feasibility Study compiles all the cost items including reserve or
risk budget to assess overall profitabil-ity
Similar
Profitability feasibility study continu-
ously monitored to ensure the target
profit attained until end of product
model life
Different
Initially focused on specific variant as
model representative, later calculated
overall profitability in weighted aver-
age
Different
Decision tool to de-cide whether to drop or proceed with pro-
ject.
Achievement scenario planning as a
set of strategies to cover the differences
between the target cost and estimated
cost
Different
Univers
ity of
Mala
ya
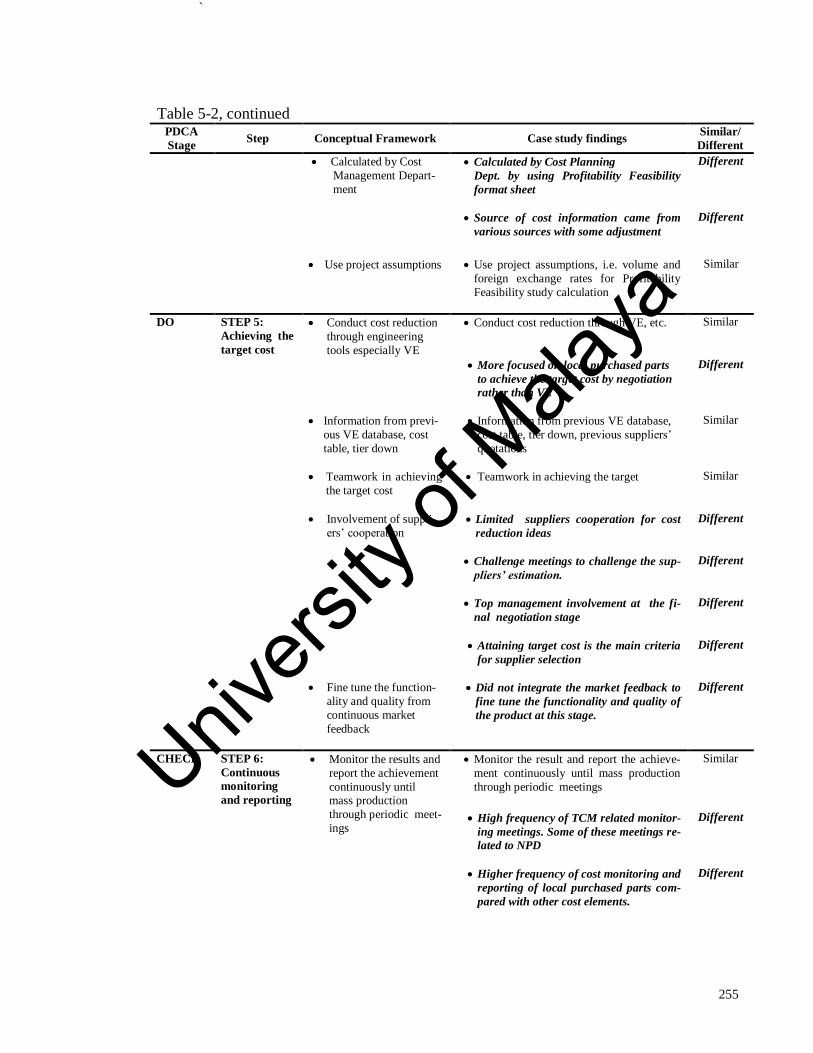
`
255
Table 5-2, continued
PDCA
Stage Step Conceptual Framework Case study findings
Similar/
Different
Calculated by Cost
Management Depart-
ment
Calculated by Cost Planning
Dept. by using Profitability Feasibility
format sheet
Different
Source of cost information came from
various sources with some adjustment
Different
Use project assumptions Use project assumptions, i.e. volume and
foreign exchange rates for Profitability
Feasibility study calculation
Similar
DO STEP 5:
Achieving the
target cost
Conduct cost reduction
through engineering
tools especially VE
Conduct cost reduction through VE, etc.
Similar
More focused on local purchased parts
to achieve the target cost by negotiation
rather than VE
Different
Information from previ-
ous VE database, cost
table, tier down
Information from previous VE database,
cost table, tier down, previous suppliers’
quotations
Similar
Teamwork in achieving
the target cost
Teamwork in achieving the target Similar
Involvement of suppli-
ers’ cooperation Limited suppliers cooperation for cost
reduction ideas
Different
Challenge meetings to challenge the sup-
pliers’ estimation.
Different
Top management involvement at the fi-
nal negotiation stage
Different
Attaining target cost is the main criteria
for supplier selection
Different
Fine tune the function-
ality and quality from
continuous market
feedback
Did not integrate the market feedback to
fine tune the functionality and quality of
the product at this stage.
Different
CHECK STEP 6:
Continuous
monitoring
and reporting
Monitor the results and
report the achievement
continuously until mass production
through periodic meet-
ings
Monitor the result and report the achieve-
ment continuously until mass production
through periodic meetings
Similar
High frequency of TCM related monitor-
ing meetings. Some of these meetings re-
lated to NPD
Different
Higher frequency of cost monitoring and
reporting of local purchased parts com-
pared with other cost elements.
Different
Univers
ity of
Mala
ya
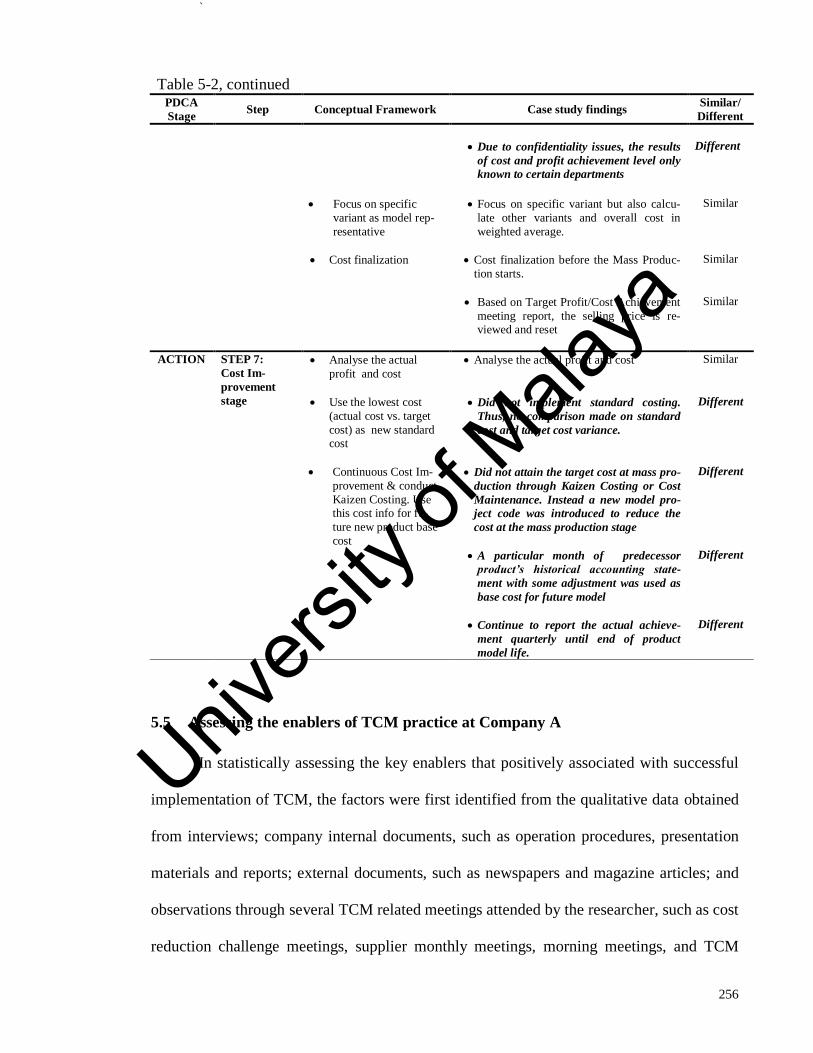
`
256
5.5 Assessing the enablers of TCM practice at Company A
In statistically assessing the key enablers that positively associated with successful
implementation of TCM, the factors were first identified from the qualitative data obtained
from interviews; company internal documents, such as operation procedures, presentation
materials and reports; external documents, such as newspapers and magazine articles; and
observations through several TCM related meetings attended by the researcher, such as cost
reduction challenge meetings, supplier monthly meetings, morning meetings, and TCM
Table 5-2, continued
PDCA
Stage Step Conceptual Framework Case study findings
Similar/
Different
Due to confidentiality issues, the results
of cost and profit achievement level only
known to certain departments
Different
Focus on specific
variant as model rep-
resentative
Focus on specific variant but also calcu-
late other variants and overall cost in
weighted average.
Similar
Cost finalization Cost finalization before the Mass Produc-
tion starts.
Similar
Based on Target Profit/Cost Achievement
meeting report, the selling price is re-viewed and reset
Similar
ACTION STEP 7:
Cost Im-
provement
stage
Analyse the actual
profit and cost
Analyse the actual profit and cost Similar
Use the lowest cost
(actual cost vs. target
cost) as new standard cost
Did not implement standard costing.
Thus, no comparison made on standard
cost and target cost variance.
Different
Continuous Cost Im-
provement & conduct
Kaizen Costing. Use this cost info for fu-
ture new product base
cost
Did not attain the target cost at mass pro-
duction through Kaizen Costing or Cost
Maintenance. Instead a new model pro-
ject code was introduced to reduce the
cost at the mass production stage
Different
A particular month of predecessor
product’s historical accounting state-
ment with some adjustment was used as
base cost for future model
Different
Continue to report the actual achieve-
ment quarterly until end of product
model life.
Different
Univers
ity of
Mala
ya
`
257
quality gates meetings. The following section focuses on nine factors that were identified.
These nine factors are: Advanced Manufacturing Technologies (AMT) implementation,
confrontational strategy, a customer orientation, an information-sharing network, lean man-
ufacturing implementation, supplier relationships, a teamwork oriented organizational cul-
ture, top management support and commitment, and training. These nine factors were later
tested statistically to determine the critical factors that positively associated with the suc-
cessful implementation of TCM in Company A’s context.
5.5.1 Advanced manufacturing technologies
Company A used AMT in its designing, manufacturing, parts ordering, product de-
livery and cost monitoring. In the design and development stage, several computer pro-
grammes, such as Computer Aided Design (CAD) and Computer Aided Engineering
(CAE) were used by the engineers. CAD was used to make the engineering drawings,
while CAE was used to verify the design of the material characteristics, performance and
interference by simulation and as the first level of judgement to evaluate whether the VE
was acceptable or not.
As for the material and parts ordering, Company A made the ordering through com-
puter systems. For example, for the local purchased parts, Company A established a cus-
tomized supplier online system for the ordering of parts and disseminating the production
and procurement related information to the suppliers using this system. While for the prod-
uct delivery, Company A used an online computer system for the car registration and pay-
ment of excise duty. This system helped to expedite the product delivery to the customers.
Univers
ity of
Mala
ya

`
258
For the TCM activities, Cost Planning Department also used a customized online
cost database system for cost monitoring of the purchased parts. This cost database system
is a real-time system, which was shared by Company A and Company M. Through this sys-
tem, information on the part list, target cost, suppliers’ price and cost estimation was shared
with the related parties. From this system, the Cost Planning Department extracted infor-
mation for preparation of the monthly cost monitoring report. However, this cost database
system was limited to certain products and the usage was limited to certain departments.
For the production side, the Production Planning Control Department used a com-
puterized shop floor system to control the production operations. Robot technology and
manual robots were used to assist the production operation. However, the usage of these
robotic systems was limited to certain processes, such as the parts stamping process and
painting process. Company A still relied on humans for most of its manufacturing process.
Around 8000 direct manpower (as per 2012) were involved with the manufacturing opera-
tion. This represented almost 80 per cent of the total manpower of Company A.
From the above qualitative findings it can be concluded that the AMT was observed
to some extent in the TCM implementation process.
5.5.2 Confrontational strategy
Company A gave priority to the quality, cost and functionality simultaneously in
strategizing its strategies. As quoted from a newspaper interview, Company A’s top man-
agement emphasized the company mission to sell its products with high quality and at an
affordable price:
Univers
ity of
Mala
ya
`
259
… What matters most is to manufacture and sell quality compact and afford-
able cars to Malaysians. 1
In addition, quality is one of Company’s A corporate values. This was reflected
through the case company’s daily activities. For example, the Defect Per Unit (DPU) index,
an index that indicates the defects found per unit of production, was monitored daily and
reported to the management by Production Planning. Furthermore, at the premises of Com-
pany A, there were posters quoting the clear message of the Managing Director concerning
quality to all of Company A’s employees:
Quality conscious starts with you. You can make that difference to exceed cus-
tomer satisfaction! (Source: Internal documents).
Regarding the product design, even though Company A used Company M’s model
base platform, Company A customized the upper body of the product to suit the local mar-
ket. The changes from its predecessor product involved styling, features and also ride com-
fort. As demonstrated by the top management in the newspaper interview:
Since day one, we have collaborated with them (Company M) as our tech-
nology and technical partner, tapping into their R&D, technology, technical
and engineering expertise. Our company’s collaboration with Company M
includes sharing common platforms and technical expertise. Be mindful that
our company does not blatantly copy and paste new products but we devel-
op new products to suit local tastes, in the areas of styling, features and also
ride comfort. Our company's models use up to 90% local parts.2
1 Your 10 questions with Datuk, The Star, 11 June 2011
2 Your 10 questions with Datuk, The Star, 11 June 2011
Univers
ity of
Mala
ya
`
260
Nevertheless, even though design modifications were made on the upper body, the
uniqueness of Company A’s products were not so obvious. As remarked by one of the sur-
vey respondents,
Company A products are mainly carry over products from Company M with
some improvement. Overall uniqueness can't easily be identified (Survey re-
spondent 54).
Additionally, the high cost of local purchased parts meant that the prices of Compa-
ny A’s products were not competitive globally. Among the reasons for the high cost of the
purchased parts was the high tooling cost due to the dies or moulds used to produce the parts
and components being imported from Japan or other overseas makers. Even though the tool-
ing cost was calculated using the payback period method, the low amortization volume re-
sulted in a high tooling cost per unit. This was one of the constraints to achieve the target
cost of the local purchased parts. As commented by the survey respondent concerning the
constraints of the confrontational strategy:
The moulds or dies (copy mould or die) are from Japan. Too expensive and not
possible to achieve the target cost. And use “old” technology (Survey respond-
ent 48).
In terms of cost reduction activities, the activities only focused on certain depart-
ments. Even though many meetings were conducted under TCM activities, due to the con-
fidentiality of cost and profit information, only middle to top management of certain de-
partments were informed concerning the total cost and profit status. Furthermore, Company
Univers
ity of
Mala
ya

`
261
A had a vertical organizational structure with a hierarchical relationship within each divi-
sion. The barrier of the horizontal relationship somehow limits the cost related information
flow and communication. Consequently, one of the respondents commented that certain
departments had a lack of awareness concerning how their decision would impact the total
cost of the product:
We don’t have good cooperation with some of the departments. Of course, R&D
and CP (department) are in close relationship. I think we have no problem in that,
but some other department QRE, QC, production people they lack this (cost)
conscious. So, they do as they please… their judgement or decision in terms of
design, their checking features jigs, and their choice of suppliers actually don’t
put cost as the priority (Informant 4, Middle management, R&D Dept.).
From the above qualitative findings, to some extent, it can be concluded that the
implementation of a confrontational strategy was observed in the implementation process of
TCM at Company A.
5.5.3 Customer orientation
Customer orientation is considered as an enabler as customer centric is one of Com-
pany’s A corporate values. According to the definition of customer centric by Company A,
“being customer centric means understanding our customer needs, meeting or exceeding
their needs and improving every customer experience with us. This is to ensure highest cus-
tomer satisfaction is our top priority”. The importance of satisfying customers to achieve
the company’s profit was well understood by the TCM related members:
In producing cars, we give priority to customer requirements and at the same
time we are concerned about the cost to get our profit… we create a product
Univers
ity of
Mala
ya
`
262
that can satisfy the customer and also give profit to the company. .. We call it
“Shohin”, create product that brings value to the manufacturer and benefits the
customer (Informant 3, Lower management, Product Marketing Dept.).
…in a manufacturing company… any company has to understand customer re-
quirements... How to satisfy customers? This is the most important… not only
internal and outside… (Informant 6, Middle management, Cost Planning Dept.).
The case company took appropriate measures in respect of quality related com-
plaints from its customers. For example, as emphasized by Informant 5, compared to other
competitors in the same field, Company A even sends the customers’ complaints to the
R&D Department for further investigation and countermeasures:
This is where this company (Company A) excels compared to its competitors.
This company tries to fulfil the needs to an extent… any complaints from cus-
tomers reach the R&D side. This is not happening at competitors. Complaints
just die off at service centre mechanics! It is up to the mechanics to serve the
complaints (Informant 5, Technical staff, Purchasing and Vendor Development
Dept.).
Customer orientation priority was reflected in the mission statement of Company A.
It aimed to be in the top three ranking in the Customer Satisfaction Index (CSI). The Cus-
tomer Satisfaction Index is an index to measure customer satisfaction according to seven
elements: service delivery, service initiation, service advisor, in-service experience, user-
friendly service, problems experienced and service quality. The sales operation under
Company A1 was responsible for the sales, marketing, and distribution including customer
satisfaction. However, as the TCM team members were under Company A4, which was
responsible for the manufacturing operation, the detailed targets of the CSI were not known
by the non-sales operation related members, as commented by the TCM survey respondent
20:
Univers
ity of
Mala
ya
`
263
The CSI targets were no specified in detail (Survey respondent 20).
From the above qualitative findings, it can be concluded that, to a certain extent, the
customer orientation was observed in the TCM implementation process of Company A.
5.5.4 Organizational information-sharing network
The researcher observed the positive and open practice of information sharing be-
tween the case company and its value chain. For example, in terms of information sharing
with Company M, the researcher observed frequent meetings including TV meetings con-
ducted by R&D members with its Company M counterparts to discuss technical related is-
sues. Company A’s R&D members also had frequent business trips to Company M in Japan
to discuss the design and development related issues. In terms of information sharing with
its suppliers, a customized online suppliers system was used to share the production and
purchase information. Besides that, Company A also conducted monthly supplier meetings
to brief all its suppliers on production and purchasing related issues. Frequent discussions
between suppliers and TCM members were also conducted to discuss the technical issues
and countermeasures.
Regarding the cost estimation of parts, besides referring to the cost tables, the case
company also referred to previous quotations of suppliers for cost information. Most of the
suppliers’ quotations had a detailed cost breakdown, such as material cost per kilogram,
cycle time of each manufacturing process and the tooling cost. This information helped the
TCM members to estimate the cost of the new purchased parts or any engineering design
Univers
ity of
Mala
ya
`
264
changes. As admitted by the Purchasing and Vendor Development Department middle
management, the existing product suppliers’ quotations were utilized for cost estimation:
If the suppliers can submit the quotation in detailed breakdown...for next pro-
ject, we can estimate the part and set the target cost (Informant 1, Middle
management, Purchasing and Vendor Development Dept.)
However, some of the suppliers only submitted the total purchased part price and re-
fused to reveal the breakdown of the part cost. Company A faced this problem with suppli-
ers who had a high supplier power position, especially for the parts related to the functional
and under outsourced drawings, which were developed by the multinational suppliers. Due
to the company policy of the suppliers and the issue of confidentiality, the cost information
on these purchased parts was very limited. As highlighted by the TCM members:
In general, our company and suppliers share information. However, in certain
cases, it is not open or easy to access. No detail breakdown (of the supplier quo-
tation’s contents) (Survey respondent 79).
For functional parts, suppliers do not give the breakdown. So, our members can-
not learn from the breakdown, cannot figure how the suppliers derive the price
because the quotation is in one figure only. For those parts, yes, we cannot study.
(Informant 1, Middle management, Purchasing and Vendor Development Dept.).
Nevertheless, regarding this limited information issue, Company M assisted Compa-
ny A with the cost information for target cost setting.
We have a base product of Company M. That’s why we can take the base cost
and work backward. If we work from zero, I don’t think we are capable. If from
scratch without a base product, in which we have to develop and set the target
cost, I think this company is still incapable. We are still not at that level yet (In-
formant 1, Middle management, Purchasing and Vendor Development Dept.).
Univers
ity of
Mala
ya
`
265
However, the information received from Company M was very limited. As admitted
by the Middle Management of the Cost Planning Department,
Another way to set the target cost is to look at cost competitiveness. However,
we don’t have enough information. We just rely on Company M information.
But Company M information is also very limited, which is only for the domes-
tic model (Japan basis cost information) (Informant 6, Middle management,
Cost Planning Dept.).
The confidentiality and legal issues related to Company M’ suppliers information hin-
dered the open information sharing between Company M and Company A. As commented
by the respondents:
Company policy and confidentiality hindered the information exchange (Survey
respondent 18).
Some information not freely shared and difficult to access (Survey respondent 48).
Some suppliers cannot disclose their detailed quotations, especially Japanese
suppliers. Our company partner (Company M) is also reluctant to share their de-
tailed cost study results (Survey respondent 44).
The lack of detailed cost information on the parts and the lack of knowhow concern-
ing the cost estimation of functional parts were among the constraints in the TCM practice.
This meant the TCM members were unable to justify the accuracy of parts’ target cost to its
suppliers. As commented by the respondent:
When people ask how we derived the target cost, we cannot answer, we cannot
justify whether or not our target cost is correct. We cannot answer back (the tar-
get cost in detail) when we were asked (by suppliers). I think because we don’t
have the detailed breakdown (of the target cost). This is my observation of the
current status (Informant 1, Middle management, Purchasing and Vendor Devel-
opment Dept.).
Univers
ity of
Mala
ya
`
266
The case company acknowledged that the cost information was one of the major con-
straints in TCM practice. In one of the management reports, the cost information issue was
summarized as, “cost data for the financial does exist, but cost data for the cost manage-
ment does not exist”. For example, even though the case company had cost tables, the cost
tables were limited to certain processes only, such as plastic injection, stamping parts and
machining. Thus, the case company lacked a standard cost level to advise the suppliers or
benchmark cost level to refer to for verification of supplier’s costs. Additionally, in terms of
in-house cost information, the case company still relied on historical accounting statements
as its base cost to estimate the new product. This historical accounting result was derived
from financial accounting data, which was originally used for the purpose of financial re-
porting. Since Company A practiced the actual costing method, some of the actual in-house
costs were allocated to each existing product based on the production volume and standard
time allocation, such as energy cost, direct manpower cost and consumable cost. This allo-
cation ignored the actual cost incurred, such as reject cost, for a particular product. Fur-
thermore, the actual payment made at a particular month would not reflect the actual cost
incurred. Thus, these cost information were not accurate to be used as the base cost of the
new product.
The case company also recognized that its cost information was based on the existing
cost level and was not competitive. In order to survive in a competitive market, the global
level cost benchmarking was important for TCM. For example, in terms of target cost set-
ting for the exclusive parts, the cost information from various countries was important to
judge the level of competitiveness of the target cost. Nevertheless, due to the inaccessibil-
Univers
ity of
Mala
ya
`
267
ity of the information, the case company still did not have the knowhow to retrieve it. As
highlighted by the middle management of the Cost Planning Department:
We don’t have cost data for Thailand and other countries like Indonesia and
the Philippines. At this time, I don’t have any idea how to get information for
other countries. But, in order to survive worldwide, we have to have such in-
formation, how to collect, how to get. That portion is very difficult and im-
portant (Informant 6, Middle management, Cost Planning Dept.).
The case company recognized that information sharing with its business partners was
important for the TCM practice. From the above qualitative findings, it can be concluded
that information sharing was observed to some extent in the TCM implementation process
of Company A. However, cost related information due to the lack of information and con-
fidentiality issues were the major constraints in the TCM practice.
5.5.5 Lean manufacturing implementation
At Company A, the lean manufacturing was known as the Toyota Production Sys-
tem (TPS). The lean manufacturing implementation at Company A was reflected through
the shop floor visualization concept and 5S. As quoted from a newspaper interview with
Company A’s customer, the respondent remarked:
I was impressed with the Japanese production methodologies being carried
out so well. The shop floor areas were clean and tidy, charts pinned up in the
neat rows along the various set manufacturing process sections and safety
measures strictly enforced.3
3 Nostalgic feeling, New Sunday Times, 30 August 2009
Univers
ity of
Mala
ya

`
268
Generally, Company A implemented TPS in seven areas with the ultimate objective
being to reduce the waste arising from waste of excessive inventory, waste of motion, waste
of transportation, waste of over processing, waste of waiting time, waste of overproduction
and waste due to product defect or rework. For example, to eliminate the waste in invento-
ry, Company A implemented the Kanban system to supply the parts to the production lines.
The implementation of the Kanban system managed to reduce the stock holding from 3
days to 0.5 days. Other examples of waste elimination in product defects and reworks were
the implementation of Pokayoke and Andon. Pokayoke was an error proofing method to
reduce the human error in assembling the parts, which, ultimately, increases quality.
Whereas, the implementation of Andon allowed the line to be stopped and operators to call
their immediate superior if any line abnormality happened. With the implementation of the
Andon and Pokayoke system, Company A managed to reduce its defects from 1.5 to 0.2 per
unit (as of year 2012). Furthermore, Company A also implemented JIT delivery for some
big parts, such as seats, tyres and bumpers.
The concept of Kaizen and the Quality Control Circle was also well known among
the employees. Company A also conducted a monthly Kaizen Suggestion Scheme competi-
tion and a yearly Quality Control Cycle competition to encourage its employees to give
ideas for cost reduction. However, these activities were hardly linked to achieving the TCM
target cost at the mass production stage.
Among the engineering tools, VE was the main tool used in TCM. It was widely
used at Company A from planning until the mass production stage. In Company A, the sec-
Univers
ity of
Mala
ya
`
269
ond look VE, VE activities after the mass production started, was also known as Value
Analysis (VA). As commented on by a survey respondent,
As of today, no proper TCM (as cost reduction activities) has been imple-
mented, except VAVE (Survey respondent 49).
From the above qualitative findings, it can be concluded that the lean manufactur-
ing, such as VE, JIT, and Kanban and Kaizen activities, was observed to some extent in
Company A.
5.5.6 Supplier relationship
Company A recognized that suppliers have important roles to make TCM activities
successful. As commented on by the middle management of the Cost Planning Depart-
ment:
Cost planning (TCM activities) cannot be done only by us, only by one com-
pany, some cooperation is necessary from other companies. The suppliers!
(Informant 6, Middle Management, Cost Planning Dept.).
Company A shared related information with its suppliers through the monthly sup-
plier meeting. In this meeting, production related information and issues related to the sup-
pliers were highlighted by the representatives from all the related departments. The objec-
tives of this meeting were to make all the suppliers aware of production related issues and
take the necessary actions related to their parts supply to Company A. Besides that, Com-
pany A also shared the production information through the online supplier information sys-
tem. Company A also established a special department, the Vendor Improvement Depart-
Univers
ity of
Mala
ya
`
270
ment (VID) to support the suppliers. The main responsibility of this department was to veri-
fy the new product production preparation at the suppliers’ plant and support the suppliers
in terms of production related issues. These activities were in line with the stance of Com-
pany A to support the suppliers and make them more competent and competitive. As re-
marked by the Managing Director of Company A in one of his newspaper interviews:
What is important now is for Company A to work even more closely with local
suppliers and help them to be globally competent and competitive and not just
be suppliers for Company A alone.4
The information received from the suppliers, i.e. supplier quotations, helped the case
company to set the target cost. In estimating the target cost, the details of the processes and
the basis of the cost charged for each process need to be understood. One of the methods to
understand the process and cost was through the analysis of the suppliers’ quotations.
However, when submitting a tender for the project, not all the suppliers give their detailed
quotation breakdown. Among the reasons given by the suppliers were against the company
policy to reveal cost information and confidentiality. As there is no breakdown of the quo-
tation from these suppliers, the TCM related members do not know the detailed costs. Fur-
thermore, without detailed cost information, the tendency for opportunism was likely to
happen after these suppliers had been selected. The suppliers might increase the cost unre-
alistically under small engineering changes along the development stage. As commented by
the respondent:
4 Your 10 questions with Datuk ,The Star, 2011, June 11th
Univers
ity of
Mala
ya
`
271
Information is very limited… the suppliers do not disclose their real costs. The
cost is hidden somewhere. So, we do not know the actual cost (Informant 17,
Lower Management, R&D Dept.).
Basically, when a large proportion of the suppliers’ volume depended on the produc-
tion of Company A, the suppliers were likely to share the detailed cost information with
Company A. However, if the value of the suppliers’ sales to Company A was small or there
were few competitors to produce the same parts, the suppliers had a high supplier power
against Company A. In this case, it was very difficult to get detailed cost information, espe-
cially for functional parts, such as headlamp, wire harness and meter instruments, which the
drawings and part development were totally under the responsibility of the suppliers. Some
suppliers were reluctant to reveal their cost information in detail because they were afraid
Company A would use it as a battleground for future cost reduction. As commented by the
middle management from the Purchasing and Vendor Development Department:
Basically, for local suppliers we have no problem getting the support to get the
detailed quotation. No problem at all. But for the international suppliers (we do
have problems), they know if they submit the details, we can utilize that detail
for future (Informant 1, Middle Management, Purchasing and Vendor Devel-
opment Dept.).
Since TCM is highly related to the suppliers, the suppliers’ capability, understanding,
commitment and level of cooperation determine the success of TCM. Generally, it seemed
that the level of supplier relationship still did not meet the expectations of the TCM mem-
bers. One of the respondents highlighted that the local suppliers still did not understand the
pressure of globalization, which made them less competitive, and ultimately, prevented the
successful implementation of TCM:
Univers
ity of
Mala
ya
`
272
I think the biggest problem is because we are not at par with (local) suppliers...
imbalance. We are into this globalization, meaning everybody has to grow to-
gether. But, I think only Company A is growing, the suppliers are not. So, be-
cause of this imbalance, some suppliers take things for granted. Probably
they’re not doing their best, they’re not offering the same quality, and they can-
not think the way we think. Some suppliers do not actually feel like they want to
challenge their own quotation, so what they have from the accounts department
is what they will submit rather than going through (the cost)... they are not try-
ing to be competitive. They don’t understand about globalization. By rights,
they should be looking at their own quotation and asking themselves is this quo-
tation competitive? Because we are into globalization, they (the suppliers)
don’t have the same understanding, that’s why they are not at par (Informant 4,
Middle Management, R&D Dept.).
However, on the other hand, it seemed that local suppliers perceived that the cost re-
duction activities requested by Company A were cutting their profit margin not through
cutting their own unnecessary or wasteful cost. This was because most of the materials
were imported and uncontrollable by the suppliers. Therefore, the suppliers could only con-
trol their manufacturing or assembly cost. However, this assembly cost only covered a
small portion of the total product cost compared to the material cost. As commented by the
suppliers on the cost reduction activities by Company A:
Most of the cost belongs to the material or purchased parts, almost 80-90%.
The balance is our manufacturing cost. How do you expect us to reduce more
cost? (Informant 19, Top management, Supplier P).
They (Company A) asked us to reduce the cost, but you can see there is no
more room for us to reduce the cost (Informant 23, Middle Management, Sup-
plier S).
Besides that, the suppliers also had a constraint on the technology, such as in-house
tooling development. This made them reliant on their second tier knowhow, which limited
Univers
ity of
Mala
ya
`
273
their capacity to conduct the cost reduction activities. As commented by the TCM mem-
bers:
The suppliers rely on their toolmakers. We have to educate the suppliers. So
they can educate their toolmakers (Informant 17, Lower Management, R&D
Dept.).
In spite of all the cost reduction pressure imposed by Company A on their suppliers,
Company A acknowledged the constraints faced by the suppliers in terms of knowhow, ca-
pabilities and the limitation of design changes that could be conducted by the suppliers to
reduce the cost:
We would like to have some cost reduction to meet the target cost. But, at the
same time, we have to understand the constraints on the supplier side… we can
push for the cost reduction but if the supplier ceases to exist, this will also be-
come a problem for Company A (Informant 1, Middle management, Purchasing
and Vendor Development Dept.).
The suppliers have a very limited area to do cost reduction because they cannot
touch or change the design. Change of the design not only involves their part
but is also related to the parts of other suppliers…which involve many things
(Informant 22, Technical staff, Purchasing and Vendor Development Dept.).
Based on the above qualitative findings it can be concluded that, to some extent, the
supplier relationship was observed in the TCM implementation process of Company A.
Nevertheless, the level of cooperation from the suppliers in terms of cooperation in joint
development, cost reduction activities, information and knowledge sharing, still did not
meet the Company A’s expectation.
Univers
ity of
Mala
ya
`
274
5.5.7 A teamwork orientation culture
Company A promotes teamwork by promoting respect as one of its company values.
In Company A’s training documents, the value of respect was defined as being courteous,
humble, exercising good emotional management in daily interactions, embracing and ap-
preciating diversity, cooperating and supporting one another at all levels. In one of the
newspaper interviews, Company A’s top management proudly admitted the value of team-
work at Company A:
Without teamwork, Company A would not be able to achieve what it has in such
a short span – less than two decades. I am blessed to have a team of dedicated
management and staff.5
As commented by one of the TCM members, teamwork played an important role in
which each department performed their role and accepted responsibility through various
means to accomplish the TCM targets:
How each department plays their role (is important for TCM success)... for
example PVD (Purchasing and Vendor Development Department), even
though we have our own cost tables, we have to enhance the cost tables, we
get the latest data, we get the new calculations, we try to see our weakness in
terms of the cost comparison between the Malaysian level, Indonesian level
and the Japanese level. From the study, we can come out with proper new ide-
as how to make a better target cost. Sometimes, you cannot calculate the part
cost itself because there is no cooperation from the suppliers, then you have to
reverse calculate and see how you can tackle the problem of the target cost
(Informant 5, Technical staff, Purchasing and Vendor Development Dept.).
5 Your 10 questions with Datuk ,The Star, 11 June 2011
Univers
ity of
Mala
ya
`
275
The respondent further added that the age level range of Company A’s employees has
also played a role in promoting a culture of cooperation. Most of the working level was be-
tween 30 to 40 years old:
We can see the age level of Company A’s employees. Everybody is much
younger. The working level is much faster. We want to get fast result, fast data,
everything is fast. If the culture is moving very slow, it is very hard for us to
work and cooperate (Informant 5, Technical staff, Purchasing and Vendor De-
velopment Dept.).
Unlike the Japanese companies, Company A did not implement Cross-Functional
Management (CFM). Generally, the tasks were highly segregated by department and divi-
sion with the TCM activities anchored by the Cost Planning Department. Nevertheless,
even though there was no cross-functional team in the case company, the TCM activities
were not conducted in isolation by the Cost Planning Department. The TCM activities
mainly involved the Purchasing and Vendor Development, R&D, Cost Planning, Product
Marketing and Product Planning Departments. Other departments, such as Vendor Im-
provement, Production Planning, Product Engineering, Cost Control and Account Depart-
ment were involved indirectly in supporting the TCM implementation process. Each de-
partment had their specific task in TCM; for example, the Marketing Department pro-
posed the new products supported by the market survey results, the Product Planning De-
partment studied the overall new product specifications, the R&D Department studied the
feasibility of how to make the parts, the Cost Planning Department compiled the cost and
calculated the profitability feasibility study, the Accounting Department provided the exist-
ing product cost information, Product Engineering studied the production line feasibility
and studied the in-house cost, the Purchasing and Vendor Development Department negoti-
Univers
ity of
Mala
ya
`
276
ated with suppliers on the pricing of parts, and the Vendor Improvement Department sup-
ported and developed the suppliers on production related issues.
The TCM activities indirectly increased the communication and cooperation among
the departments involved. For example, during the early stage of TCM implementation, the
target cost was set solely by the Cost Planning Department. At that time, Purchasing and
Vendor Development Department and the R&D Department did not get involved in the
process of the target cost setting. However, in order to get a more realistic target cost for the
model X1 project, these departments started to become involved in target cost setting. The
exclusive parts’ target costs were set together with the agreement of the Cost Planning,
R&D and, Purchasing and Vendor Development Departments. This process increased the
accuracy, reliability and achievability of the target cost. One of the R&D middle manage-
ment commented that the R&D Department gradually became involved in the TCM activi-
ties:
During the earliest stages, R&D was not involved so much in cost planning ac-
tivities (TCM)… it actually gradually increased for example like now, we are
strongly involved (Informant 4, Middle Manager, R&D Dept.).
Nevertheless, the TCM activities were more focused on the design and development
stage and not yet integrated as a companywide activity. As remarked by the survey respond-
ents, TCM was still not companywide, especially on the production side:
TCM implementation in Company A is still not overall, especially for the pro-
duction plant (Survey respondent 3).
Univers
ity of
Mala
ya
`
277
Next, activities need involvement from PE (Production Engineering) and Assem-
bly (Manufacturing) members. Most of the price increase of parts is due to addi-
tional requirements by these departments during the KWTA (initial trial stage)
activity onwards (Survey respondent 44).
Furthermore, in the case company, the TCM was a part of NPD. Thus, even though
some of the departments were not involved directly with TCM activities, all of these de-
partments had different responsibilities and contributed their own expertise in NPD. During
the NPD related meetings, the representatives of all the departments reported their status
progress, which mainly related to quality and delivery. These meetings created interaction
and cooperation among members.
From the above qualitative findings it can be concluded that even though the TCM
practices at the case company were not companywide integrated activities, the teamwork
orientation culture was positively observed to exist in the TCM implementation process of
Company A.
5.5.8 Top management support and commitment
Company A’s top management played an active role in preparing the company to-
wards market liberalization. For example, since 2002, the management of Company A
started to introduce the long-term vision, “Triple T” Vision (pseudonym), which covered
the customer satisfaction, market and cost reduction aspects. Under this vision, Company A
targeted to be in the Top three in the Customer Satisfaction Index (CSI) ranking, to have a
cost reduction of 30 per cent and to have a 30 per cent market share. These objectives were
pasted everywhere in the company’s premises. A small printed card with the “Triple T” vi-
sion was also distributed to all employees to increase their awareness. Accordingly, the
Univers
ity of
Mala
ya
`
278
TCM members recognized that the TCM practice was one of the tools to achieve the “Tri-
ple T” vision. As commented by Informant 4 regarding the relationship between the com-
pany vision and TCM practice:
... the end objectives drive thing (activities). Meaning that we know that we
have to achieve a certain target, earlier we have this ‘Triple T’ Vision (pseu-
donym), then we have 4% target reduction target every year. We know that we
have to achieve the target in order to achieve a certain profit target profitabil-
ity (Informant 4, Middle management, R&D Dept.).
Inasmuch as the case company was a manufacturing company with a vertical and
hierarchical organization, the department heads played an important role in smoothing the
communication among the departments. For example, the heads of department actively
communicated with the management of other departments to assist their subordinates to
solve the tough issues. As remarked by the R& D middle management on their top man-
agement support:
In terms of R&D, we don’t have that problem... Usually R&D management
will also be involved when we are stuck or hit the wall. They will actually ac-
tively get involved with other (department) management ... our own manage-
ment actually assists a lot (Informant 4, Middle management, R&D Dept.).
In terms of the TCM implementation process at the case company, even though the
case company did not practice the CFM, the CE was the leader for new product develop-
ment. Generally, the main role of the CE was to determine the project direction and to en-
sure the targets were achieved. Accordingly, all the related departments reported the neces-
sary information to the CE. For example, the Product Marketing Department reported the
market survey results and Product Marketing concept, the Cost Planning Department re-
Univers
ity of
Mala
ya
`
279
ported the necessary cost information and project cost achievement status at each devel-
opment stage, and the R&D Department reported the technical related issues and overall
product development status. Besides that, the CE also helped to enhance the cooperation
with Company M’s top management in relation to TCM activities. As commented by the
technical staff on the CE roles in the TCM activities of Model X1:
First, it (the direction) comes from top management itself. In the case of
Model X1, the CE was concerned about the price level in Malaysia. He per-
sonally pushed Company M to cooperate with our company. They (top man-
agement) wanted Company A’s people (TCM members) to go to Japan
(Company M) to study the target cost, get the agreement (on the target cost)...
(Informant 5, Technical staff, Purchasing and Vendor Development Dept.).
In each NPD quality gate meeting, the status of the project was also presented
to the top management for their approval including the General Managers (GM) of
the related departments, Executive Directors and Managing Director. Only with the
top management approval, was the project allowed to proceed to the next stage. As
commented by Informant 2, the top management gave support to the TCM activities
in terms of providing the resources, monitoring and reviewing the overall cost
achievement status and approving the overall result in each NPD quality gate meeting:
The GM level will monitor in terms of overall vehicle profit…meaning cost
of local parts, development cost, investment cost, everything. They don’t
have to know the part by part target cost like … this part RM5… But our ac-
tivity (TCM), at the end of the day, we produce an overall vehicle profit or
vehicle costing, and then we present to the management, and management
see, review and agreed. I think that is the involvement of the management.
Management level reviews what we did, they approved. So if you ask about
management commitment, yes! They do give commitment (Informant 2, Mid-
dle management, R&D Dept.).
Univers
ity of
Mala
ya

`
280
At the end of 2012, in order to fully prepare for the challenges of AFTA, Company
A’s top management introduced a new transformation philosophy. One of the new trans-
formation philosophies that related to TCM was “Good Product Design” through “Practi-
cability Design”. The objectives were to produce a high quality and low cost product. This
clear target drove all the employees in one direction, which was to ensure the company
achieved its target profit and remained competitive. This transformation included the or-
ganizational re-structuring of the TCM related departments and also the methods of con-
ducting the TCM, especially in terms of setting the target cost. As commented by Inform-
ant 17,
Now we are venturing into a new organization. We are doing the ‘Axis meth-
od’ (pseudonym). With this (TCM) method (of purchased part target cost set-
ting), the engineer can see the whole process not only the design stage.
However, it is too early to see the result (Informant 17, Lower Management,
R &D Dept.).
The case company’s top management had a clear vision and played an active man-
agement role in supporting the TCM practice. From the above qualitative findings, it can
be concluded that the top management support and commitment was positively observed in
the TCM implementation process of Company A.
5.5.9 Training
In general, Company A shared information with its employees through the employ-
ees website, email public folder, periodic company magazines and notice boards. Further-
more, Company A also implemented “mieruka” or the visualization concept to create a
common understanding through information visualization. In the factory visits, the re-
Univers
ity of
Mala
ya
`
281
searcher saw that various materials were pasted on the notice boards including training ma-
terials, production related status progress and production related issues. Besides that, every
morning, each department conducted a fifteen minutes briefing to brief and share the latest
issues with their group members. Some departments; for example, the Cost Planning De-
partment conducted a one hour meeting each morning. In this meeting, the Cost Planning
members shared and discussed their project status progress, issues and planned counter-
measures with the members and the superiors. After the briefing, a short training was also
conducted in turn by each member to educate the new members.
The case company’s commitment towards training was proven by the establishment
of the Learning Centre and Plant training centre. Besides conducting internal training, the
case company also trained its employees through external training including overseas train-
ing at Company M. However, such training was more general and not specific to the TCM
practice. For the TCM, most of the training was conducted through the OJT. As highlighted
by Informant 4 and Survey Respondent 54, the R&D engineers acquired the TCM
knowhow, such as parts cost estimation knowledge through the OJT.
… I think we learnt through OJT, we don’t have proper training in terms of
this cost calculation. But through (doing) projects, the same individual or
some groups of people are going through the same procedures. So, eventually
they acquired the knowledge, the right knowledge on the calculations and then
on the scenarios. If let us say, we are stuck in a certain situation we create
certain scenarios and then the countermeasures. Usually we work together
with CP (Cost Planning Department) very closely… I think most of the time
all these are learnt through OJT (Informant 4, Middle management, R&D
Dept.).
TCM experience only gained from on job (training) or daily job. No specific
training (Survey respondent 54).
Univers
ity of
Mala
ya
`
282
Even though the Cost Planning Department was established in 2001, due to the high
turnover in this department, the most senior local members of Cost Planning at Company A
only had 4 years’ experience. Due to the difficulty in retaining the expertise, Company A
still relied on the expatriates of Company M to lead and train members on the TCM prac-
tices. The expatriates from the Cost Planning Department also conducted specific TCM in-
ternal training to the TCM members to enhance the TCM knowledge, especially concerning
cost estimation methods. As commented by Informant 5, the expatriates taught the TCM
members many new things related to the TCM activities:
...We are lucky because we have a good teacher from Company M. Even
sometimes, Company M teaches certain items that we cannot see in Malaysia
itself (Informant 5, Technical staff, Purchasing and Vendor Development
Dept.).
Nevertheless, most of the TCM members felt that more specialized training on TCM
was necessary to enhance the knowledge and skills.
TCM related training can be considered as not yet sufficient and fully estab-
lished in this company, for some of the technical staff, designers and purchasing
staff (Survey respondent 48).
No specialist identified or capable to plan specific training for TCM (Survey
respondent 3).
Besides that, management also encouraged TCM members to learn the actual parts
manufacturing processes at the suppliers’ factories. The familiarization of the parts manu-
facturing processes assisted the TCM members to estimate the cost of parts accurately and
set a realistic target cost. For example, the Cost Planning Department conducted monthly
supplier visits to expose the members to the parts manufacturing processes.
Univers
ity of
Mala
ya
`
283
Company A invested in human capital development by conducting various training.
Nevertheless, regarding specific TCM training, most of the training was conducted through
OJT. From the above qualitative findings it can be concluded that training was positively
observed in the TCM implementation process of Company A.
In sum, AMT implementation, confrontational strategy, a customer orientation, an in-
formation-sharing network, lean manufacturing implementation, supplier relationships, a
teamwork oriented organizational culture, top management support and commitment, and
training, were observed to a certain extent at Company A.
5.6 Summary
This chapter described the background of Company A, the history of TCM devel-
opment and what triggered Company A to fully implement TCM. Based on the qualitative
findings, this chapter depicted the TCM implementation process, the enablers that support
the implementation and the perceived benefits to the case company of TCM implementa-
tion. The findings demonstrated that the TCM implementation process at Company A was
not a rigid technique but more of an adaptive technique. Furthermore, even though Compa-
ny A already started to implement the TCM since 10 years ago, the TCM level was still in
the infant stage. This was because the TCM implementation only focused on the design
stage, involved certain departments and was not yet integrated as a companywide activity.
In terms of the TCM implementation process, the qualitative evidence showed that the fun-
damental concept of TCM, such as target cost, target profit, target-selling price was similar
to the Japanese TCM model. However, due to the environmental constraints, mainly sup-
Univers
ity of
Mala
ya
`
284
pliers and information sharing, some adaptations were made to the TCM implementation
process.
This section also assessed the nine proposed enablers: (1) Advanced Manufacturing
Technologies (AMT) implementation, (2) confrontational strategy, (3) a customer orienta-
tion, (4) an information-sharing network, (5) lean manufacturing implementation, (6) sup-
plier relationships, (7) a teamwork oriented organizational culture, (8) top management
support and commitment and (9) training. The assessment showed that the enablers existed
and were likely to support the TCM implementation process. Nevertheless, the degrees of
existence of these enablers need to be confirmed with a statistical approach. This chapter
also assessed the perceived successful implementation of TCM from the TCM members.
Generally, the TCM members recognized that the TCM implementation helped to improve
the case company’s efficiency, marketability and cost reduction. Nevertheless, similar to
the proposed enablers, the degree of these dimensions needs to be confirmed using a statis-
tical approach.
The next chapter will discuss the statistical analysis of TCM enablers. From the
feedback of the survey questionnaires, the enablers that support the successful implementa-
tion of TCM will be analysed statistically using PLS. Then, the results from the quantitative
evidence will be triangulated with the qualitative evidence for a comprehensive conclusion
concerning the enablers that support the successful implementation of TCM at Company A.
Univers
ity of
Mala
ya
`
285
CHAPTER 6: QUANTITATIVE FINDINGS
6.1 Introduction
This chapter discusses the quantitative findings of this research to answer the re-
search question number three – among the nine factor identified, which factors that have a
positive association with the successful implementation of TCM at Company A? Accord-
ingly, the questionnaire surveys were distributed to the Company A’s employees to statisti-
cally examine the factors that have a positive association with the successful implementa-
tion of TCM in Company A.
The first section discusses and analyses the response rate and the profile of the re-
spondents. This demographic analysis is analysed using the Statistical Package for Social
Sciences (SPSS 18.0). The second section explains the data screening process in terms of
data cleaning and data coding. The last section discusses the results of the Smart Partial
Least Squares (Smart PLS 2.0) analysis. In this section, the PLS results will be explained
in two stages, the measurement model and the structural model.
6.2 Survey results
This section explains the analysis of the response rate and the profile of the re-
spondents. The data were analysed using SPSS.
6.2.1 Response rate analysis
A total of 100 questionnaires were distributed randomly to selected participants
from six departments. All the participants were either TCM direct users or indirect users.
Eighty-nine responses were returned with a response rate of 89 per cent. However, two
Univers
ity of
Mala
ya
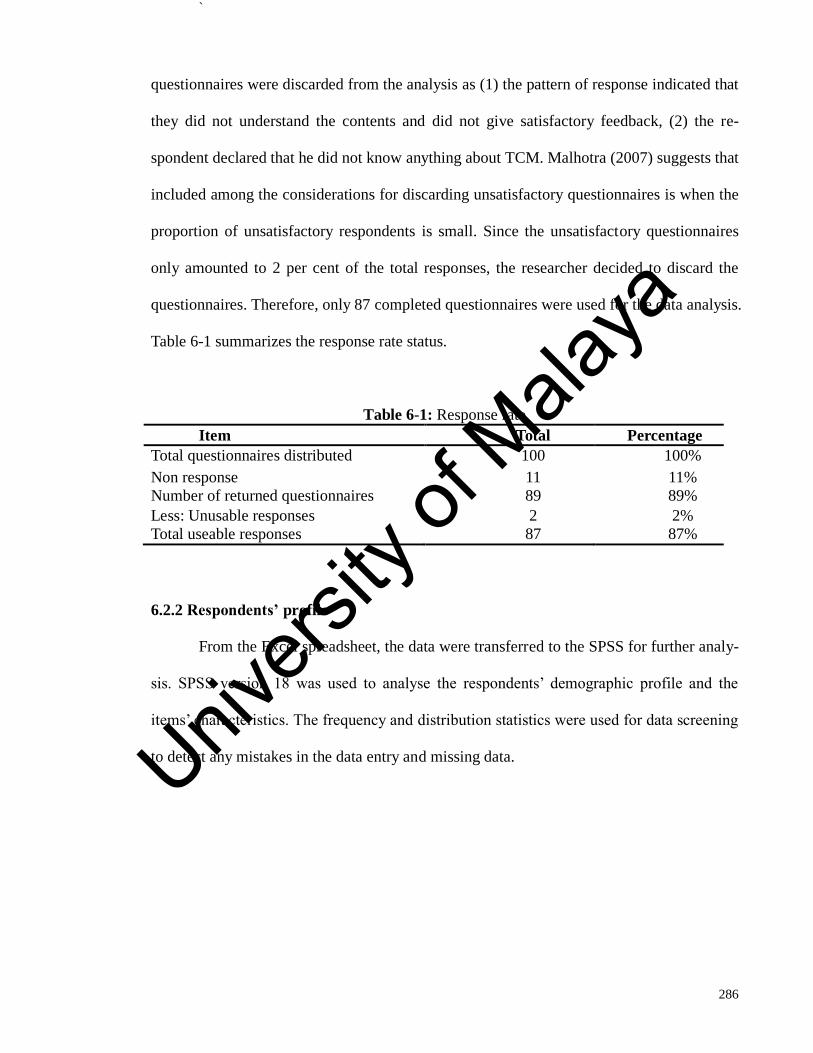
`
286
questionnaires were discarded from the analysis as (1) the pattern of response indicated that
they did not understand the contents and did not give satisfactory feedback, (2) the re-
spondent declared that he did not know anything about TCM. Malhotra (2007) suggests that
included among the considerations for discarding unsatisfactory questionnaires is when the
proportion of unsatisfactory respondents is small. Since the unsatisfactory questionnaires
only amounted to 2 per cent of the total responses, the researcher decided to discard the
questionnaires. Therefore, only 87 completed questionnaires were used for the data analysis.
Table 6-1 summarizes the response rate status.
Table 6-1: Response rate
Item Total Percentage
Total questionnaires distributed 100 100%
Non response 11 11%
Number of returned questionnaires 89 89%
Less: Unusable responses 2 2%
Total useable responses 87 87%
6.2.2 Respondents’ profile
From the Excel spreadsheet, the data were transferred to the SPSS for further analy-
sis. SPSS version 18 was used to analyse the respondents’ demographic profile and the
items’ characteristics. The frequency and distribution statistics were used for data screening
to detect any mistakes in the data entry and missing data.
Univers
ity of
Mala
ya
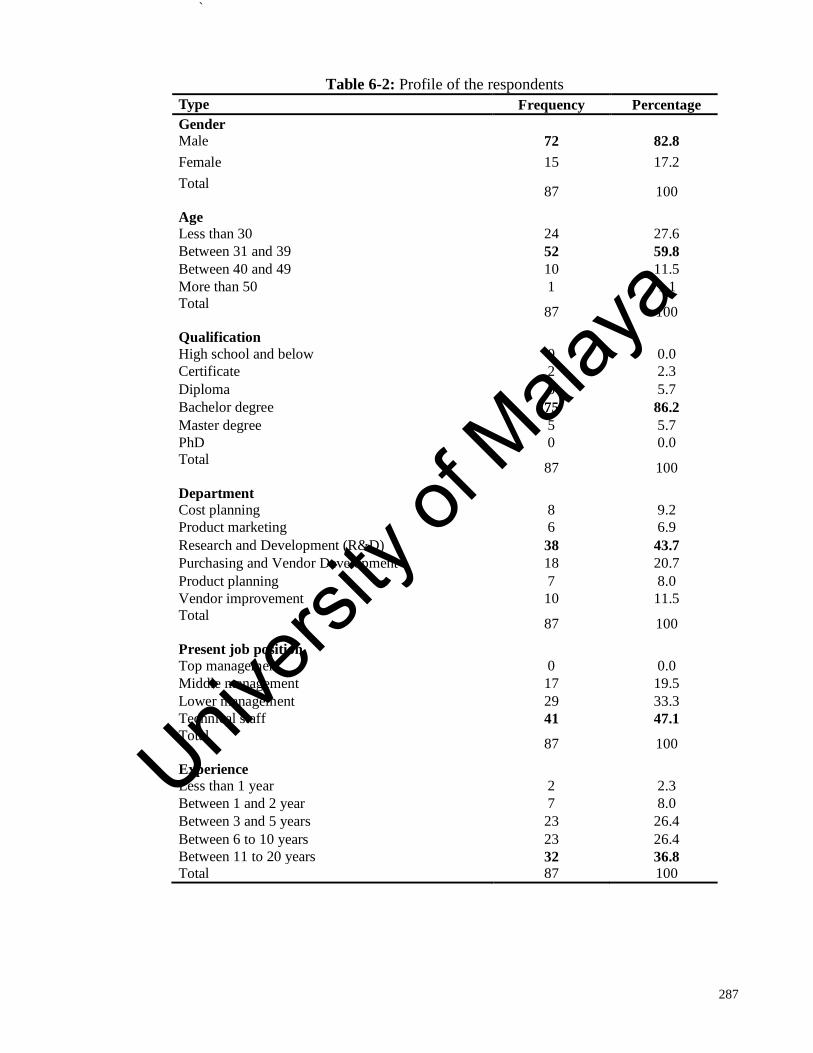
`
287
Table 6-2: Profile of the respondents
Type Frequency Percentage
Gender
Male 72 82.8
Female 15 17.2
Total
87 100
Age
Less than 30 24 27.6
Between 31 and 39 52 59.8
Between 40 and 49 10 11.5
More than 50 1 1.1
Total
87 100
Qualification
High school and below 0 0.0
Certificate 2 2.3
Diploma 5 5.7
Bachelor degree 75 86.2
Master degree 5 5.7
PhD 0 0.0
Total
87 100
Department
Cost planning 8 9.2
Product marketing 6 6.9
Research and Development (R&D) 38 43.7
Purchasing and Vendor Development 18 20.7
Product planning 7 8.0
Vendor improvement 10 11.5
Total
87 100
Present job position
Top management 0 0.0
Middle management 17 19.5
Lower management 29 33.3
Technical staff 41 47.1
Total
87 100
Experience
Less than 1 year 2 2.3
Between 1 and 2 year 7 8.0
Between 3 and 5 years 23 26.4
Between 6 to 10 years 23 26.4
Between 11 to 20 years 32 36.8
Total 87 100
Univers
ity of
Mala
ya
`
288
Table 6-2 represents the demographic characteristics of the respondents. The re-
spondents of the study consisted of 82.8 per cent male and 17.2 per cent female. The gender
was skewed towards male because the majority of the employees of Company A were male,
which is a normal phenomenon for an automotive manufacturing company. From the 87
respondents, the majority of the respondents (59.8 per cent) were in the age range between
31 and 39 years old. Most of the respondents (86.2 per cent) hold a bachelor degree. The
questionnaires were distributed to six departments, with the majority of respondents (43.7
per cent) from the Research and Development Department.
The respondents’ present job is categorized into five categories: Top level manage-
ment (i.e. General Manager, Executive Director and Managing Director), Middle level
management (i.e. Deputy General Manager, Senior Manager and Department Manager),
Lower level management (i.e. Specialist engineer and Assistant Manager), and Technical
staff (i.e. Engineer and Executive). The questionnaire was also distributed to the Top level
management, however no reply was received. The highest position of the respondents was
Deputy General Manager. The majority of the respondents were technical staff, which cov-
ered 47 per cent of the respondents. Almost 90 per cent of the respondents had been work-
ing for more than 3 years.
6.3 Data screening
The 87 responses were codified and transferred to quantitative factors and entered
into the Excel spreadsheet, which served as a codebook. Appendix I shows the coding of
the variables. At this stage, the data were cleaned by substituting the missing responses
with a neutral value, which was 4. This treatment allowed the mean of the variable to re-
main the same and the results of the statistics, such as regression, were not much affected
Univers
ity of
Mala
ya

`
289
(Malhotra, 2007). Table 6-3 shows the aggregate mean and standard deviation score for
each variable. The detailed results are attached in Appendix J.
Table 6-3: Descriptive statistics for each construct.
Variable Number
of items
Max
and
Min
Range
Mean SD
Advanced Manufacturing Technologies 7 1-7 4.85 1.31
Confrontational Strategy 8 1-7 5.07 1.12
Customer Orientation 6 1-7 5.49 1.10
Information-sharing network 7 1-7 4.93 1.78
Lean Manufacturing 7 1-7 5.12 1.17
Supplier Relationship 8 1-7 5.37 1.04
Teamwork 10 2-7 5.12 1.04
Top Management Support and Commitment 6 1-7 4.89 1.15
Training 7 1-7 4.74 1.25
TCM Successful Implementation 13 1-7 5.03 1.10
Scale “1= Strongly Disagree/ Not at all” to “7=Strongly Agree/To a great extent”
In order to ensure a suitable methodology was adopted for the structural model
analysis, a normality test was also conducted. In Appendix J, the result showed that the
measurement items did not have a normal distribution. Normal distribution refers to the dis-
tribution of a set of data which follows a symmetrical bell shaped curve where the mean,
mode and median are identical (Malhotra, 2007). The skewness result indicated skewed dis-
tribution with most of the data values showed a slight negative skew (Malhotra, 2007). The
kurtosis also showed mixed results. Positive value of the kurtosis indicated a relatively
peaked distribution and negative value of the kurtosis showed a relatively flat distribution
(Hair et al., 2006). Malhotra (2007) suggested that for the distribution with highly skewed
and peaked or flat, the statistical procedures that assume normality should be used with
caution. Hence the data did not have a normal distribution, it was necessary to select an
analysis method with higher tolerance of normality like Partial Least Square (PLS) (Chin &
Univers
ity of
Mala
ya
`
290
Newsted, 1999).
6.4 Assessing the TCM enablers
Structural Equation Model (SEM) analysis can handle complicated constructs, indi-
cators and relationships among the dependent and independent variables simultaneously.
This allows the relationship among the constructs to be corrected automatically for meas-
urement error (Chin & Newsted, 1999). Partial Least Squares (PLS) is a soft modelling
technique of SEM, which was originally designed by Herman Wold in the 1970s. PLS is
used to predict the proposed theoretical model by analysing the relationship between the
latent variables. Nevertheless, PLS does not explain the causal relationships between varia-
bles. The basic concept of PLS is to try to extract the latent factors or measurement items
that explain most of the variation in the response to predict the model.
There are several reasons why PLS is ideal for this research data analysis. First, PLS
is appropriate for exploring a large number of variables to find a set of variables that can
predict the outcome variables. Second, PLS can be used to estimate the path model with a
small sample size. Third, good characteristic measurement, i.e. strict requirement of data
distribution, is not critical requirement for PLS to produce its result (Chin & Newsted
1999). Because of the above reasons, this research used PLS (Smart PLS 2.0) to perform
the data analysis.
The next sub-sections are divided into three categories. The first sub-section ex-
plains the construct type used in the measurement model. Then, the second sub-section ex-
plains the measurement model result in terms of reliability and validity of the reflective
Univers
ity of
Mala
ya
`
291
constructs. Finally, the last sub-section explains the structural model result in terms of the
relationship between the exogenous and endogenous constructs.
6.4.1. Construct type
In this research model, all the constructs were measured by multiple indicators or
items. Before starting the PLS analysis, the constructs need to be classified as formative or
reflective. Jarvis et al. (2003) outline four criteria to distinguish whether the construct is
formative or reflective. First, the direction of causality between the construct and indicator.
For a reflective construct, the direction of causality flows from the construct to the indica-
tors, and it flows from the indicators to the construct for the formative construct. Second,
the interchangeability of the indicators. For a reflective construct, the indicators should be
interchangeable, but they should not be interchangeable for the formative construct. Third,
the covariation among indicators. Covariation refers to the condition in which the change in
one indicator is associated with changes in other indicators. For a reflective construct, the
indicators must covary with each other; however, this is not necessary for the formative
construct. Forth, the antecedents or consequences of all the indicators. For the reflective
construct, the indicators should have the same antecedents or consequences because the un-
derlying construct is the same. However for the formative construct, the indicators should
not have the same antecedents and consequences because it represents a different aspect of
the construct (Jarvis, Mackenzie, & Podsakoff, 2003). Based on these criteria, all the con-
structs were conceptualized as reflective. The types of construct are summarized in Table 6-
4.
Univers
ity of
Mala
ya
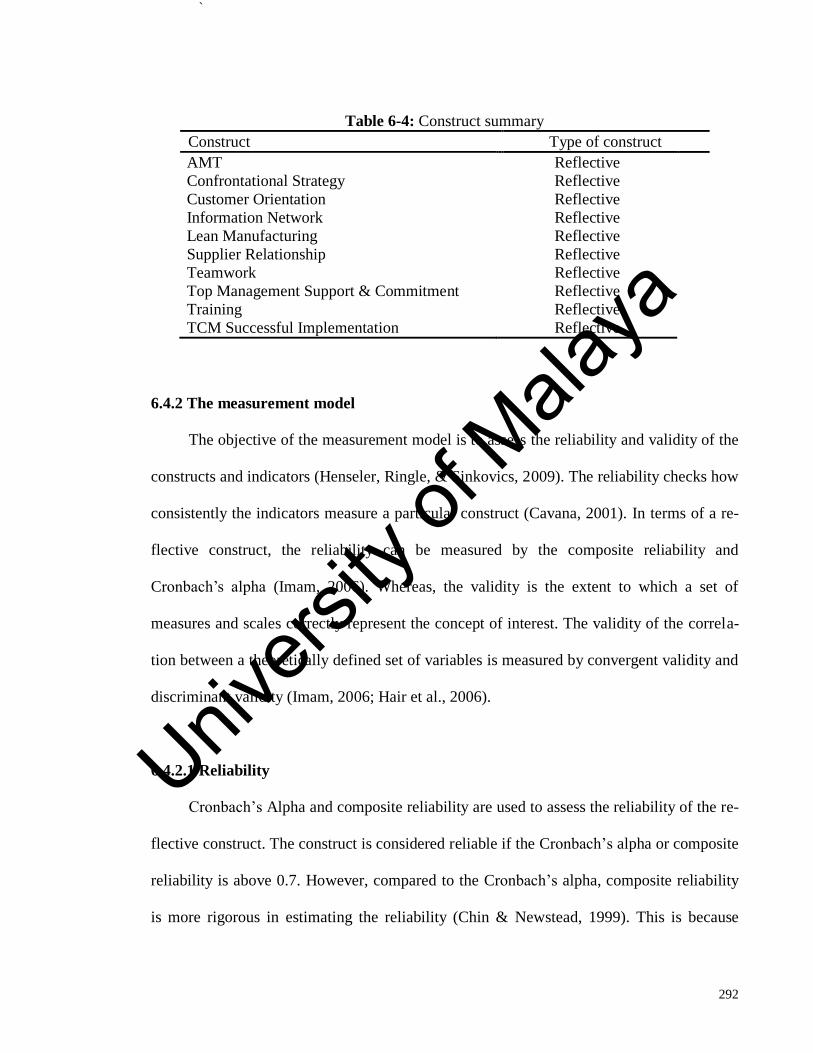
`
292
Table 6-4: Construct summary
Construct Type of construct
AMT Reflective
Confrontational Strategy Reflective
Customer Orientation Reflective
Information Network Reflective
Lean Manufacturing Reflective
Supplier Relationship Reflective
Teamwork Reflective
Top Management Support & Commitment Reflective
Training Reflective
TCM Successful Implementation Reflective
6.4.2 The measurement model
The objective of the measurement model is to assess the reliability and validity of the
constructs and indicators (Henseler, Ringle, & Sinkovics, 2009). The reliability checks how
consistently the indicators measure a particular construct (Cavana, 2001). In terms of a re-
flective construct, the reliability can be measured by the composite reliability and
Cronbach’s alpha (Imam, 2006). Whereas, the validity is the extent to which a set of
measures and scales correctly represent the concept of interest. The validity of the correla-
tion between a theoretically defined set of variables is measured by convergent validity and
discriminant validity (Imam, 2006; Hair et al., 2006).
6.4.2.1 Reliability
Cronbach’s Alpha and composite reliability are used to assess the reliability of the re-
flective construct. The construct is considered reliable if the Cronbach’s alpha or composite
reliability is above 0.7. However, compared to the Cronbach’s alpha, composite reliability
is more rigorous in estimating the reliability (Chin & Newstead, 1999). This is because
Univers
ity of
Mala
ya

`
293
composite reliability considers the different indicator loading, which is consistent with the
PLS algorithm (Henseler, Ringle, & Sinkovics, 2009). As shown in Table 6-5, both
Cronbach’s alpha and composite reliability are more than 0.8 with the composite reliability
higher than the Cronbach’s alpha. Accordingly, both results showed that the internal con-
sistency of indicators measuring each construct is high. Therefore, the constructs had good
reliability.
Table 6-5: Reliability assessment (Cronbach’s Alpha and Composite Reliability Index,
n=87)
Construct Cronbach’s
Alpha
Composite
Reliability
AMT 0.91 0.93
CONFRONTATIONAL STRATEGY 0.86 0.89
CUSTOMER ORIENTATION 0.95 0.96
INFORMATION NETWORK 0.87 0.89
LEAN MANUFACTURING 0.89 0.91
TCM SUCCESSFUL IMPLEMENTATION 0.92 0.93
SUPPLIER RELATIONSHIP 0.83 0.87
TEAMWORK 0.94 0.95
TOP MGMT SUPPORT & COMMITMENT 0.89 0.92
TRAINING 0.88 0.91
6.4.2.2 Validity
a) Convergent validity
Convergent validity indicates the extent to which the blocks of indicators strongly
converge in their representation of the underlying construct they were created to measure
(Chin, 2010). The convergent validity of the measurement model can be seen from the cor-
relation between the items and its construct. High convergent validity has the highest factor
loading. The ideal factor loading should be 0.7 or higher. However, 0.5 or higher is still ac-
ceptable (Hair et al., 2006). Table 6-6 shows the outer model loadings for the theoretical
Univers
ity of
Mala
ya
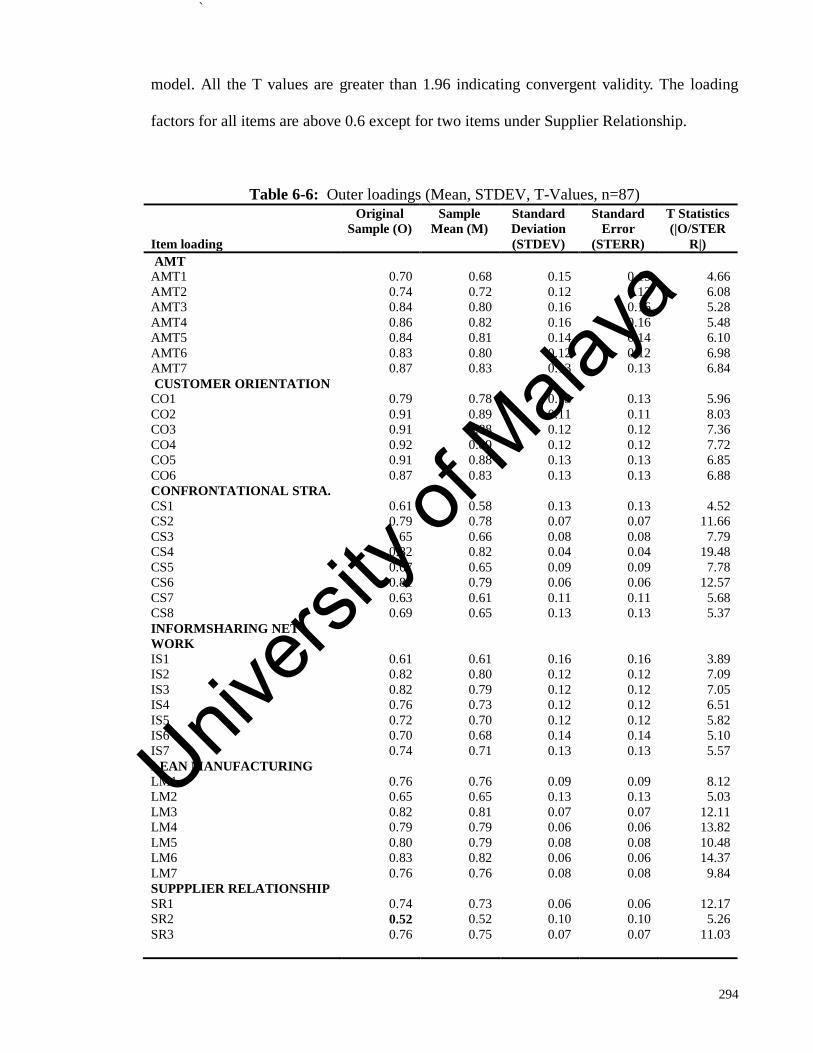
`
294
model. All the T values are greater than 1.96 indicating convergent validity. The loading
factors for all items are above 0.6 except for two items under Supplier Relationship.
Table 6-6: Outer loadings (Mean, STDEV, T-Values, n=87)
Item loading
Original
Sample (O)
Sample
Mean (M)
Standard
Deviation
(STDEV)
Standard
Error
(STERR)
T Statistics
(|O/STER
R|)
AMT
AMT1 0.70 0.68 0.15 0.15 4.66
AMT2 0.74 0.72 0.12 0.12 6.08
AMT3 0.84 0.80 0.16 0.16 5.28
AMT4 0.86 0.82 0.16 0.16 5.48
AMT5 0.84 0.81 0.14 0.14 6.10
AMT6 0.83 0.80 0.12 0.12 6.98
AMT7 0.87 0.83 0.13 0.13 6.84
CUSTOMER ORIENTATION
CO1 0.79 0.78 0.13 0.13 5.96
CO2 0.91 0.89 0.11 0.11 8.03
CO3 0.91 0.88 0.12 0.12 7.36
CO4 0.92 0.89 0.12 0.12 7.72
CO5 0.91 0.88 0.13 0.13 6.85
CO6 0.87 0.83 0.13 0.13 6.88
CONFRONTATIONAL STRA.
CS1 0.61 0.58 0.13 0.13 4.52
CS2 0.79 0.78 0.07 0.07 11.66
CS3 0.65 0.66 0.08 0.08 7.79
CS4 0.82 0.82 0.04 0.04 19.48
CS5 0.67 0.65 0.09 0.09 7.78
CS6 0.81 0.79 0.06 0.06 12.57
CS7 0.63 0.61 0.11 0.11 5.68
CS8 0.69 0.65 0.13 0.13 5.37
INFORMSHARING NET-
WORK
IS1 0.61 0.61 0.16 0.16 3.89
IS2 0.82 0.80 0.12 0.12 7.09
IS3 0.82 0.79 0.12 0.12 7.05
IS4 0.76 0.73 0.12 0.12 6.51
IS5 0.72 0.70 0.12 0.12 5.82
IS6 0.70 0.68 0.14 0.14 5.10
IS7 0.74 0.71 0.13 0.13 5.57
LEAN MANUFACTURING
LM1 0.76 0.76 0.09 0.09 8.12
LM2 0.65 0.65 0.13 0.13 5.03
LM3 0.82 0.81 0.07 0.07 12.11
LM4 0.79 0.79 0.06 0.06 13.82
LM5 0.80 0.79 0.08 0.08 10.48
LM6 0.83 0.82 0.06 0.06 14.37
LM7 0.76 0.76 0.08 0.08 9.84
SUPPPLIER RELATIONSHIP
SR1 0.74 0.73 0.06 0.06 12.17
SR2 0.52 0.52 0.10 0.10 5.26
SR3 0.76 0.75 0.07 0.07 11.03
Univers
ity of
Mala
ya
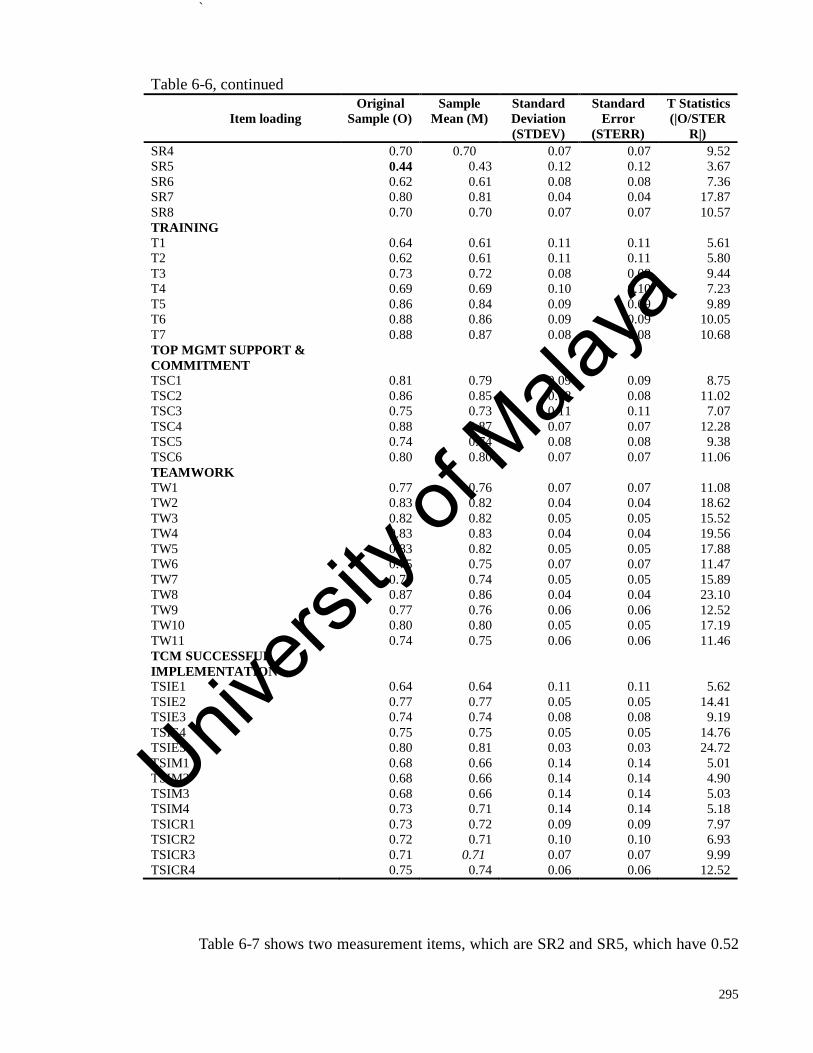
`
295
Table 6-6, continued
Item loading
Original
Sample (O)
Sample
Mean (M)
Standard
Deviation
(STDEV)
Standard
Error
(STERR)
T Statistics
(|O/STER
R|)
SR4 0.70 0.70 0.07 0.07 9.52
SR5 0.44 0.43 0.12 0.12 3.67
SR6 0.62 0.61 0.08 0.08 7.36
SR7 0.80 0.81 0.04 0.04 17.87
SR8 0.70 0.70 0.07 0.07 10.57
TRAINING
T1 0.64 0.61 0.11 0.11 5.61
T2 0.62 0.61 0.11 0.11 5.80
T3 0.73 0.72 0.08 0.08 9.44
T4 0.69 0.69 0.10 0.10 7.23
T5 0.86 0.84 0.09 0.09 9.89
T6 0.88 0.86 0.09 0.09 10.05
T7 0.88 0.87 0.08 0.08 10.68
TOP MGMT SUPPORT &
COMMITMENT
TSC1 0.81 0.79 0.09 0.09 8.75
TSC2 0.86 0.85 0.08 0.08 11.02
TSC3 0.75 0.73 0.11 0.11 7.07
TSC4 0.88 0.87 0.07 0.07 12.28
TSC5 0.74 0.74 0.08 0.08 9.38
TSC6 0.80 0.80 0.07 0.07 11.06
TEAMWORK
TW1 0.77 0.76 0.07 0.07 11.08
TW2 0.83 0.82 0.04 0.04 18.62
TW3 0.82 0.82 0.05 0.05 15.52
TW4 0.83 0.83 0.04 0.04 19.56
TW5 0.83 0.82 0.05 0.05 17.88
TW6 0.75 0.75 0.07 0.07 11.47
TW7 0.75 0.74 0.05 0.05 15.89
TW8 0.87 0.86 0.04 0.04 23.10
TW9 0.77 0.76 0.06 0.06 12.52
TW10 0.80 0.80 0.05 0.05 17.19
TW11 0.74 0.75 0.06 0.06 11.46
TCM SUCCESSFUL
IMPLEMENTATION
TSIE1 0.64 0.64 0.11 0.11 5.62
TSIE2 0.77 0.77 0.05 0.05 14.41
TSIE3 0.74 0.74 0.08 0.08 9.19
TSIE4 0.75 0.75 0.05 0.05 14.76
TSIE5 0.80 0.81 0.03 0.03 24.72
TSIM1 0.68 0.66 0.14 0.14 5.01
TSIM2 0.68 0.66 0.14 0.14 4.90
TSIM3 0.68 0.66 0.14 0.14 5.03
TSIM4 0.73 0.71 0.14 0.14 5.18
TSICR1 0.73 0.72 0.09 0.09 7.97
TSICR2 0.72 0.71 0.10 0.10 6.93
TSICR3 0.71 0.71 0.07 0.07 9.99
TSICR4 0.75 0.74 0.06 0.06 12.52
Table 6-7 shows two measurement items, which are SR2 and SR5, which have 0.52
Univers
ity of
Mala
ya
`
296
and 0.44 factor loadings, respectively. Chin (2010) suggests that blocks of indicators have
more convergent validity if the lowest loading is higher and the range of loadings is nar-
rower. In order to increase the convergent validity of the supplier relationship, the SR2 and
SR5 measurements were removed. Then, the re-estimation was made. All the remaining
items were significantly loaded with a loading factor above 0.6.
Table 6-7: Measurement items with weak factor loading
Variables Deleted items Indicated factor
loading
Supplier Relationship SR2- Supplier Relationship 0.52
SR5- Supplier Relationship 5 0.44
Convergent validity can also be validated using the Average Variance Extracted
(AVE) (Henseler, Ringle, & Sinkovics, 2009). The AVE is the average squared of the factor
loading. It is a summary indicator of the convergent validity among a set of items that rep-
resent the construct. An AVE of 0.5 indicates adequate convergent validity (Hair et al,
2006). This means that a construct is able to explain half of the variance of its indicators on
average (Henseler, Ringle, & Sinkovics, 2009). Table 6-8 shows that all the constructs have
an AVE above 0.5. Thus, all the constructs have adequate convergent validity.
Univers
ity of
Mala
ya
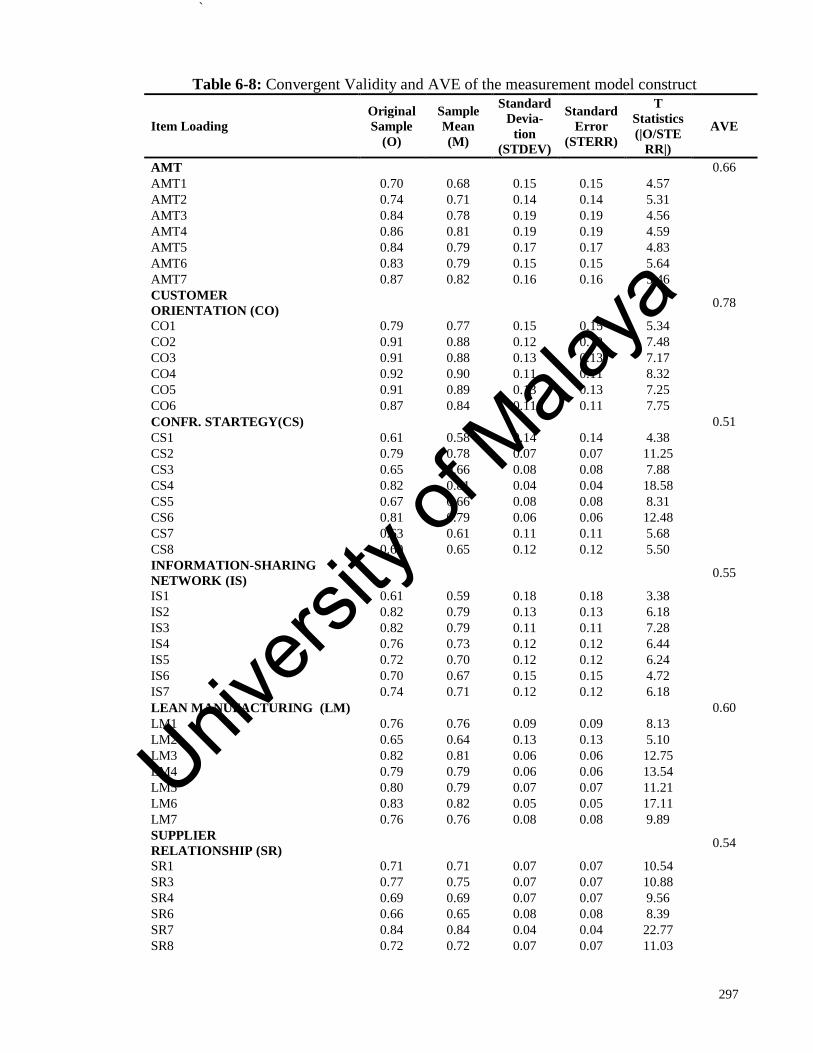
`
297
Table 6-8: Convergent Validity and AVE of the measurement model construct
Item Loading
Original
Sample
(O)
Sample
Mean
(M)
Standard
Devia-
tion
(STDEV)
Standard
Error
(STERR)
T
Statistics
(|O/STE
RR|)
AVE
AMT 0.66
AMT1 0.70 0.68 0.15 0.15 4.57
AMT2 0.74 0.71 0.14 0.14 5.31
AMT3 0.84 0.78 0.19 0.19 4.56
AMT4 0.86 0.81 0.19 0.19 4.59
AMT5 0.84 0.79 0.17 0.17 4.83
AMT6 0.83 0.79 0.15 0.15 5.64
AMT7 0.87 0.82 0.16 0.16 5.46
CUSTOMER
ORIENTATION (CO) 0.78
CO1 0.79 0.77 0.15 0.15 5.34
CO2 0.91 0.88 0.12 0.12 7.48
CO3 0.91 0.88 0.13 0.13 7.17
CO4 0.92 0.90 0.11 0.11 8.32
CO5 0.91 0.89 0.13 0.13 7.25
CO6 0.87 0.84 0.11 0.11 7.75
CONFR. STARTEGY(CS) 0.51
CS1 0.61 0.58 0.14 0.14 4.38
CS2 0.79 0.78 0.07 0.07 11.25
CS3 0.65 0.66 0.08 0.08 7.88
CS4 0.82 0.81 0.04 0.04 18.58
CS5 0.67 0.66 0.08 0.08 8.31
CS6 0.81 0.79 0.06 0.06 12.48
CS7 0.63 0.61 0.11 0.11 5.68
CS8 0.69 0.65 0.12 0.12 5.50
INFORMATION-SHARING
NETWORK (IS) 0.55
IS1 0.61 0.59 0.18 0.18 3.38
IS2 0.82 0.79 0.13 0.13 6.18
IS3 0.82 0.79 0.11 0.11 7.28
IS4 0.76 0.73 0.12 0.12 6.44
IS5 0.72 0.70 0.12 0.12 6.24
IS6 0.70 0.67 0.15 0.15 4.72
IS7 0.74 0.71 0.12 0.12 6.18
LEAN MANUFACTURING (LM) 0.60
LM1 0.76 0.76 0.09 0.09 8.13
LM2 0.65 0.64 0.13 0.13 5.10
LM3 0.82 0.81 0.06 0.06 12.75
LM4 0.79 0.79 0.06 0.06 13.54
LM5 0.80 0.79 0.07 0.07 11.21
LM6 0.83 0.82 0.05 0.05 17.11
LM7 0.76 0.76 0.08 0.08 9.89
SUPPLIER
RELATIONSHIP (SR) 0.54
SR1 0.71 0.71 0.07 0.07 10.54
SR3 0.77 0.75 0.07 0.07 10.88
SR4 0.69 0.69 0.07 0.07 9.56
SR6 0.66 0.65 0.08 0.08 8.39
SR7 0.84 0.84 0.04 0.04 22.77
SR8 0.72 0.72 0.07 0.07 11.03
Univers
ity of
Mala
ya
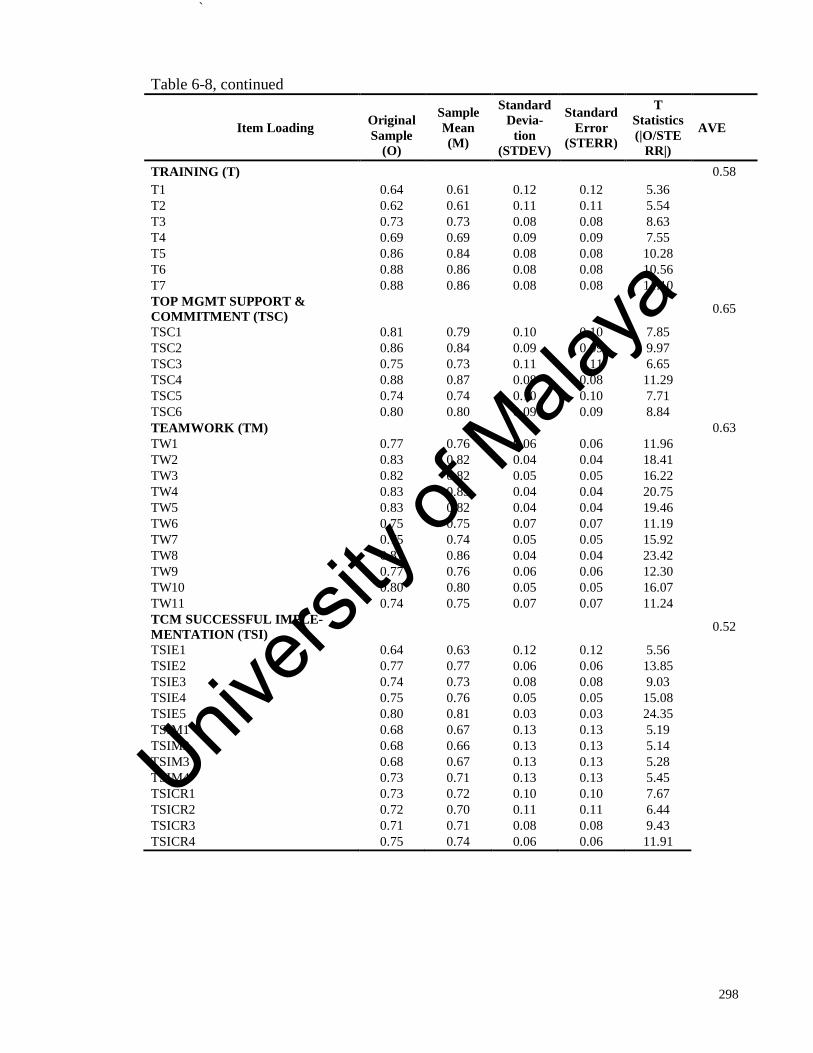
`
298
Table 6-8, continued
Item Loading
Original
Sample
(O)
Sample
Mean
(M)
Standard
Devia-
tion
(STDEV)
Standard
Error
(STERR)
T
Statistics
(|O/STE
RR|)
AVE
TRAINING (T) 0.58
T1 0.64 0.61 0.12 0.12 5.36
T2 0.62 0.61 0.11 0.11 5.54
T3 0.73 0.73 0.08 0.08 8.63
T4 0.69 0.69 0.09 0.09 7.55
T5 0.86 0.84 0.08 0.08 10.28
T6 0.88 0.86 0.08 0.08 10.56
T7 0.88 0.86 0.08 0.08 11.10
TOP MGMT SUPPORT &
COMMITMENT (TSC) 0.65
TSC1 0.81 0.79 0.10 0.10 7.85
TSC2 0.86 0.84 0.09 0.09 9.97
TSC3 0.75 0.73 0.11 0.11 6.65
TSC4 0.88 0.87 0.08 0.08 11.29
TSC5 0.74 0.74 0.10 0.10 7.71
TSC6 0.80 0.80 0.09 0.09 8.84
TEAMWORK (TM) 0.63
TW1 0.77 0.76 0.06 0.06 11.96
TW2 0.83 0.82 0.04 0.04 18.41
TW3 0.82 0.82 0.05 0.05 16.22
TW4 0.83 0.83 0.04 0.04 20.75
TW5 0.83 0.82 0.04 0.04 19.46
TW6 0.75 0.75 0.07 0.07 11.19
TW7 0.75 0.74 0.05 0.05 15.92
TW8 0.87 0.86 0.04 0.04 23.42
TW9 0.77 0.76 0.06 0.06 12.30
TW10 0.80 0.80 0.05 0.05 16.07
TW11 0.74 0.75 0.07 0.07 11.24
TCM SUCCESSFUL IMPLE-
MENTATION (TSI) 0.52
TSIE1 0.64 0.63 0.12 0.12 5.56
TSIE2 0.77 0.77 0.06 0.06 13.85
TSIE3 0.74 0.73 0.08 0.08 9.03
TSIE4 0.75 0.76 0.05 0.05 15.08
TSIE5 0.80 0.81 0.03 0.03 24.35
TSIM1 0.68 0.67 0.13 0.13 5.19
TSIM2 0.68 0.66 0.13 0.13 5.14
TSIM3 0.68 0.67 0.13 0.13 5.28
TSIM4 0.73 0.71 0.13 0.13 5.45
TSICR1 0.73 0.72 0.10 0.10 7.67
TSICR2 0.72 0.70 0.11 0.11 6.44
TSICR3 0.71 0.71 0.08 0.08 9.43
TSICR4 0.75 0.74 0.06 0.06 11.91
Univers
ity of
Mala
ya
`
299
b) Discriminant validity
Discriminant validity is the degree to which a construct is distinct from other con-
structs. High discriminant validity proves that the construct is unique and captures some
phenomena that are not captured by other constructs (Hair et al, 2006). The discriminant
validity can be assessed at the indicator level by cross loadings and at the construct level
using the Fornell-Larker criterion (Henseler, Ringle, & Sinkovics, 2009).
The discriminant level at the indicator level is established if each indicator has
greater loads related to its construct than the cross loading. Table 6-9 shows that each indi-
cator loads the highest on its construct column rather than the column of other constructs.
This shows that each indicator loads more highly on its construct than other constructs and
the construct predicts the indicators in its block better than the indicators in other blocks
(Chin, 2010; Iman, 2006; Henseler, Ringle, & Sinkovics, 2009).
Univers
ity of
Mala
ya
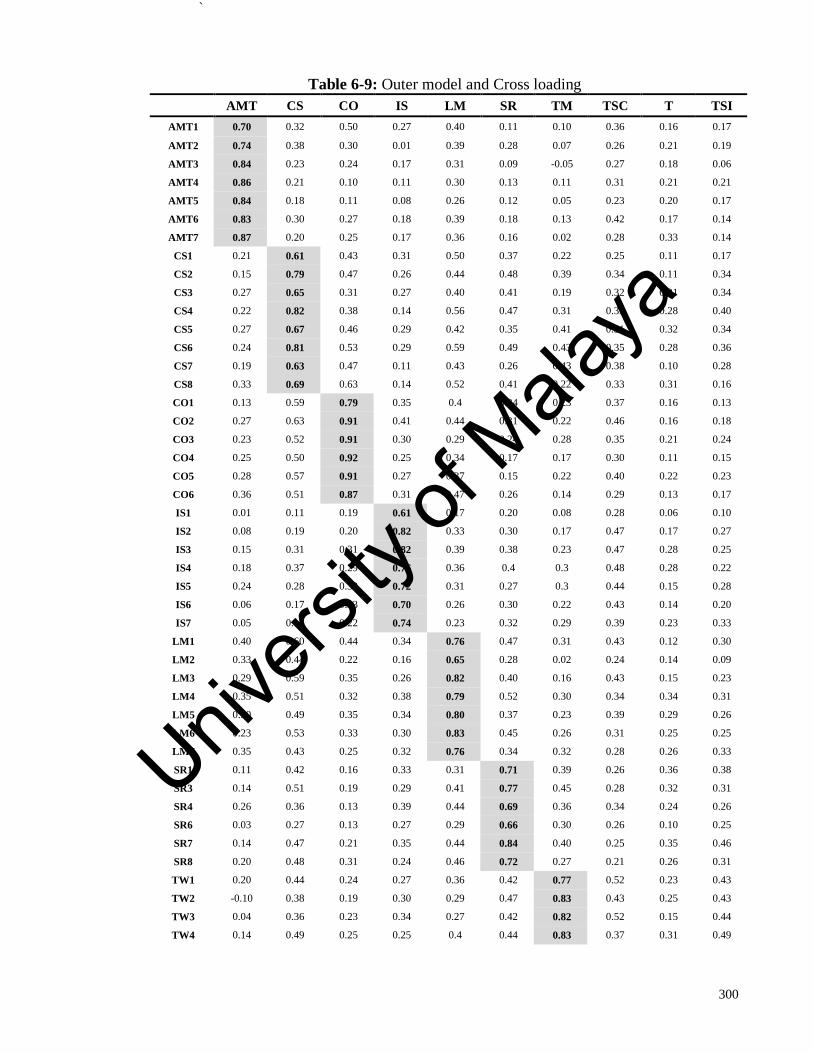
`
300
Table 6-9: Outer model and Cross loading AMT CS CO IS LM SR TM TSC T TSI
AMT1 0.70 0.32 0.50 0.27 0.40 0.11 0.10 0.36 0.16 0.17
AMT2 0.74 0.38 0.30 0.01 0.39 0.28 0.07 0.26 0.21 0.19
AMT3 0.84 0.23 0.24 0.17 0.31 0.09 -0.05 0.27 0.18 0.06
AMT4 0.86 0.21 0.10 0.11 0.30 0.13 0.11 0.31 0.21 0.21
AMT5 0.84 0.18 0.11 0.08 0.26 0.12 0.05 0.23 0.20 0.17
AMT6 0.83 0.30 0.27 0.18 0.39 0.18 0.13 0.42 0.17 0.14
AMT7 0.87 0.20 0.25 0.17 0.36 0.16 0.02 0.28 0.33 0.14
CS1 0.21 0.61 0.43 0.31 0.50 0.37 0.22 0.25 0.11 0.17
CS2 0.15 0.79 0.47 0.26 0.44 0.48 0.39 0.34 0.11 0.34
CS3 0.27 0.65 0.31 0.27 0.40 0.41 0.19 0.32 0.21 0.34
CS4 0.22 0.82 0.38 0.14 0.56 0.47 0.31 0.39 0.28 0.40
CS5 0.27 0.67 0.46 0.29 0.42 0.35 0.41 0.31 0.32 0.34
CS6 0.24 0.81 0.53 0.29 0.59 0.49 0.43 0.35 0.28 0.36
CS7 0.19 0.63 0.47 0.11 0.43 0.26 0.43 0.38 0.10 0.28
CS8 0.33 0.69 0.63 0.14 0.52 0.41 0.22 0.33 0.31 0.16
CO1 0.13 0.59 0.79 0.35 0.4 0.34 0.23 0.37 0.16 0.13
CO2 0.27 0.63 0.91 0.41 0.44 0.31 0.22 0.46 0.16 0.18
CO3 0.23 0.52 0.91 0.30 0.29 0.24 0.28 0.35 0.21 0.24
CO4 0.25 0.50 0.92 0.25 0.34 0.17 0.17 0.30 0.11 0.15
CO5 0.28 0.57 0.91 0.27 0.37 0.15 0.22 0.40 0.22 0.23
CO6 0.36 0.51 0.87 0.31 0.47 0.26 0.14 0.29 0.13 0.17
IS1 0.01 0.11 0.19 0.61 0.17 0.20 0.08 0.28 0.06 0.10
IS2 0.08 0.19 0.20 0.82 0.33 0.30 0.17 0.47 0.17 0.27
IS3 0.15 0.31 0.31 0.82 0.39 0.38 0.23 0.47 0.28 0.25
IS4 0.18 0.37 0.29 0.76 0.36 0.4 0.3 0.48 0.28 0.22
IS5 0.24 0.28 0.33 0.72 0.31 0.27 0.3 0.44 0.15 0.28
IS6 0.06 0.17 0.23 0.70 0.26 0.30 0.22 0.43 0.14 0.20
IS7 0.05 0.18 0.22 0.74 0.23 0.32 0.29 0.39 0.23 0.33
LM1 0.40 0.60 0.44 0.34 0.76 0.47 0.31 0.43 0.12 0.30
LM2 0.33 0.44 0.22 0.16 0.65 0.28 0.02 0.24 0.14 0.09
LM3 0.29 0.59 0.35 0.26 0.82 0.40 0.16 0.43 0.15 0.23
LM4 0.35 0.51 0.32 0.38 0.79 0.52 0.30 0.34 0.34 0.31
LM5 0.30 0.49 0.35 0.34 0.80 0.37 0.23 0.39 0.29 0.26
LM6 0.23 0.53 0.33 0.30 0.83 0.45 0.26 0.31 0.25 0.25
LM7 0.35 0.43 0.25 0.32 0.76 0.34 0.32 0.28 0.26 0.33
SR1 0.11 0.42 0.16 0.33 0.31 0.71 0.39 0.26 0.36 0.38
SR3 0.14 0.51 0.19 0.29 0.41 0.77 0.45 0.28 0.32 0.31
SR4 0.26 0.36 0.13 0.39 0.44 0.69 0.36 0.34 0.24 0.26
SR6 0.03 0.27 0.13 0.27 0.29 0.66 0.30 0.26 0.10 0.25
SR7 0.14 0.47 0.21 0.35 0.44 0.84 0.40 0.25 0.35 0.46
SR8 0.20 0.48 0.31 0.24 0.46 0.72 0.27 0.21 0.26 0.31
TW1 0.20 0.44 0.24 0.27 0.36 0.42 0.77 0.52 0.23 0.43
TW2 -0.10 0.38 0.19 0.30 0.29 0.47 0.83 0.43 0.25 0.43
TW3 0.04 0.36 0.23 0.34 0.27 0.42 0.82 0.52 0.15 0.44
TW4 0.14 0.49 0.25 0.25 0.4 0.44 0.83 0.37 0.31 0.49
Univers
ity of
Mala
ya
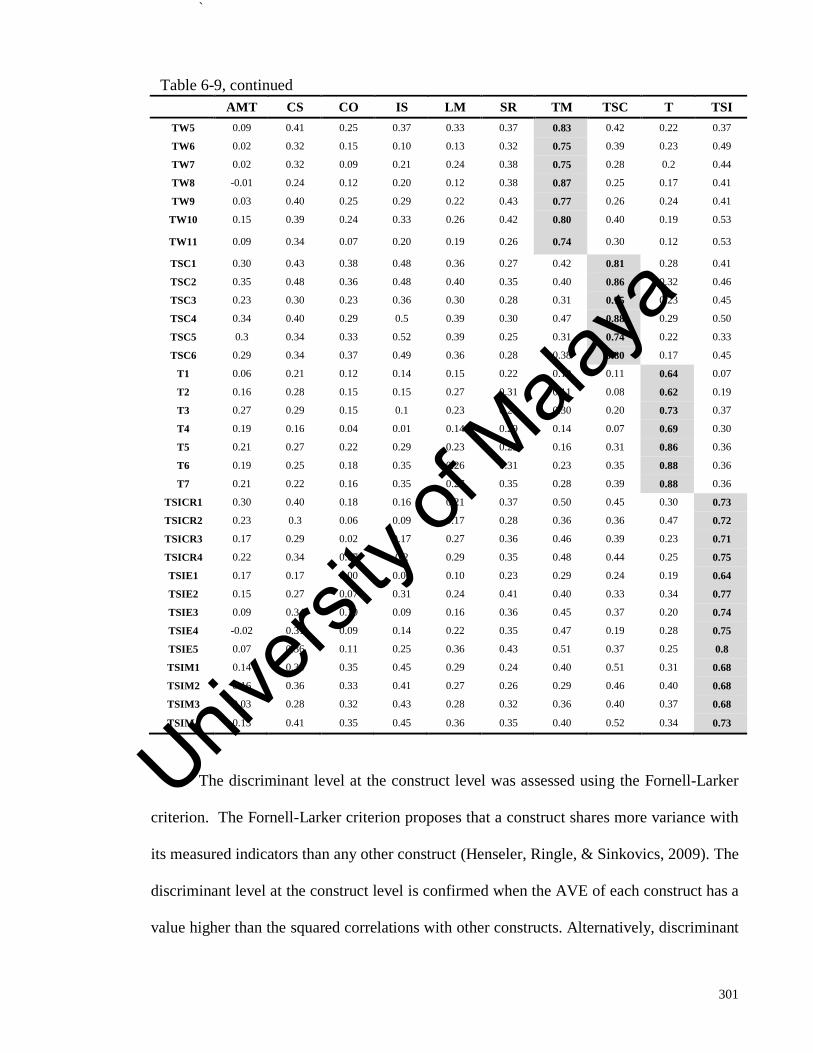
`
301
Table 6-9, continued
AMT CS CO IS LM SR TM TSC T TSI
TW5 0.09 0.41 0.25 0.37 0.33 0.37 0.83 0.42 0.22 0.37
TW6 0.02 0.32 0.15 0.10 0.13 0.32 0.75 0.39 0.23 0.49
TW7 0.02 0.32 0.09 0.21 0.24 0.38 0.75 0.28 0.2 0.44
TW8 -0.01 0.24 0.12 0.20 0.12 0.38 0.87 0.25 0.17 0.41
TW9 0.03 0.40 0.25 0.29 0.22 0.43 0.77 0.26 0.24 0.41
TW10 0.15 0.39 0.24 0.33 0.26 0.42 0.80 0.40 0.19 0.53
TW11 0.09 0.34 0.07 0.20 0.19 0.26 0.74 0.30 0.12 0.53
TSC1 0.30 0.43 0.38 0.48 0.36 0.27 0.42 0.81 0.28 0.41
TSC2 0.35 0.48 0.36 0.48 0.40 0.35 0.40 0.86 0.32 0.46
TSC3 0.23 0.30 0.23 0.36 0.30 0.28 0.31 0.75 0.23 0.45
TSC4 0.34 0.40 0.29 0.5 0.39 0.30 0.47 0.88 0.29 0.50
TSC5 0.3 0.34 0.33 0.52 0.39 0.25 0.31 0.74 0.22 0.33
TSC6 0.29 0.34 0.37 0.49 0.36 0.28 0.38 0.80 0.17 0.45
T1 0.06 0.21 0.12 0.14 0.15 0.22 0.10 0.11 0.64 0.07
T2 0.16 0.28 0.15 0.15 0.27 0.31 0.11 0.08 0.62 0.19
T3 0.27 0.29 0.15 0.1 0.23 0.28 0.30 0.20 0.73 0.37
T4 0.19 0.16 0.04 0.01 0.14 0.29 0.14 0.07 0.69 0.30
T5 0.21 0.27 0.22 0.29 0.23 0.29 0.16 0.31 0.86 0.36
T6 0.19 0.25 0.18 0.35 0.26 0.31 0.23 0.35 0.88 0.36
T7 0.21 0.22 0.16 0.35 0.27 0.35 0.28 0.39 0.88 0.36
TSICR1 0.30 0.40 0.18 0.16 0.21 0.37 0.50 0.45 0.30 0.73
TSICR2 0.23 0.3 0.06 0.09 0.17 0.28 0.36 0.36 0.47 0.72
TSICR3 0.17 0.29 0.02 0.17 0.27 0.36 0.46 0.39 0.23 0.71
TSICR4 0.22 0.34 0.07 0.2 0.29 0.35 0.48 0.44 0.25 0.75
TSIE1 0.17 0.17 0.00 0.06 0.10 0.23 0.29 0.24 0.19 0.64
TSIE2 0.15 0.27 0.07 0.31 0.24 0.41 0.40 0.33 0.34 0.77
TSIE3 0.09 0.34 0.10 0.09 0.16 0.36 0.45 0.37 0.20 0.74
TSIE4 -0.02 0.31 0.09 0.14 0.22 0.35 0.47 0.19 0.28 0.75
TSIE5 0.07 0.36 0.11 0.25 0.36 0.43 0.51 0.37 0.25 0.8
TSIM1 0.14 0.34 0.35 0.45 0.29 0.24 0.40 0.51 0.31 0.68
TSIM2 0.16 0.36 0.33 0.41 0.27 0.26 0.29 0.46 0.40 0.68
TSIM3 0.03 0.28 0.32 0.43 0.28 0.32 0.36 0.40 0.37 0.68
TSIM4 0.13 0.41 0.35 0.45 0.36 0.35 0.40 0.52 0.34 0.73
The discriminant level at the construct level was assessed using the Fornell-Larker
criterion. The Fornell-Larker criterion proposes that a construct shares more variance with
its measured indicators than any other construct (Henseler, Ringle, & Sinkovics, 2009). The
discriminant level at the construct level is confirmed when the AVE of each construct has a
value higher than the squared correlations with other constructs. Alternatively, discriminant
Univers
ity of
Mala
ya

`
302
validity can be confirmed if the squared root of the AVE of each construct is higher than its
inter-construct correlation (Chin, 2010; Imam, 2006). Table 6-10 shows that all the square
roots of the AVE are larger than the inter-construct correlation. This indicates that the con-
struct explains its item measures better than it explains another construct. Thus, the discri-
minant validity of the measurement model was confirmed.
Univers
ity of
Mala
ya
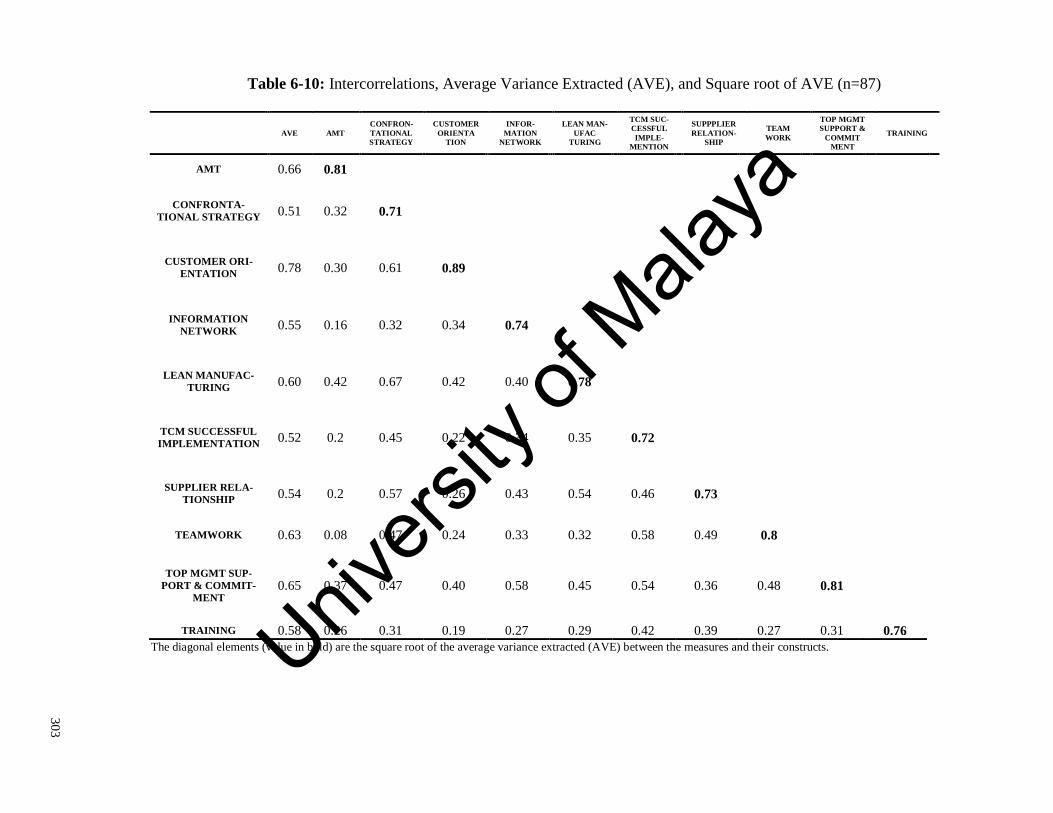
303
Table 6-10: Intercorrelations, Average Variance Extracted (AVE), and Square root of AVE (n=87)
AVE AMT
CONFRON-
TATIONAL
STRATEGY
CUSTOMER
ORIENTA
TION
INFOR-
MATION
NETWORK
LEAN MAN-
UFAC
TURING
TCM SUC-
CESSFUL
IMPLE-
MENTION
SUPPPLIER
RELATION-
SHIP
TEAM
WORK
TOP MGMT
SUPPORT &
COMMIT
MENT
TRAINING
AMT 0.66 0.81
CONFRONTA-
TIONAL STRATEGY 0.51 0.32 0.71
CUSTOMER ORI-
ENTATION 0.78 0.30 0.61 0.89
INFORMATION
NETWORK 0.55 0.16 0.32 0.34 0.74
LEAN MANUFAC-
TURING 0.60 0.42 0.67 0.42 0.40 0.78
TCM SUCCESSFUL
IMPLEMENTATION 0.52 0.2 0.45 0.22 0.34 0.35 0.72
SUPPLIER RELA-
TIONSHIP 0.54 0.2 0.57 0.26 0.43 0.54 0.46 0.73
TEAMWORK 0.63 0.08 0.47 0.24 0.33 0.32 0.58 0.49 0.8
TOP MGMT SUP-
PORT & COMMIT-
MENT 0.65 0.37 0.47 0.40 0.58 0.45 0.54 0.36 0.48 0.81
TRAINING 0.58 0.26 0.31 0.19 0.27 0.29 0.42 0.39 0.27 0.31 0.76
The diagonal elements (value in bold) are the square root of the average variance extracted (AVE) between the measures and their constructs.
Univers
ity of
Mala
ya
304
6.4.3 The structural model
Based on the above test, it was concluded that all the scales were reliable and valid
for the evaluation of the structural model estimates. Next, the structural model testing was
conducted to test the theoretical model. For the analysis, bootstrapping was conducted to
provide the confidence interval for all estimated parameters. The bootstrapping treats the
observed sample as if it represents the population by creating a large pre-specified number
of bootstrap samples (Henseler et al., 2009). As suggested by Henseler et al. (2009), the
number of cases for running the bootstrap analysis should be equal to the original sample
but the number of resamples should be large to generate a stable estimate. Imam (2006)
suggests 500 samples as a minimum sample for the bootstrapping. In this research, 1000
samples were used to evaluate the significance of the path coefficients.
The objective of the structural model testing was to visualize the relationship be-
tween the nine exogenous and endogenous variables by using the path diagram (Henseler,
Ringle, & Sinkovics, 2009). The structural measurement model can be assessed by the co-
efficient of determination (R²) measures, and the level and significance of the path coeffi-
cients (Hair, Ringle, & Sarstedt, 2011).
The R² results represent the amount of the explained variance in the endogenous
construct (Chin, 2003). Generally, the target of R² should be high but its high level depends
on the specific research (Hair, Ringle, & Sarstedt, 2011). Hinckle et al. (1998) classify the
R² results into five categories of correlation level: weak is between 0.00 to 0.29, low is be-
tween 0.30 to 0.49, moderate is between 0.50 to 0.69, strong is between 0.70 to 0.89, and
very strong is between 0.90 to 1.00. On the other hand, Chin (1998) classify R² values of
Univers
ity of
Mala
ya
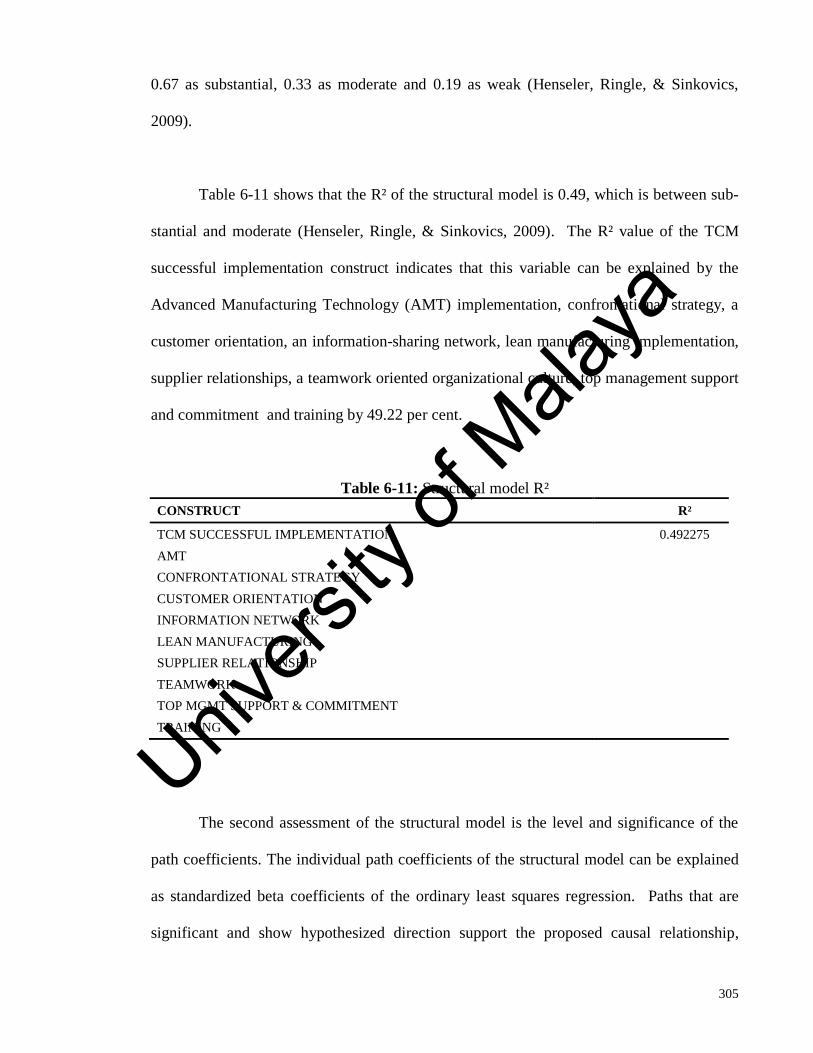
305
0.67 as substantial, 0.33 as moderate and 0.19 as weak (Henseler, Ringle, & Sinkovics,
2009).
Table 6-11 shows that the R² of the structural model is 0.49, which is between sub-
stantial and moderate (Henseler, Ringle, & Sinkovics, 2009). The R² value of the TCM
successful implementation construct indicates that this variable can be explained by the
Advanced Manufacturing Technology (AMT) implementation, confrontational strategy, a
customer orientation, an information-sharing network, lean manufacturing implementation,
supplier relationships, a teamwork oriented organizational culture, top management support
and commitment and training by 49.22 per cent.
Table 6-11: Structural model R²
CONSTRUCT R²
TCM SUCCESSFUL IMPLEMENTATION 0.492275
AMT
CONFRONTATIONAL STRATEGY
CUSTOMER ORIENTATION
INFORMATION NETWORK
LEAN MANUFACTURING
SUPPLIER RELATIONSHIP
TEAMWORK
TOP MGMT SUPPORT & COMMITMENT
TRAINING
The second assessment of the structural model is the level and significance of the
path coefficients. The individual path coefficients of the structural model can be explained
as standardized beta coefficients of the ordinary least squares regression. Paths that are
significant and show hypothesized direction support the proposed causal relationship,
Univers
ity of
Mala
ya

306
whereas insignificant paths or where the signs are contrary to the hypothesized direction do
not support the hypotheses (Hair et al., 2011).
As presented in Table 6-12, the T-values of the AMT, confrontational strategy, cus-
tomer orientation, information-sharing network, lean manufacturing, and supplier relation-
ship construct were less than 1.96. Thus, the path was insignificant and there was no cor-
relation between these variables with the successful implementation of TCM. On the other
hand, training and top management support and commitment construct had a T-value of
more than 1.96 with a 95% significance level. Among all, the teamwork construct had a T-
value more than 2.56 with a 99% significance level. Accordingly, teamwork training, and
top management support and commitment constructs reject the hypothesis that there is no
correlation or path coefficient in the population. Only three out of the nine independent var-
iables proved to be significant to the TCM successful implementation dependent variable,
which were teamwork (ß=0.31, P< 0.01), training (ß=0.20, p<0.05), and top management
support and commitment (ß=0.31, p< 0.05). Thus, teamwork, training, and top management
support and commitment have positive association with the successful implementation of
TCM.
Univers
ity of
Mala
ya
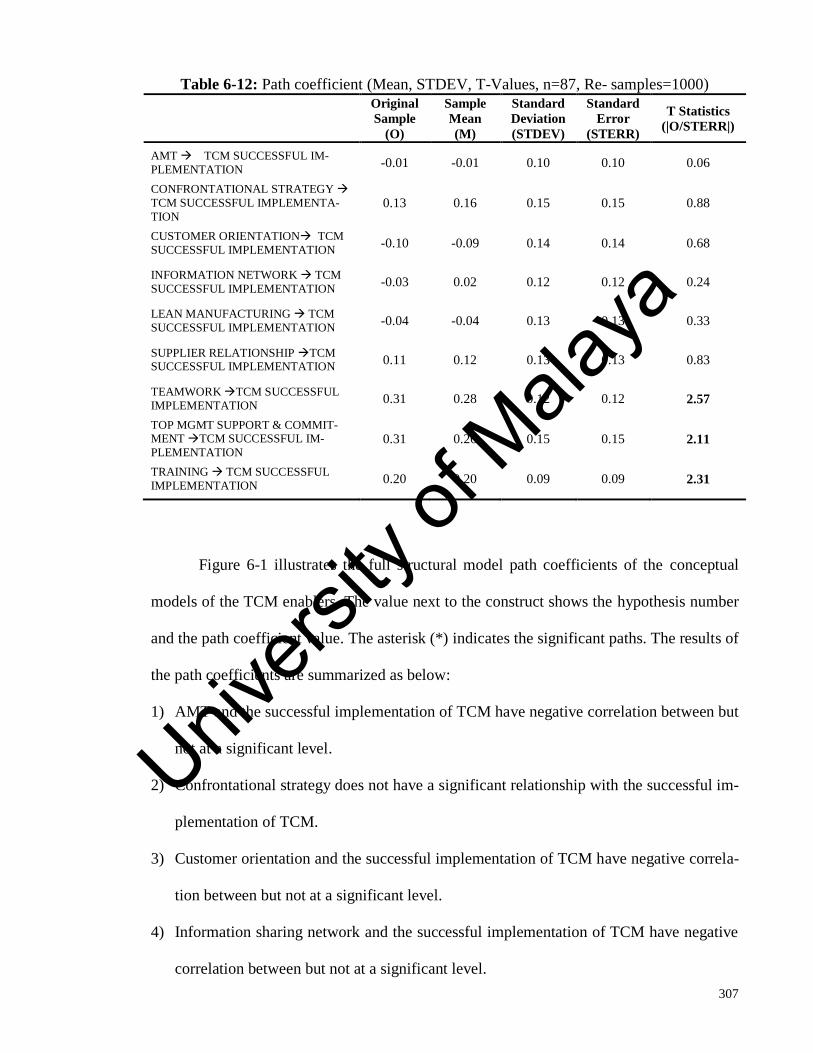
307
Table 6-12: Path coefficient (Mean, STDEV, T-Values, n=87, Re- samples=1000)
Original
Sample
(O)
Sample
Mean
(M)
Standard
Deviation
(STDEV)
Standard
Error
(STERR)
T Statistics
(|O/STERR|)
AMT TCM SUCCESSFUL IM-
PLEMENTATION -0.01 -0.01 0.10 0.10 0.06
CONFRONTATIONAL STRATEGY
TCM SUCCESSFUL IMPLEMENTA-
TION 0.13 0.16 0.15 0.15 0.88
CUSTOMER ORIENTATION TCM
SUCCESSFUL IMPLEMENTATION -0.10 -0.09 0.14 0.14 0.68
INFORMATION NETWORK TCM
SUCCESSFUL IMPLEMENTATION -0.03 0.02 0.12 0.12 0.24
LEAN MANUFACTURING TCM
SUCCESSFUL IMPLEMENTATION -0.04 -0.04 0.13 0.13 0.33
SUPPLIER RELATIONSHIP TCM SUCCESSFUL IMPLEMENTATION
0.11 0.12 0.13 0.13 0.83
TEAMWORK TCM SUCCESSFUL
IMPLEMENTATION 0.31 0.28 0.12 0.12 2.57
TOP MGMT SUPPORT & COMMIT-MENT TCM SUCCESSFUL IM-
PLEMENTATION 0.31 0.26 0.15 0.15 2.11
TRAINING TCM SUCCESSFUL
IMPLEMENTATION 0.20 0.20 0.09 0.09 2.31
Figure 6-1 illustrates the full structural model path coefficients of the conceptual
models of the TCM enablers. The value next to the construct shows the hypothesis number
and the path coefficient value. The asterisk (*) indicates the significant paths. The results of
the path coefficients are summarized as below:
1) AMT and the successful implementation of TCM have negative correlation between but
not at a significant level.
2) Confrontational strategy does not have a significant relationship with the successful im-
plementation of TCM.
3) Customer orientation and the successful implementation of TCM have negative correla-
tion between but not at a significant level.
4) Information sharing network and the successful implementation of TCM have negative
correlation between but not at a significant level.
Univers
ity of
Mala
ya
308
5) Lean system manufacturing and the successful implementation of TCM have negative
correlation between but not at a significant level.
6) Supplier relationship does not have a significant relationship with the successful im-
plementation of TCM.
7) Teamwork has a significant relationship with the successful implementation of TCM.
The path shows a strong coefficient in the model with a path coefficient of p<0.01
(ß=0.31) with the TCM successful implementation. This would indicate that if actions
were taken to increase the environment of teamwork, specifically in terms of creating a
sense of trustworthy among TCM members, then the level of the successful implemen-
tation of TCM would increase.
8) Top management support and commitment has a significant relationship to the success-
ful implementation of TCM. The path shows a strong coefficient in the model with a
path coefficient of p< 0.05(ß=0.31). This would indicate that if top management gives
more support and commitment, specifically in terms of providing the visible support for
the TCM initiatives, then the level of the successful implementation of TCM would in-
crease.
9) Training has a significant relationship to the successful implementation of TCM with a
path coefficient of p< 0.05 (ß=0.20). This would indicate that if more training was con-
ducted, specifically training for designing, implementing and using TCM, then the level
of the successful implementation of TCM would increase. Univers
ity of
Mala
ya
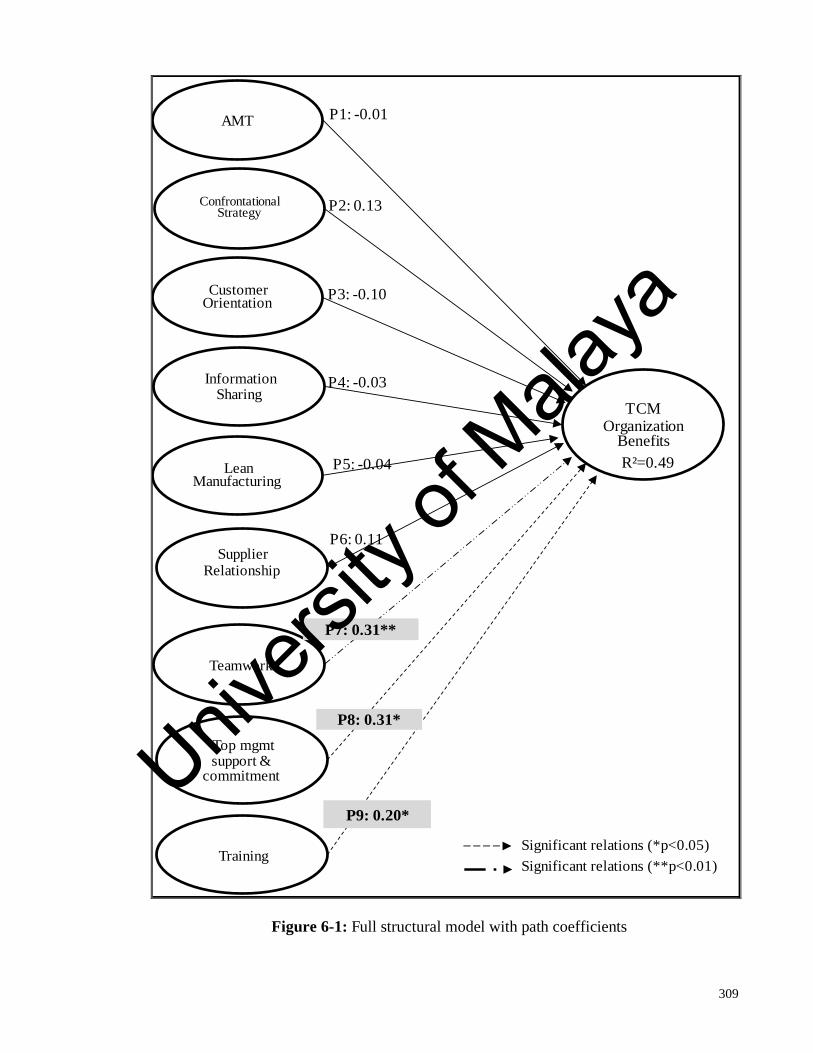
309
Significant relations (*p<0.05)
Significant relations (**p<0.01)
AMT
Confrontational Strategy
Information Sharing
Customer Orientation
LeanManufacturing
Teamwork
Top mgmtsupport &
commitment
Training
TCM Organization
Benefits
Supplier Relationship
P1: -0.01
P2: 0.13
P3: -0.10
P4: -0.03
P5: -0.04
P6: 0.11
P7: 0.31**
P8: 0.31*
P9: 0.20*
R²=0.49
Figure 6-1: Full structural model with path coefficients
Univers
ity of
Mala
ya
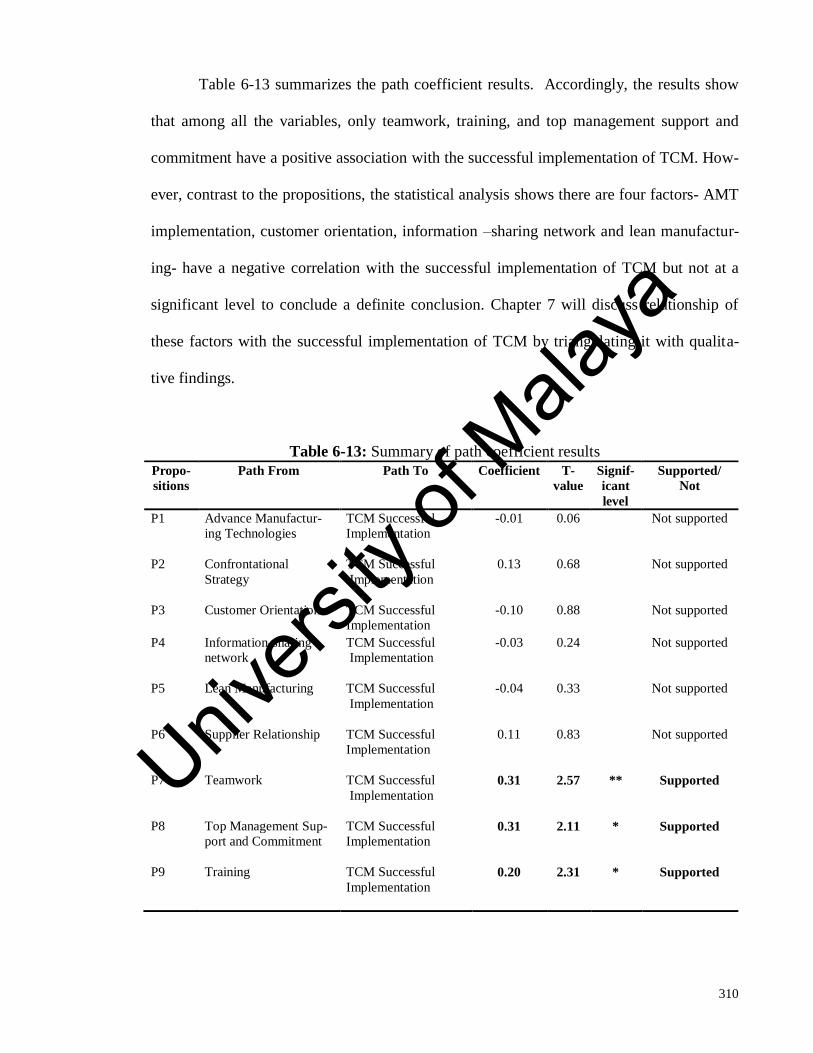
310
Table 6-13 summarizes the path coefficient results. Accordingly, the results show
that among all the variables, only teamwork, training, and top management support and
commitment have a positive association with the successful implementation of TCM. How-
ever, contrast to the propositions, the statistical analysis shows there are four factors- AMT
implementation, customer orientation, information –sharing network and lean manufactur-
ing- have a negative correlation with the successful implementation of TCM but not at a
significant level to conclude a definite conclusion. Chapter 7 will discuss relationship of
these factors with the successful implementation of TCM by triangulating it with qualita-
tive findings.
Table 6-13: Summary of path coefficient results
Propo-
sitions
Path From Path To Coefficient T-
value
Signif-
icant
level
Supported/
Not
P1 Advance Manufactur-
ing Technologies
TCM Successful
Implementation
-0.01 0.06 Not supported
P2 Confrontational
Strategy
TCM Successful
Implementation
0.13 0.68 Not supported
P3 Customer Orientation TCM Successful
Implementation
-0.10 0.88 Not supported
P4 Information-sharing
network
TCM Successful
Implementation
-0.03 0.24 Not supported
P5 Lean Manufacturing TCM Successful
Implementation
-0.04 0.33 Not supported
P6 Supplier Relationship TCM Successful
Implementation
0.11 0.83 Not supported
P7 Teamwork TCM Successful
Implementation
0.31 2.57 ** Supported
P8 Top Management Sup-
port and Commitment
TCM Successful
Implementation
0.31 2.11 * Supported
P9 Training TCM Successful
Implementation
0.20 2.31 * Supported
Univers
ity of
Mala
ya

311
6.5 Summary
In this chapter, the quantitative study was depicted in detail, including survey re-
sponse rate, respondents’ data profile, and data screening method, instrument validations
and full structural model testing using PLS. The statistical results showed that out of nine
propositions, only three enablers had a positive association with the successful implementa-
tion of TCM in the case company’s context.
The previous chapter analysed the qualitative evidence on the TCM implementation
process and enablers that support the implementation process. Based on the qualitative
findings it was concluded that, in general, all the enablers existed to a certain extent at
Company A. However, the findings also found that the case company made some adjust-
ment and adaptation to the TCM implementation process due to some constraints mainly in
the supplier relationship and information sharing. This chapter statistically analysed the en-
ablers using the quantitative evidence from the survey results. Both chapters depicted the
enablers but from different points of view, which were from qualitative and quantitative
evidence. In this chapter, it was concluded that from the results of the statistical analysis,
among all the propositions only training, top management commitment and support, and
teamwork were positively associated with the successful implementation of TCM at Com-
pany A. These quantitative findings helped to support and strengthen the qualitative find-
ings by providing the statistical results of the enablers that support the TCM practice at
Company A.
The next chapter discusses the case study findings on the TCM implementation pro-
cess and the enablers that have a positive association with the successful implementation of
Univers
ity of
Mala
ya

312
TCM by triangulating the findings from Chapter 5 and Chapter 6. By triangulating the re-
sults, the comprehensive findings of the enablers that support the successful implementa-
tion of TCM can be concluded. Then, it also proposes the TCM implementation process
model under the contexts of information sharing and supplier relationship constraints.
Univers
ity of
Mala
ya
313
CHAPTER 7: DISCUSSION AND CONCLUSION
7.1 Introduction
The previous two chapters discuss the qualitative and quantitative findings of the
case study. Chapter 5 discusses the qualitative evidence of the TCM implementation pro-
cess and the identification as well as assessment of the nine enablers for the successful im-
plementation of TCM. Subsequently, Chapter 6 presents the statistical results using the PLS
technique. The statistical findings showed that only three enablers – teamwork, top man-
agement support and commitment, and training – are positively associated with the success-
ful implementation of TCM at Company A.
This chapter discusses the results from Chapter 5 and 6 by triangulating the qualita-
tive and quantitative findings and relating them to the pertinent literature. It also discusses
and relates the results explanation by linking it with the contingency theory and dynamic
capabilities theory. The first section provides an overview of the research. It restates the
research background, objectives, questions and the research approaches taken in this study.
Then, the second section answers the first research question by summarizing the major sig-
nificant differences between what Company A has implemented and what are stated in the
conceptual framework under each TCM step. This section also proposes the new revised
conceptual framework of TCM implementation process. Next, the following section an-
swers the second research question by summarizing the possible reasons that might have
caused the differences of TCM practice at Company A compared to the TCM conceptual
model from the viewpoint of the contingency and dynamic capabilities theories. Then, the
subsequent section answers the third research question by summarizing each proposed ena-
blers relationship with the successful implementation of TCM. This explanation is made by
Univers
ity of
Mala
ya
314
triangulating the qualitative and quantitative findings from the perspective of the contin-
gency theory. Finally, this chapter ends with a discussion on the research contribution and
implications, which is followed by an explanation of the research limitations and recom-
mendations for future research topics.
7.2 Overview of the study
It is widely known that the TCM practices give a competitive advantage to the Jap-
anese companies (Ansari, Bell, & Okano, 2007). The Japanese companies manage to utilize
the TCM as a competitive tool to increase their companies’ competitiveness and long-term
profitability (Ansari & Swenson, 2006; Cooper & Slagmulder, 1999). In terms of TCM
practices in Malaysia, a survey study on management accounting practices in late 1990s by
Tho et al. (1998) found that the TCM already being implemented by Malaysian companies.
However, a focused survey study on TCM implementation at Japanese affiliated companies
in Malaysia in 2005 by Nishimura (2005a) found that the implementation process, defini-
tion and characteristics of TCM practices at these companies are not same as being prac-
ticed by the Japanese companies in Japan.
Since TCM is potential competitive tool, it is necessary to investigate the differ-
ences of TCM practices and how to enhance the implementation in order to increase a
company’s competitiveness in a developing country like Malaysia. Accordingly, the objec-
tives of this study are to examine in-depth the differences in TCM practices in a Malaysian
company compared to the Japanese TCM theoretical model, to identify the cause of differ-
ences, and to determine the key enablers that positively associated with the successful im-
plementation of TCM in non-Japanese environment context. Considering the significance
of the automotive industry in the development of Malaysia economy, this study specifically
Univers
ity of
Mala
ya
315
focused on the TCM practices in the automotive industry. Thus, the research questions in
this study are: (1) How do the TCM practices in a typical Malaysian automotive company
differ from the Japanese automotive companies’ TCM model?, (2) why do the differences
in TCM occur?, and (3) which enablers: implementation of Advanced Manufacturing
Technology (AMT), confrontational strategy, a customer orientation, an information-
sharing network, lean manufacturing implementation, supplier relationship, a teamwork
oriented organizational culture, top management support and commitment and training, are
perceived by the TCM users of a typical Malaysian automotive company as the critical en-
ablers that have a positive association with the successful implementation of TCM. A sin-
gle embedded case study method using multi-sources of data collection (Yin, 2003) was
designed to answer the research questions.
7.3 The major differences of TCM implementation process
In a nutshell, this case study found that the fundamental steps of TCM practice at
Company A were similar like the Japanese TCM theoretical model. Nevertheless, there
were some differences in the details of TCM implementation process. Next sub-sections
summarize the major differences under each step of TCM implementation process.
7.3.1 Step1: Set the target-selling price
Previous studies argue that the Japanese companies conduct a thorough market sur-
vey to identify the customers’ needs and preferences such as product specifications, fea-
tures and prices, before starting development of the new product. From the market survey,
they identify the product to be developed and the contents of the changes (Lee & Monden,
1996; Sakurai, 1989; Cooper & Slagmulder, 1999). Similarly, Company A conducted vari-
ous market surveys such as annual market survey and future trend market survey. However,
Univers
ity of
Mala
ya
316
Company A only conducted the new product market survey after the new product features
and specifications already been conceptualized. This new product concept was conceptual-
ized based on the market survey results of its existing products and future market trend,
competitors’ products, and company’s long-term business plan and product plan. Unlike the
Japanese companies, the new product market survey was not conducted to identify all cus-
tomers’ needs and preferences concerning the specifications and features of the new prod-
uct. Instead, the objective of the new product market survey was only to verify the custom-
ers’ preferences based on Company A’s pre-determined focused assumptions of new prod-
uct specifications and features. Generally, these assumptions only focused on the items that
Company A intended to develop for its new product.
This difference might be due to the range of changes that could be made by the
Company A for the new product against its original or base model. Since Company A used
its joint venture’s model base platform, the platform parts or lower body such as chassis,
engine and transmission parts were carried over from its joint venture company’s base
model. The case company only made changes on the upper body of the product by custom-
izing it to suit Malaysian market’s requirements in terms of styling, features and ride com-
fort. Any features and specifications changes on the lower body of the product to suit Ma-
laysian market’s requirement may affect and require major changes to the original or base
model’s platform parts. This eventually incurred high investment. Accordingly, Company
A pre-determined the features and specifications of the new product before the new product
market survey to identify the customers’ preferences within the allowable or possible range
of changes. This showed limited customer orientation in its new product development.
Univers
ity of
Mala
ya

317
7.3.2 Step 2: Set the target profit
As highlighted in the literature (Lee & Monden, 1996; Cooper & Slagmulder, 1999;
Kato et al., 1995; Okano, 2005), there are many ways of setting the target profit from sim-
ple to advance methods. Even though, the case company acknowledged the importance of
linking the company mid-term and long-term profit planning with the target profit, the ab-
sence of overall competitive companywide mid-term or long-term profit planning and vehi-
cle type target profit guidelines information hindered Company A to apply more advance
methods. Generally, Company A used simple target profit setting which was based on the
predecessor product or similar product with some adjustments, as highlighted by Cooper
and Slagmulder (1999). Based on historical accounting financial statement, Company A
selected a specific month of the predecessor product profitability result and its profit ratio.
In order to make the target profit of the new product more realistic, some adjustments were
made by considering the estimated profit increment and decrement. Furthermore, the aver-
age of predecessor product’s profit trend for several years and budgeted based business
plan profit level were used to justify the target profit level of the new product.
7.3.3 Step 3: Set the target cost
Previous literature (Monden & Hamada, 1991; Cooper & Slagmulder, 1988; Sa-
kurai, 1989) highlights that the Japanese companies distinguish the definition of allowable
cost and target cost. Since the allowable cost is very tight, the target cost is set in between
the allowable cost and the estimated cost. The purpose is to make the target cost more real-
istic and attainable so that it can motivate the employees. However, Company A did not
differentiate the allowable cost and the target cost. The target cost was derived by deduct-
ing the target profit from the target-selling price. In order to close the differences between
the total estimated cost and total target cost, the case company imposed a cost reduction
Univers
ity of
Mala
ya
318
target ratio equally to the estimated cost of all exclusive controllable cost items only such
as in-house cost, exclusive fixed cost, or exclusive purchased parts cost. This was because
these costs could be controlled and possible to be reduced during the product development
stage. Other costs such as tax and duty, overhead cost, sales and distribution cost, common
purchased parts, no cost reduction target was imposed as they were considered as uncon-
trollable cost items under TCM activities. Accordingly, the target cost of these uncontrolla-
ble cost items remained as same as its current estimated cost level. This measure helped to
make the target cost of each cost items more realistic and attainable. Nevertheless, this also
showed that the TCM activities at Company A were limited to certain cost items.
Previous literature (Okano, 2005; Monden & Hamada, 1991; Copper & Slagmulder,
1999) highlights that the Japanese companies break down their purchased parts total target
cost according to function, component, and part. However, Company A breaks down the
total target cost of local purchased parts until function basis level only according to R&D
Department’s designer group - Shell body, Body Others, Interior, Electrical, Engine, Drive
Train and Chassis. Considering the total purchased parts cost covers almost 60 per cent of
the total vehicle cost, the equal ratio basis cost reduction method caused the total amount
of cost reduction imposed to the purchased parts cost was higher than other cost items.
However, each designer group unable to impose cost reduction ratio equally to all pur-
chased parts because it was almost impossible to conduct cost reduction to the common
purchased parts. A common purchased part was also used at other products. Thus, any de-
sign changes of common purchased parts would affect the design of other products. This
could incur unexpected problems and cost up to the other products. On the other hand, the
cost reduction could not be conducted to all exclusive purchased parts due to the design
changes limitation. Furthermore, the quantity of exclusive purchased parts was smaller than
Univers
ity of
Mala
ya

319
common purchased parts. This required huge cost reduction per unit of exclusive purchased
parts to cover the total purchased parts cost reduction target amount. Accordingly, if the
target cost was breakdown to each individual part, it would be impossible for each individ-
ual part to achieve its target cost. Due to this limitation, each designer group unable to fur-
ther break down the target cost to each component or part basis level. Thus, the target cost
of purchased parts cost at Company A was detailed up until function basis level according
to the designer group. Each designer group had to manage their cost within their design
group target cost.
In terms of purchased parts cost estimation, unlike the Japanese companies that rely
on their suppliers (Cooper & Slagmulder, 1999), Company A did not rely on its suppliers’
estimation except for functional parts, such as wire harness and radiator, due to no expertise
or knowhow. This finding was similar to Rattray et al. (2007) in New Zealand manufactur-
ing companies who found low involvement of suppliers in the TCM activities. Accordingly,
in order to increase the accuracy of the purchased parts cost estimation, the estimation was
calculated together by TCM members from the Cost Planning Department, R&D Depart-
ment, and Purchasing and Vendor Development Department. However, this estimation used
current cost level information based on latest quotations of the existing products. This pur-
chased part cost estimation was used as the reference point to challenge the suppliers’ quo-
tations.
7.3.4 Step 4: Conduct the profitability feasibility study
Even though previous literature (Monden & Hamada, 1991; Cooper & Slagmulder,
1999) mentioned about the profitability feasibility study, there was no in-depth explanation
made concerning how it was conducted. This case study provides more evidence on how
Univers
ity of
Mala
ya
320
the profitability feasibility was conducted in terms of the process, frequency of preparing it,
and how and when the result was used.
Previous study by Monden and Hamada (1991) highlight that at the Japanese com-
panies the TCM activities were anchored by the Cost Management Department. At Compa-
ny A, instead of Cost Management Department, Cost Planning Department anchored the
TCM activities. Accordingly, the Cost Planning Department compiled all information used
in the profitability feasibility study from various sources. The profitability feasibility study
was calculated based on project assumptions, such as foreign currency exchange rates, pro-
ject volume and product model life by using a customized profitability format sheet. These
project assumptions were fixed along the development stage. The objectives are to syn-
chronize the calculation method and to avoid the fluctuation in capturing the cost infor-
mation at each development stage. Accordingly, all the material costs which were bought
from the overseas were converted to the local currency value based on foreign currency ex-
change rates assumption. As for the fixed costs such as investment and development cost,
the total investment per unit vehicle was calculated by dividing the cost with monthly pro-
ject volume and product model life assumption.
Monden and Hamada (1991) highlight that the Japanese companies calculate the
profitability feasibility study at the initial product planning stage. Similarly, this case study
also found that Company A calculated the profitability feasibility study at the initial prod-
uct planning stage. However, this case study also found that the profitability feasibility
study was calculated at each development stage to capture and monitor the current cost and
profit estimation status against the target cost and target profit. Accordingly, the cost in-
formation was continuously updated in the profitability feasibility study from the product
Univers
ity of
Mala
ya
321
planning stage until the mass production stage. This was due to the case company used the
cost reduction activities as its achievement scenario planning to cover the differences be-
tween total estimated cost and total target cost. Thus, the cost achievement results of the
cost reduction plan need to be monitored at each development stage.
Previous literature highlight that based on the profitability result, the project would
be adopted if it appears profitable and dropped or modified if it appears unprofitable
(Monden & Hamada, 1991). Generally, at Company A, the profitability feasibility study
plays an important role in TCM to capture the total estimated cost and total estimated profit
at each development stage. The result of profitability feasibility study was used to evaluate
whether a particular project meet its targets or not. However, since usually the total esti-
mated cost was unable to meet the total target cost at the initial stage, the Company A’s top
management did not make project profitability decision at the initial stage solely based on
the profitability feasibility study result. Instead, they also considered the achievement sce-
nario planning as a set of concrete cost reduction strategies or planning on how to meet the
target cost before mass production stage started.
7.3.5 Step 5: Achieving the target cost
The engineering tools mainly value engineering (VE) are commonly used by the
Japanese companies to close the differences between the target cost and the estimated cost
(Kato et al., 1995). Through VE activities, the drawings are continuously adjusted until the
target cost is met. Similarly, Company A used VE to meet its target cost. Nevertheless,
Company A more focused on the negotiation activities to meet the target cost instead of
continuously adjusting the drawings by conducting VE. This was due to limited bench-
marking information to conduct effective VE. Furthermore, Company A hardly received
Univers
ity of
Mala
ya
322
alternative design prospects as VE ideas from its suppliers. Without enough information,
VE would likely to fail and affect the performance of other surrounding parts. This would
affect the whole specification performance and quality of the new product. Accordingly,
any VE failure would likely to increase the cost further. This was due to the cost of rede-
sign the part to counter the VE failure or to counter the engineering issues at other sur-
rounding parts. In addition, as the product approached its mass production stage, any design
changes to cater VE issues would incur more cost. Specifically after tooling planning con-
firmation stage, any modification would incur cost up because the designs of the moulds or
dies were already fixed.
The Japanese companies conduct VE continuously until mass production stage and
at the same time negotiate with their suppliers to close the difference between target cost
and suppliers’ quoted prices (Cooper & Slagmulder, 1999). On the other hand, Company A
focused more on the negotiation with the suppliers instead of continuously conducting VE
to achieve the purchased parts target cost. Accordingly, starting from the supplier selection
stage, Company A gave priority to the suppliers that were able to meet the target cost. Then,
for any engineering changes during the development stage, challenge meetings were con-
ducted to challenge the suppliers’ quoted prices. Furthermore, under the cost reduction ac-
tivities, Company A analysed the suppliers’ cost level by comparing it with the similar pur-
chased part cost level of its joint ventures partner, Company M. Then, a series of negotia-
tion meetings were conducted to reduce the cost. These negotiation meetings were also
joined by the top management.
Cooper and Slagmulder (1999) highlight that the Japanese companies get the market
feedback frequently during the development stage and fine-tune their product specifications
Univers
ity of
Mala
ya
323
to cater market changes. However, in general, Company A did not modify its product’s
specifications after specifications had been being decided at the planning stage, unless due
to the unavoidable new regulation by the government. After the planning stage, Company
A fixed the specifications because any changes in the specifications would increase cost
further up due to many inter-related engineering changes need to be studied and conducted.
7.3.6 Step 6: Continuous monitoring and reporting
Previous literature (Monden & Hamada, 1991; Cooper & Slagmulder, 1999; Kato et
al., 1995; Okano, 2005) highlights that continuous monitoring and reporting are conducted
to monitor the cost achievement status. This case study also found there was a high fre-
quency of reporting the TCM results to the management, such as in monthly meetings, pe-
riodic meetings and special meetings. However, instead of monitoring and reporting the
achievement status of all the cost items at the same frequency, Company A reported and
monitored the local purchased parts cost achievement status more frequently (i.e. on a
monthly basis) than other cost items such as in-house costs. This might be due to the fact
that local purchased parts amounting to almost 50 per cent of the total vehicle costs. Case
study findings by Carr and Ng (1995) also highlighted that the TCM implementation at
Nissan UK focuses more on local purchased parts compared to other costs. For the pur-
chased parts monthly reporting, each R&D designer group was responsible to present their
group cost achievement status against the target cost to the management. This indicated that
the TCM activities of the purchased parts mainly focused on the design and development
stage to meet the target cost. However, this finding was different from TCM practices at
New Zealand companies (Rattray et al., 2007) that focus on manufacturing department in-
stead of design and development department to meet the target cost.
Univers
ity of
Mala
ya
324
Even though there were various TCM related meetings conducted at Company A,
these meetings were joined by middle to top management level from certain departments
only such as Cost Planning Department, R&D Department, and Purchasing and Vendor
Development Department. This was due to the achievement status reports contained confi-
dential issues which were related to cost and profit status of the new product. Consequently,
the strategies and the results of the TCM activities were not widely known by working level
and other non-related departments. This shows that the TCM activities at Company A still
limited to certain departments and not yet fully implemented as companywide activities.
7.3.7 Step 7: Cost improvement stage
Previous studies (Sakurai, 1989; Kato et al., 1995) highlight that some Japanese
companies link the standard costing and budgeting to the TCM. Furthermore, the Japanese
companies also link the Kaizen Costing and Cost Maintenance activities with the TCM by
conducting the continuous cost reduction at the mass production stage to meet the target
cost (Lee & Monden, 1996; Monden & Hamada, 1991). However, as Company A used ac-
tual costing method, no comparison was made concerning the standard cost and target cost
variance at the mass production stage. Furthermore, even though Company A conducted
the kaizen activities at the mass production stage, these kaizen activities were manufactur-
ing plants’ individual activities and had no linkage with TCM targets. Therefore, in order to
make continuous cost reduction at the production stage for Model X1, Company A intro-
duced a new project code, Model X2. By using this new project code, Company A re-
conduct some of TCM activities for Model X1 in order to make the cost of the product
more competitive.
Univers
ity of
Mala
ya
325
Previous literature highlight that the Japanese companies report the actual cost and
profit after three months of mass production started (Kato et al., 1995; Monden & Hamada,
1991). This case study found that Company A also conducted similar practice. Nevertheless,
Company A continued to monitor the result by quarterly basis until the end of the product
model life from the TCM planning’s viewpoint. The main objectives were to report to the
top management the actual cost movement compared to the previous quarter, and total ac-
cumulated profit since its launching time against its accumulated target profit plan. In addi-
tion, since Company A used actual costing, due to allocated overhead method, the historical
accounting information was unable to reflect actual resource consumption by any particular
product (Kaplan, 1984). Accordingly, based on historical accounting statements some ad-
justments were made to some of the cost items such as overhead cost. For these cost items,
instead of using one particular month historical accounting statement, an average of several
months historical accounting statement was used as the cost information. Based on this ad-
justment, Cost Planning Department reported the accumulated actual profit achievement of
the product against its total accumulated target profit until the end of the product model life
to the management.
The Japanese companies link the product design and development activities and
mass production activities through TCM and Kaizen Costing. The latest information from
the Kaizen Costing activities is used as the base cost to estimate future new product
(Monden & Hamada, 1991). Due to a lack of cost information cycle between the design
stage and mass production stage, Company A unable to use the latest cost information from
the manufacturing plants as the base cost of the future new product. Accordingly, a particu-
lar month of predecessor product profitability or historical accounting statement was used
as the base cost of the future new product. Nevertheless, since Company A used actual
Univers
ity of
Mala
ya

326
costing method, the cost per unit of some cost items were fluctuated from month to month
based on production volume. Thus, actual cost and profit per unit vehicle was unable to be
captured accurately (Guan et al., 2009). Accordingly, the case company made some ad-
justment by averaging up certain cost items for several months to make the cost information
more accurate for the base cost for future new model.
7.3.8 New proposed conceptual framework for TCM
Based on the major differences explained in sub-section 7.3.1 to 7.3.7, Figure 7-1
proposes the new revised conceptual model of TCM implementation process for Company
A. The number indicated on the upper left side in the Figure 7-1 shows the major steps of
the TCM implementation process. Nevertheless, in the actual process, some of the activi-
ties might occur concurrently. However, for easier understanding the TCM implementation
process flow is divided into PDCA stages and seven steps. This new proposed conceptual
model for TCM implementation process could also be applied to other companies in the
same context i.e. loose supplier relationship, limited cost information, limited customer ori-
entation and TCM activities not fully integrated with other manufacturing systems.
Univers
ity of
Mala
ya
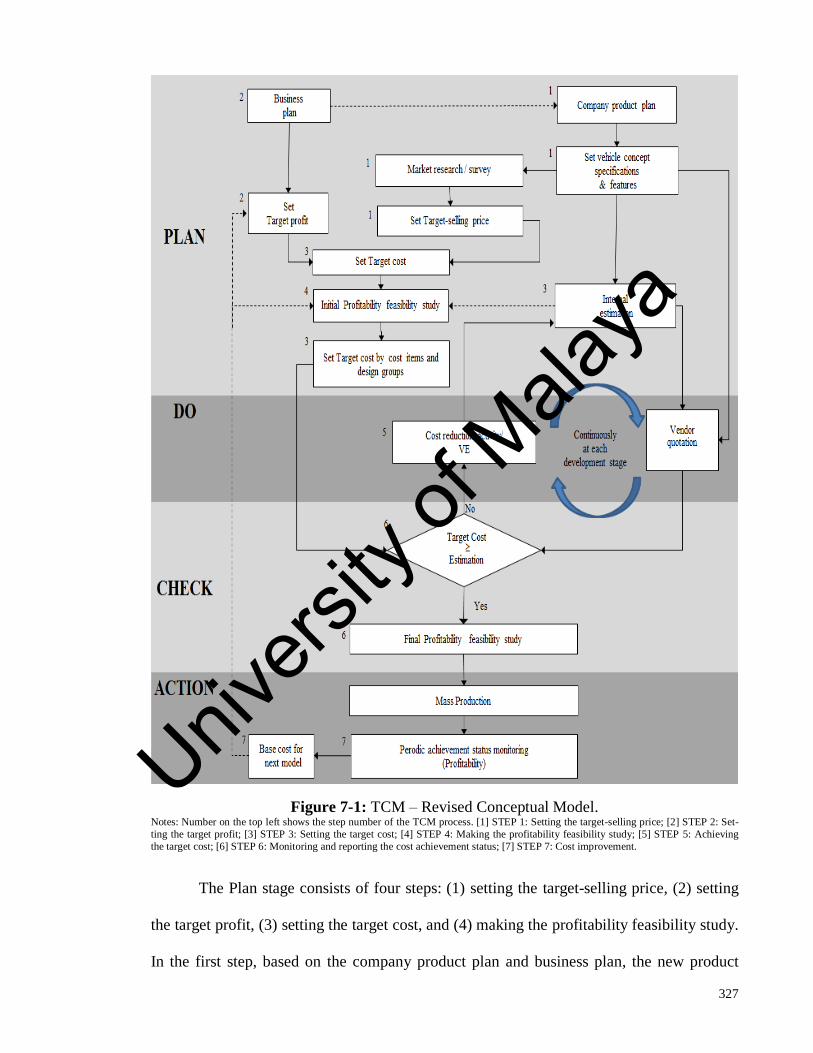
327
Figure 7-1: TCM – Revised Conceptual Model. Notes: Number on the top left shows the step number of the TCM process. [1] STEP 1: Setting the target-selling price; [2] STEP 2: Set-
ting the target profit; [3] STEP 3: Setting the target cost; [4] STEP 4: Making the profitability feasibility study; [5] STEP 5: Achieving
the target cost; [6] STEP 6: Monitoring and reporting the cost achievement status; [7] STEP 7: Cost improvement.
The Plan stage consists of four steps: (1) setting the target-selling price, (2) setting
the target profit, (3) setting the target cost, and (4) making the profitability feasibility study.
In the first step, based on the company product plan and business plan, the new product
Univers
ity of
Mala
ya

328
specifications and features are pre-determined. Then, the new product market research is
conducted to confirm these assumptions. Based on the market survey and the company
product plan, the tentative target-selling price is set. In the second step, the target profit is
set based on the company business plan and predecessor product’s profit trend. Next, in the
third step, the target cost is determined by subtracting the target profit from the target-
selling price. Then, the target cost is broken down to all cost items, such as purchased parts
cost, investment cost and in-house production cost. For the purchased parts cost, the target
cost is further broken down to the R&D designer group level only. At the same time, all the
related costs are estimated based on assumptions. If there is a gap between the target cost
and the estimated cost, an achievement scenario planning as a set of cost reduction strate-
gies must be planned to close the gap. In the fourth step, after setting the target-selling
price, target profit, target cost and estimating all the costs, the initial profitability feasibility
study is calculated to assess the per unit vehicle profit and loss. Upon top management
judgment, the process can proceed to the next stage.
In the Do stage, the cost reduction activities are conducted to achieve the target cost.
Based on the internal estimation, the suppliers’ quotations are compared and challenged.
Further cost reduction activities or negotiation will be conducted if the suppliers’ cost is
higher than the target cost. The cost achievement status is monitored continuously until the
mass production timing.
Next in the PDCA-Check stage, the achievement status is monitored continuously
until the mass production stage through periodical meetings. Before the mass production
stage starts, all the latest costs are captured to finalize the profitability feasibility study. The
Univers
ity of
Mala
ya
329
profitability feasibility study result, i.e. the estimated total cost and simulated profit per unit
vehicle, is reported to the management before proceed to the mass production stage.
Finally, in the PDCA-Act stage, after the product has been through the mass pro-
duction stage and introduced to the market, the actual profitability is analysed against its
original targets to grasp the product’s profit achievement status. The actual profitability is
continuously monitored with some adjustments based on project assumptions to monitor
the product’s profit achievement by periodic basis until the end of the product model life.
For the future new product’s base cost, an appropriate timing of the monthly actual profita-
bility or historical accounting statement will be selected as the base cost. The actual profit
trend of the predecessor product will be used as the basis to set the new product profit level.
7.4 The possible causes of the differences in TCM practices at Company A
Previous section explained the differences between Company A and the TCM con-
ceptual model. This section discusses in-depth the possible reasons of the differences in
TCM practice in the Company A context from the contingency and dynamic capabilities
theory viewpoints.
As posit by contingency theory, the application of any management accounting sys-
tem to the foreign setting must be designed with an adaptive framework. This is because all
elements in the organization must fit well with one another to perform optimally (Drury,
2004). Generally, the case study showed that Company A was unable to fully implement
TCM as highlighted in the TCM conceptual model due to some contextual constraints. As
highlighted by Anderson and Young (1999), the setting of SMA is unlikely to thrive re-
gardless of how competent the implementation is managed because the contextual factors
Univers
ity of
Mala
ya
330
have a major influence on the performance outcome. Nevertheless, the improvement of the
process factors might mitigate the indirect effect of the contextual factors to the SMA im-
plementation result.
On the other hand, this case study also showed that Company A utilized its availa-
ble resources or capabilities to cater the contextual constraints in TCM implementation pro-
cess. As posited by dynamic capabilities theory, the dynamic capabilities in the organiza-
tion influence the company’s existing resources and transform it to new resources so that
the company can enhance or sustain its competitive advantage (Teese et al., 1997). Since
TCM can be considered as bundle of routines or capabilities, this case study also explains
TCM from the dynamic capabilities perspective. Specifically, this case study showed that
within the case company’s external and internal positions, the case company managed to
adapt, integrate and reconfigure it resources through TCM activities to achieve the compa-
nies’ objectives.
Next sub-sections summarize four issues that might have caused the differences in
TCM practices and explain how the case company manages it resources to overcome the
constraints.
7.4.1 No integration with other systems
The ultimate goal of TCM implementation is to achieve the target profit (Kato,
1993). Nevertheless, in the early stage of TCM development in Japan, the TCM was seen as
a cost reduction tool (Monden et al., 1991; Tani et al., 1994). As the TCM developed and
integrated with other business elements, the perspective of TCM shifted from a cost reduc-
tion tool to a profit management tool (Ansari et al., 2007; Feil, Yook, & Kim, 2004). The
Univers
ity of
Mala
ya
331
TCM definitions also evolved from a cost reduction technique (Sakurai, 1989) to an inte-
grated systematic profit management technique (Kato et al., 1995). As the activities become
developed and matured, the Japanese companies gradually integrated it with the profit
management system and applied it as a companywide activity (Kato et al., 1995). A full
integration stage of TCM integrates and links various business functional areas into a co-
herent system (Kato et al., 1995). For example, the Japanese companies used total product
portfolio that derived from mid-term and long-term profit planning, or vehicle type target
profit guidelines to set the target profit for each new product (Kato et al., 1995; Okano,
2005). This makes the TCM closely related to corporate profit planning (Monden et al.,
1991). Accordingly, by linking the short-term competitive plan and long-term strategic plan
with TCM, the multiple loops feed forward system helps the company to be able to take
proactive action in achieving its targets (Nishimura, 2005). In addition, the Japanese com-
panies also link the TCM and other manufacturing systems, such as Kaizen Costing to con-
tinue cost reduction in the mass production stage, lean manufacturing to bring the mass
production cost in line with the target cost in the mass production stage, and 3-Gens princi-
ple to increase the accuracy of the cost information (Okano & Suzuki, 2007; Lee & Mond-
en, 1996; Monden & Hamada, 1991; Helms et al., 2005).
Company A main objective to implement TCM was to remain profitable by secur-
ing its new product’s profit. However, in setting the target profit for its new product, there
was no connection between the new product’s target profit and the strategic profit planning
of the company. Thus, there was lack of multiple loops feed forward system in TCM prac-
tice at Company A. This was because Company A only had budget based business planning
and did not have a solid strategic profit planning in terms of long-term and mid-term profit
planning that considered the target profit level of future competitive products. Accordingly,
Univers
ity of
Mala
ya
332
Company A unable to set its new product target profit based on mid-term and long-term
profit planning, or vehicle type target profit guidelines. In order to counter these infor-
mation constraints, Company A set its new product target profit based on a particular
month of predecessor product’s historical profit by considering the estimated profit incre-
ment and decrement. The budget based business plan and yearly average of predecessor
product’s historical profit trend were also used as the reference points to justify the target
profit level.
The case study found that the TCM activities at Company A focused on design and
development stage which involved limited departments, mainly R&D Department, Purchas-
ing and Vendor Development Department, and Cost Planning Department. Even though the
kaizen activities were conducted to the existing products at the mass production stage, there
was no continuation to achieve the target cost of the new product after the mass production
stage. Additionally, due to the absence of Kaizen Costing, the in-house target cost, which
was set during the design stage, was hardly monitored and improved after the mass produc-
tion stage. Accordingly, instead of extended the mass production of Model X1 due to cost
competitiveness issue, the case company conducted a special project code, Model X2, for
cost reduction activities of Model X1 after a few months of its product launching.
As highlighted by Ellram (2000), the ideal situation for TCM requires a full integra-
tion with the other activities and value chain, but not all organizations have the resources
and support to create it. Based on Ansari et al.’s (2007) five stages of management practice
life cycle, the TCM practice in Company A can be categorized in the third stage of life cy-
cle, the organizational context of the practice stage. The TCM implementation process is
Univers
ity of
Mala
ya

333
still in the process of adaptation within the company context but not yet integrated with
other organizational tools and processes, and lacks an information cycle.
In summary, a lack of integration with other systems might have caused the differ-
ences in the TCM practices at Company A. TCM activities at Company A only involved
the upstream of the production stage with the participation of certain departments and divi-
sions, standalone activities and isolated from other management tools.
7.4.2 Low degree of customer orientation
TCM helps the Japanese companies plan and design the product quality that best
meets the customers’ needs (Sakurai, 1989). Accordingly, before the development starts, an
intensive market research is conducted to determine the customer needs (Lee & Monden,
1996; Cooper & Slagmulder, 1999). The Japanese companies also change their design dur-
ing the development stage to cope with competitors’ products (Kato et al., 1995). In order
to meet the target cost, the Japanese companies mainly focus on the design effort by im-
proving the product design in the design and development stage or even earlier without sac-
rificing the value added functions or features (Tani et al., 1994; Kato et al., 1995).
Company technology and interdependence among its subunits are among the con-
tingent factors that influence the design of management accounting system (Fisher, 1998).
Due to the huge technology investment required to develop own platform parts such as en-
gine and transmission parts, Company A do not develop its own platform parts. According-
ly, Company A uses the same platform as its joint venture partner’s base or original product,
and only make changes to the upper body of the predecessor product to suit with Malaysian
market’s requirement. Thus, compared with the Japanese automotive companies, Company
Univers
ity of
Mala
ya
334
A has limited range of design engineering changes that can be conducted to its new product.
In order to focus on allowable or possible range of design changes area, Company A set its
pre-determined assumptions of the new product specifications and features before conduct-
ing the new market survey. These assumptions only focused on the items that the case
company intended to develop for its new product. The case company did not conduct a
new market survey to identify the potential customers’ specifications and features require-
ment, or to decide the new product specifications and features solely from the new product
market survey results. In other words, the objective of the new product market survey only
to verify or justify the prior assumptions concerning the upper body related new product
features and specifications. Additionally, Company A was less likely to integrate the new
market feedback on the additional functionality requirements during the development stage
unless due to unavoidable government regulations. This was due to any changes during de-
velopment stage particularly after the tooling and mould planning confirmation stage,
would cause changes on other surrounding parts which would increase cost.
In summary, the degree of customer orientation particularly in terms of determining
the features and specifications of the product might have caused the differences in the TCM
practices at Company A. Since Company A has limited scope in determining the design or
making major changes from the base design, the degree of customer orientation in terms of
identifying and integrating all customer requirements in products’ features and specifica-
tions might be different compared with Japanese companies. As a result, a thorough new
market survey to decide the specifications and features solely from the customers’ require-
ments might not be necessary for Company A.
Univers
ity of
Mala
ya
335
7.4.3 Cost information constraint
TCM requires comprehensive internal and external information (Cooper & Slag-
mulder, 1999; Kato et al., 1995; Monden & Hamada, 1991). Japanese companies create a
total cost management system by linking the TCM with the Kaizen Costing (Monden &
Hamada, 1991). In addition, instead of relying on the accounting result, the Japanese com-
panies believe in 3-Gens by directly communicating with the shop floor people during the
planning, designing and production stage. This allows proactive and fast action in respect
of cost reduction activities (Okano & Suzuki, 2007). It also creates a cost information cycle
between the design and the production stages (Monden & Hamada, 1991).
However, the case company did not implement either Kaizen Costing or 3-Gens.
Thus, it relied on the information from the financial accounting as the main source of TCM
cost information. This finding supports Chenhall & Langfield-Smith (1998b) who posit that
traditional and advance management accounting tend to complement each other. In fact,
this finding is similar to the study findings of Nishimura (2005a) who found that manage-
ment accounting in Malaysia still relies on financial accounting, budgetary or standard cost
information. As Company A used the actual costing method in preparing its financial ac-
counting report, the actual incurred indirect costs, such as energy, consumables and over-
heads, were allocated to each product by using the volume and standard time. Abnormal
factors such as reject rate were not considered during the cost allocation. Therefore, the cost
per unit not reflected the actual cost incurred for the particular product. In order to increase
the cost estimation accuracy, some cost adjustments were made, such as using monthly av-
erage historical accounting statement, to calculate the new product profitability.
Univers
ity of
Mala
ya
336
As highlighted by Johnson and Kaplan (1987), the financial accounting information
was originally designed for external financial reporting principles and procedures. There-
fore, the management accounting reports, which are prepared from this source, may not be
suitable for operation related decisions and strategic decisions (Johnson & Kaplan, 1987).
On the other hand, Hoque (2003) suggests that SMA is “the process of identifying, gather-
ing, choosing and analysing accounting data for helping the management team to make
strategic decisions and to assess organizational effectiveness”. Accordingly, in order to
counter the cost information constraint issue, Company A identified, gathered and chose the
most suitable accounting data and adjusted the cost data as the base cost of the new product
profitability feasibility study calculation. Furthermore, after the mass production, the case
company also continued to monitor a particular product’s profit and loss until the end of the
product model life to track the project achievement from the viewpoint of TCM planning.
In terms of target cost setting, the top-down method is the best method to link the
TCM with the company profit planning and business planning (Kato, 1993). This method
also fulfils the top management’s requirement (Sakurai, 1989). Company A also used the
top down method in setting its overall target cost. However, Company A has limited
benchmark cost information to set the right level of target cost particularly for the pur-
chased parts. Accordingly, in order to cover the differences between the target cost and the
estimated cost, an achievement scenario planning was planned at the planning stage. Since
the purchased parts cover almost 60 per cent from the total cost, the achievement scenario
planning mainly focused more on the cost reduction of the purchased parts. Among the
purchased parts, Company A more concentrated on the cost reduction activities of exclu-
sive local purchased parts due to limited range of changes that could be conducted to the
common purchased parts.
Univers
ity of
Mala
ya
337
In terms of the cost estimation of exclusive purchased parts, due to a lack of global
benchmark cost information, the estimation used current cost level by referring to the avail-
able information, such as from previous suppliers’ quotations of existing purchased parts.
This estimation became the target cost of the exclusive purchased parts. However, due to
the estimation being made based on the current cost level, the target cost level is less com-
petitive. Accordingly, even though the part cost achieved its target cost, it still did not
achieve the global standard. This enforced the Company A to proceed with the cost reduc-
tion of Model X1 after it had been launched in the market.
In summary, this research suggests the cost information constraint might have
caused the differences in the TCM practices at Company A. The case company used the
most useable and available cost information, such as historical accounting statement and
existing suppliers’ quotations, to adapt with the cost information constraint.
7.4.4 Loose supplier relationship
TCM implementation not only requires internal cooperation but also external coop-
eration (Monden & Hamada, 1991; Okano, 2005). An effective TCM requires joint effort
through the companies or through the entire value chain to achieve the target cost. This is
because the pressure of reaching the target must be communicated and well understood by
all parties in the supply chain, especially the suppliers (Helms et al., 2005). According to
Ellram (2000), TCM companies will reach a full integration stage when they have a close
supplier relationship. The close relationship between the Japanese companies and their
suppliers (Kato et al., 1995) helps the Japanese companies to transmit down the competitive
pressure to their suppliers and generate cost reduction throughout the supply chain (Kaplan
Univers
ity of
Mala
ya

338
et al., 1998; Cooper & Slagmulder, 1999). The Japanese suppliers even assist the Japanese
automotive manufacturers in the cost estimation of parts and proactively propose cost re-
ductions ideas (Cooper & Slagmulder, 1999, Okano, 2005). This high cooperation and mu-
tual consensus in the relationship with suppliers gives a competitive edge to the Japanese
companies (Howard & Herbig, 1996).
However, this research found that the case company relationship with its suppliers
was rather low. This finding was similar to Rattray et al. (2007) in New Zealand manufac-
turing companies who found low involvement of suppliers in TCM activities. Accordingly,
the low supplier relationship meant the case company did not have any long-term commit-
ment with its suppliers. Furthermore, unlike the Japanese suppliers, the suppliers of the
case company hardly suggested any VE ideas for cost reduction ideas. In order to adapt
with the loose supplier relationship, Company A adjusted its TCM process implementation.
For example, the suppliers’ selection was mainly based on meeting the target cost and the
cost estimation calculation mainly was estimated by the TCM members instead of relying
on suppliers’ cost estimation. By using the cost estimation of TCM members as a reference
point, the case company conducted a series of challenge meetings with suppliers to chal-
lenge the suppliers’ estimation.
In summary, this research suggests that a loose supplier relationship might have
caused the differences in the TCM practices at Company A. Specifically, the relationship
between Company A and its suppliers was more to win-lose or lose-win relationship in-
stead of win-win relationship. Accordingly, Company A modified its TCM implementation
process in order to adapt to the loose suppliers-buyers environment.
Univers
ity of
Mala
ya

339
7.5 The relationship between the proposed TCM enablers and the successful imple-
mentation of TCM at Company A
This section summarizes the relationship between the TCM enablers and the suc-
cessful implementation of TCM from the perspective of the contingency theory. As posited
by contingency theory, the contingent factors influence the management accounting infor-
mation systems design (Otley, 1980; Gordon & Miller, 1976; Fisher, 1998). From the re-
view of documentation and interviews of key personnel of Company A, nine enablers were
identified and expected to have a positive association with the successful implementation of
TCM at Company A. These nine enablers are: Advanced manufacturing technology (AMT)
implementation, confrontational strategy, a customer orientation, an information-sharing
network, lean manufacturing implementation, supplier relationships, a teamwork oriented
organizational culture, top management support and commitment, and training. The quali-
tative data indicated that these enablers exist to some degree and were likely to support the
TCM implementation process in Company A. In order to answer the third research question
on what factors are perceived by the TCM users as the critical factors that positively asso-
ciated with the successful implementation of TCM, quantitative data i.e. survey was col-
lected and statistical analysis was conducted. The statistical analysis results using PLS
showed that out of nine propositions on TCM enablers, only three enablers – teamwork, top
management support and commitment, and training – were perceived as the enablers that
support the successful implementation of TCM by the TCM users at Company A. Among
all, teamwork was perceived as the most valued enabler. This result was almost similar with
Huh et al. (2008) findings who found that among local, architectural and process capabili-
ties, the Japanese companies consider the architectural capabilities, such as top manage-
ment support and cross–functional team, are the most important factor for the successful
Univers
ity of
Mala
ya
340
implementation of TCM practices in Japan. In other words, the software capabilities are
more important than the hardware capabilities for the successful implementation of TCM.
In the subsequent sub-sections, the findings on the relationships between each ena-
bler and the successful implementation of TCM are discussed. The discussion is based on
the triangulation of both the qualitative and quantitative data in order to increase the validi-
ty of the findings.
7.5.1 AMT and the successful implementation of TCM
Based on the qualitative findings, it was observed that, to some extent, Company A
implemented AMT from the planning stage until the product delivery stage. Nevertheless,
the PLS results showed that AMT and the successful implementation of TCM have nega-
tive correlation but not at a significance level to conclude a definite conclusion. There are a
few reasons that might cause AMT implementation has negative correlation and not to be
perceived as an enabler that supports the TCM implementation by the TCM users in Com-
pany A.
First, Company A has highly hierarchical organization structure with highly de-
partmentalized functions. Under this organization structure, employees only concentrated
on their specialization areas and likely to unaware of other departments’ operations and au-
tomation systems. For example, since the CAE and CAD system only used by the R&D
engineers, non-R&D respondents did not aware the existence and the functions of these
systems in supporting the TCM operations in Company A. This might cause the respond-
ents to give low evaluation on AMT implementation at Company A.
Univers
ity of
Mala
ya

341
Second, even though the AMT helps the companies to improve their production re-
lated competitiveness with production processes and product quality improvement (Hoque,
2003), it requires a huge amount of investment (Mcnair & Mosconi, 1987). In the case of
Company A, one of the main criteria for the selection of the supplier of local purchased
parts is meeting the target cost. The AMT implementation, such as using robots for the
production, involves additional investment, which increases the total tooling cost of the
purchased parts. As a result, the suppliers may quote higher price than the target cost. In
order to improve the situation, Company A could assign future similar parts to the same
supplier to increase the volume of production and decrease the tooling amortization amount.
However, since there is no long-term relationship between Company A and its suppliers,
there is no guarantee that the same supplier would be selected again to supply the similar
purchased part for the future new products. Accordingly, the TCM users might unable to
link the importance of AMT as one of the important enablers of successful implementation
of TCM.
Third, despite a moderate level of AMT implementation in Company A, the AMT
usage was still not comprehensive. The robotics systems were not widely used in the manu-
facturing plants. Unlike world automotive manufacturers in which their productions are
fully automated, Company A still relied on labour workforce for its production with almost
80 per cent of its manpower are direct labour. This labour-oriented production focus is
common in Malaysia. As highlighted by Nishimura (2005a), Malaysia is still immature in
technology-oriented production compared with USA and European companies. In addition,
according to Chin et al. (1996), even though Malaysian companies implement a variety of
Univers
ity of
Mala
ya
342
advanced technology within the company, the usage is not comprehensive. The advanced
technology only affects a small part of the company. Even though most of the companies
understood the importance of AMT for better product quality, productivity and production
flexibility, they were still in dilemma on the necessity to invest in imported advances tech-
nologies. Furthermore, Felker and Jomo (2007) argue that poor industry policy design
causes most companies to totally depend on foreign partners for technology input, tools and
key machinery. Due to this, the main technologies of the project are neither understood nor
accessible to the locals.
Based on the above arguments, it is concluded that there is no association between
the AMT implementation and the successful implementation of TCM at Company A.
7.5.2 Confrontational strategy and the successful implementation of TCM
Based on the qualitative findings, it was observed that, to some extent, Company A
gave similar priority to quality, cost and functionality. Nevertheless, the statistical analysis
result showed that confrontational strategy had no positive association with the successful
implementation of TCM. There are a few explanations that may explain why confrontation-
al strategy was not perceived as an enabler that supports the successful implementation of
TCM by the TCM users at Company A.
First, even though Company A has the capacity to produce 250,000 units per annum
on a 2-shift cycle, the level of the capacity utilization was still below its capacity. As a rule
of thumb, full capacity utilization could reduce the total amortization cost related to fixed
cost investments such as tools and jigs. Although Company A was exporting its products to
Univers
ity of
Mala
ya
343
the overseas markets, the volume was still low. This inadequate level of capacity utilization
somehow impact the cost competitiveness of Company A’s products.
Second, even though Company A has made some changes to the external design of
the vehicle to suit the local tastes in terms of styling, features and ride comfort, most of the
platform parts were carried over from the base product’s platform of Company M. Compa-
ny A only make changes to the upper body portion with limited design changes due to the
target cost constraint. This might cause uniqueness of the Company A’s product hardly
been seen compared with its base product.
Third, the hierarchical organization structure of the company might cause business
strategies related to the pricing, cost and profit were only known to the higher management
level. For example, due to the confidentiality issues, not all employees understand how
Company A positioning its product pricing, strategies behind the pricing ranges and strate-
gies behind the selection of production plant for the production of any particular product.
Fourth, the tasks at Company A were highly segregated by divisions and depart-
ments. The departmentalization might cause employees to focus on their specialization and
unaware with other departments activities. For example, how capacity utilization at the
production plants could increase the efficiency of TCM activities might unknown to some
respondents. Furthermore, even though Company A shared information with employees
openly in the new product development meetings, cost and profit information was very con-
fidential and only disclosed to certain departments and for certain management levels.
Therefore, TCM related activities and result in terms of cost and profit achievement status
were not easily accessible to the employees. Hence, even though Company A emphasized
Univers
ity of
Mala
ya
344
on the cost, quality and functional simultaneously, above reasons could provide some justi-
fications for the insignificant relationship between confrontational strategy and the success-
ful implementation of TCM in Company A.
7.5.3 Customer orientation and the successful implementation of TCM
Based on the qualitative findings, it was observed that Company A put customer
orientation as its main agenda. This was shown by customer centric as its corporate value
and satisfying customers as its corporate mission. Nevertheless, the statistical analysis re-
sult showed that customer orientation has negative correlation with the successful imple-
mentation of TCM but not at a significance level that required a definite conclusion. There
are a few reasons that might cause this result.
First, due to high competition and liberalization of the automotive industry, there
are many choices of products in the market that provide similar specifications with better
prices. Thus, it was very hard for Company A to get full commitment and full customer
loyalty to continuously loyal to Company A’s brand. Since meeting the target cost was the
main objective of TCM at Company A, the specifications or features of the product are
bound by the target cost. Specifically, in order to achieve the target cost, Company A trade
off some specifications and gave priority to the product specifications that had high value
added to the customers only. Thus, not all customer requirements adapted to the product’s
specifications and features. In fact, since Company A only responsible to change the upper
body portion of product, platform related parts were as same as the base product with no
changes made to meet Malaysian customers’ requirement. Furthermore, during the devel-
opment stage, Company A did not incorporate the new customers’ requirements into its
product unless required by the compulsory government regulations. Thus, due to above
Univers
ity of
Mala
ya
345
constraint, TCM users might feel lack of customer commitment in the TCM practice at
Company A.
Another possible reason for the insignificant result is due to the fact that customer
orientation activities were not so obvious to the non-sales operation members. In Company
A, the sales and manufacturing operations were under separate entities. Accordingly, the
customer orientation related activities were conducted mainly by the sales operation,
whereas, the TCM related activities were mainly anchored by the manufacturing operation.
The hierarchical organization structure helped the management teams at Company A had a
full set of information to operate the business. However, the hierarchical organization struc-
ture with segmentation of tasks by departments and divisions might cause the lower level of
management had restricted information. According, this might cause TCM members not
being aware of the customer orientation activities conducted by the sales operation espe-
cially particularly activities related with after sales services.
In summary, above explanation might justify the reasons of no association between
customer orientation and the successful implementation of TCM at Company A.
7.5.4 Organizational information-sharing network and the successful implementation
of TCM
Based on the qualitative study, even though information sharing was observed at
Company A, most of the respondents from the survey considered that cost related infor-
mation sharing was still limited for TCM practice in which limited the effectiveness of
TCM practice. This was supported by the statistical analysis result which showed that the
organizational information-sharing network has no correlation with the successful imple-
Univers
ity of
Mala
ya
346
mentation of TCM. However, contrary to the proposition, the statistical analysis also
showed negative correlation but not at a significance level to conclude a definite conclusion.
There are a few reasons that might lead to this result.
Information-sharing network does not seem to have association with the successful
implementation of TCM at Company A might due to lack of exclusive information sharing
between Company A and its business partners. Even though Company A openly shared
general information with employees, exclusive information related with cost and profit in-
formation was very confidential and could only be accessed by certain departments at man-
agement level. In addition, Company A has vertical and hierarchical organizational struc-
tures where tasks are segregated by departments and divisions. This departmentalization
and specialization lead to narrow view of business operation among employees. Thus, not
all the employees of Company A understood the overall picture of TCM activities and its
interrelated linkage, and able to access the result of TCM activities. Moreover, the
knowhow concerning TCM information sharing seems insufficient in Company A. With
the manpower turnover issue in the Cost Planning Department, the knowledge of TCM de-
tail implementation process was hardly embedded in the organization. Accordingly, Ansari
et al. (2006) argued that to make TCM successful, a right implementation process is not
enough. They posit that TCM should be institutionalized into the company’s daily work
routine and culture by breaking down the communication barriers among employees. This
is because the simultaneous engineering can only work effectively after the value and in-
formation are shared (Tani, 1995).
Another plausible explanation for the insignificant result may be due to the limited
cost benchmark information. In TCM activities, cost information is essential in identifying
Univers
ity of
Mala
ya
347
and prioritizing the cost improvement opportunities (Kulmala et al., 2002). Even though
Company A has Company M as its joint venture partner, due to legal and confidentiality
issues, Company A was unable to access the detailed cost information from Company M’s
suppliers or subsidiaries. This cost benchmark information was also not available openly in
the market. In addition, some Company A’s suppliers with high supplier power were also
reluctant to share the cost information. Thus, Company A was unable to accurately bench-
mark whether or not the cost charged by suppliers was competitive. On the other hand, the
TCM members could not verify all the costs by using the cost tables. This is because the
cost tables were limited to a few manufacturing processes only as the process for making
cost tables was very time consuming and difficult. This is similar to what was highlighted
by Tani et al. (1994) where the Japanese companies also have problems in updating the cost
tables because the updating procedures are difficult and expensive.
Hence, the above explanations could provide some justifications for the insignifi-
cant relationship between the organization information-sharing network and the successful
implementation of TCM at Company A.
7.5.5 Lean manufacturing implementation and the successful implementation of TCM
Based on the qualitative findings, it was observed that, to some extent, the case
company implemented lean manufacturing. The concept of continuous improvement in lean
manufacturing helps to improve the actual mass production cost after the mass production
stage as per target cost set during the planning stage (Helms et al., 2005). However, the sta-
tistical analysis results showed that lean manufacturing implementation and the successful
implementation of TCM have negative correlation but not at a significance level. There are
Univers
ity of
Mala
ya

348
a few reasons that might have caused the lean manufacturing implementation to be consid-
ered as insufficient to support the TCM practice by the TCM users at Company A.
First, the TCM activities at Company A focused on the design and development
stage only, which mainly involved the R&D Department, Purchasing and Vendor Devel-
opment Department, Product Marketing Department, Product Planning Department and
Cost Planning Departments. Other than VE, most of the lean manufacturing techniques
were used by the manufacturing plants and only involved the manufacturing personnel.
Neither Accounting Department nor Cost Planning Department involved in the lean manu-
facturing activities. As the organizational structure of Company A was highly segmented,
the TCM members might not be familiar with the production related cost reduction activi-
ties and programmes conducted by the manufacturing plants to reduce waste and non-value
added activities.
Second, even though the production plants continuously conducting cost reduction,
there was insufficient linkage between the actual mass production cost and cost reduction
result under lean manufacturing activities at Company A. Since Company A company used
the actual costing accounting method, the allocated production cost did not reflect the actu-
al production cost incurred for a particular product. Accordingly, any cost reduction under
the implementation of lean manufacturing for a particular product unable to be reflected as
the actual cost improvement of that product. The lack of cost related performance and in-
formation from the lean manufacturing activities might have caused non-manufacturing
personnel especially design and development related personnel to not be aware of the im-
pact of lean manufacturing activities conducted at the manufacturing plants. Due to this
reason, TCM users unable to see the significance of lean manufacturing implementation to
Univers
ity of
Mala
ya
349
the TCM activities. As highlighted by Silvi et al. (2008), lean manufacturing approach does
not provide any financial and cost information which make it fails to provide an overall pic-
ture of process performance conducted under the lean manufacturing activities. Further-
more, lack of accounting personnel involvement in manufacturing improvement teams
caused the lean manufacturing activities and measures do not link with the key business
priorities (Silvi et al., 2008).
Third, TCM was still not integrated at Company A. Even though the lean manufac-
turing, such as the Kanban system, JIT, 5S, Total Productive Maintenance were implement-
ed, there was a lack of integration of these activities with the TCM. In fact, these activities
were seen as separate activities and not as part of the TCM activities. Furthermore, even
though kaizen activities were conducted at the manufacturing plants to reduce non-value
added activities, the targets were not derived from TCM. Therefore, there no continuation
to achieve the target cost of the new product after mass production stage. Due to lack of
integrated coordination, respondents might feel there was no enough complete cycle to
eliminate waste and non-value added cost from design and development stage until produc-
tion process.
Due to the above reasons, it is concluded that in the case study context, lean manu-
facturing implementation is not related to the successful implementation of TCM.
7.5.6 Supplier relationship and the successful implementation of TCM
Based on the qualitative findings, even though a positive supplier relationship was
observed at the case company, most of the respondents considered that the level of supplier
cooperation in TCM as being still limited. This was supported by the statistical analysis re-
Univers
ity of
Mala
ya
350
sult, which showed that there is no significance relationship between the supplier relation-
ship and the successful implementation of TCM.
There are a few arguments that might have caused supplier relationship to be con-
sidered as insufficient to support the TCM practice in the Company A context. First, sup-
pliers with high supplier power were reluctant to share detailed cost information. Most of
the functional parts were developed by suppliers because Company A did not have the ex-
pertise. Additionally, TCM members were unable to learn details of the processes because
some suppliers were reluctant to submit their quotations with a detailed breakdown as per
required by the Purchasing Department. Without a detailed quotation breakdown, TCM
members were unable to analyse the cost, identify the detailed contents of the cost structure
and use the information to counter the cost estimation of the suppliers in the future. Thus,
the estimated cost changes for most of the functional parts continued to rely on the infor-
mation from the suppliers. Hence, Company A might expose itself to the suppliers’ oppor-
tunistic gaming behaviour, which resulted in a higher part cost. According to Kato (1993),
Nissan Europe also faced similar issues with its European suppliers. In fact, Nissan’s sup-
pliers were reluctant to reveal their cost information, reluctant to allow their production
lines to be inspected, reluctant to provide unreasonable cost estimations, increased costs
unreasonably, and their quotations were not based on the drawings. As highlighted by Yig-
itbasioglu (2010), the extent of the information shared between the buyers and suppliers
depends on the dependence of key suppliers on the buyer and the buyer’s dependence on
the key suppliers. In addition, unlike the supplier relationship in Japan, most of the suppli-
ers outside Japan do not have a co-existent relationship with their buyers (Kato, 1993).
Therefore, it is common that suppliers particularly with high supply power reluctant to re-
veal their detailed cost information to their customers.
Univers
ity of
Mala
ya
351
Second, incapability of the local suppliers in terms of technical knowhow limited
their involvement in the product design and development stage. This limits Company A in
pooling their local suppliers’ expertise to find a creative solution to reduce the cost. Hasan
and Jomo (2007) emphasize that incompetent local suppliers are among the major issues
faced by the automotive industry in Malaysia. Furthermore, Rosli and Kari (2008) in their
comparative study of Proton’s local and foreign suppliers on economics and the financial
ratio found that the capabilities of the local suppliers was behind the foreign suppliers,
which hindered them in being competitive. Their study highlights that the foreign suppliers
are superior to the local suppliers because the foreign suppliers can access superior tech-
nology from abroad, which makes their performance better than the local suppliers.
Third, the win-win relationship between Company A and its suppliers was weak.
For example, except for functional parts, Company A did not rely on its suppliers to esti-
mate the part costs. The part cost estimation was estimated by the TCM members. Eventu-
ally, this part cost estimation was used as a target cost to challenge the supplier’s estimation.
Furthermore, Company A had to go through with lengthy negotiation process to request
vendors to meet their target cost. A study by Rattray et al. (2007) of New Zealand manufac-
turing companies also found a weak supplier involvement in the TCM practices at these
companies.
Due to the above arguments, it is concluded that in the case study context, there is
no relation between supplier relationship and the successful implementation of TCM.
Univers
ity of
Mala
ya
352
7.5.7 A teamwork orientation organization culture and the successful implementation
of TCM
Organizational culture can be a source of competitive advantage if it rare, valuable
and inimitable (Barney, 1986). Based on the qualitative findings, it was observed that the
teamwork orientation culture was rather strong at Company A. This was supported by the
statistical analysis result, which showed that the team orientation cultures had a positive
association with the successful implementation of TCM. This result is supported by Feil et
al. (2004) who suggest that teamwork is one of the critical factors for the successful imple-
mentation of TCM. This result is also similar to Lynn and Akgun (2003) who found a posi-
tive impact between the teamwork and NPD.
As highlighted in the previous sections, Company A had a vertical and hierarchical
organization, no CFM like the Japanese companies, lacked a multi-skilled expertise work-
force, and the TCM activities only involved certain departments. Nevertheless, in spite of
the constraints, all the TCM related departments played their role well in each TCM activi-
ty to achieve the company objectives. In fact, all TCM members showed high sense of re-
sponsibility and enthusiasm to tackle the TCM issues that were related with their depart-
ments. The trustworthy attitude and sense of camaraderie among TCM members created
healthy working environment of information and knowledge sharing among members.
These reasons might have caused the teamwork orientation organization culture to be con-
sidered as an enabler that supports the TCM practice in Company A context.
Accordingly, it is concluded that in the case study context, teamwork is positively
associated with the successful implementation of TCM.
Univers
ity of
Mala
ya
353
7.5.8 Top management support and commitment and the successful implementation
of TCM
Based on the qualitative findings, it was observed that the top management support
and commitment was rather strong at Company A. This was supported by the statistical
analysis result, which showed that the top management support and commitment had a pos-
itive association with the successful implementation of TCM. This finding also supports the
previous findings by Kuen and Suhaiza (2012), and Chang and Zailani (2012), who posit
that top management support and commitment is important for project success.
As highlighted above, compared with the Japanese companies, the TCM practice at
Company A was still new and faced many environment constraints particularly due to lack
of information and loose supplier relationship. The top management at Company acknowl-
edged the situation by proving adequate resources and visible supports to promote the TCM
practice. For example, Company A’s top management made frequent re-structuring within
the business units and division levels. These changes were made to create solid and robust
organization to adapt with the changing markets. Furthermore, the top management of
Company A set a clear cost reduction target under “Triple T” vision. This vision helped to
communicate the cost reduction mission and create cost awareness to the employees. Under
Hofstede’s (1984) index dimension, Malaysia is under the large power distance and low
individualism quadrant category. Thus, in Malaysia context, the top management is indis-
pensable to direct and pull the workforce towards the company direction. Company A’s top
management played it roles well by delivering its strong and active support to the TCM
implementation in terms of providing necessary resources, determining the direction and
evaluating the result.
Univers
ity of
Mala
ya

354
Therefore, it is concluded that in the case study context, top management support
and commitment is positively associated with the successful implementation of TCM.
7.5.9 Training and the successful implementation of TCM
Based on the qualitative findings, it was observed that the training was rather strong
at Company A. This was supported by the statistical analysis result, which showed that
training had a positive association with the successful implementation of TCM. This find-
ing also supports the previous findings by Pinto and Slevin (1989), which emphasize that
training people with the right administrative and technical skills has a positive impact on
successful project implementation.
The TCM members acknowledged that knowhow and skills were important in con-
ducting the TCM. Company A provided ample resources for human capital development
through various external and internal trainings. Like the Japanese companies, Company A
also focused on OJT for designing, implementing and using TCM. Besides that, Company
A even sent its manpower to be trained at Company M’s plants in Japan to expose its em-
ployees to the Japanese manufacturing methods and work culture. Although some of the
external and internal trainings were general and not directly related to the TCM implemen-
tation, these trainings increased members knowhow concerning the parts making and busi-
ness processes, which, ultimately, helped the members to identify ideas for cost reduction
activities. Accordingly, this helped the employees to understand the business processes and
continuously improve themselves and the companies (Okano & Suzuki, 2007; Feil et al.,
2004; Sadoi, 1998). In addition, a teamwork orientation organization culture also helped to
create a positive working environment for OJT training at Company A. It also helped to
Univers
ity of
Mala
ya
355
create healthy environment for informal training through spontaneous, informal feedback
and interaction among employees (Mathis & Jackson, 2004).
Accordingly, it is concluded that in the case study context, training is positively as-
sociated with the successful implementation of TCM.
7.6 Contributions and implications
Generally, this research contributes to the body of knowledge by investigating in-
depth the TCM practice in a non-Japanese environment, i.e. Malaysia, and the differences
of TCM practices by comparing it to popular Japanese TCM theoretical model. The find-
ings of this research have several significant implications for researchers and practitioners.
This chapter segregates the research contributions and implications into theoretical contri-
butions and practical implications.
7.6.1 Theoretical contributions
The theoretical contributions of this research can be categorized into two categories:
(1) understanding of TCM practice in Malaysia context, and (2) the application of contin-
gency theory and dynamic capabilities theory in TCM practices. The subsections below ex-
plain each category in detail.
7.6.1.1 Understanding of TCM practice in Malaysia context
From the accounting perspective, TCM is one of the competitive tools that may as-
sist the companies to gain competitiveness. Nevertheless, due to a lack of in-depth empiri-
cal case studies, the TCM practices in Malaysia remains comparatively unknown. This re-
search provides preliminary evidence on detailed insights of TCM implementation process
Univers
ity of
Mala
ya
356
in Malaysian context. It also provides a detailed comparison between the TCM practices in
a Malaysian automotive company and those in Japanese automotive companies based on
previous case studies research. As highlighted before, the automotive industry is one of the
main manufacturing sections that contribute to the development of Malaysia. Under the
current liberalization of the market and high competition, the Malaysian automotive com-
panies must have competitive tools to remain competitive. Accordingly, this research pro-
vides better understanding of TCM practices specifically in terms of its process implemen-
tation in non-Japanese environment context.
A survey by Nishimura (2005a) in Asian countries including Malaysia found that
even the TCM practices in the Japanese affiliated companies were not the same as Japan.
However, there is a lack of case study research to understand the actual level of TCM im-
plementation in Malaysia. This research provides a better understanding of the actual TCM
practice and the issues concerning its implementation in the Malaysian automotive industry
context and what causes the differences compared to the Japanese TCM theoretical model.
Accordingly, the necessary further action can be taken to close the gap between the theory
and practice to enhance its implementation.
The results showed that even though the basic fundamentals of TCM were the same
as those of the Japanese companies, some differences were found concerning the details of
the TCM implementation process. Generally, the findings showed that unlike the Japanese
companies, the TCM implementation level in Malaysia was between the standalone and full
integration stage. This was mainly because: (1) TCM activities mainly focused on the up-
stream process to achieve the target cost, and were not perceived as a companywide activity
to achieve the target cost from the upstream to the downstream process, (2) the TCM activi-
Univers
ity of
Mala
ya

357
ties were not integrated with other manufacturing methods, and (3) the contextual con-
straints mainly in the supplier relationship and information-sharing network.
7.6.1.2 The application of contingency and dynamic capabilities theories in TCM
practices.
This research showed the application and adaptation of TCM practices in
non-Japanese context by underpinning it with the contingency and dynamic capabilities
theories. According to the contingency theory, there is no one universal best design of man-
agement accounting systems that is applicable to all companies in all situations (Otley,
1980; Gordon & Miller, 1976; Fisher, 1998). Scholars (Tani et al, 1994; Feil, Yook, & Kim,
2004) also suggest that the TCM practices are influenced by its environment, strategy and
the organization structure specific to the industry. In fact, Ellram (2000) suggests that the
availability of resources plays important role in TCM practices. Therefore, the TCM im-
plementation level can vary starting from a standalone activity at the lowest point up to full
integration at the highest point. In the standalone stage, the TCM activities only involve a
single department or team, whereas with full integration, the TCM activities involve an in-
tegrated effort consisting of value engineering and supply chain activities (Ellram, 2000).
In general, this study partially supports the study of Nishimura (2005) who advo-
cates that the TCM practices in Malaysian companies are not the same as that highlighted
in the Japanese TCM theoretical models. However, contrary with Nishimura (2005), this
study found that the fundamental concept of the TCM in the case company was similar with
the Japanese theoretical model but there were some differences in the detail processes. Ac-
cordingly, this study supports the contingency theory which claims that the situational fac-
tors influence the design of the management accounting system. For example, the Japanese
Univers
ity of
Mala
ya
358
companies conduct thorough market surveys to determine the product features and specifi-
cations. On the hand, Company A conducted the new product survey after the product fea-
tures and specifications were already conceptualized. Company A only proceeded with the
product features and specifications if the new product market surveys result were favoura-
ble. This was because Company A still did not have the technology capabilities to develop
the whole vehicle by its own. As Company A had limitation to change the under body parts,
it only focused on the allowable or possible range of design changes by pre-determining the
new product’s features and specifications. This showed that technology constraint influ-
enced the design of TCM at Company A. According to contingency theory suggests that
all elements must fit with one another for it to perform well (Otley, 1980). An appropriate
fit between the identified contingent factors and a management accounting system resulted
superior performance (Simon, 2007). By understanding its business process and environ-
ments, Company A designed the TCM practice to adapt with its non- Japanese environment
context. This helped to create a fit inter-linkage of all elements in its non-Japanese envi-
ronment for TCM implementation. Consequently, this adaptation enabled smooth imple-
mentation of TCM and helped the Company A to achieve its organization goals.
Nevertheless, the contingency theory does not explain how the companies manage
to cope up with situational factors and gain competitive advantages. By using dynamic ca-
pabilities, this study explained how the case company adapted, integrated and reconfigured
its resources through TCM practice and developed TCM as a source of competitive ad-
vantage in the non-Japanese environment. Generally, dynamic capabilities approach helps
to explain why and how certain companies build competitive advantages in competitive en-
vironment (Teece et al., 1997). There are several implications can be derived from this
study that contribute to the development of the dynamic capabilities. First, this study links
Univers
ity of
Mala
ya
359
TCM as one of company level’s capabilities. Specifically this study explained how dynam-
ic capabilities approach helped the case company to modify and reconfigure its external and
internal resources to gain competitive advantages in the competitive environment. For ex-
ample, in terms of limited information, this research showed that Company A selected, re-
configured and utilized its available information, such as information from financial ac-
counting and existing suppliers’ quotations, for TCM implementation.
In addition, this study supports the dynamic capabilities theory in terms of provid-
ing empirical study on how the capabilities are shaped by external and internal positions
(Teese at al., 1997). Specifically, this study outlined the dimensions of external and inter-
nal positions in terms of TCM implementation - advanced manufacturing technologies im-
plementation, confrontational strategy, customer orientation, an information sharing net-
work, lean manufacturing implementation, supplier relationships, a teamwork oriented or-
ganizational culture, top management support and commitment, and training. However, out
of these factors, only three factors were positively associated with the successful implemen-
tation of TCM implementation at Company A. Due to a lack of supporting factors in the
TCM practices, the resources were modified to adapt with these constraints. For example,
due to weak supplier relationship, Company A did not rely on their suppliers’ estimation
for cost estimation of the purchased parts. Instead, through team work activities, Company
A gathered all its expertise personnel to work together to estimate the purchased parts cost.
This estimation was also used to challenge the suppliers’ quoted prices. In fact, in order to
meet the target cost, the top management of Company A also involved in the final negotia-
tion process with the suppliers. This example showed that Company A adapted its loose
supplier’s relationship constraint by utilizing its other capabilities in terms of teamwork and
top management support to make the implementation of TCM successful.
Univers
ity of
Mala
ya
360
In summary, this research provided an empirical study of TCM practice in a Malay-
sian automotive company. As posited by Otley (1980), the particular features of a suitable
accounting system depend on the specific situation in which a company finds itself. The
research findings showed that the details of the TCM implementation process in Malaysia
were different from its original Japanese TCM theoretical model due to some modifications
being made to adapt to the contextual constraints. The findings also give useful insights in-
to the TCM implementation process in terms of the major contextual constraints faced, and
how the case company modified the TCM implementation process was made to adapt to
these contextual constraints.
7.6.2 Practical implications
This research contributes to the management’s understanding concerning the nine
enablers’ relationship with the successful implementation of TCM in a typical Malaysian
automotive company context. By understanding the relationship of these enablers, manag-
ers can utilize the key enablers to support the TCM implementation and take necessary ac-
tions to mitigate the constraints. In addition, the understanding of TCM constraints in the
case study context may help future potential TCM companies to modify the TCM imple-
mentation process to best suits their contexts. Eventually, this may help Malaysian automo-
tive companies to utilize TCM as one of the tools to increase their competitiveness and Ma-
laysian automotive industry as a whole.
This research found, among all the enablers, the top management support and
commitment, training and teamwork had a positive association with the successful imple-
mentation of TCM in the typical Malaysian automotive company. Managers can expect that
Univers
ity of
Mala
ya
361
by increasing the environment of teamwork, providing more visible top management sup-
port and commitment, and facilitating more TCM specific training programmes, the level of
successful implementation of TCM would increase. Furthermore, non-TCM user compa-
nies in the same context could equip themselves by giving priority to these key enablers
before starting to apply TCM.
In addition, this case study also found low supplier relationship and lack of infor-
mation sharing to be the main contextual constraints in TCM implementation. The new po-
tential TCM companies in the same context can mitigate and leverage the risk of failure in
implementing TCM by modifying the TCM implementation process to suit with contextual
environment constraints. Nevertheless, if the Malaysian automotive companies focus on
building up a long-term supplier relationship particularly with Malaysian automotive sup-
pliers, it would help them create trust, cooperation and an open information exchange with
the suppliers. Eventually, this environment of cooperation would help in achieving the tar-
get cost, reducing the car price and increasing the competitiveness of Malaysian automotive
companies.
7.7 Limitations and recommendations for future research
This study’s aims were to investigate how the TCM implementation process com-
pared to the Japanese TCM theoretical model, to investigate how the modifications were
made to adapt to the constraints and to understand the enablers that support the successful
implementation of TCM. A single embedded case study was conducted to answer the re-
search questions. As emphasized by Scapen (2006), a single case study helps the researcher
to understand the variation in the management accounting practices and its complex mish-
mash of interrelated influences. The single case study objective is to understand the practice
Univers
ity of
Mala
ya
362
in-depth and not determine what is generally true for many (Meriam, 1998). Accordingly,
comparison across different organizational contexts using multiple case studies was not
adopted as the methodology for this research. Instead, the comparison was made within the
same organization by applying a single embedded case study. These findings can only be
replicated to the organizations that have a similar situation in terms of the nature of the
problem and problem definition (Cavana et al., 2001). Nevertheless, as stressed by Yin
(2003), in the context of case studies, generalization is feasible to the theoretical proposi-
tions with the objective of expanding and generalizing the theories.
As posited by Feil et al. (2004), TCM is environment specific. In order to focus on
the scope of the study and to eliminate contextual variance, this research focused on the
TCM implementation in the context of the automotive industry only. This is because, com-
pared with other industries, the automotive industry involves a huge number of parts and
components, many distinct processes and requires complex and high technologies to manu-
facture the output. The automotive industry was considered to be the best industry to re-
flect the research context. Accordingly, this case study focused on a single industry and a
single company with its employees as the subunit of analysis. In order to understand the
TCM enablers that have a positive association with the successful implementation of TCM
in the case company, only those who were involved directly or indirectly with TCM were
selected as the respondents. Even though various precautionary steps were taken to elimi-
nate research bias, such as using multi-sources of data collecting and data triangulation, the
researcher admits that potential bias still exists in terms of interpreting the collected data.
Future research should conduct multiple case studies in various industries to understand the
TCM practices in the Malaysian context.
Univers
ity of
Mala
ya
363
As stressed by Monden and Hamada (1991), Japanese automotive companies have
managed to create a total cost management system because they link the TCM with the
Kaizen Costing. This case study only focused on the TCM practice without looking at the
Kaizen Costing as part of TCM. The findings showed that even though TCM was imple-
mented with a positive outcome at Company A, TCM implementation was not regarded as
a tool that integrates other management tools to achieve company strategic profit. The ab-
sence of Kaizen Costing might cause no total cost management system that links the cost
reduction between the mass production stage and the design stage. A future study to ex-
plore how the linkage with Kaizen Costing or other manufacturing methods, such as lean
system manufacturing and the implementation of AMT, could impact the TCM perfor-
mance at companies outside Japan would be very interesting. On the other hand, in the ab-
sence of integrated TCM, further exploration concerning how the traditional cost manage-
ment could support and enhance the TCM activities would be an interesting topic to study.
The TCM implementation process is very long, complicated and involves many par-
ties. Even though this research was conducted as a longitudinal study with multi-sources of
data collection, it only focused on the technical aspects of the TCM, i.e. its implementation
process and its key enablers. It did not focus on the motivational factors that influence the
agents’ behaviour towards the successful implementation of TCM. Future research should
also study the implications of the motivational factors on the agents’ behaviour towards
achieving the target cost. For example, how rewards to the employees and suppliers could
enhance and trigger the collective TCM responsibility among the organizational members
and its suppliers.
Univers
ity of
Mala
ya

364
7.8 Summary
Under the current global competitive market, the biggest challenge for companies is
to remain profitable. Despite many studies showing the benefits of TCM, many companies
still underestimate the power of TCM as a critical competitive tool (Ansari et al., 2007).
This research listed details of all the processes, key enablers and constraints of the TCM
implementation process in a Malaysian automotive company context using the case study
method. It offers practical application knowhow in the specific environment of TCM. This
helps potential TCM implementers to understand the constraints of TCM in the Malaysian
context and the critical factors that are likely to assist the TCM implementation. This re-
search also proposed the conceptual model for the TCM implementation process under the
same context.
In a nutshell, TCM is environment specific. Accordingly, any company cannot
simply “plug in” the TCM to their company system (Kato et al., 1995). Based on the con-
tingent factors, companies should develop the TCM that suits its environmental constraints
by utilizing the dynamic capabilities of the organization through adapting, reconfiguring
and modifying their resources.
Univers
ity of
Mala
ya
365
REFERENCES
Abdullah, S. H., Thong, L. L., Chin, T., Noh, I. M., Book, L. Y., Joon, O. T., et al. (1999).
Management in Malaysia: A basic text on general management with local reference
to managing a Malaysian business. Kuala Lumpur: Malaysian Institute of Manage-
ment
Abu_Bakar, R., Salleh, D. A. L., & Ling, L. C. (2008). "How We Do Things Around
Here”: Implication of Corporate Culture On Job Performance. The Business Review,
Cambridge, 9(2), 339-344
Adler, R., Everett, A. M., & Waldron, M. (2000). Advanced management accounting tech-
niques in manufacturing: utilization, benefits, and barriers to implementation. Ac-
counting Forum, 24(2).
Albright, T., & Lam, M. (2006). Managerial accounting and continuous improvement initi-
atives: A retrospective and framework. Journal of Managerial Issues, 18(2), 157-
174.
Ambrosini, Véronique, & Bowman, Cliff. (2009). What are dynamic capabilities and are
they a useful construct in strategic management? International Journal of Manage-
ment Reviews, 11(1 ), 29-49.
Anderson, S. W., & Young, S. M. (1999). The impact of contextual and process factors on
the evaluation of activity -based costing systems. Accounting, Organization and So-
ciety, 24, 525-559.
Ansari, S., Bell, J., Okano, H. (2007). Target Costing: Uncharted Research Territory. In:
Chapman, C.S, Hopewood, A. G, Shields, M.D. (Ed.), Handbook of Management
Accounting Research, edited by C. S. Chapman, A. G. Hopwood, and M. D.
Shields, 507-530. Oxford, U.K.: Elsevier.
Ansari, S., Bell, J., & Swenson, D. (2006). A template for implementation target costing.
Cost Management, 20(5), 20-27.
Arkinson, A. A., Banker, R. D., Kaplan, R. S., & Young, S. M. (1995). Management Ac-
counting. Eaglewood Cliffs: Prentice Hall.
Ax, C., Greve, J., & Nilsson, U. (2008). The impact of competition and uncertainty on the
adoption of target costing. Int. J. Production Economics, 115, 92- 103.
Univers
ity of
Mala
ya
366
Baharudin, N., & Jusoh, R. (2015). Target Cost Management (TCM): A case study of an
automotive company. Procedia - Social and Behavioral Sciences, 172, 525 - 532.
Barney, J. B. (1986). Organization Culture: Can It Be A Source of Sustainable Competitive
Advantage? Academy of Management Review, 11(3), 656-665.
Boeije, H. (2010). Analysis in Qualitative Research. Sage: London.
Bright, J., Davies, R. E., Downes, C. A., & Sweeting, R. C. (1992). The deployment of
costing techniques and practices: a UK study. Management Accounting Research, 3,
201-211.
Burgess, T. F., & Gules, H.K. (1998). Buyer-supplier relationships in firms adopting ad-
vance manufacturing technology: an empirical analysis of the implementation of
hard and soft technologies. Journal of Engineering and Technology Management
15, 127-152.
Carr, A. S., & Pearson, J. N. (1999). Strategically managed buyer-supplier relationships
and performance outcomes. Journal of Operations Management, 17, 497-519.
Cavana, R. Y., Delahaya, B. L., & Sekara, U. (2001). Applied Business Research: Qualita-
tive and Quantitative Methods. Australia: John Wiley & Sons Australia, Ltd.
Chatterjee, S. R., & Nankervis, A. R. (2007). Asian Management in Transition: Emerging
Themes. New York: Palgrave Macmillan.
Chen, J. V., Yen, D. C., Rajkumar, T. M., & Tomochko, N. A. (2010). The antecedent fac-
tors on trust and commitment in supply chain relationships. Computer Standards &
Interfaces, 33, 262-270
Chenhall, R. H. (1997). Reliance on manufacturing performance measures, total quality
management and organizational performance. Management Accounting Research, 8,
187-206.
Chenhall, R. H., & Langfield-Smith, K. (1998a). Adoption and benefits of management ac-
counting practices: an Australian study. Management Accounting Research, 9, 1-18.
Univers
ity of
Mala
ya

367
Chenhall, R.H., & Langfield-Smith, K. (1998b). The relationship between strategic priori-
ties, management techniques and management accounting: an empirical investiga-
tion using a systems approach. Accounting, Organizations and Society, 23(3),
243-64.
Chin, W.W., & Newsted, P. R. (1999) Structural equation modelling analysis with small
samples using partial least squares. In: R. H. Hoyle (Ed.), Statistical strategies for
small sample research. Thousand Oaks: Sage, 307-341
Chin, W. W. (1998), The Partial Least Squares Approach to Structural Equation Model-
ling, in Modern Methods for Business Research, G. A. Marcoulides (Ed.). Mahwah,
NJ: Lawrence Erlbaum Associates, 295–358
Choe, J. M. (2002). The organizational learning effects of management accounting infor-
mation under advanced manufacturing technology. European Journal of Infor-
mation Systems, 11, 142-158.
Chua, S. (2013). Malay press: Mustapa blames carmakers for pricey vehicles, The Edge.
Retrieved from http://www.theedgemalaysia.com/political-news/243153-malay-
press-mustapa-blames-carmakers-for-pricey-vehicles.html
Chun, L. S., Kasim, N. A. H. A., & Minai, B. (1996). Are management accounting systems
in Malaysia outmoded? Singapore Management Review, 18 (1), 55-68.
Cooper, R. (1996) Enterprise and the confrontation strategy. The Academy of Management
Executive, 10(3), 28-29.
Cooper, R., Slagmulder R (1999). Develop profitable new product with target costing.
Sloan Management Review, 40(4), 23-33.
Cooper, R. (1995). When Lean Enterprises Collide. Boston MA: Harvard Business School
Press.
Cooper, R., & Kaplan, R. S. (1988). Measure Costs Right: Make the Right Decisions. Har-
vard Business Review, September- October, 96-103.
Copper, R., & Slagmulder, R. (2004). Achieving Full- Cycle Cost Management. [Cost
Management]. MIT Sloan Management Review, 46(1), 45-52.
Univers
ity of
Mala
ya
368
Creese, R. C. (2000). Cost Management in Lean Manufacturing Enterprises. AACE Interna-
tional Transactions, C5.1-C5.6.
David, F. R. (2005). Strategic Management Concepts and Cases (10th
ed.). New Jersey:
Prentice Hall.
Davis, F. D., Bagozzi, R. P., & Warshaw, P. R. (1989). User Acceptance Of Computer
Technology: A Comparison Of Two. Management Science, 35(8), 982-1003.
Day, George S. (1994). The capabilities of market-driven organizations. Journal of Market-
ing, 58(4), 37-52
Dekker, H., & Smidt, P. (2003). A survey of adoption and use of target costing in Dutch
firms. Int. J. Production Economics, 84, 293-305.
Deshpande, R., & Webster, F.E. (1989). Organizational culture and marketing: defining the
research agenda. Journal of Marketing, 53, 3-15.
Drazin, R., & Van de Ven, A.H. (1985). Alternative Forms of Fit in Contingency Theory.
Administrative Science Quarterly, 30(4), 514-539.
Drury, C. (2004). Management and Cost Accounting. London: Thomson.
Drury C., & Tayles, M. (1994) Product costing in UK manufacturing organization. Europe-
an Accounting Association, 3(3), 443-469.
Drury, C., & Tayles, M. (1995). Issues arising from surveys of management accounting
practices. Management Accounting Research, 6, 267-280.
Drury, C., & Tayles, M. (1994). Product costing in UK manufacturing organization. Euro-
pean Accounting Association, 3(3), 443-469.
Drury, Colin. (2004). Management and Cost Accounting. London: Thomson.
Univers
ity of
Mala
ya
369
Eisenhardt, K. M., & Martin, J. A. (2000). Dynamic capabilities: What are they? Strategic
Management Journal, 21(10/11), 1105-1121.
Ellram, L. M. (2000). Purchasing and supply management's participation in the target cost-
ing process. Journal of Supply Chain Management, 36(12): 39-51.
Ellram, L. M. (2002). Supply management's involvement in the target costing process. Eu-
ropean Journal of Purchasing & Supply Management, 8, 235-244.
Ellram, L. M. (2006). The implementation of target costing in the United States: Theory
versus practices. Journal of Supply Chain Management, 42(1), 13-26.
Everaert, P., Loosveld, S., Van Acker, T., Schollier, M., & Sarens, G. (2006). Characteristic
of target costing: Theoretical and field study perspectives. Qualitative Research in
Accounting & Management, 3(3), 237-263.
Feil, P., Yook, K. H., & Kim, I. W. (2004) Japanese Target Costing: A Historical Perspec-
tive. International Journal of Strategies Cost Management, Spring, 10-19.
Felker, G., Jomo, K. S. (2007). Technology Policy in Malaysia. In: Jomo K. S. (Ed.), Ma-
laysian Industry Policy Singapore: NUS Press, 129-156.
Ferrara, W. L. (1995). Cost Management Accounting - The 21st Century Paradigm. Man-
agement Accounting, 77(6), 30-36.
Filomena, T. P., Neto, J. F. K., & Duffey, M. R. (2009). Target costing operationalization
during product development: Model and application. International Journal Produc-
tion Economics, 118, 398–409
Fisher, J. G. (1998). Contingency Theory, Management Control Systems and Firm Out-
comes: Past Results and Future Directions. Behavioral Research in Accounting, 10,
47-64.
Gagne, M., & Discenza, R. (1995). Target Costing. Journal of Business & Industrial Mar-
keting, 10(1), 16-22.
Univers
ity of
Mala
ya
370
Gandhinathan, R., Raviswaran, N., & Suthakar, M. (2004). QFD- and VE-enabled target
costing: a fuzzy approach. International Journal of Quality & Reliability Manage-
ment, 21 (9), 1003-1011.
George, J. M., & Jones, G. R. (2005). Understanding and Managing Organizational Be-
haviour (4th ed.). New Jersey: Pearson Prentice Hall.
Giroud, A. (2000). Japanese transnational corporations' knowledge transfer to Southeast
Asia: the case of the electrical and electronics sector in Malaysia. International
Business Review, 9, 571-587.
Gopalakrisnan, M., Samuels, J., & Swenson, D. (2007). Target costing at consumer product
company. Strategic Finance, 89(6), 37-41.
Gordon, L. & Miller, D. (1976). A contingency framework for the design of accounting in-
formation systems. Accounting, Organizations, and Society, 1, 59-69.
Guan, L., Hansen, D. R., & Mowen, M. M. (2009). Cost Management. USA: South West-
ern Cengage Learning.
Gupta, P. (2006). Beyond PDCA-A New Process Management Model. Quality Progress,
39(7), 45-52.
Hair, J. F., Black, W. C., Anderson, B. J., & Tatham, R. L. (2006). Multivariate Data Anal-
ysis. Upper Saddle River, New Jersey: Prentice Hall.
Hair, J. F., Ringle, C. M., & Sarstedt, M. (2011). PLS-SEM: Indeed a silver bullet. Journal
of Marketing Theory and Practice, 19(2), 131-151.
Harrison, G., & McKinnon, J. (2007). National culture and management control. In T.
Hopper, D. Northcott & R. Scapens (Eds.), Issues in management accounting. Eng-
land: Prentice Hall.
Hasan, H., & Jomo, K. S. (2007). Rent- Seeking and Industrial Policy in Malaysia. In: Jo-
mo KS (Ed.), Malaysia Industrial Policy Singapore: NUS Press, 157-178.
Helms, M. M., Ettkin, L., Baxter, J. T., & Gordon, M. W. (2005). Managerial implications
of target costing. Competitive Review, 15(1), 49-56.
Univers
ity of
Mala
ya

371
Henseler, J., Ringle C. M., & Sinkovics, R. R. (2009). The use of partial least squares path
modeling in internal marketing. New challenges to International Marketing, in Ad-
vances in International Marketing, vol. 20. Rudolf R. Sinkovics and Pervez N.
Ghauri, eds., Greenwich, CT: JAI Press, 277-320.
Hergert, H. (2002). Target Costing in the textile company. Journal of textile and apparel,
technology and management, 2(IV), 1-10.
Hibbets, A. R., Albright, T., & Funk, W. (2003). The Competitive Environment And Strat-
egy of Target Costing Implementers: Evidence From the Field. Journal of Manage-
ment Issues, XV(1), 65-81.
Hilton, R. W. (2005). Managerial Accounting: Creating Value in Dynamic Business Envi-
ronment. New York: Mc Graw.
Hiromoto, T. (1991). Restoring the Relevance of Management Accounting. Journal of
Management Accounting Research, 3, 1-15.
Hitt, M. A., Ireland, R. D., & Hoskisson, R. E. (2007). Strategic Management Competitive-
ness and Globalization. Mason, OH: Thompson South-Western.
Hofstede, G. (1984). The Cultural Relativity of Quality of Life Concept. Academy of Man-
agement. The Academy of Management Review, 9(3), 389.
Hofstede, G. (1993). Cultural Constraints in Management Theories. Academy of Maange-
ment Executive, 7(1), 81.
Hofstede, G., Deusen, C. A. V., Mueller, C. B., & Charles, T. A. (2002). What Goals Do
Business Leaders Pursue? A Study in Fifteen Countries. Journal of International
Business Studies, 33(4), 785-803.
Horngren, C. T., Bhimani, A., Datar, S. M., & Foster, G. (2008). Management and Cost
Accounting (4th ed.). England: Prentice Hall.
Horngren, C.T., & Foster, G. (1987). Cost Accounting: A Management Emphasis (6th
ed).
Englewood Cliffs, NJ: Prentice Hall.
Univers
ity of
Mala
ya
372
Hoque, Zahirul. (2003). Strategic Management Accounting Concepts, Processes and Issues
(2nd ed.), London: Spipo Press.
Howard, C. & Herbig, P. (1996). Japanese Pricing Policy. Journal of Consumer Marketing,
13(4), 5-17.
Huh, S., Yook, K., & Kim, I. (2008). Relationship between organizational capabilities and
performance of target costing: An empirical study of Japanese companies. Allied
Academies International Conference, 7(2), 15-27.
Hulland, J. (1999). Use of partial least squares (PLS) in strategic management research: A
review of four recent studies. Strategic Management Journal, 20(2), 195-204.
Hunt, S. D., Chonko, L. B., & Wood, V. R. (1985). Organizational Commitment and Mar-
keting. Journal of Marketing, 49(1), 112-126.
Iman, G. (2006). Structural Equation Modellling Metode Alternatif Dengan Partial Least
Square. Semarang: Badan Penerbit Universitas Diponegoro.
Ibusuki, U., & Kaminski, P. C. (2007). Product development process with focus on value
engineering and target costing: A case study in an automative company. Interna-
tional Journal of Production Economics, 105, 459-474.
Ingram, R. W., Albright, T. L., Baldwin, B. A., & Hill, J. W. (2005). Accounting Infor-
mation for Decisions (3rd ed.). Canada: Thomson South- Western.
Isa, C. R., & Foong, S. Y. (2005). Adoption of advanced manufacturing technology (AMT)
and management accounting practices: the case of manufacturing firms in Malaysia.
World Review of Science, Technology and Sustainable Development, 2(1), 35-48.
Isa, C. R. (2006). Accounting in a Changing Environment: Issues & Implication for Man-
agement Accounting and Taxation. Kuala Lumpur: Monteriro & Heng.
Islam, R., Md Zahidul, D., Jason, A., Mahtab, H., & Ahmad, Z. A. (2009). Team learning,
top management support and new product development success. International Jour-
nal of Managing Projects in Business 2(2):289-260.
Univers
ity of
Mala
ya
373
Islam, R., & Mustapha, M. R. (2008). Organizational Approach to Total Quality Manage-
ment: A Case Study. Asian Journal of Business and Accounting, 1(2),19-38.
Jarvis, C. B., Mackenzie, S. B., & Podsakoff, P. M. (2003). A critical review of construct
indicators and measurement model misspecification in marketing and consumer re-
search. Journal of consumer research, 30, 199-218.
Jayasankaran, S. (1993). Made In Malaysia: The Proton Project. In J. K.S (Ed.), Industrial-
izing Malaysia: Policy, performance, prospects. London: Routledge , 272-285.
Johnson, H. T., & Kaplan, R. S. (1991). Relevant Lost: The rise and fall of management
accounting. Boston, Massachusetts: Harvard Business School Press.
Johnson, P., & Duberly, J. (2000). Understand Management Research. London, England:
Sage Publication.
Jomo, K. S. (1993). Introduction. In K. S. Jomo (Ed.), Industrializing Malaysia: Policy,
performance, prospects. London: Routledge, 1-76.
Jones, M. J., Munday, M., & Brinn, T. (1998). Speculation on barriers to transfer of Japa-
nese management accounting. [Literature review compilation]. Accounting, Audit-
ing & Accountability Journal, 11(2), 204-215.
Joshi, P. L. (2001). The international diffusion of new management accounting practices.
The case of India. Journal of International Accounting 10(1), 85-109.
Kaplan, R. K., & Atkinson, A. A. (1998). Advanced Management Accounting (3rd Edi-
tion). New Jersey: Prentice Hall.
Kaplan, R. S. (1983). Measuring manufacturing performance: A new challenge for manage-
rial accounting research. The accounting review, 8(4), 686-705.
Kaplan, R. S., & Cooper, R. (1998). Cost and Effect: Using integrated cost system to drive
profitability and performance. Boston, MA: Harvard Business School Press.
Kaplan, R. S. (1984). The Evolution of Management Accounting. The Accounting Review,
59(3), 390-418.
Univers
ity of
Mala
ya
374
Kato Y, Boer G, Chow C. W. (1995) Target Costing: An Integrative Management Process.
Journal of Cost Management, Spring, 39-51.
Kato, Y. (1993). Target Costing Support Systems: Lessons from leading Japanese compa-
nies. Management Accounting Research, 4, 33-77.
Kerzner, H. (1987). In search of excellence in project management. Journal of Systems
Management, 38(2), 30 - 40.
Koch, C. (2010). An ethical justification of profit maximization. Society and Business Re-
view, 5 (3), 270-280.
Kohli, A. K., & Jaworski, B. J. (1990). Market Orientation: The Construct, Research
Propositions, and Managerial Implications. Journal of Marketing, 54 (2), 1-18.
Krajewski, L. J., & Ritzman, L. P. (2005). Operations Management: Processes and value
chains. New Jersey, USA: Pearson Prentice Hall.
Krumweide, K. R. (1998). The implementation stages of Activity-Based Costing and the
Impact of Contextual and Organizational Factors. Journal of Management Account-
ing Research , 10: 239-277.
Kuen, C. W., & Zailani, S. (2012). Critical Factors in Successful New Product Develop-
ment: An Empirical Study of Malaysian Manufacturing Companies. International
Journal of Management Reviews, 29(1), 429.
Kulmala, H. I. (2004). Developing cost management in customer-supplier relationships:
three case studies. Journal of Purchasing and Supply Management, 10(2), 65-77.
Kwon, I. G, & Suh, T. (2004). Factors Affecting the Level of Trust and Commitment in
Supply Chain Relationship. Journal of Supply Chain Management, 40(2), 4-14.
Kwun, O., & Alshare, K. A. (2007). The Impact Of Fairness On User's Satisfaction With
The IS Department. Academy of Information and Management Sciences Journal,
10(1), 47-63.
Univers
ity of
Mala
ya

375
Langfield-Smith, K. (2008). Strategic management accounting: how far have we come in
25 years? Accounting, Auditing & Accountability Journal, 21 (2), 204-228.
Lee, J. Y, & Monden, Y. (1996). An International Comparison of Manufacturing - Friendly
Cost Manufacturing System. The International Journal of Accounting 31(2):197-
212.
Leong, L., & Jarmoszko, A. T. (2010). Analyzing Capabilities and enterprise strategy: A
value proposition framework. International Journal of Management and Infor-
mation System, 14(1), 53-59.
Li, S., & Lin, B. (2006). Accessing information sharing and information quality in supply
chain management. Decision Support Systems, 42, 1641-1656.
Lynn, G. S., & Akgun, A. E. (2003). Launch your new products/services better, faster. Re-
search Technology Management, 46(3), 21-26.
MAA. (2013). Summary of Sales & Production Data. Retrieved from
http://www.maa.org.my/info_summary.htm
Mahalingam, E. (2011) Institute expects one million total vehicle sales by 2020. Retrieved
from http://biz.thestar.com.my/news/story.asp?file=/2011/5/16/business/8679103
&sec=business.
Mahidin, M. U., & Kanageswary, R. (2004). The development of the automobile industry
and the road ahead. Department of Statistics Malaysia.
MAI. (2010). Malaysia Automotive Economy Trends And Outlook. Kuala Lumpur: Malay-
sia Automotive Institute.
Malhotra, N. K. (2007). Marketing Research An Applied Orientation (5th ed.). Upper Sad-
dle River, NJ: Pearson.
Manjunath, U, Metri, B. A, & Ramachandran, S. (2007) Quality management in a
healthcare organisation: a case of South Indian hospital. The TQM Magazine, 19
(2),129-139.
Univers
ity of
Mala
ya
376
Mathis, R. L., & Jackson, J. H. (2004). Human Resources Management (10th ed.). Austral-
ia: Thomson South-Western.
Mahfar, R., & Omar, N. H. (2004). The current state of management accounting practice in
selected Malaysian companies: An empirical evidence. International Business Man-
agement Conference, Universiti Tenaga Nasional International, Malaysia (pp. 50-
61)
McGowan, A. S. (1998). Perceived benefits of ABCM implementation. Accounting Hori-
zons, 12(1), 31-50.
Mcnair, C. L., & Mosconi, W. (1987). Measuring Performance in An Advance Manufactur-
ing Environment. Management Accounting 69(1): 28-31.
Mcnair, C.L, & Mosconi, William. (1987). Measuring Performance in An Advance Manu-
facturing Environment. Management Accounting, 69(1), 28-31.
Meriam, S. B. (1998). Quantitative research and case study application in education. San
Franscisco: Jossey –Bass.
MIDA. (2010). Business Opportunities Malaysia's Automotive Industry. Kuala Lumpur:
Transport Industry Division Malaysian Industrial Development Authority.
MIDA. (July 2009). Malaysia's Automotive Industry. Kuala Lumpur: Malaysian Industrial
Development Authority.
MITI. (2010). Review of National Automotive Policy. Retrieved from
http://www.miti.gov.my/cms/content.jsp?id=com.tms.cms.article.Article_9971dce0-
c0a81573-3edb3edb-686eb8ad
MITI. (2011). AFTA. Retrieved from http://www.miti.gov.my /cms/index.jsp
MITI. (2011). Malaysia International Trade and Industry Report 2010. Kuala Lumpur:
Ministry of International Trade and Industry Malaysia.
Moen, R. D., & Norman, C. L. (Nov 2010). Circling Back. Quality Progress, 43(11), 23-
28.
Univers
ity of
Mala
ya

377
Mokhtar, S. S. M, & Yusof, R. Z. (2010). The influence of top management commitment,
process quality management and quality design on new product performance: A
case of Malaysian manufacturers. Total Quality Management, 21(3):291-300.
Monden, Y., & Lee, J. (1993). How Japanese auto maker reduces cost. Management Ac-
counting, 75, 22-26.
Monden, Y., & Hamada, K. (1991). Target Costing and Kaizen Costing in Japanese auto-
mobile companies. Journal of Management Accounting Research, 3(Fall), 16-34.
Narver, J. C., & Slater, S. F. (1990). The effect of market orientation on business profitabil-
ity. Journal of Marketing, 54(4), 20-34.
New Sunday Times (2012). Nostalgic feeling. Retrieved from
http://www.highbeam.com/doc/1P1-170236406.html.
New Sunday Times (2012). Perodua’s new big car. Retrieved from
http://www.highbeam.com/doc/1P1-170236406.html.
Newman, R. G., & Mckeller, J. M. (1995). Target Pricing- A Challenge for Purchasing. In-
ternational Journal of Purchasing and Materials Management, 31(3), 13-20.
Nishimura, A. (1995). Transplanting Japanese Management Accounting and Cultural Rele-
vance. The International Journal of Accounting, 30, 318-330.
Nishimura, A. (2005a). Management Accounting Practices of Japanese Affiliates in Singa-
pore, Malaysia and Thailand. In A. Nishimura & R. Willett (Eds.), Management Ac-
counting in Asia. Malaysia: Thomson.
Nishimura, A. (2005b). Strategic Management and Contemporary Management Account-
ing. In A. Nishimura & R. Willett (Eds.), Management Accounting in Asia (pp. 1-8).
Singapore: Thomson.
Nor, N. G. M., & Sumormo, S. (Jul 2005). Transaction Cost and Organizational Choice in
the Malaysian Automobile Industry. International Journal of Business and Society,
6(2), 97-112.
Univers
ity of
Mala
ya
378
Okano, H., & Suzuki, T, (2007). A history of Japanese Management Accounting. In: C. S.
Chapman, A. G. Hopwood & M. D. Shields (Eds.), Handbook of Management Ac-
counting Research (pp. 1119-1137). UK: Elsevier Ltd,
Okano, H. (2005). Japanese Management Accounting and Recent Changes of Target Cost-
ing at Toyota. Proceeding of International Conference on Management Accounting,
Xiamen University, China.
Omar, O. E. (1997). Target Pricing: A marketing management tool for pricing new cars.
Pricing Strategy & Practice, 5(2), 61-69.
Otley, D. T. (1980). The contingency theory of management accounting: Achievement and
prognosis. Accounting, Organizations and Society, 5(4), 413-428.
Patton, M. Q. (1990). Qualitative Evaluation and Research Methods (2nd ed.). California:
Sage Publications.
Peng, D. X., Schroeder, R. G., & Shah, R. (2008). Linking routines to operations capabili-
ties: A new perspective. Journal of Operation Management, 26, 730-748.
Perera, S., Harison, G., & Poole, M. (1997). Customer focused manufacturing strategy and
the use of operation based non-financial performance measures: A research notes.
Accounting, Organizations and Society, 22(6), 555-572.
Pierce, Be. (2002). Target Cost Management: Comprehensive Benchmarking for a Compet-
itive Market. Accountancy Ireland, 34(2), 30-32.
Pinto, J. K., & Selvin., P. S. (1989). Critical success factors in R & D projects. Research
Technology Management, 32(1), 31-36.
Rattray, C. J., Lord, B. R., & Shanahan, Y. P. (2007). Target Costing in New Zealand man-
ufacturing firms. Pacific Accounting Review, 19(1), 68-83.
Roslender, Robin, & Hart, Susan J. (2003). In search of strategic management accounting:
theoretical and field study perspectives. Management Accounting Research, 14,
255-279.
Univers
ity of
Mala
ya
379
Rosli, M., & Kari, F. (2008). Malaysia’s National Automotive Policy and the Performance
of Proton’s Foreign and Local Vendors. Asia Pacific Business Review, 14(1), 103-
118.
S. Saberi, R. Mohd. Yusuff, N. Zulkifli and M.M.H. Megat Ahmad, 2010. Effective Factors
on Advanced Manufacturing Technology Implementation Performance: A Review.
Journal of Applied Sciences, 10, 1229-1242.
Sadoi, Y. (1998). Skill Formation in Malaysia: The case of Auto Parts Industry. Southeast
Asian Studies, 36(3), 317-354.
Sakurai M (1989) Target Costing and How to Use It. Journal of Cost Management, Sum-
mer, 39-50.
Sakurai, M. (1990). The influence of Factory Automation on Management Accounting
Practices: A study of Japanese Companies. Boston, Massachusetts: HBS Press.
Saraph, J. V., Benson, P. G., & Schroeder, R. G. (1989). An Instrument For Measuring The
Critical Factors Of Quality. Decision Sciences, 20(4), 810-829.
Scapens, R. W. (2006). Understanding management accounting practices: A personal jour-
ney. The British Accounting Review, 38(1), 1-30.
Schiller, B. R. (1980). The Economy Today (4th Ed.). New York: Random House.
Shank, J. K., & Fisher, J. (1999). Case study: Target costing as a strategic tool. Sloan
Management Review, Fall (41), 73-81.
Shields, M. D. (1995). An Empirical Analysis of Firms' Implementation Experiences with
Activity-Based Costing. Journal of Management Accounting Research, 7(1), 148-
165.
Simons, H. (1990). Case Study Research in Practice. London: Sage Publication
Sirmon, D. G., Hitt, M. A., & Ireland, R. D. (2007). Managing Firm Resources In Dynamic
Environments To Create Value: Looking Inside The Black Box. Academy of Man-
agement Review, 32(1), 273-292.
Univers
ity of
Mala
ya
380
Slevin, D. P., & Pinto, J. K. (1986-1998). Balancing Strategy and Tactics in Project Imple-
mentation. Sloan Management Review, 29(1), 33-41.
Smith, M., Abdullah, Z., & Razak, R. A. (2008). The diffusion of technological and man-
agement accounting innovation: Malaysian evidence. Asian Review of Accounting,
16(3), 197-218.
Stainer, A. (1995). Productivity management: the Japanese experience. Management Deci-
sion, 33 (8), 4-12.
Steiner, G. A., & Steiner, J. F. (2006). Business, Government, and Society. New York:
McGraw- Hill Irwin.
Sulaiman, M., Ahmad, N. N. N., & Alwi, N. M. (2004) Management accounting practices
in selected Asian countries- A review of literature. Managerial Auditing Journal,
19(4), 493-508.
Sulaiman, M., Ahmad, N. N. N., & Alwi, N. M. (2005). Is standard costing obsolete? Em-
pirical evidence from Malaysia. Managerial Auditing Journal, 20(2), 109-124.
Swenson, D., Ansari, S. B. J., & Kim, I.W. (2003). Best Practices in Target Costing. Man-
agement Accounting Quarterly, 4(2), 12-17.
Swenson, D.W., Buttross, T.E. & Kim, Il-W. (2005), Using the CAM-I Diagnostic to Eval-
uate Readiness for Target Costing. Cost Management, 19, 3, ABI/INFORM Global,
41
Tani, T., Okano, H., Shimizu, N., Iwabuchi, Y., Fukuda, J., & Cooray, S. (1994). Target
Cost Management in Japanese companies: Current state of art. Management Ac-
counting Research, 5, 67-81.
Tani, Takeyuki. (1995). Interactive control in target cost management. Management Ac-
counting research, 6, 399-414.
Tham, S. Y. (2004). AFTA and Competitiveness of Malaysian Manufacturing. 4th Interna-
tional Malaysian Studies Conference. Universiti Kebangsaan Malaysia, Bangi, Ma-
laysia.
Univers
ity of
Mala
ya
381
Tho, L. M., Isa, C. R. M., & Ng, K. T. (1998). Manufacturing environment, cost structure
and management accounting practices: Some Malaysia evidence. Akauntan Nasion-
al, August.
Thompson, A. A., Strickland, A. J., & Gamble, J. E. (2010). Crafting and Executing Strat-
egy (17th ed.). London: McGraw Hill International Edition.
Wad, P., & Govindaraju, V. G. R. C. (2011). Automotive industry in Malaysia: an assess-
ment of its development. Int. J. Automotive Technology and Management, 11(2),
152-171.
Wickramasinghe, Danture, & Alawattage, Chandana. (2007). Management Accounting
Change. New York: Routlegde.
Wijewardena, Hema, & Zoysa, Anura De. (1999). A comparative analysis of management
accounting practices in Australia and Japan: An empirical investigation. The Inter-
national Journal of Accounting, 34(1), 49-70.
Yamashina, H. (2000). Challenge to world class manufacturing. International Journal of
Quality & Reliability Management, 17(2), 132-143.
Yazdifar, Hassan, & Askarany, Davood. (2012). A comparative study of the adoption and
implementation of target costing in the UK, Australia and New Zealand. Interna-
tional Journal of Production Economic, 135, 382-392.
Yee, J. Y., & Monden, Y. (1996). An International Comparison of Manufacturing -Friendly
Cost Management System. The International Journal of Accounting, 31, 197-202.
Yigibasioglu, Ogan M. (2010). Information sharing with key suppliers: a transaction cost
theory perspective. International Journal of Physical Distribution & Logistics Man-
agement, 40(7), 550-578.
Yin, R. K. (2003). Case Study Research - Design and Methods (3rd ed.). California: Sage
Publications.
Yin, R. K. (2009). Case Study Research - Design and Methods (4th ed.). California: Sage
Publications.
Univers
ity of
Mala
ya
382
Zahay, D., & Griffin, A. (2010). Marketing Strategy Selection, Marketing Metrics, and
Firm Performance. Journal of Business & Industrial Marketing, 25(2), 84-93.
Zollo, Maurizio, & Winter, Sidney G. (2002). Deliberate Learning and the Evolution of
Dynamic Capabilities. Organization Science, 13(3), 339-351.
Zwikael, Ofer. (2008). Top management involvement in project management: A cross
country study of the software industry. International Journal of Managing Projects
in Business, 1(4), 498-511.
Univers
ity of
Mala
ya
383
LIST OF PUBLICATION AND PAPER PRESENTED
Baharudin, N. (2012). Comparative study of Target Cost Management (TCM) process im-
plementation and its key enablers: Malaysia automotive company case study. Paper
presented at ASEAN FBEPS-AGBEP PhD Colloqium. Brunei Darussalam: Univer-
sity of Brunei Darussalam.
Baharudin, N., & Jusoh, R. (2014). Target Cost Management (TCM): A case study from
Malaysian automotive company. Proceedings of the Global Conference on “Busi-
ness and Social Science Development” (GCBSS – 2014) Kuala Lumpur, Malaysia.
Paper presented at Global Conference on Business and Social Science, Kuala Lum-
pur (p. 206). Kuala Lumpur: GATR Enterprise.
Baharudin, N., & Jusoh, R. (2015). Target Cost Management (TCM): A case study of an
automotive company. Procedia - Social and Behavioral Sciences, 172, 525 - 532.
Univers
ity of
Mala
ya
384
APPENDICES
APPENDIX A: The Case Study Protocol
A. Introduction to the case study and purpose of protocol
Al. Overview of the study
• Appendix B
A2. Conceptual and Theoretical framework for the case study
• Chapter 3.3 for TCM implementation processes
• Chapter 3.4 for TCM enablers
A3. Role of protocol in guiding the case study investigator
B. Data collection procedures
Bl. Names of sites to be visited, including contact persons
B2. Data collection plan
• Overall schedule: Table 4-1
• Supporting devices: digital record device, laptop computer
B3. Expected preparation prior to site visits
• Review the public documents, previous received documents and observations,
previous interviews.
• Review the screening survey data
C. Case study questions
C1. Interview questions
• Appendix C
C2. Survey question
• Appendix H
D. Outline of case study report
DI. TCM implementation process
D2. TCM enablers’ existence
D3. TCM enablers statistical survey result
D4. Theories to support the result
D5. Attachments: figures, tables, list of persons interviewed, statistical results, item coding.
Developed based on the guideline provided by Yin (2003, p. 68)
Univers
ity of
Mala
ya

385
APPENDIX B: Case study research letter of consent
Norhafiza Baharudin
PhD Candidate,
Department Of Management Accounting & Taxation,
Faculty of Business and Accountancy
University Of Malaya
Tel: 012-6638281
Email: [email protected] 24th AUGUST 2011
Madam Zarina Mansor,
General Manager,
Human Resource Department,
Perodua Manufacturing Sdn. Bhd
Sungai Choh, Locked Bag 226,
48009 Rawang,
Selangor Darul Ehsan,
Malaysia.
RE: REQUEST FOR RESEARCH PERMISSION
Dear Madam,
I am Norhafiza Baharudin, a PhD candidate in the Department of Management Accounting
and Taxation, Faculty of Business and Accountancy at University Malaya. Currently, I am
doing a research on how automotive industry at Malaysia implements Target Costing Man-
agement (TCM) and the enablers that influence its implementation for my PhD thesis. Con-
junction to this, I would like to request permission to do data collection at your company.
1.1 Objective if the study
The purpose of this study is to understand the Target Costing Management (TCM) imple-
mentation in PERODUA and enablers that influence the TCM implementation process.
The results will give benefits in term of (1) understand the current level of Malaysia com-
pany’s TCM practices compared with study made by the scholars on Japanese compa-
nies’ TCM practices , (2) highlight the enablers that assist the TCM implementation at Ma-
laysia . This result hopefully can help to promote the TCM implementation and eventually
enhance the development of automotive industry at Malaysia.
1.2 Background Research
Basically there are many terms used to describe Target Costing Management (TCM) such
as ‘basis net price’, ‘manufacturing cost reduction’, ‘pre-calculation’, ‘direct cost feasibility
study’, ‘design to cost’ and ‘Cost Planning’.
Univers
ity of
Mala
ya

386
In this research, Target Costing Management is defined as:
‘A comprehensive profit management activity in which targets are set as to quality, prices,
reliability and delivery date at the time of product planning and development, to conform to
the needs of customers, and respective targets are designed to attain simultaneously in all
the processes from the start (upstream) to the end (downstream).’
TCM starts by estimating a market-based product selling price and then subtracting a de-
sired target profit to arrive at a target cost. Then, all the possibilities for cost reduction in
the various product-development phases to achieve the cost are assessed. This should be
achieved without compromising the specified product demands connected with functionali-
ty, quality, reliability et cetera.
The following formula applies to Target Costing Management:-
Target-selling Price - Target Profit = Target Cost
Once the target cost has been determined, further efforts are focused to ensure that the
product is designed to meet that target cost. Several tools can be used to accomplish this,
such as, Value Engineering (VE), reverse engineering, Value Analysis (VA) and process
improvement.
1.3 Methodology of Data Collection
The data will be collected thru interview and survey questions. Please refer to appendices
for interview questions and the survey questionnaires. The interview will be conducted
around 30 to 60 minutes per respondent. While, the survey questions will take around 20
minutes to complete.
1.4 Target Respondents
The target respondents are the employees from departments which are involved directly
with TCM implementation such as PVD, R&D, Cost Planning and et cetera.
The target respondents are 10 pax for the interview and 100 pax for the survey.
1.5 Anonymity and Confidentiality
In this research I only explore the TCM implementation process and the factors that enable
the implementation process at PERODUA. NO information related to cost, profit or loss
figures will be collected or revealed.
The anonymity of the respondents and company is guaranteed. The strict ethic guidelines of
University Malaya will ensure that anonymity is maintained at all time. Hence, no names
are required. Individual participants will not be identified in the analysis as only aggregated
results will be analysed and presented. The result of the findings will be presented for aca-
demic related purpose only. However, upon request, I would be very honoured to share the
findings with PERODUA’s management.
Univers
ity of
Mala
ya
387
Herewith I attached the supporting document from University Malaya for your reference.
Thank you very much for your consideration. It is only with your generosity and help that
this study can be successful.
Sincerely,
-------------------------------------
Norhafiza Baharudin
CHA080010
PhD Candidate,
Department Of Management Accounting & Taxation,
Faculty of Business and Accountancy
University Of Malaya
Cc:
Associate Prof. Dr. Ruzita Binti Jusoh
Department Of Management Accounting and Taxation
Faculty of Business and Accountancy
Email: [email protected]
Dr. Tengku Mohamed Faziharudean Bin Dato Tengku Feissal
Director,
Graduate School of Business
Faculty of Business and Accountancy
University Malaya
Email: [email protected]
Univers
ity of
Mala
ya
388
APPENDIX C: Target Cost Management Interview Protocol
1) Please describe why your company started to implement Target Costing management.
1. When your company did start using Target Costing Management (TCM) ap-
proach?
2. How did your company manage the cost and price of your product before you
started to implement TCM?
3. What are the reasons that your company change to TCM?
4. Who has influenced the TCM implementation at your company (e.g.: consult-
ant, employee)?
5. Whose idea was it and how TCM progress gets started?
6. How the Japanese expatriates influence the TCM implementation in your
company?
7. Was there any top management involvement in the early levels of TC devel-
opment?
8. What levels/functions were involved?
9. What departments starting the TCM? Who led the effort? Was it the commit-
tee, department and individual?
10. How different the TCM implementation of early practice look like and how
different is from current practice?
11. Is TCM viewed as tools or a philosophy? Could you give examples to support
this?
2) Please explain how your company manages to implement Target Costing Manage-
ment.
PLAN STAGE
1. What departments involve TCM planning stage and how these departments tied with
TCM?
2. Are there any management involvements at the TCM planning process? What level
functions were involved?
3. What kind of information and supports are necessary to implement target cost man-
agement at your company?
4. How does your company set the target cost?
5. How does your company set the selling price was set?
6. How does your company set the target profit was set?
DO STAGE
7. What departments involves this DO stage TCM and how?
8. Are there any management involvements at the TCM implementation process? What
level functions were involved?
Univers
ity of
Mala
ya
389
9. Who is responsible for gathering/maintaining data related to TC - individual, team, ad
hoc?
10. Are there tools that you aware that support TCM implementation at your company?
11. How do you link the Japanese manufacturing method such as one flow system, Kai-
zen, JIT in assisting TCM?
12. To your best knowledge, do you suppliers use TCM approach? Do you encourage
your suppliers to use TCM approach?
13. To what extent you share the TCM information with current or potential suppliers?
Under what circumstances?
CHECK STAGE
14. What departments involve this stage planning TCM and how?
15. Do you track cost saving from the TCM approach? What kind of cost saving are
tracked and how?
16. Who received the reports?
17. How much saving annually does your company save by using the TCM? Could I see
the report you issued on the TCM activity saving?
18. How do you check your TCM activity result?
19. How do you communicate your target cost achievement?
20. What will happen if the actual cost exceeds the target cost?
21. Are there any management involvements at the TCM planning process? What level
functions were involved?
22. Do you track non-monetary benefits using a TC approach? If so, what are they and
how are they tracked? May I see/have a copy of the summary report(s) you have is-
sued on non-monetary benefits?
23. How you/team/others are held accountable for TC results?
ACTION STAGE
24. What departments involve this stage TCM and how?
25. Are there any management involvements at the TCM stage process? What level func-
tions were involved?
26. Do you benchmark your company TCM practices with other companies? Please ex-
plain.
27. What changes or enhancements will you still make to your TCM approach?
TCM ENABLERS
28. How do you develop your members or company to understand TCM?
29. Are any employees trained on the use of TCM approach? If so, how does the training
occur? Do you train your supplier? Could you explain in details?
30. How your corporate cultures affect the TCM implementation process?
31. How supplier involved in TCM practices?
Univers
ity of
Mala
ya

390
32. Do you believe that the linkage of TCM to other initiatives (such as supplier relation-
ship, Japanese manufacturing method and etc.) have helped the acceptance of TCM,
or vice versa? How and why?
33. How do you information network with your mother company, shareholders, business
partners, suppliers help you to strengthen the TCM achievement?
34. How do you your top management assist your company to in TCM implementation?
35. Are there any specific TCM execution rules at your company? Who set the rules?
And it is known to companywide?
3) Please describe the issues of Target Costing Management that you faced during its
implementation.
1. Are there any misapplication of TCM that you have seen or notice?
2. What do you see as the drawbacks / difficulties/ disadvantages of using the TCM
approach?
3. Are the any problems which you see are so serious that they may distort/ undermine
the result of TCM?
4. Do you see your firm doing more or less in the future? Which areas will be affected
and why?
5. Is there anything else significant about your use of TCM approach or your imple-
mentation of TCM approach that you think I should know about?
4) Please explain the results of Target Costing Management to your company.
1. Are your company or department gain benefits with the TCM implementation?
2. Does TCM help you with the decision-making?
3. What do you see as the main benefits of using TCM?
4. Do you measure these benefits?
5. How do you measure this?
SECTION 2: INTERVIEWEE BACKGROUND
1. Position & responsibilities background
2. Involvement in TCM
Univers
ity of
Mala
ya

391
APPENDIX D: Document Summary Sheet Format
DOCUMENT SUMMARY SHEET
Received date: Document number:
Document date: Category: Main/ Support
Document name: Document source:
1. Brief of documents
2. Significant of document to this research
3. Summary of the contents
4. Next evidence to check/verify/ask
Univers
ity of
Mala
ya
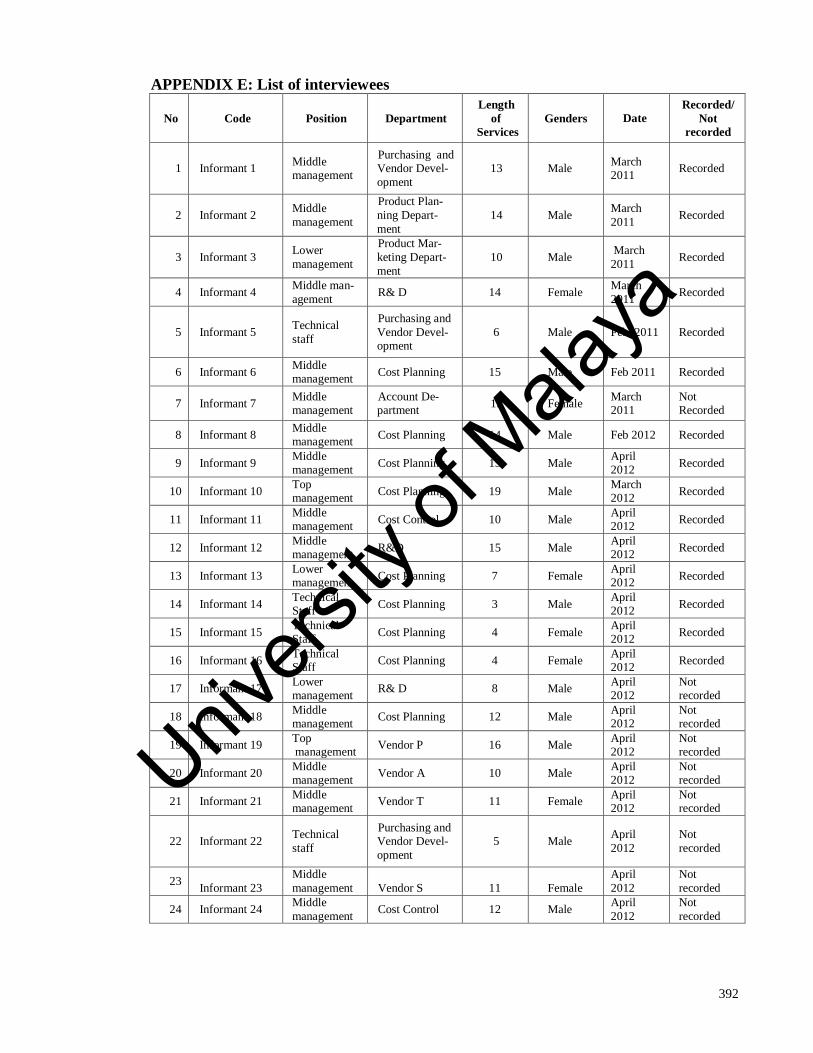
392
APPENDIX E: List of interviewees
No Code Position Department
Length
of
Services
Genders Date Recorded/
Not
recorded
1 Informant 1 Middle management
Purchasing and Vendor Devel-
opment
13 Male March 2011
Recorded
2 Informant 2 Middle
management
Product Plan-
ning Depart-
ment
14 Male March
2011 Recorded
3 Informant 3 Lower
management
Product Mar-
keting Depart-
ment
10 Male March
2011 Recorded
4 Informant 4 Middle man-
agement R& D 14 Female
March
2011 Recorded
5 Informant 5 Technical
staff
Purchasing and
Vendor Devel-opment
6 Male Feb 2011 Recorded
6 Informant 6 Middle management
Cost Planning 15 Male Feb 2011 Recorded
7 Informant 7 Middle management
Account De-partment
15 Female March 2011
Not Recorded
8 Informant 8 Middle management
Cost Planning 14 Male Feb 2012 Recorded
9 Informant 9 Middle management
Cost Planning 15 Male April 2012
Recorded
10 Informant 10 Top management
Cost Planning 19 Male March 2012
Recorded
11 Informant 11 Middle management
Cost Control 10 Male April 2012
Recorded
12 Informant 12 Middle management
R&D 15 Male April 2012
Recorded
13 Informant 13 Lower management
Cost Planning 7 Female April 2012
Recorded
14 Informant 14 Technical Staff
Cost Planning 3 Male April 2012
Recorded
15 Informant 15 Technical Staff
Cost Planning 4 Female April 2012
Recorded
16 Informant 16 Technical Staff
Cost Planning 4 Female April 2012
Recorded
17 Informant 17 Lower management
R& D 8 Male April 2012
Not recorded
18 Informant 18 Middle management
Cost Planning 12 Male April 2012
Not recorded
19 Informant 19 Top management
Vendor P 16 Male April 2012
Not recorded
20 Informant 20 Middle management
Vendor A 10 Male April 2012
Not recorded
21 Informant 21 Middle management
Vendor T 11 Female April 2012
Not recorded
22 Informant 22 Technical
staff
Purchasing and Vendor Devel-
opment
5 Male April
2012
Not
recorded
23 Informant 23
Middle
management Vendor S 11 Female
April
2012
Not
recorded
24 Informant 24 Middle
management Cost Control 12 Male
April
2012
Not
recorded
Univers
ity of
Mala
ya

393
APPENDIX F: Survey cover letter
UNIVERSITY OF MALAYA
FACULTY OF BUSINESS AND ACCOUNTANCY
DEPARTMENT OF MANAGEMENT ACCOUNTING & TAXATION
“Questionnaire”
Enablers of the Target Costing Management (TCM) implementation process in PERODUA.
By
Norhafiza Baharudin
CHA080010
Dear Sir/ Madam,
I am Norhafiza Baharudin, a PhD candidate in the Department of Management Accounting
and Taxation, Faculty of Business and Accountancy at University Malaya. Currently, I am
conducting a survey to gather data for my PhD thesis. The purpose of this study is to under-
stand the Target Costing Management (TCM) implementation in PERODUA and deter-
mine enablers that influence TCM implementation process.
Your response is very important to the accuracy of my study. I understand that your time is
valuable, however, if you could take a few minutes to complete this short questionnaire it
would be very much appreciated.
Your completion of the questionnaire is critical to my study. Please complete and return the
questionnaire as soon as possible. Your anonymity is guaranteed. The strict ethic guide-
lines of University Malaya will ensure that anonymity is maintained at all time. Hence,
no names are required. Individual participants will not be identified in the analysis as only
aggregated results will be analysed and presented. Please email to [email protected], if
you require further explanation or should you need the results of this study.
In making your ratings, please remember the following points:-
Univers
ity of
Mala
ya

394
1. Please answer each of the statements related to the questions by circling the number
that best describes your answer.
2. Some of the questions may appear to be similar, but they do address somewhat dif-
ferent issues. Please read each question carefully.
3. Please answer ALL questions.
4. Please circle only one number for each item.
Thank you very much for your time and consideration. It is only with your generosity and
help that this study can be successful.
Sincerely,
Norhafiza Baharudin
PhD Candidate
Tel: 012-6638281
Email: [email protected]
Univers
ity of
Mala
ya
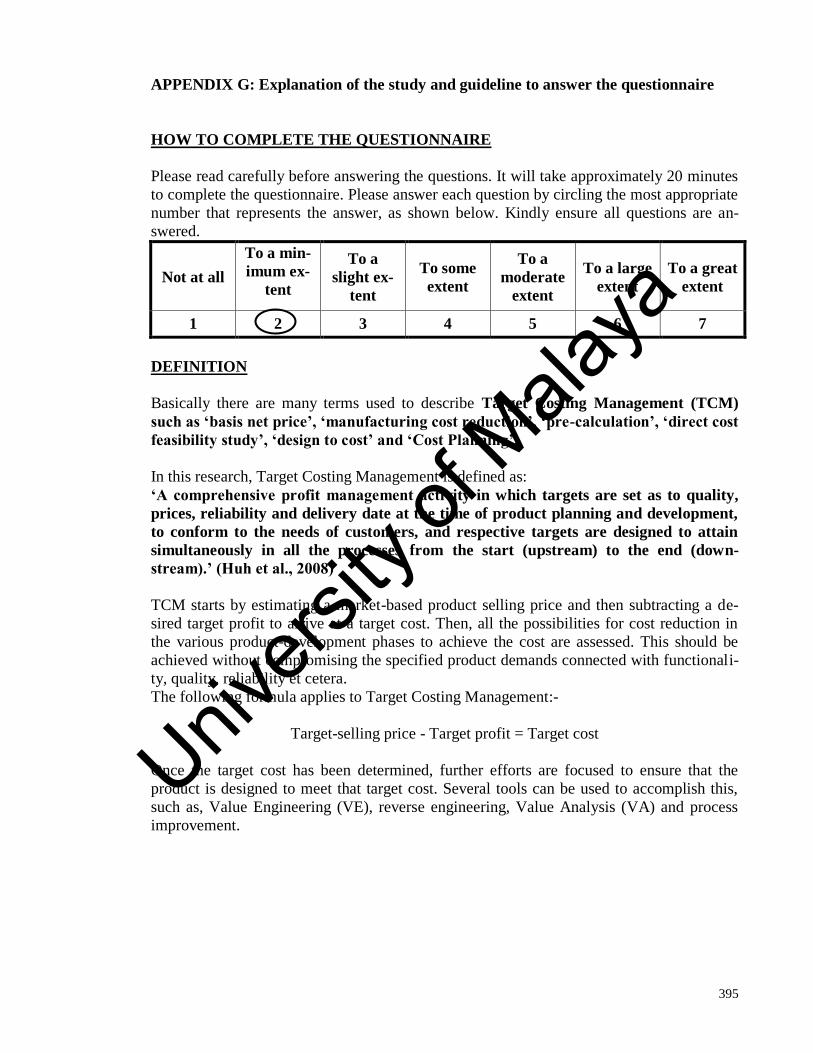
395
APPENDIX G: Explanation of the study and guideline to answer the questionnaire
HOW TO COMPLETE THE QUESTIONNAIRE
Please read carefully before answering the questions. It will take approximately 20 minutes
to complete the questionnaire. Please answer each question by circling the most appropriate
number that represents the answer, as shown below. Kindly ensure all questions are an-
swered.
Not at all
To a min-
imum ex-
tent
To a
slight ex-
tent
To some
extent
To a
moderate
extent
To a large
extent
To a great
extent
1 2 3 4 5 6 7
DEFINITION
Basically there are many terms used to describe Target Costing Management (TCM)
such as ‘basis net price’, ‘manufacturing cost reduction’, ‘pre-calculation’, ‘direct cost
feasibility study’, ‘design to cost’ and ‘Cost Planning’.
In this research, Target Costing Management is defined as:
‘A comprehensive profit management activity in which targets are set as to quality,
prices, reliability and delivery date at the time of product planning and development,
to conform to the needs of customers, and respective targets are designed to attain
simultaneously in all the processes from the start (upstream) to the end (down-
stream).’ (Huh et al., 2008)
TCM starts by estimating a market-based product selling price and then subtracting a de-
sired target profit to arrive at a target cost. Then, all the possibilities for cost reduction in
the various product-development phases to achieve the cost are assessed. This should be
achieved without compromising the specified product demands connected with functionali-
ty, quality, reliability et cetera.
The following formula applies to Target Costing Management:-
Target-selling price - Target profit = Target cost
Once the target cost has been determined, further efforts are focused to ensure that the
product is designed to meet that target cost. Several tools can be used to accomplish this,
such as, Value Engineering (VE), reverse engineering, Value Analysis (VA) and process
improvement.
Univers
ity of
Mala
ya
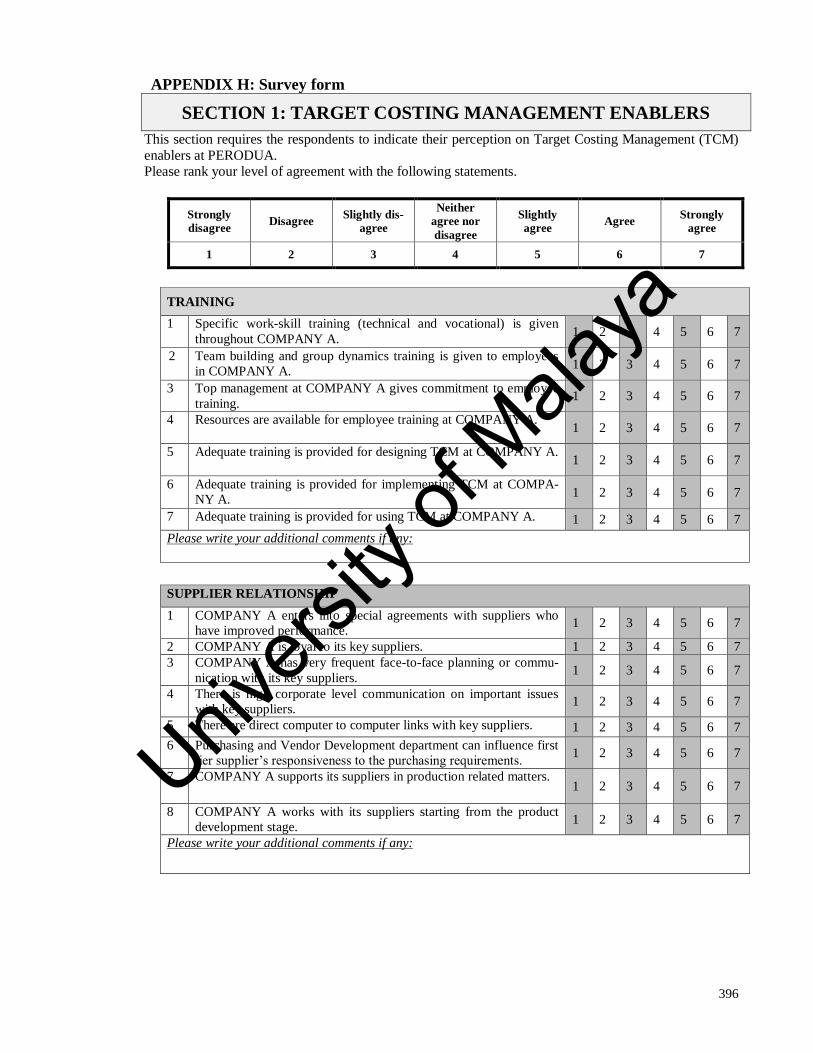
396
APPENDIX H: Survey form
SECTION 1: TARGET COSTING MANAGEMENT ENABLERS
This section requires the respondents to indicate their perception on Target Costing Management (TCM)
enablers at PERODUA. Please rank your level of agreement with the following statements.
Strongly
disagree Disagree
Slightly dis-
agree
Neither
agree nor
disagree
Slightly
agree Agree
Strongly
agree
1 2 3 4 5 6 7
TRAINING
1 Specific work-skill training (technical and vocational) is given
throughout COMPANY A. 1 2 3 4 5 6 7
2 Team building and group dynamics training is given to employees
in COMPANY A. 1 2 3 4 5 6 7
3 Top management at COMPANY A gives commitment to employee
training. 1 2 3 4 5 6 7
4 Resources are available for employee training at COMPANY A. 1 2 3 4 5 6 7
5 Adequate training is provided for designing TCM at COMPANY A. 1 2 3 4 5 6 7
6 Adequate training is provided for implementing TCM at COMPA-
NY A. 1 2 3 4 5 6 7
7 Adequate training is provided for using TCM at COMPANY A. 1 2 3 4 5 6 7
Please write your additional comments if any:
SUPPLIER RELATIONSHIP
1 COMPANY A enters into special agreements with suppliers who
have improved performance. 1 2 3 4 5 6 7
2 COMPANY A is loyal to its key suppliers. 1 2 3 4 5 6 7
3 COMPANY A has very frequent face-to-face planning or commu-
nication with its key suppliers. 1 2 3 4 5 6 7
4 There is high corporate level communication on important issues
with key suppliers. 1 2 3 4 5 6 7
5 There are direct computer to computer links with key suppliers. 1 2 3 4 5 6 7
6 Purchasing and Vendor Development department can influence first
tier supplier’s responsiveness to the purchasing requirements. 1 2 3 4 5 6 7
7 COMPANY A supports its suppliers in production related matters. 1 2 3 4 5 6 7
8 COMPANY A works with its suppliers starting from the product
development stage. 1 2 3 4 5 6 7
Please write your additional comments if any:
Univers
ity of
Mala
ya

397
Please rank your level of agreement with the following statements.
Strongly
disagree Disagree
Slightly dis-
agree
Neither
agree nor
disagree
Slightly
agree Agree
Strongly
agree
1 2 3 4 5 6 7
TEAMWORK CULTURE
1 TCM related members acknowledge conflict and work together to
resolve issues on the team. 1 2 3 4 5 6 7
2 TCM related members help one another by sharing knowledge and
information. 1 2 3 4 5 6 7
3 TCM related members encourage diverse perspectives and
different points of view from others in the team. 1 2 3 4 5 6 7
4 TCM related members demonstrate interest and enthusiasm during
team activities. 1 2 3 4 5 6 7
5 TCM related members acknowledge the contributions made by oth-
ers in the team. 1 2 3 4 5 6 7
6 TCM related members are working together towards a unified goal. 1 2 3 4 5 6 7
7 TCM related members freely share information (technical, market,
etc.) with others in the team. 1 2 3 4 5 6 7
8 Overall, TCM related members are very trustworthy. 1 2 3 4 5 6 7
9 TCM related members are usually considerate of each other’s feel-
ings. 1 2 3 4 5 6 7
10 TCM related members are friendly. 1 2 3 4 5 6 7
11 I can rely on my TCM related members. 1 2 3 4 5 6 7
Please write your additional comments if any:
TOP MANAGEMENT SUPPORT AND COMMITMENT
1 In COMPANY A, TCM receives strong and active support from the
top management. 1 2 3 4 5 6 7
2 Upper management in COMPANY A provides adequate resources
to the TCM implementation effort. 1 2 3 4 5 6 7
3 TCM is closely tied to COMPANY A competitive strategies. 1 2 3 4 5 6 7
4 COMPANY A’s management has provided visible support for the
TCM initiatives. 1 2 3 4 5 6 7
5 Support for implementing TCM in COMPANY A comes from both
the manufacturing operations and support groups. 1 2 3 4 5 6 7
6 Support for implementing TCM in COMPANY A is widespread. 1 2 3 4 5 6 7
Please write your additional comments if any:
Univers
ity of
Mala
ya
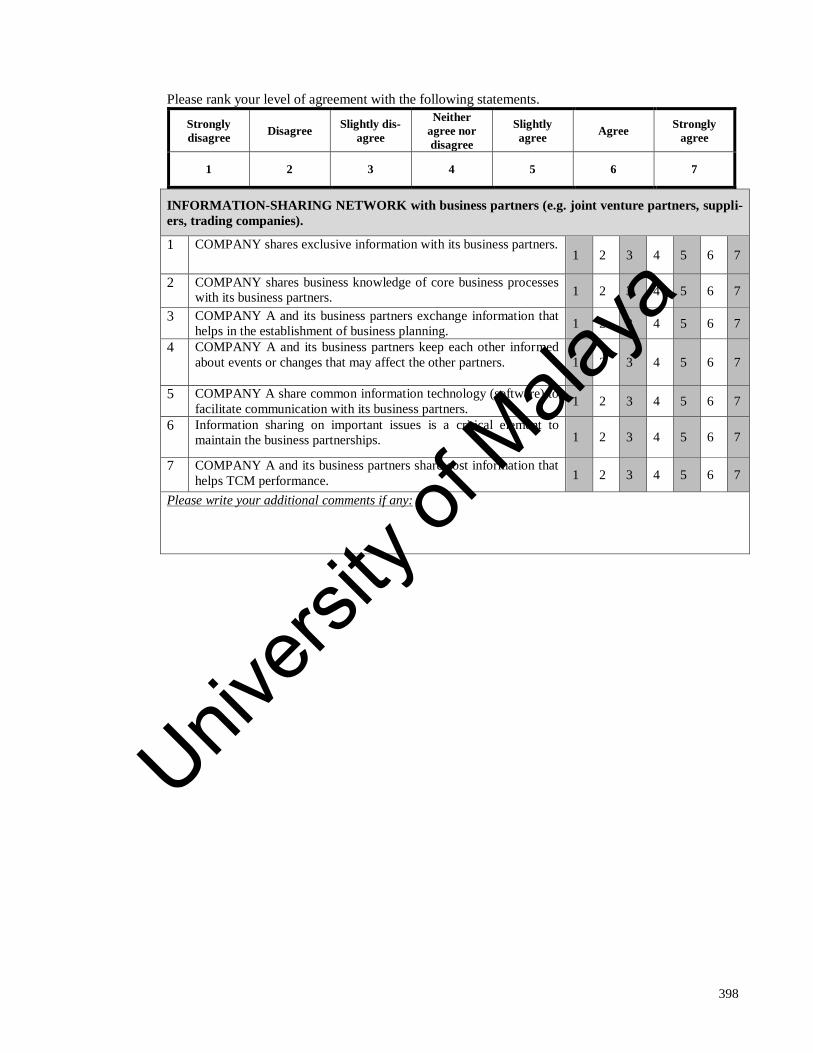
398
Please rank your level of agreement with the following statements.
Strongly
disagree Disagree
Slightly dis-
agree
Neither
agree nor
disagree
Slightly
agree Agree
Strongly
agree
1 2 3 4 5 6 7
INFORMATION-SHARING NETWORK with business partners (e.g. joint venture partners, suppli-
ers, trading companies).
1 COMPANY shares exclusive information with its business partners. 1 2 3 4 5 6 7
2 COMPANY shares business knowledge of core business processes
with its business partners. 1 2 3 4 5 6 7
3 COMPANY A and its business partners exchange information that
helps in the establishment of business planning. 1 2 3 4 5 6 7
4 COMPANY A and its business partners keep each other informed
about events or changes that may affect the other partners. 1 2 3 4 5 6 7
5 COMPANY A share common information technology (software) to
facilitate communication with its business partners. 1 2 3 4 5 6 7
6 Information sharing on important issues is a critical element to
maintain the business partnerships. 1 2 3 4 5 6 7
7 COMPANY A and its business partners share cost information that
helps TCM performance. 1 2 3 4 5 6 7
Please write your additional comments if any:
Univers
ity of
Mala
ya

399
Please rate the extent to which the following items are being practiced at COMPANY A.
Not at all To a mini-
mum extent
To a slight
extent
To some ex-
tent
To a moder-
ate extent
To a large
extent
To a great
extent
1 2 3 4 5 6 7
CONFRONTATIONAL STRATEGY
1 Level of capacity utilization. 1 2 3 4 5 6 7
2 Level of operating efficiency. 1 2 3 4 5 6 7
3 Low overhead cost. 1 2 3 4 5 6 7
4 Emphasis on finding ways to reduce production cost. 1 2 3 4 5 6 7
5 Uniqueness of its products. 1 2 3 4 5 6 7
6 Targeting clearly identified segment or segments. 1 2 3 4 5 6 7
7 Offering products that are suitable for its price segment. 1 2 3 4 5 6 7
8 Offering quality products. 1 2 3 4 5 6 7
Please write your additional comments if any:
CUSTOMER ORIENTATION
1 Customer commitment. 1 2 3 4 5 6 7
2 Create customer value. 1 2 3 4 5 6 7
3 Understand customer needs. 1 2 3 4 5 6 7
4 Customer satisfaction objectives. 1 2 3 4 5 6 7
5 Measure customer satisfaction. 1 2 3 4 5 6 7
6 After sales services. 1 2 3 4 5 6 7
Please write your additional comments if any:
Univers
ity of
Mala
ya
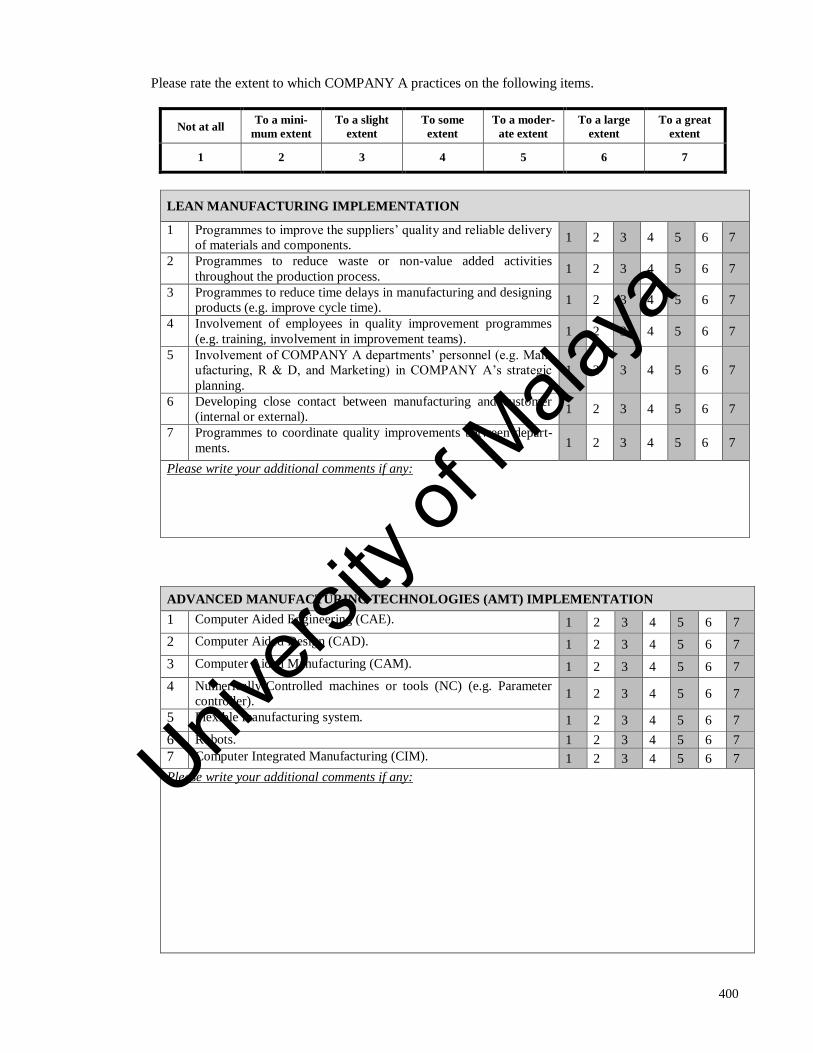
400
Please rate the extent to which COMPANY A practices on the following items.
Not at all To a mini-
mum extent
To a slight
extent
To some
extent
To a moder-
ate extent
To a large
extent
To a great
extent
1 2 3 4 5 6 7
LEAN MANUFACTURING IMPLEMENTATION
1 Programmes to improve the suppliers’ quality and reliable delivery
of materials and components. 1 2 3 4 5 6 7
2 Programmes to reduce waste or non-value added activities
throughout the production process. 1 2 3 4 5 6 7
3 Programmes to reduce time delays in manufacturing and designing
products (e.g. improve cycle time). 1 2 3 4 5 6 7
4 Involvement of employees in quality improvement programmes
(e.g. training, involvement in improvement teams). 1 2 3 4 5 6 7
5 Involvement of COMPANY A departments’ personnel (e.g. Man-
ufacturing, R & D, and Marketing) in COMPANY A’s strategic
planning.
1 2 3 4 5 6 7
6 Developing close contact between manufacturing and customer
(internal or external). 1 2 3 4 5 6 7
7 Programmes to coordinate quality improvements between depart-
ments. 1 2 3 4 5 6 7
Please write your additional comments if any:
ADVANCED MANUFACTURING TECHNOLOGIES (AMT) IMPLEMENTATION
1 Computer Aided Engineering (CAE). 1 2 3 4 5 6 7
2 Computer Aided Design (CAD). 1 2 3 4 5 6 7
3 Computer Aided Manufacturing (CAM). 1 2 3 4 5 6 7
4 Numerically-Controlled machines or tools (NC) (e.g. Parameter
controller). 1 2 3 4 5 6 7
5 Flexible manufacturing system. 1 2 3 4 5 6 7
6 Robots. 1 2 3 4 5 6 7
7 Computer Integrated Manufacturing (CIM). 1 2 3 4 5 6 7
Please write your additional comments if any:
Univers
ity of
Mala
ya
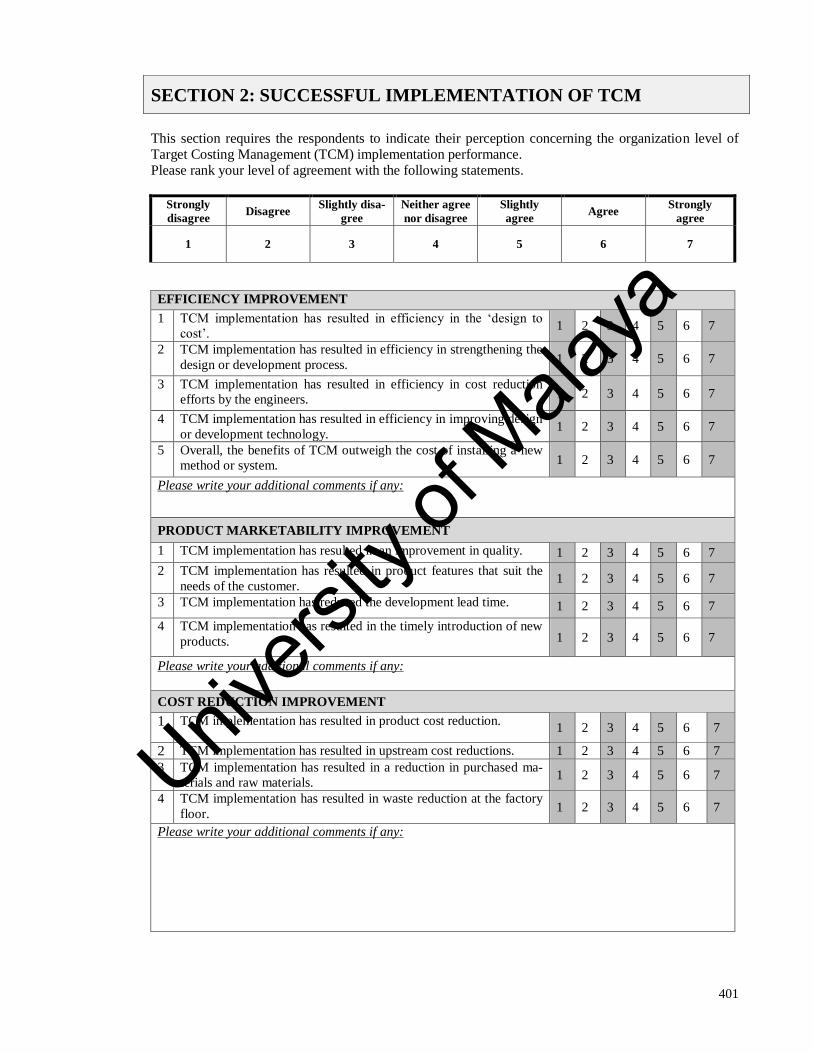
401
SECTION 2: SUCCESSFUL IMPLEMENTATION OF TCM
This section requires the respondents to indicate their perception concerning the organization level of Target Costing Management (TCM) implementation performance. Please rank your level of agreement with the following statements.
Strongly
disagree Disagree
Slightly disa-
gree
Neither agree
nor disagree
Slightly
agree Agree
Strongly
agree
1 2 3 4 5 6 7
EFFICIENCY IMPROVEMENT
1 TCM implementation has resulted in efficiency in the ‘design to
cost’. 1 2 3 4 5 6 7
2 TCM implementation has resulted in efficiency in strengthening the
design or development process. 1 2 3 4 5 6 7
3 TCM implementation has resulted in efficiency in cost reduction
efforts by the engineers. 1 2 3 4 5 6 7
4 TCM implementation has resulted in efficiency in improving design
or development technology. 1 2 3 4 5 6 7
5 Overall, the benefits of TCM outweigh the cost of installing a new
method or system. 1 2 3 4 5 6 7
Please write your additional comments if any:
PRODUCT MARKETABILITY IMPROVEMENT
1 TCM implementation has resulted in an improvement in quality. 1 2 3 4 5 6 7
2 TCM implementation has resulted in product features that suit the
needs of the customer. 1 2 3 4 5 6 7
3 TCM implementation has reduced the development lead time. 1 2 3 4 5 6 7
4 TCM implementation has resulted in the timely introduction of new
products. 1 2 3 4 5 6 7
Please write your additional comments if any:
COST REDUCTION IMPROVEMENT
1 TCM implementation has resulted in product cost reduction. 1 2 3 4 5 6 7
2 TCM implementation has resulted in upstream cost reductions. 1 2 3 4 5 6 7
3 TCM implementation has resulted in a reduction in purchased ma-
terials and raw materials. 1 2 3 4 5 6 7
4 TCM implementation has resulted in waste reduction at the factory
floor. 1 2 3 4 5 6 7
Please write your additional comments if any:
Univers
ity of
Mala
ya
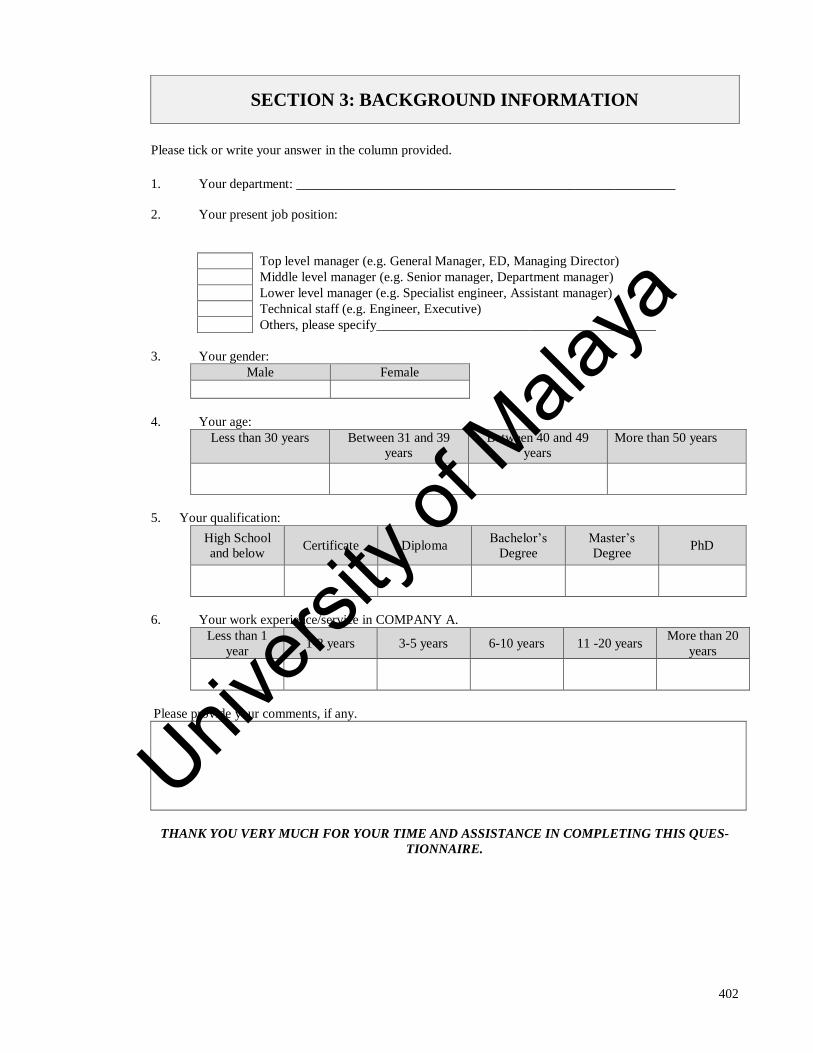
402
SECTION 3: BACKGROUND INFORMATION
Please tick or write your answer in the column provided.
1. Your department: _________________________________________________________
2. Your present job position:
Top level manager (e.g. General Manager, ED, Managing Director)
Middle level manager (e.g. Senior manager, Department manager)
Lower level manager (e.g. Specialist engineer, Assistant manager)
Technical staff (e.g. Engineer, Executive)
Others, please specify__________________________________________
3. Your gender:
Male Female
4. Your age:
Less than 30 years Between 31 and 39
years
Between 40 and 49
years
More than 50 years
5. Your qualification:
High School
and below Certificate Diploma
Bachelor’s
Degree
Master’s
Degree PhD
6. Your work experience/service in COMPANY A.
Less than 1
year 1-2 years 3-5 years 6-10 years 11 -20 years
More than 20
years
Please provide your comments, if any.
THANK YOU VERY MUCH FOR YOUR TIME AND ASSISTANCE IN COMPLETING THIS QUES-
TIONNAIRE.
Univers
ity of
Mala
ya
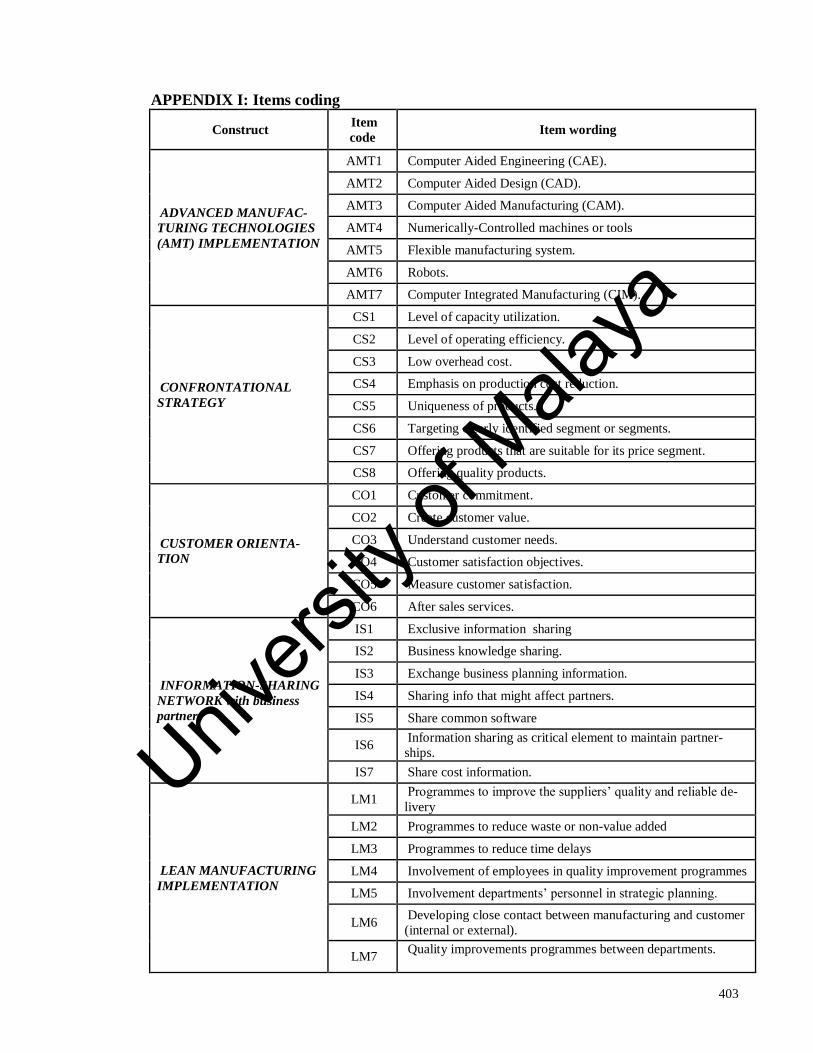
403
APPENDIX I: Items coding
Construct Item
code Item wording
ADVANCED MANUFAC-
TURING TECHNOLOGIES
(AMT) IMPLEMENTATION
AMT1 Computer Aided Engineering (CAE).
AMT2 Computer Aided Design (CAD).
AMT3 Computer Aided Manufacturing (CAM).
AMT4 Numerically-Controlled machines or tools
AMT5 Flexible manufacturing system.
AMT6 Robots.
AMT7 Computer Integrated Manufacturing (CIM).
CONFRONTATIONAL
STRATEGY
CS1 Level of capacity utilization.
CS2 Level of operating efficiency.
CS3 Low overhead cost.
CS4 Emphasis on production cost reduction.
CS5 Uniqueness of products.
CS6 Targeting clearly identified segment or segments.
CS7 Offering products that are suitable for its price segment.
CS8 Offering quality products.
CUSTOMER ORIENTA-
TION
CO1 Customer commitment.
CO2 Create customer value.
CO3 Understand customer needs.
CO4 Customer satisfaction objectives.
CO5 Measure customer satisfaction.
CO6 After sales services.
INFORMATION-SHARING
NETWORK with business
partners
IS1 Exclusive information sharing
IS2 Business knowledge sharing.
IS3 Exchange business planning information.
IS4 Sharing info that might affect partners.
IS5 Share common software
IS6 Information sharing as critical element to maintain partner-
ships.
IS7 Share cost information.
LEAN MANUFACTURING
IMPLEMENTATION
LM1 Programmes to improve the suppliers’ quality and reliable de-
livery
LM2 Programmes to reduce waste or non-value added
LM3 Programmes to reduce time delays
LM4 Involvement of employees in quality improvement programmes
LM5 Involvement departments’ personnel in strategic planning.
LM6 Developing close contact between manufacturing and customer
(internal or external).
LM7 Quality improvements programmes between departments.
Univers
ity of
Mala
ya
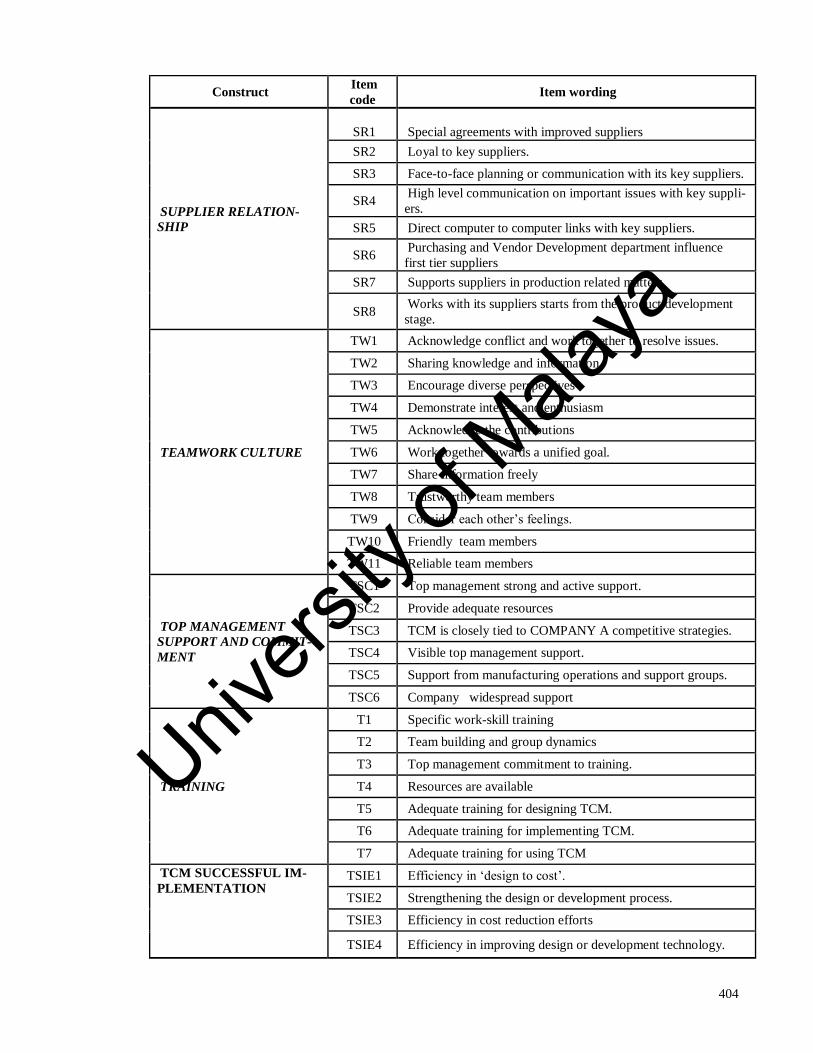
404
Construct Item
code Item wording
SUPPLIER RELATION-
SHIP
SR1
Special agreements with improved suppliers
SR2 Loyal to key suppliers.
SR3 Face-to-face planning or communication with its key suppliers.
SR4 High level communication on important issues with key suppli-
ers.
SR5 Direct computer to computer links with key suppliers.
SR6 Purchasing and Vendor Development department influence
first tier suppliers
SR7 Supports suppliers in production related matters.
SR8 Works with its suppliers starts from the product development
stage.
TEAMWORK CULTURE
TW1 Acknowledge conflict and work together to resolve issues.
TW2 Sharing knowledge and information.
TW3 Encourage diverse perspectives
TW4 Demonstrate interest and enthusiasm
TW5 Acknowledge the contributions
TW6 Work together towards a unified goal.
TW7 Share information freely
TW8 Trustworthy team members
TW9 Consider each other’s feelings.
TW10 Friendly team members
TW11 Reliable team members
TOP MANAGEMENT
SUPPORT AND COMMIT-
MENT
TSC1 Top management strong and active support.
TSC2 Provide adequate resources
TSC3 TCM is closely tied to COMPANY A competitive strategies.
TSC4 Visible top management support.
TSC5 Support from manufacturing operations and support groups.
TSC6 Company widespread support
TRAINING
T1 Specific work-skill training
T2 Team building and group dynamics
T3 Top management commitment to training.
T4 Resources are available
T5 Adequate training for designing TCM.
T6 Adequate training for implementing TCM.
T7 Adequate training for using TCM
TCM SUCCESSFUL IM-
PLEMENTATION
TSIE1 Efficiency in ‘design to cost’.
TSIE2 Strengthening the design or development process.
TSIE3 Efficiency in cost reduction efforts
TSIE4 Efficiency in improving design or development technology.
Univers
ity of
Mala
ya
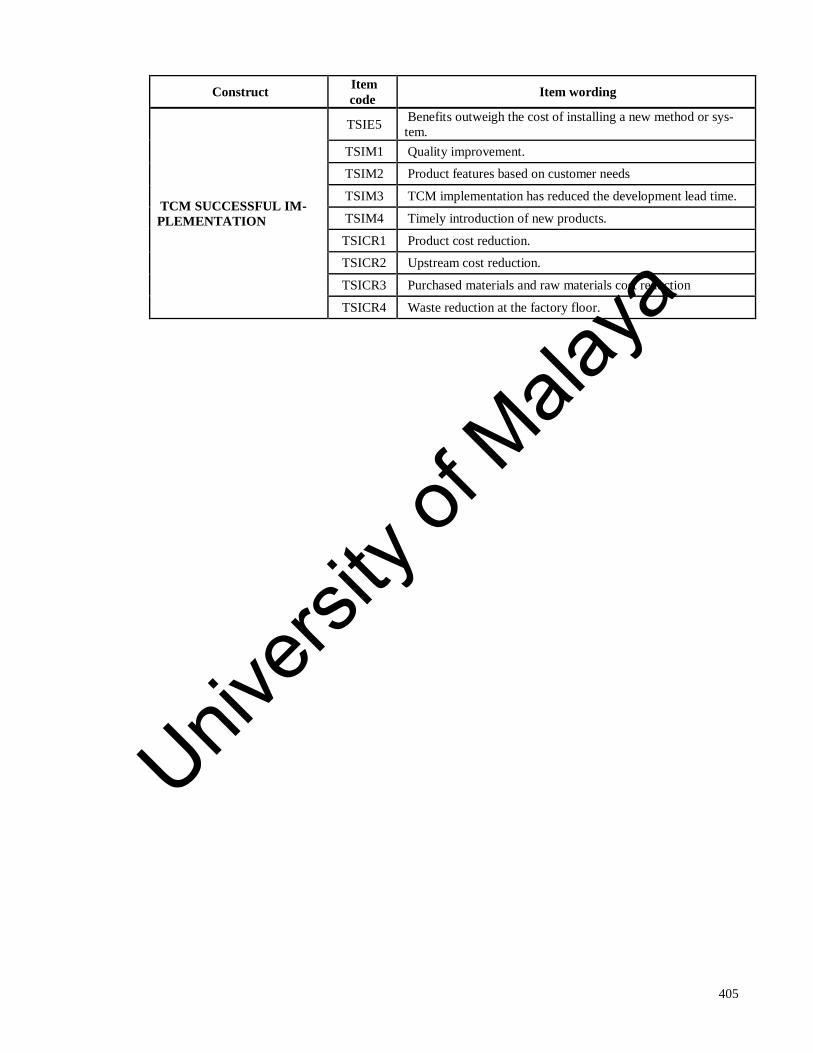
405
Construct Item
code Item wording
TCM SUCCESSFUL IM-
PLEMENTATION
TSIE5 Benefits outweigh the cost of installing a new method or sys-
tem.
TSIM1 Quality improvement.
TSIM2 Product features based on customer needs
TSIM3 TCM implementation has reduced the development lead time.
TSIM4 Timely introduction of new products.
TSICR1 Product cost reduction.
TSICR2 Upstream cost reduction.
TSICR3 Purchased materials and raw materials cost reduction
TSICR4 Waste reduction at the factory floor.
Univers
ity of
Mala
ya
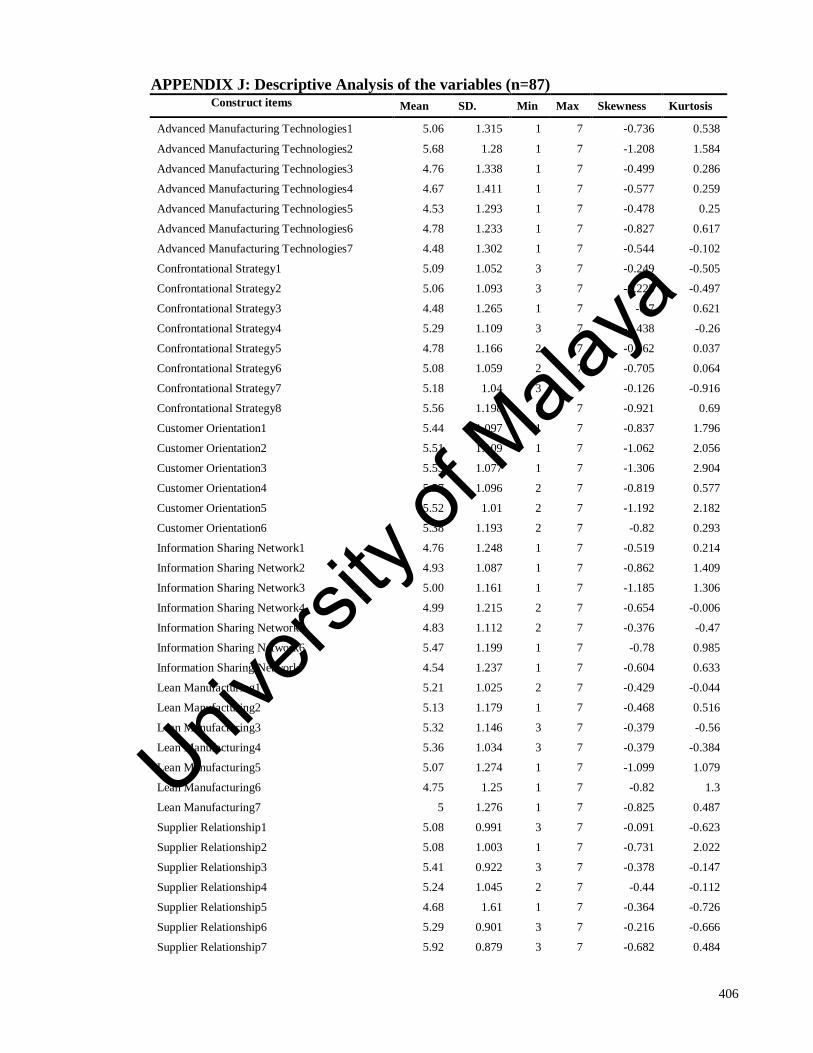
406
APPENDIX J: Descriptive Analysis of the variables (n=87) Construct items Mean SD. Min Max Skewness Kurtosis
Advanced Manufacturing Technologies1 5.06 1.315 1 7 -0.736 0.538
Advanced Manufacturing Technologies2 5.68 1.28 1 7 -1.208 1.584
Advanced Manufacturing Technologies3 4.76 1.338 1 7 -0.499 0.286
Advanced Manufacturing Technologies4 4.67 1.411 1 7 -0.577 0.259
Advanced Manufacturing Technologies5 4.53 1.293 1 7 -0.478 0.25
Advanced Manufacturing Technologies6 4.78 1.233 1 7 -0.827 0.617
Advanced Manufacturing Technologies7 4.48 1.302 1 7 -0.544 -0.102
Confrontational Strategy1 5.09 1.052 3 7 -0.249 -0.505
Confrontational Strategy2 5.06 1.093 3 7 -0.225 -0.497
Confrontational Strategy3 4.48 1.265 1 7 -0.7 0.621
Confrontational Strategy4 5.29 1.109 3 7 -0.438 -0.26
Confrontational Strategy5 4.78 1.166 2 7 -0.462 0.037
Confrontational Strategy6 5.08 1.059 2 7 -0.705 0.064
Confrontational Strategy7 5.18 1.04 3 7 -0.126 -0.916
Confrontational Strategy8 5.56 1.198 2 7 -0.921 0.69
Customer Orientation1 5.44 1.097 1 7 -0.837 1.796
Customer Orientation2 5.51 1.109 1 7 -1.062 2.056
Customer Orientation3 5.53 1.077 1 7 -1.306 2.904
Customer Orientation4 5.57 1.096 2 7 -0.819 0.577
Customer Orientation5 5.52 1.01 2 7 -1.192 2.182
Customer Orientation6 5.38 1.193 2 7 -0.82 0.293
Information Sharing Network1 4.76 1.248 1 7 -0.519 0.214
Information Sharing Network2 4.93 1.087 1 7 -0.862 1.409
Information Sharing Network3 5.00 1.161 1 7 -1.185 1.306
Information Sharing Network4 4.99 1.215 2 7 -0.654 -0.006
Information Sharing Network5 4.83 1.112 2 7 -0.376 -0.47
Information Sharing Network6 5.47 1.199 1 7 -0.78 0.985
Information Sharing Network7 4.54 1.237 1 7 -0.604 0.633
Lean Manufacturing1 5.21 1.025 2 7 -0.429 -0.044
Lean Manufacturing2 5.13 1.179 1 7 -0.468 0.516
Lean Manufacturing3 5.32 1.146 3 7 -0.379 -0.56
Lean Manufacturing4 5.36 1.034 3 7 -0.379 -0.384
Lean Manufacturing5 5.07 1.274 1 7 -1.099 1.079
Lean Manufacturing6 4.75 1.25 1 7 -0.82 1.3
Lean Manufacturing7 5 1.276 1 7 -0.825 0.487
Supplier Relationship1 5.08 0.991 3 7 -0.091 -0.623
Supplier Relationship2 5.08 1.003 1 7 -0.731 2.022
Supplier Relationship3 5.41 0.922 3 7 -0.378 -0.147
Supplier Relationship4 5.24 1.045 2 7 -0.44 -0.112
Supplier Relationship5 4.68 1.61 1 7 -0.364 -0.726
Supplier Relationship6 5.29 0.901 3 7 -0.216 -0.666
Supplier Relationship7 5.92 0.879 3 7 -0.682 0.484
Univers
ity of
Mala
ya
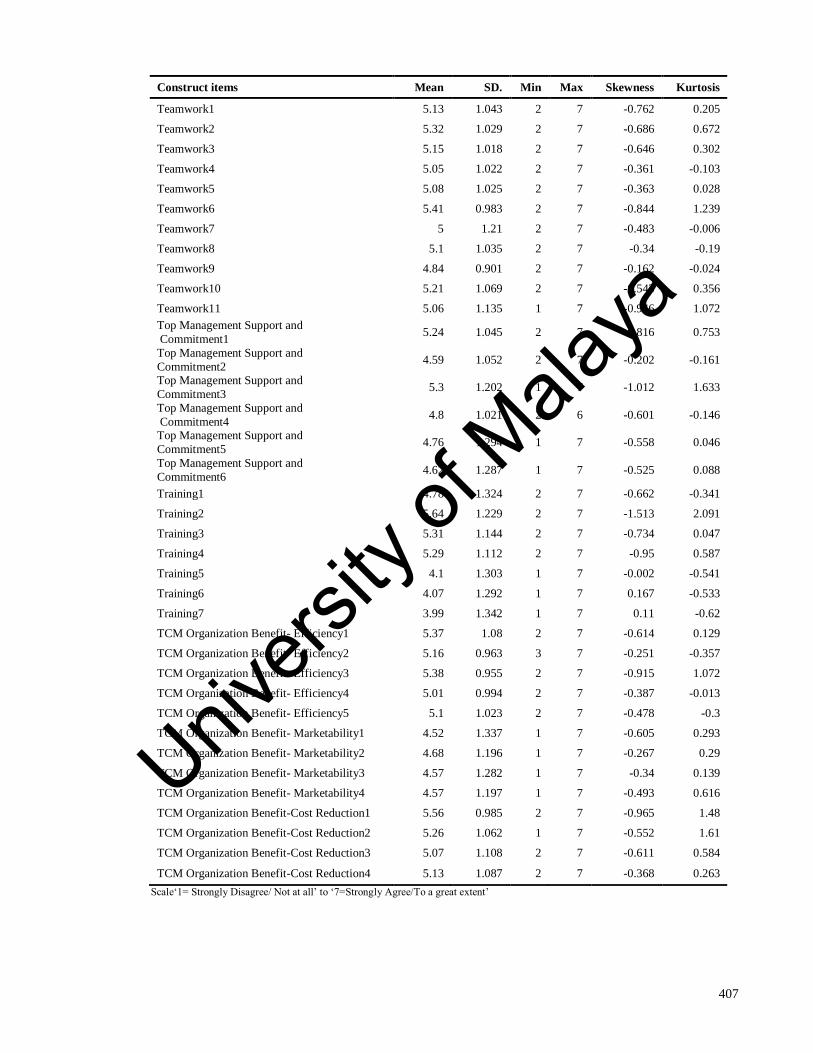
407
Construct items Mean SD. Min Max Skewness Kurtosis
Teamwork1 5.13 1.043 2 7 -0.762 0.205
Teamwork2 5.32 1.029 2 7 -0.686 0.672
Teamwork3 5.15 1.018 2 7 -0.646 0.302
Teamwork4 5.05 1.022 2 7 -0.361 -0.103
Teamwork5 5.08 1.025 2 7 -0.363 0.028
Teamwork6 5.41 0.983 2 7 -0.844 1.239
Teamwork7 5 1.21 2 7 -0.483 -0.006
Teamwork8 5.1 1.035 2 7 -0.34 -0.19
Teamwork9 4.84 0.901 2 7 -0.162 -0.024
Teamwork10 5.21 1.069 2 7 -0.543 0.356
Teamwork11 5.06 1.135 1 7 -0.946 1.072
Top Management Support and
Commitment1 5.24 1.045 2 7 -0.816 0.753
Top Management Support and
Commitment2 4.59 1.052 2 7 -0.202 -0.161
Top Management Support and
Commitment3 5.3 1.202 1 7 -1.012 1.633
Top Management Support and
Commitment4 4.8 1.021 2 6 -0.601 -0.146
Top Management Support and
Commitment5 4.76 1.294 1 7 -0.558 0.046
Top Management Support and
Commitment6 4.62 1.287 1 7 -0.525 0.088
Training1 4.78 1.324 2 7 -0.662 -0.341
Training2 5.64 1.229 2 7 -1.513 2.091
Training3 5.31 1.144 2 7 -0.734 0.047
Training4 5.29 1.112 2 7 -0.95 0.587
Training5 4.1 1.303 1 7 -0.002 -0.541
Training6 4.07 1.292 1 7 0.167 -0.533
Training7 3.99 1.342 1 7 0.11 -0.62
TCM Organization Benefit- Efficiency1 5.37 1.08 2 7 -0.614 0.129
TCM Organization Benefit- Efficiency2 5.16 0.963 3 7 -0.251 -0.357
TCM Organization Benefit- Efficiency3 5.38 0.955 2 7 -0.915 1.072
TCM Organization Benefit- Efficiency4 5.01 0.994 2 7 -0.387 -0.013
TCM Organization Benefit- Efficiency5 5.1 1.023 2 7 -0.478 -0.3
TCM Organization Benefit- Marketability1 4.52 1.337 1 7 -0.605 0.293
TCM Organization Benefit- Marketability2 4.68 1.196 1 7 -0.267 0.29
TCM Organization Benefit- Marketability3 4.57 1.282 1 7 -0.34 0.139
TCM Organization Benefit- Marketability4 4.57 1.197 1 7 -0.493 0.616
TCM Organization Benefit-Cost Reduction1 5.56 0.985 2 7 -0.965 1.48
TCM Organization Benefit-Cost Reduction2 5.26 1.062 1 7 -0.552 1.61
TCM Organization Benefit-Cost Reduction3 5.07 1.108 2 7 -0.611 0.584
TCM Organization Benefit-Cost Reduction4 5.13 1.087 2 7 -0.368 0.263
Scale‘1= Strongly Disagree/ Not at all’ to ‘7=Strongly Agree/To a great extent’
Univers
ity of
Mala
ya